
Assessing Cast Aluminum Alloys with Computed Tomography Defect Metrics: A Gurson Porous Plasticity Approach

1
Faculty of Chemical and Metallurgical Engineering, Istanbul Technical University, Istanbul 34467, Turkey
2
Faculty of Mechanical Engineering, Atilim University, Kızılcaşar, Ankara 06830, Turkey
3
Department of Materials Science and Engineering, Mechanical and Manufacturing Engineering School, ISAE-Supméca–Institut Supérieur de Mécanique de Paris, 93400 Saint-Ouen, France
*
Authors to whom correspondence should be addressed.
Metals 2023, 13(4), 752; https://doi.org/10.3390/met13040752
Submission received: 10 March 2023
/
Revised: 4 April 2023
/
Accepted: 9 April 2023
/
Published: 12 April 2023
(This article belongs to the Special Issue Analysis and Design of Metal Forming Processes II)
Abstract
:Aluminum alloys have inherent tendencies to produce casting defects caused by alloying or metal melt flow inside the mold. The traditional detection method for these defects includes reduced pressure tests, which assess metal quality in a destructive manner. This leaves a gap between metal quality assessments and tensile test correlations. Computed tomography (CT) scans offer crucial assistance in evaluating the internal quality of castings without damaging the structure. This provides a valuable opportunity to couple mechanical tests with numerical methods such as finite element analysis to predict the mechanical performance of the alloy. The present study aims to evaluate the internal quality of cast aluminum alloys using CT scans and to correlate the defect metrics obtained from CT scans with mechanical test results. The Gurson-type material model and finite element methodology have been used to validate the correlation studies. Therefore, we propose a more holistic approach to predicting the behavior of metals by coupling damage models with CT scans and mechanical tests. The study investigates several CT metrics such as the defect volume, total defect surface, biggest defect surface, and projected area of defects. The conclusion reveals that CT scans provide crucial assistance in evaluating the internal quality of castings, and CT defect metrics can be used to build correlations between mechanical tests and CT evaluations. The study also suggests that the concept of adjusted representative material yield parameter (ARMY) or computed representative material yield parameter (CRMY) can be used to correlate CT metrics with mechanical strength in cast materials and parts for a given aluminum alloy. Overall, the study proposes a more comprehensive methodology to assess the quality of cast aluminum alloys and couple the quality to mechanical performance.
1. Introduction
The casting process of aluminum (Al) alloys has been the widely used manufacturing process for complex-shaped parts in industry owing to the ability to fill mold cavities at every section scale. Although this castability has provided an advantage, the inherent defect formation mechanism of Al alloys in the casting and smelting process causes difficulties. Defects in the final part internal structure must be controlled, evaluated, and assessed properly. The main defects besides porosity have been classified as metal oxide films [1].
During the casting process, it has been shown by Campbell [2,3] that impurities and non-linear fluid flow cause the formation of metal bifilms (double oxide films—DOF). These internal defects cause parts and components to fail and become out of service during use. The structure of bifilms has multilayered, closed, or semi-closed pores that act as a crack initiator when the part is in service. The effect on reliability and impact on strength of the alloy in the presence of those bifilms has been investigated by Mi et al. [4]. Do Lee has investigated the property variation at different microporosity levels of A356 alloy [5].
As the effect of DOF has been clearly proven in the literature, Dispinar has proposed a reduced pressure test (RPT) and bifilm index (BFI) evaluation based on the content of DOF quantities and sizes in order to determine alloy melt quality and to assess final properties [6]. Dispinar and Campbell have shown that BFI identification by low-pressure solidification test (RPT) has been required to assess the level of metal melt cleanliness. Evaluation of metal solidification under vacuum has been identified as a suitable methodology to investigate the number of pores formed in the structure due to DOF formations [7,8,9]. Even though this methodology has been researched in the literature and has been in use in the industry for melt quality determination, it has been based on 2D section analysis on a reference cupcake geometry by a destructive evaluation technique. In recent studies, internal structure defects and quality evaluations of parts have been assessed with computed tomography (CT) scans and X-ray scanning methods [10,11]. Gyarmati has shown that CT scans could be used to characterize DOF contents within the cast structure as a result of aluminum melt quality assessments [12].
The BFI and defect content evaluation and defect metric computations have been the main objective of the before mentioned experimental methods. The ultimate objective has been to establish a framework of production with acceptable metal quality of a specific alloy in order to obtain sustainable and reliable mechanical properties. At the final product validation step, verification of properties in a virtual environment could be achieved via finite element analysis (FEA). In order to apply this methodology, it has been required to perform mechanical tensile tests and determine material properties according to a relevant mathematical model that has been implemented in FEA code.
The modeling framework of FEA has been based on the continuum mechanics (CM) approach in order to simulate material elastic and elastoplastic behaviors. In this methodology, the material structure could be defined as a continuum matrix of solid, and the behavior of the structure has been expressed mathematically by the material behavior model in both 2D and 3D as the basics have been given by Forest and Besson [13,14].
Both ideal material conditions and defect-related failure-plasticity conditions have been investigated within the CM framework. Using J2 von Mises plasticity provides a modeling approach where the material has been assumed as defect-free. In the J2 framework, the material behaves as elastic up to the yield point and then inelastic up to the failure point. To describe the behavior of the material in the inelastic region, a function that models the yield, the yield rule, and the hardening function must be defined. Factors used in the equation are yield strength—σy, kinematic hardening variable—X, and R is defined as the isotropic hardening variable. Kinematic hardening is important in cyclic loadings whereas singular loads activate isotropic hardening. Elastic and plastic behavior requirements are given in Equations (1) and (2) [3]. In the present study, the effects of DOF on fatigue behavior have not been investigated therefore kinematic hardening has not been taken into consideration. The isotropic hardening model could be based on several mathematical equations. A widespread approach had been to adopt linear hardening, power law hardening, and exponential hardening in order to converge on the physical behavior of the stress–strain curve in the plasticity region. In this paper, power law hardening has been chosen.
Moreover, the damage concept and porosity-related plasticity have been investigated and various approaches have been proposed by McClintock, Rice and Tracey, Rousselier, and Lemaitre [15,16,17]. The ductile damage model proposed by Gurson has taken account of the deformation of voids of different geometries within the plastic matrix. The model has included a void volume fraction fv as the model variable. The evolution of the fv has been given in Equation (3). The model has captured the effect of initial porosity of different sizes and shapes but has not considered the nucleation effect [18]. As DOFs have been the most crucial defects in cast aluminum alloys, their initial number and sizes have been effective in behavior assessments. Therefore, the Gurson model has been selected in order to investigate the correlation between modeling and physical tests along with CT scans.
In Gurson plasticity, the representation of the yield potential is based on the classical von Mises plasticity model while damage calculation is governed by an additional dependence on the mean stress and two porosity functions g1 and g2 as given by Equation (4):
The Gurson model uses two functions, g1, and g2, to describe the effects of porosity on the mechanical behavior of a porous metal. These functions are defined based on the volume fractions of voids within the material.
The g1 function is defined as the ratio of the actual void volume fraction to the critical void volume fraction. It represents the reduction in the effective stiffness of the material due to the presence of voids. As the volume fraction of voids increases, the g1 function approaches 1, indicating that the material has lost all of its effective stiffness.
The g2 function is defined as the ratio of the actual void volume fraction to the total volume fraction of the material. Thus, it represents the reduction in the effective strength of the material due to the presence of voids. As the volume fraction of voids increases, the g2 function approaches 1, indicating that the material has lost all of its effective strength.
Yield potential has been expressed based on those porosity functions, where effective stress state evolution has been calculated according to difference versus initial yield surface as given in Equation (5), where σeq is the von Mises Stress, σm is the hydrostatic or mean stress.
The above-mentioned formulation can only predict the growth of existing voids and does not include void nucleation. The plasticity condition and plastic strain calculation have been implemented according to Equation (6) where flow increment has been associated with flow multiplier γ.
Therefore, constitutive equations have been integrated to obtain material behavior by a numerical implementation step to calculate plastic flow and porosity evolution at each step. The RVE-based material point has been assigned with the mean porosity level. Plasticity has been observed on this representative volume element.
Focusing on localization, studies investigating defect size and the assessment of their impact on mechanical properties and fatigue life by experimental, statistical, and empirical methods have been proposed by several researchers. Gorzen et al. [19] have investigated cyclic indentation test results and their correlation with fatigue life in low alloy high-strength steels. A certain defect size threshold has been observed in fatigue life estimation and crack initiation locations. Qian et al. [20], have proposed a statistical model which has been based on fracture toughness—yield strength correlations at the local material scale for steels.
The approach of Gurson to defect modeling has been based on the continuum mechanics framework both at a localized and non-localized level. As validity and investigation of double oxide film behavior of aluminum alloys with continuum mechanics approach and computed tomography studies have not been at a mature level. At this stage, the localization effect due to defects on geometry, coalescence of defects, distribution, and the number of defects have not been considered.
In the literature, however, there are relatively recent studies. As given by Monchiet et al., the void size effects can have a significant impact on the plastic behavior of porous metals in Gurson-type plasticity [21]; Niordson and Tvergaard have shown a Gurson-type model presented for size dependency and shows a strong correlation between cavity size and damage growth as well as the stress–strain response [22]. The homogenized model proposed by Edvard et al. extends conventional porous plasticity models to include size dependence for micron-scale voids and demonstrates the effectiveness of accounting for void size effects through two simple extension [23]. A more localized work scheme has also been published highlighting the investigation of the energetics approach of tensile and shear void coalescences in ductile materials which have been proposed by Wong, offering a unified method for determining the occurrences of both mechanisms. This work illustrates the importance of considering void size effects and the potential impact on plastic deformation and fracture behavior in porous metals [24]. The investigation by Boåsen et al. presented a multiple mechanism weakest link model for brittle fracture by micro-mechanical analysis. They use a non-local porous plastic Gurson model to predict the ductile crack growth and brittle fracture toughness distribution [25].
In these contexts, in the present study, the casting of specimens has been performed and all specimens have been evaluated by CT scans. Defect metrics have been investigated for non-local conditions. Reconstruction of defects in the structure has been performed. Tensile tests have been undertaken to determine alloy behaviors. A correlation between tensile behaviors and CT defect metrics has been established. After the evaluation and testing phase, the damage model based on the Gurson model with power law isotropic hardening has been loaded into ABAQUS software. Model verification has been performed with different fv porosity levels. Afterwards, CT scan metrics have been investigated and Gurson model fv determination according to CT metrics have been performed. Physical test results—CT metrics and modeling results have been correlated. The BFI and DOF effects on mechanical behavior have been successfully replicated and simulated within the CM framework by the Gurson Model.
The main objective and motivation of the work have been defined as to investigate CT scan and mechanical tensile test correlations in order to provide a non-destructive prediction and assessment methodology which can replace destructive RPT assessment in casting quality. The second main objective has been set to investigate porous metal plasticity capability and compatibility in a correlation of CT scans with tensile tests. Therefore, product development, the casting process, and alloy development steps will be improved. Numerical analysis and virtual validation phase will be integrated with production step parameters.
2. Experimental and Numerical Framework
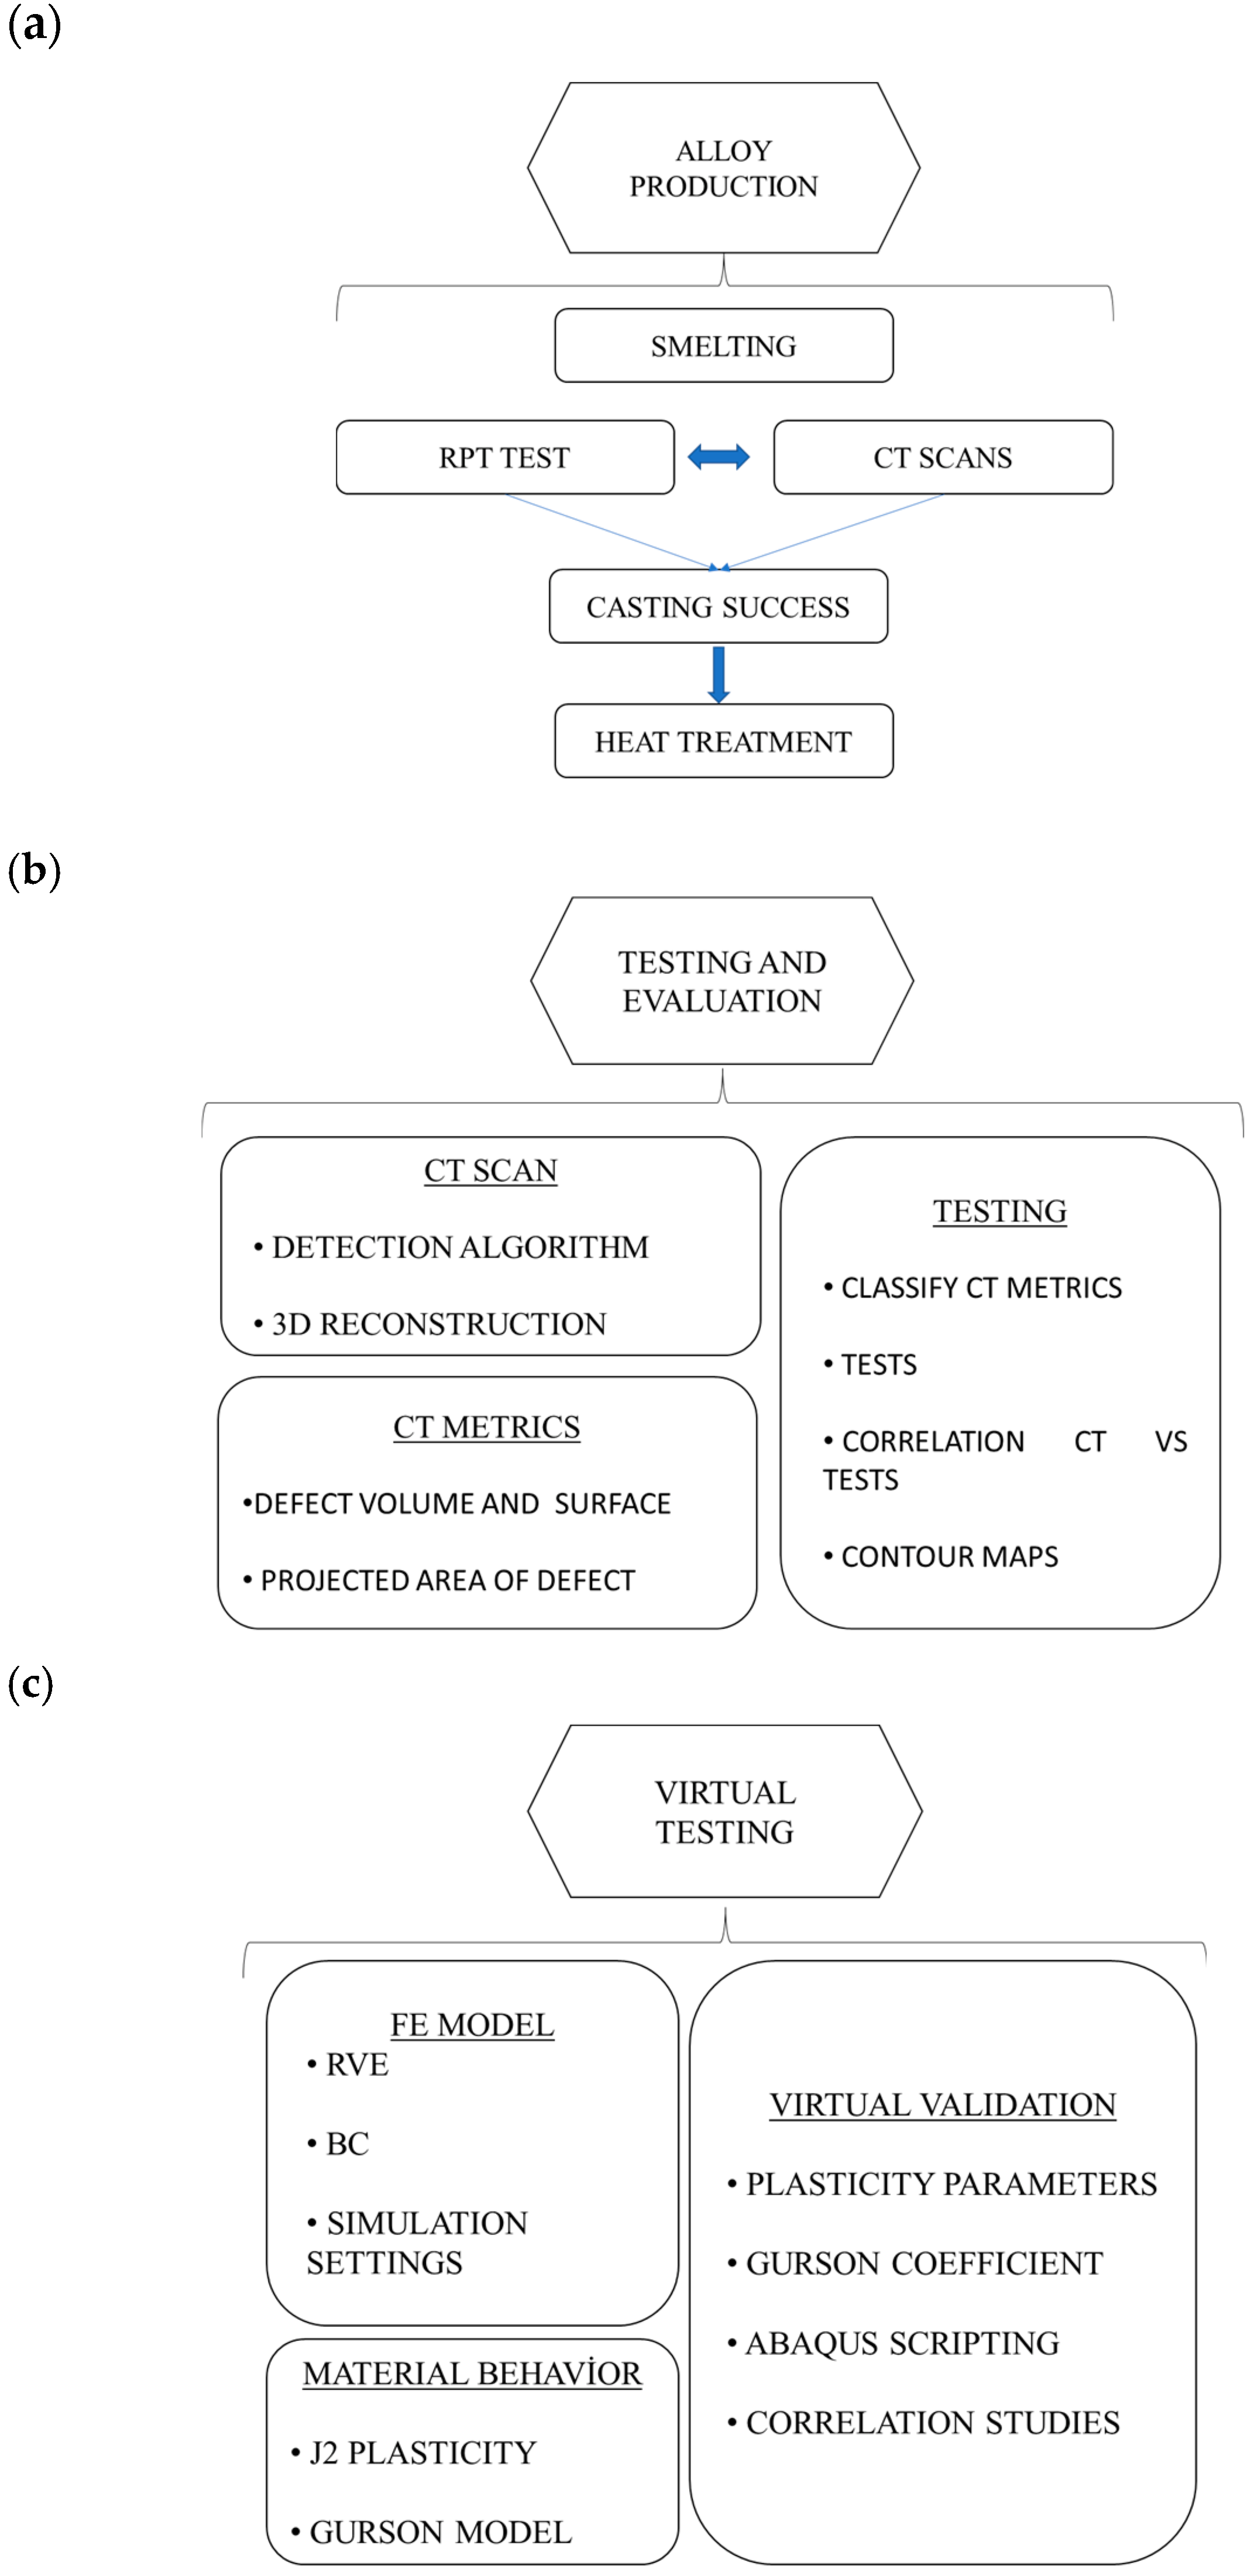
Experimental studies have been conducted to achieve the following main objectives as illustrated in Figure 1. In the first stage, tilt sand casting of the alloys has been undertaken. Raw material and specimen quality control have been assured by CT scan evaluations. Tensile tests and hardness tests of the alloys have been conducted. Finally, optical analysis and CT scans evaluations have been conducted to build a correlation between the results.
2.1. Casting and Specimen Production
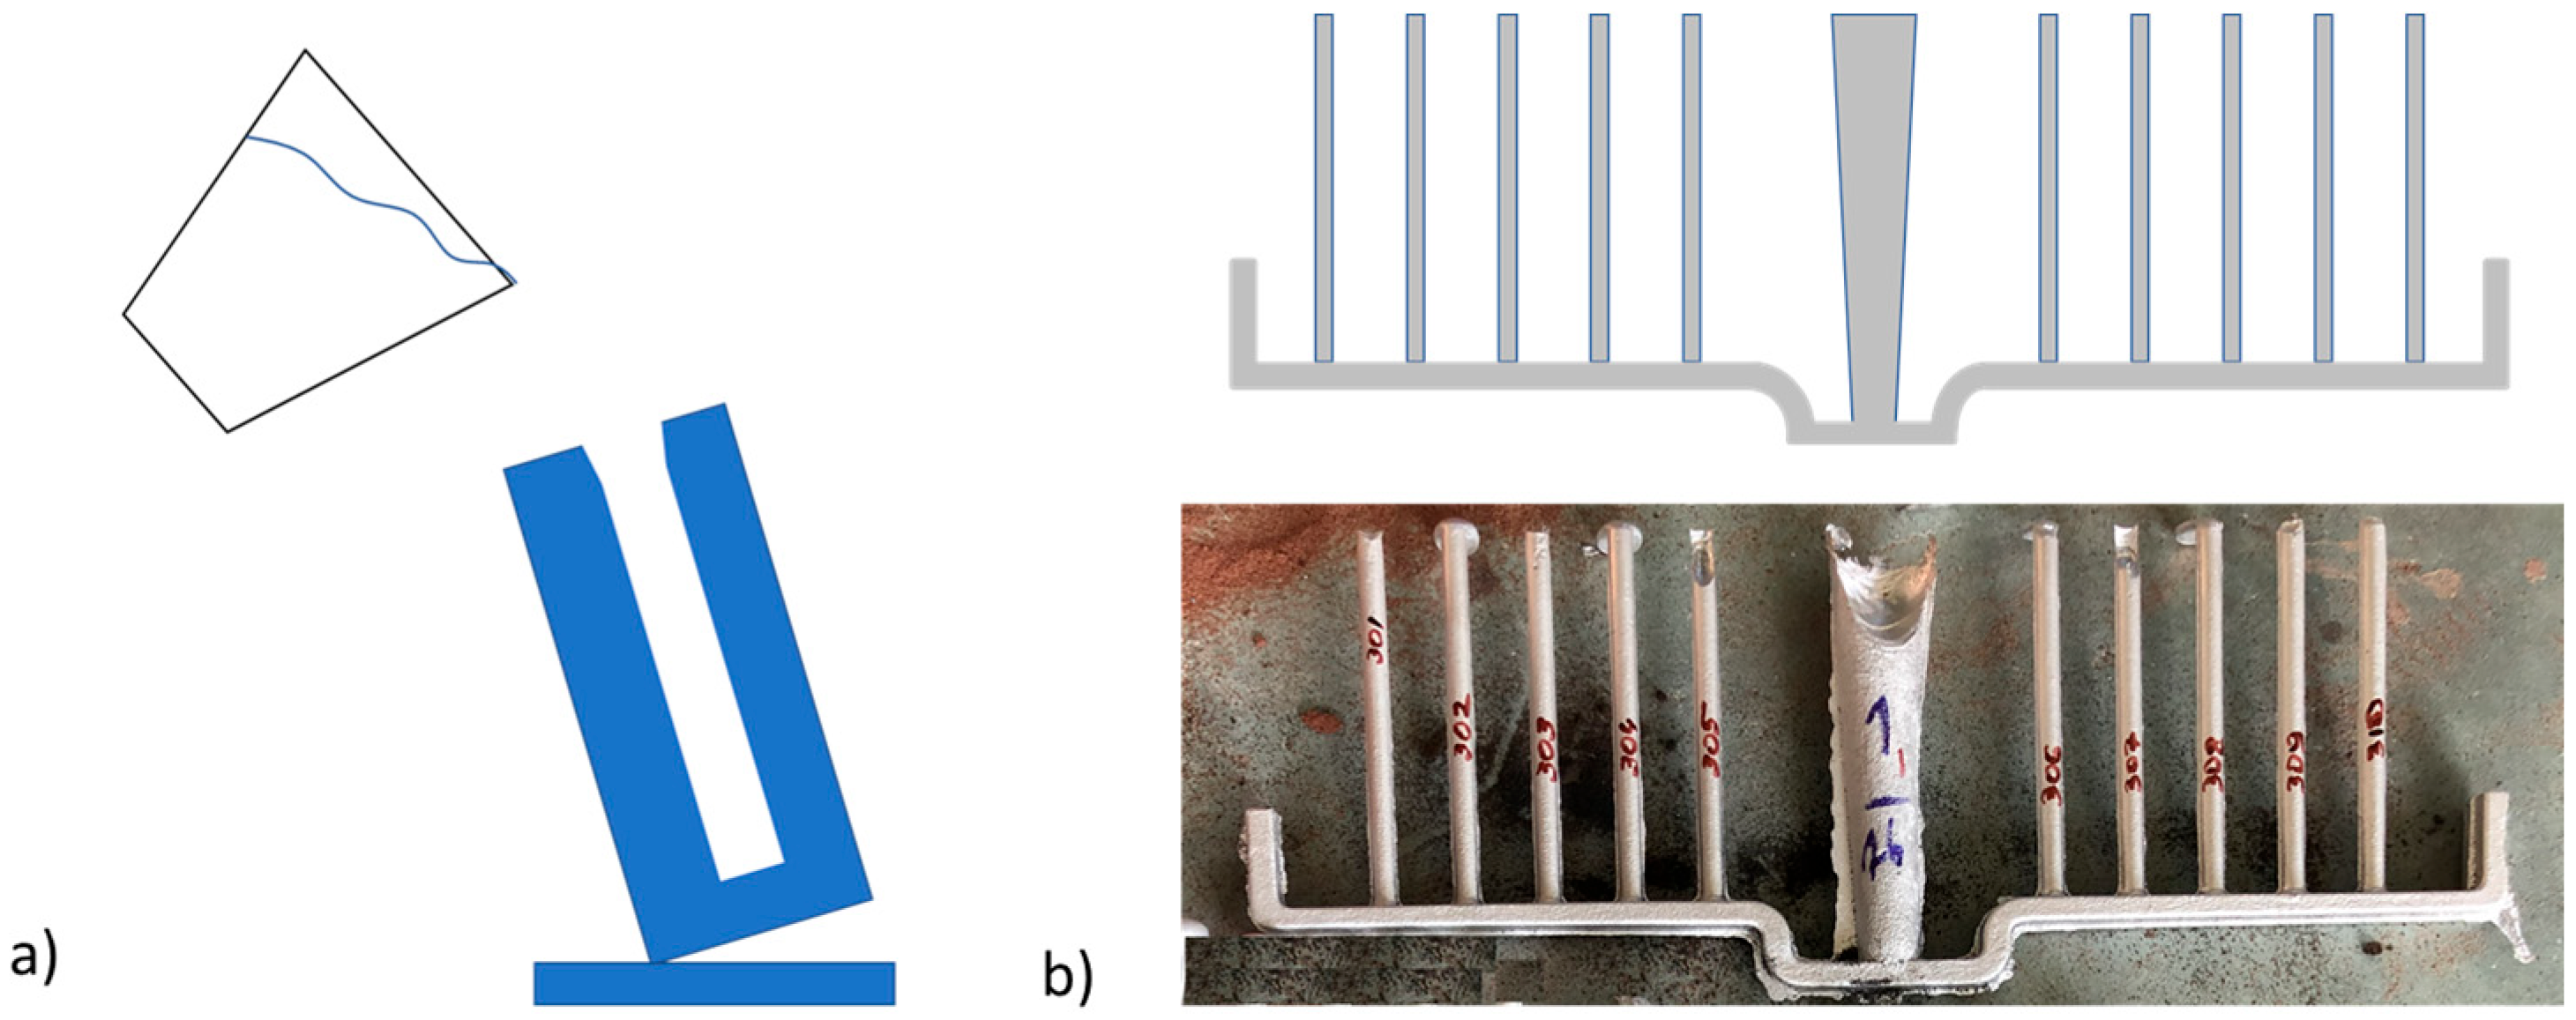
Three main alloys have been used in mechanical experiments and constitutive modeling. The main composition of the alloys selected are AlMg7Cu1.2 and Ti–V–Nb alloy which have been selected to investigate property evolution and modeling. The main benefit of this composition has been predicted as a potential candidate for load-bearing and transmission housing components, as authenticated with mechanical tests showing high tensile strength and good formability. With Al–Cu–Mg alloys, it is possible to achieve high strength through the precipitation of different n phases by increasing the nucleation rate within the alloy. An overview of the casting work scheme and parameters have been given in Table 1. The alloys have been classified as A1, A2, and A3 in the following sections to better distinguish and refer to the properties. The pouring method and branched mold design to fabricate the specimens in the tilt pouring experiments are given in Figure 2a,b, respectively. The specimen diameter has been set to 8.5 mm.
From a casting point of view, there are several castings, pouring, and molding methods. In this study, metal melting has been conducted in an induction furnace with a SiC crucible. In each casting, a total of 10 kg of metal has been prepared. As per Figure 2a, molten metal has been poured into a sand mold cavity where the mold is inclined at 45 degrees with an alfa angle to prevent turbulent flow. In Figure 2b, an overview of mold and specimens is illustrated. Each pouring resulted in 10 specimens, A1, A2, and A3.3 alloys provided 1 set of specimens (10 units) The A3.1 and A3.2 casting provided 3 sets of mold with 30 specimens in total. Specimens from the molds have been scanned in CT.
2.2. Characterization and Mechanical Testing
In order to determine melt cleanliness, RPT tests have been conducted before and after degassing. Specimens have been analyzed by CT scans using General Electric Phoenix Tomography (Renault Research Development Centre, Bursa, Turkey). Moreover, cast specimens after T6 heat treatments, have been inspected via CT scans to compute internal defect metrics. Although whole specimens have been scanned, CT reconstruction analysis has been performed on gauge length section for a volume of 1000 mm3. Table 2 summarizes the settings of the evaluation. The set of metrics that has been selected is given in Table 3. A GE Xray Tomography machine has been used. The image reconstruction was performed with VG STUDIO MAX 3.2 software.
Machine and software settings that have been applied have been chosen as per Renault’s casting evaluation specifications. The focus, current and voltage, and numerical aperture of the software would approximately yield a detection limit of 15 um for planar defects and 30 um for spherical defects.
Mechanical tensile tests have been conducted using Zwick tensile tests with a stroke speed of 1 mm/min, and 500 mm/min. Specimen dimensions have been selected according to ASTM E8 standards. Specimen dimensions have been given in Figure 3. Cylindrical specimens have been machined in air and water-cooled using a lathe machine before heat treatment.
2.3. Constitutive Modeling—Parameter Identification and FEA Analysis
Constitutive models for cast aluminum behaviors have been built and simulated in ABAQUS v6.14 Code. Gurson-type porous metal plasticity has been elaborated to identify material behaviors and material parameters.
In the constitutive modeling framework as shown in Figure 4, J2 plasticity has been proposed to model the behavior of defect-free metallic solid materials. The model incorporates non-linear isotropic hardening of the material. When defect/porosity has been omitted and set to zero, the model behaves as a J2 plasticity model. In the case of porous metal plasticity where the porosity comes into effect, plasticity equations must be solved by considering the defect percentage. In both cases, 3D simulations have been performed. The results of Gurson plasticity simulations have been investigated in the present study so that the correlation of CT scans and tensile tests can be established and the porosity effect can be demonstrated in modeling.
Plasticity code has been implemented via ABAQUS UMAT subroutine integration features. An Intel Fortran Compiler has been used in the implementation. Constitutive equations have been written in Fortran code. Local numerical integration of the equations has been governed by the UMAT routine within the global finite element model. The Newton-Raphson method has been used to compute yield function and incremental plastic flow multiplier. Step time integration by the backward Euler algorithm has been implemented to calculate the evolution of constitutive equations.
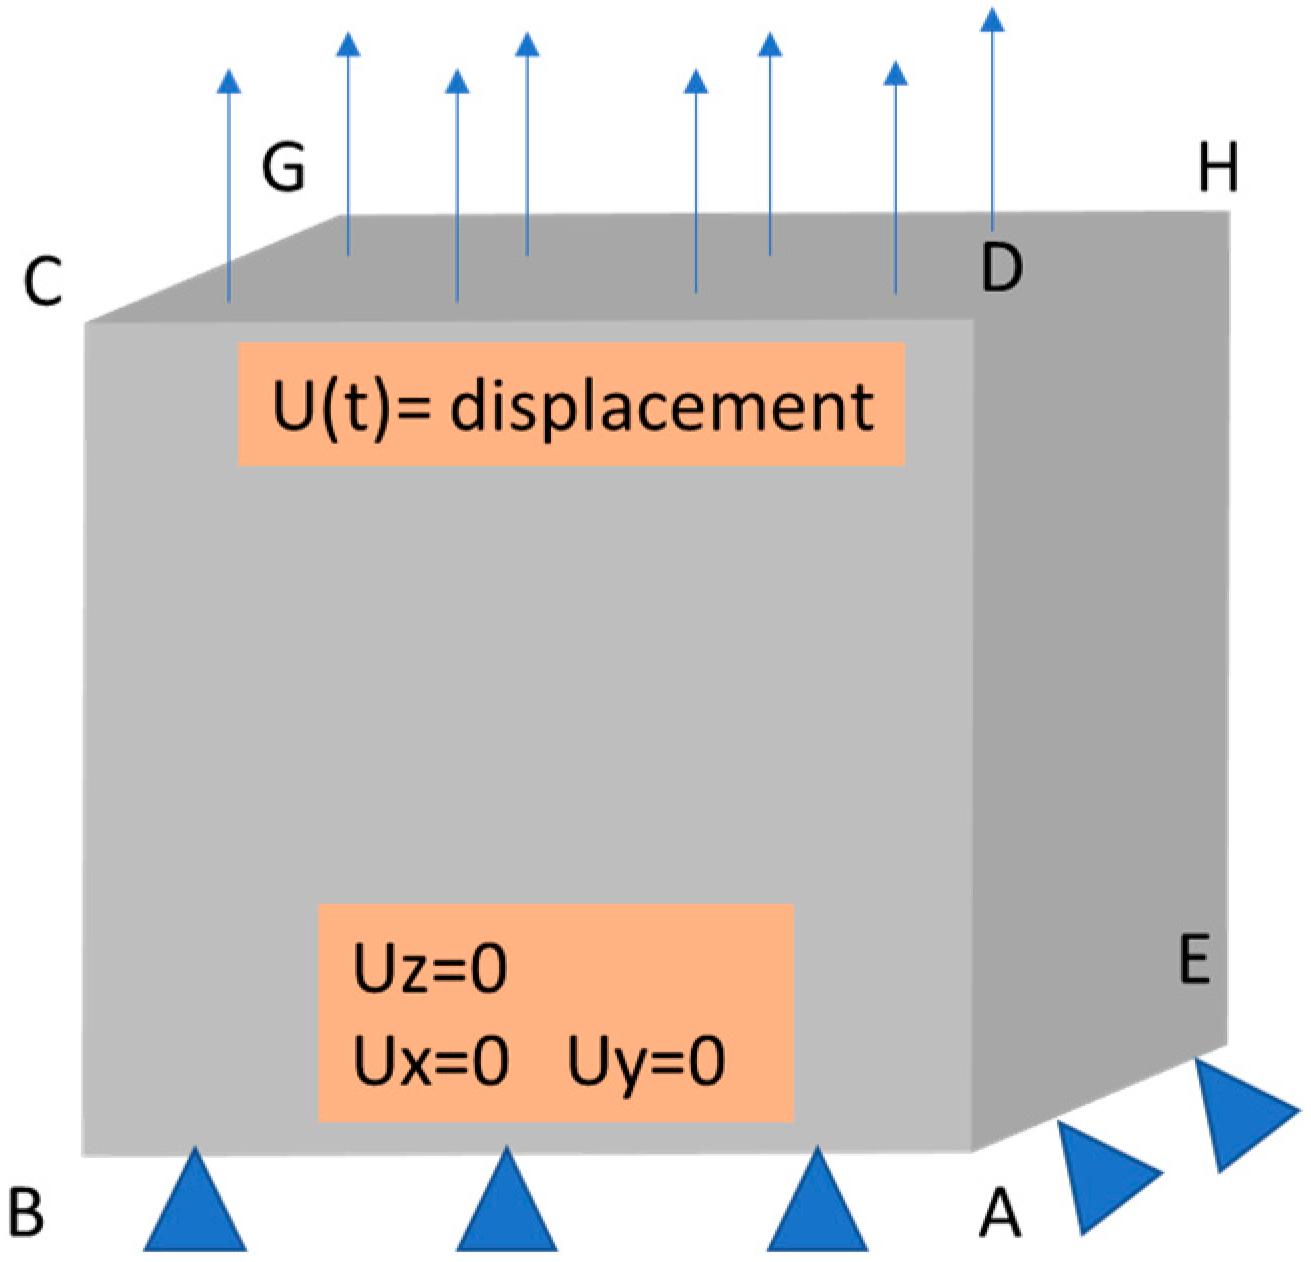
Finite element models have been built on simple geometry for verification of the models and initial correlation of tomography results. A square and a cube of 10 mm edge dimension have been built. Quad type 8 node elements have been assigned to the models. Boundary conditions representations are given in Figure 5.
In the second stage, the unitary finite element reference cube has been modeled in 3D. The lower face has been fixed in cartesian coordinates in all directions and the upper face has been subjected to displacement along the Z axis as tested in the tensile test. The RVE FE model has not included any defects or porosity at the mesh grid level. Porosity and defects have been implemented numerically through the Gurson model within the UMAT routine.
Correlations with tensile tests and simulations have been conducted in built-in tools of ABAQUS. Stress–strain curves have been plotted. Stress–Strain tensor fields have been visualized on deformed geometry. Porosity and plasticity evolutions have been observed.
3. Results
3.1. CT Characterization
The first step of CT evaluations has been performed in RPT specimens to validate melt cleaning and final structure comparison. A sampling of 20,000 mm3 has been taken from the center of the specimens (Figure 6).
Table 3 shows the RPT CT metrics, where detected defects numbers were similar for both steel and sand mold in degassed conditions, but the surface and volume have been relatively higher due to the slower cooling rate and opening of defects in the structure.
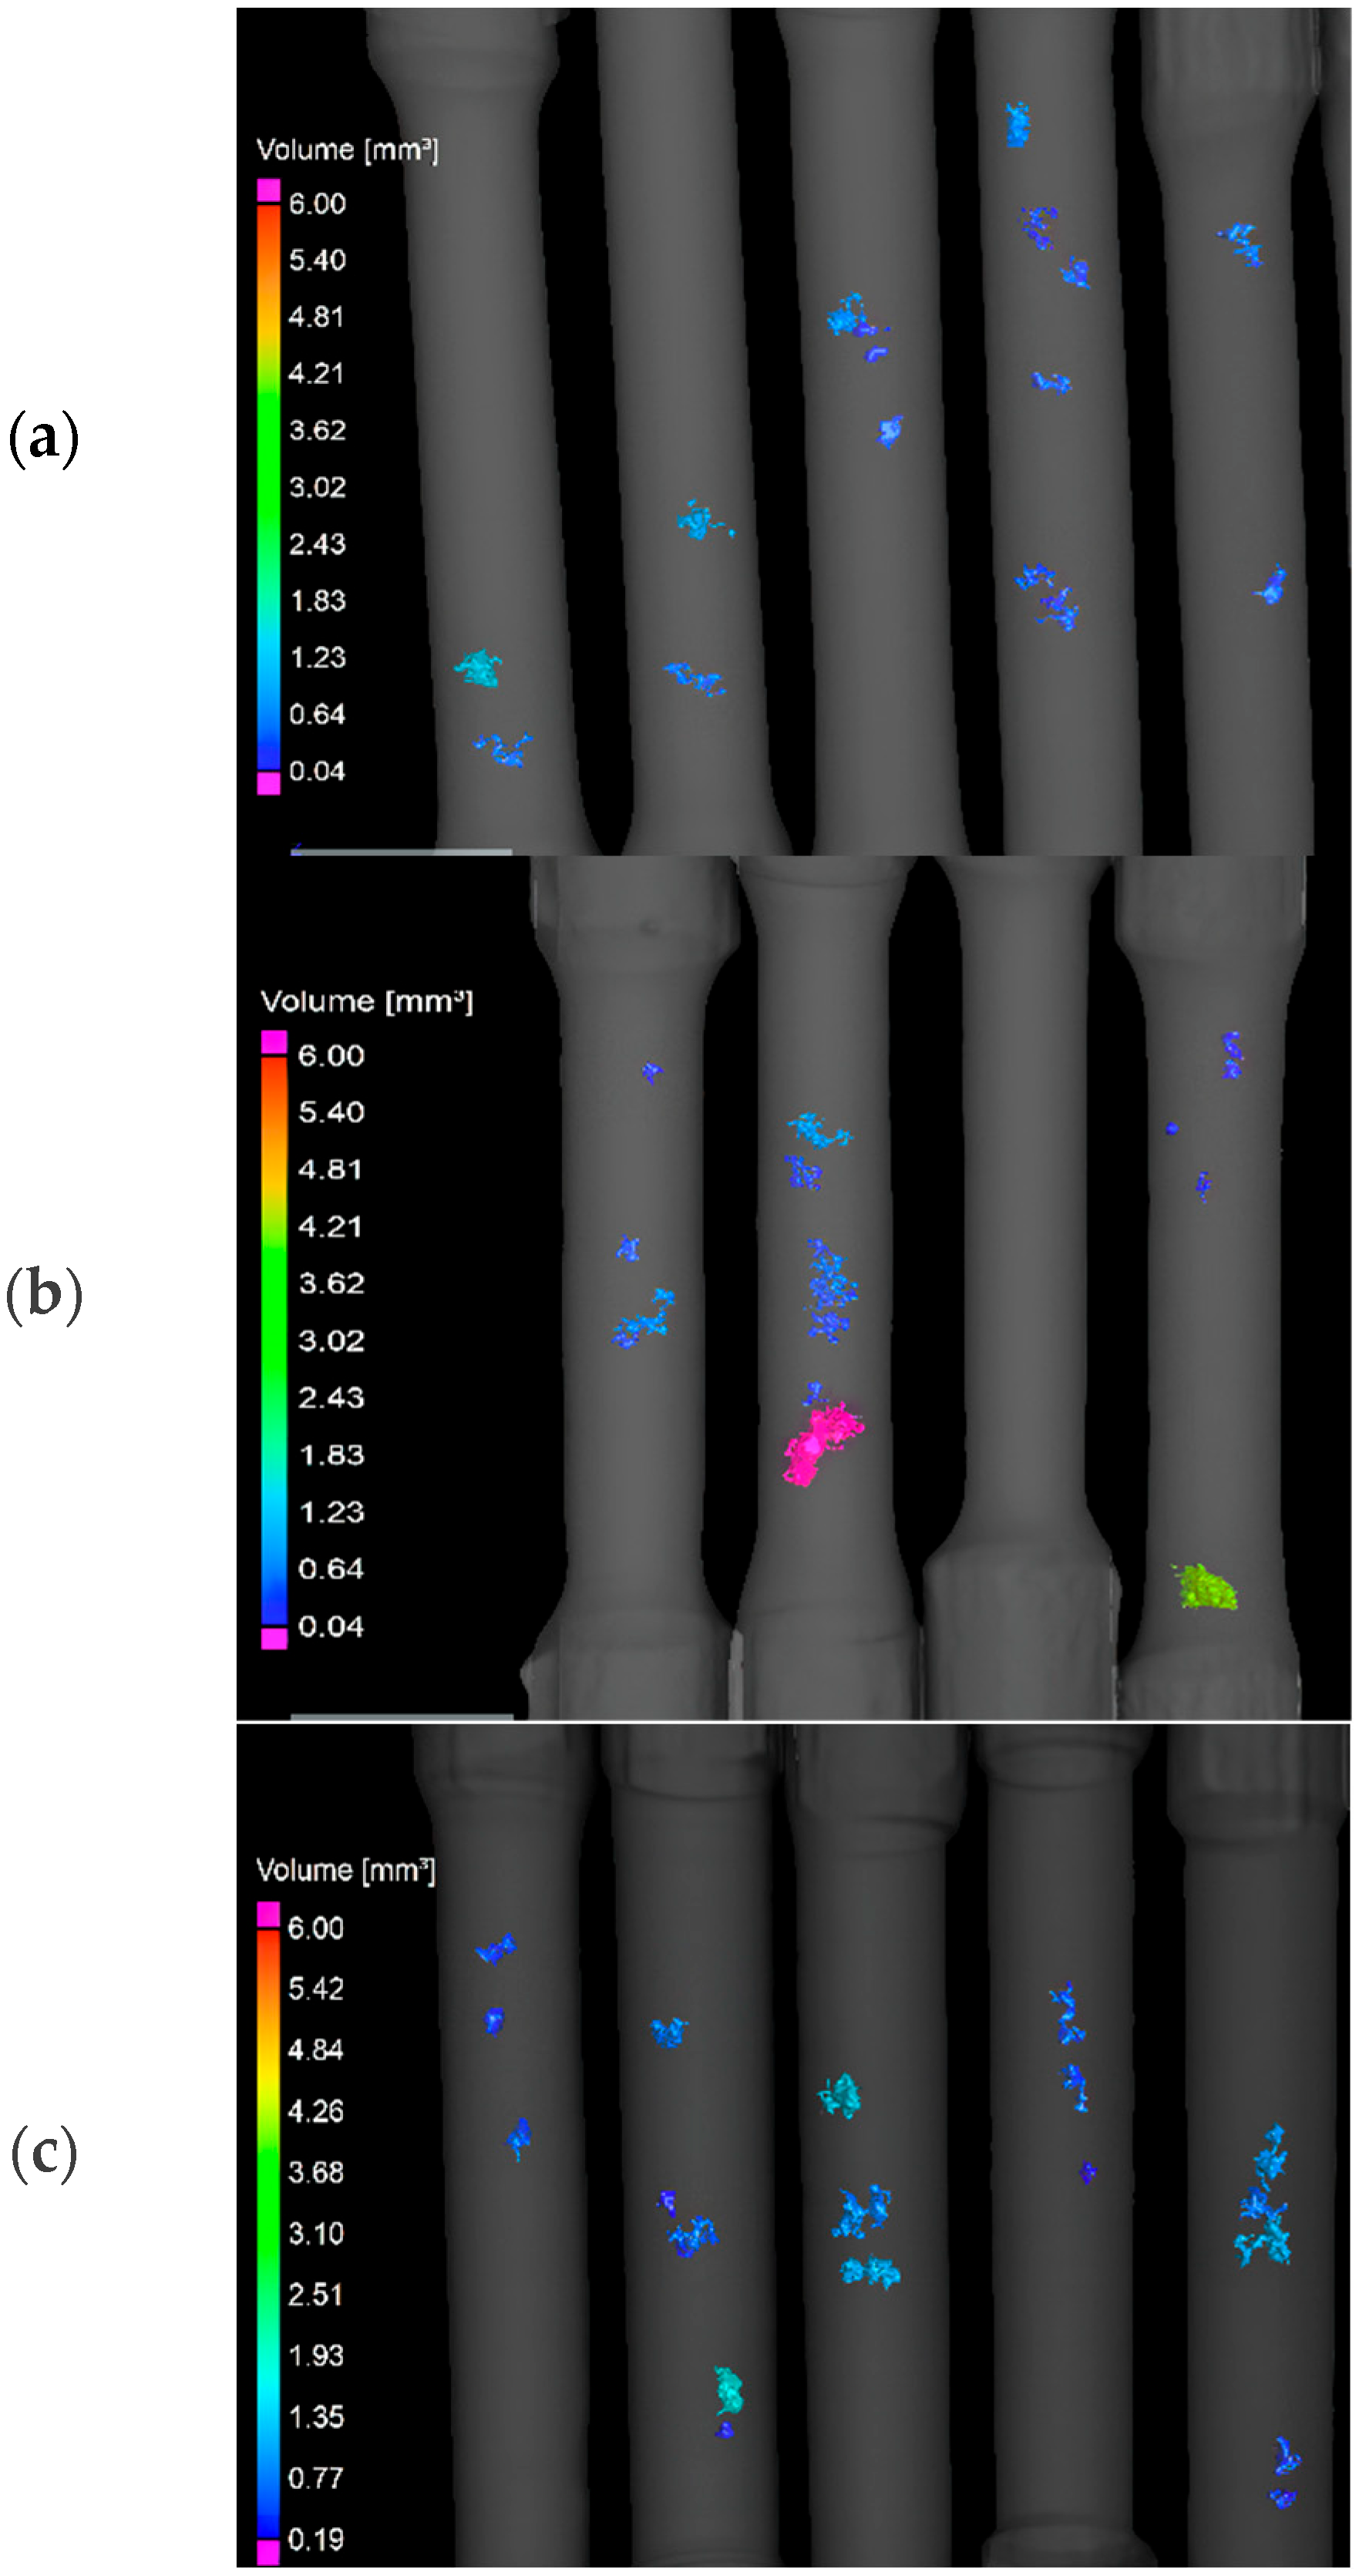
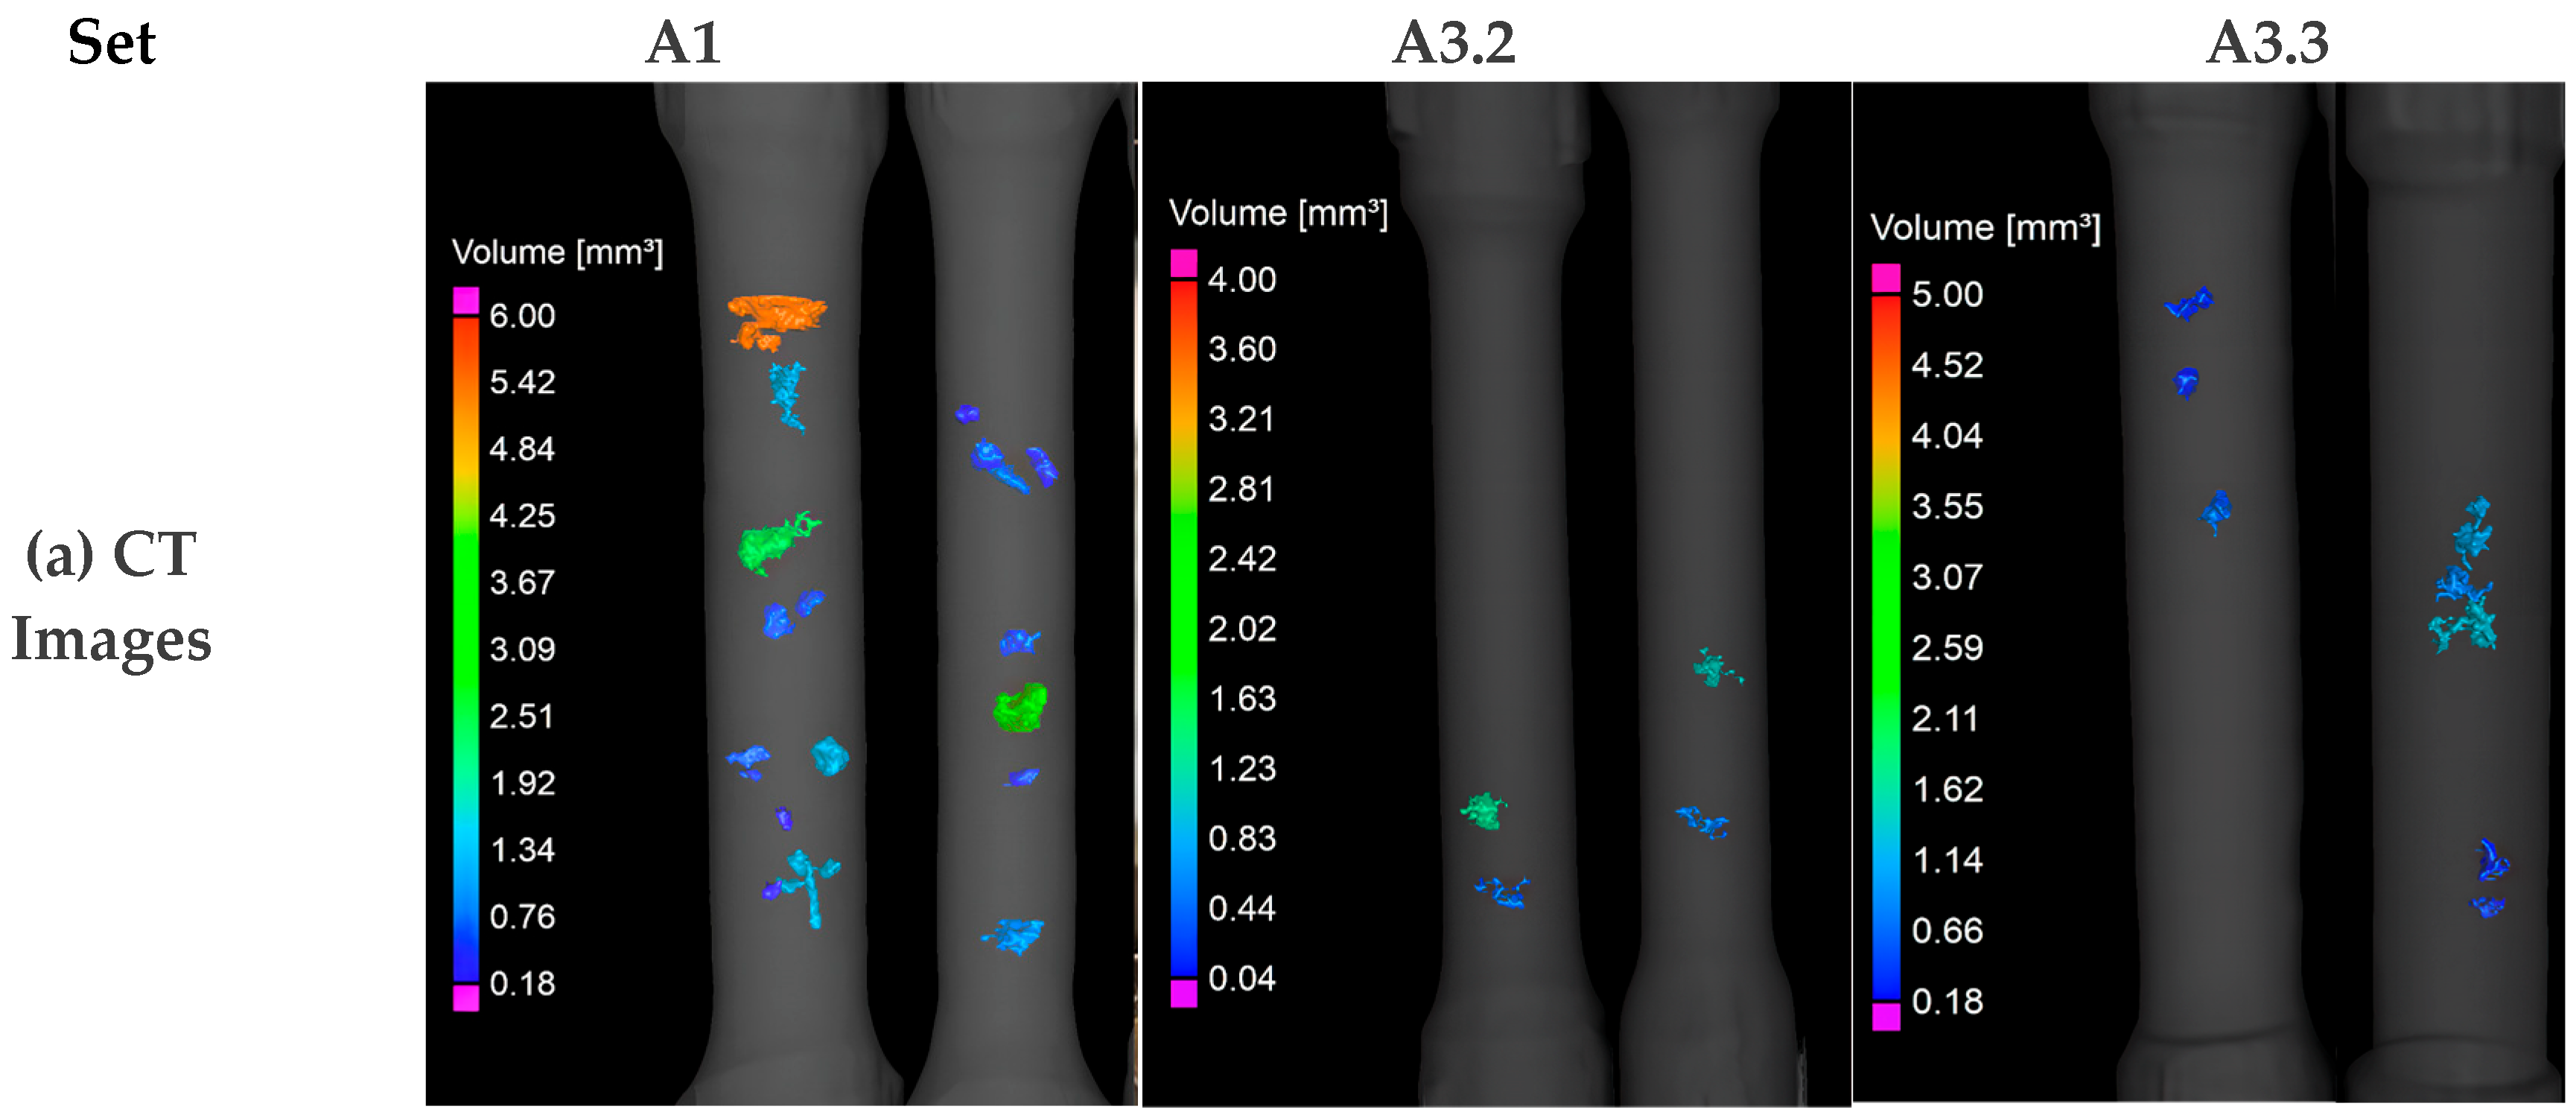
In order to evaluate the internal defect structure of the specimens, CT scans have been performed. Reconstruction of Alloy A3 is given in Figure 7 for A3.1, A3.2, and A3.3 specimen sets, respectively.
As the oxide film surface and percentage are important in deformation behavior, the following tomography metrics have been exploited: total defect surface (DSurf), total defect volume (DVol), biggest singular defect’s surface (DSmax), localization effect, the projected area of the biggest defect as Pxz on the cartesian plane of X-Z and, Pxy on the cartesian plane of X-Y in Table 4.
Reconstruction images have been given in cartesian coordinates and defects have been illustrated by their volumes in mm3 within the structure. The z-axis has been selected as the longitudinal axe of specimens in the measurements.
3.2. Mechanical Test Results
Prior to the mechanical testing of alloy sets, the spectra results and composition complexity for the alloys have been built and are given in Table 5. Two different sets of grain refiners have been alloyed into the final compositions. Nb content in the alloys has been measured by XRF. The bifilm evaluations, tomography (CT) studies, and tensile tests have been conducted on these main alloys hence the constitutive modeling has been built on their mechanical response. Metal melt sampling and cleanliness evaluations have been conducted via reduced pressure tests and CT scans. The base Alloy is AlMg7.3Cu1.1 and A1 is Niobium alloyed, A2 is Titanium–Vanadium alloyed and A3 is Ti–V–Nb are the alloyed sets.
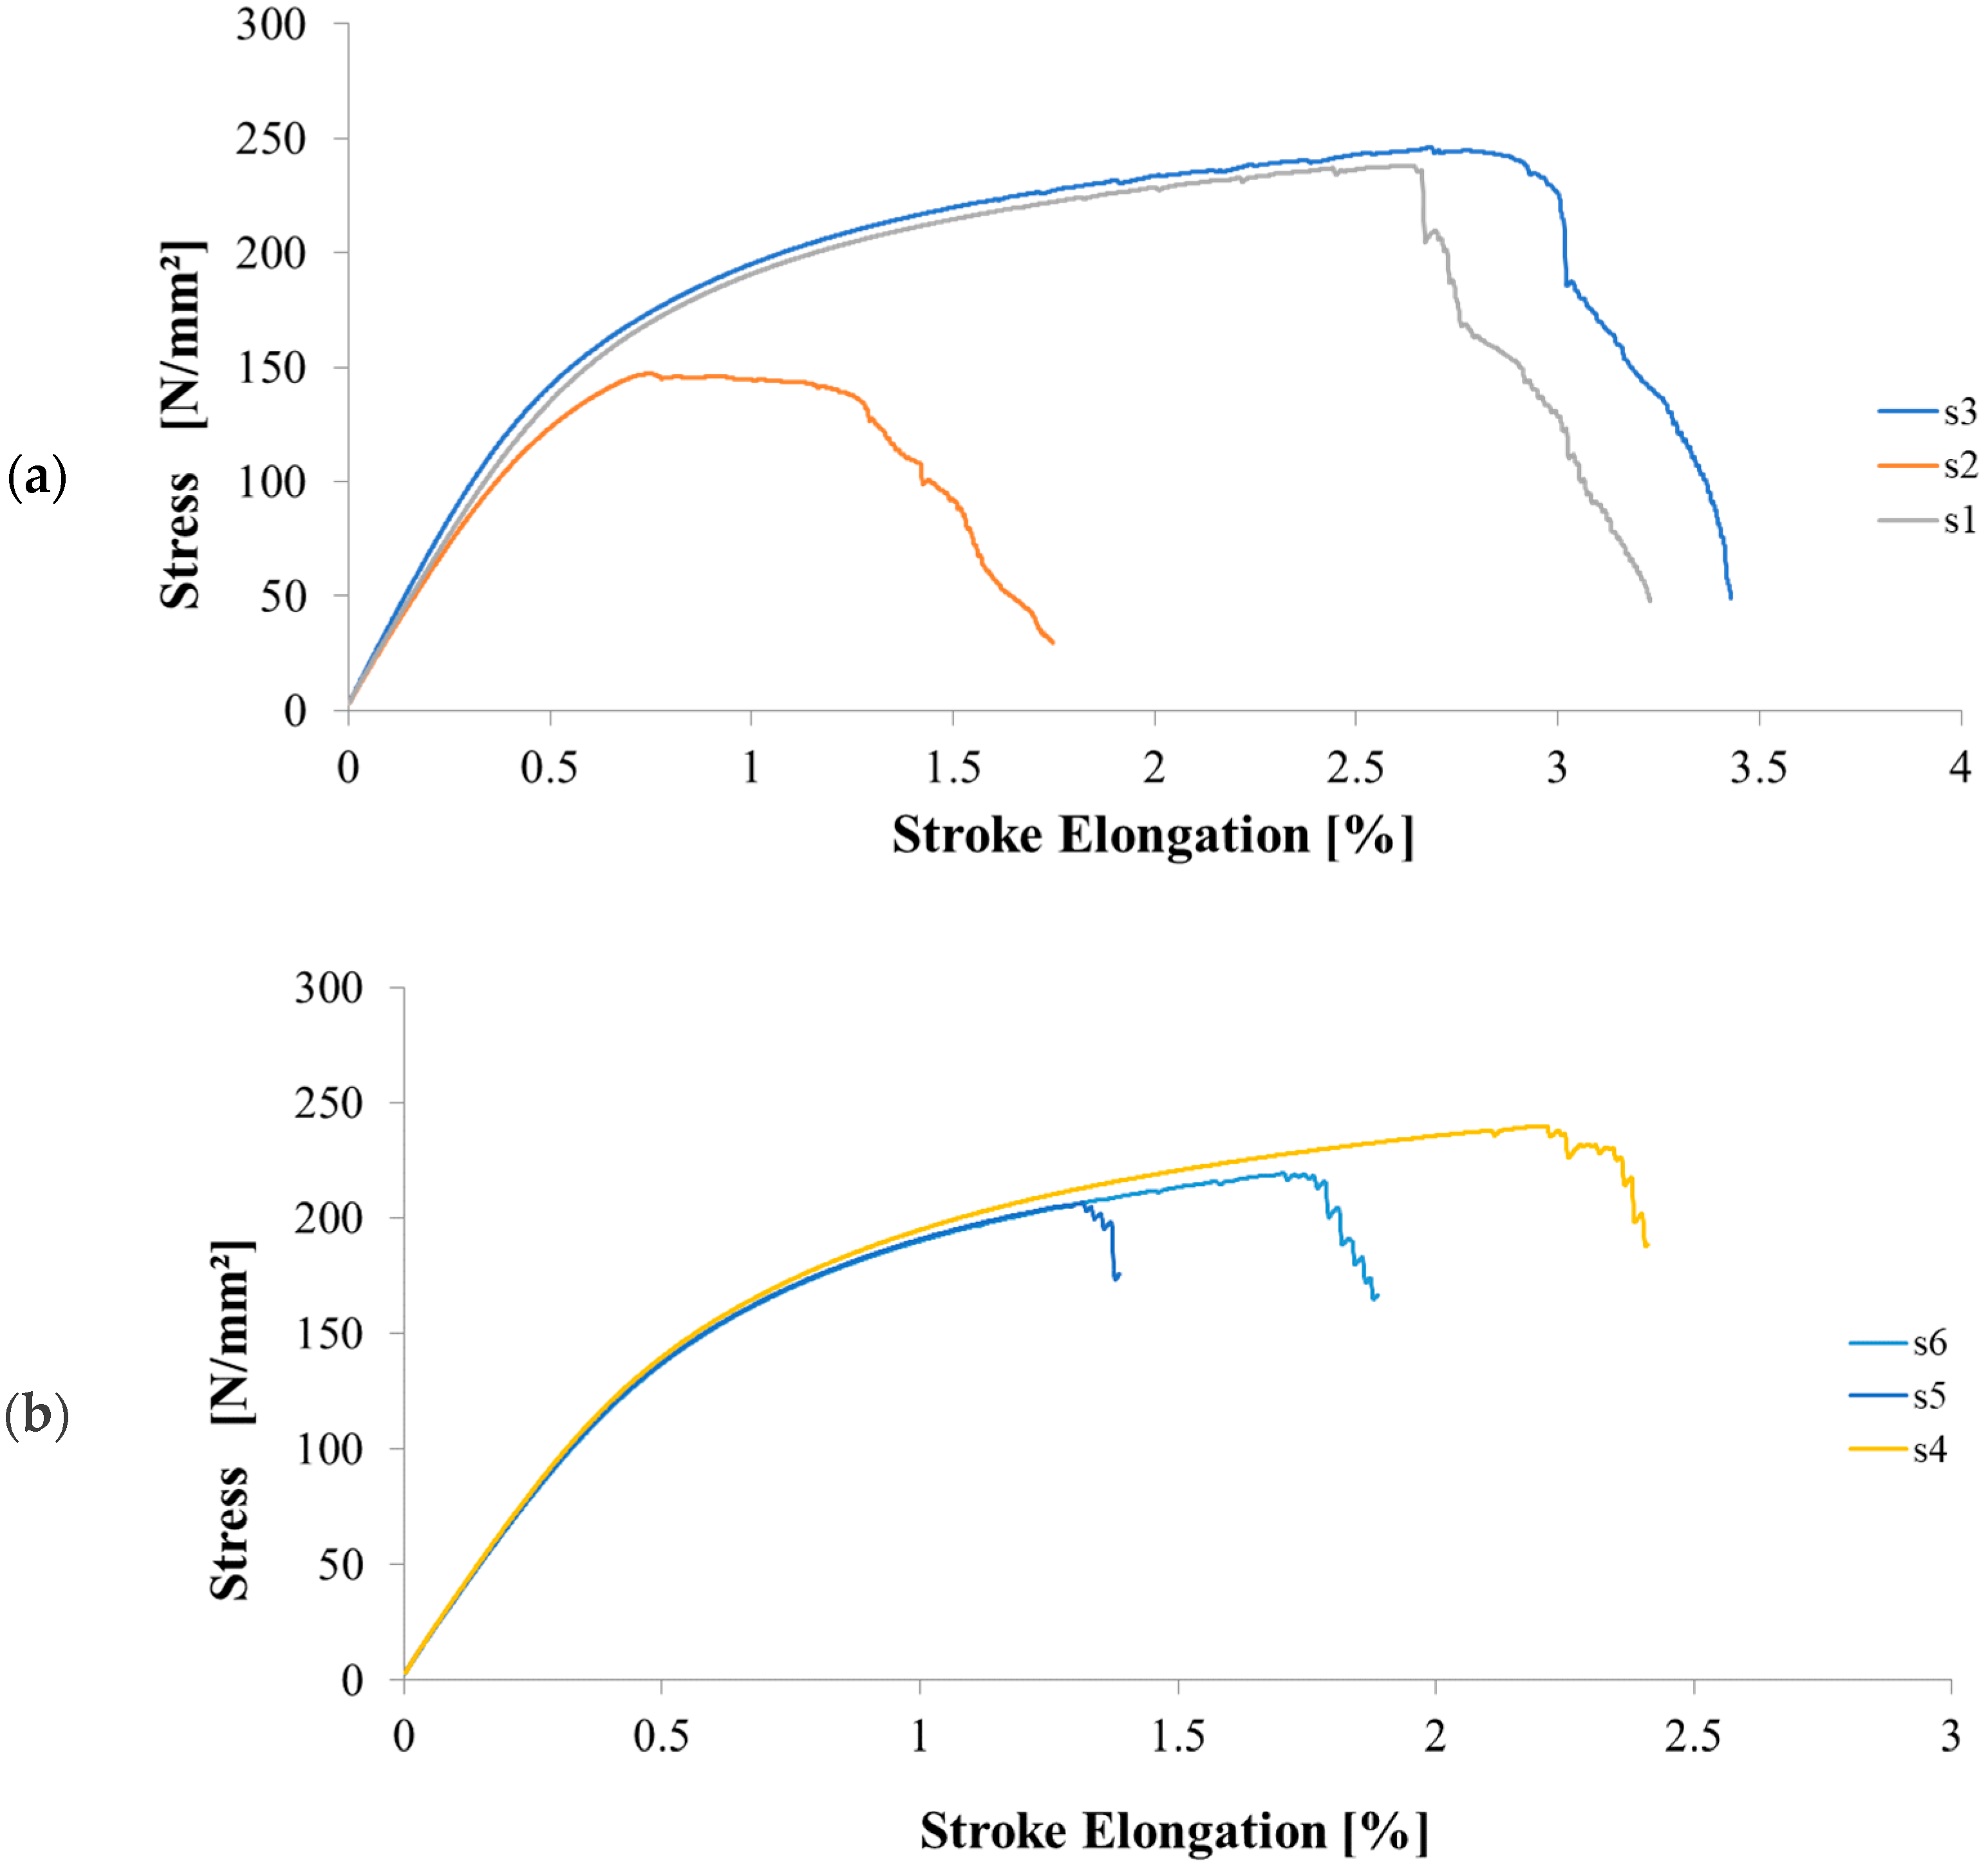
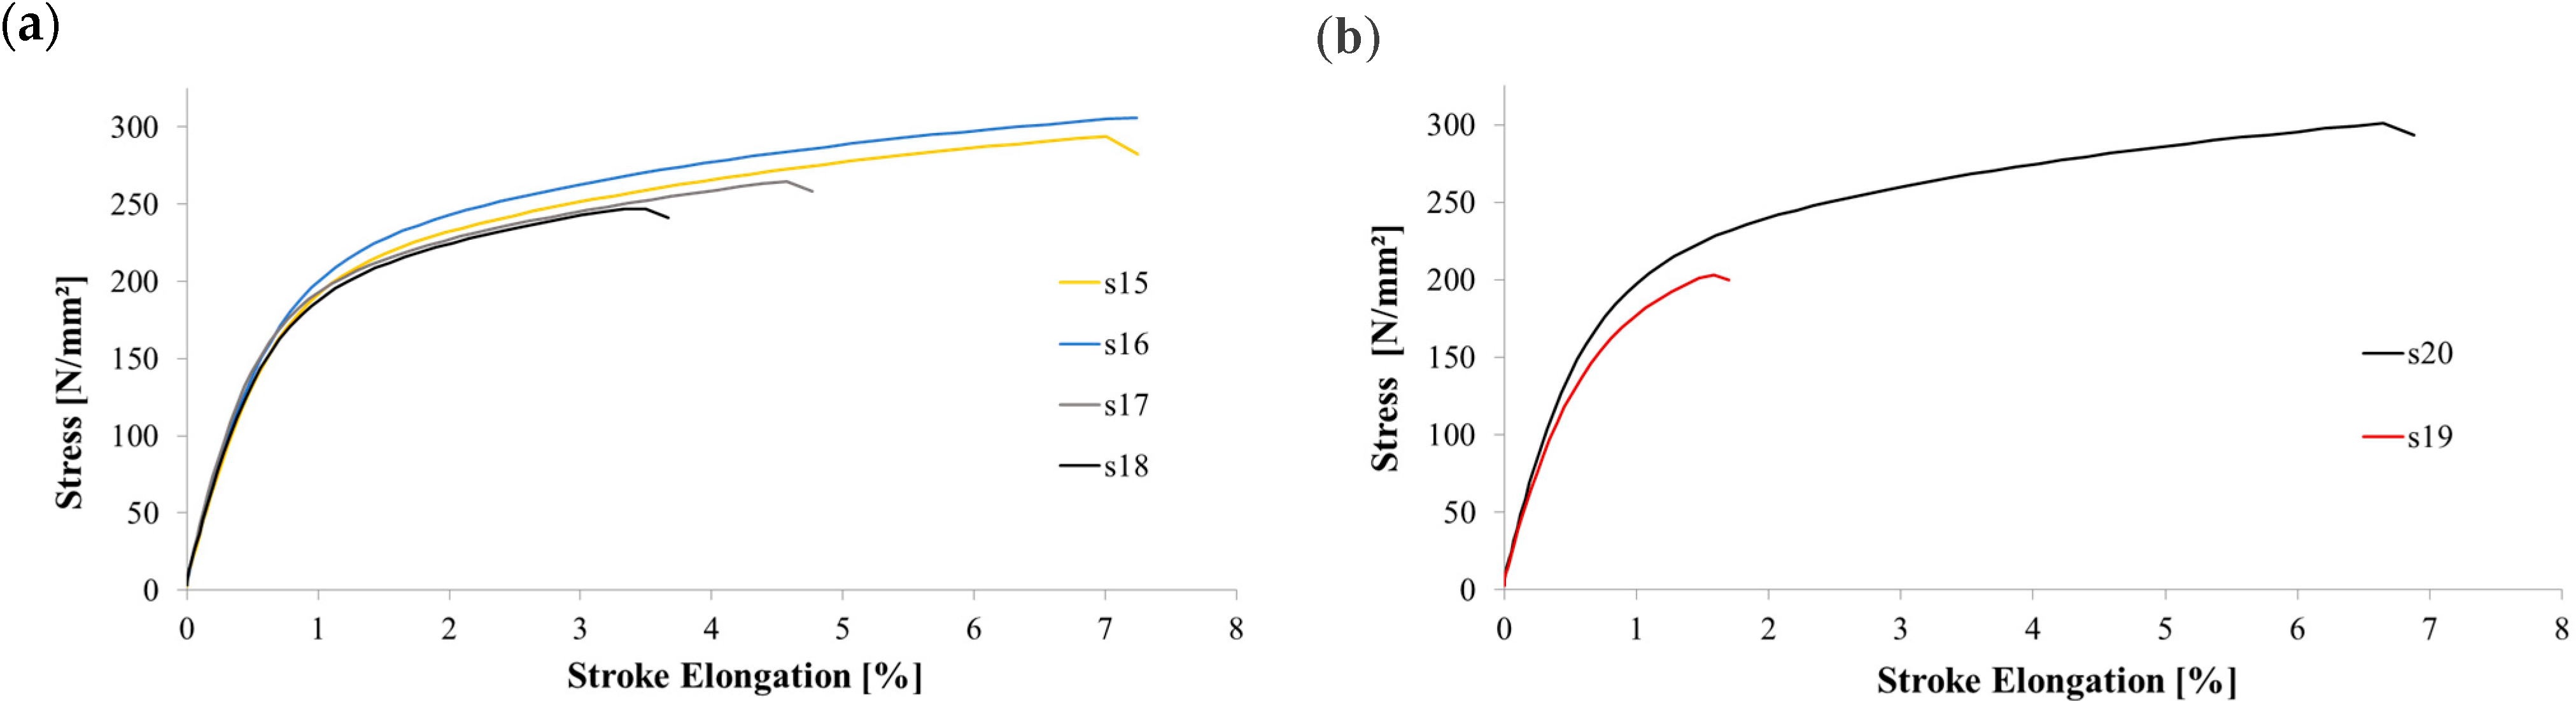
The behavior of alloys has been characterized by tensile tests with 1 mm-min and 500 mm-min tensile stroke speeds at room temperature conditions. Tensile curves of 1 mm-min stroke speed of the Alloys A1, A2, and A3 are presented in Figure 8a–c, respectively. Tensile curves of multiple test results have been selected for illustration. A1, A2, and A3 represent the results of each alloy set in a single crucible casting condition whose composition is given in Table 4. A1 alloy (AlMgCu-Nb) has been prepared and specimens have been fabricated and later have been tested. The same has been performed for A2—the Ti-V alloyed AlMgCu and A3—the TiVNb alloyed AlMgCu. Specimen results have been given each for a single casting experiment.
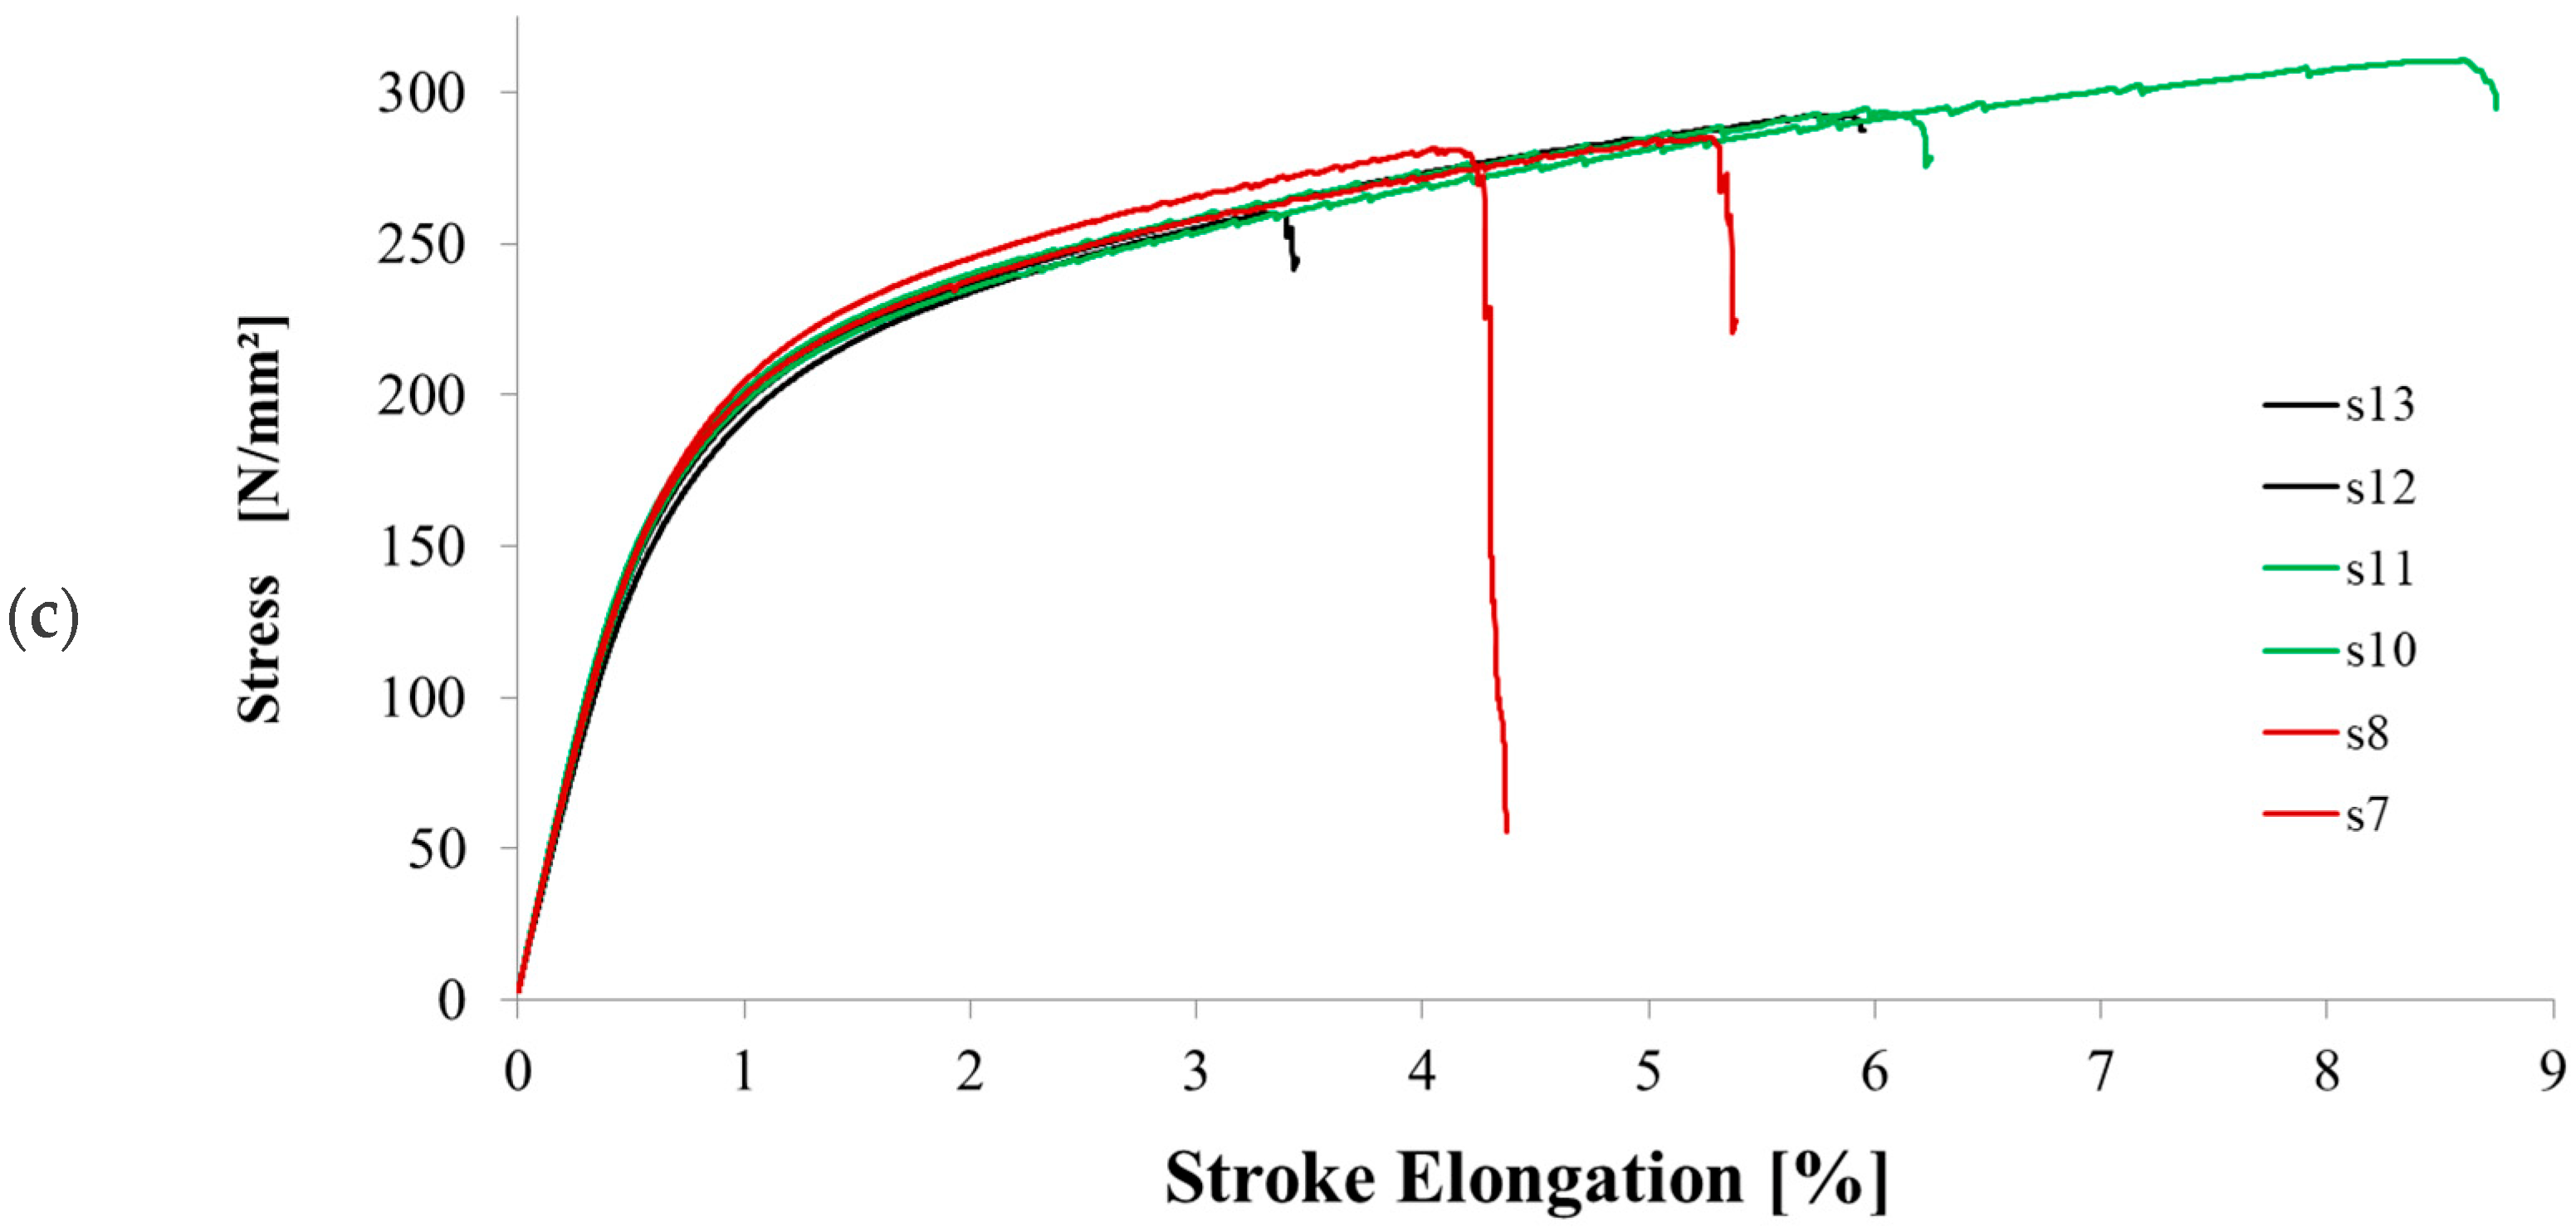
A stroke speed of 500 mm/min has been selected to test second specimen groups in order to investigate the tensile behavior of the alloys. The results of the tests are given in Figure 8 for the alloy sets of A3.1 and A3.3, respectively. Specimens of alloy set of A1 and A2 have failed to give sensible results as they have fractured due to their internal defects contents and their effect on mechanical behavior at 500 mm/min stroke speed. The results are discussed in a later section.
Table 6 gives the tensile test results of the before mentioned tensile curves in Figure 8 and Figure 9. Yield Strength, tensile strength, and stroke elongations are given.
In stroke speed and stroke elongation conditions, comparison of 1 mm/min and 500 mm/in test results have shown similar tensile curves according to Figure 10. Strain sensitivity has not been observed. In general, defect content and tensile strength correlation have provided similar results. The strain-controlled tests or ballistic impact tests must be performed to observe the sensitivity and effect of defect content on properties. This is out of the scope of the present study.
Following the tensile tests and CT scan evaluations, comparison and correlation studies have been conducted on post-test pictures and CT reconstruction images. Results are illustrated in Figure 11a for CT images of specimens and Figure 11b for test pictures in 1 mm/min and 500 mm/min tensile stroke speed respectively. In Row 1-2-3, results of specimen sets, A1-A3.1-A3.3 have been presented.
As illustrated in Figure 11, the defect position of the most critical defect within the structure as measured and computed in CT has yielded the crack location of the tensile specimen.
Contour maps of tensile strength vs. Dvol and Dsurf have been calculated for the tensile stroke speed test results. Maps have yielded correlated results where maximum tensile strength has been achieved with the lowest defect volume and surface as expected according to Figure 12.
3.3. Behavior Simulations
Prior to simulation vs. tensile data correlation, CT scans results have been analyzed and effective porosity parameter fv of the Gurson porous metal plasticity model are shown as per Table 7. Computed Dvol has been taken as a reference defect for a representative volume of 100 mm3. This representative volume concept can be defined as the “Adjusted Representative Material Yield parameter (ARMY) or Computed Representative Material Yield parameter (CRMY)” for CT scans of cast materials.
3.3.1. Porous Plasticity
The CT scans, evaluation of metrics, and correlation of tensile data have provided sufficient information that behavior modeling must be performed by a numerical model which should take porosity into consideration. Classical J2 plasticity could not sufficiently depict material behaviors where defects such as inherent double oxide films of cast aluminum alloys dominate the main deformation mechanism.
3.3.2. Gurson Model Adaptation
The Gurson model has been loaded into ABAQUS software. The hardening behavior has been selected as power law hardening. Model calibration has been performed to determine the hardening exponent and porosity content. In Table 8, material parameters after adaptation are given. Calibration of the model has been performed according to yield stress and maximum tensile stress of each specimen set. As the simulations have been performed.
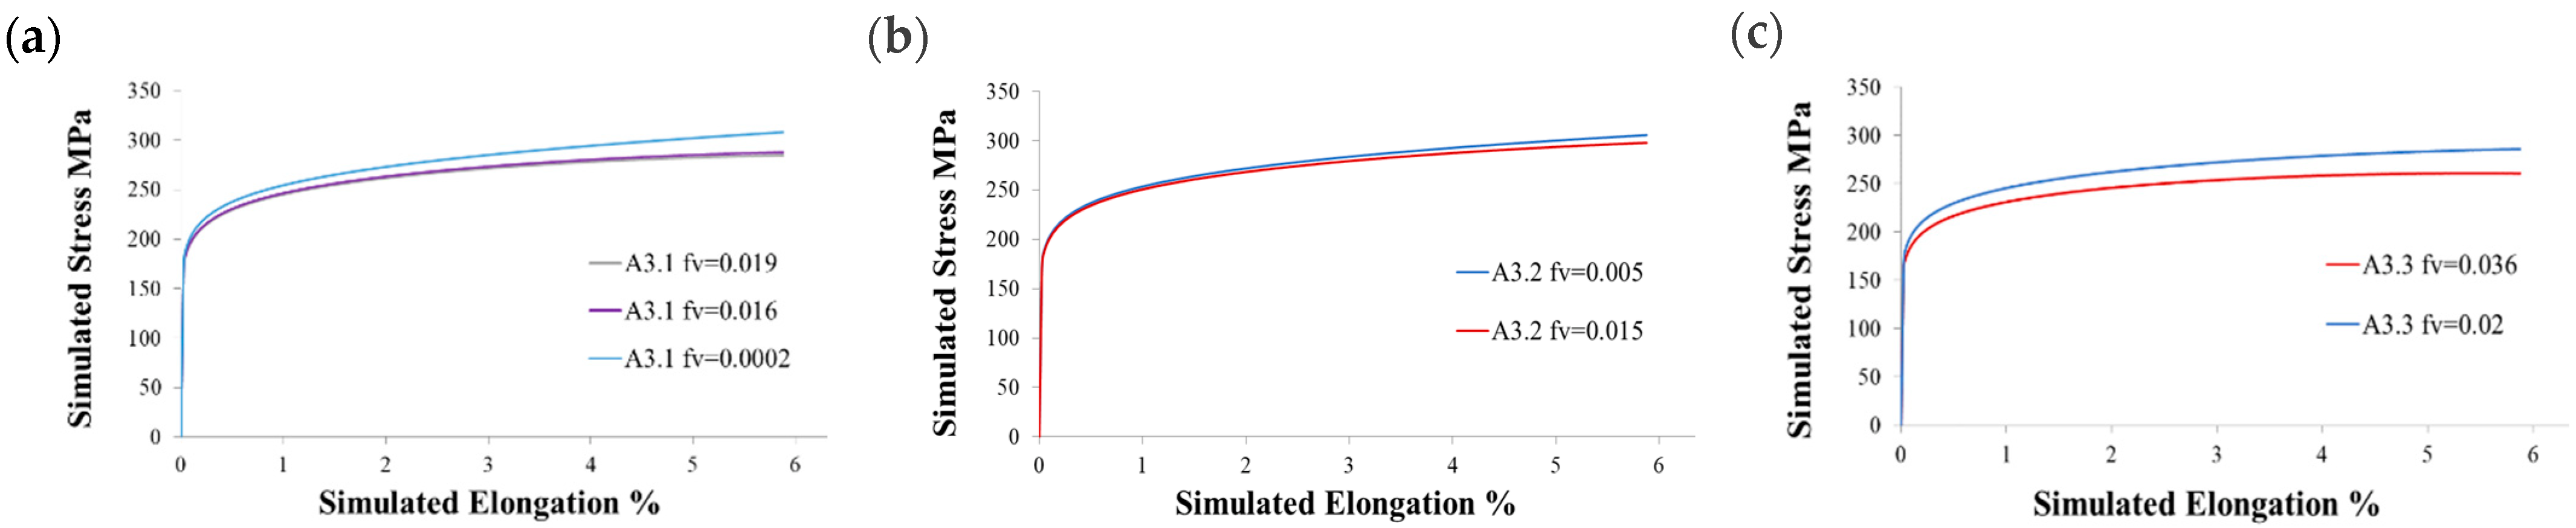
Figure 13a,b illustrates the calibration of tensile test curves with calculated tensile curves according to the Gurson Model with different porosity levels for A3.1 and A3.3 alloy sets respectively. Power law hardening exponent and porosity coefficient has been used to fit the data with simulations.
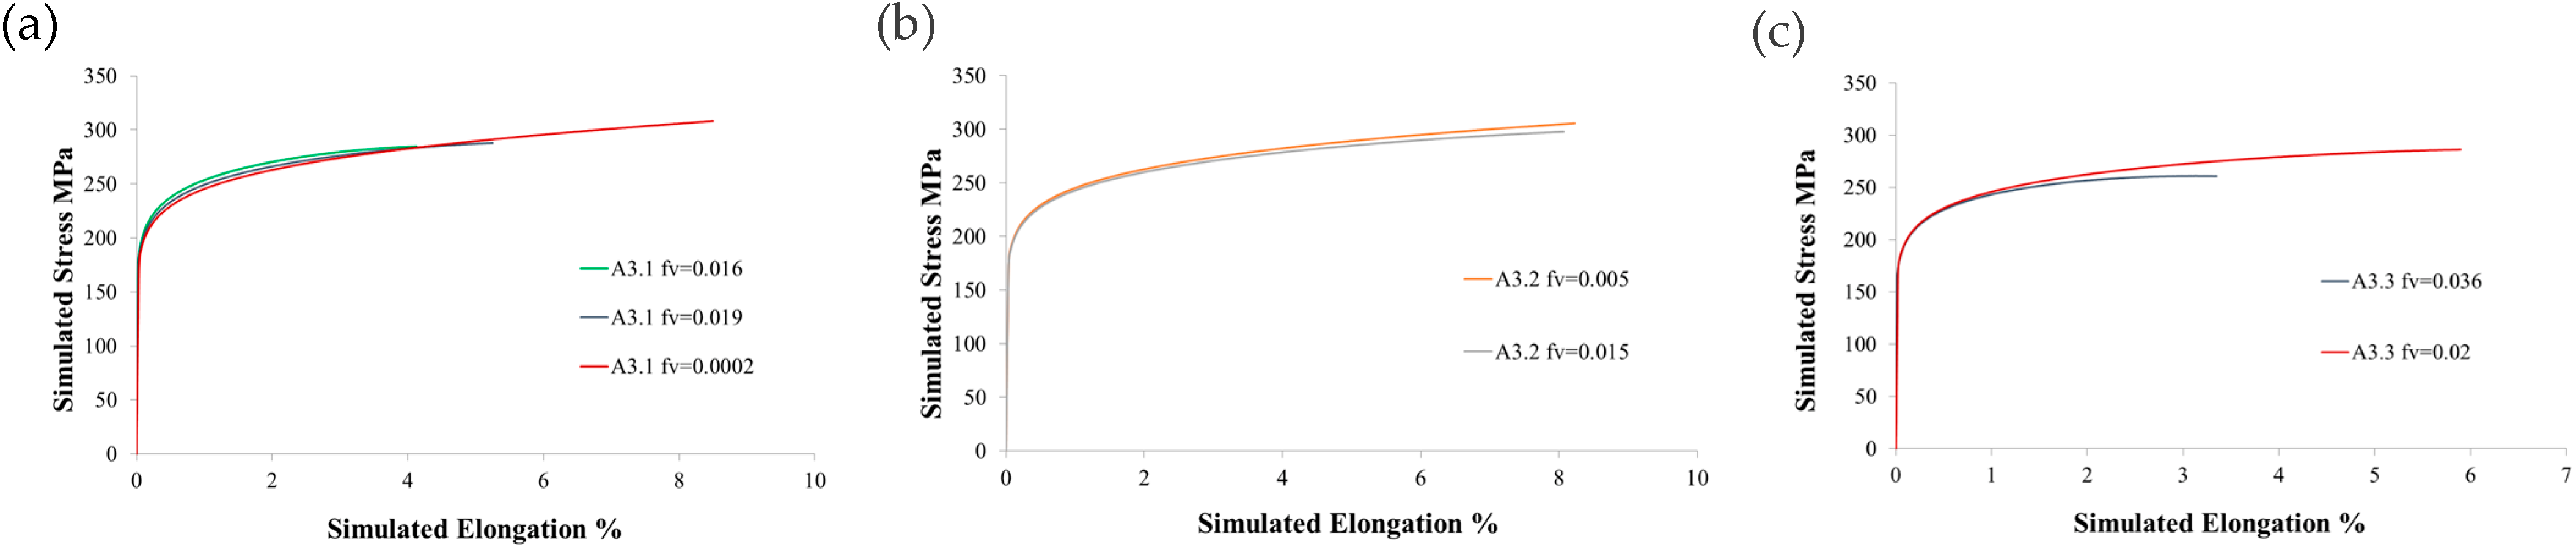
Figure 14 illustrates respectively A3.1, A3.2, and A3.3 simulation results on the RVE elements for different porosity levels calculated from CT scans. As the simulations have been calculated on the RVE element in reference conditions, total elongations have been calculated up to 5,88% elongation as a boundary condition has been set for the displacement reaching this percentage of deformation on the unit cell.
At the final stage, elongation correction has been conducted by matching test elongation data with simulation results. Otherwise, correction results are shown in Figure 15a–c. respectively for A3 alloy sets. The effect of porosity content percent difference on mechanical strength has been observed in both simulated and tested curves.
Table 9 gives the results of Gurson Model simulations with tensile test results correlations. Tested and calculated stress levels are shown for A3 alloy sets.
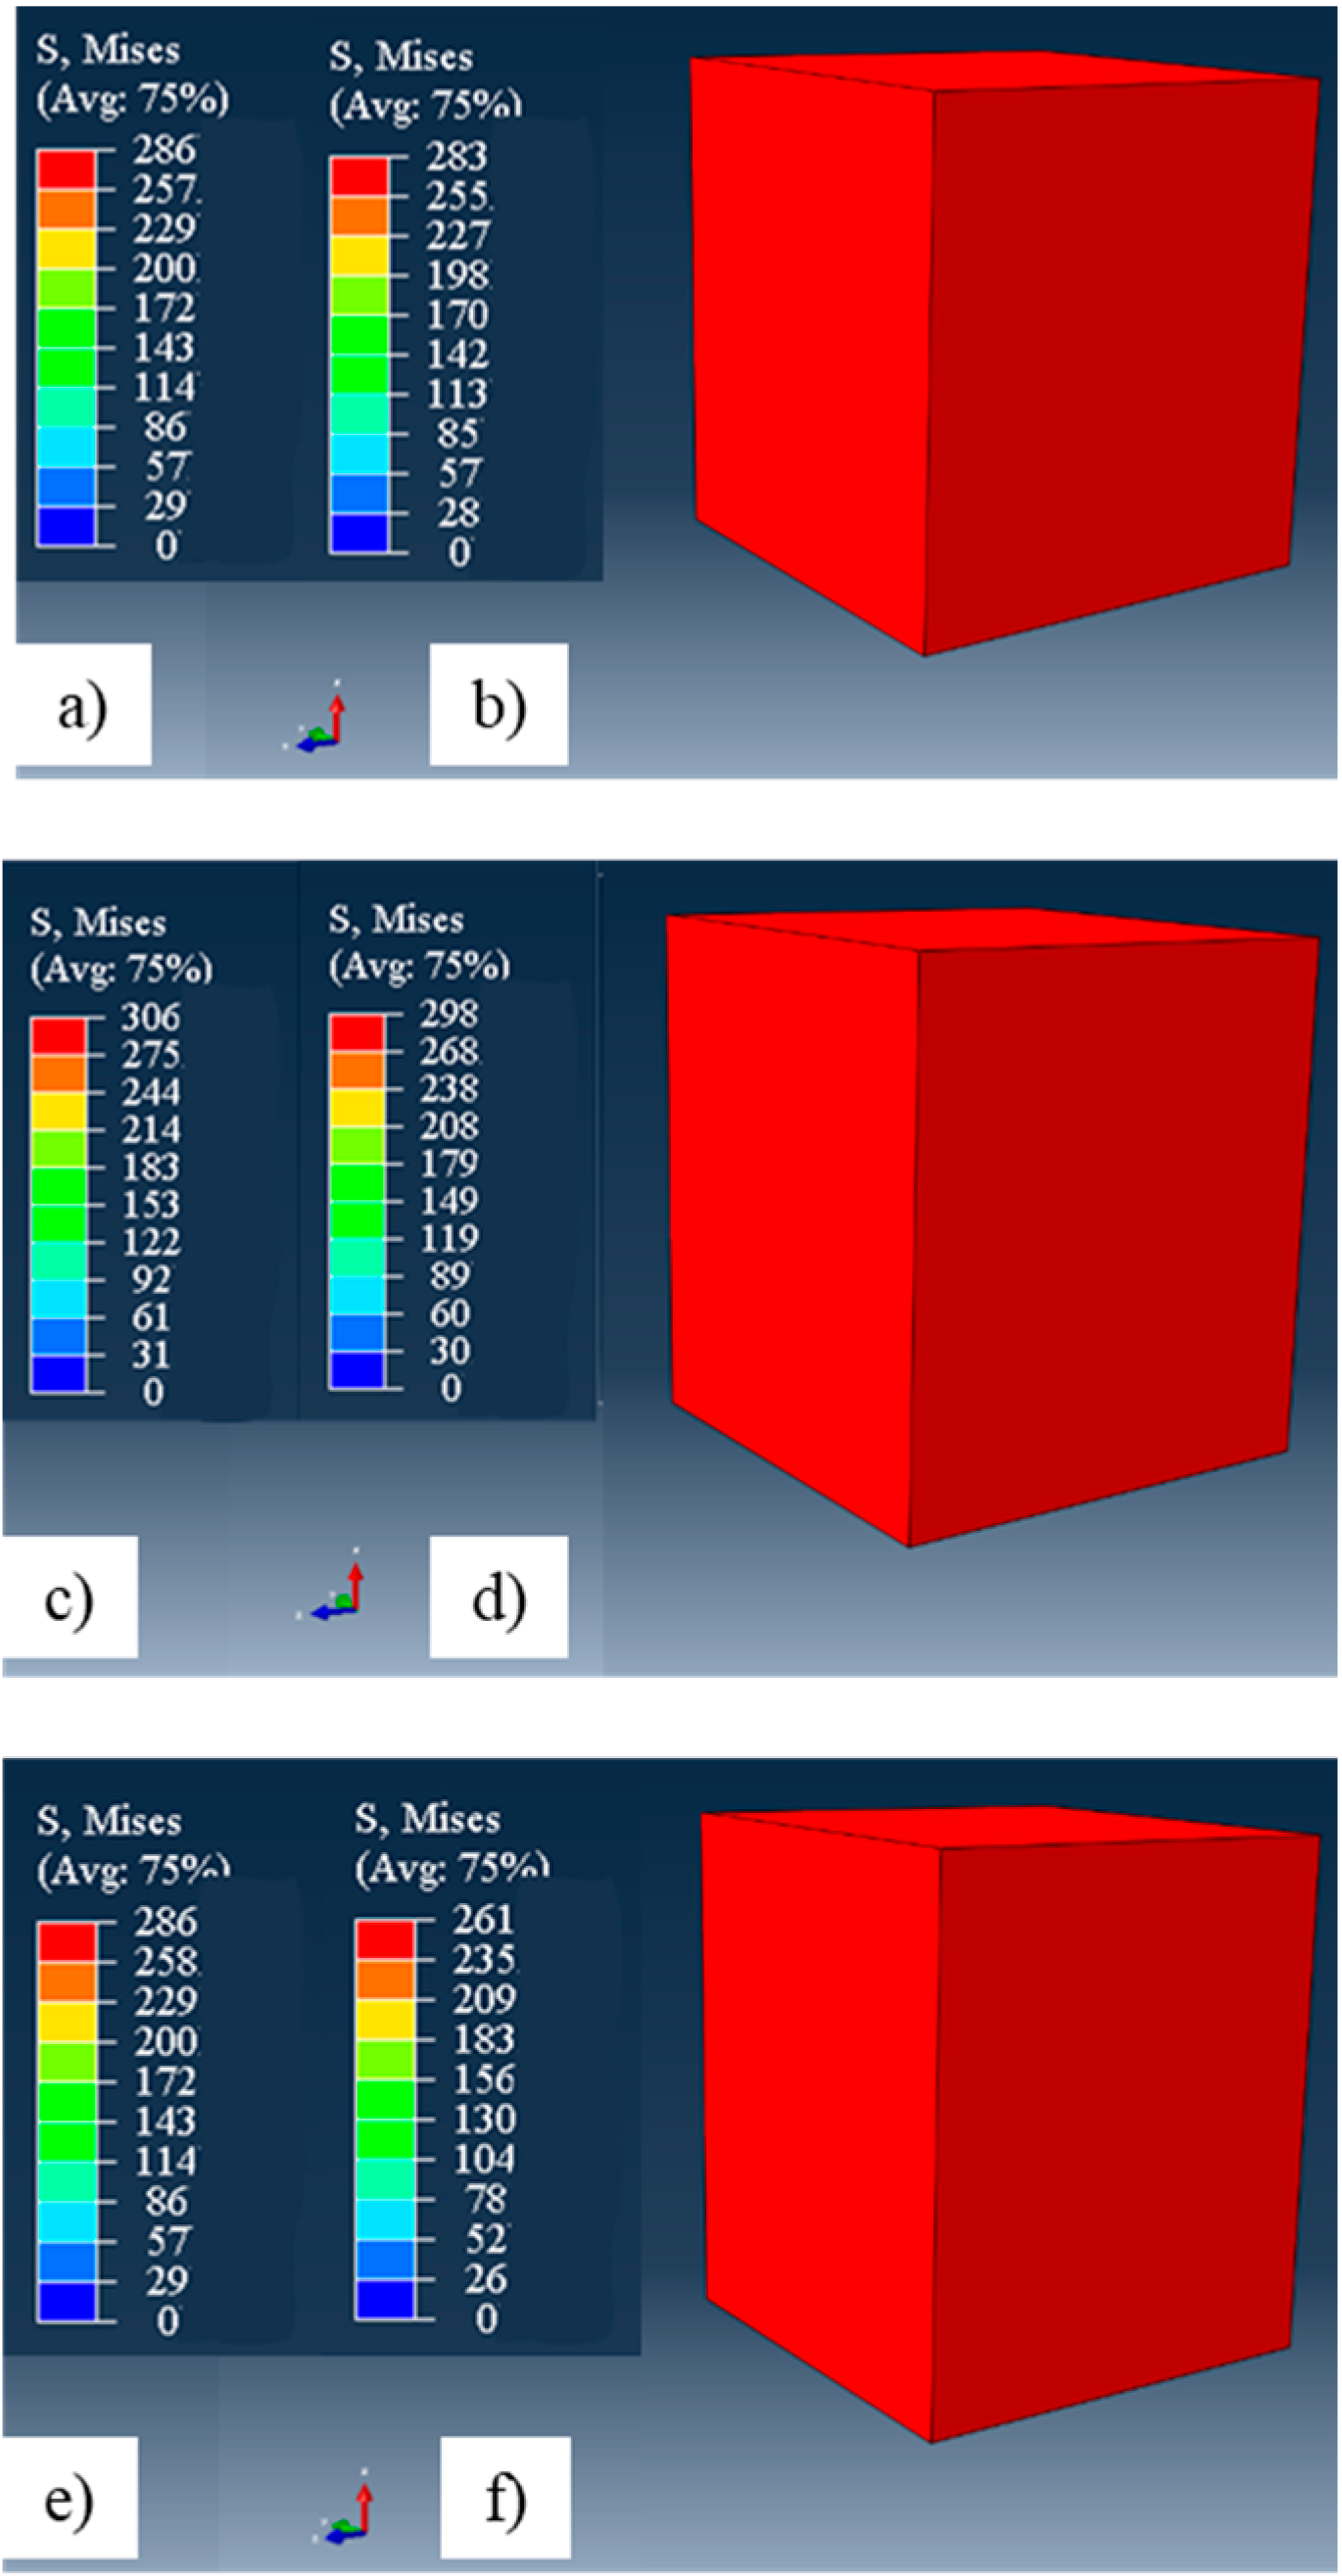
In Figure 16, the results of the one-element FE analysis are shown respectively for alloys A3.1, A3.2, and A3.3. The deformed state and maximum tensile stresses have been demonstrated. In each alloy set, results of low porosity have been visualized in Figure 16a,c,e and high porosity in Figure 16b,d,f. The calculated tensile strength for 1 mm/min stroke speed is given in Table 8.
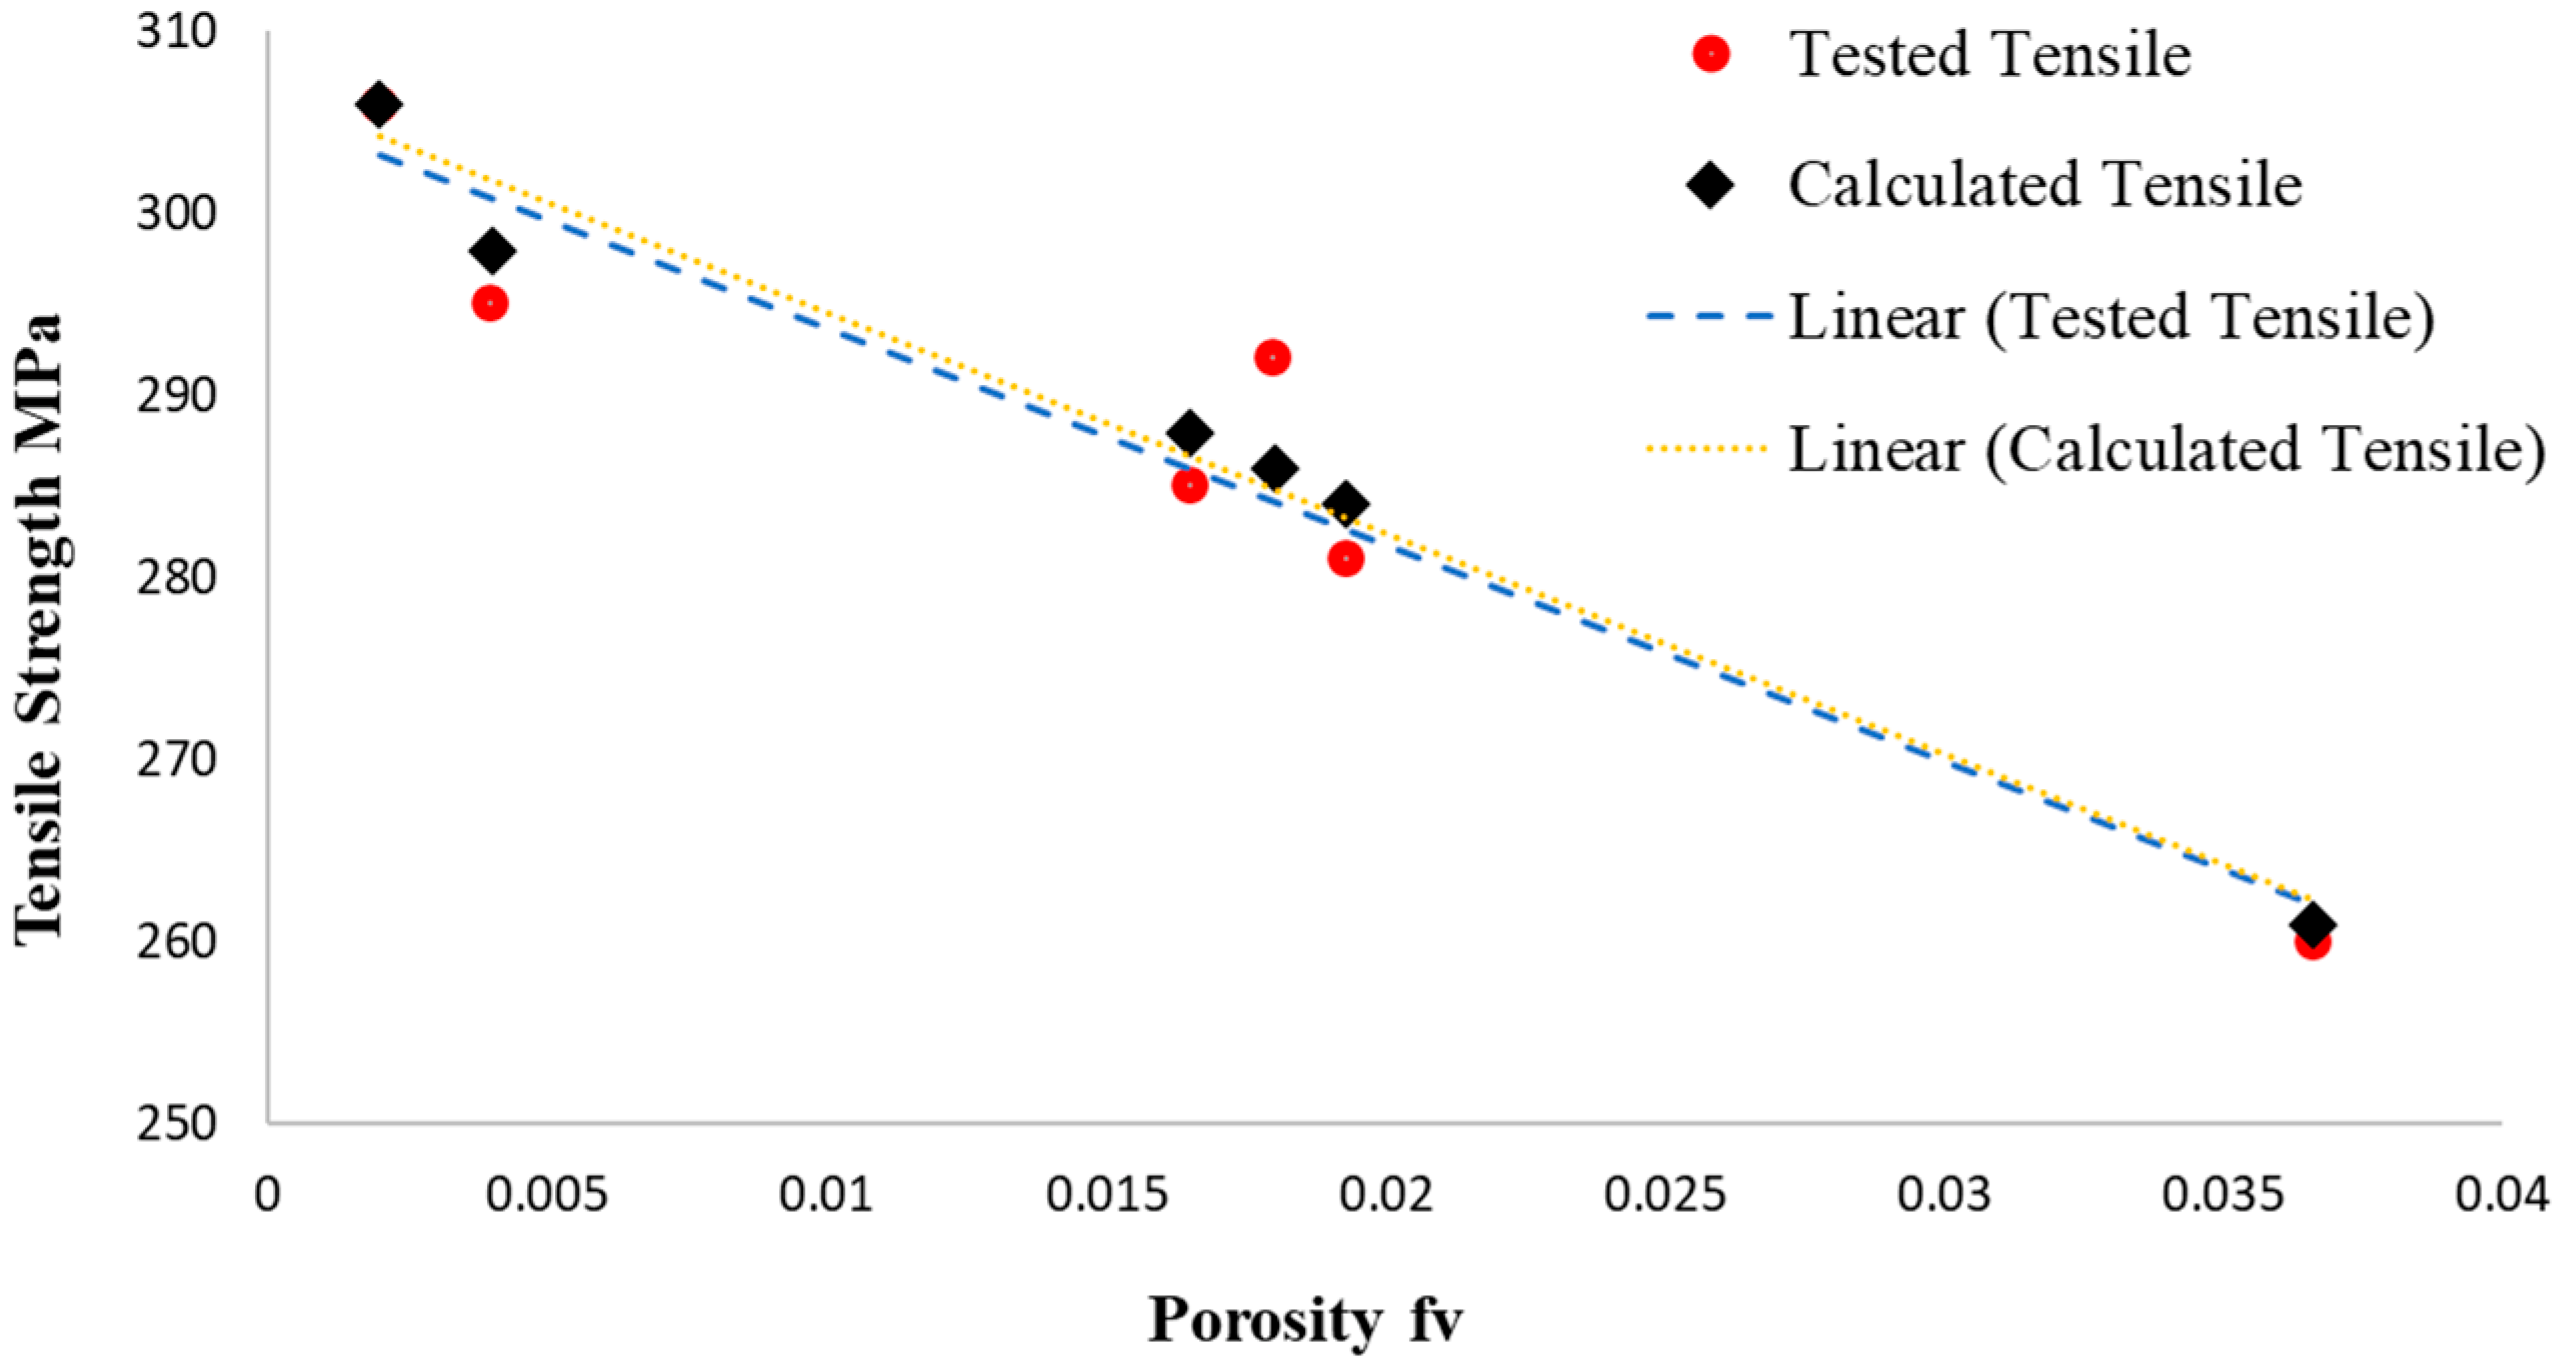
Figure 17 illustrates the evolution of tensile strength with the change in porosity level in the specimens. The evolution of porosity has yielded correlated results as expected. As the porosity decreases, calculated tensile strength from the Gurson model has given the highest tensile strength values.
The model has been implemented as rate-independent of the porosity effect on mechanical strength. Despite the fact that CT scans can detect variations in strength based on the porosity level of the alloys. The effect of porosity on high-speed tensile tests could not be captured in simulations. As before mentioned, 1 mm/min and 500 mm/min tests have not produced significant differences in tensile curves due to test conditions being stroke speed and low tensile test speeds.
4. Discussion
Defect within the structure in the 3D cartesian space of the specimens has been successfully computed via tomography scans. Both tomography metrics and reconstruction images have given adequate information about casting quality. Thus, this methodology support and complete the reduced pressure test method for alloy quality control [1].
Tensile tests at different stroke speeds have been performed for different alloys. Test results of alloy sets with different defect ratios which have shown varying tensile strength and elongations have shown a correlation with CT metrics [5].
The most important and effective CT metrics have been found as defect volume per representative volume element, total defect surface, biggest defect surface in the structure, and projected area of the defects [10]. Defect volume has proven to be more critical and more effective. CT reconstruction images of tensile test specimens have given accurate localization and positioning of the defects towards tensile test results and post-test pictures have validated CT scan methodology [6].
CT scans and metric computation requires careful selection of evaluation algorithms and software filters. In the present paper, a single set of industry-standard filters and algorithms has been used. Effect and variation due to different filters and algorithms must be assessed in a separate work [10,11].
In the phase of porous metal plasticity, validation of FE code has been conducted by correlation of tensile test data in stroke speed condition. Although there could be slight changes in behavior in strain-controlled tests, model validation between virtual calculations and test data by tensile strength and yield strength has proven adequate results. Material parameters have been identified for porous plasticity [5].
The Dvol of specimens per unit volume of 100 mm3 has been successfully adapted into Gurson Type Model as the “fv” initial porosity level. Results and correlation of different alloy sets with different defect metrics have shown correlated results in simulations with calculated initial porosity “fv” levels [10,12,18].
In oxide film, defect correlation of cooling rate is very important. As steel mold and sand mold results may affect the evaluation, in the present study sand mold specimens and sand mold samples have been considered in order to perform more apparent correlations. Steel mold evaluation would require another detailed analysis [1].
CT metrics for defect detection lower limit has been selected as 0.0025 mm3 for smallest defects. That size has been assumed to be sufficient for Sand Mold Casting [10].
Calculated and tested Tensile strengths have yielded similar values and the error percentage has not exceeded 2% of tensile strengths for 1 mm/min stroke speed conditions [5].
On the other hand, the rate-independent Gurson Model could not give a correlation at high stroke speed, between tensile strength and defect percentage. A model that incorporates defect sensitivity with strain rate has been required [10].
In the present study, detection limits of CT have been 15 um for spherical defects and 30 um for planar defects. Therefore, closed, or smaller bifilms would be invisible to CT scans and characterization. Theoretical strength calculation of the model with near-zero porosity yielded 320 MPa tensile strength at 10% elongation and 330 MPa tensile strength at 15% elongation. This shows the possible effects of undetected defects due to threshold.
The modeling approach in the present study has not considered defect localization or defect geometries. In future work, CT metrics elaboration for localization and defect geometry should be investigated.
5. Conclusions
Defect metrics of CT have been evaluated and demonstrated with precision for multiple alloys set over different compositions. Those metrics have been successfully correlated to tensile tests in terms of deformation and strength behavior.
Optimum probability criteria as p = 1 and p = 3 and size filter of minimum 0,0025 mm3 for detection of defects have been selected and applied. A minimum defect size detectable in the study has been set to 15 μm.
Tensile behavior and elongation failure has been calibrated based on porosity/defect volumes on the specimen geometry. The definition of reference material volume to correlate CT metrics with mechanical strength has been proposed. This representative volume concept can be defined as ARMY or CRMY for CT scans of cast materials and parts.
Stroke speed tests have yielded similar tensile curves.
Topography maps for tensile strength as a result of defect volume and defect surface as predictors of tensile behavior have been demonstrated successfully.
A Gurson-type plasticity code has been loaded into FE-Code ABAQUS and validated to model cast aluminum alloy behaviors in the presence of defects such as double oxide films with CT metric correlation. The fv initial porosity determination has been established between CT evaluations and numerical code with precision.
RPT tests and evaluations can be fortified by CT evaluations in a specimen or cast part quality. Gradewalk of alloy cleanliness and effective defects from RPT specimen level towards cast part would become viable with this methodology and ARMY.
The outcomes and the success of the study would enable, with further elaboration and investigation of CT metrics, to predict the exact failure location crack initiation spots and failure likeliness of a complex cast part. Future steps to predict the effect of defect metrics on fatigue life and creep life of metal alloys would be possible.
In order to capture the rate sensitivity effect of double oxide films, the standard Gurson model must be modified so that the porosity would affect more tensile properties at high strain rates or high tensile testing speeds.
As a continuation of the present study, the authors aim to dive into the localization or concentration of defects within the structure and their impact on strength and deformation. For this purpose, improved UMAT would be created to provide more detailed results in deformation plasticity. On the other hand, a revised constitutive model of defect size effect formulation similar to Beremin or J integral methods are expected to be incorporated into the continuum modeling. This methodology approach would be key to predicting critical localized defect size determination, especially at high strain rates and high-temperature deformation conditions.
Moreover, the effect of germination and coalescence of defects during tests is planned to be studied by the authors with the correlation of improved modeling approach taking into account the defect sizes.
Author Contributions
Conceptualization: O.A., E.S.K. and E.B.; Methodology, O.A. and A.G.; Software, A.G.; Validation, O.A.; Formal analysis, O.A., E.S.K., E.B. and A.G.; Investigation, A.G., O.A., E.S.K., E.B. and A.G.; Resources, O.A., E.S.K. and E.B.; Data curation, O.A., E.S.K. and E.B.; Writing, A.G.; Writing, review and editing, O.A., E.S.K. and E.B.; Visualization, O.A., E.S.K. and E.B.; Supervision O.A., E.S.K. and E.B.; Project administration, O.A., E.S.K. and E.B. All authors have read and agreed to the published version of the manuscript.
Funding
This research received no external funding.
Data Availability Statement
No new data were created, or where data is unavailable due to privacy or ethical restrictions (RENAULT confidential data).
Acknowledgments
Authors acknowledge the support of TUBITAK BIDEB for granting 2211-/A national fellowship program for Studies. Derya Dispinar is highly acknowledged for his support in the alloy manufacturing phase. Research assistant Kerem Can Dizdar in Istanbul Technical University is highly acknowledged for his contribution in casting experiments.
Conflicts of Interest
The authors declare no conflict of interest.
Abbreviation
| AlMg7Cu1.2 | Aluminum alloy with 7% Magnesium and 1.2% Copper |
| Yield Function | |
| σy | Yield Strength |
| A1–A2–A3 | Alloy Composition Sets Nb/Ti-V/Ti-V-Nb alloyed |
| A3.1 s1 | Alloy Set 3.1 and specimen no 1 |
| BC | Boundary Condition |
| BFI | bifilm index |
| CM | continuum mechanics |
| CT | computed tomography |
| DOF | metal bifilms—double oxide films |
| DSmax), | Biggest singular defect’s surface |
| DSurf | Total Defect surface |
| DVol | Defect volume |
| FEA | Finite Element Analysis |
| FEA | finite element analysis |
| fv | void volume fraction |
| g1 and g2 | porosity functions |
| kVolt | Kilo Voltage |
| m | strain hardening exponent |
| mA | Mili Amper |
| Nb | Niobium |
| Pxz − Pxy | Projected area of the biggest defect as on cartesian plane |
| R | isotropic hardening variable |
| RPT | reduced pressure test |
| RVE | Representative Volume Element |
| Ti | Titanium |
| UMAT | User material Subroutine |
| V | Vanadium |
| X | kinematic hardening variable |
| XRF | Xray Fluorescent Analysis |
| γ | Plastic flow multiplier |
References
- Campbell, J. Complete Casting Handbook: Metal Casting Processes, Metallurgy, Techniques and Design; Butterworth-Heinemann: Oxford, UK, 2015. [Google Scholar]
- Campbell, J. Entrainment defects. Mater. Sci. Technol. 2006, 22, 127–145. [Google Scholar] [CrossRef]
- Campbell, J. Stop pouring, start casting. Int. J. Met. 2012, 6, 7–18. [Google Scholar] [CrossRef]
- Mi, J.; Harding, R.A.; Campbell, J. Effects of the entrained surface film on the reliability of castings. Metall. Mater. Trans. A 2004, 35, 2893–2902. [Google Scholar] [CrossRef]
- Lee, C.D. Variability in the impact properties of A356 aluminum alloy on microporosity variation. Mater. Sci. Eng. A 2013, 565, 187–195. [Google Scholar] [CrossRef]
- Dispinar, D.; Campbell, J. Reduced pressure test (RPT) for bifilm assessment. In Proceedings of the Shape Casting: 5th International Symposium 2014, London, UK, 5–9 May 2014; pp. 243–251. [Google Scholar]
- Dispinar, D.; Campbell, J. Critical assessment of reduced pressure test. Part 1: Porosity phenomena. Int. J. Cast Met. Res. 2004, 17, 280–286. [Google Scholar] [CrossRef]
- Dispinar, D.; Campbell, J. Critical assessment of reduced pressure test. Part 2: Quantification. Int. J. Cast Met. Res. 2004, 17, 287–294. [Google Scholar] [CrossRef]
- Dispinar, D.; Campbell, J. Use of bifilm index as an assessment of liquid metal quality. Int. J. Cast Met. Res. 2006, 19, 5–17. [Google Scholar] [CrossRef]
- Carmignato, S.; Dewulf, W.; Leach, R. (Eds.) Industrial X-ray Computed Tomography; Springer International Publishing: Berlin/Heidelberg, Germany, 2018. [Google Scholar]
- Fuchs, P.; Kröger, T.; Garbe, C.S. Defect detection in CT scans of cast aluminum parts: A machine vision perspective. Neurocomputing 2021, 453, 85–96. [Google Scholar] [CrossRef]
- Gyarmati, G.; Fegyverneki, G.; Mende, T.; Tokár, M. Characterization of the double oxide film content of liquid aluminum alloys by computed tomography. Mater. Charact. 2019, 157, 109925. [Google Scholar] [CrossRef]
- Forest, S. Mécanique des Milieux Continus. Volume 1: Theorie Ecole des Mines de Paris. 2009–2010. Available online: http://mms2.ensmp.fr/mmc_paris/poly/MMC.pdf (accessed on 4 April 2023).
- Besson, J.; Cailletaud, G.; Chaboche, J.L.; Forest, S. Non-Linear Mechanics of Materials; Springer Science & Business Media: Berlin/Heidelberg, Germany, 2009; Volume 167, p. 433. [Google Scholar]
- McClintock, F.A. A Criterion for Ductile Fracture by the Growth of Holes. J. Appl. Mech. 1968, 35, 363–371. [Google Scholar] [CrossRef]
- Rousselier, G. Ductile fracture models and their potential in local approach of fracture. Nucl. Eng. Des. 1987, 105, 97–111. [Google Scholar] [CrossRef]
- Lemaitre, J. A Continuous Damage Mechanics Model for Ductile Fracture. J. Eng. Mater. Technol. 1985, 107, 83–89. [Google Scholar] [CrossRef]
- Gurson, A.L. Continuum Theory of Ductile Rupture by Void Nucleation and Growth: Part I—Yield Criteria and Flow Rules for Porous Ductile Media. J. Eng. Mater. Technol. 1977, 99, 2–15. [Google Scholar] [CrossRef]
- Görzen, D.; Ostermayer, P.; Lehner, P.; Blinn, B.; Eifler, D.; Beck, T. A New Approach to Estimate the Fatigue Limit of Steels Based on Conventional and Cyclic Indentation Testing. Metals 2022, 12, 1066. [Google Scholar] [CrossRef]
- Qian, G.; Lei, W.S.; Tong, Z.; Yu, Z. A Statistical Model of Cleavage Fracture Toughness of Ferritic Steel DIN 22NiMoCr37 at Different Temperatures. Materials 2019, 12, 982. [Google Scholar] [CrossRef] [PubMed] [Green Version]
- Monchiet, V.; Bonnet, G. A Gurson-type model accounting for void size effects. Int. J. Solids Struct. 2013, 50, 320–327. [Google Scholar] [CrossRef]
- Niordson, C.F.; Tvergaard, V. A homogenized model for size-effects in porous metals. J. Mech. Phys. Solids 2019, 123, 222–233. [Google Scholar] [CrossRef]
- Dæhli LE, B.; Børvik, T.; Hopperstad, O.S. Influence of loading path on ductile fracture of tensile specimens made from aluminium alloys. Int. J. Solids Struct. 2016, 88-89, 17–34. [Google Scholar] [CrossRef]
- Wong, W.H.; Guo, T.F. On the energetics of tensile and shear void coalescences. J. Mech. Phys. Solids 2015, 82, 259–286. [Google Scholar] [CrossRef]
- Boåsen, M.; Dahlberg, C.F.; Efsing, P.; Faleskog, J. A weakest link model for multiple mechanism brittle fracture—Model development and application. J. Mech. Phys. Solids 2021, 147, 104224, ISSN 0022-5096. [Google Scholar] [CrossRef]
Figure 1.
Study Flow Chart as (a) Production (b) Testing (c) Virtual Validation.

Figure 2.
(a) Pouring Method and (b) 3D Mold Design/Fabricated Specimen Set.

Figure 3.
ASMT E8 Small Tensile Test Specimen Dimensions.

Figure 4.
Plasticity and Porous Plasticity FE Modeling Scheme.

Figure 5.
PRVE and BC Schematics.

Figure 6.
CT Scan of RPT specimens Level of Cleaning by Degassing Method.

Figure 7.
CT Reconstruction of Defect Volumes of AlMgCu Alloys (a) A3.1 (b) A3.2 (c) A3.3.

Figure 8.
Tensile Test Results in 1 mm-min stroke speed of AlMgCu Alloyed (a) A1 alloy Set (Nb) (b) A2 alloy Set (Ti–V) (c) A3 alloy Set (Ti–V–Nb).
Figure 8.
Tensile Test Results in 1 mm-min stroke speed of AlMgCu Alloyed (a) A1 alloy Set (Nb) (b) A2 alloy Set (Ti–V) (c) A3 alloy Set (Ti–V–Nb).


Figure 9.
500 mm-min Stroke Speed Tensile Test Results (a) A3.1 set (b) A3.3 set.

Figure 10.
Comparison of Tensile Results at Different Stroke Speeds (a) A3.1 specimens (b) A3.3 specimens.
Figure 10.
Comparison of Tensile Results at Different Stroke Speeds (a) A3.1 specimens (b) A3.3 specimens.

Figure 11.
(a) CT reconstruction images of the tested specimens; (b) Tensile Post test crack pictures.
Figure 11.
(a) CT reconstruction images of the tested specimens; (b) Tensile Post test crack pictures.


Figure 12.
Contour Maps DSurf–DVol–Tensile Strength: (a) 1 mm-min and (b) 500 mm-min.

Figure 13.
Model Calibration by Tensile Value (a) set A3.1 (b) set A3.3.

Figure 14.
Gurson Model Simulation Results of A3 Sets with Different fv Porosity Levels: (a) A3.1; (b) A3.2; (c) A3.3.
Figure 14.
Gurson Model Simulation Results of A3 Sets with Different fv Porosity Levels: (a) A3.1; (b) A3.2; (c) A3.3.

Figure 15.
RVE Simulation Results After Elongation Correction According to Test Results of A3 set Specimens: (a) A3.1; (b) A3.2; (c) A3.3.
Figure 15.
RVE Simulation Results After Elongation Correction According to Test Results of A3 set Specimens: (a) A3.1; (b) A3.2; (c) A3.3.

Figure 16.
FE Results of the Alloy Set A3.1: (a) fv = 0.0165, (b) fv = 0.0193, A3.2: (c) fv = 0.002, (d) fv = 0.004, and A3.3: (e) fv= 0.018, (f) fv = 0.0366.
Figure 16.
FE Results of the Alloy Set A3.1: (a) fv = 0.0165, (b) fv = 0.0193, A3.2: (c) fv = 0.002, (d) fv = 0.004, and A3.3: (e) fv= 0.018, (f) fv = 0.0366.

Figure 17.
Calculated Tensile Strength vs. Calculated Porosity Parameter for 1 mm/min Stroke Speed Tests.
Figure 17.
Calculated Tensile Strength vs. Calculated Porosity Parameter for 1 mm/min Stroke Speed Tests.


Table 1.
Alloy production Experiment Parameters.
| Materials and Processing | A1 | A2 | A3 |
|---|---|---|---|
| Alloying% | AlMg7Cu1.2–Nb 0.05% | AlMg7Cu1.2–Ti 0.05%–V 0.05% | AlMg7Cu1.2–Set 1/Set 2: Ti 0.05%–V 0.05%–Nb 0.05% Set 3: Ti 0.05%–V 0.05%–Nb 0.12% |
| Casting Temperature Hold Time Furnace/Crucible | 745 °C 20 min Lance Degassing—N2—5 mL/min Flux Not Applied | Induction Furnace 26 KWh A50 Mammoth Wetro SiC Crucible (Diameter 450 mm) Boron Nitride Refractory Paint Applied to Crucible Inlet Walls | |
| Process Specification Heat Treatment | Tilt Pouring of 45 degrees applied Distance to Mold Inlet Channel—75 mm Sand Casting: Diameter 8.5 mm Multi-branch Mold: 10 specimens | Solution Treatment: 430 °C—5 h—Resistance Furnace Ageing Treatment: 200 °C—5 h —Radiating Dry Oven | |
Table 2.
Defect Evaluation Settings.
| Defect Control | Settings | |
|---|---|---|
| CT scan | Acceleration Voltage | 170 kVolt |
| Tube Current | 8 mA | |
| Total Picture per 360° | 2400 slices | |
| Defect detection size filter 0.002 mm3 minimum and 75 mm3 maximum | ||
| Defect Metrics | Defect Volume: DVol (mm3) | |
| Defect Surface: DSurf (mm2) | ||
| Ratio of Defects (%) | ||
| Maximal Singular Defect Volume and Surface: DSmax | ||
Table 3.
Comparison of RPT specimen CT metrics.
| Defect Identification | Non Degassed | Degassed | ||
|---|---|---|---|---|
| Steel RPT | Sand RPT | Steel RPT | Sand RPT | |
| DefVol mm3 | 2033 | 4978 | 39 | 54 |
| DefSurf mm2 | 19.382 | 43.404 | 568 | 745 |
| Defect Number | 3247 | 4560 | 112 | 98 |
Table 4.
Tomography Defect Metrics A3 alloys.
| Specimen sets | Specimen N° | DVol mm3 | DSurf mm2 | DSmax mm2 | Pxz of DSmax mm2 | Pxy of DSmax mm2 |
|---|---|---|---|---|---|---|
| A3.1 | s7 | 1.65 | 27 | 15 | 2.05 | 2.12 |
| A3.1 | s8 | 1.93 | 27 | 15 | 2.43 | 2.02 |
| A3.2 | s11 | 0.8 | 10 | 8 | 0.75 | 0.72 |
| A3.2 | s10 | 1.55 | 22 | 12.5 | 1.8 | 1.78 |
| A3.3 | s12 | 3.66 | 52 | 27 | 2.43 | 1.99 |
| A3.3 | s13 | 2 | 30 | 17 | 2.82 | 3.02 |
| A3.3 | s14 | 2.87 | 31 | 17.3 | 2.56 | 2.67 |
Table 5.
Alloy Compositions A1 and A2.
| Specimen Sets | Al% | Cu% | Mg% | Mn% | Fe% | Ti% | V% | Nb% |
|---|---|---|---|---|---|---|---|---|
| A1 | 91.31 | 1.12 | 7.3 | 0.06 | 0.11 | 0.00 | 0.00 | 0.05 |
| A2 | 90.96 | 1.07 | 7.55 | 0.09 | 0.125 | 0.05 | 0.04 | 0.00 |
| A3.1 | 91.06 | 1.09 | 7.43 | 0.09 | 0.12 | 0.05 | 0.03 | 0.05 |
| A3.2 | 90.74 | 1.10 | 7.66 | 0.09 | 0.12 | 0.05 | 0.03 | 0.05 |
| A3.3 | 91.26 | 1.05 | 7.20 | 0.09 | 0.12 | 0.05 | 0.03 | 0.125 |
Table 6.
Tensile Test Results of Alloy Sets.
| Test Speed | Specimen Set | Yield Strength MPa | Tensile Strength MPa | Stroke Elongation % | |
|---|---|---|---|---|---|
| 1 mm/min | A1 | s1 | 173 | 238 | 3.88 |
| s2 | 147 | 146 | 2.61 | ||
| s3 | 171 | 246 | 2.72 | ||
| A2 | s4 | 171 | 240 | 4.12 | |
| s5 | 154 | 165 | 0.36 | ||
| s6 | 168 | 206 | 0.67 | ||
| A3.1 | s7 | 178 | 285 | 5.18 | |
| s8 | 185 | 281 | 5.6 | ||
| A3.2 | s11 | 181 | 306 | 8.33 | |
| s10 | 178 | 295 | 8.19 | ||
| A3.3 | s12 | 172 | 260 | 3.01 | |
| s13 | 174 | 292 | 5.70 | ||
| 500 mm/min | A1 | s14 | Test failed abruptly due to high defect content | ||
| A2 | s15 | Test failed abruptly due to high defect content | |||
| A3.1 | s16 | 171 | 292 | 8.1 | |
| s17 | 175 | 306 | 7.3 | ||
| s18 | 166 | 265 | 6.0 | ||
| s19 | 165 | 247 | 4.3 | ||
| A3.3 | s20 | 155 | 203 | 0.5 | |
| s21 | 170 | 301 | 5.9 | ||
Table 7.
Tomography Defect Metrics A3 alloy Set and Porosity Calculation.
| Specimen Sets | Specimen N° | DVol | DSurf | fv = Dvol/100 mm3 |
|---|---|---|---|---|
| A3.1 | s7 | 1.65 | 27 | 0.0165 |
| A3.1 | s8 | 1.93 | 27 | 0.0193 |
| A3.1 | s9 | 1.8 | 31 | 0.018 |
| A3.2 | s10 | 1.5 | ~22 | 0.015 |
| A3.2 | s11 | 0.4 | ~8 | 0.004 |
| A3.3 | s14 | 2.87 | 31 | 0.0287 |
| A3.3 | s13 | 1.75 | 30 | 0.0175 |
| A3.3 | s12 | 3.66 | 52 | 0.0366 |
Table 8.
Tomography Defect Metrics A3.1 Alloy Set and Porosity Calculation.
| Test Results | m | Porosity | Yield Strength | fv = Dvol/100 mm3 |
|---|---|---|---|---|
| Model | 0.094 | fv = Dvol/100 mm3 | 181 MPa | 0.0165 |
Table 9.
Comparison of Calculated and Tested Tensile Test Values in 1 mm/min Stroke Speed.
| Alloy | fv | Tested Tensile | Calculated Tensile | %Error |
|---|---|---|---|---|
| s7 | 0.0165 | 285 | 286 | 1.05 |
| s8 | 0.0193 | 281 | 283 | 1.06 |
| s11 | 0.004 | 306 | 303 | 0.01 |
| s10 | 0.015 | 295 | 293 | 0.01 |
| s13 | 0.018 | 292 | 286 | 2.1 |
| s12 | 0.0366 | 260 | 261 | 0.3 |
Disclaimer/Publisher’s Note: The statements, opinions and data contained in all publications are solely those of the individual author(s) and contributor(s) and not of MDPI and/or the editor(s). MDPI and/or the editor(s) disclaim responsibility for any injury to people or property resulting from any ideas, methods, instructions or products referred to in the content. |
© 2023 by the authors. Licensee MDPI, Basel, Switzerland. This article is an open access article distributed under the terms and conditions of the Creative Commons Attribution (CC BY) license (https://creativecommons.org/licenses/by/4.0/).
Share and Cite
MDPI and ACS Style
Gul, A.; Aslan, O.; Kayali, E.S.; Bayraktar, E. Assessing Cast Aluminum Alloys with Computed Tomography Defect Metrics: A Gurson Porous Plasticity Approach. Metals 2023, 13, 752. https://doi.org/10.3390/met13040752
AMA Style
Gul A, Aslan O, Kayali ES, Bayraktar E. Assessing Cast Aluminum Alloys with Computed Tomography Defect Metrics: A Gurson Porous Plasticity Approach. Metals. 2023; 13(4):752. https://doi.org/10.3390/met13040752
Chicago/Turabian StyleGul, Armağan, Ozgur Aslan, Eyüp Sabri Kayali, and Emin Bayraktar. 2023. "Assessing Cast Aluminum Alloys with Computed Tomography Defect Metrics: A Gurson Porous Plasticity Approach" Metals 13, no. 4: 752. https://doi.org/10.3390/met13040752
Note that from the first issue of 2016, this journal uses article numbers instead of page numbers. See further details here.