
Optimization of Response Surface Methodology for Pulsed Laser Welding of 316L Stainless Steel to Polylactic Acid

1
Guangdong Provincial Welding Engineering Technology Research Center, Guangdong University of Technology, Guangzhou 510006, China
2
Education Bridge Institute, Boston, MA 02119, USA
*
Author to whom correspondence should be addressed.
Metals 2023, 13(2), 214; https://doi.org/10.3390/met13020214
Submission received: 20 December 2022
/
Revised: 18 January 2023
/
Accepted: 19 January 2023
/
Published: 22 January 2023
(This article belongs to the Special Issue Laser Welding Technology)
Abstract
:A laser welding technology for the dissimilar materials 316L stainless steel (316L ss) and polylactic acid (PLA) was investigated to analyze the process parameters, which have a large influence on the joint quality. Orthogonal tests, single-factor tests, response surface method (RSM), and Box–Behnken design (BBD) were utilized to optimize the experimental design. A metallographic microscopy analysis was conducted to classify the joint morphology into two categories: effective and ineffective. The effective area ratio was established as an effective judgment method for the joint mechanical properties. Mathematical relations between the process parameters and the mechanical properties of the joints were investigated and the process parameters were optimized and validated. The test values were in excellent agreement with the actual values, thus demonstrating the reliability of the proposed model.
1. Introduction
Research on composite materials that combine the strength and stiffness of metals with the advantages of the light weight, low cost, and easy processing of plastics is a hotspot in current material research [1,2,3]. Such composite materials have a range of applications in daily digital products, household appliances, automobiles, the aerospace industry, and even military industries [4,5,6]. However, medical composite materials are relatively under-studied and have a vast potential for exploration. In the biomedical field, metal–polymer composites are used in bone formation, dental materials, polymer heart valves, hard-tissue substitutes, prosthetic sockets, and medical devices [7,8].
Medical stainless steel is renowned for its great biocompatibility, mechanical properties, humoral corrosion resistance, excellent processing and molding properties, and low cost. Of all steel types, 316L stainless steel is the most widely used in clinical practice [9]. Nevertheless, it demonstrates poor biocompatibility and corrosion and wear resistance. It is also prone to stress shielding, which can cause implant failure [10,11].
Polylactic acid (PLA) is also widely used in the medical field. Due to its good biocompatibility and degradability, PLA weakens continuously in the process of degradation and overcomes stress masking. Meanwhile, as one of the most commonly used materials for FDM 3D printing, it can customize a fixed structure according to different parts of bone defects [12]. During the in vivo degradation of polylactic acid, acid groups are produced, leading to tissue inflammation. Biodegradable metals provide an alkaline environment during the degradation process of electrochemical corrosion. Based on the principle of acid–base neutralization, the combination of these two materials can keep the pH value of the degraded environment neutral and form a more biocompatible composite material [13,14,15]. However, the applicability of PLA is still limited by its severe brittleness, low thermal deformation temperature, slow crystallization rate, and relatively high production cost [16]. As a result, the combination of 316L stainless steel for medical materials and polylactic acid can leverage each other. This would reduce costs and address biocompatibility and stress-shielding issues.
Mechanical joining, adhesive joining, injection joining, and welding are the main forms of metal and plastic composites. Mechanical joining is simple, low-cost, reliable, and can be visually inspected, but it is prone to loosening and poor sealing [17]. Adhesive joining is greatly affected by the environment and is prone to aging [18]. Laser welding is the preferred option due to fewer defects, the precise sealing of welds, a smooth and beautiful surface, high efficiency, convenience, flexibility, and strength [19]. The generation of welding defects is a complicated process related to the welding heat process [20,21,22,23].
Wahba M. et al. used a high-power semiconductor laser to connect AZ91D magnesium alloy to PET, producing joints stronger than PET [24]. Bergmann J. P. et al. studied the laser connection of PA6,6 and DC01 mild steel, finding that the key to forming strong connections was the change of surface activation energy through sandblasting and stamping surface treatments on metal surfaces [25]. Chen Y. J. et al. proposed an ultrasonic, vibration-laser connection technique to join polyethylene terephthalate with titanium, increasing joint strength by more than four times over conventional, laser-assisted direct connection processes (LAMP) [4]. Lambiase F. et al. analyzed the variation rule of the temperature field of the laser-assisted direct connection of 304 stainless steel and polycarbonate (PC), establishing a finite element (FE) model for temperature field analysis [26]. Wang F. et al. studied the direct laser connection of a carbon-fiber-reinforced thermoplastic composite (CFRTP) with an aluminum alloy with different surface morphologies, finding that the circular hole structure significantly improved joint strength [27]. In the biomedical field, Branquinho M.V. et al. implemented a polylactic acid coating on the surface of 316L stainless steel used in bone implants, displaying superior results in vitro and in vivo [28]. Chou P.Y. et al. have implemented the application of composite materials made of metal and polymer in artificial temporomandibular joint prostheses created through thermal processing methods [29].
Despite the success of LAMP in metals and plastics, there have been very few studies on the use of lasers to connect materials in the biomedical field. Attention is still needed to optimize process parameters, explore better joint morphologies, increase joint strength, and build mathematical models of the process parameters. This paper aims to optimize the process parameters of the joint between 316L stainless steel and polylactic acid, establish an effective judgment method of the mechanical properties of the joint–effective area ratio, and build a mathematical model of process parameters and joint mechanical properties. The validity of the model is verified, providing research significance and application value in the field of joining metal and plastic.
2. Materials, Equipment, and Methods
2.1. Materials
The test materials used were 316L stainless steel and PLA plates measuring 80 mm × 30 mm × 1 mm. The properties of these materials are shown in Table 1. Prior to testing, a 75% ethanol solution was used to remove any stains from the plates. To ensure the same surface roughness for each plate, the stainless steel surfaces were sanded with 400 Cw sandpaper.
2.2. Equipment
The experimental device is shown in Figure 1a. The equipment used for testing was the HWF40 fiber laser-welding system. The main performance parameters of the system are listed in Table 2. The specifics of the specialized fixture for the laser welding of the thin plates are shown in Figure 1b. To assemble a fixed block with the 316L stainless steel and PLA in order, the workpiece was clamped using spring elastic force. Materials were joined by laser heat conduction, with the laser beam directed towards the stainless steel. Heat was transferred to the PLA plate through thermal conduction. After welding, the current state was maintained for 6 h to allow for internal stress to be eliminated. The joint shear force was then measured using a universal tensile test machine, the clamp from which held the workpiece area at one-quarter of the back end of the plate, with the test machine running at a speed of 5 mm/min, as is shown in Figure 2. The joint morphology and fracture–failure morphology of the samples were obtained with a digital camera.
2.3. Methods
The laser power (P), pulse frequency (f), pulse–duty ratio (z), laser scanning speed (v), laser defocus distance (L), and clamping force (Fj) were adjustable process parameters, while the shielding gas flow rate, g, and pressure holding time, t, were kept constant (23 L/min and 1 min, respectively). Table 3 shows the range of levels for each parameter value. An orthogonal table of L25 (56) was designed to conduct an orthogonal test of six factors and five levels. To reduce the effect of random errors on the results, two tests were performed., The results were averaged, as is shown in Table 4. The evaluation index of joint quality was obtained using a universal tensile testing machine (Made in Dongguan, Guangdong, China) and was the average maximum shear force ().
Table 5 shows the range analysis of , , , , and (the average value of maximum shear force from the first to the fifth level) and Rw (the range of maximum shear force).
This analysis concluded that laser power, pulse–duty ratio, and laser scanning speed were the main influences. A single-factor test of six levels was then conducted to examine which of these had the most influence on the mechanical properties of the joint. The laser frequency, f, laser defocus distance, L, fixture clamping force, F, shielding gas flow, g, and pressure holding time, t, were kept constant at 12 Hz, 10 mm, 5 N, 23 L/min, and 1 min, respectively.
For the single-factor test of the laser power, the pulse–duty ratio was set at z = 50%, the laser scanning speed was set at v = 2 mm/s, and the laser power was chosen from 450 to 575 W, with an interval of 25 W. As is shown in Figure 3a, with the increase of laser power, the laser-heat-affected zone on the outer layer of the weld, on the metal side, gradually expanded, and the width of the welding line became uniform by degrees. The width of the weld and the burned area in the center of the plastic side gradually increased with the increasing laser power. According to scholar Y.J. Huang, burned areas do not form effective joints. The effective joining area of the joint is the total area of the joint minus the area of the burned area of the joint [17], and the effective joining area of the joint first increases and then decreases. As a result, the maximum shear force first increases and then decreases.
The laser power, P, was set at 550 W and the laser scanning speed, ν, was set at 2 mm/s in the single-factor test of the pulse–duty ratio. The pulse–duty ratio was chosen to range from 30 to 55%, with an interval of 5%. With the increase of the pulse–duty ratio, the laser-heat-affected zone (HAZ) of the outer layer of the weld on the metal side expanded significantly. When z = 30%, the weld did not appear center-white, indicating that PLA did not appear to recrystallize [30]. At z = 35%, recrystallization began to occur at the weld and the joint strength increased. Later, as the pulse –duty ratio increased, the burning region also appeared. When z > 50%, the burning was severe and the mechanical properties of the joint were reduced.
For the single-factor test of the laser scanning speed, the laser power, P, pulse–duty ratio, z, and laser scanning speed, v, were set at 550 W, 50%, and 2 to 4.5 mm/s, respectively, with an interval of 0.5 mm/s. A lower scanning speed of the laser results in a longer heating time per unit length of the laser and a higher input energy. The width of the metal side weld decreased with the increasing laser scanning speed. When v = 3 mm/s, the weld width and surface morphology of the plastic side were optimal and the joint strength was optimal, which decreased approximately linearly with the laser scan speed below or above 3 mm/s.
The design of the response surface test was the three-factor, three-level Box–Behnken design proposed in the references [31]. RSM-BBD has been applied to optimize process parameters in the industrial field with rich experience [32,33,34]. The experimental process parameters were determined as laser power, P, pulse–duty ratio, z, and laser scanning speed, v, and the range of parameters was based on the unit interval around the maximum shear force of each factor. Design-expert 13 was used to encode the parameters and design matrices. The response surface method was used to obtain the regression equation and the corresponding response graph. Table 6 shows the test parameters.
3. Results & Discussion
3.1. Analysis of Mechanical Properties, Morphology, and Fracture–Failure Forms of Joints
The coding parameters and design matrix generated from Table 6 were tested in the order of Run order. After the test, a tensile test was conducted after a cooling period of six hours, and the results are shown in Table 7.
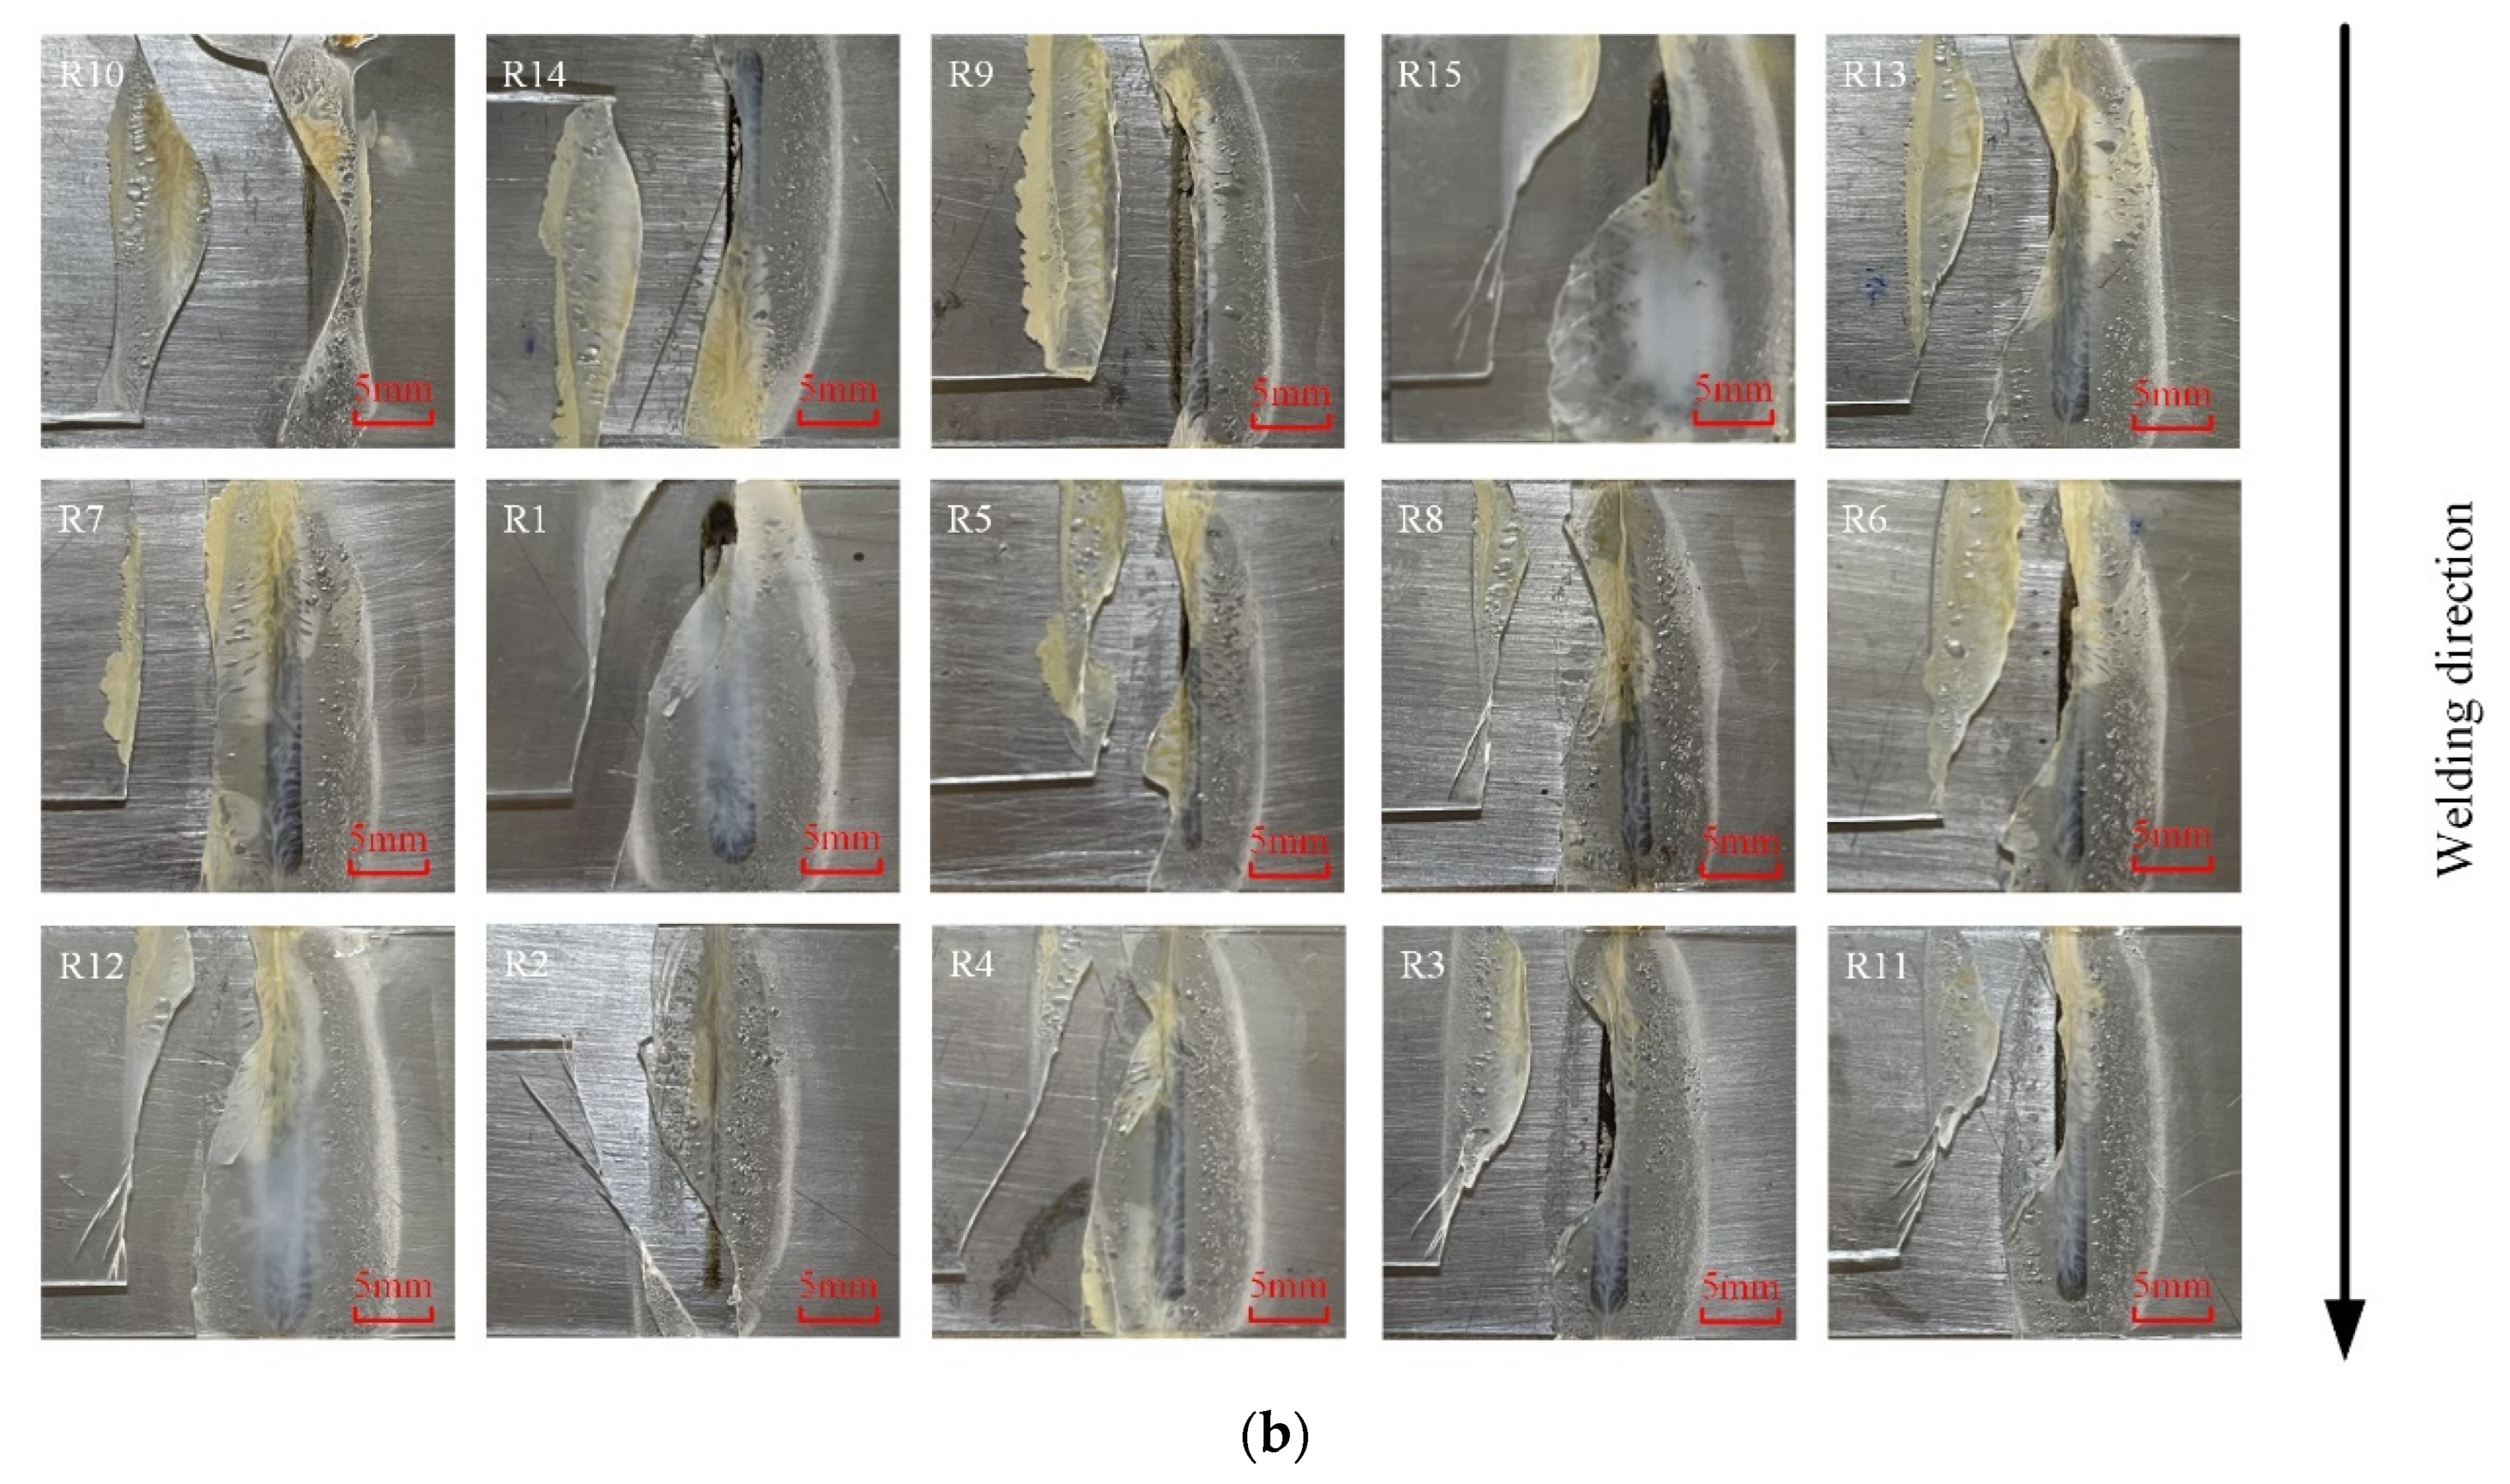
The morphologies of plastic side joints and fracture–failure morphologies were sorted according to the increasing maximum shear force of joints, as is shown in Figure 4a. The plastic side joint morphologies can be divided into five different regions based on their appearance: Yellowed region, Heat Affected Zone (HAZ) region, Center weld region (black), Center weld region (white), and Porosities region.
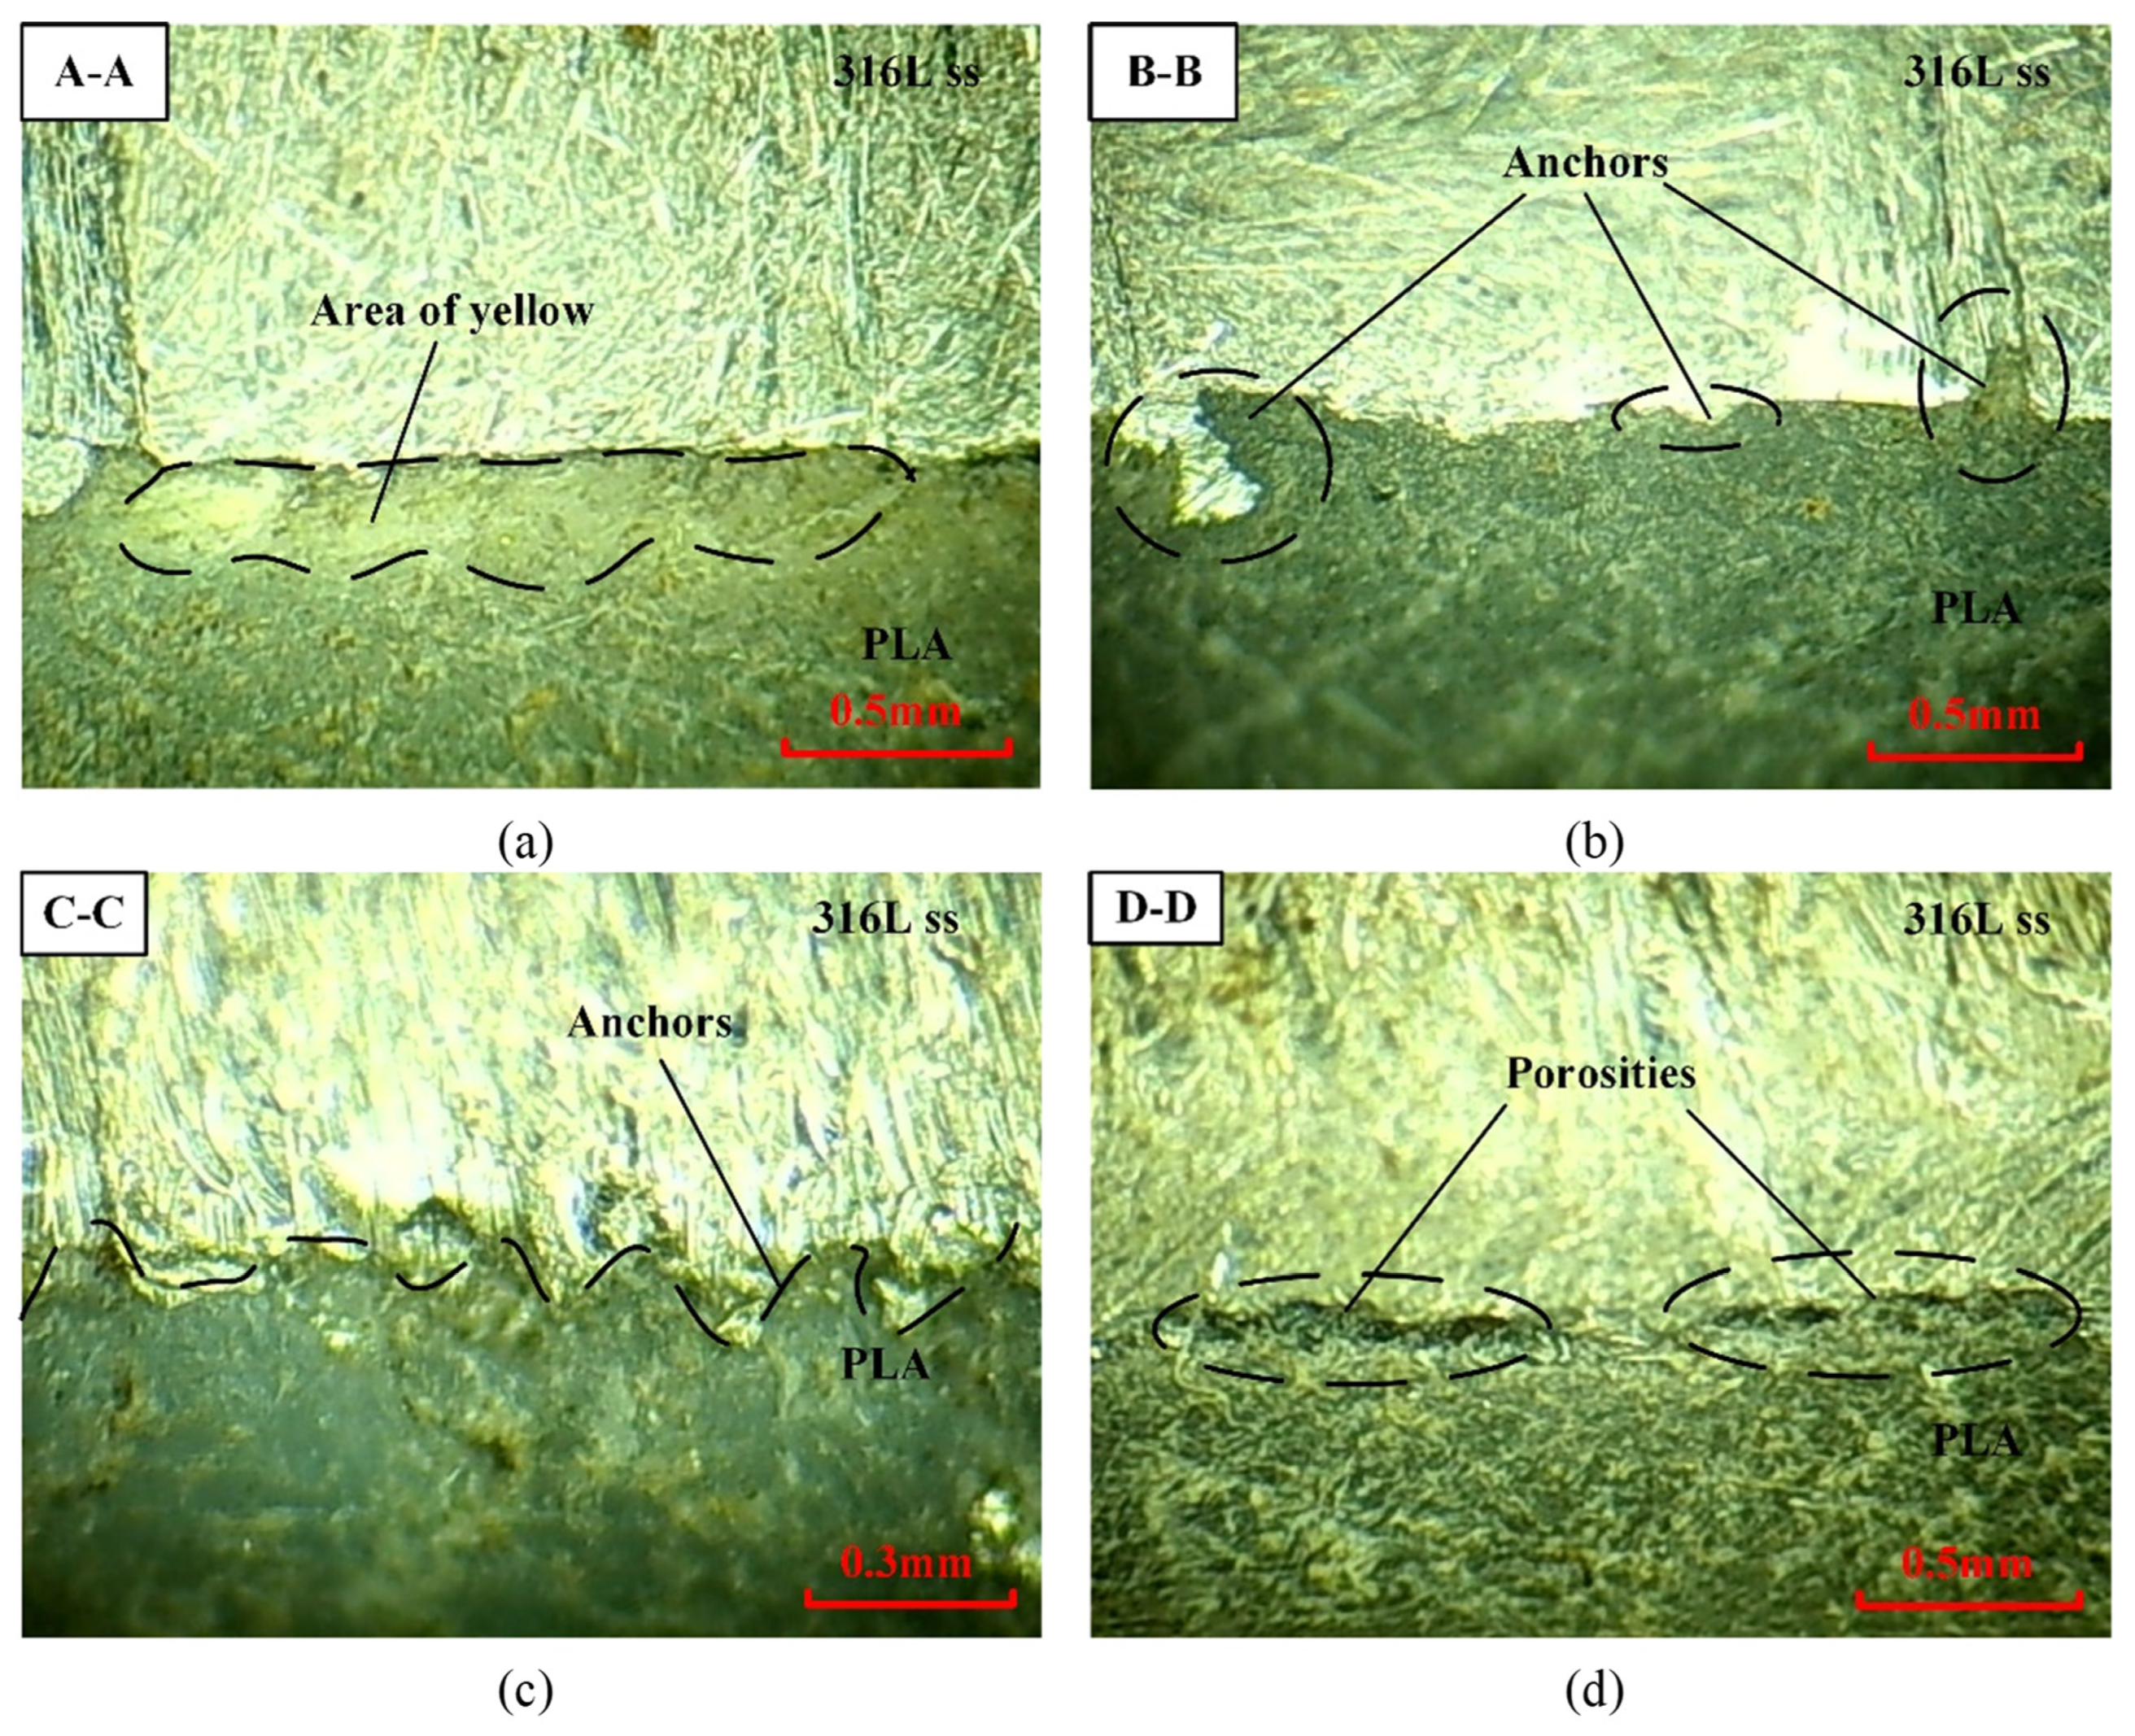
Laser-line energy density is a measure of single-line laser energy; it is directly proportional to the laser power and pulse–duty ratio, and inversely proportional to the laser scanning speed [35]. Yellowed regions are formed when the single-line laser energy is too large, causing the heated region to surpass the decomposition point. This is evidenced by the yellow area at the fracture site in Figure 4b. The mechanical properties of materials degrade after decomposition. The Center weld region (black), which is the black oxide layer of the joint, appears only when the laser energy density reaches the oxidation temperature of 316L stainless steel. When the laser energy is further increased on this basis, PLA will undergo recrystallization, causing a white recrystallization layer to appear in the weld center and cover the black oxide layer. This produces the Center weld region (white). As can be seen in Figure 4b, most of the fracture and failure areas of the joint are a Yellowed region, indicating that the laser energy was too high, causing the temperature of the heated area to exceed the decomposition temperature and thus decreasing the mechanical properties of the materials. In Figure 5a, it is clear that the Yellowed region is located at the joint of the 316L stainless steel and PLA, which results in the poor mechanical properties of the joint. Figure 5b,c indicate that there are anchors in the Center weld region, which can effectively increase the mechanical properties of joints. The difference is that the anchor points in the Center weld region (black) are scattered, whereas those in the Center weld region (white) are continuous. The porosities form due to the evaporation of water in the PLA and the degradation of the material by heat, which spills out with the molten PLA [36]. According to relevant studies [37,38], the pores in Figure 5d play a positive role in the mechanical properties of joints. Therefore, the Yellowed region is classified as the ineffective joint region, whereas the Center weld region (black), Center weld region (white), and the Porosities region are the effective joint regions. Consequently, the effective area ratio of joints can be used to measure the quality of joints.
where is the effective area ratio of joint, is the area of Center weld region (black), is the area of Center weld region (white), is the area of Porosities region, is the area of Yellowed region, and is the area of the HAZ region, which is the total area of the joint.
The X-axis labels in Figure 6 are sorted according to the Run Order, corresponding to the increasing of the maximum shear force. It can be seen that, with the increase of the maximum shear force, the changes of the HAZ, the Porosities region, and the Center weld region do not follow any specific rule, indicating that the influence on the mechanical properties of the weld stems from multiple aspects of the effective weld region and the ineffective weld region. With an increase in the effective area ratio of the joint, the maximum welding shear force increases, indicating that the effective area ratio of the joint is proportional to the mechanical properties of the joint, and the mechanical properties of the weld can be predicted by the effective area ratio of the joint.
3.2. Response Model Analysis
The analysis of the variance of the quadratic polynomial model of the maximum shear force (Table 8) indicates that the model is significant (p-value of 0.0156, p < 0.05). Additionally, the lack of goodness-of-fit is not significant (p > 0.05). According to the p < 0.05 of the laser power (A2), pulse–duty ratio (B2), and laser scanning speed (C2), it can be seen that these three factors have significant effects on the maximum shear force, with laser scanning speed having the highest influence, followed by pulse–duty ratio and then laser power.
To further eliminate the insignificant factors in the model, the backward elimination method was used to remove the interaction item AB with p > 0.1. Table 9 shows the ANOVA of the model after the elimination, with p = 0.0096. The p-value of the model is lower, and the model is more significant than before backward elimination. Table 10 also shows that the predicted R2 is closer to the adjusted R2, making the model more reliable with a significant increase in the predicted R2. The predicted R2 is used to measure the prediction quality of the model. This indicates an increase in the model’s ability to predict a new set of data. Adeq Precision (signal to noise ratio) was used to measure the model; a ratio greater than 4 is desirable, and the model achieved a ratio of 8.126, indicating an adequate signal.
The final mathematical model that can be used to predict maximum shear force of joints in the same design space after backward elimination is (final equation in terms of coded factors):
Maximum shear force = 1227.49 + 16.49A − 65.84B − 77.57C − 147.62AC + 162.86BC − 235.23A2 − 294.97B2 − 396.43C2
3.3. Influence of Process Parameters on Response Model
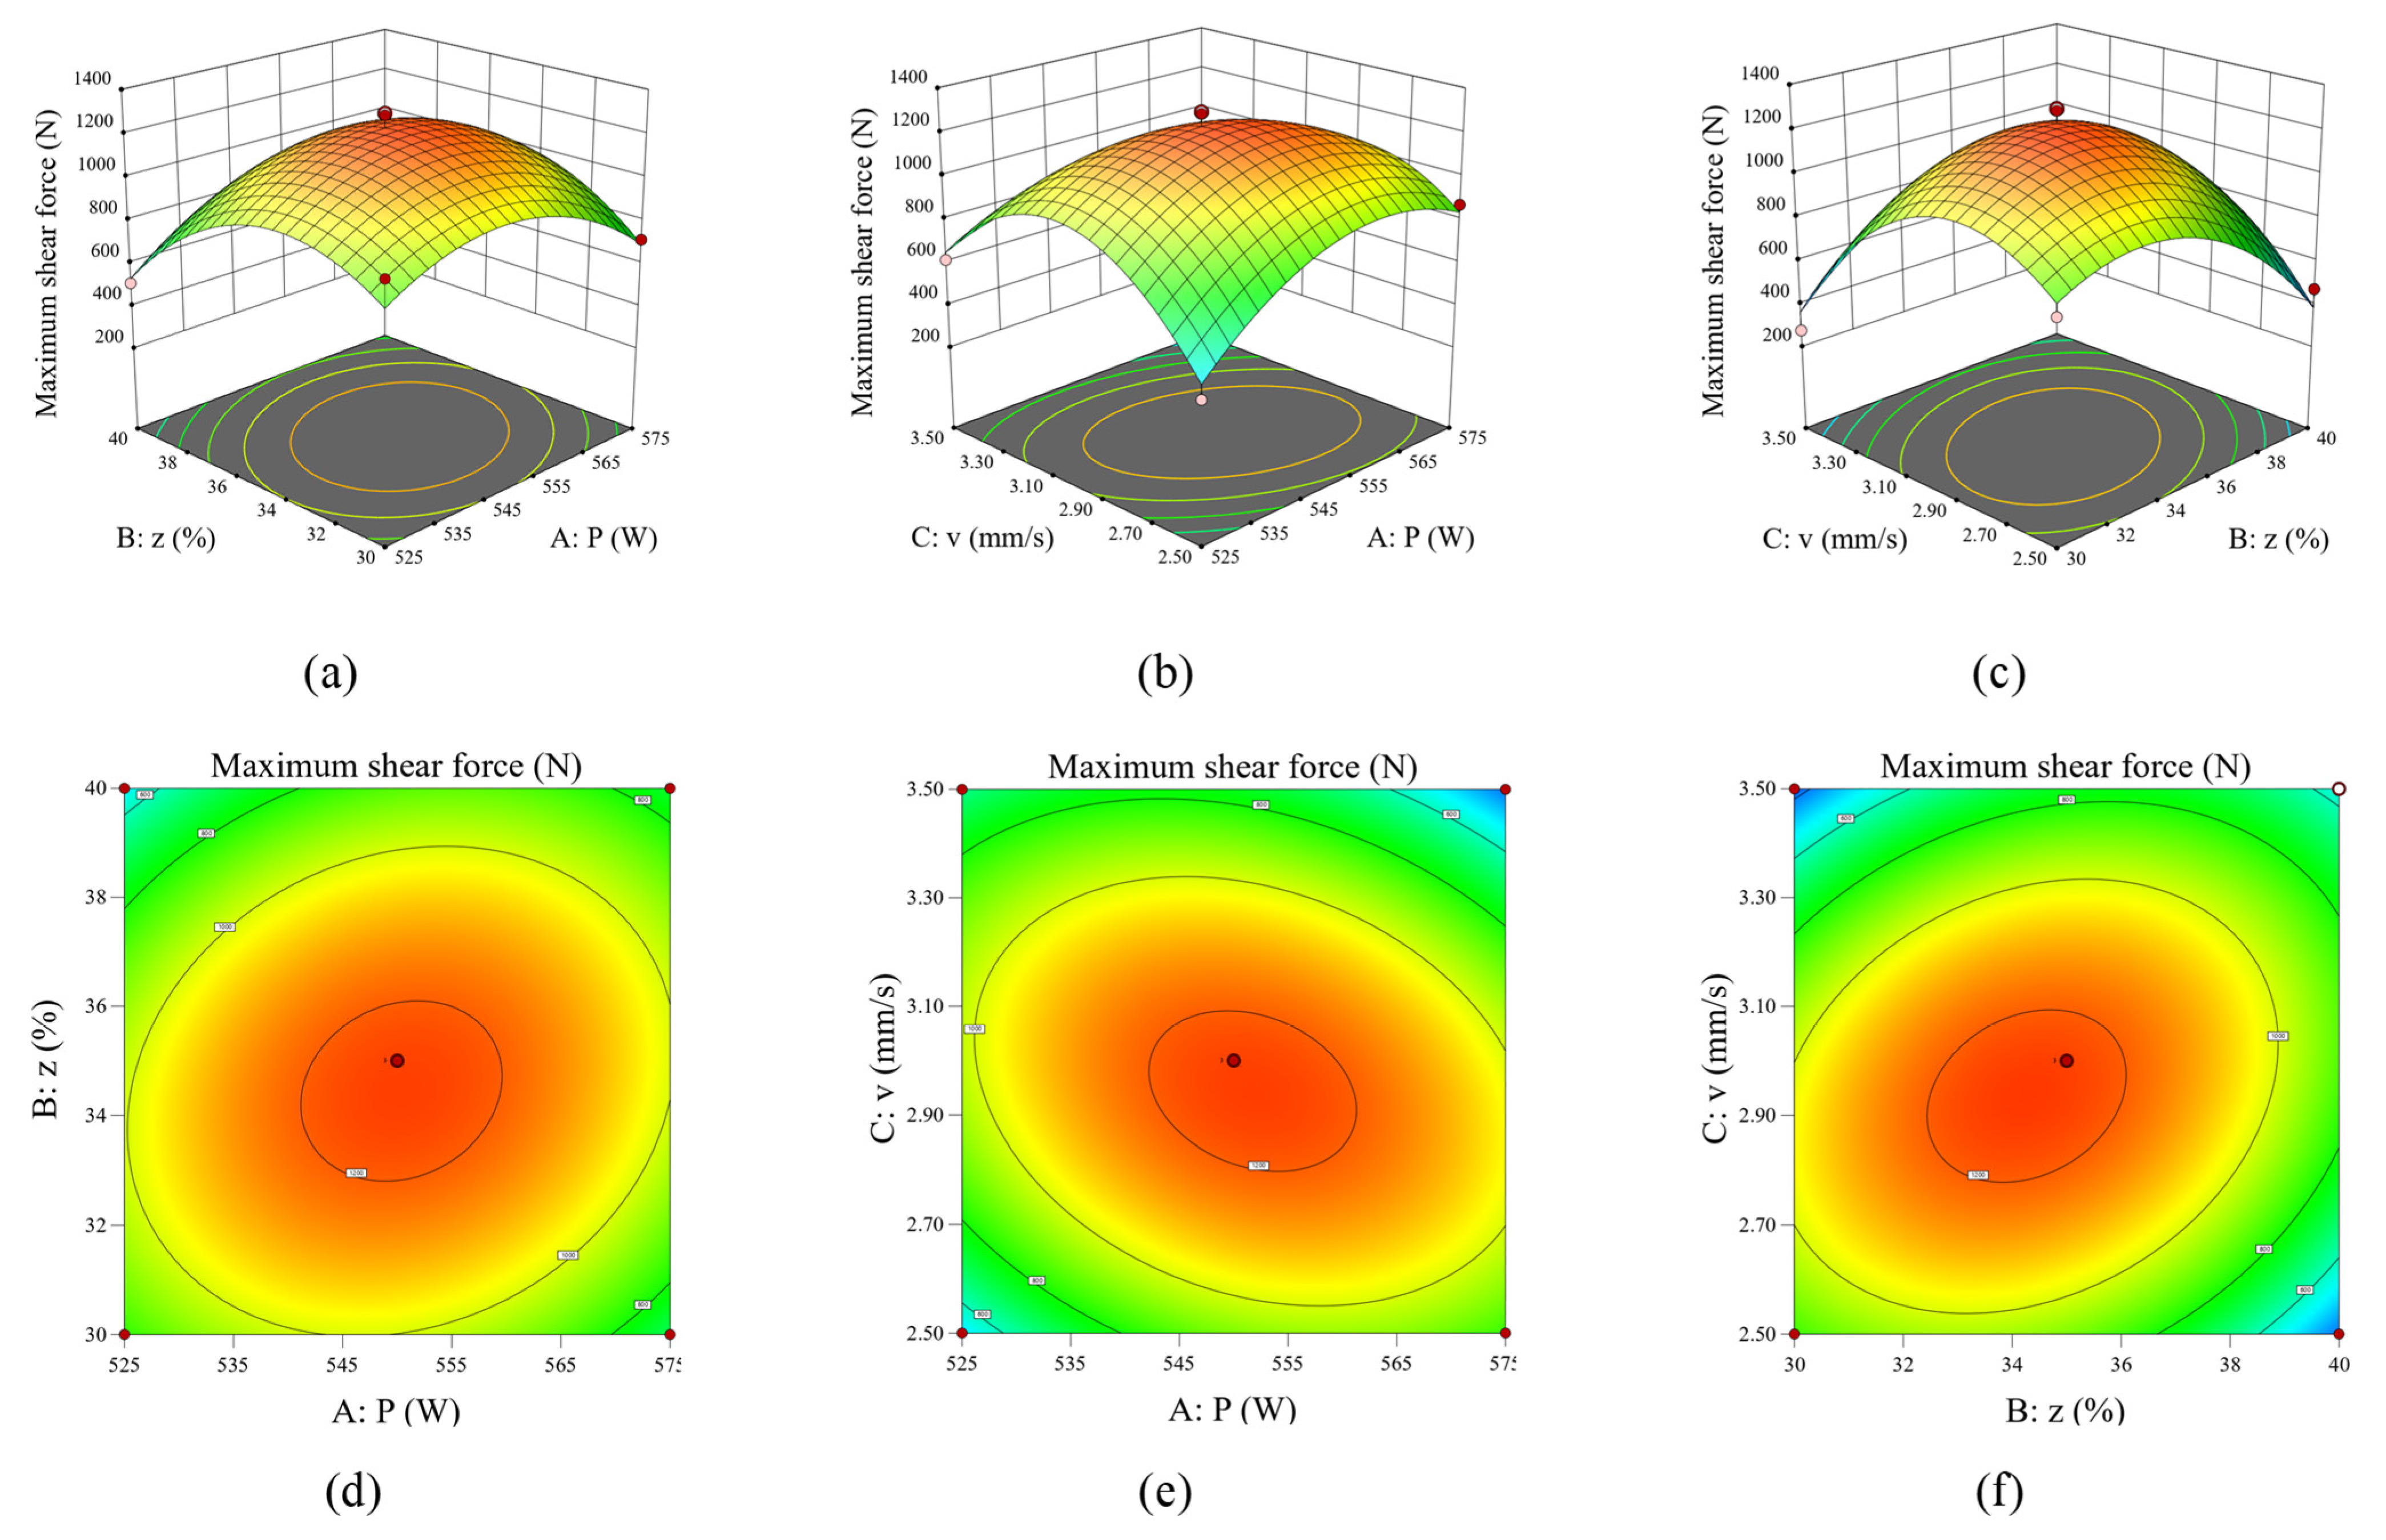
It can be observed from Figure 7a,d that the influence trends of the laser power and pulse–duty ratio on the maximum shear force are similar. As the laser power and pulse–duty ratio increase, the maximum shear force initially increases before decreasing, with the apex of the convex surface being the maximum. Figure 7b,e shows that there is an interaction rule between the laser power and the laser scanning speed. Values that are too low or too high for the laser power and laser scanning speed will lead to poor welding results, with the worst results achieved when the laser scan speed and laser power are the lowest. Figure 7c,f highlights the significant interaction between pulse–duty ratio and laser scanning speed. At all levels of the pulse–duty ratio, the influence of the laser scanning speed on the maximum shear force follows the same downwards parabolic function distribution. Similarly, when the laser scanning speed is kept constant, the pulse–duty ratio on the maximum shear force also follows the same distribution. The maximum shear force is reached when the pulse–duty ratio is between 34 and 36% and the laser scanning speed is between 2.9 and 3.1 mm/s.
3.4. Response Model Verification
Figure 8a depicts a normal plot of residuals, wherein each data point is generally fitted to a straight line, suggesting that the residuals follow a normal distribution. This indicates that the experiment is random, and the random errors can be effectively fitted. A scatter plot of residuals in Figure 8b is a common method used to examine and test residual issues. The residuals have a mean of zero and are randomly and uniformly distributed across the range of fitted values with no discernible pattern, suggesting that there is no heteroscedasticity problem. Figure 8c displays the relationship between the predicted and actual maximum shear forces. It is evident from this figure that the errors between the actual and predicted values are minimal, and the actual and predicted values are in close agreement. To conclude, the welding-prediction model developed is reasonable and effective.
Three sets of process parameters were randomly selected for validation tests; the actual results, predicted values, and errors for the validation tests are displayed in Table 11. As shown in the validation tests, the errors between the predicted and actual values are around 4%. This is within the acceptable range, affirming that the results computed by the model are precise.
4. Conclusions
This research focuses on the pulsed laser welding of 316L stainless steel and polylactic acid. Through the study, the following conclusions have been drawn:
- (1)
- Orthogonal tests revealed that the most significant factors affecting welding mechanical properties were the laser scanning speed, pulse–duty ratio, and laser power, in this order. ANOVA further enabled us to measure the influence degree of different process parameters on welding quality;
- (2)
- A joint region analysis, fracture–failure analysis, and a microscopic morphology analysis led to the division of the joint region into two categories: the effective region and the failure region. Furthermore, the effective area ratio was established as a method of judging the joint’s mechanical properties’
- (3)
- The response surface method and the Box–Behnken design allowed us to develop a mathematical model of the welding quality with an error of approximately 4%, thereby providing a good prediction result;
- (4)
- It was found that the combination of pulse–duty ratio and laser scanning speed had the greatest effect on joint quality. Optimal mechanical properties for 316L stainless steel–PLA joints can be obtained with a pulse–duty ratio of 34–36% and a laser scanning speed of 2.9–3.1 mm/s.
Author Contributions
Conceptualization, X.G.; Methodology, J.W.; Validation, J.W. and X.G.; Investigation, J.W.; Resources, X.G.; Data curation, J.W. and X.G.; Writing—original draft, J.W.; Writing—review & editing, P.P.G. and X.G.; Visualization, J.W.; Supervision, P.P.G. and X.G.; Project administration, X.G.; Funding acquisition, X.G. All authors have read and agreed to the published version of the manuscript.
Funding
This work was supported in part by the Guangzhou Municipal Special Fund Project for Scientific and Technological Innovation and Development under Grant [202002020068], the National Natural Science Foundation of China under Grant [52275317], and the Guangdong Provincial Natural Science Foundation of China [2314050004977].
Institutional Review Board Statement
Not applicable.
Informed Consent Statement
Not applicable.
Data Availability Statement
Not applicable.
Conflicts of Interest
The authors declare no conflict of interest.
References
- Zhou, Z.; Gao, X.; Zhang, Y. Research Progress on Characterization and Regulation of Forming Quality in Laser Joining of Metal and Polymer, and Development Trends of Lightweight Automotive Applications. Metals 2022, 12, 1666. [Google Scholar] [CrossRef]
- Qiao, Y.; Merkel, D.R.; Nickerson, E.K.; Shin, Y.; Seffens, R.J.; Ortiz, A.; Simmons, K.L. Mode I tensile fracture behavior of adhesively-bonded metal–metal, metal–CFRP, and CFRP–CFRP bi-material combinations analyzed by size effect method. Compos. Part A Appl. Sci. Manuf. 2022, 160, 107025. [Google Scholar] [CrossRef]
- Hussein, F.I.; Akman, E.; Genc Oztoprak, B.; Gunes, M.; Gundogdu, O.; Kacar, E.; Hajim, K.I.; Demir, A. Evaluation of PMMA joining to stainless steel 304 using pulsed Nd:YAG laser. Opt. Laser Technol. 2013, 49, 143–152. [Google Scholar] [CrossRef]
- Chen, Y.J.; Yue, T.M.; Guo, Z.N. A new laser joining technology for direct-bonding of metals and plastics. Mater. Des. 2016, 110, 775–781. [Google Scholar] [CrossRef]
- Sairajan, K.K.; Aglietti, G.S.; Mani, K.M. A review of multifunctional structure technology for aerospace applications. Acta Astronaut. 2016, 120, 30–42. [Google Scholar] [CrossRef]
- Lambiase, F.; Genna, S. Laser-assisted direct joining of AISI304 stainless steel with polycarbonate sheets: Thermal analysis, mechanical characterization, and bonds morphology. Opt. Laser Technol. 2017, 88, 205–214. [Google Scholar] [CrossRef]
- Zaaba, N.F.; Ismail, H.; Saeed, A.M. A Review: Metal Filled Thermoset Composites. Polym.-Plast. Tech Mat 2022, 61, 13–26. [Google Scholar] [CrossRef]
- Madhav, H.; Singh, N.; Jaiswar, G. Chapter 4—Thermoset, bioactive, metal–polymer composites for medical applications. In Materials for Biomedical Engineering; Grumezescu, V., Grumezescu, A.M., Eds.; Elsevier: Amsterdam, The Netherlands, 2019; pp. 105–143. [Google Scholar]
- Huang, H.W.; Wang, Z.B.; Lu, J.; Lu, K. Fatigue behaviors of AISI 316L stainless steel with a gradient nanostructured surface layer. Acta Mater. 2015, 87, 150–160. [Google Scholar] [CrossRef]
- Xu, L.; Ba, D.; Wang, K.; Guo, D. Wang, C. New Research Progressing of Surface Modification of Medical 316L Stainless Steels. Proc. SPIE-Int. Soc. Opt. Eng. 2013, 9068, 90681L. [Google Scholar]
- Li, C.; Ma, Y.; Yang, X.; Hou, M. New TiTaNbZrMo high-entropy alloys for metallic biomaterials. Mater. Res. Express 2021, 8, 105403. [Google Scholar] [CrossRef]
- Shen, M.; Wang, L.; Gao, Y.; Feng, L.; Xu, C.; Li, S.; Wang, X.; Wu, Y.; Guo, Y.; Pei, G. 3D bioprinting of in situ vascularized tissue engineered bone for repairing large segmental bone defects. Mater. Today Bio 2022, 16, 100382. [Google Scholar] [CrossRef]
- Yang, J.; Guo, J.L.; Mikos, A.G.; He, C.; Cheng, G. Material Processing and Design of Biodegradable Metal Matrix Composites for Biomedical Applications. Ann. Biomed. Eng. 2018, 46, 1229–1240. [Google Scholar] [CrossRef] [PubMed]
- Hamad, K.; Kaseem, M.; Ayyoob, M.; Joo, J.; Deri, F. Polylactic acid blends: The future of green, light and tough. Prog. Polym. Sci. 2018, 85, 83–127. [Google Scholar] [CrossRef]
- Qi, X.; Ren, Y.; Wang, X. New advances in the biodegradation of Poly(lactic) acid. Int. Biodeterior. Biodegrad. 2017, 117, 215–223. [Google Scholar] [CrossRef]
- Berger, K.; Gregorova, A. Thermal stability of modified end-capped poly(lactic acid). J. Appl. Polym. Sci. 2014, 131, 41105. [Google Scholar] [CrossRef]
- Huang, Y.J.; Gao, X.D.; Ma, B.; Liu, G.Q.; Zhang, N.F.; Zhang, Y.X.; You, D.Y. Optimization of weld strength for laser welding of steel to PMMA using Taguchi design method. Opt. Laser Technol. 2021, 136, 106726. [Google Scholar] [CrossRef]
- Reitz, V.; Meinhard, D.; Ruck, S.; Riegel, H.; Knoblauch, V. A comparison of IR- and UV-laser pretreatment to increase the bonding strength of adhesively joined aluminum/CFRP components. Compos. Part A Appl. Sci. Manuf. 2017, 96, 18–27. [Google Scholar] [CrossRef]
- Feng, Y.Z.; Gao, X.D.; Zhang, Y.X.; Peng, C.; Gui, X.Y.; Sun, Y.S.; Xiao, X.T. Simulation and Experiment for dynamics of laser welding keyhole and molten pool at different penetration status. Int. J. Adv. Manuf. Technol. 2021, 112, 2301–2312. [Google Scholar] [CrossRef]
- Gao, X.D.; Mo, L.; You, D.Y.; Li, Z.M. Tight butt joint weld detection based on optical flow and particle filtering of magneto-optical imaging. Mech. Syst. Signal Process. 2017, 96, 16–30. [Google Scholar] [CrossRef]
- Wang, T.; Gao, X.D.; Katayama, S.; Jin, X.L. Study of dynamic features of surface plasma in high-power disk laser welding. Plasma Sci. Technol. 2012, 14, 245–251. [Google Scholar] [CrossRef]
- Gao, X.D.; Zhang, Y.X. Monitoring of welding status by molten pool morphology during high-power disk laser welding. Optik 2015, 126, 1797–1802. [Google Scholar] [CrossRef]
- Gao, X.D.; Sun, Y.; Katayama, S. Neural network of plume and spatter for monitoring high-power disk laser welding. Int. J. Precis. Eng. Manuf.-Green Technol. 2014, 1, 293–298. [Google Scholar] [CrossRef]
- Wahba, M.; Kawahito, Y.; Katayama, S. Laser direct joining of AZ91D thixomolded Mg alloy and amorphous polyethylene terephthalate. J. Mater. Process Tech. 2011, 211, 1166–1174. [Google Scholar] [CrossRef]
- Bergmann, J.P.; Stambke, M. Potential of Laser-manufactured Polymer-metal hybrid Joints. Phys. Procedia 2012, 39, 84–91. [Google Scholar] [CrossRef] [Green Version]
- Lambiase, F.; Genna, S.; Kant, R. A procedure for calibration and validation of FE modelling of laser-assisted metal to polymer direct joining. Opt. Laser Technol. 2018, 98, 363–372. [Google Scholar] [CrossRef]
- Wang, F.; Bu, H.; Luo, J.; Zhang, P.; Wang, L.; Zhan, X. Influence of different micro-pattern types on interface characteristic and mechanical property of CFRTP/aluminum alloy laser bonding joint. Int. J. Adv. Manuf. Technol. 2022, 120, 3543–3557. [Google Scholar] [CrossRef]
- Branquinho, M.V.; Ferreira, S.O.; Alvites, R.D.; Magueta, A.F.; Ivanov, M.; Sousa, A.C.; Amorim, I.; Faria, F.; Fernandes, M.H.V.; Vilarinho, P.M.; et al. In Vitro and In Vivo Characterization of PLLA-316L Stainless Steel Electromechanical Devices for Bone Tissue Engineering—A Preliminary Study. Int. J. Mol. Sci. 2021, 22, 7655. [Google Scholar] [CrossRef]
- Chou, P.Y.; Lee, D.; Chen, S.H.; Liao, C.T.; Lo, L.J.; Liu, S.J. 3D-printed/electrospun bioresorbable nanofibrous drug-eluting cuboid frames for repair of alveolar bone defects. Int. J. Pharm. 2022, 615, 121497. [Google Scholar] [CrossRef]
- Pagano, N.; Campana, G.; Fiorini, M.; Morelli, R. Laser transmission welding of polylactide to aluminium thin films for applications in the food-packaging industry. Opt. Laser Technol. 2017, 9180, 84. [Google Scholar] [CrossRef]
- Ye, X.; Cai, W.F.; Lu, D.; Liu, R.N.; Wu, Y.D.; Wang, Y. Electrochemical regeneration of granular activated carbon using an AQS (9,10- anthraquinone-2-sulfonic acid)/PPy modified graphite plate cathode. Chemosphere 2022, 308, 136189. [Google Scholar] [CrossRef]
- Manjunath, P.G.C.; Krishna, P.; Parappagoudar, M.B. Modelling of squeeze casting process: Conventional statistical regression analysis approach. Appl. Math. Model. 2016, 40, 6869–6888. [Google Scholar]
- Parappagoudar, M.B.; Pratihar, D.K.; Datta, G.L. Linear and non-linear statistical modelling of green sand mould system. Cast Met. 2007, 20, 1–13. [Google Scholar] [CrossRef]
- Manjunath, P.G.C.; Shettigar, A.K.; Parappagoudar, M.B. A systematic approach to model and optimize wear behaviour of castings produced by squeeze casting process. J. Manuf. Process. 2018, 32, 199–212. [Google Scholar]
- Wu, J.; Gao, X.; Huang, Y.; Ye, G.; Zhang, Y.; Gao, P.P. Parameter optimization and quality analysis of pulsed laser joining of 316L stainless steel and polylactic acid. Opt. Laser Technol. 2023, 159, 108965. [Google Scholar] [CrossRef]
- Schricker, K.; Diller, S.; Bergmann, J.P. Bubble formation in thermal joining of plastics with metals. Procedia CIRP 2018, 74, 518–523. [Google Scholar] [CrossRef]
- Liu, H.K.; Liu, H.X.; Xu, W.; Wang, H.; Wang, X. Laser transmission welding of PMMA to alumina ceramic. Ceram. Int. 2022, 48, 11018–11030. [Google Scholar] [CrossRef]
- Huang, Y.J.; Gao, X.D.; Ma, B.; Zhang, Y.X. Interface Formation and Bonding Mechanisms of Laser Welding of PMMA Plastic and 304 Austenitic Stainless Steel. Metals 2021, 11, 1495. [Google Scholar] [CrossRef]
Figure 1.
(a) Diagram of experimental device, (b) schematic diagram of laser heat-conduction joining between metal and plastic.
Figure 1.
(a) Diagram of experimental device, (b) schematic diagram of laser heat-conduction joining between metal and plastic.

Figure 2.
Diagram of tensile test.

Figure 3.
Single-factor test of process parameters and maximum shear force of the joint: (a) laser power and joint maximum shear force, (b) pulse–duty ratio and joint maximum shear force, and (c) laser scanning speed and joint maximum shear force.
Figure 3.
Single-factor test of process parameters and maximum shear force of the joint: (a) laser power and joint maximum shear force, (b) pulse–duty ratio and joint maximum shear force, and (c) laser scanning speed and joint maximum shear force.


Figure 4.
Joint morphologies and corresponding fracture–failure morphologies on the plastic side: (a) joint morphologies and corresponding region diagrams, (b) joint fracture–failure morphologies.
Figure 4.
Joint morphologies and corresponding fracture–failure morphologies on the plastic side: (a) joint morphologies and corresponding region diagrams, (b) joint fracture–failure morphologies.


Figure 5.
Metallographic micrographs of joint section: (a) section of yellowed region (corresponding to region A-A in Figure 4a), (b) section of Center weld region (black) (corresponding to region B-B in Figure 4a), (c) section of Center weld region (white) (corresponding to region C-C in Figure 4a), and (d) section of Porosities region (corresponding to region D-D in Figure 4a).

Figure 6.
Relationship between maximum shear force and joint morphology.

Figure 7.
The response surface plots on the maximum shear force: (a,d) showing the effect of A and B at C = 3.0, (b,e) showing the effect of A and C at B = 35.0, (c,f) showing the effect of B and C at A = 550.0.
Figure 7.
The response surface plots on the maximum shear force: (a,d) showing the effect of A and B at C = 3.0, (b,e) showing the effect of A and C at B = 35.0, (c,f) showing the effect of B and C at A = 550.0.

Figure 8.
Validations of response model: (a) normal plot of residuals, (b) scatter plot of residuals, and (c) predicted vs. actual.
Figure 8.
Validations of response model: (a) normal plot of residuals, (b) scatter plot of residuals, and (c) predicted vs. actual.


Table 1.
Physical properties of materials.
| Materials | AISI316L | PLA |
|---|---|---|
| Density (g/cm3) | 8 | 1.28 |
| Ultimate Tensile Strength (MPa) | 564 | 62.9 |
| Elongation at Break (%) | 44 | 64.2 |
| Thermal Conductivity (W/(m·K)) | 14.0~15.9 | 0.0320~0.170 |
| Glass Transition Temperature (°C) | - | 55~65 |
| Melting Point (°C) | 1371~1398 | 156 |
| Decomposing Temperature (°C) | - | 190 |
Table 2.
Performance parameters of fiber lasers.
| Maximum Output Power/W | Focal Spot Diameter/μm | Pulse Frequency/Hz | Pulse–Duty Ratio/% | Scan Speed/(mm·s−1) | Wave Length/μm |
|---|---|---|---|---|---|
| 4000 | 400 | 6~5000 | 5~100% | 1~2000 | 1.07 |
Table 3.
Test-influencing factors and level table.
| Level | P (W) | f (Hz) | z (%) | v (mm/s) | L (mm) | Fj (N) |
|---|---|---|---|---|---|---|
| 1 | 400 | 6 | 20 | 2 | 0 | 5 |
| 2 | 450 | 12 | 30 | 3 | 10 | 15 |
| 3 | 500 | 18 | 40 | 4 | 20 | 25 |
| 4 | 550 | 24 | 50 | 5 | 30 | 35 |
| 5 | 600 | 30 | 60 | 6 | 40 | 45 |
Table 4.
Orthogonal table of process parameters.
| Process Parameters | Evaluation Indicators | ||||||||
|---|---|---|---|---|---|---|---|---|---|
| No. | P/W | f/Hz | z/% | v/(mm·s−1) | L/mm | Fj/N | Fq1/N | Fq2/N | /N |
| 1 | 400 | 6 | 20 | 2 | 0 | 5 | 569.074 | 290.440 | 429.757 |
| 2 | 400 | 12 | 30 | 3 | 10 | 15 | 727.575 | 284.095 | 505.835 |
| 3 | 400 | 18 | 40 | 4 | 20 | 25 | 301.655 | 236.720 | 269.188 |
| 4 | 400 | 24 | 50 | 5 | 30 | 35 | 417.365 | 514.174 | 465.770 |
| 5 | 400 | 30 | 60 | 6 | 40 | 45 | 372.050 | 407.475 | 389.763 |
| 6 | 450 | 6 | 30 | 4 | 30 | 45 | 358.325 | 492.625 | 425.475 |
| 7 | 450 | 12 | 40 | 5 | 40 | 5 | 638.585 | 441.560 | 540.073 |
| 8 | 450 | 18 | 50 | 6 | 0 | 15 | 885.195 | 567.305 | 726.250 |
| 9 | 450 | 24 | 60 | 2 | 10 | 25 | 1429.475 | 1672.245 | 1550.860 |
| 10 | 450 | 30 | 20 | 3 | 20 | 35 | 593.275 | 480.525 | 536.900 |
| 11 | 500 | 6 | 40 | 6 | 10 | 35 | 279.370 | 887.852 | 583.611 |
| 12 | 500 | 12 | 50 | 2 | 20 | 45 | 1547.980 | 1636.975 | 1592.478 |
| 13 | 500 | 18 | 60 | 3 | 30 | 5 | 1541.635 | 1162.645 | 1352.140 |
| 14 | 500 | 24 | 20 | 4 | 40 | 15 | 313.169 | - | 156.585 |
| 15 | 500 | 30 | 30 | 5 | 0 | 25 | 498.530 | 483.034 | 490.782 |
| 16 | 550 | 6 | 50 | 3 | 40 | 25 | 1625.615 | 1669.000 | 1647.308 |
| 17 | 550 | 12 | 60 | 4 | 0 | 35 | 919.435 | 1640.223 | 1279.829 |
| 18 | 550 | 18 | 20 | 5 | 10 | 45 | 549.150 | 570.845 | 559.998 |
| 19 | 550 | 24 | 30 | 6 | 20 | 5 | 725.515 | 518.605 | 622.060 |
| 20 | 550 | 30 | 40 | 2 | 30 | 15 | 688.983 | 924.253 | 806.618 |
| 21 | 600 | 6 | 60 | 5 | 20 | 15 | 918.255 | 1354.578 | 1136.416 |
| 22 | 600 | 12 | 20 | 6 | 30 | 25 | 295.310 | 358.030 | 326.670 |
| 23 | 600 | 18 | 30 | 2 | 40 | 35 | 579.260 | 479.640 | 529.450 |
| 24 | 600 | 24 | 40 | 3 | 0 | 45 | 626.630 | 338.555 | 482.593 |
| 25 | 600 | 30 | 50 | 4 | 10 | 5 | 1215.920 | 1678.885 | 1447.403 |
Table 5.
Analysis table of maximum shear-force range in orthogonal experiment.
| Factor | P | f | z | v | L | Fj | |
|---|---|---|---|---|---|---|---|
| Mean Value | |||||||
| 412.062 | 844.513 | 401.982 | 981.832 | 681.842 | 878.286 | ||
| 755.912 | 848.977 | 514.720 | 904.955 | 929.541 | 666.341 | ||
| 835.119 | 687.405 | 536.416 | 715.696 | 831.408 | 856.961 | ||
| 983.162 | 655.573 | 1175.841 | 638.608 | 675.334 | 679.112 | ||
| 727.075 | 673.752 | 1036.170 | 511.488 | 705.736 | 690.827 | ||
| 571.100 | 193.403 | 773.860 | 470.344 | 254.207 | 211.946 | ||
Table 6.
Test parameter table.
| Factor | Name | Units | Minimum | Maximum | Coded Low | Coded High |
|---|---|---|---|---|---|---|
| A | P | W | 525.00 | 575.00 | −1 ↔ 525.00 | +1 ↔ 575.00 |
| B | z | % | 30.00 | 40.00 | −1 ↔ 30.00 | +1 ↔ 40.00 |
| C | v | mm/s | 2.50 | 3.50 | −1 ↔ 2.50 | +1 ↔ 3.50 |
Table 7.
The design matrix and measured response.
| Order | Factor 1 | Factor 2 | Factor 3 | Response | |
|---|---|---|---|---|---|
| Std | Run | A:P | B:z | C:v | Maximum Shear Force |
| W | % | mm/s | N | ||
| 1 | 8 | 525 | 30 | 3 | 952.489 |
| 2 | 7 | 575 | 30 | 3 | 715.474 |
| 3 | 2 | 525 | 40 | 3 | 509.895 |
| 4 | 14 | 575 | 40 | 3 | 611.28 |
| 5 | 4 | 525 | 35 | 2.5 | 443.19 |
| 6 | 9 | 575 | 35 | 2.5 | 872.21 |
| 7 | 13 | 525 | 35 | 3.5 | 614.675 |
| 8 | 5 | 575 | 35 | 3.5 | 453.22 |
| 9 | 1 | 550 | 30 | 2.5 | 787.2 |
| 10 | 6 | 550 | 40 | 2.5 | 471.52 |
| 11 | 3 | 550 | 30 | 3.5 | 274.945 |
| 12 | 10 | 550 | 40 | 3.5 | 610.69 |
| 13 | 15 | 550 | 35 | 3 | 1292.96 |
| 14 | 12 | 550 | 35 | 3 | 1104.5 |
| 15 | 11 | 550 | 35 | 3 | 1284.99 |
Table 8.
The ANOVA of quadratic polynomial model for the maximum-shear-force model.
| Source | Sum of Squares | df | Mean Square | F-Value | p-Value | |
|---|---|---|---|---|---|---|
| Model | 1.276 × 10⁶ | 9 | 1.418 × 10⁵ | 8.32 | 0.0156 | significant |
| A-P | 2175.86 | 1 | 2175.86 | 0.1277 | 0.7354 | |
| B-z | 34,679.64 | 1 | 34,679.64 | 2.04 | 0.2130 | |
| C-v | 48,141.49 | 1 | 48,141.49 | 2.83 | 0.1536 | |
| AB | 28,628.64 | 1 | 28,628.64 | 1.68 | 0.2515 | |
| AC | 87,165.18 | 1 | 87,165.18 | 5.12 | 0.0732 | |
| BC | 1.061 × 10⁵ | 1 | 1.061 × 10⁵ | 6.23 | 0.0548 | |
| A2 | 2.043 × 10⁵ | 1 | 2.043 × 10⁵ | 11.99 | 0.0180 | |
| B2 | 3.213 × 10⁵ | 1 | 3.213 × 10⁵ | 18.86 | 0.0074 | |
| C2 | 5.803 × 10⁵ | 1 | 5.803 × 10⁵ | 34.06 | 0.0021 | |
| Residual | 85,177.70 | 5 | 17,035.54 | |||
| Lack of Fit | 62,457.36 | 3 | 20,819.12 | 1.83 | 0.3721 | not significant |
| Pure Error | 22,720.34 | 2 | 11,360.17 | |||
| Cor Total | 1.361 × 10⁶ | 14 |
Table 9.
The ANOVAfor the maximum-shear-force model after backward elimination.
| Source | Sum of Squares | df | Mean Square | F-Value | p-Value | |
|---|---|---|---|---|---|---|
| Model | 1.247 × 10⁶ | 8 | 1.559 × 10⁵ | 8.22 | 0.0096 | significant |
| A-P | 2175.86 | 1 | 2175.86 | 0.1147 | 0.7464 | |
| B-z | 34,679.64 | 1 | 34,679.64 | 1.83 | 0.2251 | |
| C-v | 48,141.49 | 1 | 48,141.49 | 2.54 | 0.1622 | |
| AC | 87,165.18 | 1 | 87,165.18 | 4.60 | 0.0758 | |
| BC | 1.061 × 10⁵ | 1 | 1.061 × 10⁵ | 5.59 | 0.0559 | |
| A2 | 2.043 × 10⁵ | 1 | 2.043 × 10⁵ | 10.77 | 0.0168 | |
| B2 | 3.213 × 10⁵ | 1 | 3.213 × 10⁵ | 16.94 | 0.0062 | |
| C2 | 5.803 × 10⁵ | 1 | 5.803 × 10⁵ | 30.59 | 0.0015 | |
| Residual | 1.138 × 10⁵ | 6 | 18,967.72 | |||
| Lack of Fit | 91086.00 | 4 | 22,771.50 | 2.00 | 0.3594 | not significant |
| Pure Error | 22,720.34 | 2 | 11,360.17 | |||
| Cor Total | 1.361 × 10⁶ | 14 |
Table 10.
Comparison of statistics of different models.
| R2 | Adjusted R2 | Predicted R2 | Adeq Precision | |
|---|---|---|---|---|
| All factors | 0.9374 | 0.8248 | 0.2282 | 8.1260 |
| After backward elimination | 0.9164 | 0.8049 | 0.4107 | 8.1176 |
Table 11.
The validation test.
| Number | Laser Power (W) | Pulse Duty Ratio (%) | Laser Scanning Speed (mm/s) | Maximum Shear Force (N) | |
|---|---|---|---|---|---|
| 1 | 575 | 35 | 2.5 | Actual | 872.21 |
| Predicted | 837.508 | ||||
| Error | 3.98% | ||||
| 2 | 525 | 40 | 3 | Actual | 509.895 |
| Predicted | 530.352 | ||||
| Error | 4.01% | ||||
| 3 | 550 | 35 | 3 | Actual | 1284.99 |
| Predicted | 1227.49 | ||||
| Error | 4.47% |
Disclaimer/Publisher’s Note: The statements, opinions and data contained in all publications are solely those of the individual author(s) and contributor(s) and not of MDPI and/or the editor(s). MDPI and/or the editor(s) disclaim responsibility for any injury to people or property resulting from any ideas, methods, instructions or products referred to in the content. |
© 2023 by the authors. Licensee MDPI, Basel, Switzerland. This article is an open access article distributed under the terms and conditions of the Creative Commons Attribution (CC BY) license (https://creativecommons.org/licenses/by/4.0/).
Share and Cite
MDPI and ACS Style
Wu, J.; Gao, P.P.; Gao, X. Optimization of Response Surface Methodology for Pulsed Laser Welding of 316L Stainless Steel to Polylactic Acid. Metals 2023, 13, 214. https://doi.org/10.3390/met13020214
AMA Style
Wu J, Gao PP, Gao X. Optimization of Response Surface Methodology for Pulsed Laser Welding of 316L Stainless Steel to Polylactic Acid. Metals. 2023; 13(2):214. https://doi.org/10.3390/met13020214
Chicago/Turabian StyleWu, Jiakai, Perry P. Gao, and Xiangdong Gao. 2023. "Optimization of Response Surface Methodology for Pulsed Laser Welding of 316L Stainless Steel to Polylactic Acid" Metals 13, no. 2: 214. https://doi.org/10.3390/met13020214
Note that from the first issue of 2016, this journal uses article numbers instead of page numbers. See further details here.