Article

The Effectiveness of Cooled-Finger and Vacuum Distillation Processes in View of the Removal of Fe, Si and Zn from Aluminium

by
Michaela Gotenbruck
,
Danilo C. Curtolo
,
Semiramis Friedrich
* and
Bernd Friedrich
IME Institute, RWTH Aachen University, 52072 Aachen, Germany
*
Author to whom correspondence should be addressed.
These authors contributed equally to this work.
Metals 2022, 12(12), 2027; https://doi.org/10.3390/met12122027
Submission received: 24 October 2022 / Revised: 11 November 2022 / Accepted: 22 November 2022 / Published: 25 November 2022
(This article belongs to the Special Issue Separation and Purification of Metals)

Abstract

:
The increasing demand for ultra-high purity aluminum for technological applications has led to the improvement of refining methods in recent decades. To achieve ultra-purity levels (>5N), the common industrial way is to firstly purify aluminum from 2N8 up to 4N8 via three-layer electrolysis, followed by fractional crystallization (usually zone melting). Since both of these methods are very cost- and time-intensive, this paper aims at providing other alternatives of purification. For this purpose, here, the purification of some selected impurities through cooled-finger fractional crystallization method and vacuum distillation have been the focus of this investigation. Both processes are more environmentally friendly than three-layer electrolysis and require less time than zone melting. In this paper, both methods were explored for the aluminum purification. Moreover, the effect of process parameters on the purification efficiency of iron, zinc, and silicon has been investigated. At the end, the effectiveness of the two processes was compared and advantages and disadvantages were summarized. The results showed that the cooling finger process effectively removed iron and silicon impurities, but the removal efficiency of zinc was low. The vacuum distillation process successfully removes zinc in the first stage of distillation. Iron and silicon removal requires additional distillation stages to achieve lower impurity levels.

1. Introduction

In today’s application-oriented high-tech world, there is an increasing demand for materials with superior properties, which are necessary for the enhancement of quality of life and advances in modern technologies. In this context, various metals have been recognized as strategic materials for the technologies of the future. For many high-tech applications, materials with extremely high purity levels are required [1].
Some areas of application, such as semiconductors and microchips, image screens, but also low-temperature applications in the range below 30 K, require special quality and purity levels of the materials used. Among other critical metals, high- to ultra-purity aluminum is also applied in the above-mentioned areas. In particular, the low specific resistance and high electrical and thermal conductivity are improved with increasing degrees of purity in aluminum. High-purity aluminum, for example, has up to 10,000 times the thermal conductivity of commercially used aluminum alloys [2,3].
The purification of aluminum to higher degrees is usually achieved via a variety of methodologies, but most commonly by a combination of three-layer electrolysis and fractional crystallization [4]. A huge disadvantage of the three-layer electrolysis is the high power consumption, which is associated with high costs and poor environmental compatibility. Fractional crystallization processes, such as zone melting, is associated with a higher process time, as several repetitions of the process may be required to achieve higher levels of purity [5]. In the search for more energy- and time-saving ways to purify metals, new methods and processes are being researched. Within fractional crystallization, the cooled-finger method shows promising results against classical methods, e.g., zone melting due to the higher productivity achieved by its larger crystallization interface [6]. Another promising method to obtain high purity aluminum is vacuum distillation, based on the high selectivity due to the specific boiling point and vapor pressure of each impurity. The latter two are able to be reduced under vacuum, consequently leading to decreasing the process temperature as well as the energy costs [7].
In this paper, both methods of cooled-finger fractional crystallization as well as the vacuum distillation are explored for the purification of aluminum as parallel alternative methodologies. Here, the removal of the main impurities usually present in commercial primary aluminum are investigated and compared via both techniques. Moreover, the effects of main process parameters on the purification efficiency within both methods are also explored.

1.1. Fractional Crystallization

Fractional crystallization is a well-known method to produce ultra-pure metals. It works based on the difference between the solubility of an impurity in the solid and liquid phases of a base metal and is explored to generate a solid phase with lower impurities content than the initial molten phase. The relation between in the solid and in the liquid phase concentration of a specific element is called the distribution coefficient (k), as shown in Equation (1) below [8].
k = c S c L
Table 1 shows the distribution coefficient of the main impurities present in aluminum. The variation of k values between authors is due to the concentration interval taken from phase diagram, when calculating the distribution coefficient. Since most phase diagrams possess a parabolic liquidus and solidus curve, this can significantly influence the calculation of k. The smaller the k coefficient is than unity, the more effective is the removal of those impurities via fractional crystallization. On the other hand, impurities with k higher than one (such as Cr, V, Zr, and Ti) will remain in the solid phase and can be partially incorporated during crystallization. In case an impurity has a distribution coefficient close to unity (e.g., Sc), the fractional crystallization is not effective [9].

Main Influencing Parameters on Fractional Crystallization

During a slow crystallization of the melt, the composition profile of the forming crystal layer follows the solid concentration C S = K C L . During crystallization, the rejected solutes are expelled to the melt. Assuming that the diffusion in the solid is neglected and all the rejected solute is completely mixed within the liquid phase, the solute distribution can be well described by Scheil’s equation (Equation (2)) [6].
C S = K C 0 1 f S K 1
where f S   is the solidified fraction of the melt and C 0 is the initial solute concentration.
However, if no complete mixing is considered and only diffusion is the main driver for the movement of solute from the solid to the liquid phase, the rejected solutes will be accumulated within a heterogeneous solute layer ahead of the solidification front, as their diffusion rate is not fast enough to move themselves towards the bulk melt. For that, an effective distribution coefficient ( K e f f ), firstly proposed by Burton, Prim, and Slichter, will be considered for this thin diffusion layer ahead of the solidification front (see Equation (3)) [15,16].
K e f f = K K + 1 K   e V D
where K is the distribution coefficient, V is the solid growth rate, is the thickness of the diffusion layer and D is the solute diffusion coefficient in the liquid. As seen in Equation (3), the effective distribution coefficient ( K e f f ) is mainly influenced by the solid growth rate ( V ) and the thickness of the diffusion layer ( ). The decrease of the thickness of the diffusion layer is an effective way to improve the rejection of solute to the melt while keeping the growth rate (the process productivity) high enough. This can be achieved by an intense mixing of the melt promoted ahead of the solidification front, usually employing forced convection.
Moreover, the stability of the growth front morphology, i.e., the preservation of a planar growth, is directly related to the crystal growth rate (V), the temperature gradient at the solid–liquid interface (G), the initial solute concentration ( C 0 ), the slope of the liquidus line in the phase diagram (m), the distribution coefficient (K), and the diffusion coefficient of the impurity in the base liquid melt ( D l ). As shown in Equations (4) and (5), when G/V is higher than Δ T 0 / D l , the growth interface becomes stable. Decreasing the temperature gradient and the growth rate would therefore stabilize the growth front, leading to a planar growth. This means that the proper control of growth rate and temperature gradient are among the key process parameters influencing the fractional crystallization, as the shift to a columnar or dendritic morphology would partially entrap the expelled solute [8,17,18].
G V Δ T 0 D l
G < m V C 0 1 k D l k ,   as   Δ T 0 = m C 0 1 k   k

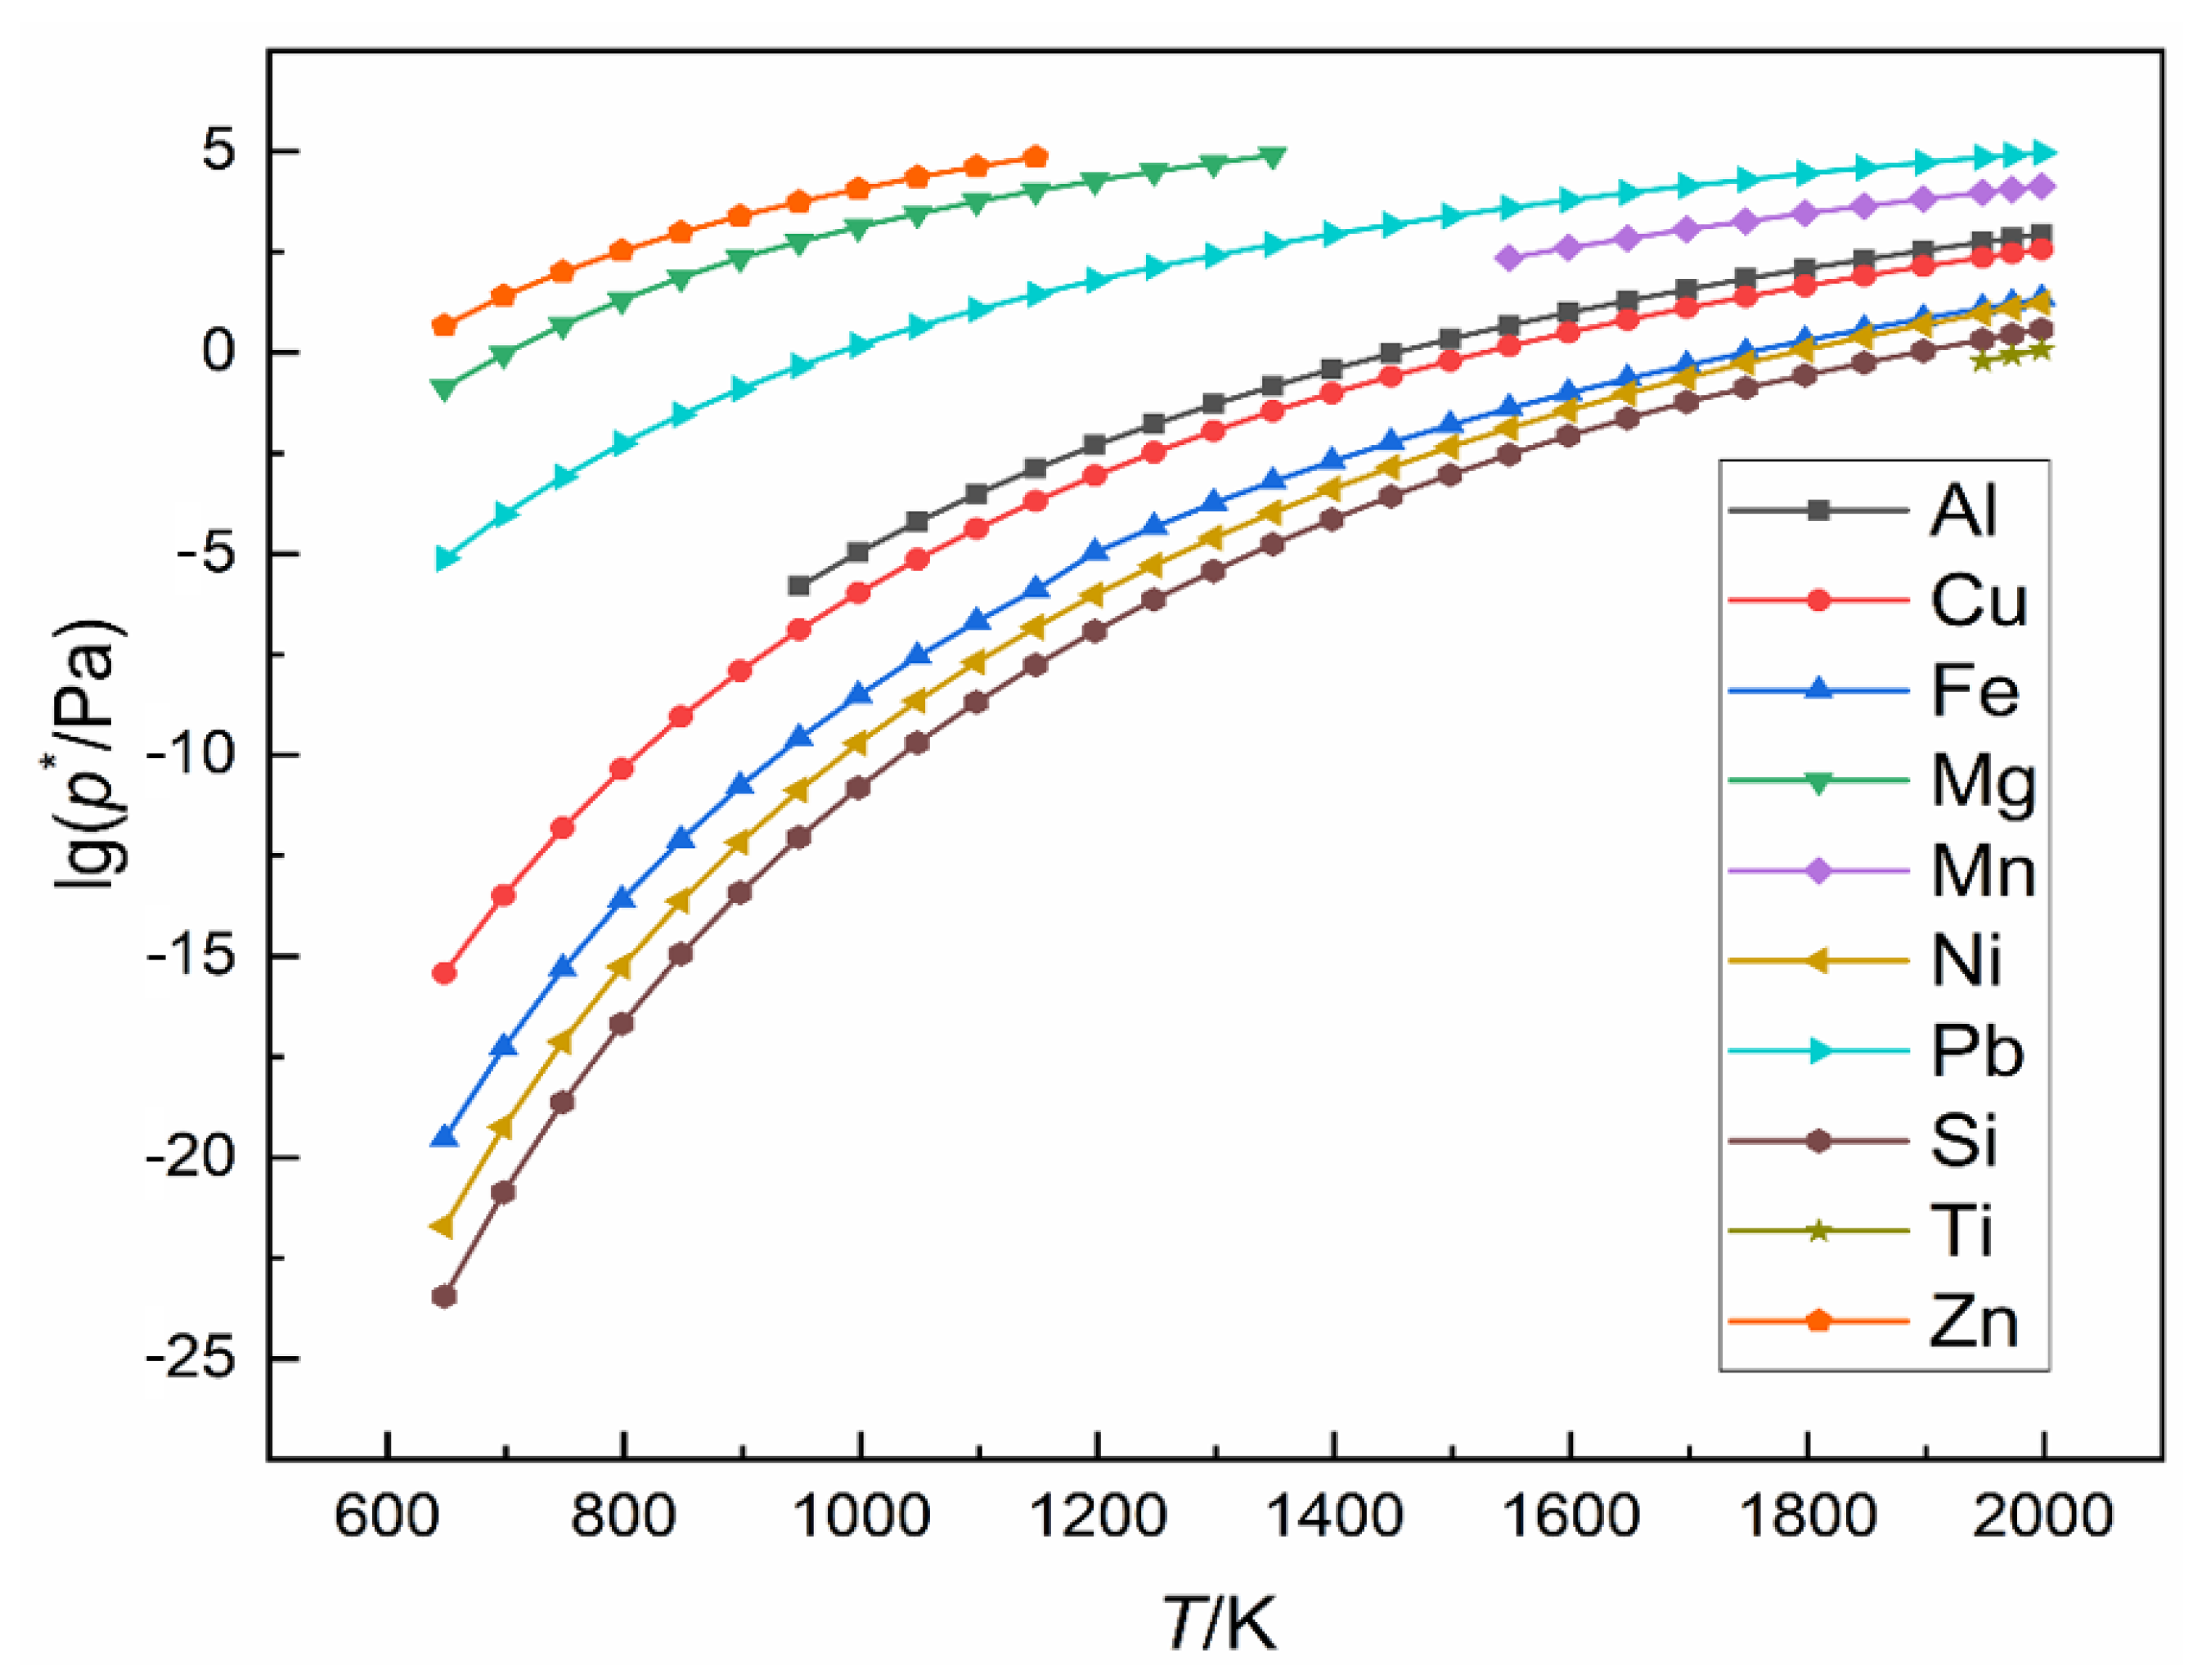
1.2. Vacuum Distillation

Vacuum distillation is a separation process for refining or enrichment of a metal. It uses the fact that different chemical elements have different boiling points and different vapor pressures as well. When the melt in the vacuum distillation furnace is heated up, the more volatile components tend to evaporate, whereas the less volatile components remain in the crucible. The evaporated element will then be condensed on a cooled surface, called condenser [19,20,21]. As the boiling temperature depends strongly on the ambient pressure, better evaporation and sublimation rates can be achieved at significantly lower temperatures under vacuum, as opposed to atmospheric pressure or in an inert gas atmosphere. Through the reduced reaction time and lower temperatures, the energy consumption and the operating costs can be lowered, making it one of the biggest advantages of vacuum distillation. Another advantage of the process is the avoidance of any contact of the substance with the atmosphere, which is particularly important for fast-oxidizing materials, such as aluminum and magnesium. Furthermore, vacuum distillation is a very environmentally friendly process without the formation of waste gases, wastewater, or sludge [19,20,21].

1.2.1. Influencing Factors on Vacuum Distillation

One of the biggest thermodynamic factors influencing vacuum distillation is the vapor pressure. Every element has a certain vapour pressure at a specific temperature [22]. It can be calculated using the vapor pressure equations from the literature. In Figure 1 the vapor pressures of aluminum and different impurities are displayed. As seen, Zn, Mg, Pb, and Mn have higher vapor pressures than Aluminum in the given temperature range. Therefore, these elements will be preferentially volatilized during the distillation process. In contrast, elements with lower vapor pressure, such as Fe, Ni, and Si, are kept in the molten part. The impurities with a similar vapor pressure as Al such as Cu are difficult to remove by vacuum distillation.
A very important kinetic factor for efficient and fast vacuum distillation is the mass transport in the melt since a concentration difference is formed at the phase interface between the melt surface and the inner melt due to evaporation. To maintain the evaporation rate, new molecules must always be transported to the melt surface. This necessary mass transport takes place by convection within the melt, and by diffusion at the liquid–gas boundary layer. The convection can occur either naturally (natural convection) e.g., thermal convection or influenced by external forces (forced convection) [24,25]. In an inductively heated furnace, such as the one used in these experiments, the melt is mixed through forced convection by changing the magnetic fields. Therefore, the particles of the elements reach the melt surface more easily and are able to vaporize. The forced convection could have a significant impact on the efficiency of vacuum distillation. In this paper, the vacuum distillation trials focus on the removal of the volatile element zinc as well as the removal of the less volatile elements iron and silicon from the primary aluminum.

1.2.2. Separation Coefficient

The vapor pressures of the pure components in a multi-component system merely give a rough estimate of the separation possibilities, because the partial vapor pressure of a component depends not only on the vapor pressure of that component in pure form, but also on the activity of the component in the system. Raoult’s law can explain it well as represented in Equation (6) [22,26].
p i = p v 0 · γ i · x i
where pi describes the partial vapor pressure; p v 0 the vapour pressure of the pure component; γi is the activity coefficient of the components, and xi is the mole fraction of the components. To show the degree of separation between two components, the separation coefficient was introduced (see Equation (7)) [21,27].
β i = γ i γ A l · p i p A l
where βi is the separation coefficient; pi and pAl are the saturated vapor pressures of the impurity i and aluminum; and γi and γAl are the activity coefficients of the impurity i and aluminum all at a certain temperature. If βi > 1, the impurity is concentrated in the gas phase during vacuum distillation, whereas the target metal remains as a liquid phase in the melt. If βi < 1, the opposite occurs, and the target metal is volatized. When βi = 1, the content of the two components in the gas phase is equal to that in the liquid phase, so that the two components cannot be separated by vacuum distillation. The further βi from unity, the larger the value of difference and hence better the effect of separation of the impurity from the base metal by vacuum distillation [23].
A difficulty in these calculations is obtaining the activity coefficients for individual components, because they vary with the temperature of the system and the initial concentrations of the individual impurities. However, if the metal under investigation has a high purity, it is reasonable to assume the activity coefficient of γi equal to unity [28]. On the other hand γAl, must be determined experimentally or extracted from literature data [21,27]. Table 2 shows the separation coefficients for a few selected temperatures calculated using the activity coefficients from Ralph et al. [29].
The separation coefficient for zinc is much higher than unity. Accordingly, zinc should be very easy to distill from the aluminum without evaporating a huge amount of the aluminum itself. In comparison, the separation coefficients of iron and silicon are far below one. Therefore, aluminum enters the gas phase before these two elements. Moreover, the probability that the elements iron and silicon will be vaporized alongside aluminum is quite low.
The vapor pressures as well as the separation coefficients of zinc, iron, and silicon confirm that these impurities cannot be removed from aluminum with a single distillation stage. Therefore, a two-stage distillation is suggested. In the first stage, the element zinc, with a higher vapor pressure than aluminum, would be removed by keeping the temperatures below the boiling point of aluminum. In the second stage, the aluminum is distilled out of the elements iron and silicon by keeping the temperature above its boiling temperature.

2. Materials and Methods

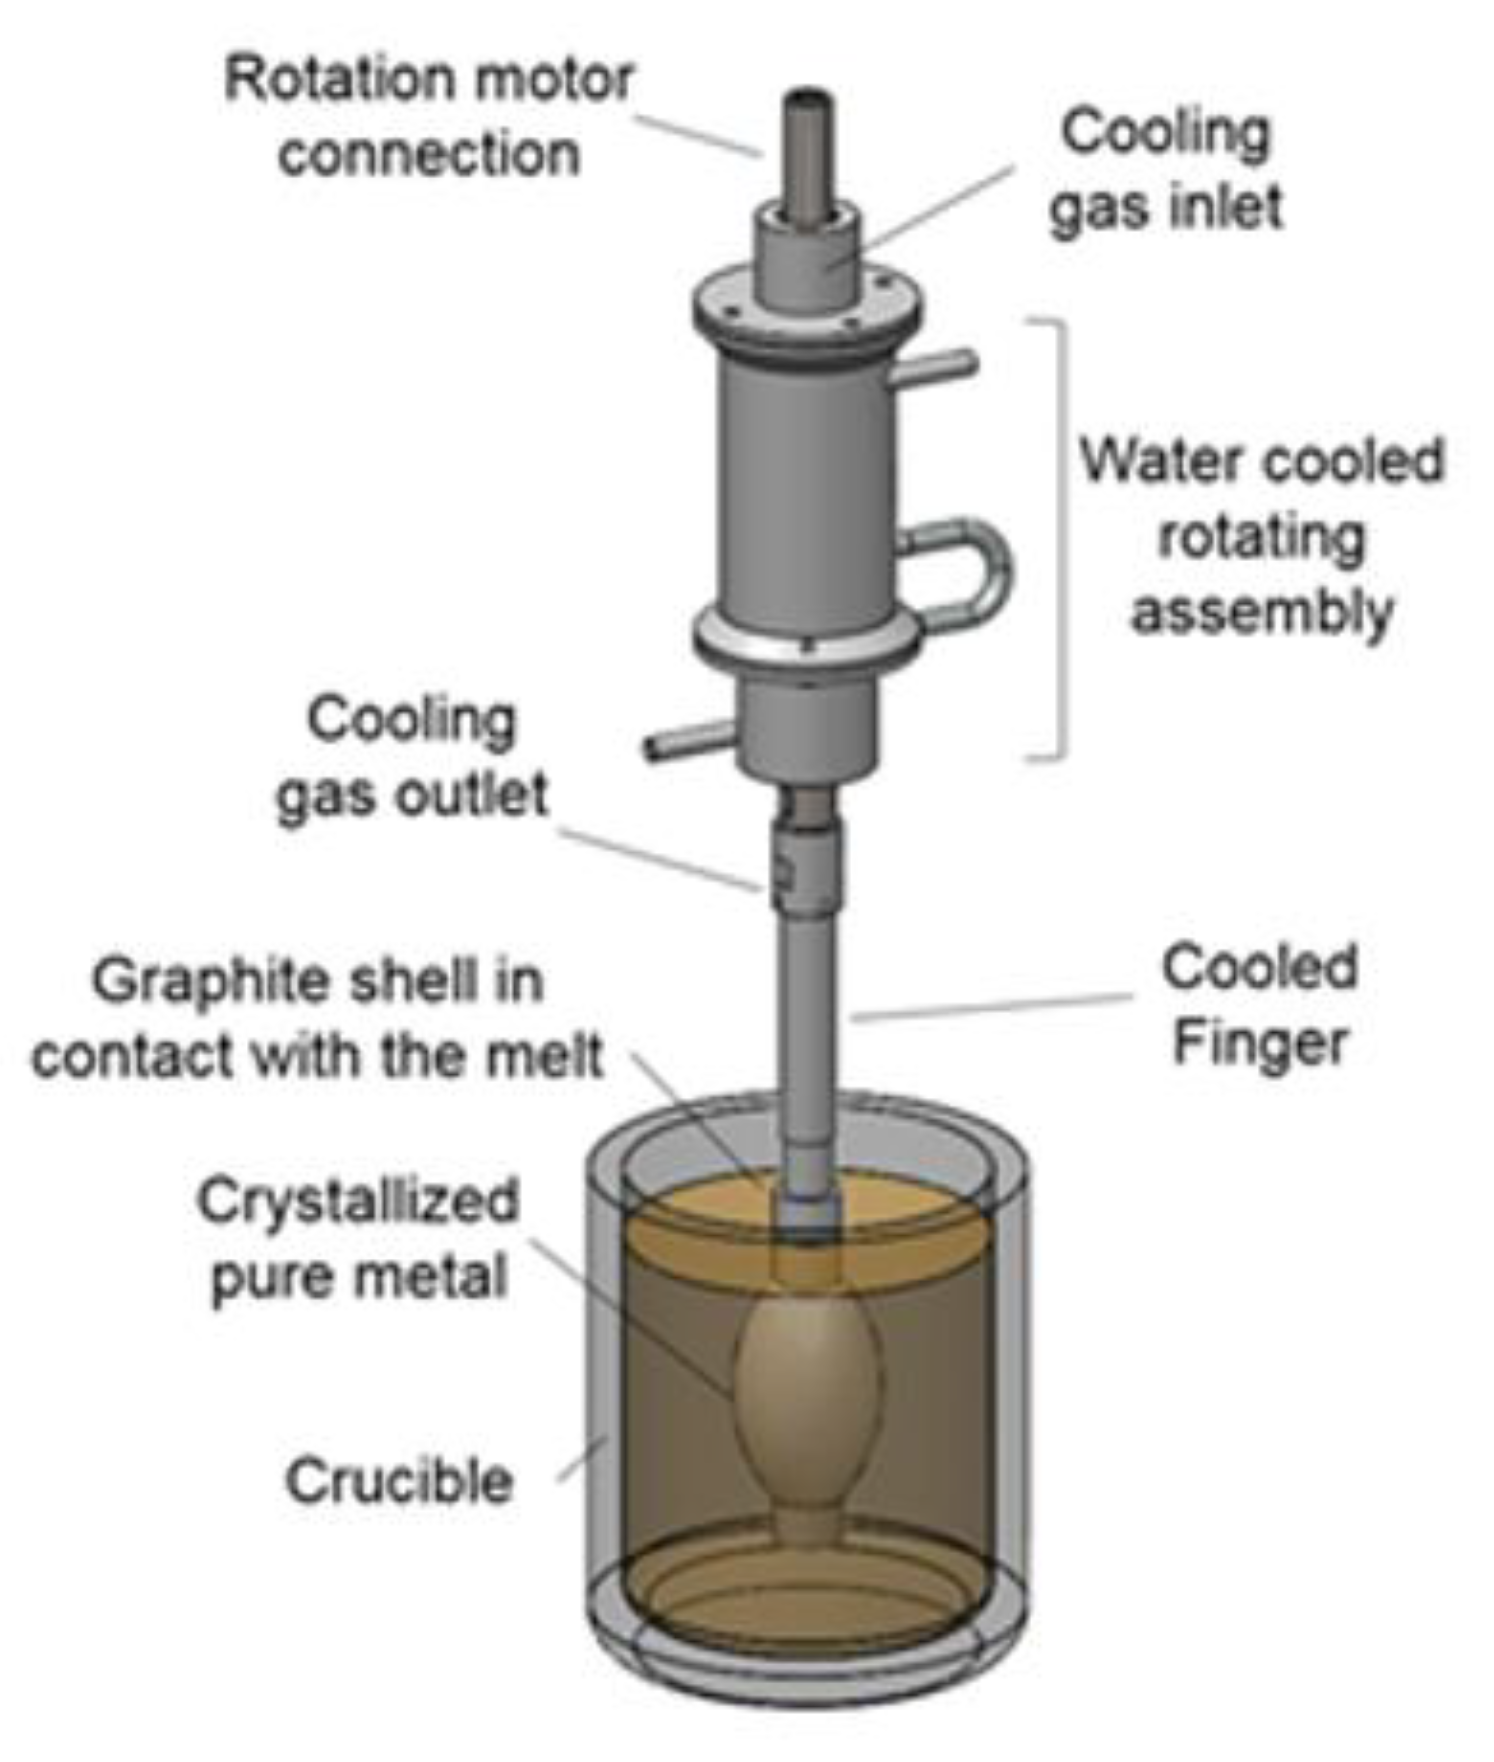
2.1. Cooled-Finger Fractional Crystallization

The experimental setup of the cooled-finger purification process is illustrated in Figure 2. It consists of a rotating, gas-cooled steel rod inserted into the molten bath. The rod is covered with a high-purity graphite shell, inhibiting a physical contact of the steel with aluminum.
Based on the same principle of well-stablished fractional crystallization techniques (e.g., zone melting, Pechiney, etc.), this method differentiate itself by moving a solid growth front radially towards the crucible wall, while rotating. The rotational mechanism promotes a homogeneous mixing of the melt and a stable boundary layer, which improves the segregation of impurities away from the crystallization interface. The growth rate is influenced by a combination of the cooling degree and the rotation rate.

2.1.1. Initial Material

As initial material, high purity aluminum (4N8) containing added impurities of Fe, Si, and Zn was chosen, as these elements represent the main impurities in primary aluminum. For this investigation, a mixture of 4N8-Al with Fe, Si, and Zn was used (each element with a purity level over 3N).
This investigation was divided into three experimental parts. First, the effect of impurity concentration on the purification of Al was investigated. In the second part, the interaction among the detected impurities were studied. For that, a series of trials were performed comprehending the binary (Al-Si, Al-Fe, and Al-Zn) as well as the ternary systems (Al-X-Y, being X and Y each selected impurity). For these investigations, a concentration of 0.1 wt.%. was used for the selected impurities (see Table 3). The third part focus on the rotation rate, the process parameter that distinguishes cooled finger from other fractional crystallization methods.

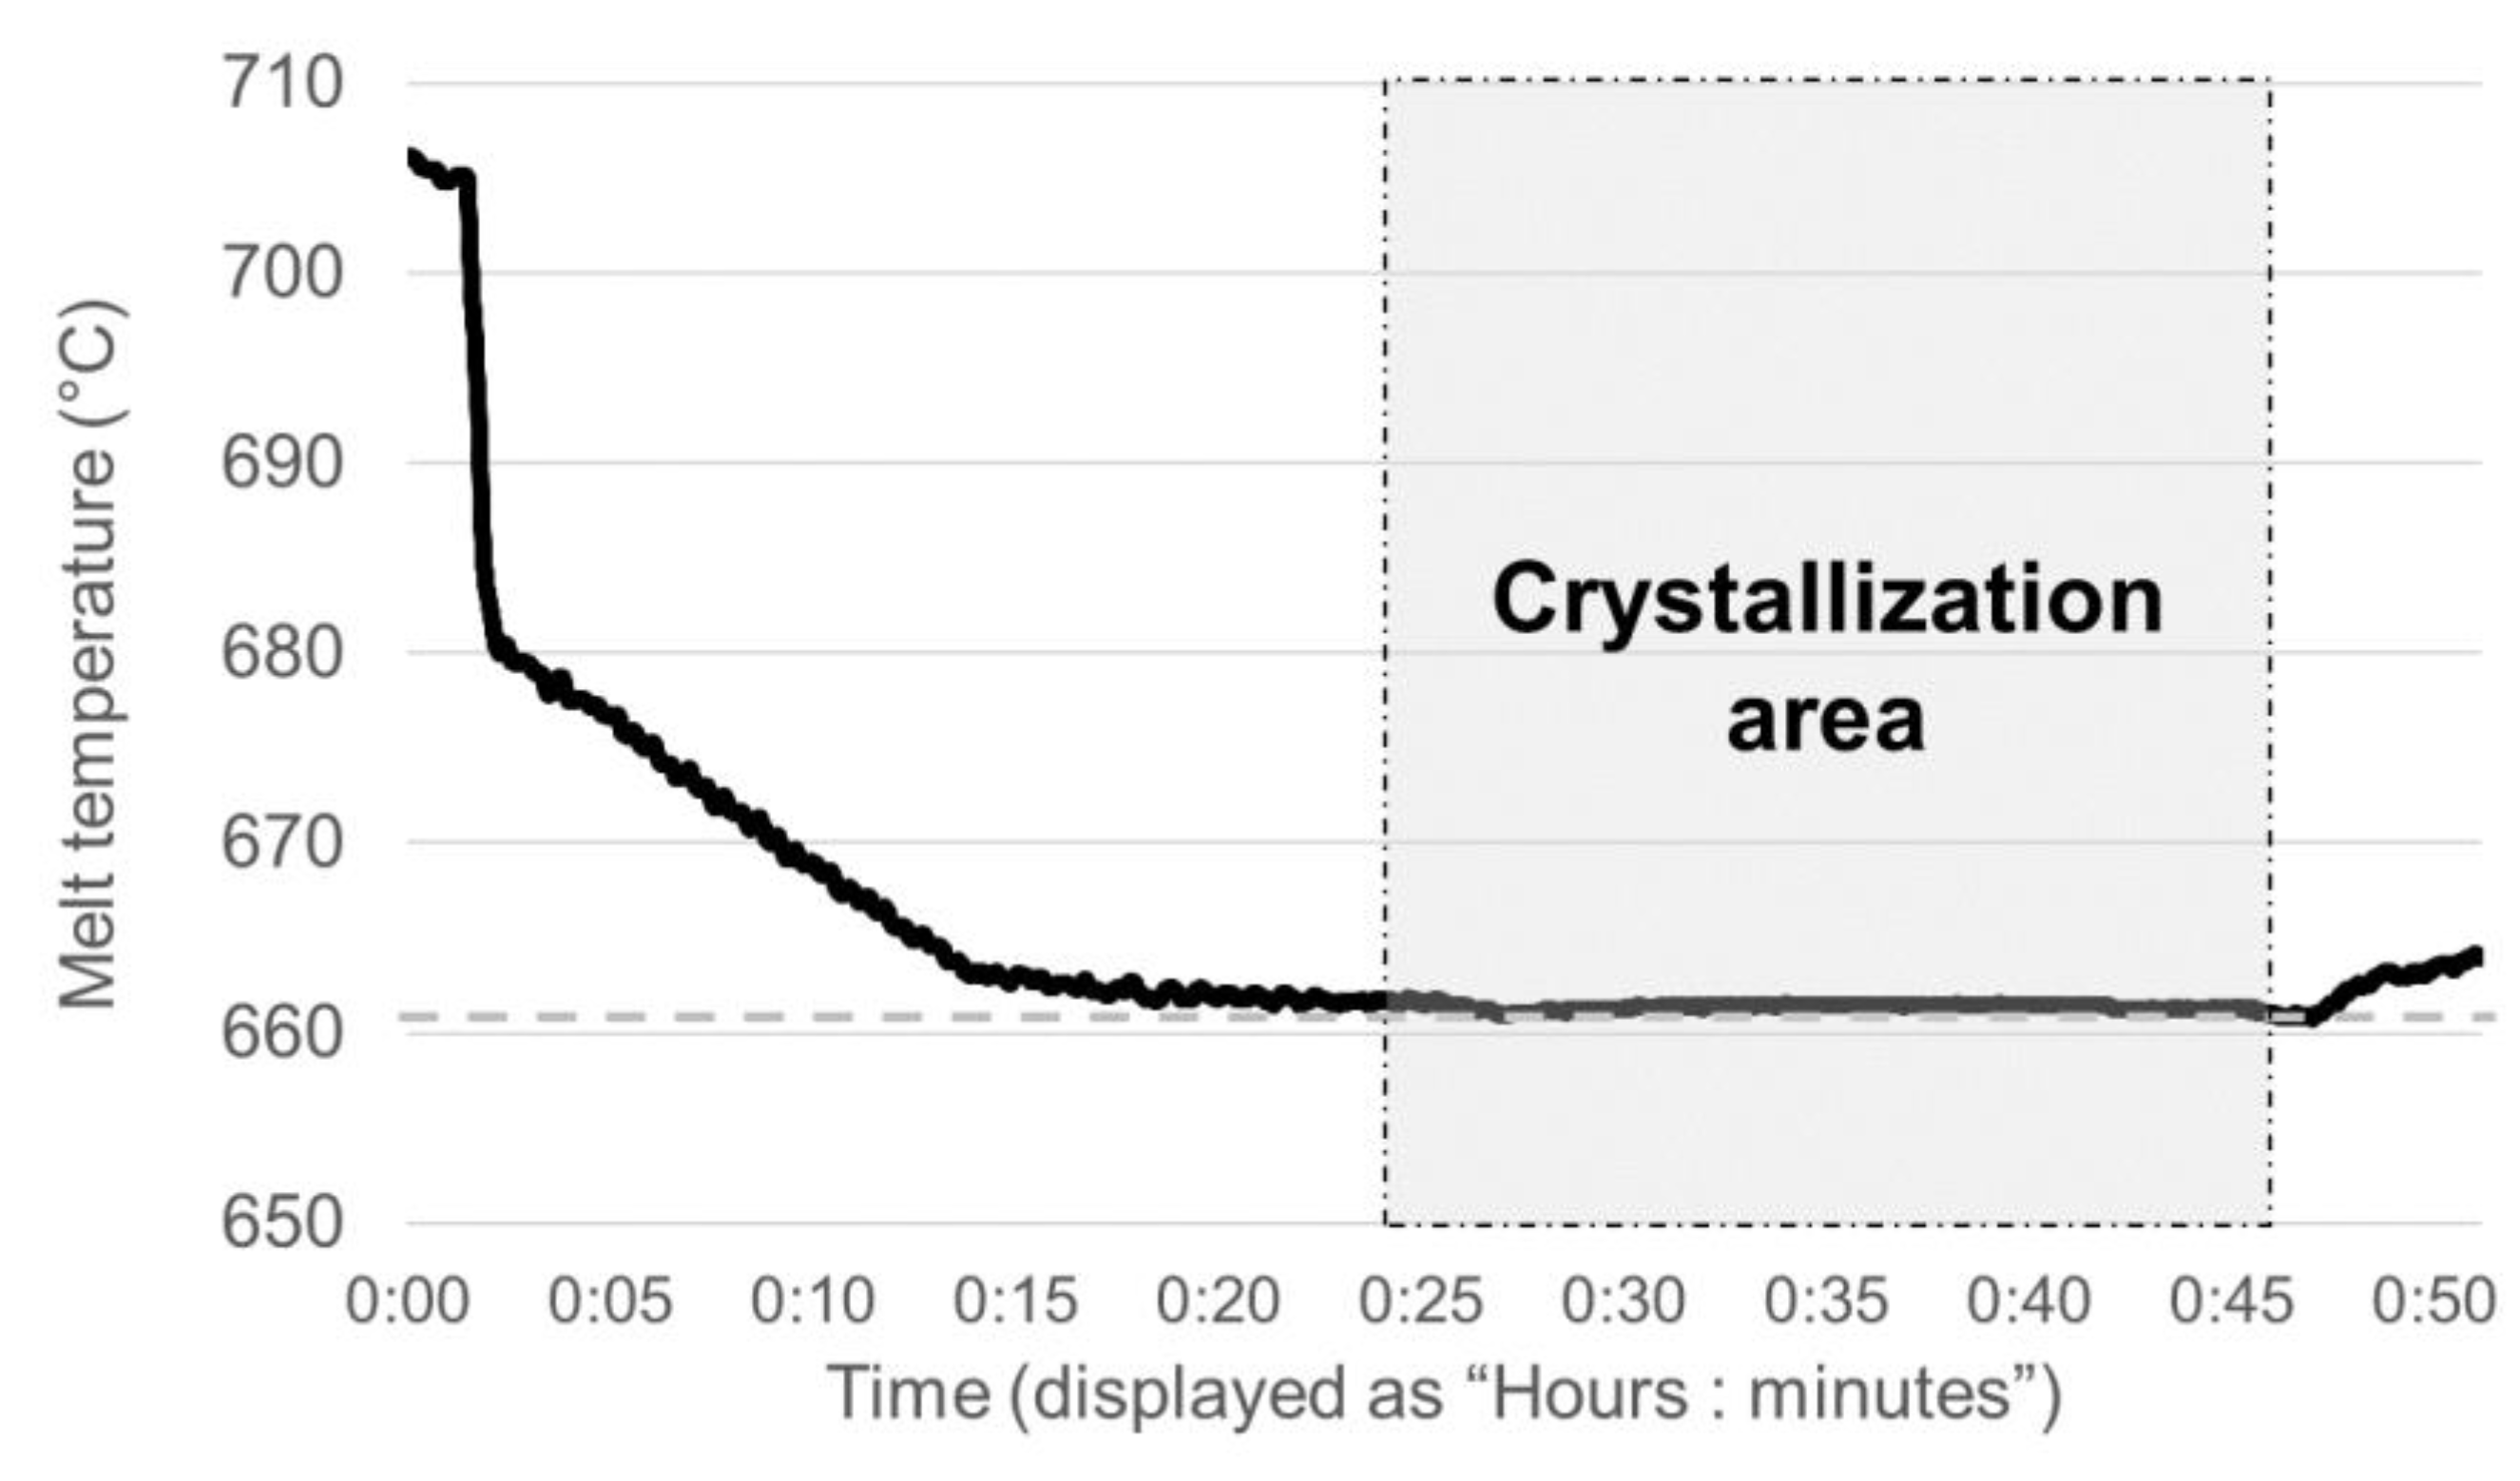
2.1.2. Experimental Methodology

Around 5.6 kg of the produced alloy were melted an A20 clay-graphite crucible coated with Boron nitride. The trial took place in an open resistance-heated furnace using argon as a protective atmosphere. Once the melt reached the process temperature, the Cooled-Finger was immersed in the molten bath. The rotation was then set fixed and the cooling gas flow initiated. After approximately 20 min into the crystallization phase (see the plateau in Figure 3), the process was interrupted, and the cooled-finger was lifted up along with the crystallized product. This processing time allowed the crystallization of circa 1 kg of high purity aluminum over the cooled finger, representing a yield of around 18%. The parameters used for the investigation of the effect of rotation on cooled-finger trials can be seen in Table 4 below. The rotation rate within the investigated interval did not change the growth rate significantly. Therefore, the effect of rotation on the purification of aluminum was not influenced by any decrease in the solid growth rate.
For the trials aiming at the investigation of the effect of each impurity as well as the interaction between the impurities, the process parameters were kept constant at 720 °C, 25 RPM, and 50 NL.min−1. Each trial system was repeated three times.
For all the conducted trials, a sample of the molten aluminum was taken before (designated as C 0 ) and after ( C L ) each trial. A third sample ( C S ) was later taken from the crystallized material. These samples were analyzed by OES (Optical Emission Spectroscopy, Spectro Analytical Instruments GmbH, Kleve, Germany). The purification ratio achieved in the trials was calculated according to Equation (8).
P u r i f i c a t i o n   r a t i o = 1 C S C 0 100
To control the crystallization time, a thermocouple was placed inside the melt (adjacent to the crucible wall) to record the melt temperature during the trials. By online monitoring of the “temperature vs time” curve, the crystallization time can be seen as the plateau (A) shown in Figure 3. For this exemplary temperature curve, the initial composition was Al-0.1% Fe, 0.1% Si, 0.1% Zn. However, at this impurity concentration level, the curve behavior is not influenced, as the sum of impurities is low enough to not drastically affect the liquidus temperature of the melt.

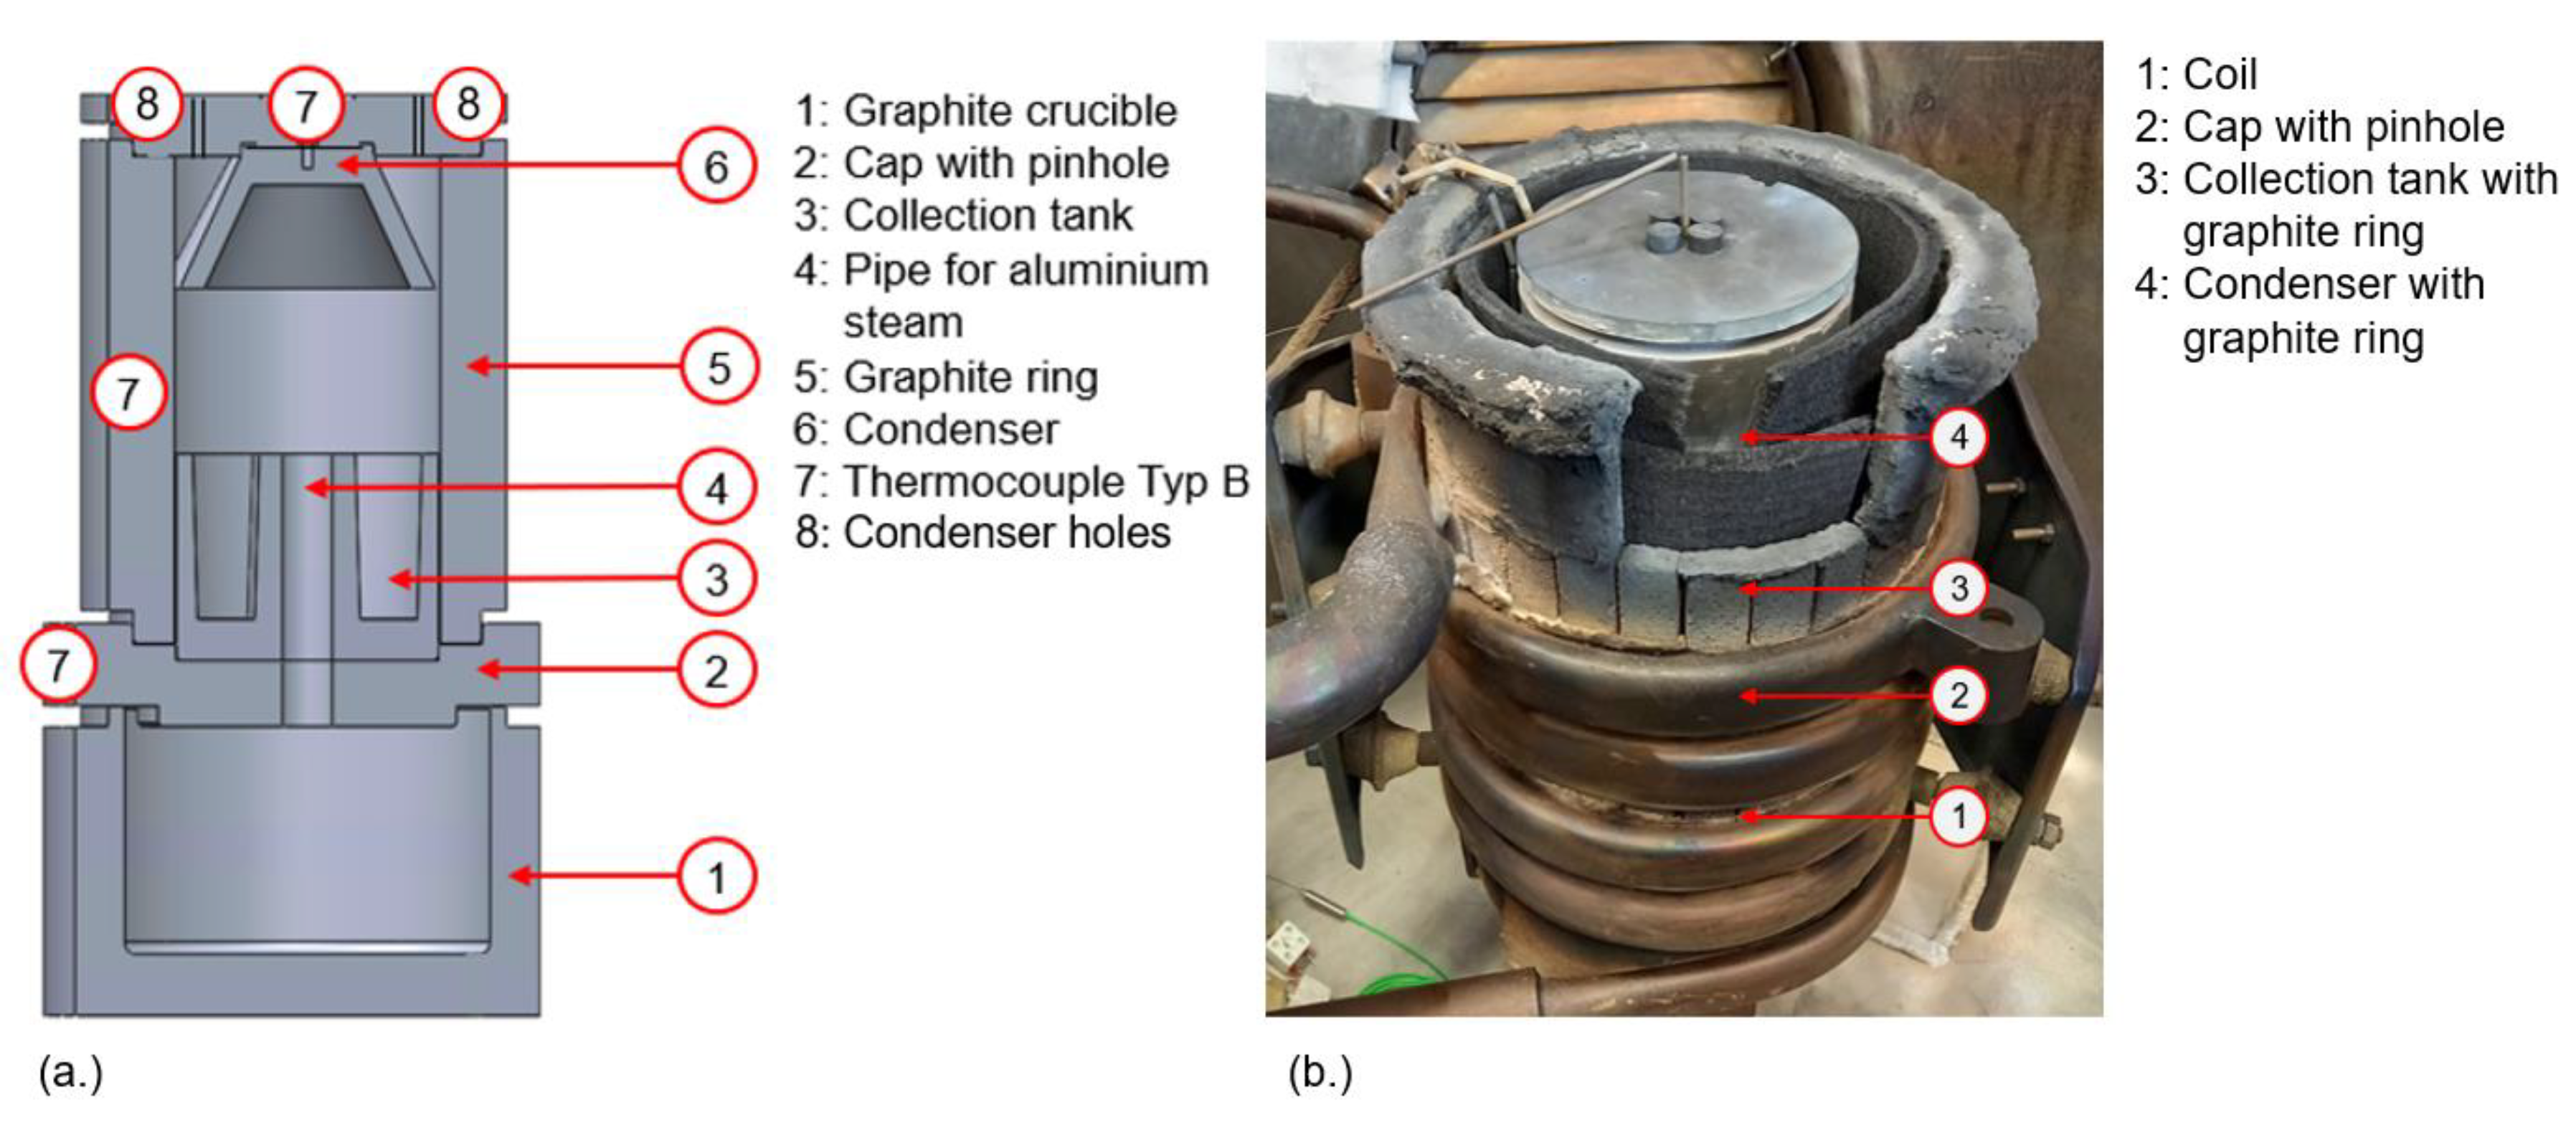
2.2. Vacuum Distillation

2.2.1. Initial Material

The ingot of commercial pure aluminum was cut into small pieces of approximately six centimeters. To provide clean surfaces and remove oil residues, splinter or other containments, the pieces were than milled off and later etched in diluted nitride acid, rinsed with water, and dried. The chemical composition of the initial aluminum samples before vacuum distillation, determined using ICP-MS (Inductively coupled plasma-mass spectrometry, model number G3665A), is illustrated in Table 5. Here, the selected impurities Fe, Si, and Zn have been in focus.

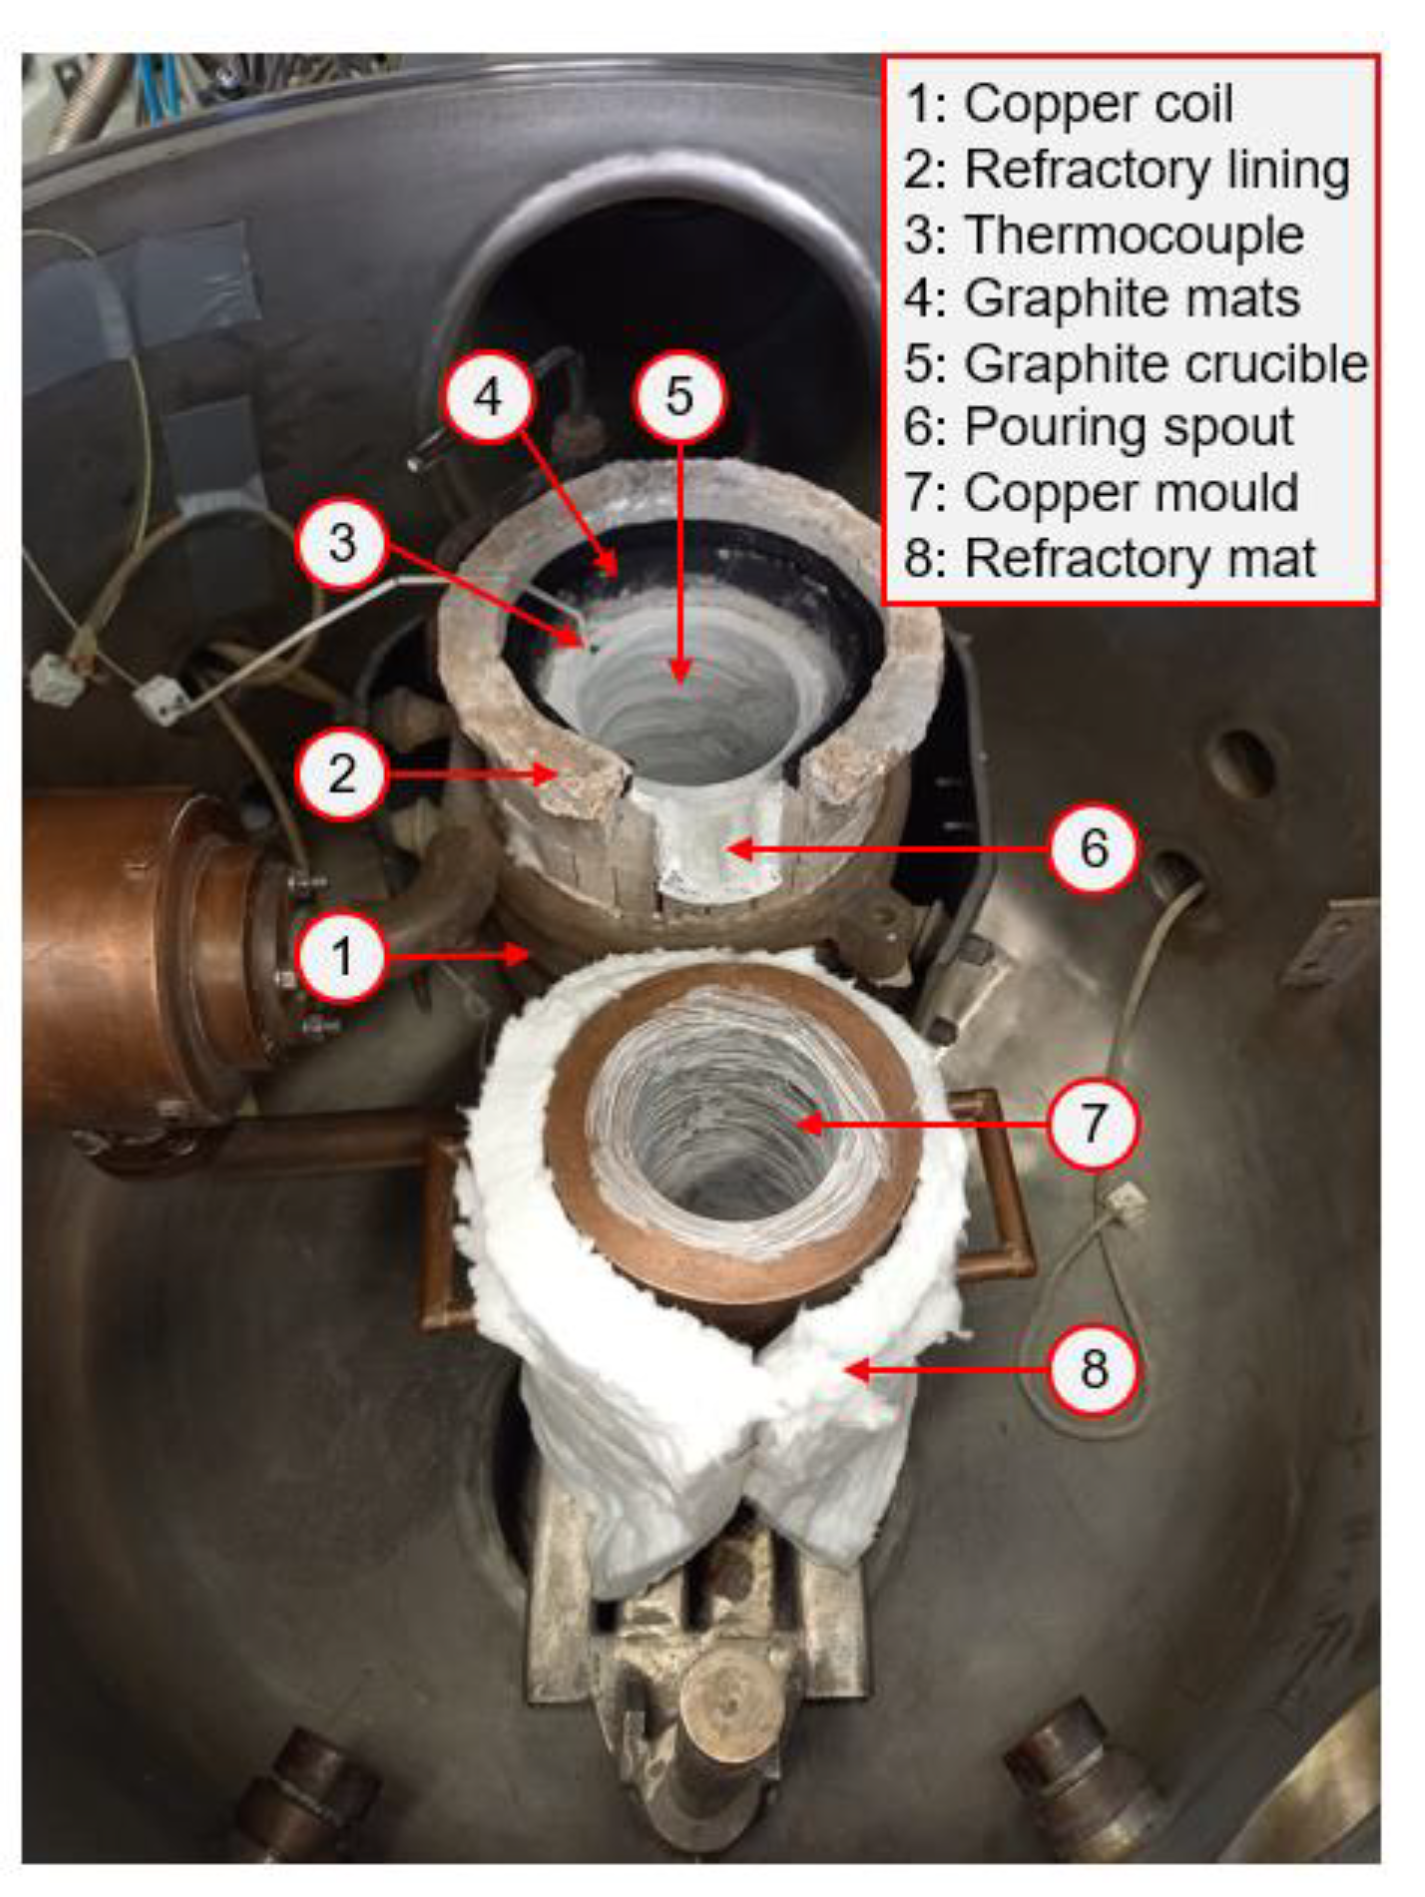
2.2.2. Experimental Methodology

The trials of both distillation stages, one to remove the volatile and one to remove the less volatile impurities than aluminum, took place in a vacuum induction furnace. Due to the high resistivity against the temperature as well as the material investigated, the setup was made of high purity graphite (99.999%). The temperature generated through the induction could be controlled by adjusting the electric current. The vacuum level was obtained by a set of mechanical pumps.
For the first distillation stage temperatures up to 1100 °C were applied. The experimental setup included, as seen in Figure 4, a high purity graphite crucible, coated internally with boron nitride. A tapping spout, also made of graphite, to cast the liquid aluminum in a copper mold after the trial ended, as well as a copper mold, encased in a refractory ceramic fiber mat to prevent contact with the coil, were installed. Since only a small amount of the material was evaporated in this first stage of experiments, not an individual condenser chamber but the internal surface of the furnace lid itself served as the condenser.
This series of trials was conducted under 0.1 mbar vacuum, and the setting temperatures at 800, 900, 1000, 1100 °C as well as 60 min of dwelling time. The trial of each temperature was repeated three times to validate the reproducibility of the experiment. During the dwelling time, the volatile impurities in aluminum, i.e., mostly Zn, evaporated from the melt surface and condensed on the internal surface of the furnace lid. At the end of the holding time, the furnace was flooded with argon and the aluminum was poured into the copper mold. When the aluminum cooled down, it was removed from the copper mold and weighted again. Using waterjet cutting the final sample was cut into three equal parts. Out of one, three thin slices were removed and sent for analysis through ICP-MS.
A schematic overview of the vacuum distillation equipment of the second distillation stage is shown in Figure 5. For this experiment the temperature of 1500 °C, the pressure of 0.1 mbar and a dwelling time of 60 min were applied. When aluminum cooled down, it was taken out of the furnace and cut into three thin slices by means of a water jet cutter. These slices were then chemically analyzed via ICP-MS. The material used in this stage was taken from the previous distillation stage. Many empirical improvements were conducted in the design and process refinement to achieve a stable distillation of aluminum. The most optimum conditions were used to perform the second stage distillation trial within this study.

3. Results and Discussion

3.1. Fractional Crystallization

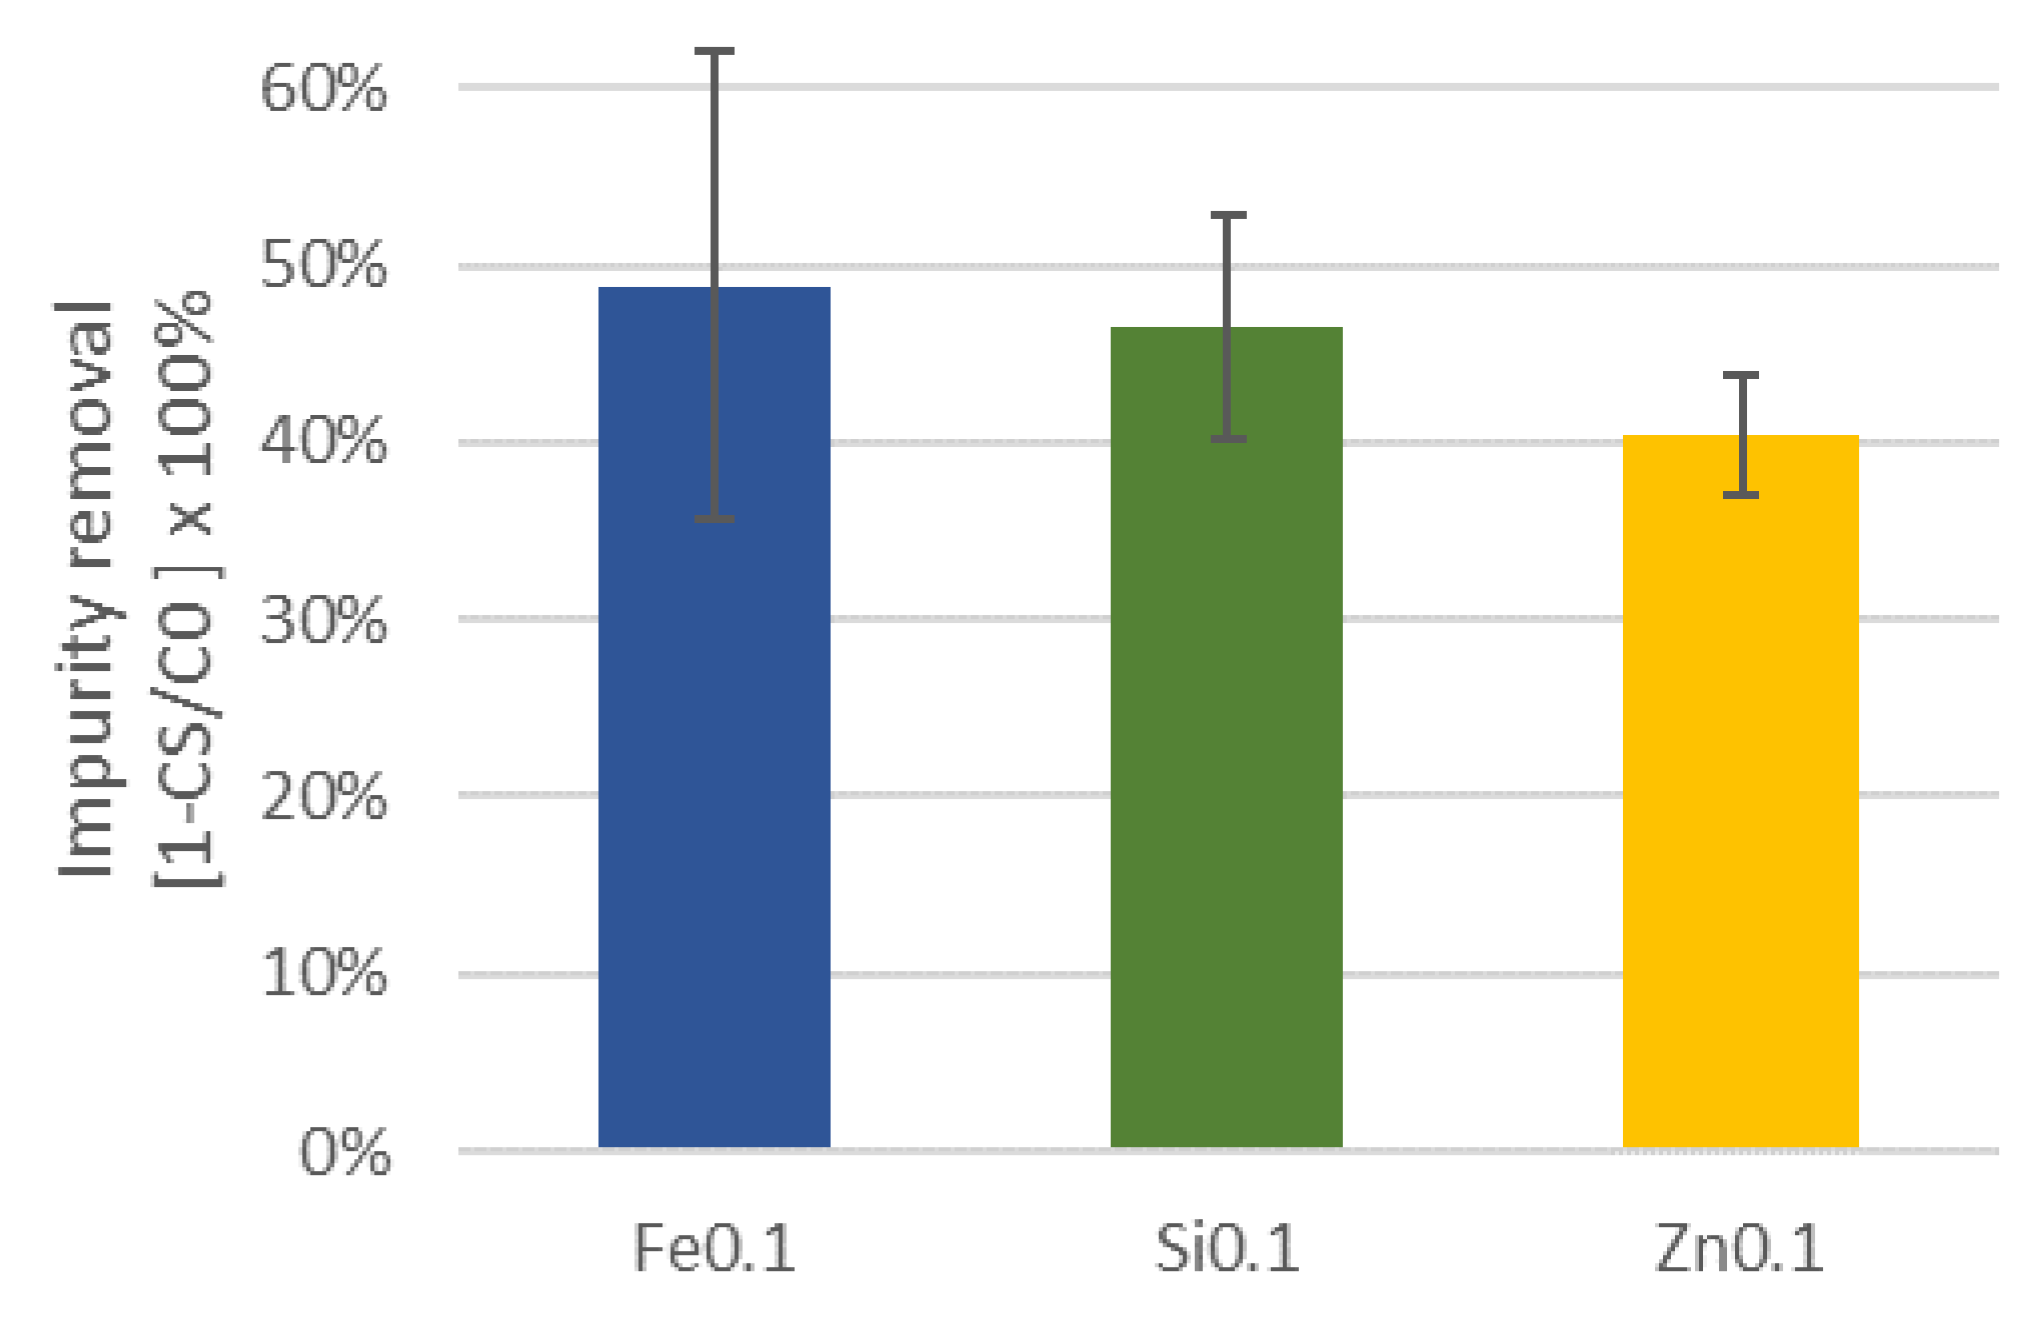
3.1.1. Influence of Impurity Type and Concentration on the Purification Ratio

The results shown in Figure 6 illustrate the different removal factors (1-Cs/C0) obtained for all the investigated impurities. It can be seen that this factor of each impurity in a binary system is correlated well with their distribution coefficient in aluminum (see Table 1), where Zn (highest k coef.) has the lowest impurity removal factor, followed by Si and Fe. Overall, the aluminum was purified from an initial purity of 3N up to 3N6, considering Fe as main impurity in the aluminum.
The following experimental results show a direct relation of the removal factor with the impurities concentration in the system. Figure 7 shows that for Zn, the removal factor is inversely proportional to the impurity concentration. Moreover, the removal factor reaches a seemingly constant value (41% for Zn) as it approaches a lower level of concentration.
The initial solute concentration seems to have two main influences during the crystallization: Firstly, it causes shifting from a planar/cellular growth behavior (seen at low solute concentration) towards a dendritic growth (usually seem at higher solute concentrations). This is illustrated in Equation (5) describing the supercooling in dependence on initial solute concentration (C0). This eventually causes the entrapment of solute between the dendritic arms, making it more difficult to be properly expelled into the bulk melt.
The second influence of a higher solute concentration is the increase in the thickness of the stagnant film formed at the solid-liquid interface during the crystallization. The stagnant film theory (BPS) can explain the sudden drop in the removal factor at higher initial solute concentrations, where an over-saturation of impurities at the growth front must have occurred, creating a much bigger layer of impurities ahead of the solidification front. This will increase the value of C0, then becoming equal to the solute concentration within the layer and directly affecting the purification results.

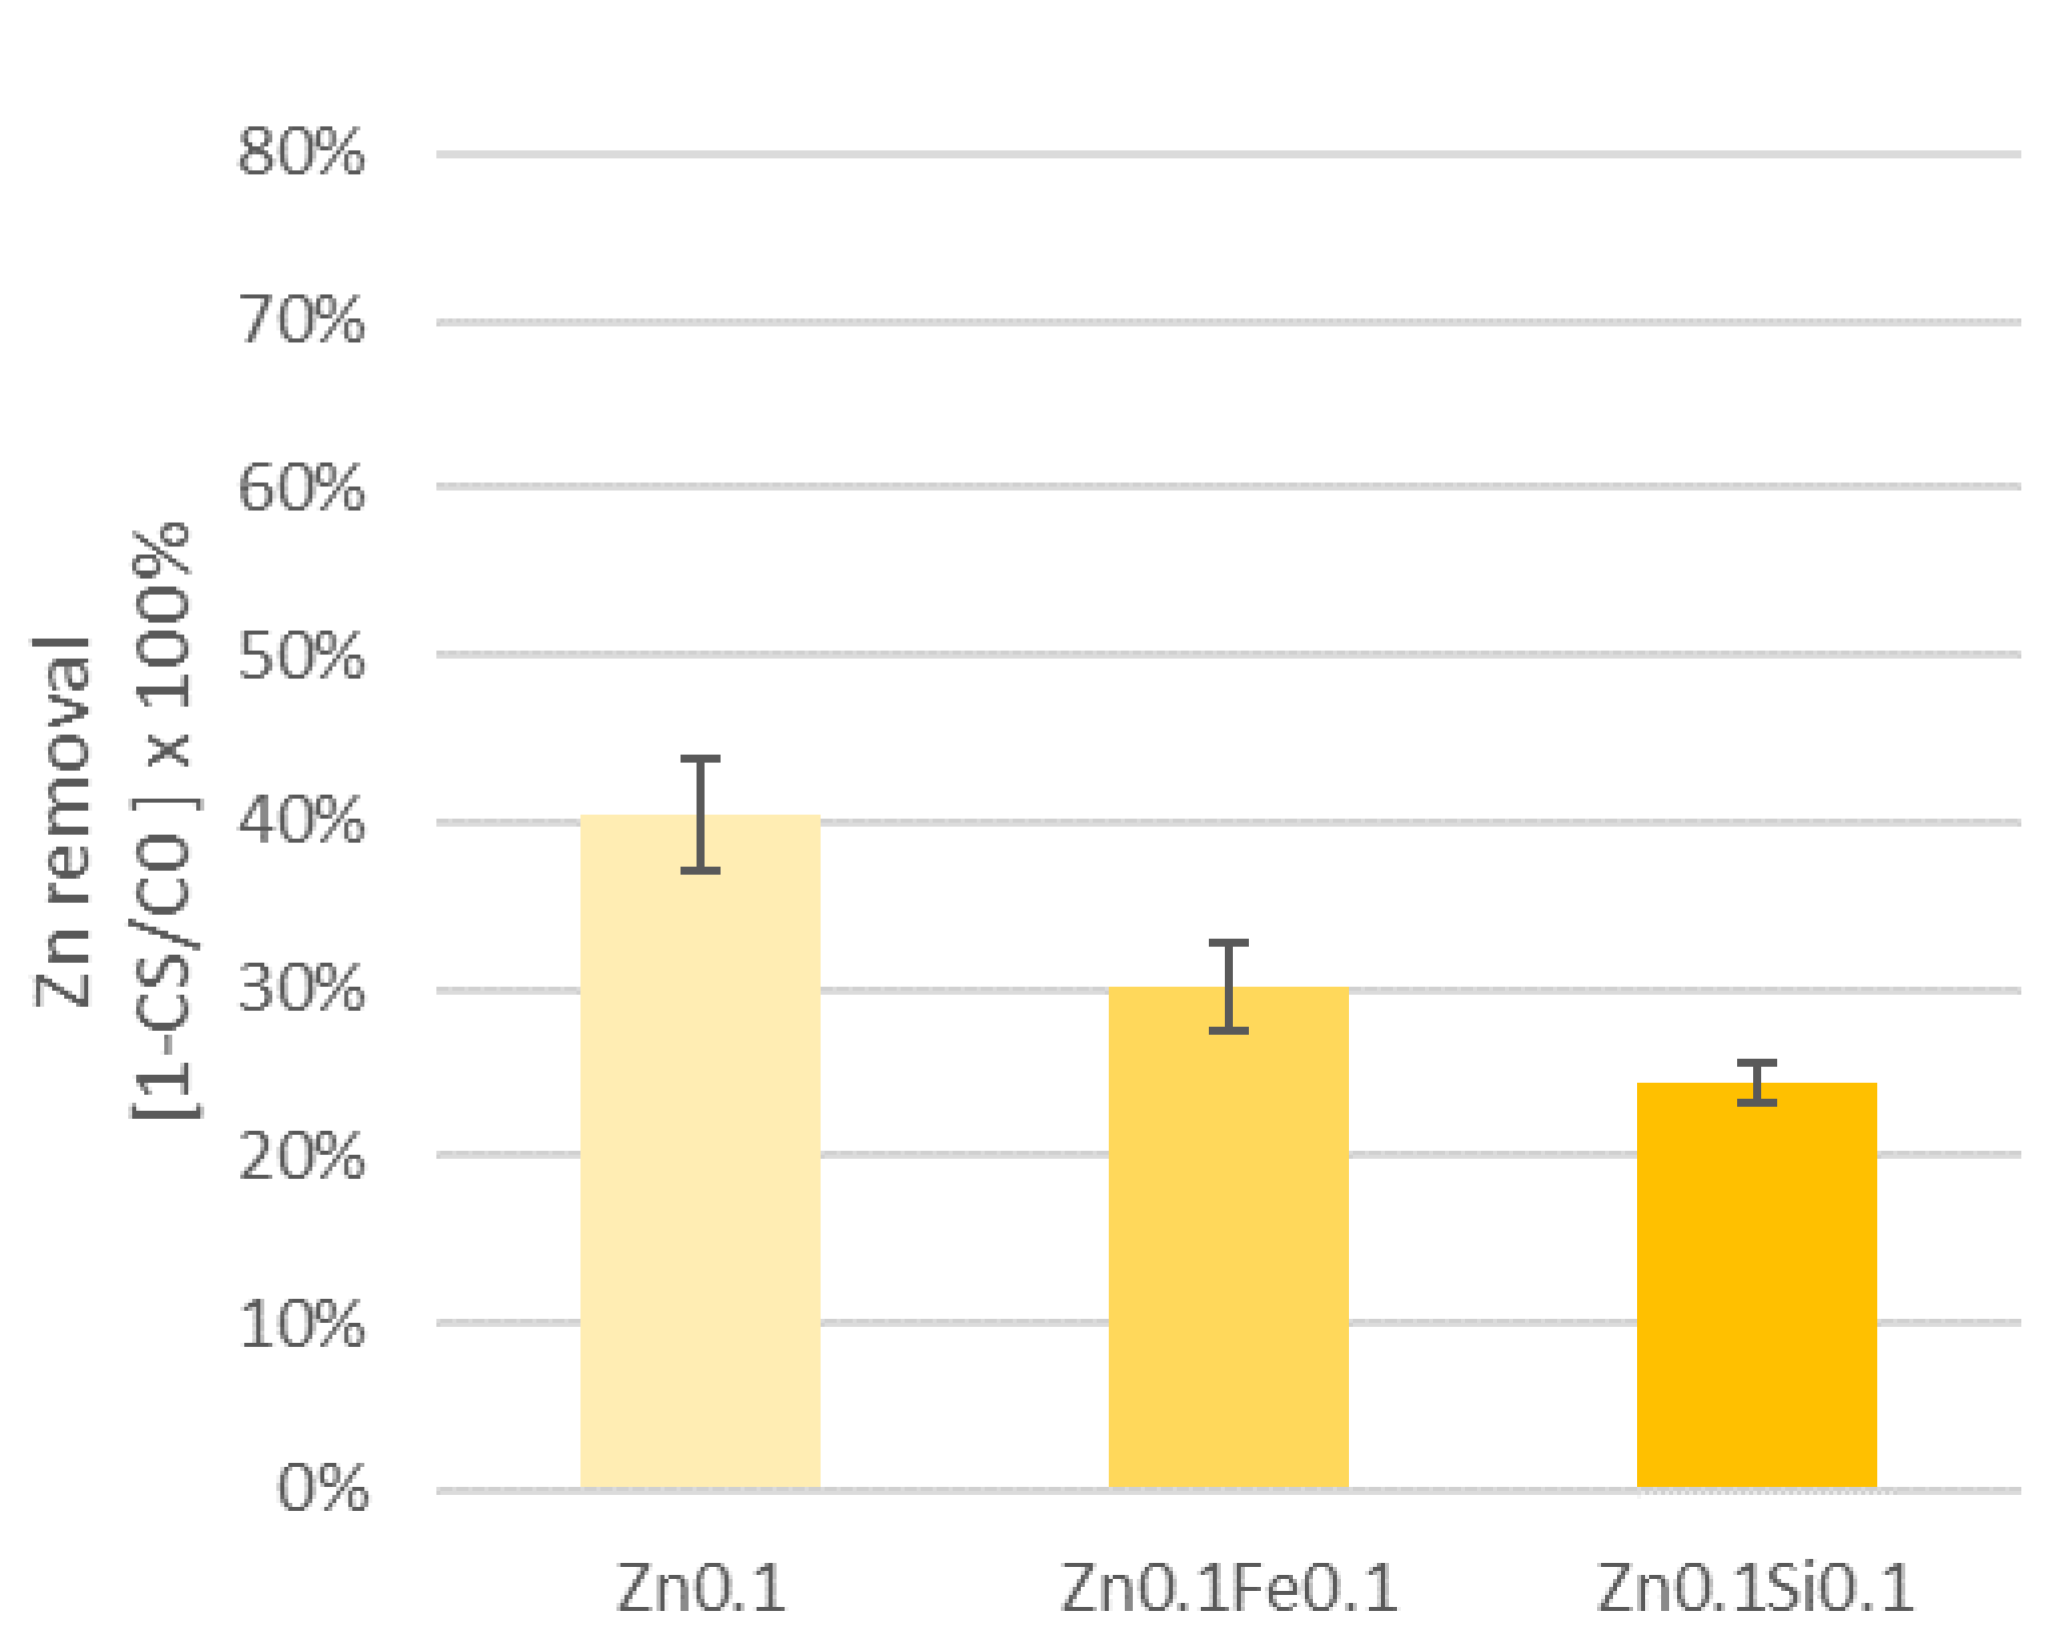
3.1.2. Effect of Accompanying Impurities on the Purification Ratio

The influence of accompanying impurities is shown in Table 6, where the solid solubility of each added third element in the main investigated impurity is depicted. These values were obtained from the binary phase diagram of each combination of impurity (obtained from FactSage 8.0, using FTLite Database). The maximum solid solubility for each investigated impurity in aluminum is shown in the first data row of the table. Having a high solubility means that the impurity tends to stay in the solid phase instead of moving towards the liquid. These values agree with the distribution coefficient (Table 1) and indicate that Fe has the lowest aluminum solubility (hence easier to be expelled towards the liquid), followed by Si and Zn.
Moreover, by comparing the solubility among the elements, it is possible to understand the interaction between different elements during the fractional crystallization process. For this, the solid solubility of each impurity (Y) in a second impurity (X) can also be observed in.
As shown in Table 6, this analysis aims to explain the changes in the purification factor of the second impurity (X) when a third impurity (Y) is added. As an example, according to the table below, the addition of Fe in a Al-Si system would have a positive effect on the removal of Si. This occurs because Fe has a high solid solubility in Si (65%), and since Fe also has a low solid solubility in Al (0.06%), the addition of Fe helps to remove the Si out of the solid phase.

Experimental Results

The results plotted in Figure 8 show the removal factor of each investigated impurity, for each ternary system Al-X-Y, after three times repetition and calculating the average as well as the standard deviation values.
These diagrams focus on the comparison between the effect of a second impurity added to the ternary systems on the removal of the first impurity. The details have been explained as following.
Effect of second added impurities on the removal of Fe: The median removal ratio of iron in the Al-Fe binary system containing 0.1 wt.% of Fe was 49% (Figure 8a). When an extra 0.1 wt.% of a second impurity (Si or Zn) was added to the system, an overall reduction in the removal ratio of Fe was expected, as now the total impurity in the system doubled. In reality, however, the average removal of Fe was benefited by the addition of a second impurity. This beneficial effect is in the case of Zn-addition only 4% and very slightly. That can be explained by the very high solid solubility of Zn in both Al and in Fe. This combination increases the likelihood of Zn capturing in the Fe, while at the same time remaining within the solid phase.
The removal ratio of Fe increased when Si was added to the system. In this system, the average removal ratio of Fe was 60% for the Al-Fe-Si ternary system. As the Si has a reasonably good solid solubility in Fe, and a poor solid solubility in Al, the addition of Si is beneficial for the removal of Fe from the system. In this situation, Si and Fe tend to be bound together out of the solid phase.
Effect of second added impurities on the removal of Si: The average removal ratio of silicon in the Al-Si binary system containing 0.1 wt.% of Si was 46% (Figure 8b). When Fe was added to this system, the Si removal ratio increased to 51%. Similar to the reasons presented previously, the very high solid solubility of Fe in Si could also have played a role in the increase of the Si removal ratio, as both Fe and Si have quite low solid solubility in Al, they tend to be segregated towards the liquid phase upon crystallization.
Furthermore, the results for the Si removal decreased when of Zn was added to the Al-Si system. For those systems, the Si removal had an average of 46% when Zn was added. Since, according to the phase diagrams, the solid solubility of Zn in Si is virtually nonexistent, this effect can just be explained by the increase in the sum of impurities, impeding generally the refining process.
Effect of second added impurities on the removal of Zn: The same explanation described above also applies to the case of Zn removal (Figure 8c). While a median value of 40% of Zn was removed in the binary Al-1%Zn system, the removal ratio of Zn was lower for all other systems, dropping to 24% at Si-addition, and 30% at Fe-addition. The very high solid solubility of Zn in Al is most likely the reason for the negative influence of any of the additional elements on the removal of Zn, as it has a high tendency to remain in solid solution in Al.
Overall interaction effect between the investigated impurities: A qualitative summary of the experimental results regarding the removal efficiency of each investigated element in aluminum can be seen in the first row of Table 7. In addition, the positive or negative influence of an added third element on the removal ratio of the target impurity can be qualitatively compared as well.
To better understand the table above, the following example can be made. The removal of Fe from an Al-Fe system was the best removal among the three binary systems investigated, hence it received “+ + +”. When Si was added to the system, the removal of Fe increased and therefore received the classification “+ + + +”. However, when Zn is added, the Fe removal remained nearly unchanged and a “+ + +” was given. In conclusion, the table shows that the removal of Fe and Si are enhanced by the addition or presence of a third element. For Zn, this effect could not be observed.

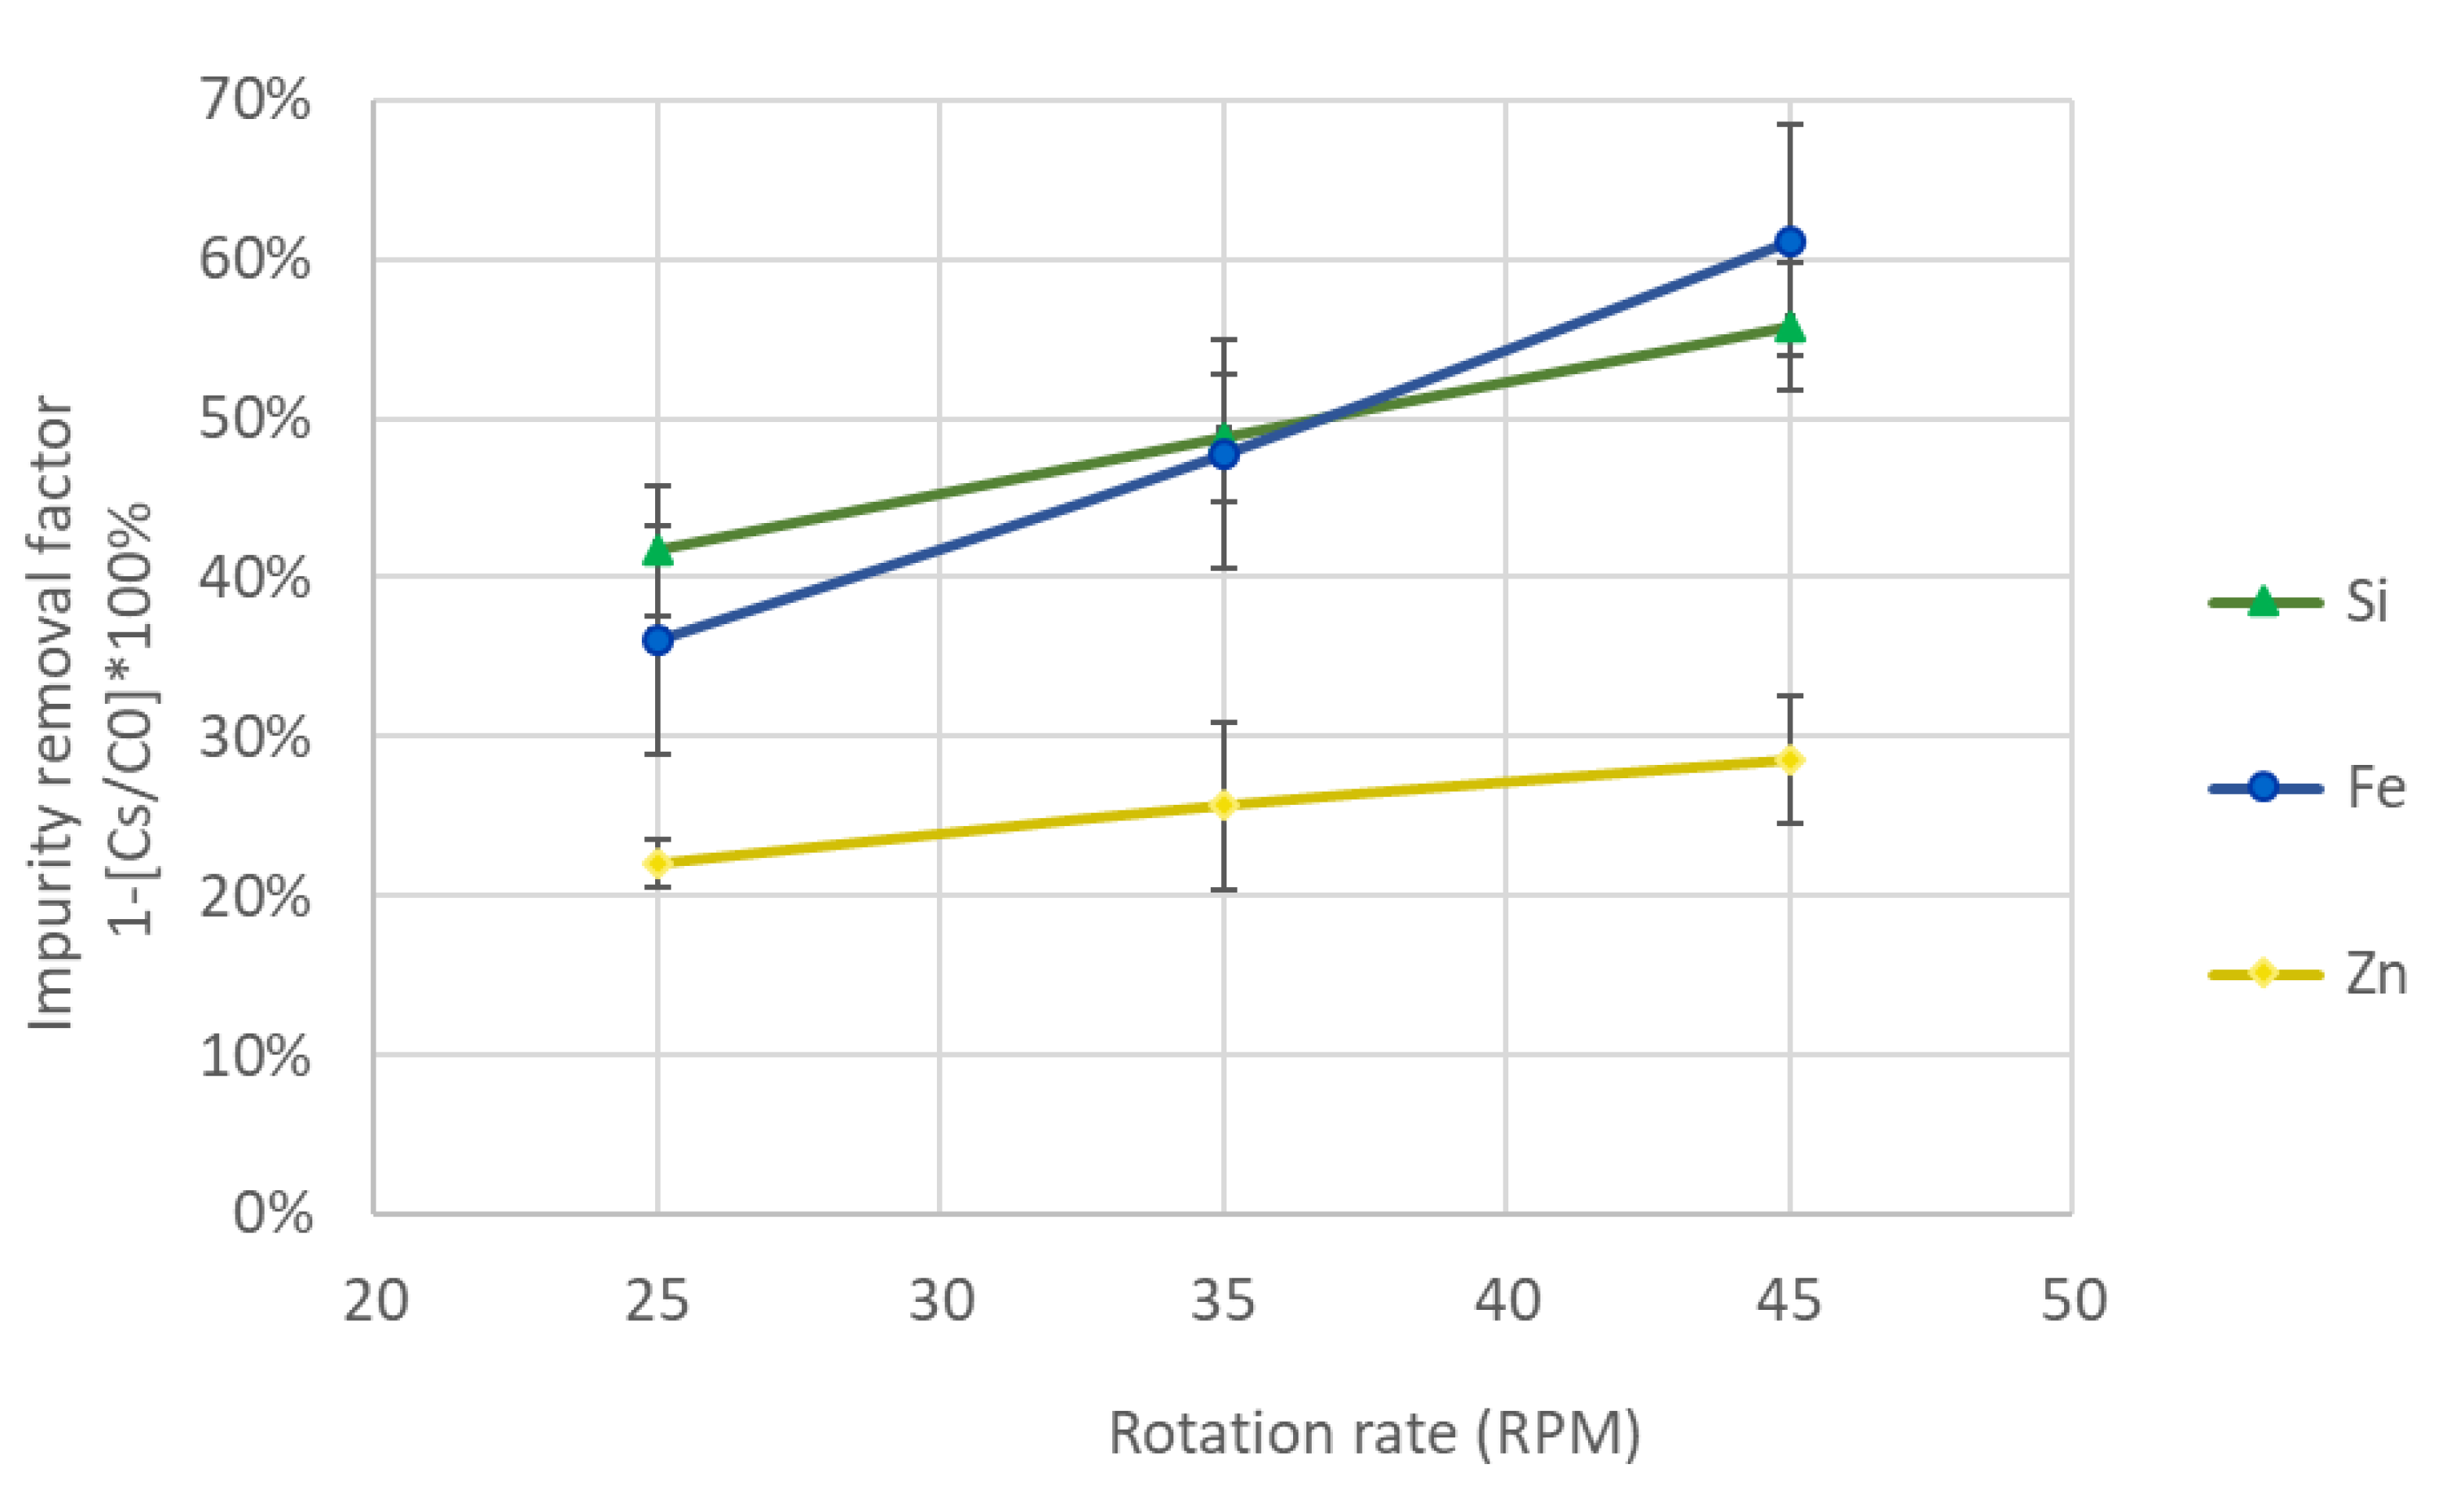
3.1.3. Influence of Rotation Rate on the Purification Ratio

The reduction factor of different impurities in aluminum via Cooled-Finger at different rotation rates has been illustrated in Figure 9. In these graphs, a considerable rise in the reduction factor (%) was observed with an increasing rotation rate. The increase in rotation rate promotes a higher convection and mass flow ahead of the solidification front, assisting the dilution of the expelled impurities towards the bulk melt, hence decreasing the thickness of the formed diffusion layer. As shown in Equation (3), the decrease in the diffusion layer thickness has a direct effect on the effective distribution coefficient and therefore on the purification ratio.
The reduction factor of each impurity contained in the system Al-Fe-Si-Zn (see Table 3) partially follows the results expected from their individual distribution coefficients. While the impurities with a lower k coefficient (Fe and Si) are more removed from the crystallized aluminum, the impurity with the highest distribution coefficient (Zn) has lower removal efficiency.

3.2. Vacuum Distillation

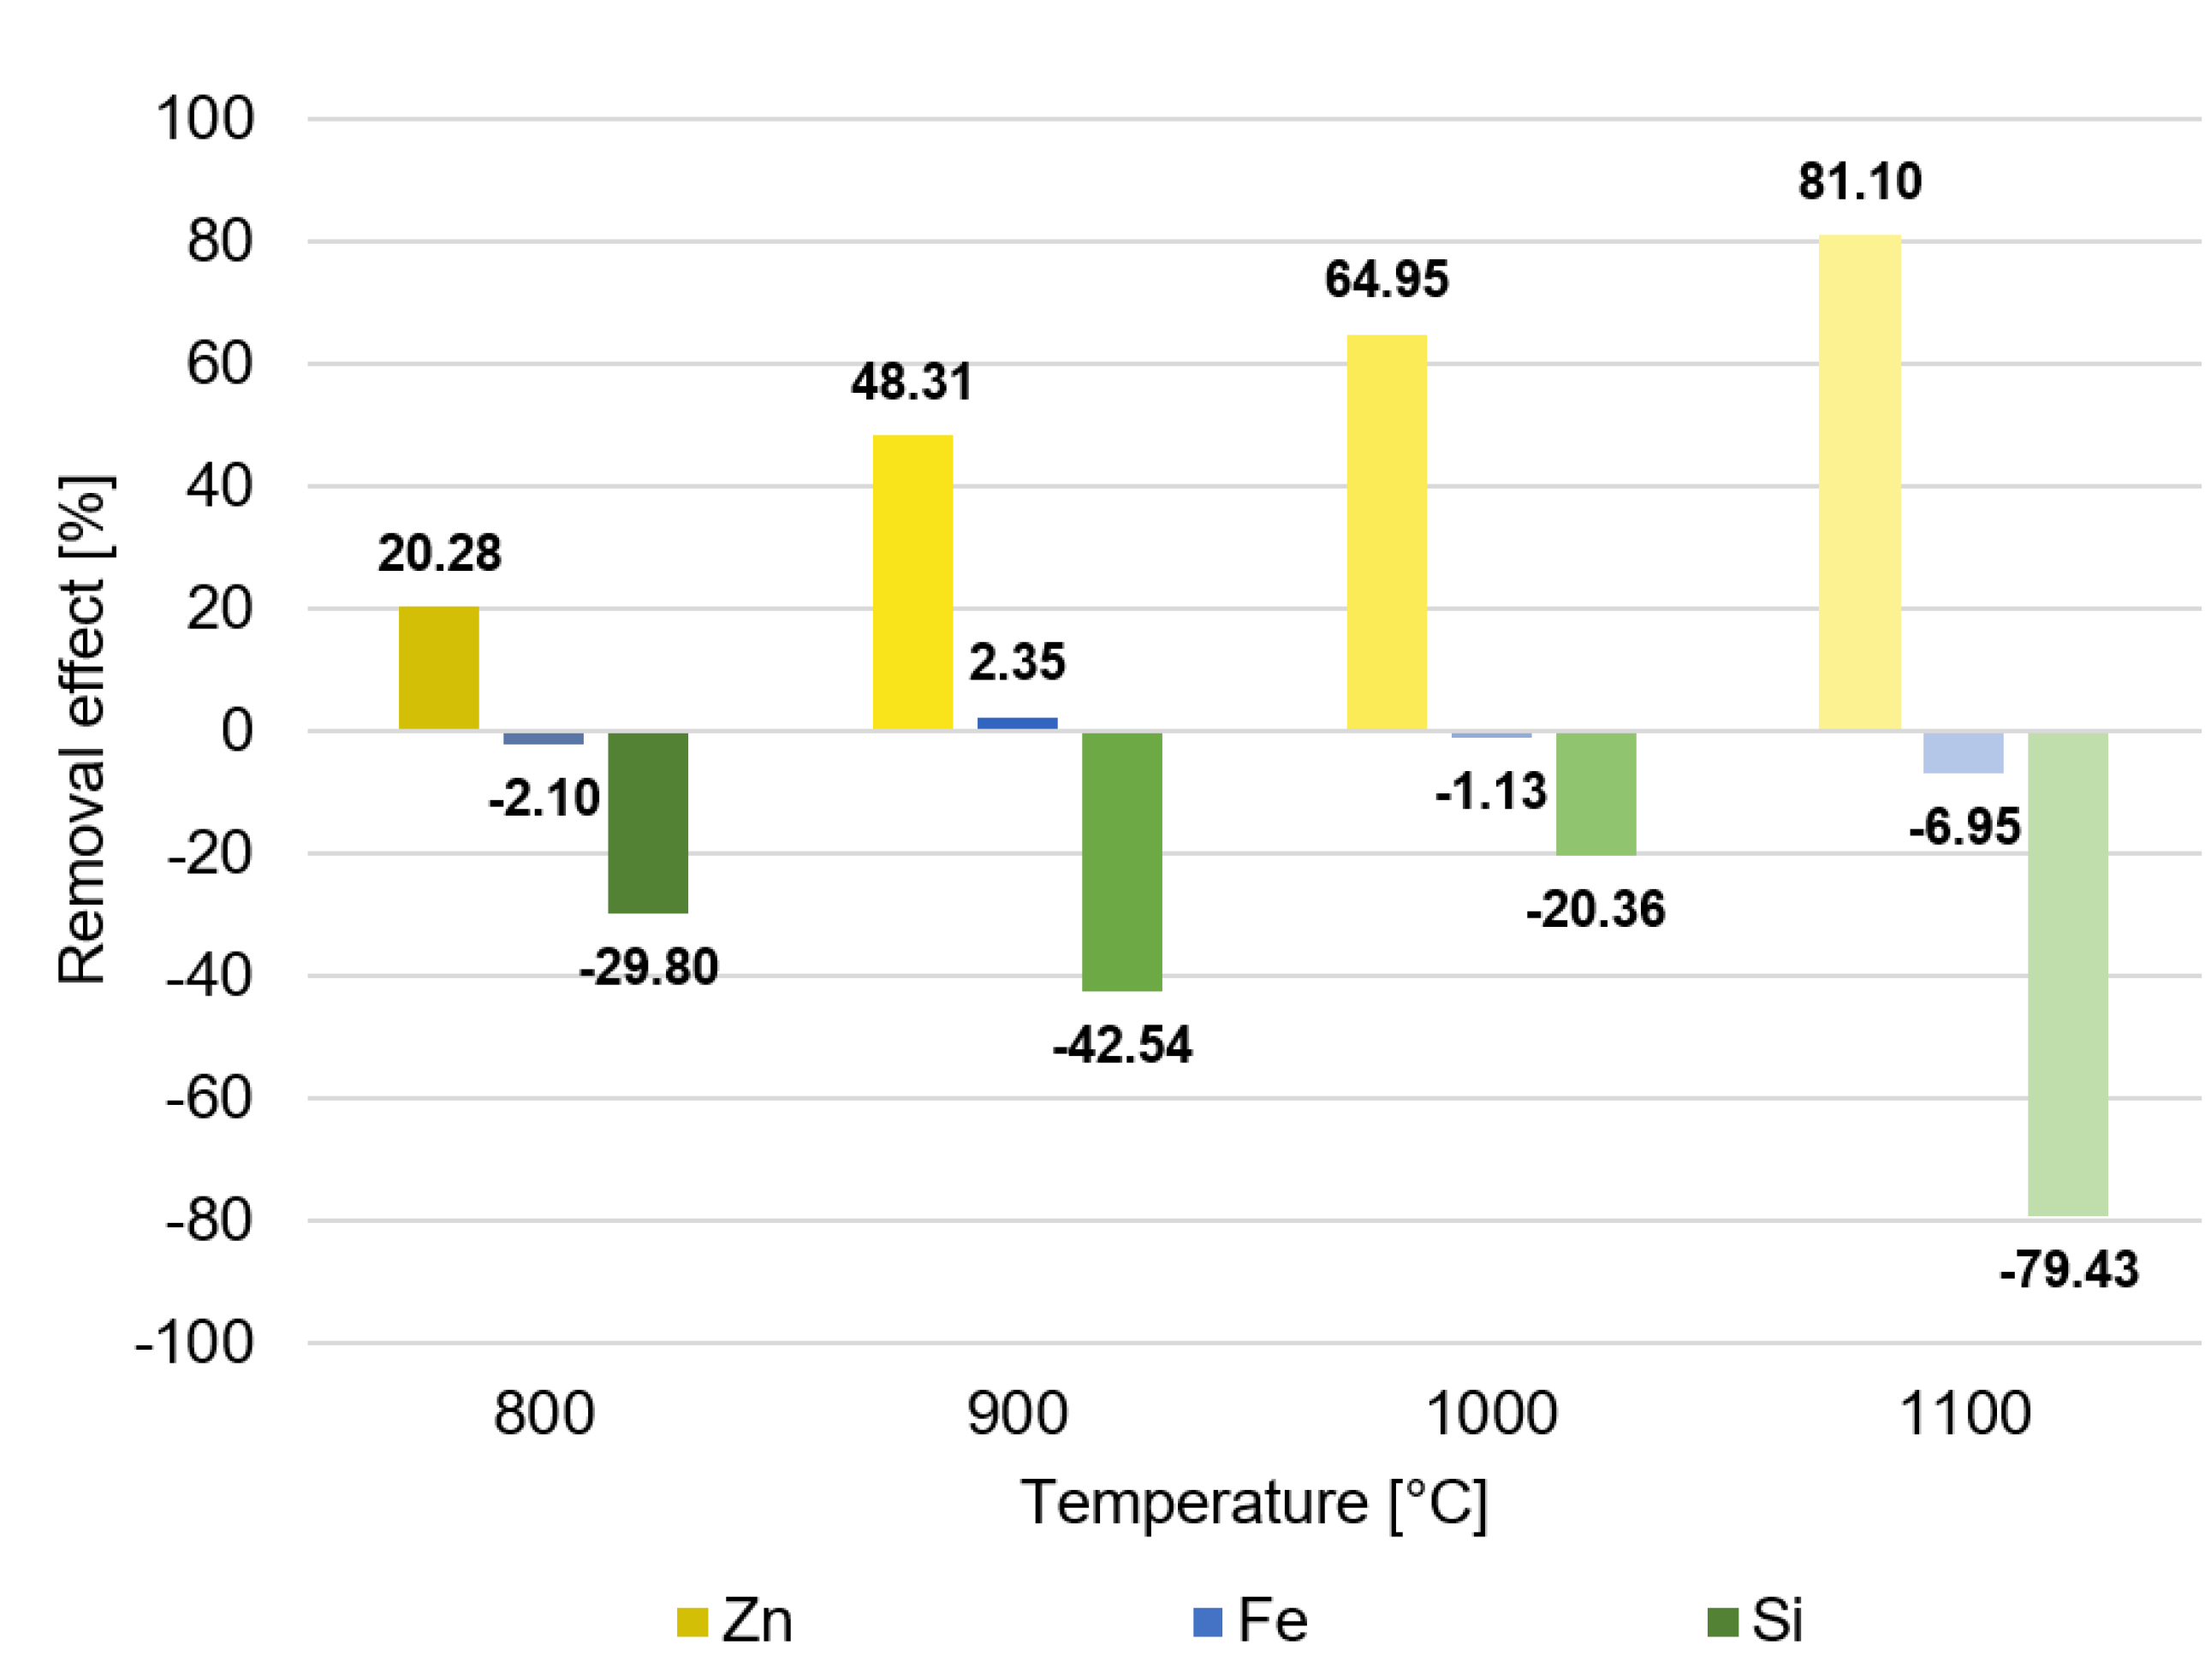
3.2.1. 1st Distillation Stage

Figure 10 illustrates the removal effect of the investigated impurities from aluminum during the first step of distillation. To determine the removal effect, the individual contents of the initial sample are related to those of the trial sample and expressed in percentage. See Equation (9).
E r e m o v a l = 100   % e t   e i · 100   %  
where e i represents the content of the respective element in the initial- and e t in the trial sample. If the removal effect has a positive value, it means that the impurity content has been decreased, compared to the initial sample. A negative value indicates a higher impurity content, compared to the initial sample.
As seen, the removal of zinc is ever growing from 20.28% to 81.1%, with rising the temperature. Iron, as the less volatile element than aluminum, was not removed even at the highest trial temperature. The enrichment of maximum 6.95% of iron, as well as the removal of 2.35% in the trial of 900 °C resulted from residual material in the crucible. The results of the silicon content should, by taking the literature research into account, hardly differ from those of the iron content since both elements showed similar vapor pressures and separation coefficients. Nonetheless, a huge increase in silicon, up to 79.43%, was observed. This unexpected extreme increase is supposed to be due to the external contamination from the refractory mat that was wrapped around the copper mold.

3.2.2. 2nd Distillation Stage

Results of the removal of aluminum from the less volatile elements in the second distillation stage have been shown in Figure 11. The iron and silicon contents in the condensed aluminum after evaporation were reduced by about 86.25% and 62.69% respectively. This indicates that the aluminum successfully evaporated, while the less volatile elements, e.g., iron and silicon, remained in the melt.
Surprisingly, the content of the rest of zinc, which is expected to be distilled accompanied by aluminum, also decreased by about 68.81%. The reason for that could be found in the small holes in the lid of the condenser, seen in Figure 5. These ensure that part of the vaporized gas jet could escape from the setup so that there was no equilibrium between the crucible and the upper part of the setup. Zinc evaporated well before aluminum and reached the upper part of the setup much earlier. Since there was very little zinc left in the samples after passing through the first distillation stage, the gas phase of zinc was also not large. The gas-phase was probably attracted by the suction of the vacuum pumps, escaped through the holes, and was thus discharged from the process.
Overall, a reduction of all three examined impurities has taken place over the two distillation stages. Zinc has been removed in both stages, while iron and silicon were only reduced in the second distillation stage. Table 8 reveals the qualitative influence of the different distillation stages on the impurity removal in aluminum. In this table, it is seen that Zn was greatly reduced from their initial concentration in the first stage, followed by a further smaller reduction in the second stage of distillation. Fe and Si were not reduced in the first stage and were rather reduced in the second stage of distillation. Silicon, however, did not have a reduction factor as good as Fe had. Overall, the “+” markers give a qualitative indication not only on the stage in which the impurities were removed, but also the comparative degree in which they were removed.
After undergoing both distillation stages, the purity of the aluminum reaches a value of 3N5 in comparison to the initial sample with 2N8.

4. Conclusions and Outlook

The cooled-finger process effectively removed the iron and silicon impurities, while having lower removal efficiency for zinc. This relates to the distribution coefficient of the impurities. Increasing the rotation rate improved the overall impurity removal for all elements, but the removal of zinc was still low. The vacuum distillation process has successfully removed zinc in the first stage of distillation. The removal of iron and silicon required a further distillation stage to reach lower impurity level. Zinc has been removed in the second distillation stage as well. Therefore, it would be advisable to investigate in further experiments whether the zinc can be purified in the second distillation stage as effectively as in the first distillation stage. If this is the case, the aluminum could be purified with a single-stage distillation, resulting in significant energy and time savings. Further an increase in temperature or decrease of the pressure could result in a higher purity. However, it is important that the temperature does not exceed the boiling point of iron and silicon.
Vacuum distillation is able to remove zinc much more effectively than the cooled-finger fractional crystallization method. The removal of iron is also better via vacuum distillation. However, vacuum distillation requires several repetitions and high temperatures or very low pressures, which results in high energy consumption. It is therefore recommended to combine both processes. To remove the zinc, aluminum is recommended to be treated through a low temperature of vacuum distillation, followed by fractional crystallization using the cooled-finger technique to separate iron and silicon effectively.

Author Contributions

Conceptualization, D.C.C. and S.F.; methodology, D.C.C. and M.G.; Experimental investigation, D.C.C. and M.G.; writing—original draft preparation, D.C.C. and M.G; writing—review and editing, D.C.C., S.F. and M.G; supervision, S.F. and B.F.; principal investigator, B.F. All authors have read and agreed to the published version of the manuscript.

Funding

This research was funded by DFG (Deutsche Forschungsgemeinschaft) grant number DFG FR 1713/43-1.

Conflicts of Interest

The authors declare no conflict of interest.

References

  1. Kékesi, T. International Motivation and Cooperation for Research in the Ultra-High Purification of Metals. Eur. Integr. Stud. 2002, 2, 109–126. [Google Scholar]
  2. Hoshikawa, H.; Megumi, T.; Tabuchi, H.; Sasaki, K.; Tomaru, T.; Shintomi, T. Magnetoresistance of 5N, 6N, and 6N8 high purity aluminum. Proc. AIP Conf. Proc. 2012, 1435, 140–147. [Google Scholar]
  3. Tanaka, I.; Hoshikawa, H.; Megumi, T. Refining Technology and Low Temperature Properties for High Purity Aluminium; Sumitomo Chemical Co., Ltd.: Tokyo, Japan, 2013; pp. 1–12. [Google Scholar]
  4. Kieft, R.; Bergstrom, T.; Le Brun, P.; Friedrich, B.; Oygard, A.; Pisch, A.; Rombach, G.; Ryckeboer, M.; De Schutter, W. Aluminum Purification. In Proceedings of the ASEM Workshop on Clean Technologies, Hanoi, Vietnam, 3–6 November 2004; pp. 1–10. [Google Scholar]
  5. Rodriguez-Rojas, M.J.; Friedrich, S.; Curtolo, D.C.; Friedrich, B. Alternative fractional crystallization-based methods to produce high-purity aluminum. J. Mater. Res. Technol. 2021, 12, 796–806. [Google Scholar]
  6. Curtolo, D.C.; Friedrich, S.; Bellin, D.; Nayak, G.S.; Friedrich, B.J.M. Definition of a first process window for purification of aluminum via “Cooled Finger” crystallization technique. Metals 2017, 7, 341. [Google Scholar] [CrossRef]
  7. Mohamed, S.R.; Friedrich, S.; Friedrich, B. Investigation of Process Parameters in a Vacuum Distillation Setup to produce High Purity Magne-sium. In Proceedings of the EMC, Düsseldorf, Germany, 23–26 June 2019; p. 1. [Google Scholar]
  8. Zavartsev, Y.D.; Zagumennyi, A.; Koutovoi, S. Effective segregation coefficient in cluster crystallization model. J. Cryst. Growth 2007, 303, 110–113. [Google Scholar] [CrossRef]
  9. Fredriksson, H.; Akerlind, U. Solidification and Crystallization Processing in Metals and Alloys; John Wiley & Sons: Hoboken, NJ, USA, 2012; pp. 71–77. [Google Scholar]
  10. Hashimoto, E.; Ueda, Y.; Kino, T. Purification of ultra-high purity aluminum. Le J. de Phys. IV 1995, 5, C7–C153. [Google Scholar] [CrossRef] [Green Version]
  11. Widiatmo, J.V.; Harada, K.; Yamazawa, K.; Arai, M.J.M. Estimation of impurity effect in aluminium fixed-point cells based on thermal analysis. Metrologia 2006, 43, 561. [Google Scholar] [CrossRef]
  12. Hannibal, W.; Ibe, G.; Kurre, K.; Peychal-Heiling, H.J. Entwicklung Eines Technischen Verfahrens zur Herstellung von Reinstaluminium für die Kyroelektrotechnik, Speziell für Kyromagnete; Zentralstelle für Luft-u; Raumfahrtdokumentation u.-information: Munich, Germany, 1974. [Google Scholar]
  13. Pearce, J. Distribution coefficients of impurities in metals. J Int. J. Thermophys. 2014, 35, 628–635. [Google Scholar] [CrossRef]
  14. Barthel, J.; Buhirg, E.; Al, E. Kristallisation aus Schmelzen; Verlag für Grundstoffindustrie: Leipzig, Germany, 1982; p. 356. [Google Scholar]
  15. Burton, J.; Prim, R.; Slichter, W. The distribution of solute in crystals grown from the melt. Part I. Theoretical. J. Chem. Phys. 1953, 21, 1987–1991. [Google Scholar] [CrossRef]
  16. Burton, J.; Prim, R.; Slichter, W. The distribution of solute in crystals grown from the melt. Part II. Experimental. J. Chem. Phys. 1953, 21, 1991–1996. [Google Scholar] [CrossRef]
  17. Kurz, W.; Fisher, D.J. Fundamentals of Solidification; Trans Tech Publication: Bach, Switzerland, 1992; pp. 46–48. [Google Scholar]
  18. Viardin, A.; Böttger, B.; Apel, M. Phase field assisted analysis of a solidification based metal refinement process. Mater. Theory 2022, 6, 1–22. [Google Scholar] [CrossRef]
  19. Destillation, G. Laborpraxis Band 3: Trennungsmethoden, Aprentas; Springer International Publishing: Cham, Switzerland, 2017; pp. 97–111. [Google Scholar] [CrossRef]
  20. Roth, A. Vacuum Technology; Elsevier: Amsterdam, The Netherlands, 2012; pp. 344–348. [Google Scholar]
  21. Mohamed, S.R.; Friedrich, S.; Friedrich, B. Refining principles and technical methodologies to produce ultra-pure magnesium for high-tech applications. Metals 2019, 9, 85. [Google Scholar] [CrossRef]
  22. Schulze, M.; Seidel, P. Verdampfungsgleichgewicht und Dampfdruck; Springer: Berlin/Heidelberg, Germany, 2018; pp. 11–13. [Google Scholar]
  23. Xiong, N.; Curtolo, D.C.; Friedrich, S.; Friedrich, B. High-and ultra-high-purity aluminum, a review on technical production methodologies. Metals 2021, 11, 1407. [Google Scholar]
  24. Böckh, P.; Wetzel, T. Wärmeübertragung: Grundlagen und Praxis; Springer-Verlag: Berlin/Heidelberg, Germany, 2018; pp. 83–89. [Google Scholar]
  25. Cordes, H.; Rudolph, B.-E.; Cammenga, H.K. Massen-und Wärmetransport bei der Verdampfung flüssiger Metalle/Mass and Heat Transport in the Evaporation of Liquid Metals. Int. J. Mater. Res. 1971, 62, 326–328. [Google Scholar] [CrossRef]
  26. Atkins, P.W.; De Paula, J. Physikalische Chemie; John Wiley & Sons: Hoboken, NJ, USA, 2013; pp. 791–800. [Google Scholar]
  27. Wei, Q.S.; Yang, B.; Li, Y.F.; Dai, Y.N. Zinc removing from aluminum alloy by vacuum distillation. Proc. Adv. Mater. Res. 2012, 402, 303–306. [Google Scholar] [CrossRef]
  28. Sigworth, G.K. Refining of Secondary Aluminum: Important Chemical Factors. JOM 2021, 73, 2594–2602. [Google Scholar] [CrossRef]
  29. Hultgren, R.; Desai, P.; Hawkins, D.; Gleiser, M.; Kelley, K.J. Selected Values of the Thermodynamic Properties of Binary Alloys; ASM: Metals Park, OH, USA, 2007; pp. 51–58. [Google Scholar]
Figure 1. The vapor pressure of the pure elements in aluminium [23].
Metals 12 02027 g001
Figure 2. Experimental setup for the Cooled-Finger fractional crystallization developed at IME/RWTH Aachen [6].
Metals 12 02027 g002
Figure 3. An exemplary “Temperature vs. time” curve, including the plateau of crystallization.
Metals 12 02027 g003
Figure 4. Furnace setup in the first distillation stage.
Metals 12 02027 g004
Figure 5. Schematic cross-section (a.) and actual setup (b.) for the second distillation stage.
Metals 12 02027 g005
Figure 6. Impurity removal factor (1-Cs/C0) of each impurity in a binary system with aluminum.
Metals 12 02027 g006
Figure 7. Influence of impurity concentration on the impurity removal factor (1-Cs/C0) for Zn.
Metals 12 02027 g007
Figure 8. Effect of accompanying impurities on the removal ratio of X in Al-X-Y systems. (a) Al-Fe-Y, (b) Al-Si-Y, and (c) Al-Zn-Y.
Metals 12 02027 g008
Figure 9. Influence of rotation rate on the removal factor.
Metals 12 02027 g009
Figure 10. Individual element removal effect from aluminium during the first distillation stage in %.
Metals 12 02027 g010
Figure 11. Individual element removal effect from aluminium during the second distillation stage in %.
Metals 12 02027 g011
Table 1. Literature values of distribution coefficients of impurities in aluminum [10,11,12,13,14].
ElementsDistribution Coefficient kElementsDistribution Coefficient k
Fe0.018–0.053Ti7–11
Cu0.15–0.153Si0.082–0.12
Ag0.2–0.3K0.56
Au0.18Zr2.3–3
Zn0.35–0.47Pb0.0007–0.093
Ni0.004–0.09P<0.01
Mn0.55–0.9Sc0.9
Mg0.29–0.5Sb0.09
Ca0.006–0.08V3.3–4.3
Cr1.8Na0.013
Table 2. Separation coefficients for typical impurities in aluminium at specific temperatures.
Temperature [°C]βZincβIronβSilicon
7272.24 × 107n.an.a
827n.a1.08432 × 10−6n.a
1600n.an.a1.1268 × 10−3
Table 3. Experimental design on the purification according to impurity type and concentration.
Number of Trials PerformedSystemAl (wt.%)Targeted Impurity Concentration (wt.%)
SiFeZn
3Al-Si99.90.1--
3Al-Fe99.9-0.1-
3Al-Zn99.9--0.1
3Al-Zn99.5--0.5
3Al-Zn99.95--0.05
3Al-Si-Fe99.80.10.1-
3Al-Si-Zn99.80.1-0.1
3Al-Fe-Zn99.8-0.10.1
12Al-Fe-Si-Zn99.70.10.10.05
Table 4. Rotation rates investigated.
TrialRotation (RPM)
A25
B35
C45
D50
Table 5. Al, Fe, Si and Zn content in the aluminium ingot (ICP-MS-Analysis).
ElementAl (wt.%)Fe (ppm)Si (ppm)Zn (ppm)
Content99.81143436688
Table 6. Solid solubility limit of impurities in aluminum (first data row) and between the second (X) and third (Y) impurities in an Al-X-Y ternary system.
FeSiZn
Solid solubility of elements in AluminumAl0.06%1.7%82%
Solid solubility between elementsFe-35%46%
Si65%-0%
Zn26%0%-
Table 7. Qualitative influence of additional elements on the impurity removal in an Al-X-Y ternary system.
Target Element
FeSiZn
Al+ + ++ ++
Added elementFe + + +< +
Si+ + + + << +
Zn+ + ++ +
Table 8. Qualitative influence of the different distillation stages on the impurity removal in aluminium.
FeSiZn
First distillation stage of Al--+ + + +
Second distillation stage of Al+ + + ++ ++ + +
Total Al+ + + ++ ++ + ++
Publisher’s Note: MDPI stays neutral with regard to jurisdictional claims in published maps and institutional affiliations.

