Article

A Comprehensive Investigation on the Effects of Surface Finishing on the Resistance of Stainless Steel to Localized Corrosion

1
Department of Chemistry, Materials and Chemical Engineering “G. Natta”, Politecnico di Milano, Via Mancinelli 7, 20131 Milan, Italy
2
Centro inox S.r.l., Via Rugabella 1, 20122 Milan, Italy
*
Author to whom correspondence should be addressed.
Metals 2022, 12(10), 1751; https://doi.org/10.3390/met12101751
Submission received: 5 September 2022 / Revised: 12 October 2022 / Accepted: 13 October 2022 / Published: 18 October 2022
(This article belongs to the Special Issue Corrosion and Protection of Stainless Steels)

Abstract

:
The present research investigates the influence of surface roughness imparted by cold surface finishing processes on the localized corrosion resistance of stainless steel. Five different alloys were studied: ferritic AISI 430, martensitic AISI 430F, austenitic AISI 303, AISI 304L, and AISI 316L. It was demonstrated that the grinding process, executed on previously cold drawn bars, leads to an improvement in corrosion resistance according to the results obtained with electrochemical tests, namely, potentiostatic and potentiodynamic tests in chloride-rich environments, the salt spray test, and long-term exposure in urban and marine atmospheres. This allowed us to establish a trend among the different alloys regarding the resistance to pitting corrosion, which was assessed according to pitting potentials, critical chloride contents, and pitting initiation time. All the tests confirmed that surface finishing, as well as alloy chemical composition, is an important factor in controlling the corrosion resistance of stainless steel.

1. Introduction

Stainless steels are characterized by a high chromium content and other alloying elements such as carbon, nickel, molybdenum, silicon, and titanium, which improve their mechanical properties and corrosion resistance [1]. This class of materials is used for a wide variety of applications such as the manufacturing of domestic products, the production of food and beverages, the construction of oil and gas infrastructures, or architectural purposes. According to EN 10088-1:2014 [2], the terminology “stainless steel” (SS) can be used for ferrous alloys with a chromium content greater than 10.5% by weight, which allows the formation of an oxide on the metal surface, i.e., the passive layer or passive film, protecting it from further corrosion in a vast range of environments [3]. Depending on the alloying process, stainless steels can be classified into five different families, i.e., ferritic, austenitic, martensitic, duplex, and precipitation-hardening [4,5]. Austenitic steels present higher corrosion resistance properties [6], thanks to a generally high content of Cr (17 to 26 wt.%) and Ni (7 to 22 wt.%) favoring the stabilization of a face-centered cubic structure. As a matter of fact, the Cr content inside the alloy is crucial for the stabilization of the surface oxide [5,6,7]. However, several factors such as chemical alloying elements [8,9], surface defects, finishing operations [10,11] and pH variations can hinder the healing of the passive layer [5,12]. In these circumstances, the SS will not be protected anymore, and localized corrosion phenomena will take place in the presence of oxygen, where the passive film is damaged. The most common and dangerous forms of localized corrosion affecting SS are pitting, crevice corrosion, and stress corrosion cracking [5,6,12].
Pitting corrosion is a deep penetrating attack, which forms pits with diameters less than a few millimeters where the passive film breaks [1,13,14,15]. Severe corrosion conditions develop inside the pits, leading to fast corrosion rates of up to several mm per year. The mechanism presents two stages: pit initiation and propagation. The initiation stage represents the time required for the passive film to undergo a local breakdown, and depends mainly on temperature, the presence of aggressive species (i.e., chlorides), impurities on the surface, surface finishing, the velocity of the fluid in contact, the presence of oxidizing species, and exposure time. Moreover, the stochastic nature of the position and total number of initiation sites often requires a structured statistical approach to describe the phenomenon [16,17,18,19] and a robust experimental campaign in order to investigate the effect of metallurgical and environmental parameters on localized corrosion initiation, as proposed, for instance, by Dastgerdi et al. [20].
The propagation stage consists of the formation of a macrocell between the anode, represented by the internal surface of the pit, and the cathode, represented by the passive layer around the pit. The solution will undergo acidification inside the pit because of the hydrolysis reaction, as in Equation (1),
M z + + z H 2 O M O H z + z H +
which brings the pH to values close to 3–4. Outside the pit, the pH level will increase so that the passive layer will become even stronger. The chemical composition of the alloy represents one of the main influencing factors on the corrosion resistance of stainless steel [7]. Therefore, the Pitting Resistance Equivalent Number (PREN), based only on the chemical composition of the alloying elements, was created to compare the pitting corrosion resistance of stainless steels. The PREN index is defined according to Equation (2)
PREN = C r % + 3.3 M o % + 16 N %
Higher values of PREN indicate a higher resistance of the SS specimen to the initiation of pitting corrosion, even if this approach is to be used only as a rule of thumb.
Another common phenomenon in metals displaying active–passive behavior, such as SS, is crevice corrosion [21,22]. This is likely to take place when small interstices are present on the metal surface, due to geometric features of the component or contact with external objects, such as seals and gaskets, that hinder the local diffusion of chemical species. Crevice and pitting corrosion share similar characteristics and can be described according to an initiation and a propagation stage. Initiation is usually referred to as the phase in which the passive film is locally broken and general corrosion occurs internally. When the passive film is in contact with a chloride-containing solution with a neutral pH, the most validated initiation mechanism is the “passive dissolution model” [21], characterized by the typical acidification process verified in occluded regions and also observed in pitting defects. Propagation instead refers to the metal dissolution rate following a macrocell corrosion mechanism between the anodic zone inside the crevice and the cathodic zone outside the crevice where the material is still passive. This macrocell current circulating between the two regions leads to a migration of chlorides toward the crevice. In the meantime, the formation of H+ inside the crevice leads to a pH drop and when the acidity and the chloride concentration reach a critical threshold, the disruption of the passive film inside the crevice starts and the propagation phase develops, just like for pitting [23].
The effect of surface finishing on corrosion resistance is a field of study for all classes of metallic materials, such as stainless steels. Stainless steels, for certain applications, may require a special surface finishing to recover specific characteristics of the alloy such as residual stresses, microstructure or appearance. It has been seen that rougher surfaces are more susceptible than smoother ones to localized forms of corrosion, as pit nucleation is generally favored [24,25,26]. The surface state of the material is primarily dictated from previous machining and grinding operations undertaken along all the fabrication steps. These operations heavily affect surface properties ruling the corrosion response of the metal. Cold working, for example, has marked effects on mechanical properties, generating a high dislocation density and promoting, in some austenitic stainless steel grades, martensitic transformation [11]. Researchers such as Rhouma et al. [10] have investigated surface finishing operations such as shot blasting and wire brushing, finding that a residual compressive stress can improve in-service properties such as resistance to pitting corrosion and stress corrosion cracking (SCC). Grabke et al. [27] noticed that surface finishing processes such as grinding, sand blasting, polishing, machining and shot-peening can favor the formation of near-surface deformation acting as preferential channels for Cr transport to the surface. This can further boost the passivation of the alloy. Mohammad et al. [28] found surface roughness control to be more effective than surface hardness in limiting crevice growth rate in the case of martensitic AISI 410 and 416. A comparison of the resistance to pitting corrosion between AISI 430 and 304 was provided by Bellezze et al. [29] in terms of anodic polarization tests in NaCl solution. The authors found improved surface properties for AISI 304 according to its higher Cr content independent from surface finishing. Various metallurgical parameters can be affected by cold working operations. Peguet et al. [11] discussed the effect of cold rolling reduction percentage on pitting initiation and propagation in AISI 304 and 430, suggesting both stages are controlled by the dislocation density. Similar results were found by [14], working on 18Cr10Ni2Mo, demonstrating a monotonic increase in corrosion current density with the degree of plastic deformation.
The goal of this work is to investigate the influence of surface roughness imparted by cold surface finishing processes on the localized corrosion resistance of stainless steel via potentiostatic and potentiodynamic polarization tests in chloride-rich environments, immersion tests in ferric chloride solution, and salt spray tests. Five different alloys are studied, and a trend is established among the alloys with different surface finishing according to their pitting potentials, critical chloride content, and pitting initiation time in accelerated and natural long exposure tests in urban and marine environments.

2. Materials and Methods

Five stainless steel grades were tested in this work: ferritic X6Cr17 (AISI 430); martensitic X14CrMoS17 (AISI 430F); austenitic X8CrNiS18-9 (AISI 303); austenitic X2CrNi18-9 (AISI 304L); and austenitic X2CrNiMo17-12-2 (AISI 316L). Chemical compositions are reported in Table 1.
For each steel, two surface finishings, i.e., drawn and ground, were considered for a total of 10 different conditions. Steel bars were supplied by Rodacciai S.p.A, Bosisio Parini, Lecco (Italy) in cylinders of length L = 200 mm and diameter Ø = 14 mm, except for AISI 430 bar, whose diameter was 12 mm.

2.1. Corrosion Tests

Five electrochemical and/or accelerated corrosion tests were carried out: (1) the potentiodynamic cyclic polarization test, (2) the potentiostatic polarization test, (3) the immersion test in ferric chloride solution, (4) the salt spray test, and (5) the atmospheric exposure test.
Potentiodynamic cyclic polarization measurements were executed according to the ASTM G61-86 standard [30] for a total of 80 samples in order to determine the relative susceptibility to localized corrosion (pitting and crevice corrosion) in chloride-containing environments. A standard three-electrode corrosion cell (Colaver, Vimodrone, Milan, Italy) was used: mixed-metal oxide titanium (MMO-Ti) and silver/silver chloride in saturated KCl solution (Ag/AgCl/KClsat., +0.198 V vs. SHE) were used as auxiliary electrode and reference electrodes, respectively. Two chloride-containing solutions were tested: 0.1 g/L NaCl and 1 g/L NaCl. Before testing, specimens were rinsed with distilled water, dried, and then degreased with acetone. This cleaning procedure was applied before every test described in this work. The potential scan rate considered was equal to 0.17 mV/s, starting from −0.10 V vs. free corrosion potential (Ecorr). A sharp increase in the circulating current would mark the onset of localized corrosion, i.e., localized corrosion potential. The value of the current cutoff when the scan was reversed was fixed to 5 A/m2. The test was stopped when the potential reached −0.10 V vs. Ecorr.
Potentiostatic polarization measurements were carried out with a replication of two specimens for each condition (20 specimens tested); specimens (length 50 mm) were immersed in a corrosion cell of 5 dm3 volume and then polarized at a constant potential of +0.1 V vs. Ag/AgCl/KClsat. selected from the results of the preliminary potentiodynamic tests, as this value was close to the pitting potential measured for the AISI 430F samples. The anodic polarization potential was maintained throughout the duration of the test, while the chloride concentration in the solution was increased at periodic time intervals. Chloride ions (in form of NaCl) were added in solution every three days: 10 mg/L chlorides; 30 mg/L; 100 mg/L; 300 mg/L; 1000 mg/L; 3000 mg/L; and 10,000 mg/L.
The onset of localized corrosion was shown by an increase in the anodic polarization current when chloride content reached the critical chloride threshold. Polarization current was measured during the tests by means of voltage drop measurements across a shunt of 10 Ω inserted in the electrical circuit.
The immersion test in ferric chloride solution was performed according to the ASTM G48-11 standard [31]. This accelerated corrosion test allows the determination of the resistance of stainless steel to pitting and crevice corrosion when exposed to a severe oxidizing environment. The use of ferric chloride allowed us to largely decrease the initiation time of the localized corrosion due to the high oxidizing power (Fe3+ + e → Fe2+, Eeq = +0.77 V vs. SHE), high chloride ion content with a subsequent decrease in pitting potential and weakening of the passive film, and low pH (around 1.5) due to the hydrolysis of ferric chloride. Two samples (length 50 mm) for each finish and SS grade were immersed in a 6 wt.% FeCl3 solution at 22 ± 2 °C for 72 h. The same tests were performed using a fluorinated elastomer O-ring as a crevice former. The pit density and the weight loss were evaluated at the end of the test to determine pitting and crevice susceptibility in ferric chloride solution.
The salt spray corrosion test was performed to evaluate the resistance to corrosion of the five stainless steel grades, according to the ASTM B117-18 standard [32]. A solution of 30 L of distilled water and 1.5 kg of sodium chloride (5% in weight) with small additions of HCl and NaOH to stabilize the pH at 7 was adopted in the fog chamber. The tests were performed at RTM Breda laboratories in Cormano (Milan), exposing stainless steel bars (length 200 mm) for 816 h at 35 °C.
The atmospheric exposure test was carried out to implement the results obtained through the salt spray exposure corrosion test, assessing the corrosion resistance of the samples exposed to real outdoor environments. The test took place in two different environments: an urban atmosphere, exposing the samples on the rooftop of the building of the Department of Chemistry, Materials and Chemical Engineering of Politecnico of Milano (Milan, Italy), and a marine atmosphere, at the seaside of Cefalù (Sicily, Italy). Stainless steel bars (length 200 mm) were installed on galvanized steel racks and properly insulated from the samples in order to avoid galvanic coupling effects. The standard ASTM G50-10 [33] was slightly adapted to respect the geometry of the stainless steel samples. Moreover, two fluorinated elastomers O-rings per sample were used as crevice formers. A monthly inspection was performed.

2.2. Surface Characterization Techniques

Visual inspection was used to characterize the surface evolution during and after the tests. Optical microscopy (Leica DM LM Microscope, magnification up to 1000×) was employed to investigate the microstructure of the samples’ surfaces prior to polishing and Nital 10 acid attack. An optical profilometer (UBM Microfocus Laser Profilometer) was used to measure the surface roughness profile before and after the corrosion test.

3. Results and Discussion

When analyzing the resistance of a metal to localized corrosion, the main parameters we considered in this work were pitting potential (Ep), critical pitting chloride concentration, and corrosion resistance in the accelerated exposure tests. These parameters were investigated for five stainless steels (AISI 316L, AISI 430, AISI 430F, AISI 304L, and AISI 303), drawn or ground-finished through a series of corrosion resistance tests, namely, potentiodynamic and potentiostatic polarization tests, ferric chloride immersion tests, and salt spray and atmospheric exposure tests. In the following section, a broad description of all the experimental results, their interpretation, and implications are provided.

3.1. Surface Characterization

Surface characterization of the samples was performed via optical microscopy before the corrosion tests to verify the presence of superficial contaminants, which may act as pitting initiation enablers. Moreover, the surface was characterized via optical microscopy and profilometry at the end of the tests to analyze the microstructure changes and evaluate the influence of surface roughness on the corrosion resistance of the samples.

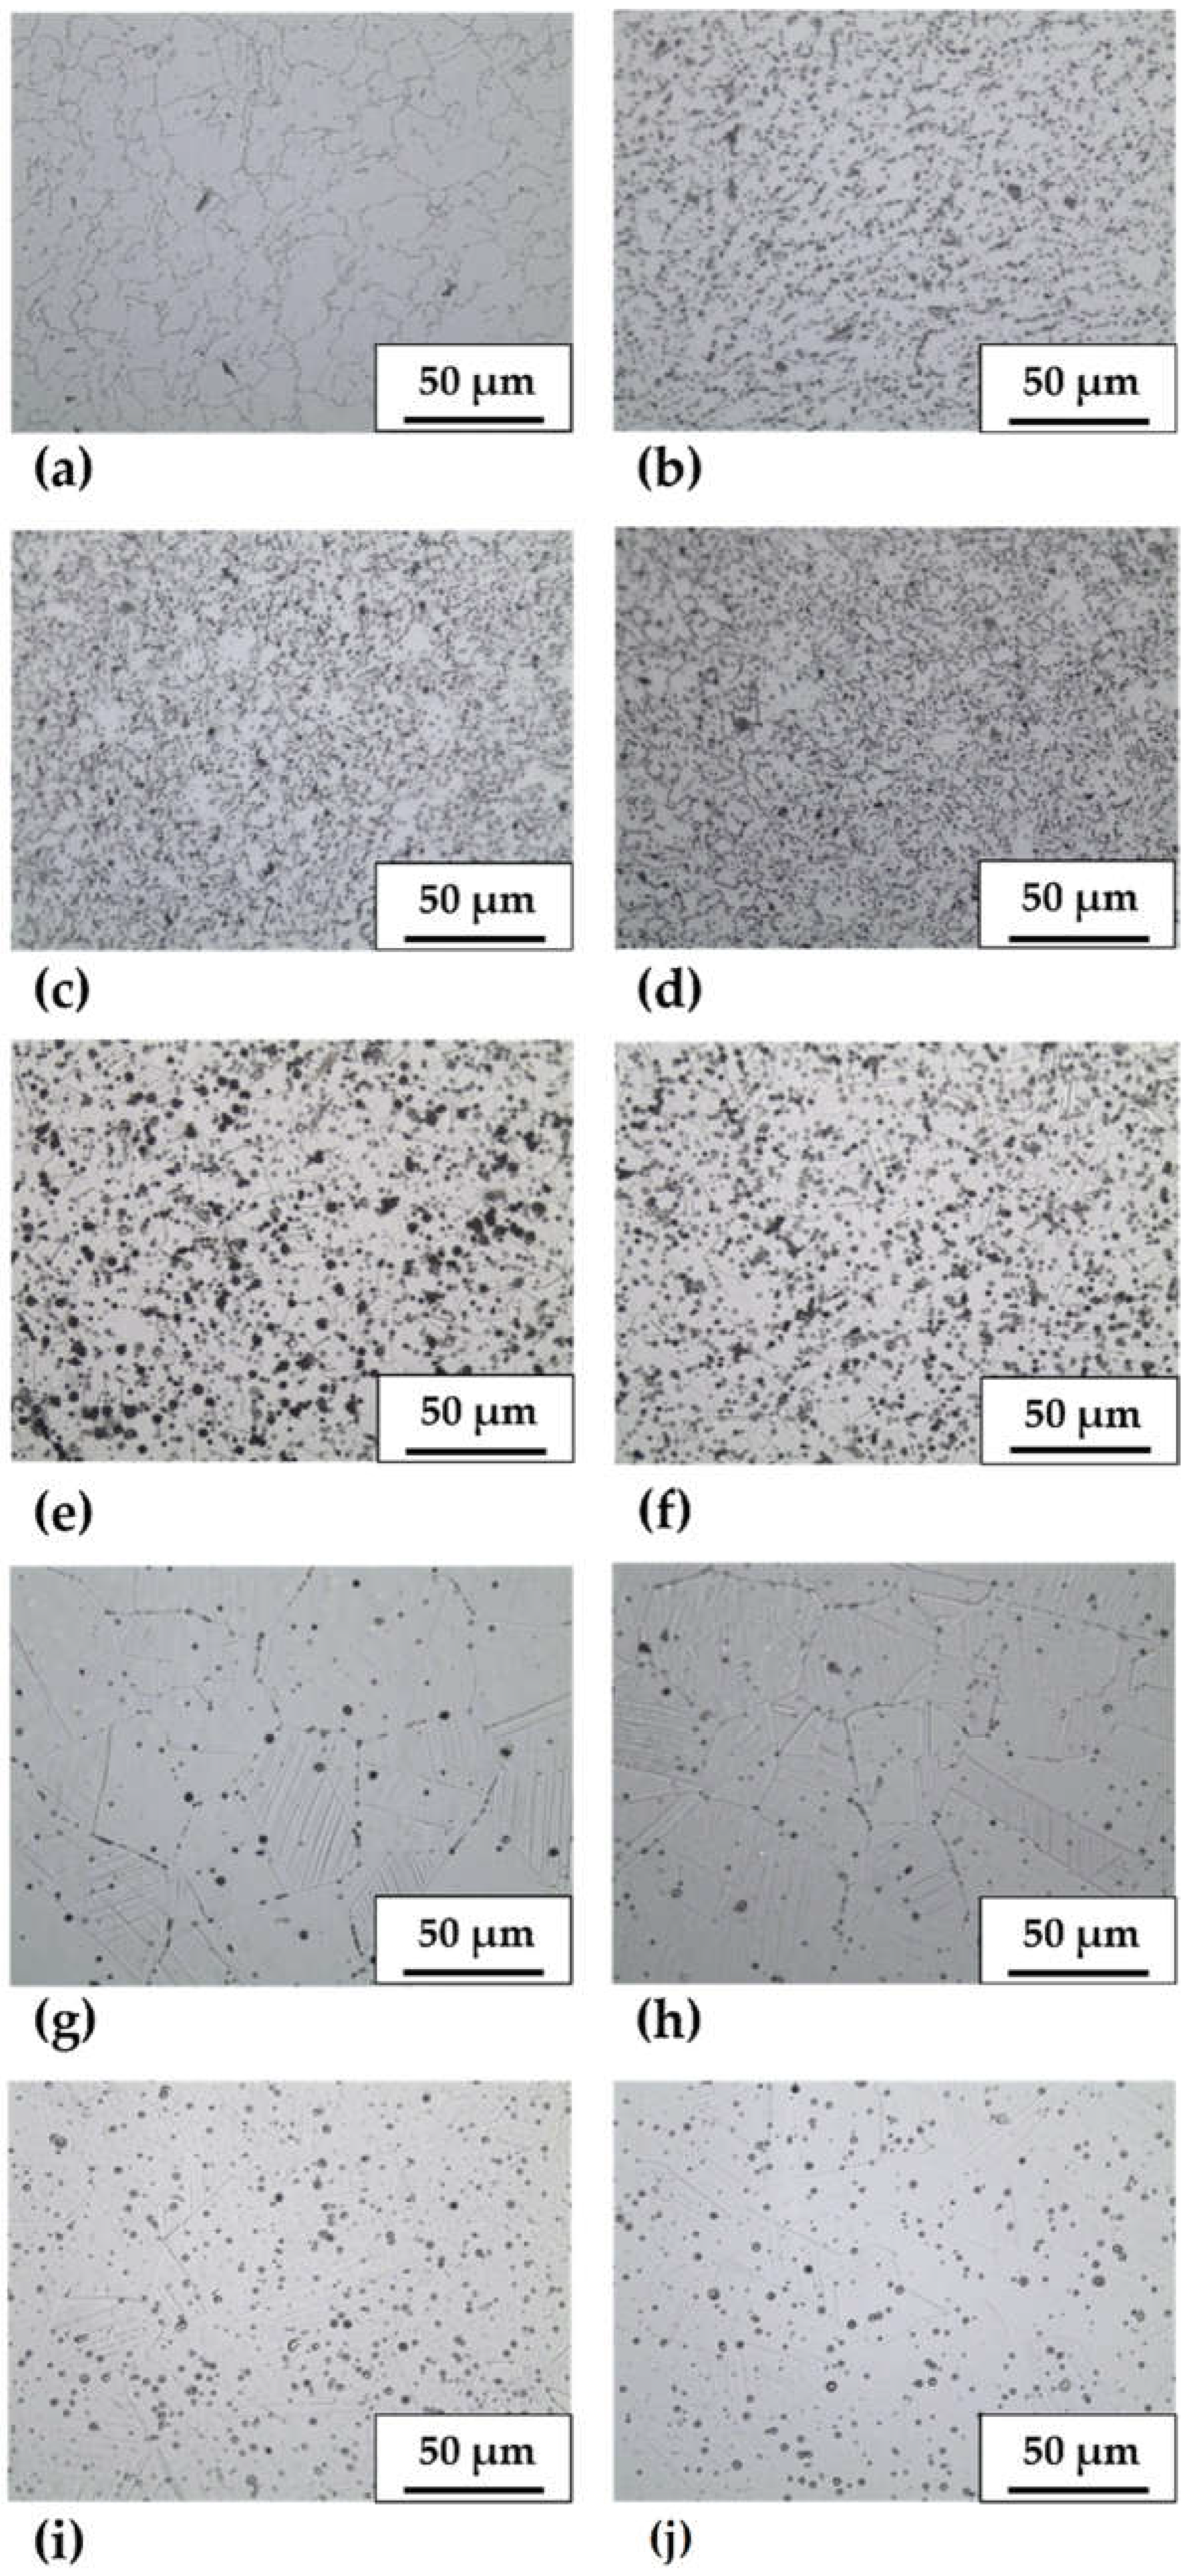
3.1.1. Optical Microscopy

One specimen for each of the ten investigated conditions was characterized via optical microscopy at magnifications 200× and 500×, both at the center and border, in order to evaluate the differences in the microstructure between same-grade stainless steels with ground and drawn surface finishes. Figure 1 shows 500× magnifications of the borders of the different specimens, in which a high percentage of precipitates and inclusions is clearly visible in black, especially in the case of AISI 430F, AISI 430, and AISI 303. In the case of AISI 430F and AISI 303, these precipitates could be caused by a high amount of sulfur that could alter their behavior. Aside from a neater definition of grain boundaries in the ground samples rather than in the drawn ones, the analysis did not show major microstructural changes as a result of the surface finishing processes. This is probably due to the fact that the finishing processes are both cold ones, so the main alterations in the materials will not be found in their microstructure.

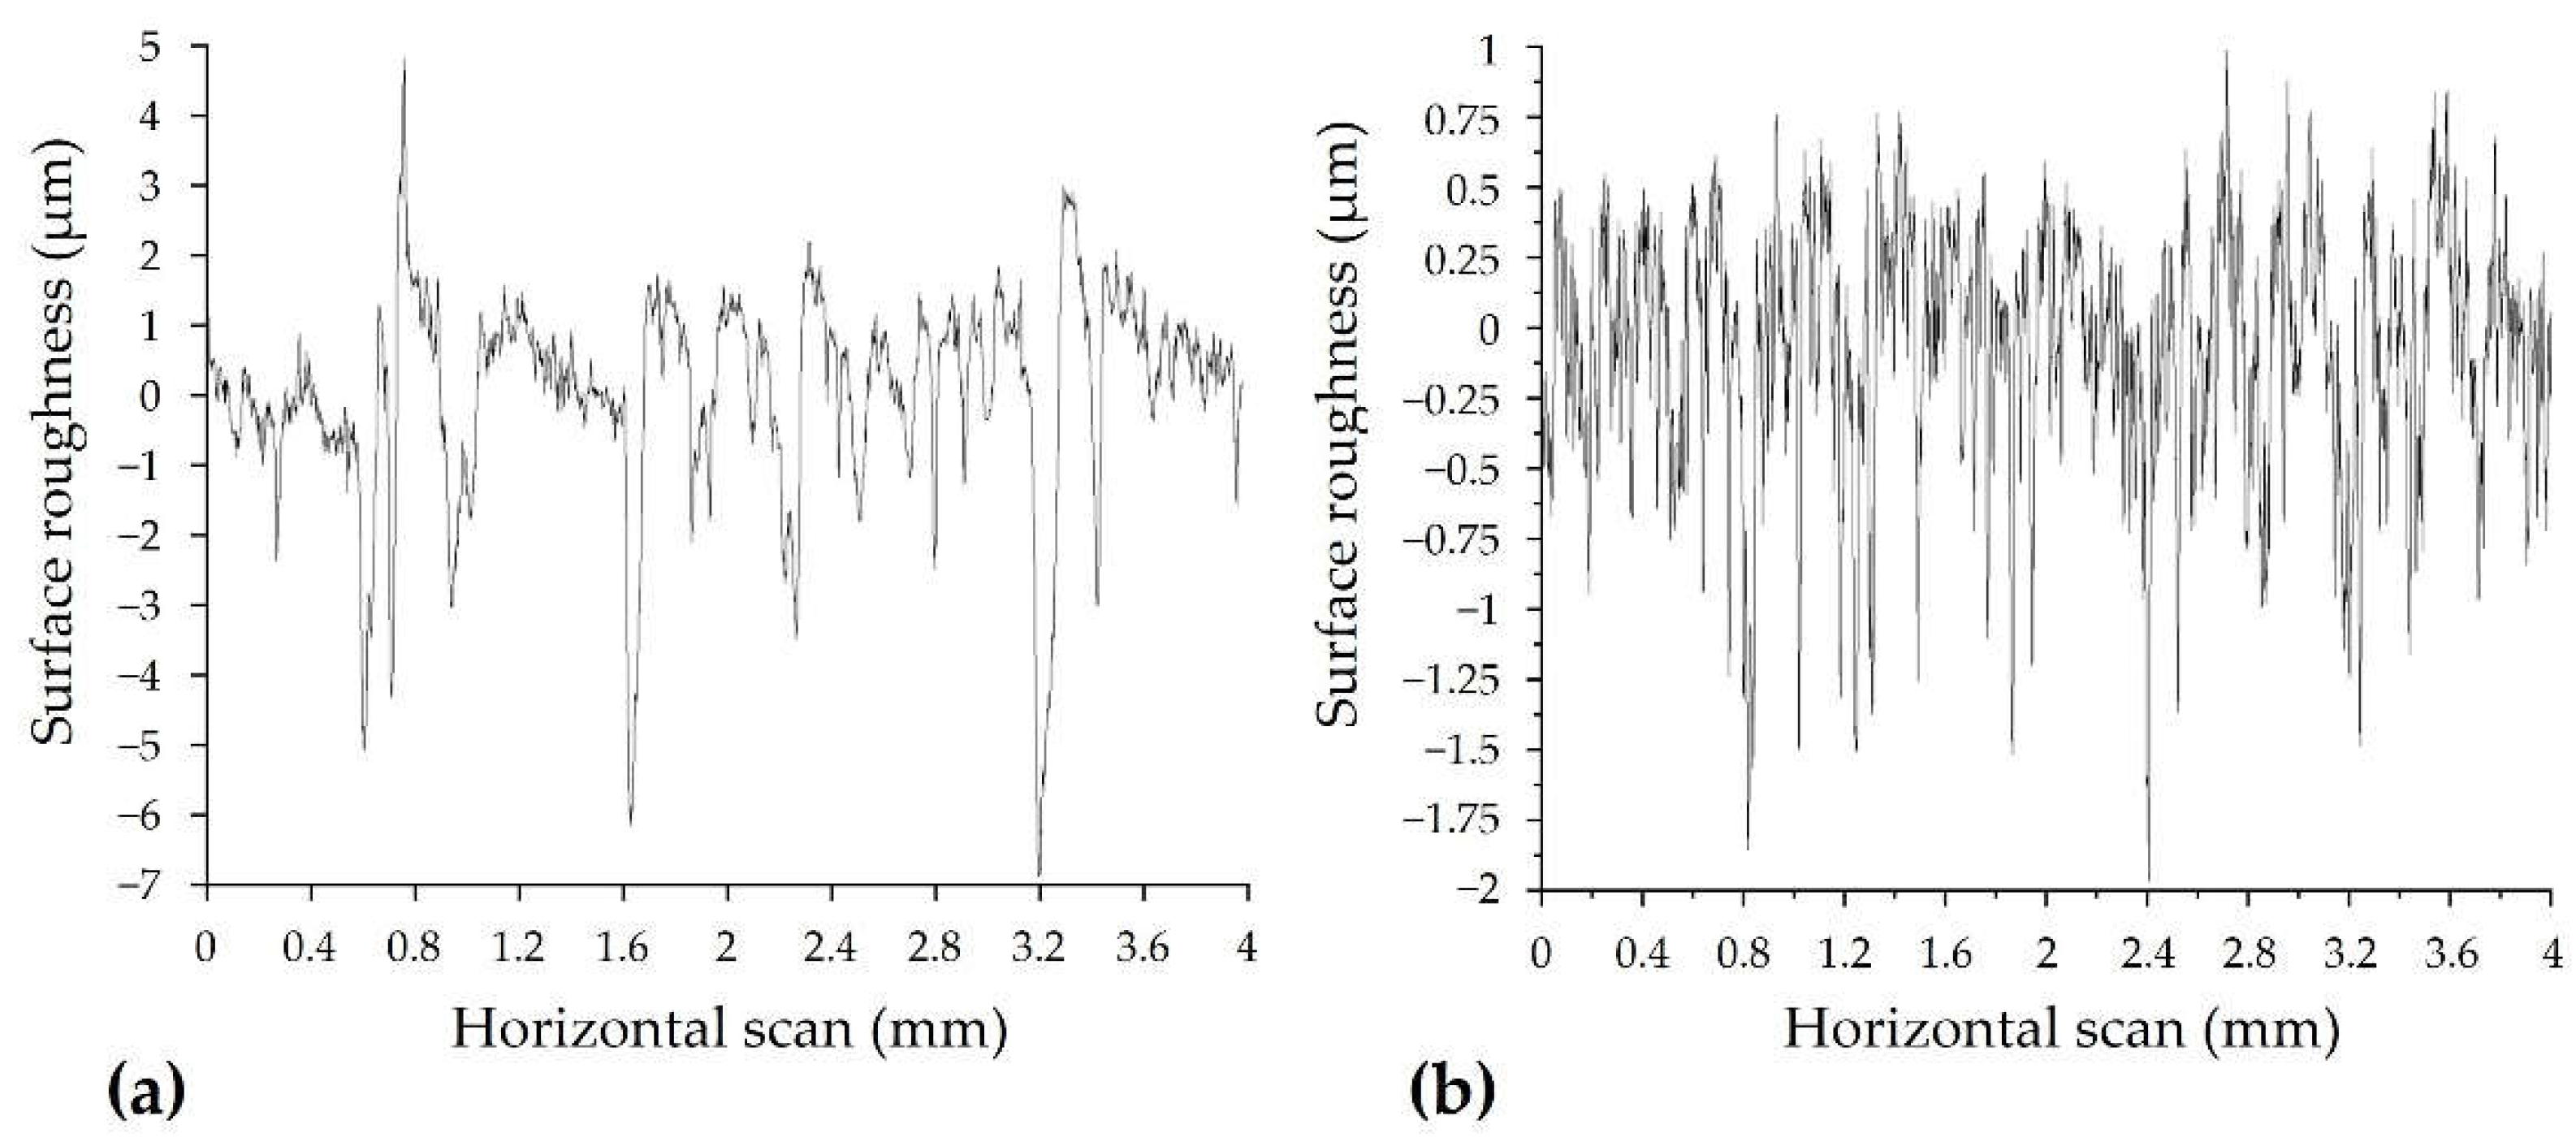
3.1.2. Optical Profilometry

Optical profilometry was used to quantify the surface roughness of the samples and to interpret its role in the different corrosion responses estimated. Three samples were analyzed for each stainless-steel grade—considering drawn and ground finishing—for a total of 30 linear profiles. The measurements, whose filter parameters are reported in Table 2, were performed in accordance with the DIN 4768 standard [34], and the resulting surface linear profiles for drawn AISI 430F and ground AISI 430F are shown as an example in Figure 2.
From all the linear profiles collected, it is possible to extrapolate three key parameters, reported in Table 3, to compare the roughness of the specimens and identify the possible localized corrosion initiation points:
  • Arithmetic mean roughness (Ra), that is, the arithmetic average of the absolute deviation of the surface profile from the mean surface height R a = 1 n i = 0 n y i ;
  • Mean roughness depth (Rz DIN), that is, the arithmetic average of the maximum peak to valley height of the roughness values of five consecutive sampling specimens R z DIN = 1 5 i = 1 5 Y i ;
  • The maximum profile depth parameter (Pt) that represents the vertical distance between the highest peak and lowest valley in the profile and can show the weakest point for localized corrosion attack initiation.
The measured mean roughness, Ra, confirms that the grinding process creates bars with much smoother surfaces than the cold drawn finishing. Furthermore, the mean roughness depth, Rz DIN, allows us to identify the biggest cavities on the sample surface, where contaminants such as chloride ions might stagnate and initiate the pitting corrosion process. Finally, the profile depth parameter Pt is useful to evaluate the control over the sample roughness for the two finishing processes, since it could represent the depth of the biggest cavity if highest peak and lowest valley were coupled. The much smaller values of Pt in the ground samples suggest that the roughness can be better controlled with respect to the drawn samples, diminishing the possibilities of pit corrosion initiation.

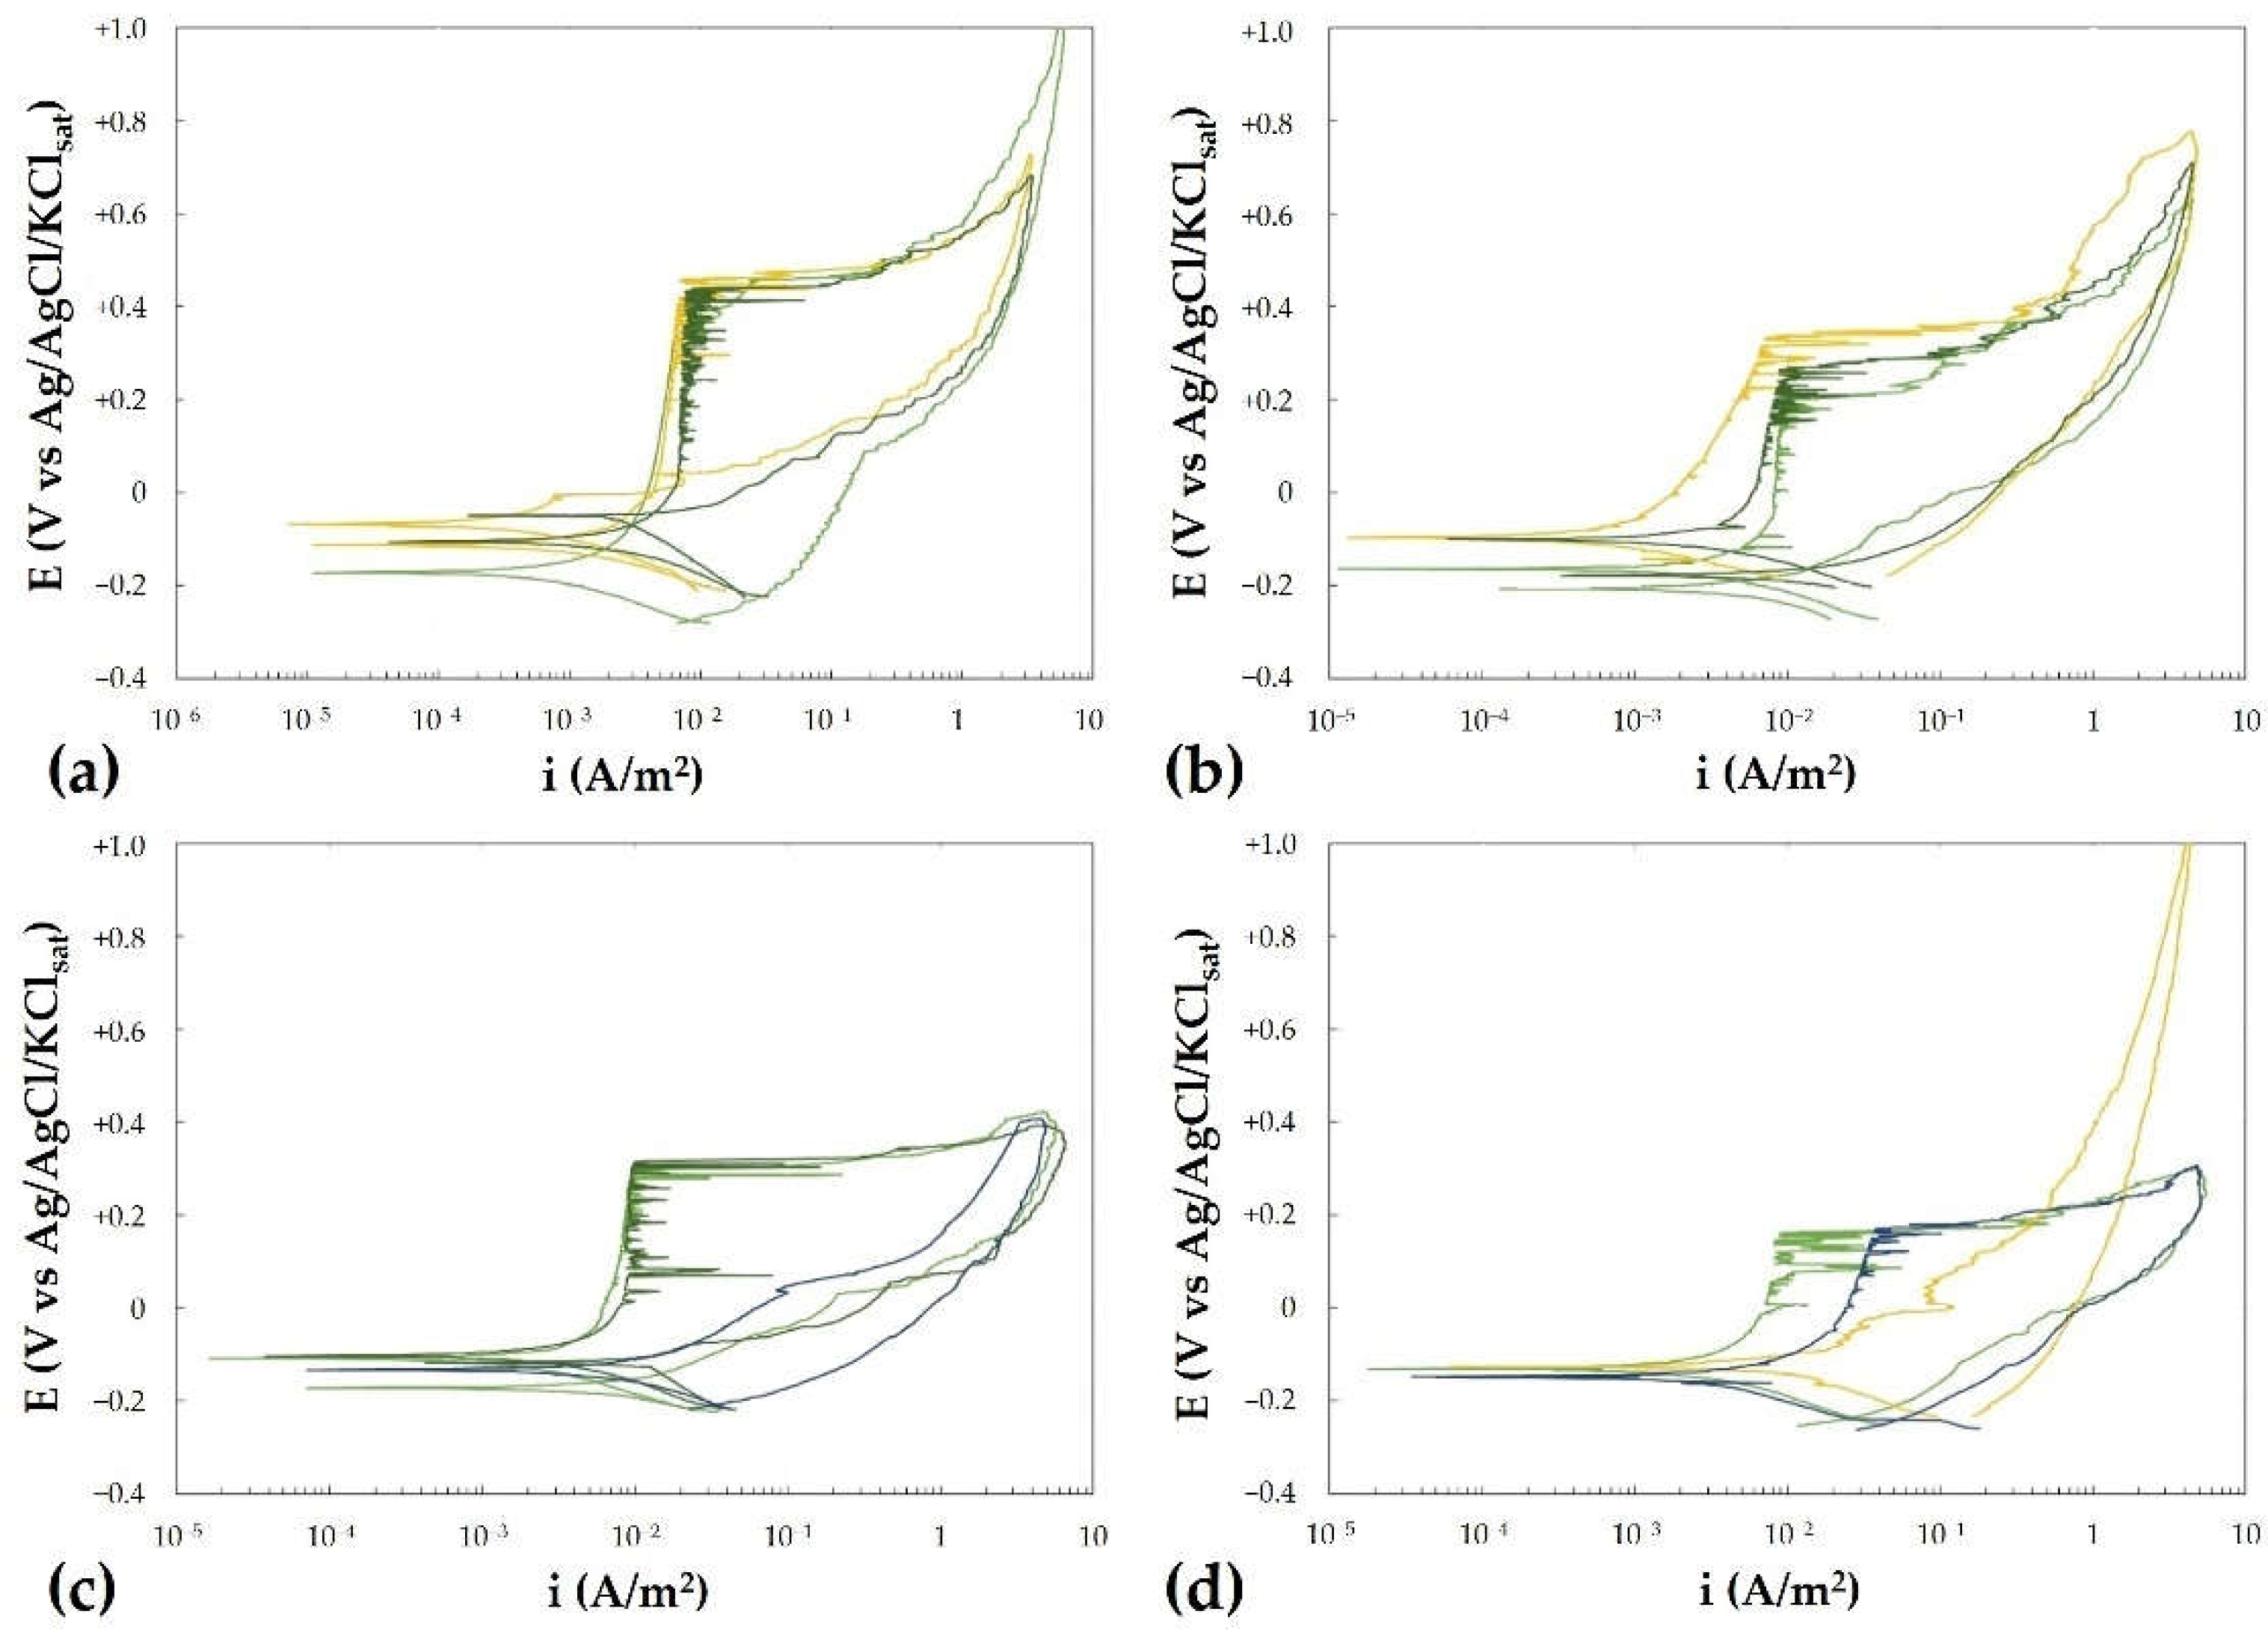
3.2. Pitting Potential Determination

The pitting potential can be defined as the lowest value of potential at which pits nucleate and grow, and it depends mainly on steel chemical composition, chloride content, pH, temperature, and surface finishing [4,5,6]. It is one of the main parameters necessary to evaluate the resistance to pitting corrosion attacks and it can be determined via potentiodynamic polarization tests.

Cyclic Potentiodynamic Polarization Test

Cyclic potentiodynamic polarization tests were performed according to ASTM G61-86 [30] on 80 specimens:
  • Three tests were performed on the cross-section of three different specimens for each grade and finish, with a chloride concentration of 100 ppm, for a total of 30 runs;
  • Three tests were performed on the cross-section of three different specimens for each grade and finish, with a chloride concentration of 1000 ppm, for a total of 30 runs;
  • Two tests were performed on the lateral surface of two different specimens for each grade and finish, with a chloride concentration of 100 ppm, for a total of 20 runs.
As an example, the potentiodynamic polarization tests performed on the cross-section of the AISI 430 samples in the conditions mentioned above are shown in Figure 3.
The values extrapolated from all the tests are collected in Table 4. Pitting potential (Ep) has been measured as the potential corresponding to which a sharp increase in anodic current density in the potential scan was measured. After pitting initiation, the potential scanning direction was reversed once it reached a current density equal to 5 A/m2; the repassivation potential (Erep) has been determined as the potential at which the curve re-intersects the passive branch, corresponding to a current density equal to the passivity current density. All the stainless-steel grades showed active–passive behavior, with the exception of the AISI 430F cross-section samples, which showed an active behavior even in a solution containing 100 mg/L of chlorides, while the lateral surfaces of AISI 430F specimens followed the expected trend. These tests allowed us to investigate not only Ep, but also the previously mentioned parameter Erep. The passivity current density always ranged from 1 to 10 mA/m2 in all the testing conditions.
Regarding the effect of surface treatments, two important considerations can be made. Firstly, the higher Ep values of ground-finished samples with respect to drawn-finished samples for a given chemical composition confirm that the grinding treatment results in higher resistance to localized corrosion. Secondly, the Ep values corresponding to the unfinished cross-sections are smaller than the ones of the finished lateral surfaces, given the same chemical composition and chloride concentration. This means that the surface finishing processes positively influence the corrosion resistance of stainless steel. Regarding the effect of chemical composition, the highest pitting potentials have been measured for AISI 304L and AISI 316L, as expected, and even for the AISI 430 grade, despite its lower PREN index.
Finally, regarding the effect of chloride content in solution, the tests proved that an increase in chloride content results in a slightly lower Erep and lower Ep, and consequently in a smaller pitting corrosion resistance, as expected [4].

3.3. Critical Pitting Chloride Concentration Determination

The critical pitting chloride concentration, CPCC, is a threshold below which pitting does not initiate [4]. This parameter is fundamental in the analysis of the influence of surface finish and composition on the resistance to localized corrosion attacks and can be determined via potentiostatic polarization tests.

Potentiostatic Polarization Test

Potentiostatic polarization tests were performed on 20 different samples: 2 for each stainless-steel grade and surface finish. The chloride concentration of the solution was increased at periodic intervals and the changes in current densities were measured daily for each sample. A not negligible value of current density resulted in a shift of the material to active behavior, meaning that the CPCC for a given potential was reached. Tests ended when a current density greater than 5 A/m2 was measured and corrosion was confirmed by visual inspection. Table 5 reports the CPCC and the corresponding measured current.
The analysis of the CPCC confirms, as expected from the literature, that the alloy composition is a key factor in the determination of the corrosion resistance of a stainless steel in a stagnant oxidizing electrolyte. Moreover, the ground AISI 316L, AISI 304L and AISI 430 showed a higher CPCC, while the ground and drawn samples of AISI 303 and AISI 430F showed almost no difference in CPCC values, probably due to the very low amount of chlorides necessary to initiate the corrosion process on these grades. The AISI 316L grade was the most resistant alloy, as confirmed by the highest critical chloride content for pitting initiation.

3.4. Accelerated and Natural Exposure Tests

Accelerated exposure tests (ferric chloride immersion test and salt spray test) and natural exposure tests in urban and marine environments allow us to evaluate the localized corrosion resistance of stainless steels in the presence of a chloride-containing environment. Accelerated tests are carried out in very severe environments, in ferric chloride or fog spray chambers, and strongly reduce the initiation time of corrosion. It follows that these tests are useful only for comparison purposes. On the other hand, natural exposure tests are time-consuming, but they simulate the corrosion behavior of the material in real service conditions, allowing the determination of the localized corrosion initiation time.

3.4.1. Ferric Chloride Corrosion Test

Ferric chloride (FeCl3) corrosion tests were executed following the ASTM G48-11 [31] standard to compare the corrosion resistance of 40 specimens:
  • Two for each finish and stainless-steel grade, to test the pitting corrosion resistance for a total of twenty samples;
  • Two for each finish and stainless-steel grade with two O-rings on each one of them to test the crevice corrosion resistance for a total of twenty samples.
The average pit density on the sample surfaces and the mass loss are reported in Table 6, with the exception of AISI 304L ground, for which data are not available (n.a.). It can be noticed that, due to the strong corrosiveness of ferric chloride solution, a significative effect of alloy chemical composition and surface finishing on corrosion resistance cannot be appreciated. Corrosion attacks were observed on all the specimens and mass loss data are comparable. AISI 430F specimens show the worst corrosion resistance, showing uniform corrosion with an absence of localized pits on the surface for both surface finishing styles.

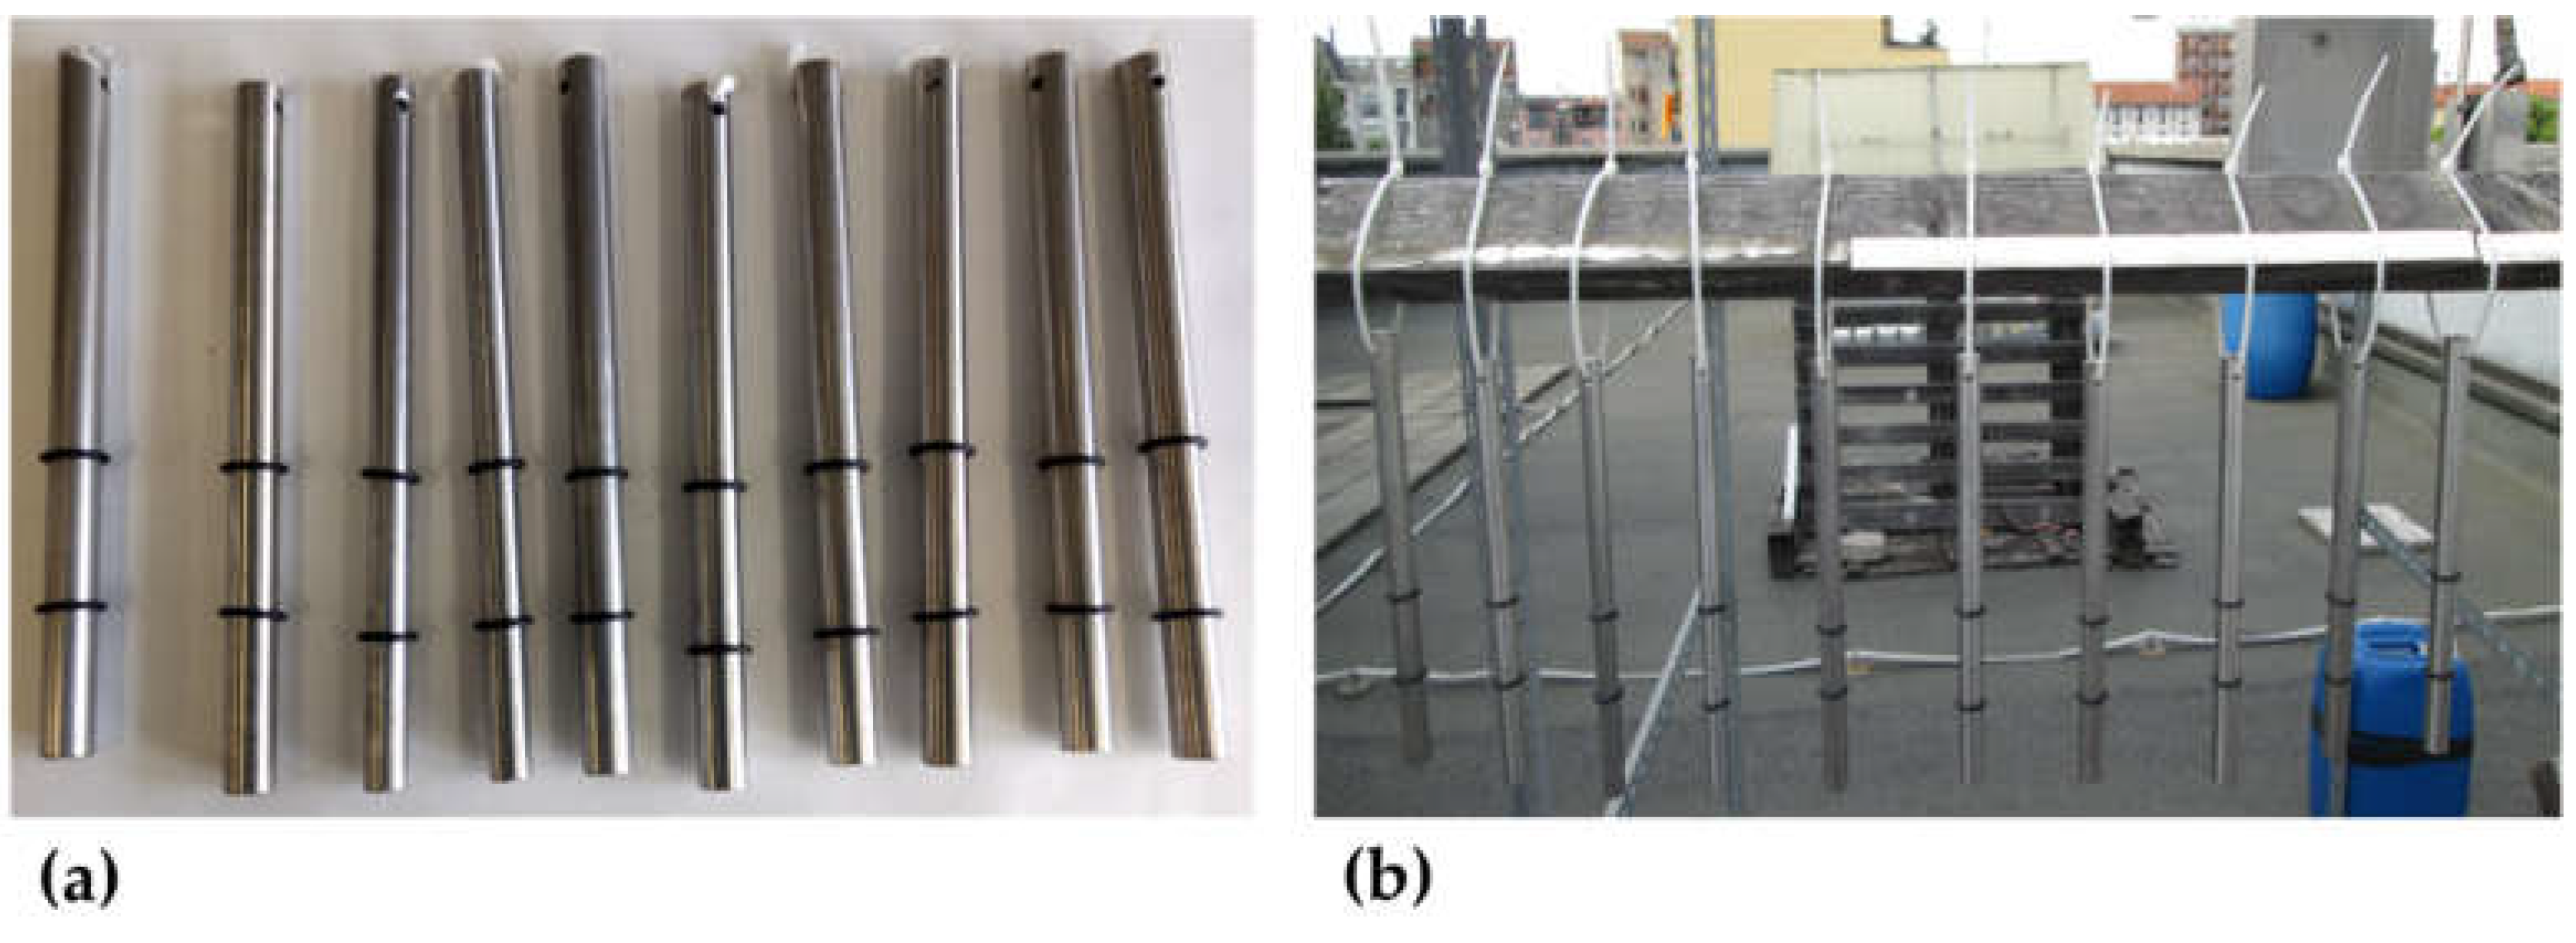
3.4.2. Exposure Tests

A further evaluation of the effect of the two surface finishes on the corrosion resistance of stainless steels exposed to oxidizing environments was performed via exposure tests: salt spray test and natural exposure to urban and marine atmosphere.

Salt Spray Corrosion Test

The salt spray corrosion test simulates an accelerated condition of exposure to a chloride-containing atmosphere for long periods of time. It was executed according to the ASTM B117-18 standard [32] for 816 h and allowed us to estimate and compare the corrosion behavior of the different materials. This test was performed on three samples for each stainless-steel grade with finishing coupling for a total of 30 samples. Daily inspections and a weekly photographic report of the macroscopic and microscopic state of the surface were performed. As expected, lower PREN grades underwent corrosion before the higher PREN ones, and AISI 304L and 316L samples did not show any sign of corrosion after ~one month. Moreover, among the stainless-steel grades that showed signs of corrosion, the drawn ones were characterized by an earlier appearance of pits with respect to the ground ones, as reported in Table 7, confirming the better resistance to localized corrosion of the latter.

Atmospheric Corrosion Test

Atmospheric corrosion tests were performed exposing 20 samples for 9 months to an urban environment and 20 samples to a marine environment, according to the ASTM G50 standard [33]. In particular, the outdoor exposure class of the marine environment according to the ISO 9223 standard was C3 marine, with chloride deposition rates higher than 60 mgm−2d−1, and a very small presence of SO2 and other contaminants. The urban environment presented higher SO2 concentrations and belonged to the C3 class, with an almost nil presence of chlorides.
At the end of the exposure period to the urban atmosphere, only the surfaces of drawn AISI 430F and AISI 430 specimens showed staining signs, while none of the samples showed signs of pitting attack. Figure 4 shows the samples at the beginning and at the end of the exposure to the urban environment. As expected, due to the high chloride content, the marine environment proved more dangerous than the urban one. Indeed, all the samples showed staining—the first sign of initiation of the corrosion process—but still, none of them presented any pits.
Table 8 reports the staining initiation time for the tested materials. The effects of the marine environment after 80, 210 and 270 days for both drawn and ground AISI 430F samples are shown as an example in Figure 5.

3.5. Localized Corrosion Resistance

All the data collected from surface characterization tests and corrosion experiments allowed a comprehensive evaluation of the corrosion resistance of five stainless-steel grades treated with two different surface finishings in oxidizing environments with various chloride concentrations. The results are summarized in Table 9, where the red color corresponds to low resistance values, the yellow color corresponds to medium resistance values, and the green color corresponds to high resistance values. Stainless steels that displayed a better behavior overall are ground AISI 304L and AISI 316L. Despite the lowest PREN index, AISI 430 showed a good behavior in the electrochemical tests (potentiodynamic and potentiodynamic polarization test); nevertheless, the salt spray test and long-term marine exposure showed corrosion attacks on this alloy.
The results show that the ground finishing process on stainless-steel bars increases the resistance to pitting corrosion, as expected from the linear roughness profiles of the specimens. Roughness is then a parameter that should always be considered in the material selection process. Comparing the different tests, the effect of surface finishing and alloy chemical composition can be clearly observed in the salt spray test and with long-term marine exposure. On the other hand, the accelerated immersion test with ferric chloride seems to be too harsh, due to the strong corrosiveness of the solution; thus, a significative effect of surface finishing and steel chemical composition on corrosion resistance was not observed, except for AISI 430F, which showed uniform corrosion. In an urban atmosphere, all the stainless-steel grades showed no corrosion attacks, regardless of the surface finishing.

4. Conclusions

The present work discussed the influence of two cold surface finishes (drawn and ground) of five stainless steel grades on localized corrosion resistance in chloride-containing environments.
As expected, surface finishing is a key parameter for the assessment of localized corrosion resistance, especially in the presence of chloride ions. Ground surface finishing provided the best results in terms of corrosion resistance in all the tested conditions where pitting and crevice corrosion was a threat.
Electrochemical tests, namely, the potentiodynamic and potentiostatic anodic polarization tests in chloride-containing solution, confirmed the influence of surface finishing: stainless-steel specimens with grounded finishing present a higher pitting potential than those with drawn finishing. Minor effects were observed on repassivation potential. In the potentiostatic test, a higher critical chloride concentration for pitting initiation was found in the case of ground specimens, even if the effect of surface finishing was found to be secondary with respect to the alloy chemical composition.
Comparing the different tests, the effect of surface finishing and alloy chemical composition can be clearly observed in the salt spray test and long-term marine exposure test, especially for low-alloyed stainless steels. While a negligible effect of finishing and chemical composition was observed in the urban atmosphere for all the materials, in the marine atmosphere, staining was observed on AISI 430, AISI 430F, and AISI 303 stainless steels with both drawn and ground surfaces. A similar trend was obtained in the accelerated corrosion salt spray test. As a rule of thumb, ground-finished samples kept their pristine aspect for about 20–30% longer with respect to the drawn-finished ones in the marine exposure test. On the other hand, the accelerated immersion test in ferric chloride seems to be too severe, due to the strong corrosiveness of the solution; thus, a significative effect of surface finishing and steel chemical composition on corrosion resistance was not observed, except for AISI 430F, which showed uniform corrosion attacks.

Author Contributions

Conceptualization, F.C., F.B., M.O.; methodology: E.M., L.C., L.P., M.O. and A.B.; writing—original draft preparation, E.M., L.C., L.P., M.O. and A.B.; writing—review and editing, E.M., F.B., M.O. and A.B. All authors have read and agreed to the published version of the manuscript.

Funding

This research received no external funding.

Institutional Review Board Statement

Not applicable.

Informed Consent Statement

Not applicable.

Data Availability Statement

The data presented in this study are available on request from the corresponding author.

Acknowledgments

We thank Rodacciai S.p.A. for having supplied the material and RTM Breda laboratories (Cormano, Milan) for salt spray corrosion testing.

Conflicts of Interest

The authors declare no conflict of interest.

References

  1. Baroux, B. Further Insights on the Pitting Corrosion of Stainless Steels. In Corrosion Mechanisms in Theory and Practice: Third Edition; CRC Press: Boca Raton, FL, USA, 2011; pp. 419–448. [Google Scholar]
  2. EN 10088-1:2014; Stainless Steels: List of Stainless Steels. European Standard: Brussels, Belgium, 2014.
  3. Eiselstein, L.E.; Huet, R.; Kruger, J.; Verink, E.D., Jr.; Staehle, R.W.; Nessim, M.; Verink, E.D., Jr.; Verink, E.D., Jr.; Thompson, W.T.; Kaye, M.H.; et al. Uhlig’s Corrosion Handbook, 3rd ed.; Revie, R.W., Ed.; Wiley: Hoboken, NJ, USA, 2011; p. 1296. ISBN 978-0-470-87286-4. [Google Scholar] [CrossRef]
  4. Pedeferri, P. Corrosion Science and Engineering, 1st ed.; Engineering Materials; Springer International Publishing: Cham, Switerland, 2018; ISBN 978-3-319-97625-9. [Google Scholar] [CrossRef]
  5. Sedriks, A.J. Corrosion of Stainless Steel, 2nd ed.; U.S. Department of Energy Office of Scientific and Technical Information: Oak Ridge, TN, USA, 1996; ISBN 978-0-471-00792-0. [Google Scholar]
  6. Iversen, A.; Leffler, B. Aqueous Corrosion of Stainless Steels. In Shreir’s Corrosion; Elsevier: Amsterdam, The Netherlands, 2010; pp. 1802–1878. [Google Scholar] [CrossRef]
  7. Sedriks, A.J. Effects of Alloy Composition and Microstructure on the Passivity of Stainless Steels. Corrosion 1986, 42, 376–389. [Google Scholar] [CrossRef]
  8. Ilevbare, G.O.; Burstein, G.T. The role of alloyed molybdenum in the inhibition of pitting corrosion in stainless steels. Corros. Sci. 2001, 43, 485–513. [Google Scholar] [CrossRef]
  9. Olefjord, I.; Wegrelius, L. The influence of nitrogen on the passivation of stainless steels. Corros. Sci. 1996, 38, 1203–1220. [Google Scholar] [CrossRef]
  10. Rhouma, A.B.; Sidhom, H.; Braham, C.; Lédion, J.; Fitzpatrick, M.E. Effects of surface preparation on pitting resistance, residual stress, and stress corrosion cracking in austenitic stainless steels. J. Mater. Eng. Perform. 2001, 10, 507–514. [Google Scholar] [CrossRef]
  11. Peguet, L.; Malki, B.; Baroux, B. Influence of cold working on the pitting corrosion resistance of stainless steels. Corros. Sci. 2007, 49, 1933–1948. [Google Scholar] [CrossRef]
  12. Fontana, M.G. Corrosion Engineering; McGraw-Hill Book Company: New York, NY, USA, 1986; ISBN 978-0-07-293973-6. [Google Scholar]
  13. Szklarska-Smialowska, Z. Pitting Corrosion of Metals; Pitting Corrosion of Metals; National Association of Corrosion Engineers (NACE): Houston, TX, USA, 1986; p. 431. [Google Scholar] [CrossRef] [Green Version]
  14. Štefec, R.; Franz, F. A study of the pitting corrosion of cold-worked stainless steel. Corros. Sci. 1978, 18, 161–168. [Google Scholar] [CrossRef]
  15. Frankel, G.S. Pitting Corrosion of Metals: A Review of the Critical Factors. J. Electrochem. Soc. 1998, 145, 2186–2198. [Google Scholar] [CrossRef]
  16. Shibata, T. Statistical and Stochastic Approaches to Localized Corrosion. Corrosion 1996, 52, 813–830. [Google Scholar] [CrossRef]
  17. Brenna, A.; Bolzoni, F.; Lazzari, L.; Ormellese, M. Predicting the risk of pitting corrosion initiation of stainless steels using a Markov chain model. Mater. Corros. 2018, 69, 348–357. [Google Scholar] [CrossRef]
  18. Salvago, G.; Taccani, G.; Fumagalli, G. Corrosion potential and breakdown potential distributions for stainless steels in seawater. In Proceedings of the CORROSION 96, Denver, CO, USA, 24–29 March 1996. [Google Scholar]
  19. Dastgerdi, A.A.; Brenna, A.; Ormellese, M.; Pedeferri, M.; Bolzoni, F. Electrochemical methods for the determination of Pedeferri’s diagram of stainless steel in chloride containing environment. Mater. Corros. 2019, 70, 9–18. [Google Scholar] [CrossRef] [Green Version]
  20. Dastgerdi, A.A.; Brenna, A.; Ormellese, M.; Pedeferri, M.; Bolzoni, F. Experimental design to study the influence of temperature, pH, and chloride concentration on the pitting and crevice corrosion of UNS S30403 stainless steel. Corros. Sci. 2019, 159, 108160. [Google Scholar] [CrossRef] [Green Version]
  21. Laycock, N.J.; Stewart, J.; Newman, R.C. The initiation of crevice corrosion in stainless steels. Corros. Sci. 1997, 39, 1791–1809. [Google Scholar] [CrossRef]
  22. Szklarska-Smialowska, Z.; Mankowski, J. Crevice corrosion of stainless steels in sodium chloride solution. Corros. Sci. 1978, 18, 953–960. [Google Scholar] [CrossRef]
  23. Bolzoni, F.; Contreras, G.; Fumagalli, G.; Lazzari, L.; Re, G. Localized corrosion: An empirical approach to the study of passive film breakdown rates. Corrosion 2013, 69, 352–363. [Google Scholar] [CrossRef]
  24. Hilbert, L.R.; Bagge-Ravn, D.; Kold, J.; Gram, L. Influence of surface roughness of stainless steel on microbial adhesion and corrosion resistance. Int. Biodeterior. Biodegrad. 2003, 52, 175–185. [Google Scholar] [CrossRef]
  25. Halamova, M.; Liptakova, T.; Alaskari, A.; Bolzoni, F. Influence of surface structure on corrosion behaviour of welded stainless steel AISI 316L. Commun. Sci. Lett. Univ. Zilina 2014, 16, 78–83. [Google Scholar] [CrossRef]
  26. Zatkalíková, V.; Liptáková, T. Pitting corrosion of stainless steel at the various surface treatment. Mater. Eng. 2011, 18, 115–120. [Google Scholar]
  27. Grabke, H.J.; Muller-Lorenz, E.M.; Strauss, S.; Pippel, E.; Woltersdorf, J. Effects of grain size, cold working, and surface finish on the metal-dusting resistance of steels. Oxid. Met. 1998, 50, 241–254. [Google Scholar] [CrossRef]
  28. Mohammad, H.M.; Ahmed, F.S. Effects of Heat Treatment and Surface Finish on the Crevice Corrosion Resistance of Martensitic Stainless Steel. Basrah J. Eng. Sci. 2017, 17, 9–17. [Google Scholar] [CrossRef]
  29. Bellezze, T.; Viceré, A.; Giuliani, G.; Sorrentino, E.; Roventi, G. Study of Localized Corrosion of AISI 430 and AISI 304 Batches Having Different Roughness. Metals 2018, 8, 244. [Google Scholar] [CrossRef] [Green Version]
  30. ASTM G61-86; Test Method for Conducting Cyclic Potentiodynamic Polarization Measurements for Localized Corrosion Susceptibility of Iron-, Nickel-, or Cobalt-Based Alloys. ASTM International: West Conshohocken, PA, USA, 2018; p. 5. [CrossRef]
  31. ASTM G48-11; Test Methods for Pitting and Crevice Corrosion Resistance of Stainless Steels. ASTM International: West Conshohocken, PA, USA, 2020; p. 11. [CrossRef]
  32. ASTM B117-18; Society for Protective Coatings Standard Practice for Operating Salt Spray (FOG) Apparatus. ASTM International: West Conshohocken, PA, USA, 2018.
  33. ASTM G50-10; Practice for Conducting Atmospheric Corrosion Tests on Metals. ASTM International: West Conshohocken, PA, USA, 2015; p. 6. [CrossRef]
  34. DIN 4768:1990-05; Determination of Values of Surface Roughness Parameters Ra. Rz, Rmax Using Electrical Contact (Stylus) Instruments: Concepts and Measuring Conditions. Deutsches Institut für Norming Berlin: Berlin, Germany, 1990.
Figure 1. Microstructure of (a) AISI 430 drawn finishing, (b) AISI 430 ground finishing, (c) AISI 430F drawn finishing, (d) AISI 430F ground finishing, (e) AISI 303 drawn finishing, (f) AISI 303 ground finishing, (g) AISI 304L drawn finishing, (h) AISI 304L ground finishing, (i) AISI 316L drawn finishing, and (j) AISI 316L ground finishing.
Metals 12 01751 g001
Figure 2. Surface roughness linear profile of (a) AISI 430F with drawn finishing and (b) AISI 430F with ground finishing.
Metals 12 01751 g002
Figure 3. Potentiodynamic polarization curves of (a) AISI 430—ground finishing—100 ppm [Cl] -cross-section; (b) AISI 430—drawn finishing -100 ppm [Cl]—cross-section; (c) AISI 430—ground finishing—1000 ppm [Cl]—cross-section; (d) AISI 430—drawn finishing—1000 ppm [Cl]—cross-section. The different colors of the lines in the graphs correspond to different specimens.
Metals 12 01751 g003
Figure 4. Samples exposed to (a) urban atmosphere at time zero and (b) urban atmosphere after 295 days.
Metals 12 01751 g004
Figure 5. AISI 430F sample exposed to marine atmosphere after (a) 80 days—drawn finishing; (b) 210 days—drawn finishing; (c) 270 days—drawn finishing; (d) 80 days—ground finishing; (e) 210 days—ground finishing; and (f) 270 days—ground finishing.
Metals 12 01751 g005
Table 1. PREN and chemical composition (% weight) of SS grades.
AISIPRENC (wt.%)Si (wt.%)Mn (wt.%)P
(wt.%)
S
(wt.%)
Cr (wt.%)Mo (wt.%)N (wt.%)Cu (wt.%)Ni (wt.%)
43017<0.08<1.00<1.00<0.040<0.03016.0–18.0----
430F17.80.10–0.17<1.00<1.50<0.0400.15–0.3515.5–17.50.20–0.60---
30319.7<0.10<1.00<2.00<0.0450.15–0.3517.0–19.0-<0.10<1.008.0–10.0
304L20.2<0.030<1.00<2.00<0.045<0.03017.5–19.5-<0.10-8.0–10.5
316L26.6<0.030<1.00<2.00<0.045<0.03016.5–18.52.00–2.50--10.0–13.0
Table 2. Optical profilometry filter parameters.
Transverse (mm)Eval. Length (mm)Point Density (Points/mm)Filter TypeCut off λ (mm)Damping (%)Crack
Suppression
5.6 mm4500RC0.8075No
Table 3. Arithmetic mean roughness (Ra), mean roughness depth (Rz DIN), and maximum profile depth (Pt) for the different steel grades and surface finishes.
AISISurface
Finishing
Ra
(μm)
Rz DIN
(μm)
Pt
(μm)
430Drawn0.4964.1356.558
430Ground0.3522.5833.563
430FDrawn0.9757.57915.332
430FGround0.3612.6392.672
303Drawn0.5194.6908.641
303Ground0.3942.6223.525
304LDrawn1.0727.08312.764
304LGround0.3052.0072.918
316LDrawn0.8505.9958.021
316LGround0.4112.7503.750
Table 4. Pitting potential (Ep) and repassivation potential (Erep) as a function of surface finishing and chloride content for each steel grade tested. All the reported potential values are versus Ag/AgCl/KClsat.
Cross-SectionLateral Surface
AISISurface
Finishing
1000 mg/L Chlorides100 mg/L Chlorides100 mg/L Chlorides
Ep
(V)
Erep
(V)
Ep
(V)
Erep
(V)
Ep
(V)
Erep
(V)
430Ground0.28−0.100.42−0.100.380.06
430Drawn0.13−0.250.27−0.190.27−0.05
430FGroundactiveactiveactiveactive0.06−0.11
430FDrawnactiveactiveactiveactive0.13−0.15
303Ground0.12−0.210.17−0.210.380.08
303Drawn0.09−0.140.19−0.190.350.14
304LGround0.17−0.090.25−0.010.490.19
304LDrawn0.110.020.200.040.410.20
316LGround0.20−0.090.36−0.020.550.25
316LDrawn0.18−0.040.23−0.040.420.21
Table 5. Critical chloride concentration in potentiostatic polarization tests.
AISISurface FinishingChlorides at Initiation Time
(mg/L)
430Drawn300–1000
430Ground3000
430FDrawn10–30
430FGround10
303Drawn100–300
303Ground30–100
304LDrawn100–1000
304LGround1000–>10,000
316LDrawn3000–10,000
316LGround>10,000
Table 6. Results of the sample analysis performed at the end of the FeCl3 immersion test (n.a. = data not available).
AISISurface
Finishing
Mass Loss
Crevice
(g)
Mass Loss
Pitting
(g)
Average Pit Density (Pit/cm2)
430Drawn1.451.6212.07
430Ground1.421.061.86
430FDrawn1.701.69Uniform corrosion
430FGround1.661.69Uniform corrosion
303Drawn1.121.236.03
303Ground1.131.314.32
304LDrawn1.030.954.43
304LGround1.391.05n.a.
316LDrawn1.150.925.46
316LGround1.591.366.14
Table 7. Pitting initiation times and pit density at the end of the salt spray corrosion test.
AISISurface FinishingPit Initiation (h)Pit Density (Pit/cm2)
430Drawn3360.74
430Ground5040.46
430FDrawn722.04
430FGround722.91
303Drawn3360.16
303Ground5040.36
304LDrawn--
304LGround--
316LDrawn--
316LGround--
Table 8. Results of visual inspection of specimens exposed to marine atmosphere.
AISI430430F303304L316L
GroundDrawnGroundDrawnGroundDrawnGroundDrawnGroundDrawn
Staining
initiation time (days)
78357878207207267207267267
Table 9. Localized corrosion resistance results: G = ground and D = drawn.
SampleAISI 430AISI 430FAISI 303AISI 304LAISI 316L
GDGDGDGDGD
Salt spray test
Marine atmosphere
Urban atmosphere
FeCl3 solution
Potentiodynamic test—1000 ppm [Cl]
Potentiodynamic test—100 ppm [Cl]
Publisher’s Note: MDPI stays neutral with regard to jurisdictional claims in published maps and institutional affiliations.

