
Comparison of the Warm Deformation Constitutive Model of GH4169 Alloy Based on Neural Network and the Arrhenius Model
1
China Productivity Center for Machinery, China Academy of Machinery Science and Technology, Beijing 100044, China
2
School of Materials Science and Engineering, University of Science and Technology Beijing, Beijing 100083, China
*
Author to whom correspondence should be addressed.
Metals 2022, 12(9), 1429; https://doi.org/10.3390/met12091429
Submission received: 11 July 2022
/
Revised: 11 August 2022
/
Accepted: 13 August 2022
/
Published: 29 August 2022
Abstract
:In order to realize a better description of plastic flow behavior in the warm deformation process of GH4149, the GH4169 superalloy was compressed by Gleeble-3800 at a temperature of 700–900 °C and a strain rate of 0.01–10 s−1. The constitutive model of GH4169 superalloy was established using artificial neural network (ANN) and the Arrhenius equation, and the accuracy of the model was compared. The results show that the average absolute relative error (AARE) of the ANN constitutive model is 4.34%. The AARE of the Arrhenius equation constitutive model is 29.95%. The ANN constitutive model is more accurate than the Arrhenius constitutive model, and has consistent accuracy in the whole parameter range. The stress–strain curve obtained by the model is in good agreement with the experimental curve. The process of the warm compression test is simulated by finite element software importing the ANN constitutive material model. The results verified the reliability of the model. The ANN constitutive model can effectively predict the flow stress of GH4169 superalloy during the warm deformation process.
1. Introduction
GH4169 alloy is an Ni-Cr-Fe-based deformation superalloy strengthened by body-centered cubic Ni3Nb (γ’’) and face-centered cubic Ni3(Al,Ti,Nb) (γ’) precipitation [1,2]. GH4169 alloy has good comprehensive mechanical properties and excellent fatigue and corrosion resistance and is a key material widely used in the aviation, aerospace, petrochemical, and nuclear energy fields [3,4,5]. However, owing to the large deformation resistance of GH4169 alloy in the process of hot processing and sensitivity to processing technology, many scholars have carried out corresponding research on the thermal deformation characteristics, microstructure, and properties of GH4169 [6,7]. Most scholars are concerned with the thermal deformation behavior and constitutive model of GH4169 alloy [8,9,10]. Their potential will be fully developed when the properties of materials in the range of deformation temperature and strain rate are fully understood, especially in engineering applications. Therefore, it is of great significance to study the warm deformation behavior of GH4169, and to construct the constitutive model for the engineering application of GH4169 alloy.
During hot deformation, the thermomechanical process exhibits complicated behaviors in deformation variables. The complexity of hot deformation behavior leads to providing the constitutive models for predicting the flow stress [11]. The constitutive model is used to describe the relationship between flow stress and strain, strain rate, and temperature, and can be used to study the warm deformation behavior. At present, the Arrhenius constitutive equation is one of the most widely used phenomenological models to describe the relationship between true stress, true strain, and deformation temperature during Ni alloy and Inconel 718 alloy deformation [12,13]. Ning et al. [10] investigated the hot deformation behavior (flow behavior, constitutive model, and processing map) of GH4169 superalloy at a temperature range between 940 and 1060 °C. However, the Arrhenius model can be only used to describe the plastic flow behavior accurately at high temperatures and strain rates [14]. Therefore, it is necessary to explore a high-precision constitutive model that can describe the warm deformation behavior of GH4169 alloy.
With the development of computer technology, artificial neural network (ANN) has been successfully applied to predict thermal deformation behavior under different processing conditions. Compared with the phenomenological model, the ANN model has a more powerful ability to simulate highly accurate non-linear data and may also keep the core data in memory [15]. The ANN model requires minimal awareness about the state of the physical background of the process. The structure of the ANN model is composed of three main layers, namely, the input layer, hidden layer, and output layer, which determine the myriad of ways the various neurons are interconnected to one another [16]. Liu et al. [17] used an ANN model to predict the flow stress for W18Cr4V steel. Compared with the prediction method of flow stress using the Zener–Holloman parameter and hyperbolic sine stress function, the prediction method using the ANN model has higher efficiency and accuracy. Chen et al. [18] established three kinds of constitutive models, including the Arrhenius-type (AT) model, physical-based (PB) model, and ANN model, in which the ANN model can precisely depict the hot deformation features of Inconel 625 superalloy. Huang et al. [19] compared four flow stress models characterizing the constitutive behavior of hot deformation of 40 Mn steel. The results show that the ANN model can not only perform a highly accurate non-linear fit of the flow stress, but also can significantly improve the prediction accuracy of numerical simulations for hot forming processes after coupling of a finite element solver. Churyumov et al. [20] built a novel ANN model to determine the steel flow stress with high accuracy (the error was 6.6%) in the wide range of concentrations of the elements in high-alloyed, corrosion-resistant steels. Ren et al. [21] constructed a strain-compensated Arrhenius model and an ANN model to predict the flow behavior of the alloy. The results show that the ANN model shows a better predictability with a lower average absolute relative error of 2.24%.
In this work, the GH4169 alloy warm compression test was performed to obtain the data of flow stress–strain curves. The flow stress–strain curves were used to establish the constitutive model by ANN and the Arrhenius constitutive equation, respectively. Meanwhile, in order to select a high-precision constitutive model, the error was analyzed and compared. Finally, the compression of the superalloy during warm deformation was simulated and verified via finite element simulation method.
2. Materials and Methods
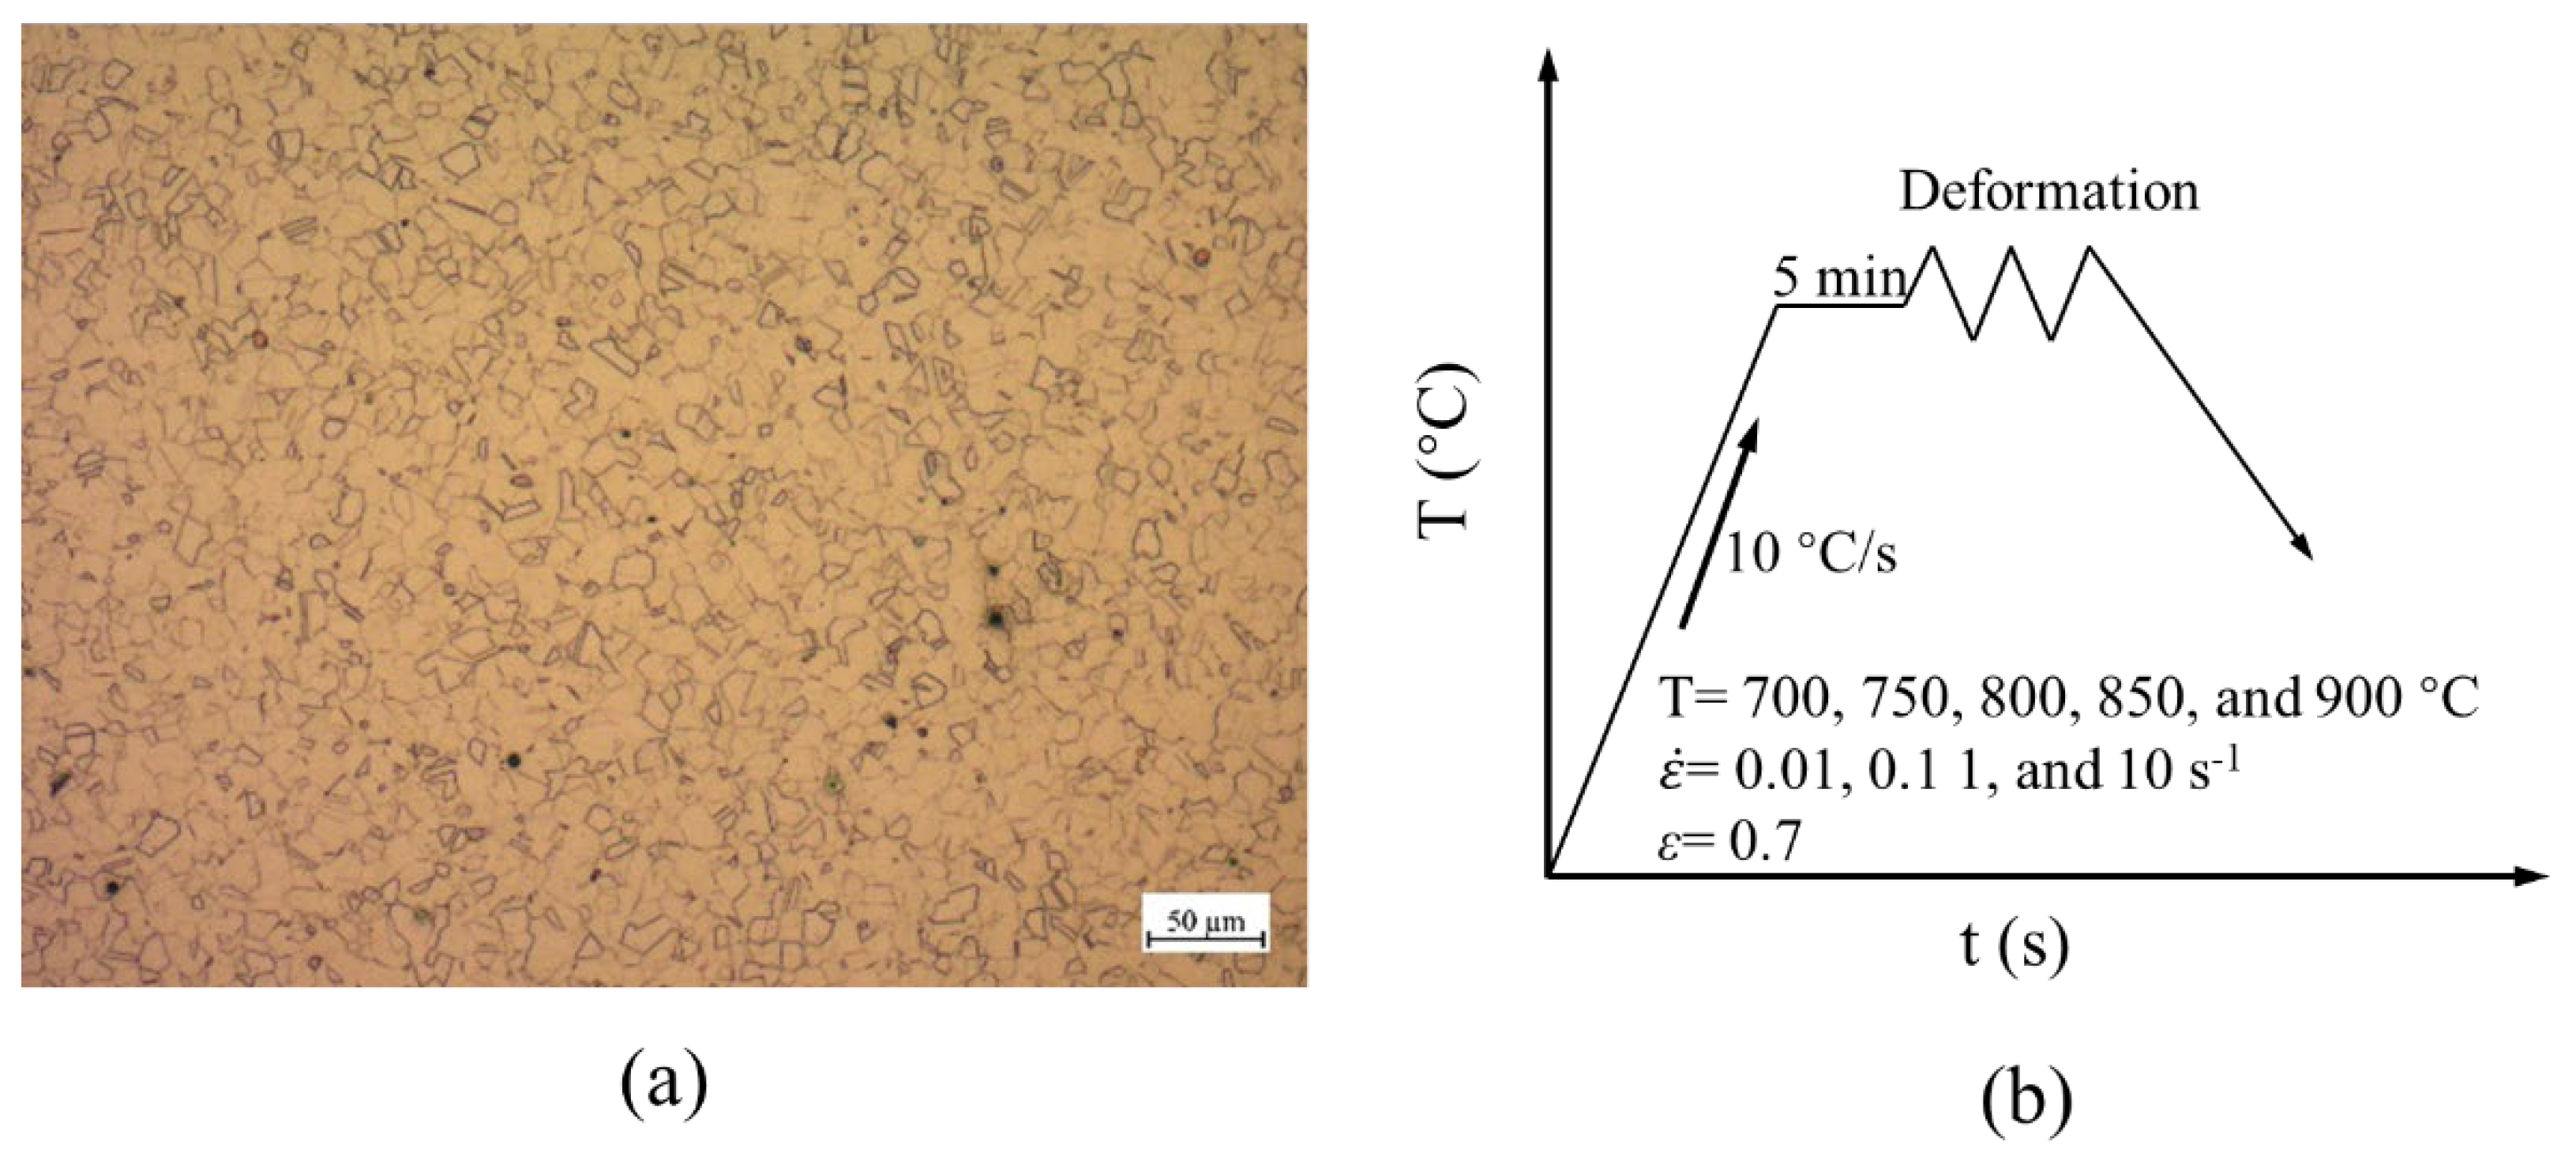
The commercial as-extruded GH4169 alloy (UNS NO7718) was employed as experimental material in this study and its chemical composition is shown in Table 1, which was measured by an optical spectrometer. Figure 1a is the initial microstructure and the average grain size is about 13.6 μm. Cylindrical specimens of 8 mm diameter and 12 mm height were machined to carry out the compression tests. The compression was tested via a Gleeble 3800 thermo-mechanical simulator. To reduce the friction, the specimens were polished with metallographic sandpaper, and lubricated with tantalum sheets coated with graphite during the deformation process. Figure 1b is a schematic diagram of the compression process. First, the specimens were heated to the deformation temperature with a heating rate of 10 °C/s, and then maintained for 5 min to homogenize the microstructure. The compression tests were conducted over a range of strain rates (10, 1, 0.1, and 0.01 s−1) and temperatures (700 °C, 750 °C, 800 °C, 850 °C, and 900 °C). The true strain is 0.7. The compression chamber was preserved in an argon state.
3. Results and Discussion
3.1. Flow Stress Curves
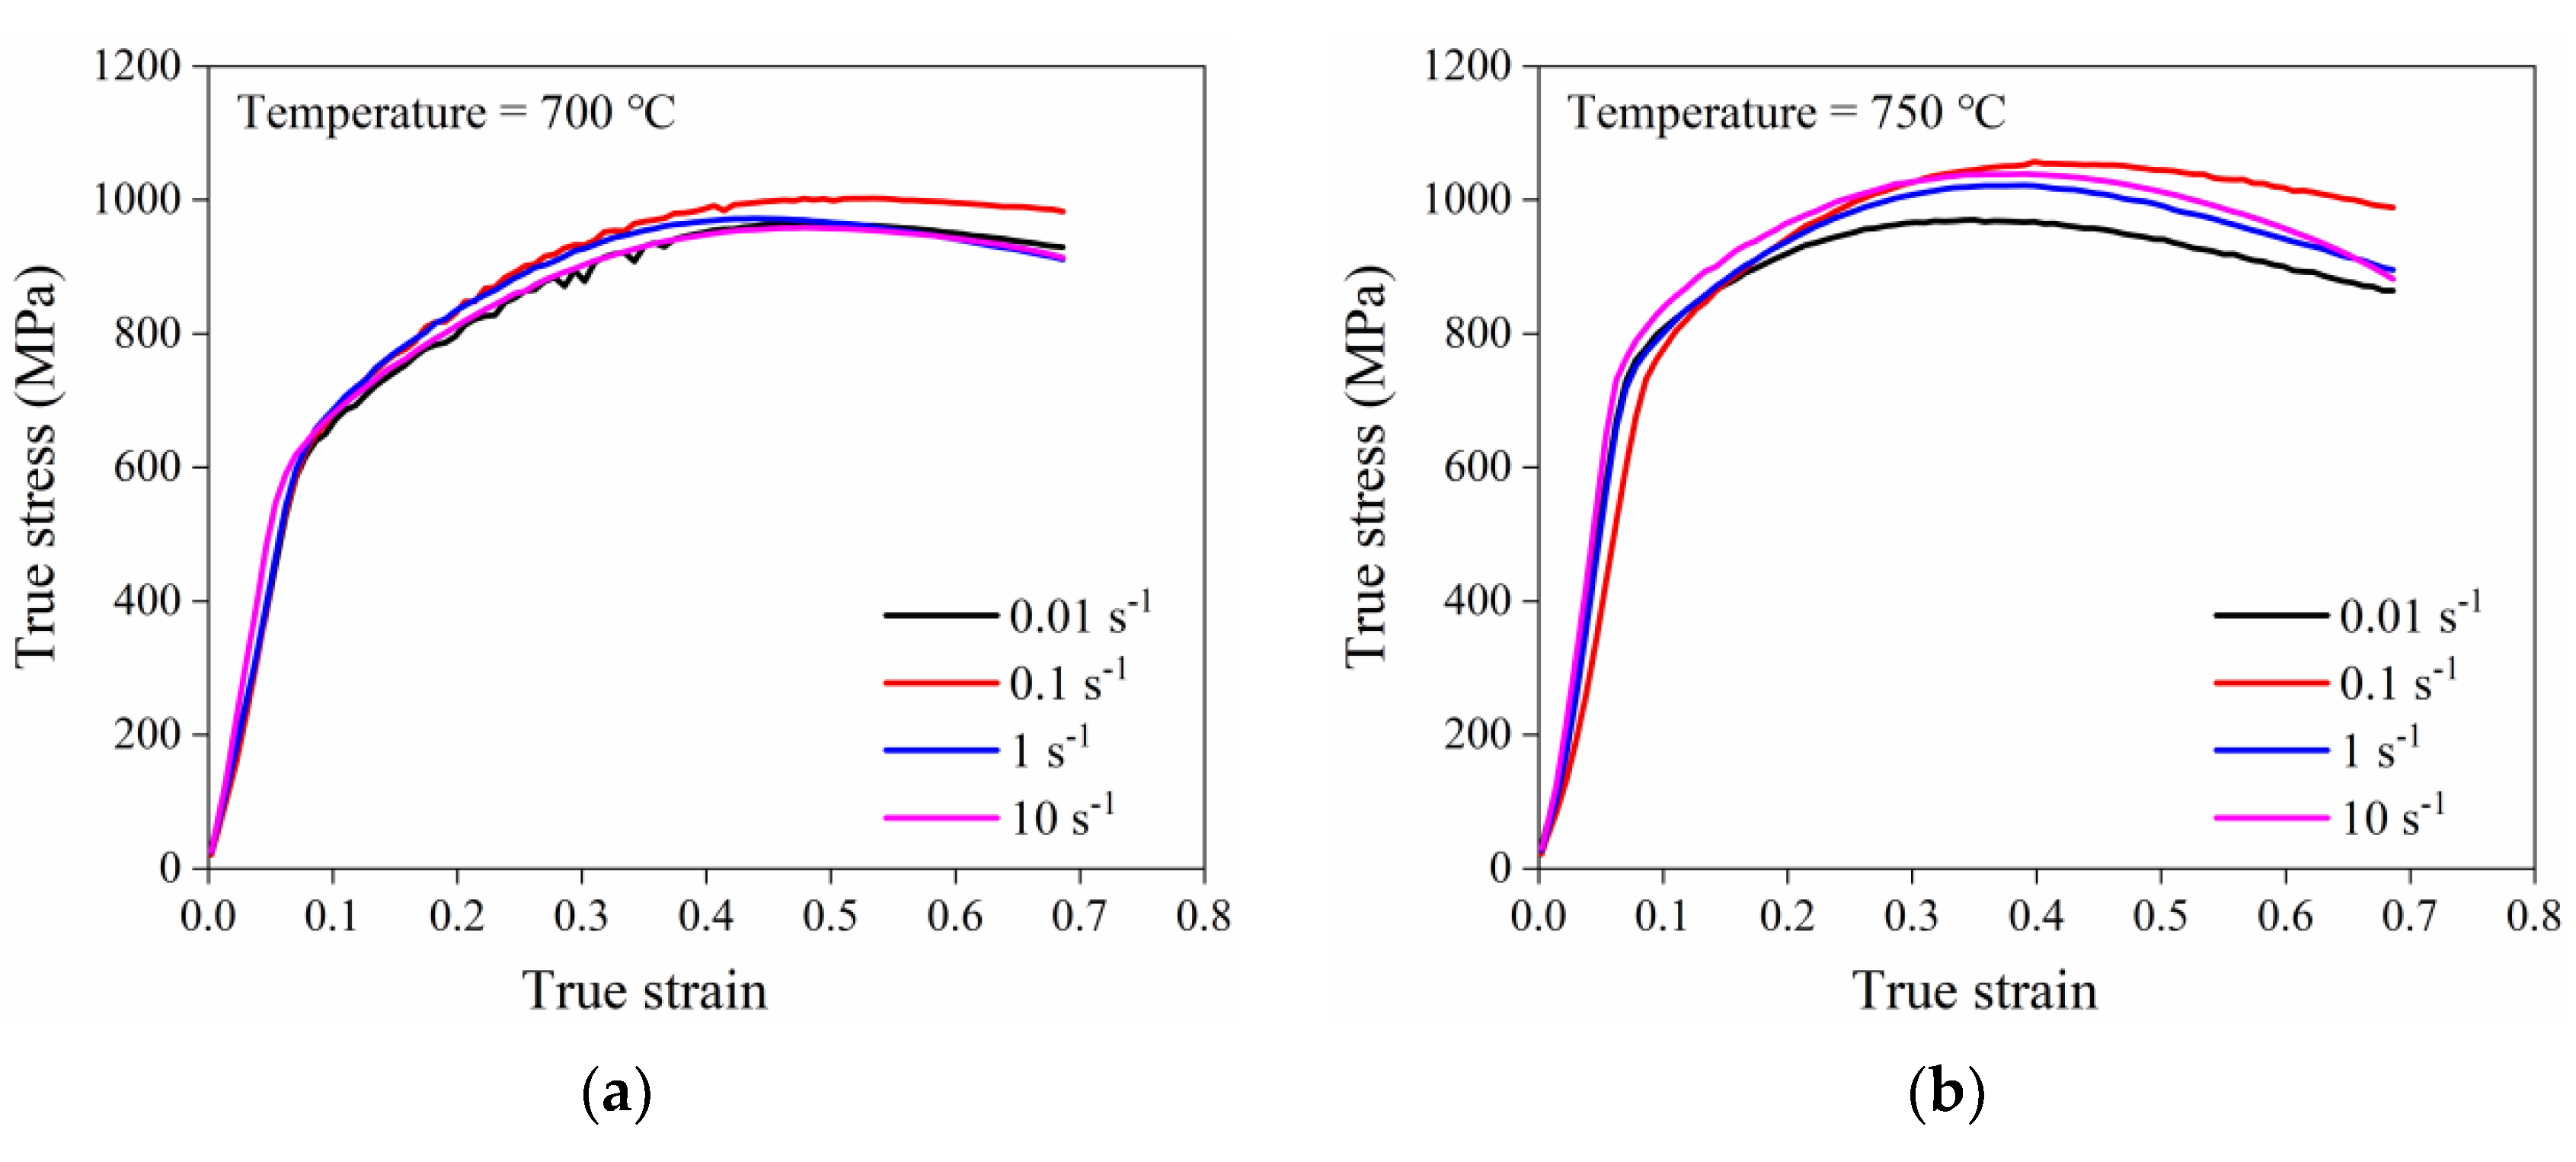
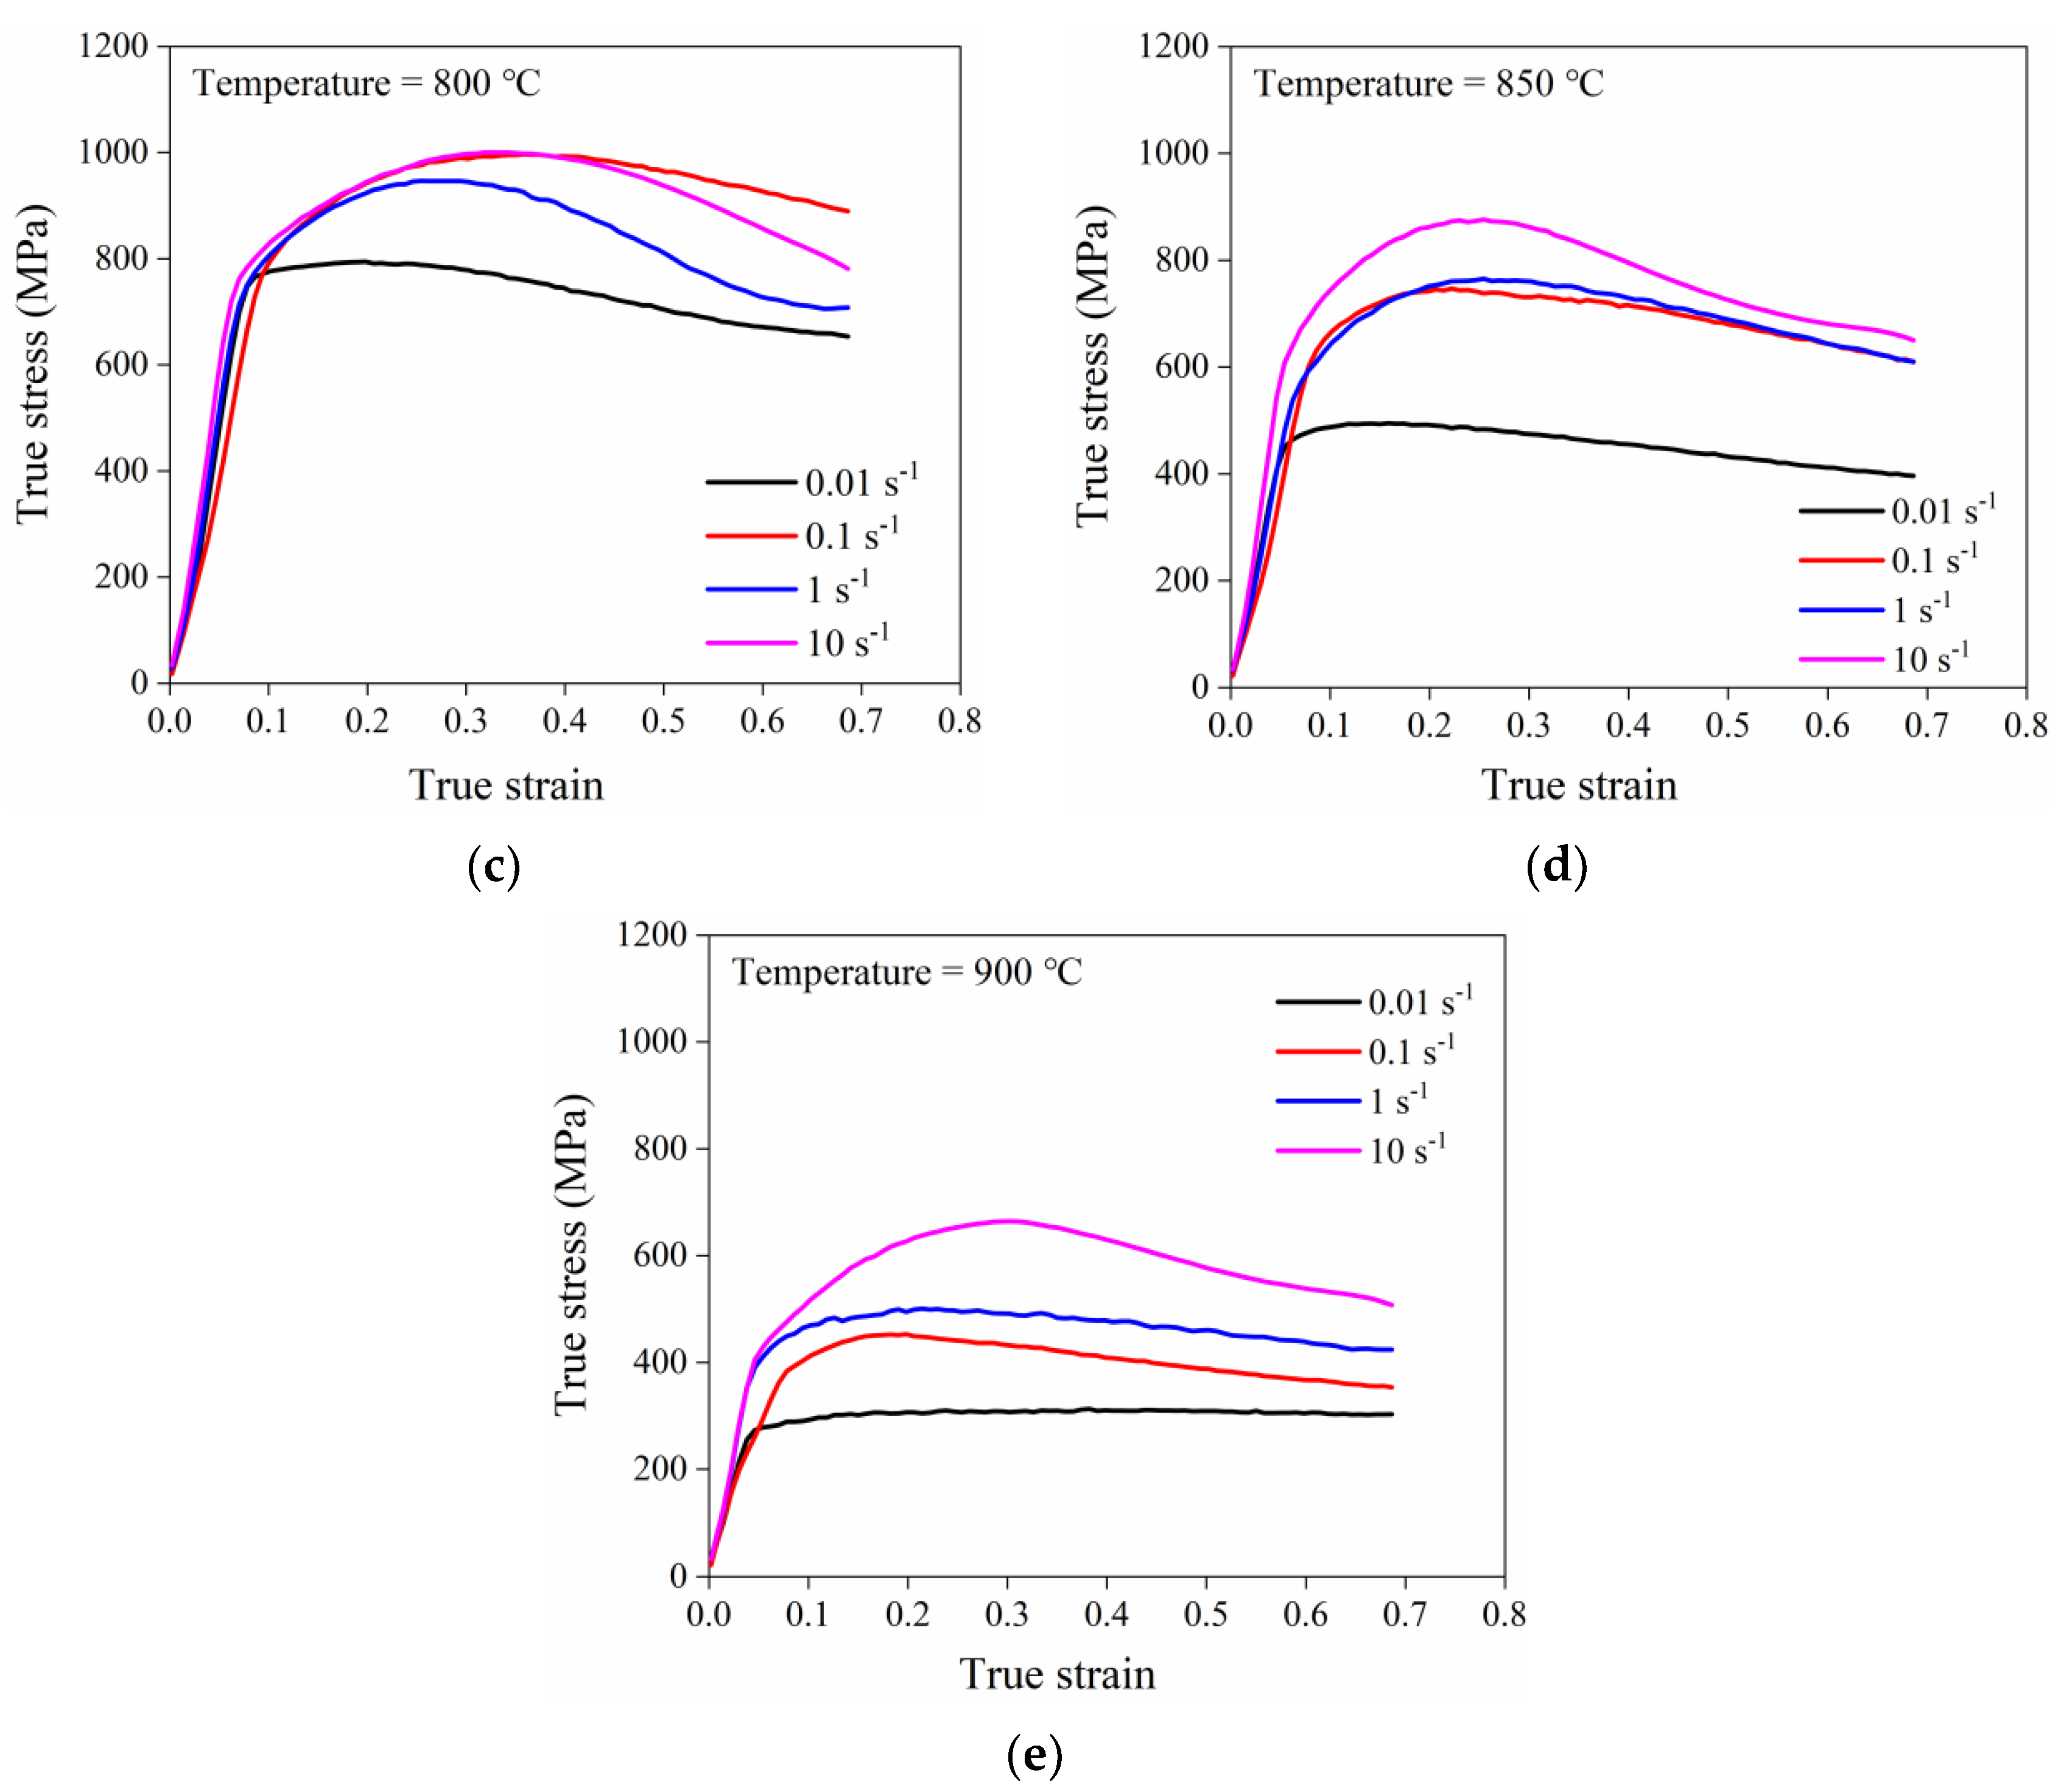
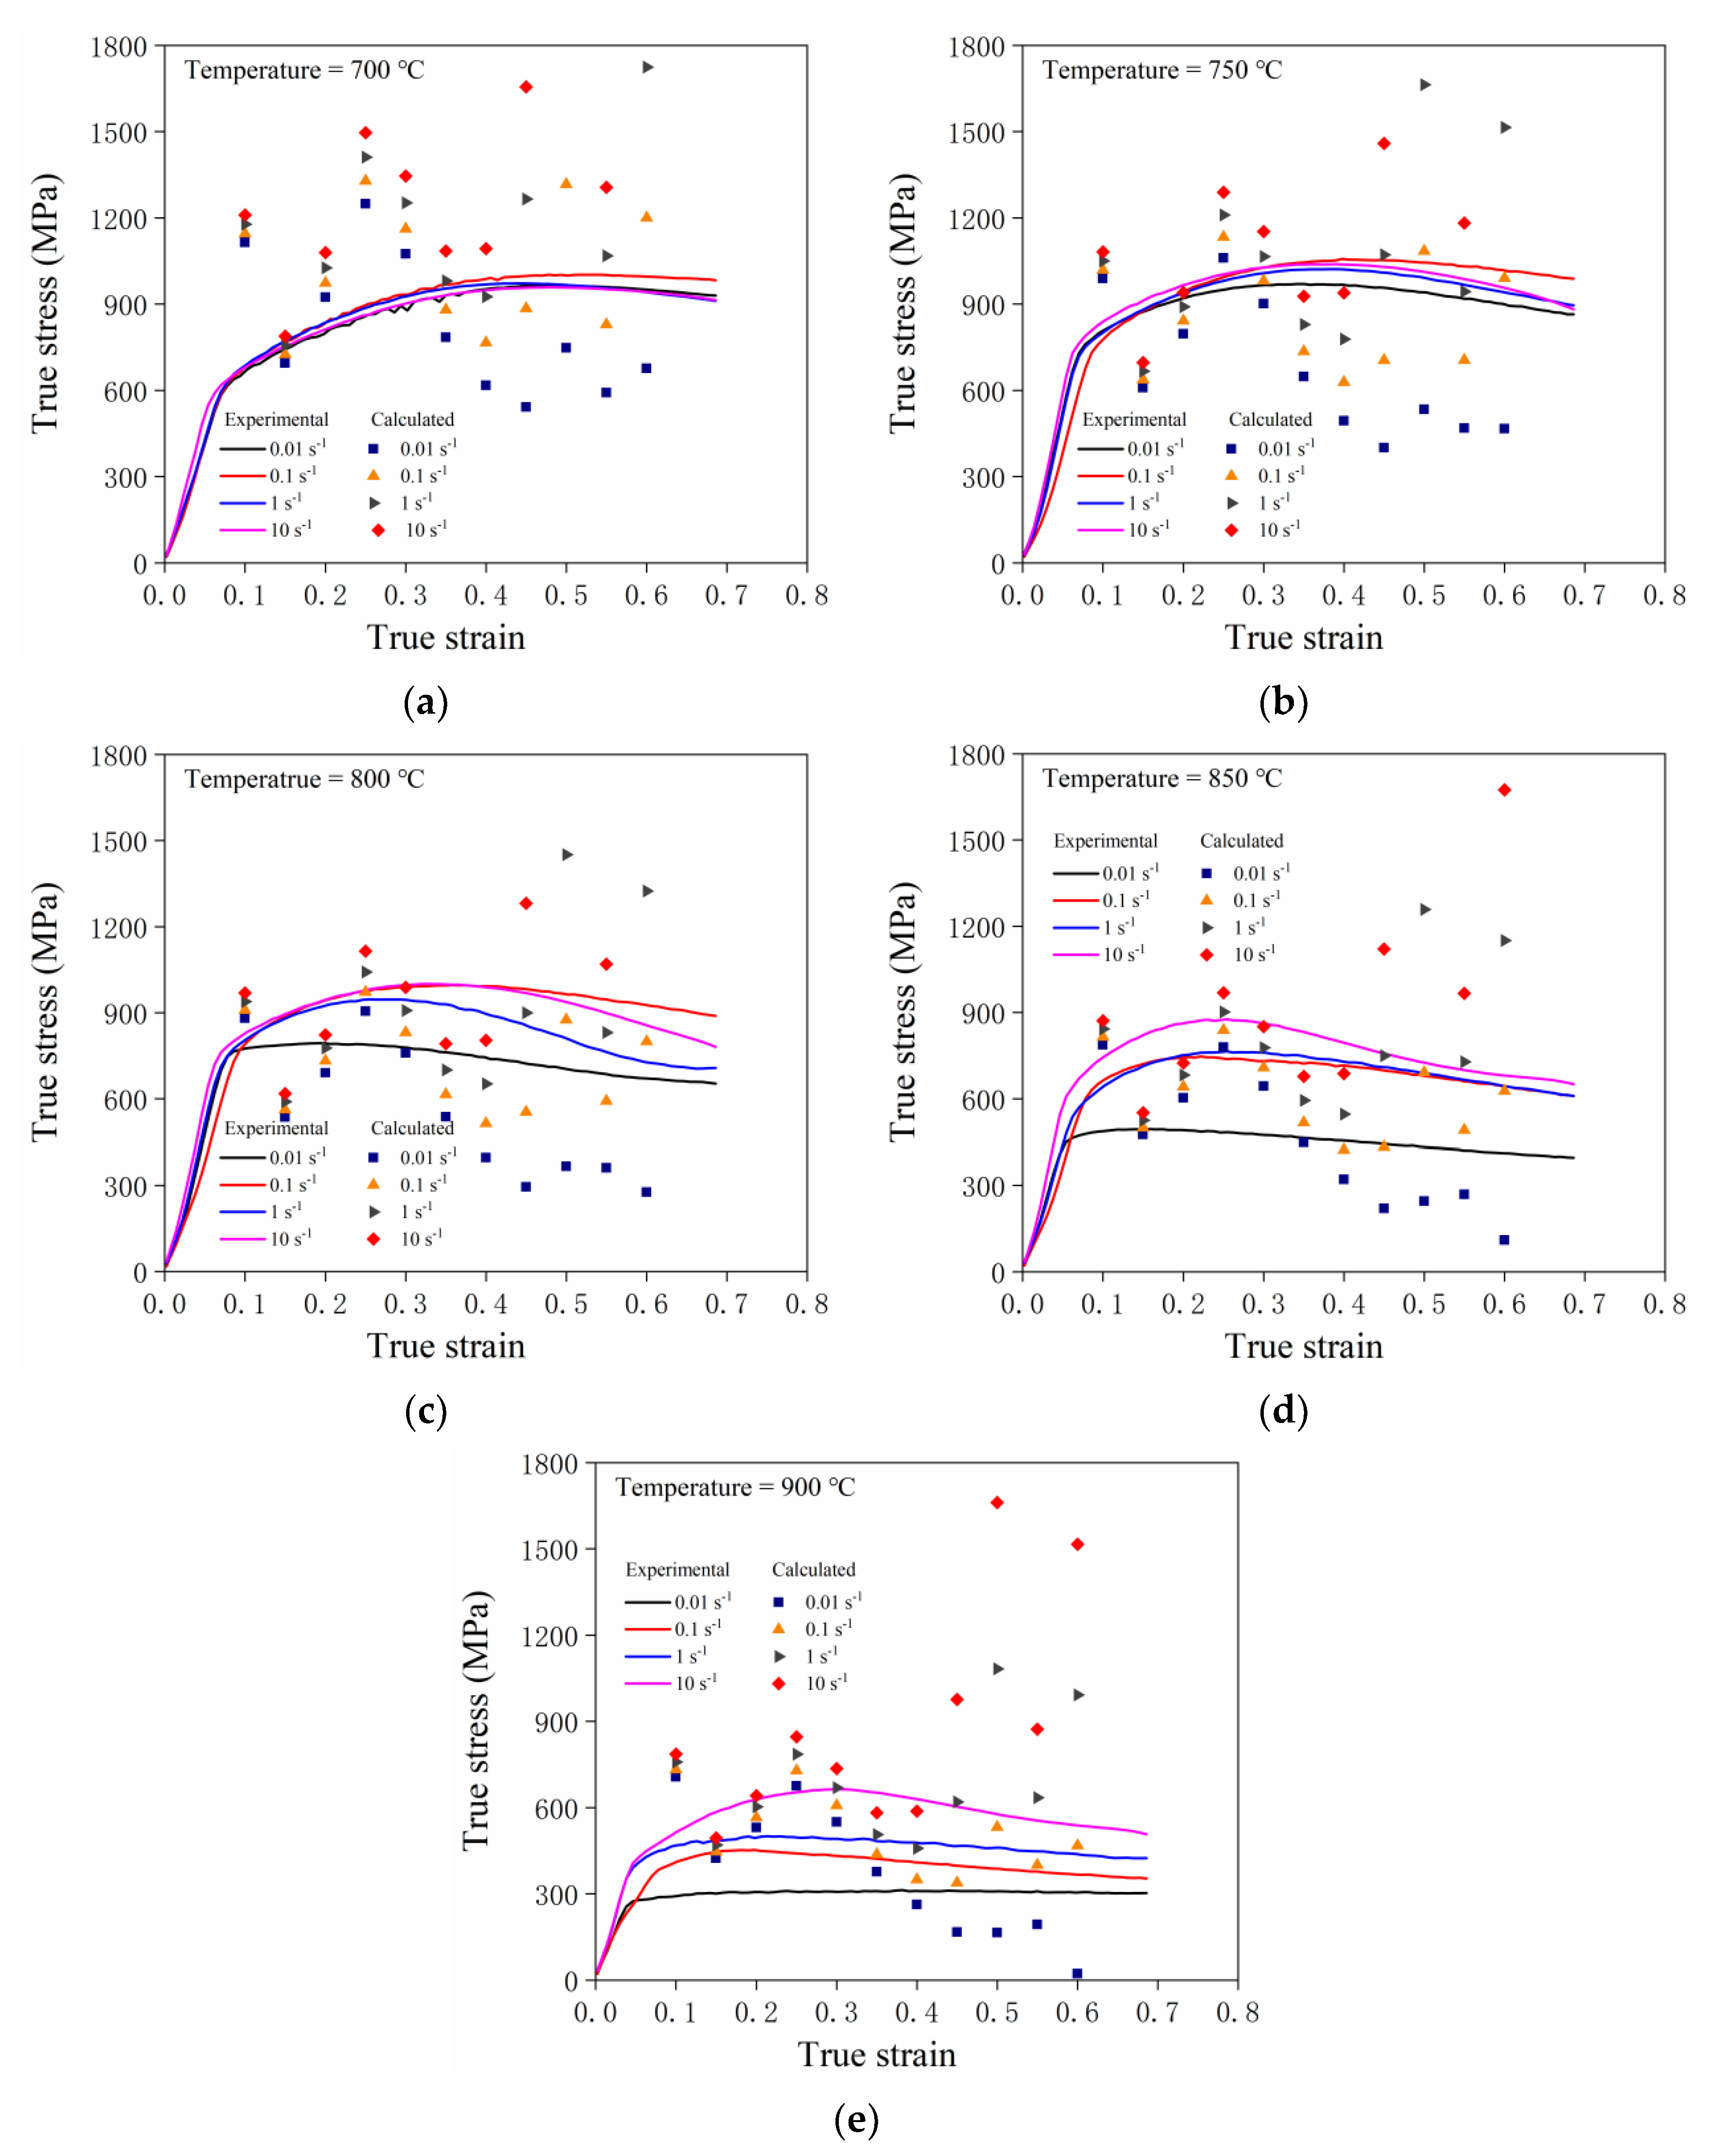
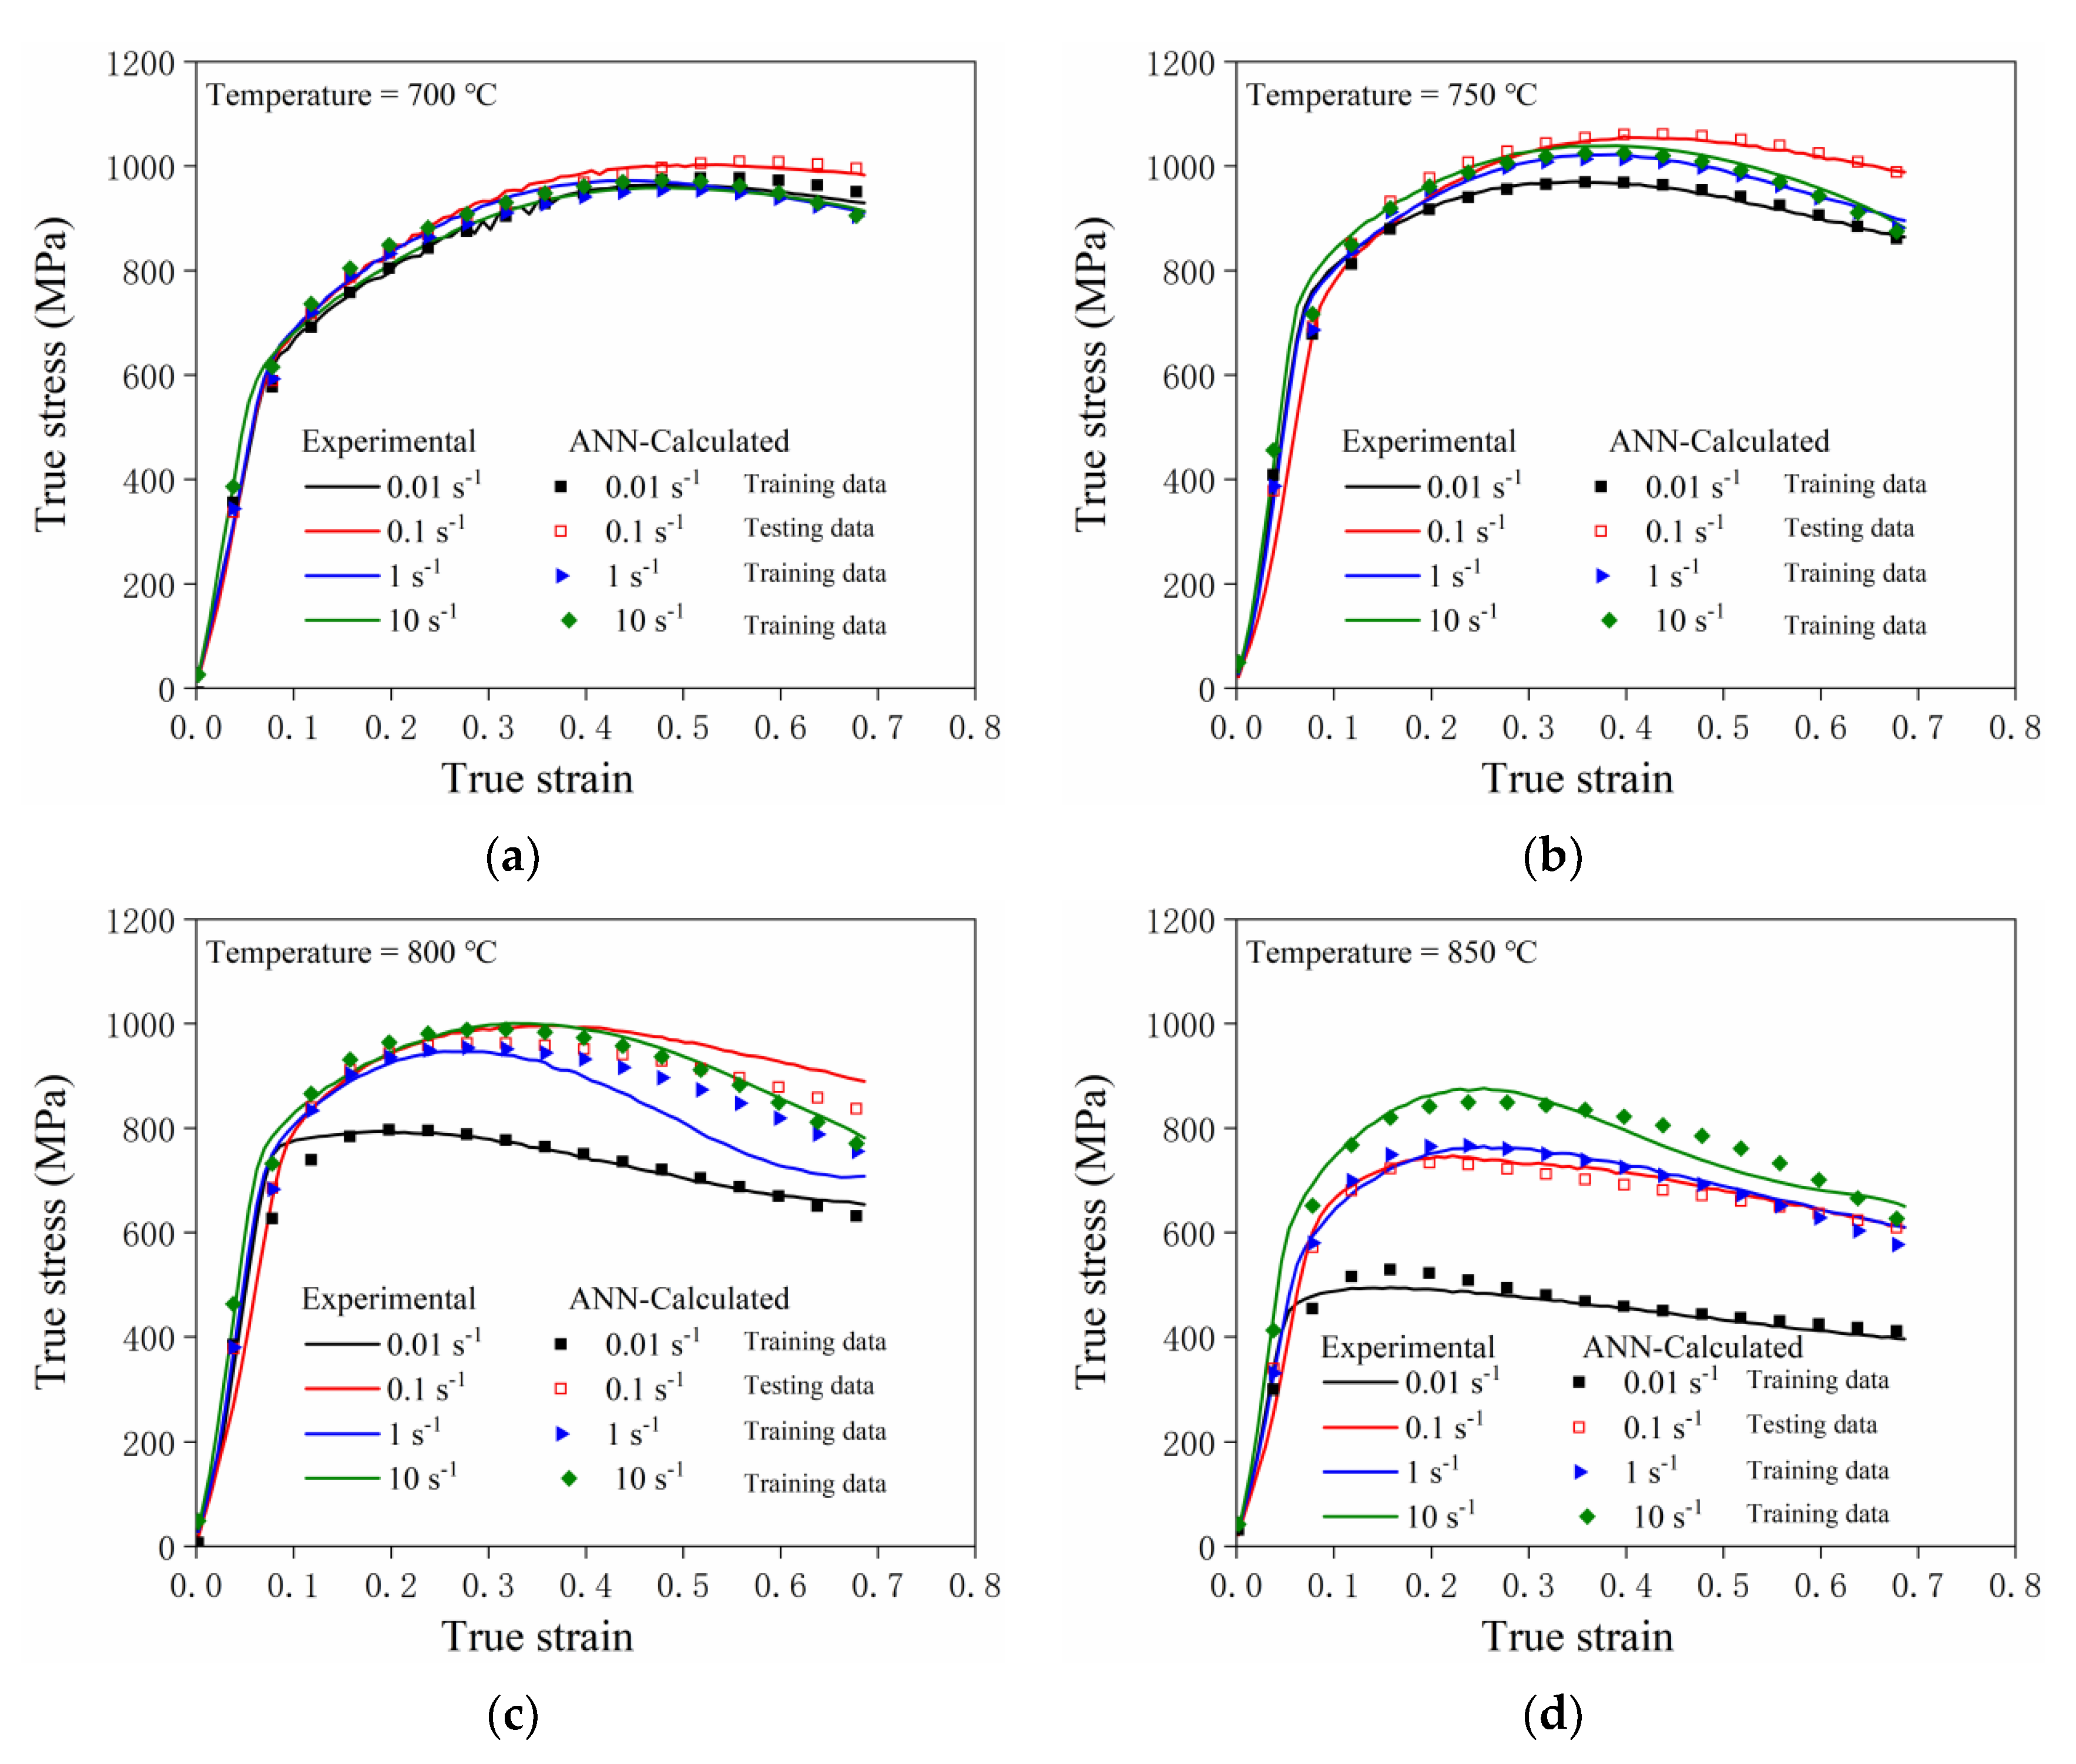
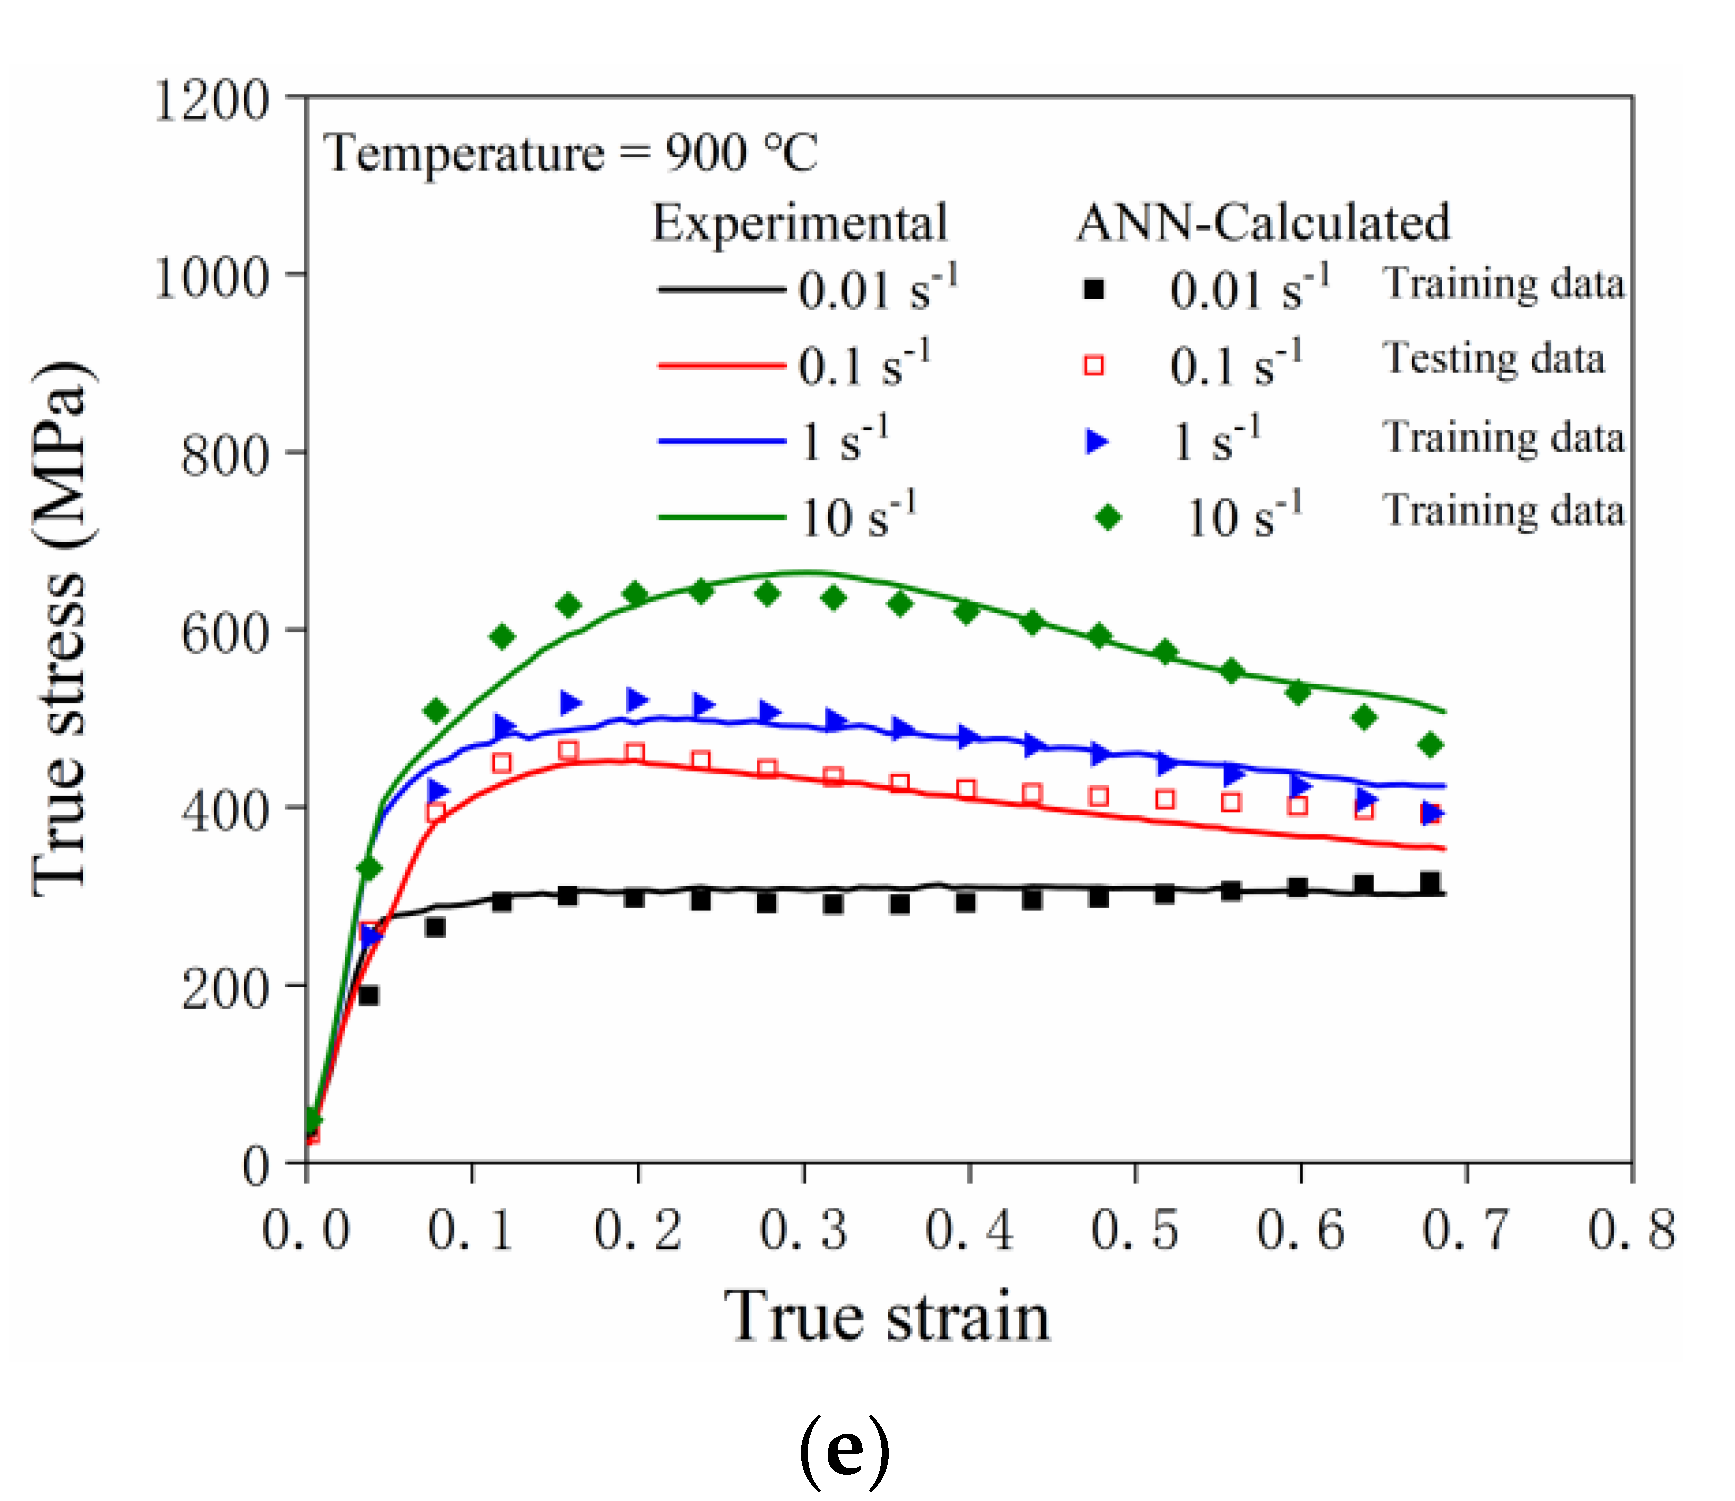
Figure 2 shows the true stress–strain curves of GH4169 superalloy at different strain rates and temperatures. It can be seen that the effects of deformation temperature and strain rate on true stress–true strain curves of the GH4169 are significant. The flow stress increases rapidly with the increase in strain, and grows to a peak and then decreases in the deformation temperature range of 850 °C to 900 °C. When the temperature is maintained constant, the true stress rises with a rise in the strain rate. The flow stress increases with the increase in the strain rate at the same temperature. It can also be found that the stress–strain curves overlap at different strain rates at 700 °C. At a certain deformation temperature, the strain corresponding to the peak flow stress increases with the increase in strain rate. In addition, when the specimens deformed at 900 °C and 0.01 s−1, 0.1 s−1, 1 s−1, and 10 s−1, the flow stress increases rapidly to a peak value at first, and then decreases to a stable state, revealing the occurrence of softening behavior. This is because the continuing deformation leads to the accumulation of dislocations to a critical value for the onset of dynamic recrystallization in softening behavior [11].
3.2. Constitutive Model Establishment
The constitutive model is a mathematical model that can provide the theoretical basis for numerical simulation analysis. It is an important mathematical tool to describe and predict the thermal deformation process of materials. Generally, the Arrhenius constitutive equation is shown below [14,22,23]:
where is the strain rate, s−1; σ is flow stress, MPa; A1, n1, A2, A3, n, α, and β are constants; T is absolute temperature, K; Q is the deformation activation energy, kJ/mol; R is the gas constant with a value of 8.3145 J/(mol·K); and α (α = β/n1) is a tunable constant, MPa−1. The Zener–Hollomon (Z) parameter is used to describe the relationship between temperature and strain rate. It is a strain rate factor compensated by temperature.
Taking the natural logarithm on both sides of Equations (1) and (2), as follows:
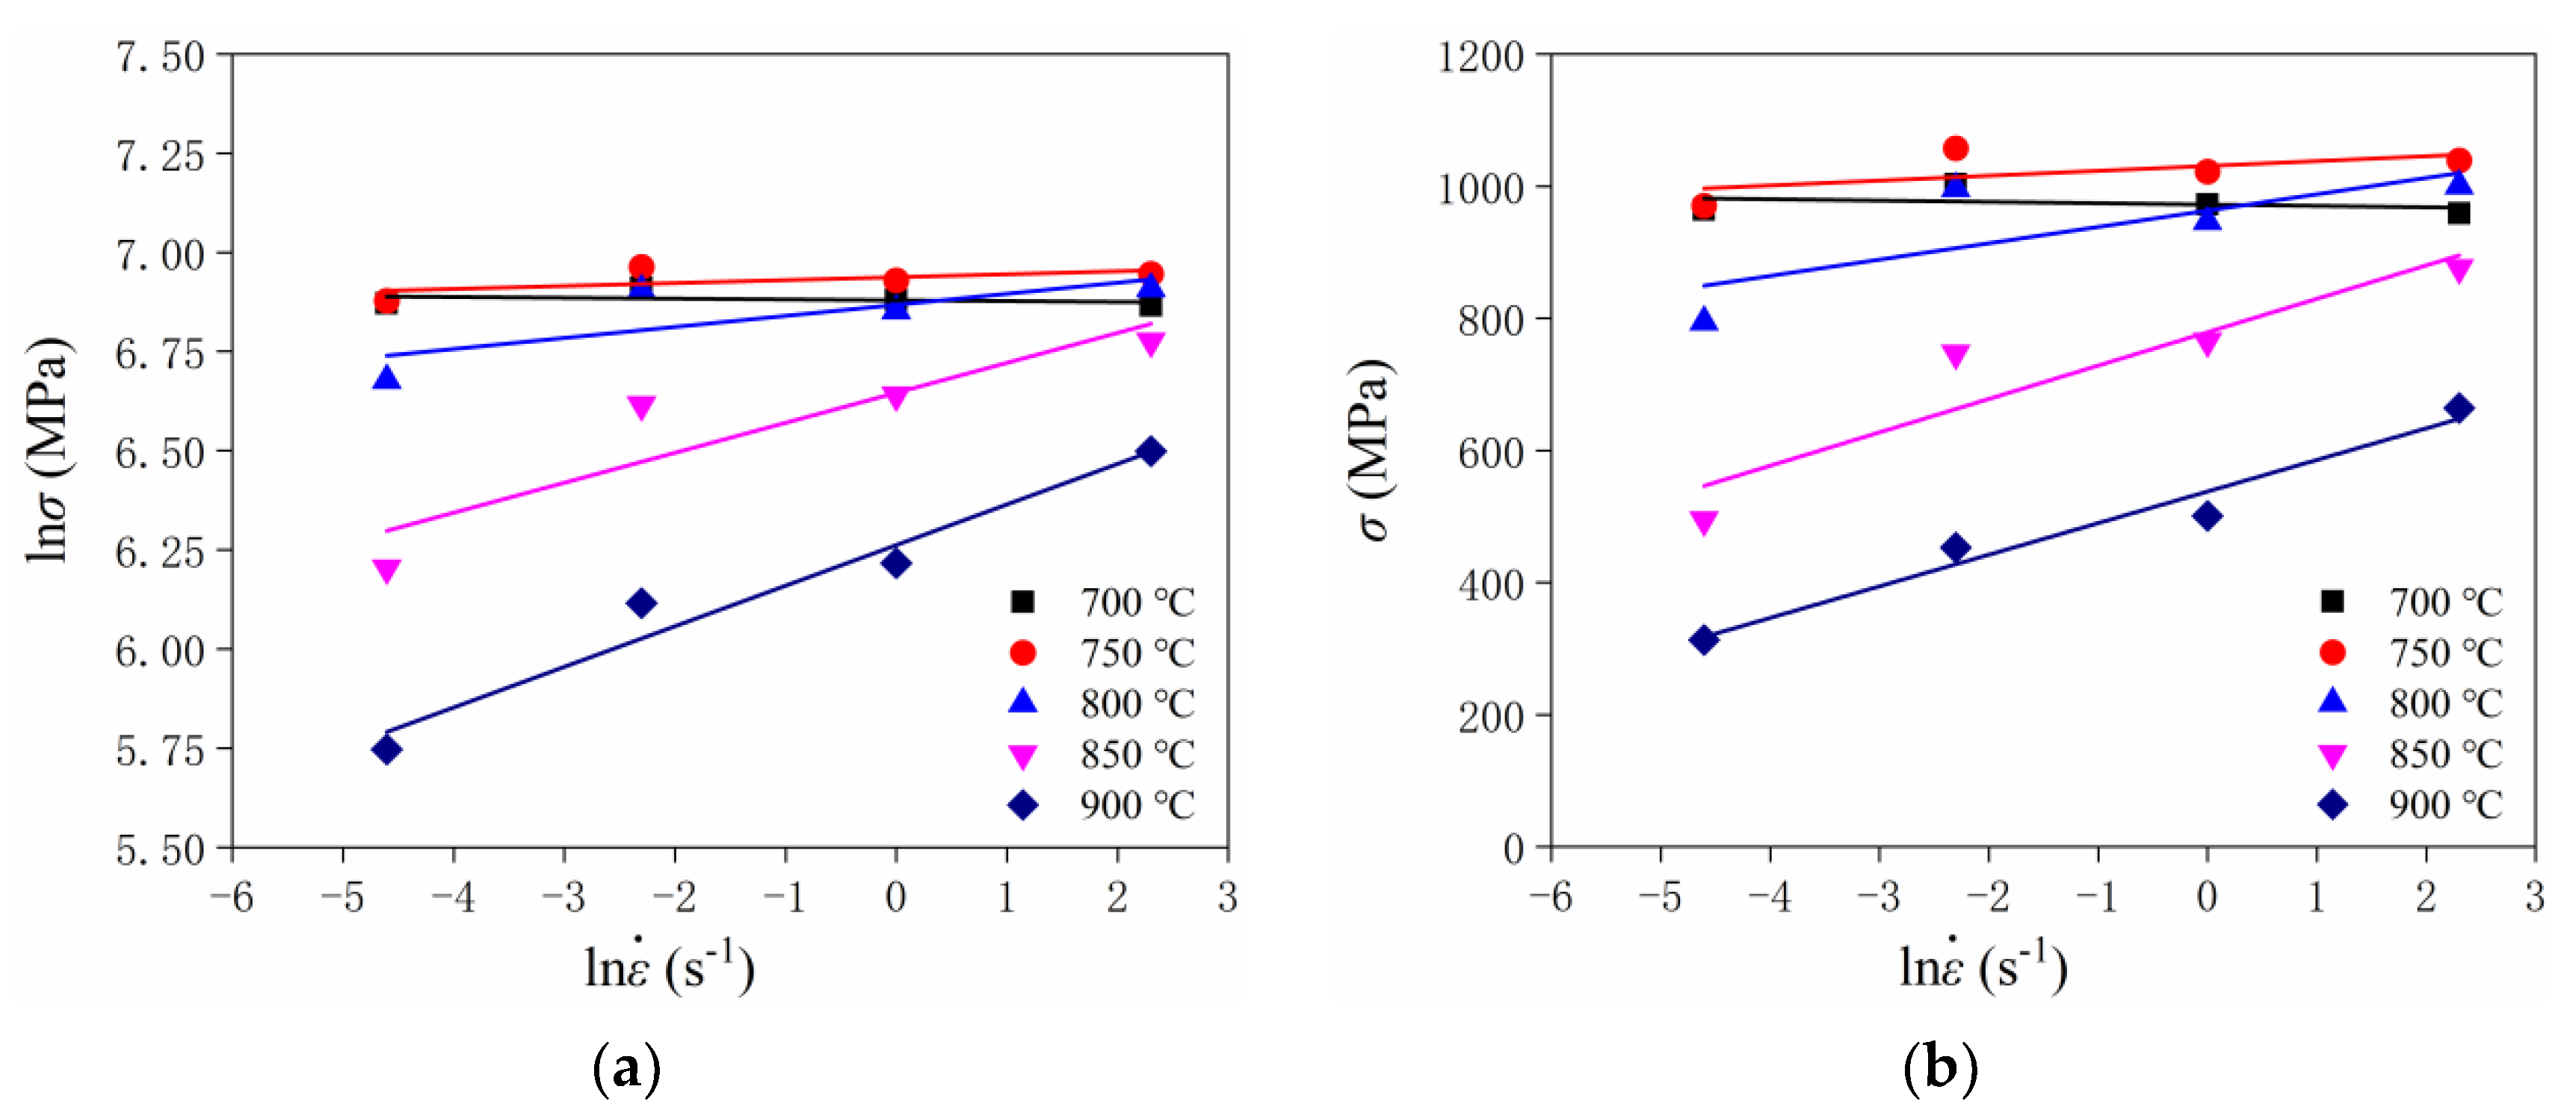
According to Equations (5) and (6), taking the peak stress as an example, the fitted linear relationships of and lnσ and and σ are shown in Figure 3. The value of n1 and β is the reciprocal of the average values of slopes obtained by linear fitting. The calculated values of n1 and β are 8.56 and 0.012 MPa−1, respectively. Thus, the calculated value of α is 0.0014 MPa−1.
The formula can be expressed as
For a particular temperature, n can be expressed as
For a particular strain rate, Q can be expressed as
Thus, Q can be expressed as
Therefore, Q is 279.955 kJ/mol, calculated by the formula.
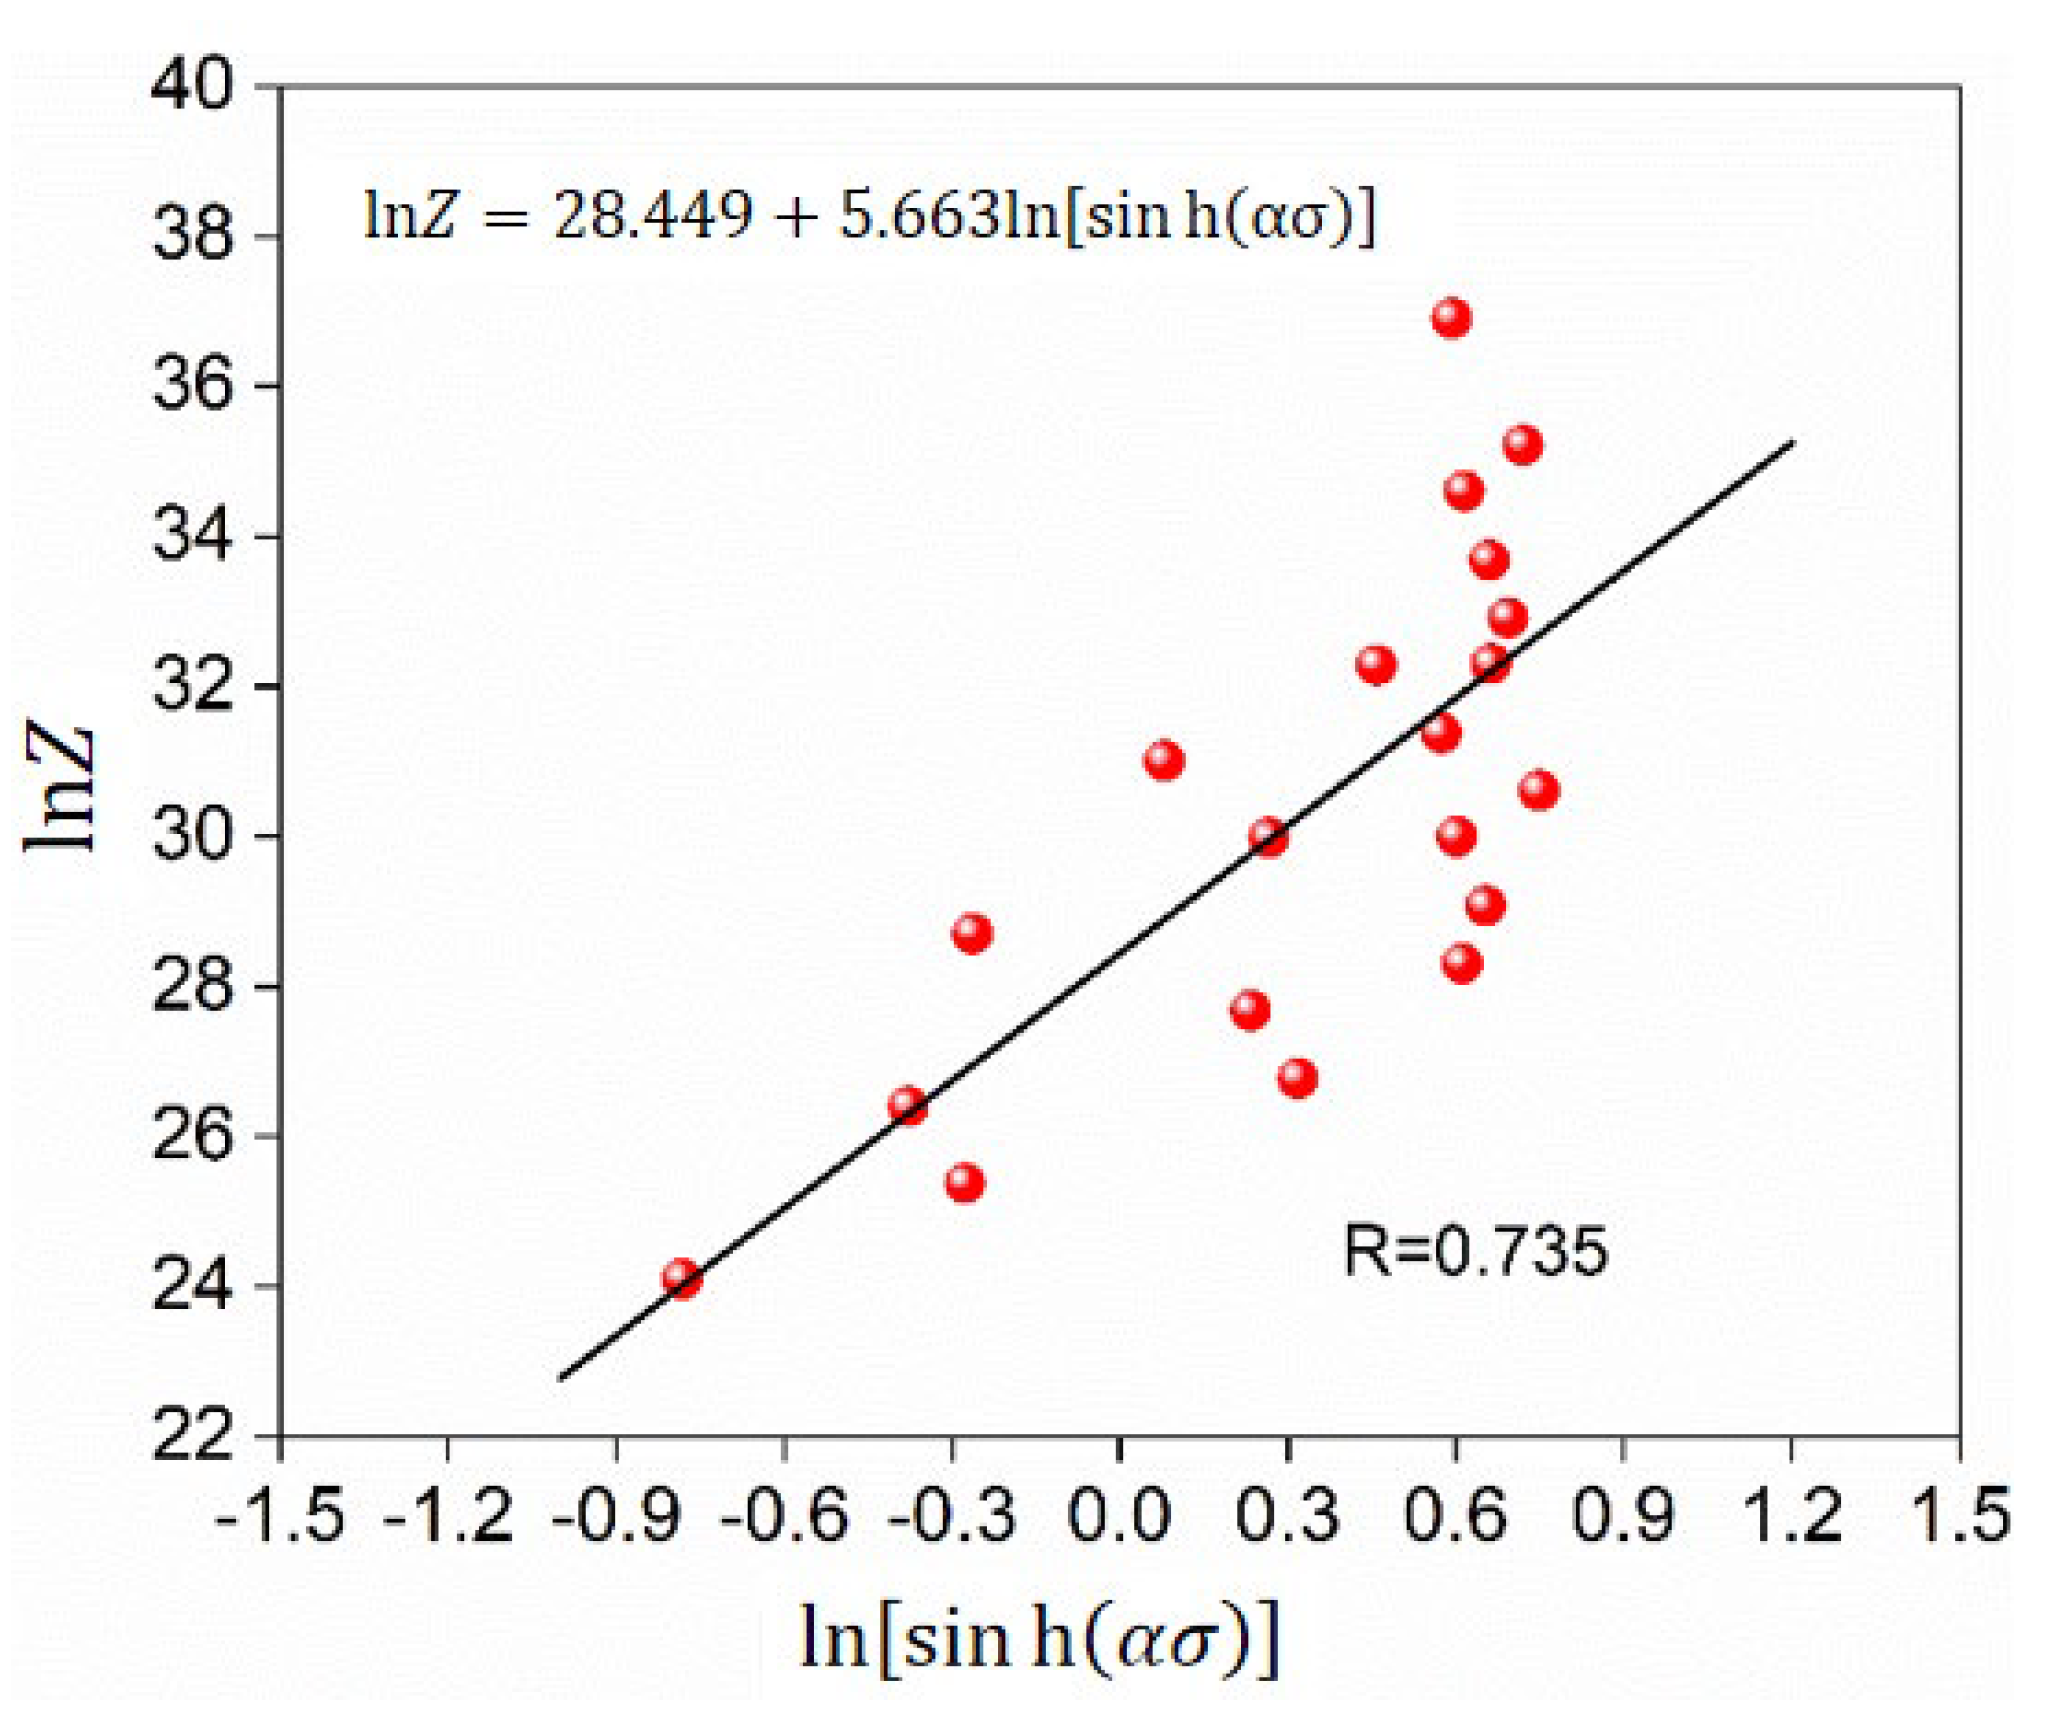
The natural logarithm of the formula can be obtained:
Figure 4 shows the relation between lnZ and ln[sinh(ασ)]. From Figure 4, A3 is 2.267 × 10¹² and n is 5.663. Thus, the constitutive model can be described as follows:
In addition, as shown in Figure 2, the magnitude of the flow stress is significantly influenced by the strain. Thus, to improve the prediction accuracy of the flow stress model, the effects of strain on the flow stress should be considered [19]. Therefore, the values of parameters A3, α, n, and Q were calculated at different strains, as shown in Table 2. “ε” in the first column represents the node strain at strains ranging from 0.10 to 0.60 with an interval of 0.05.
According to Table 2, the relationships of A3, α, n, Q, and ε were fitted by a fifth-order polynomial as follows:
At any defined strain, the parameters A3, α, n, and Q are calculated based on the above equation and the flow stress is predicted according to the following formula:
The experimental and predicted strain–stress values are shown in Figure 5. It can be seen that the consistency between the experimental results and the calculated results is low, and the average absolute relative error (AARE) between the predicted values and the experimental values is 29.95%, indicating that the Arrhenius constitutive model cannot accurately predict the flow stress curve of GH4169 under the condition of warm deformation.
where Ei is the experimental value, Pi is the calculated value, i is the ordinal number, and N is the total amount of data.
3.3. ANN Constitutive Model Establishment and Verification
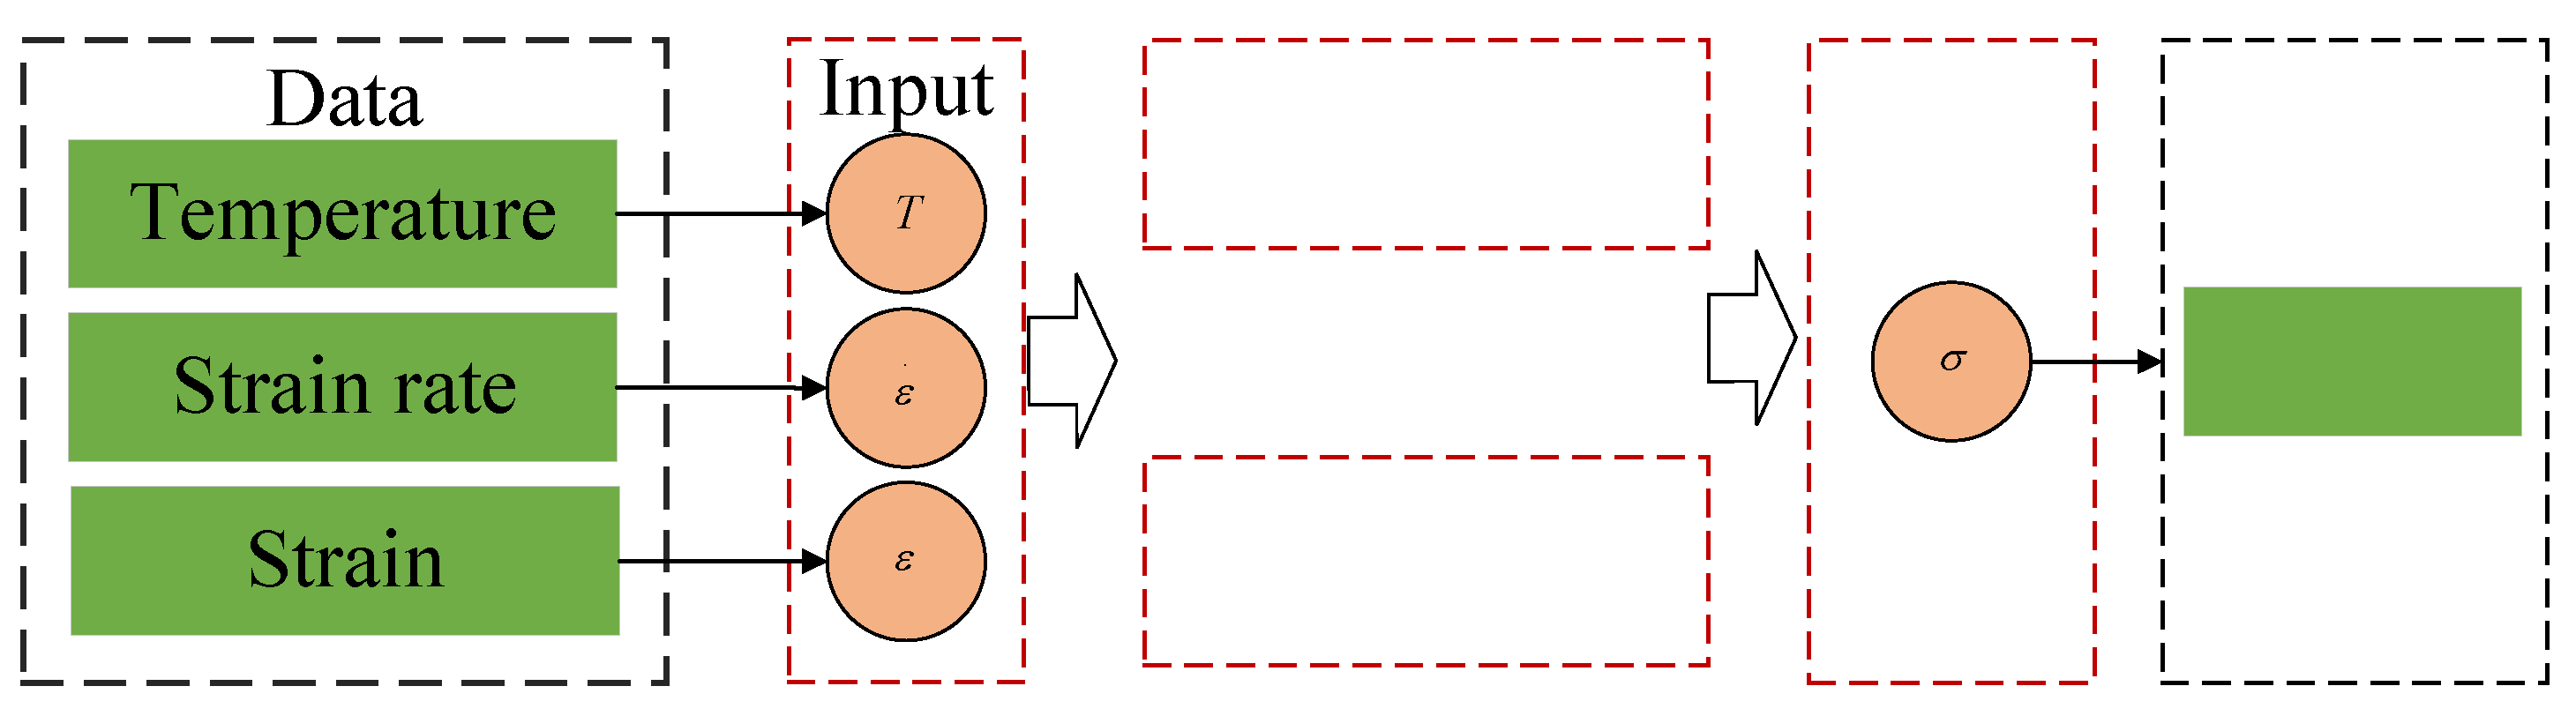
In this work, a feed-forward multi-layer ANN model was adopted in this work. The back propagation (BP) algorithm was used for training the ANN model. As shown in Figure 6, the structure of the BP neural network consists of an input, hidden layer, output layer, and output layer. The ANN model of machine learning was implemented by Python programming. The Sklearn package and the MLPRegressor regression module were employed to establish the BP-ANN model. According to the characteristics of the constitutive equation, three input nodes were set as deformation temperature, strain rate, and true strain, and one output node was set as true stress. In addition, the prediction performances of a single hidden layer and a double hidden layer are compared. For both single-layer hidden layer and double-layer hidden layers, the Levenberg–Marquardt algorithm as a BP learning algorithm was used to train the ANN model and the hyperbolic tangent activation was pursued as an activation function in hidden layers and output layer. The momentum rate of the network model was 0.9, and the learning rate was 0.1. The number of iterations was 1200 and the training stopped when the target error (optimization tolerance) was 1 × 10⁻⁵. The 1740 experimental datasets from the true stress–true strain curves in the strain range of 0.002–0.686 with an interval of 0.002 were selected to train and test the BP-ANN model. Prior to training, all input values were normalized to the range of 0–1 using the following normalization equation:
where X as original data was normalized based on the minimum and maximum value as Xmin and Xmax, respectively, and Xn is unified data of the corresponding X. In addition, because the strain rate varies by an interval of one order of magnitude, the logarithmic strain rate is adopted before normalization to investigate its effects on the hot deformation behavior [19].
Out of the complete datasets, 1305 datasets corresponding to the experimental data of hot compression tests, performed in the temperature range of 700–900 °C and strain rate of 0.01, 1 and 10 s−1, respectively, were selected for training of the network. The remaining 435 datasets, corresponding to the hot compression tests at a strain rate of 0.1 s−1, were selected for testing the network. While training the neural network, the input and output data were utilized to update the weight and biases, which minimize the error between the output and target.
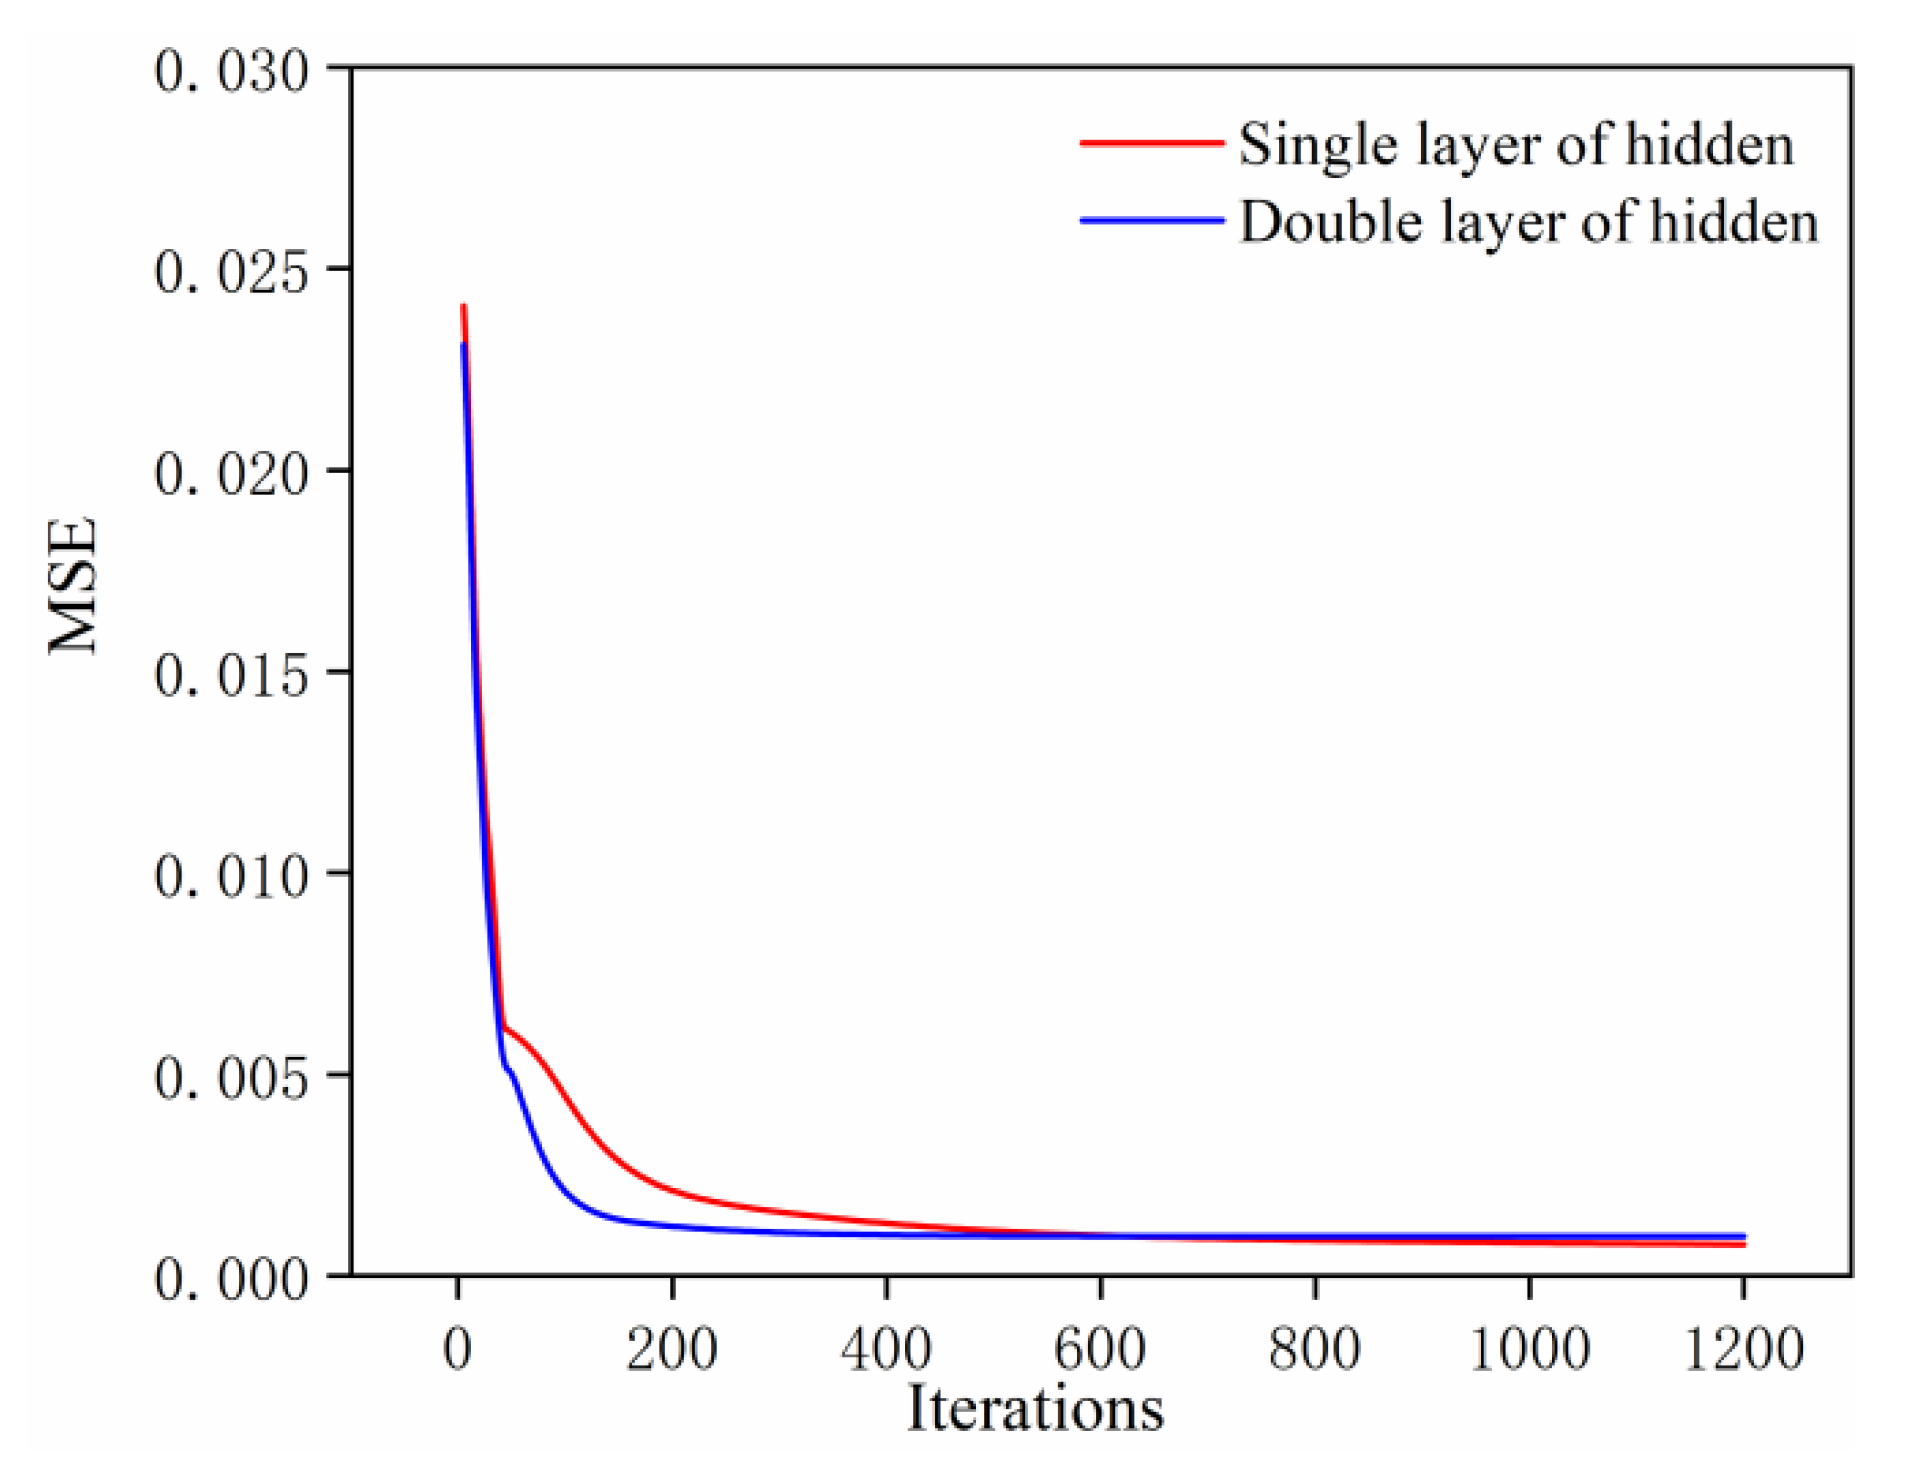
For the BP-ANN model with one hidden layer, twenty neurons were used in the hidden layer. As shown in Figure 7, after the training and testing, the mean square error (MSE) is 0.0006, and it takes 776 iterations to complete the calculation. When using two hidden layers with twenty and ten neurons in the first and second hidden layer, respectively, it only takes 331 iterations to complete the calculation.
Figure 8 shows the comparison between flow stress prediction data and experimental data after training with a single hidden layer. As can be seen from Figure 8, the predicted results are basically consistent with the experimental results. The AARE between the predicted value and the experimental value is 5.45%.
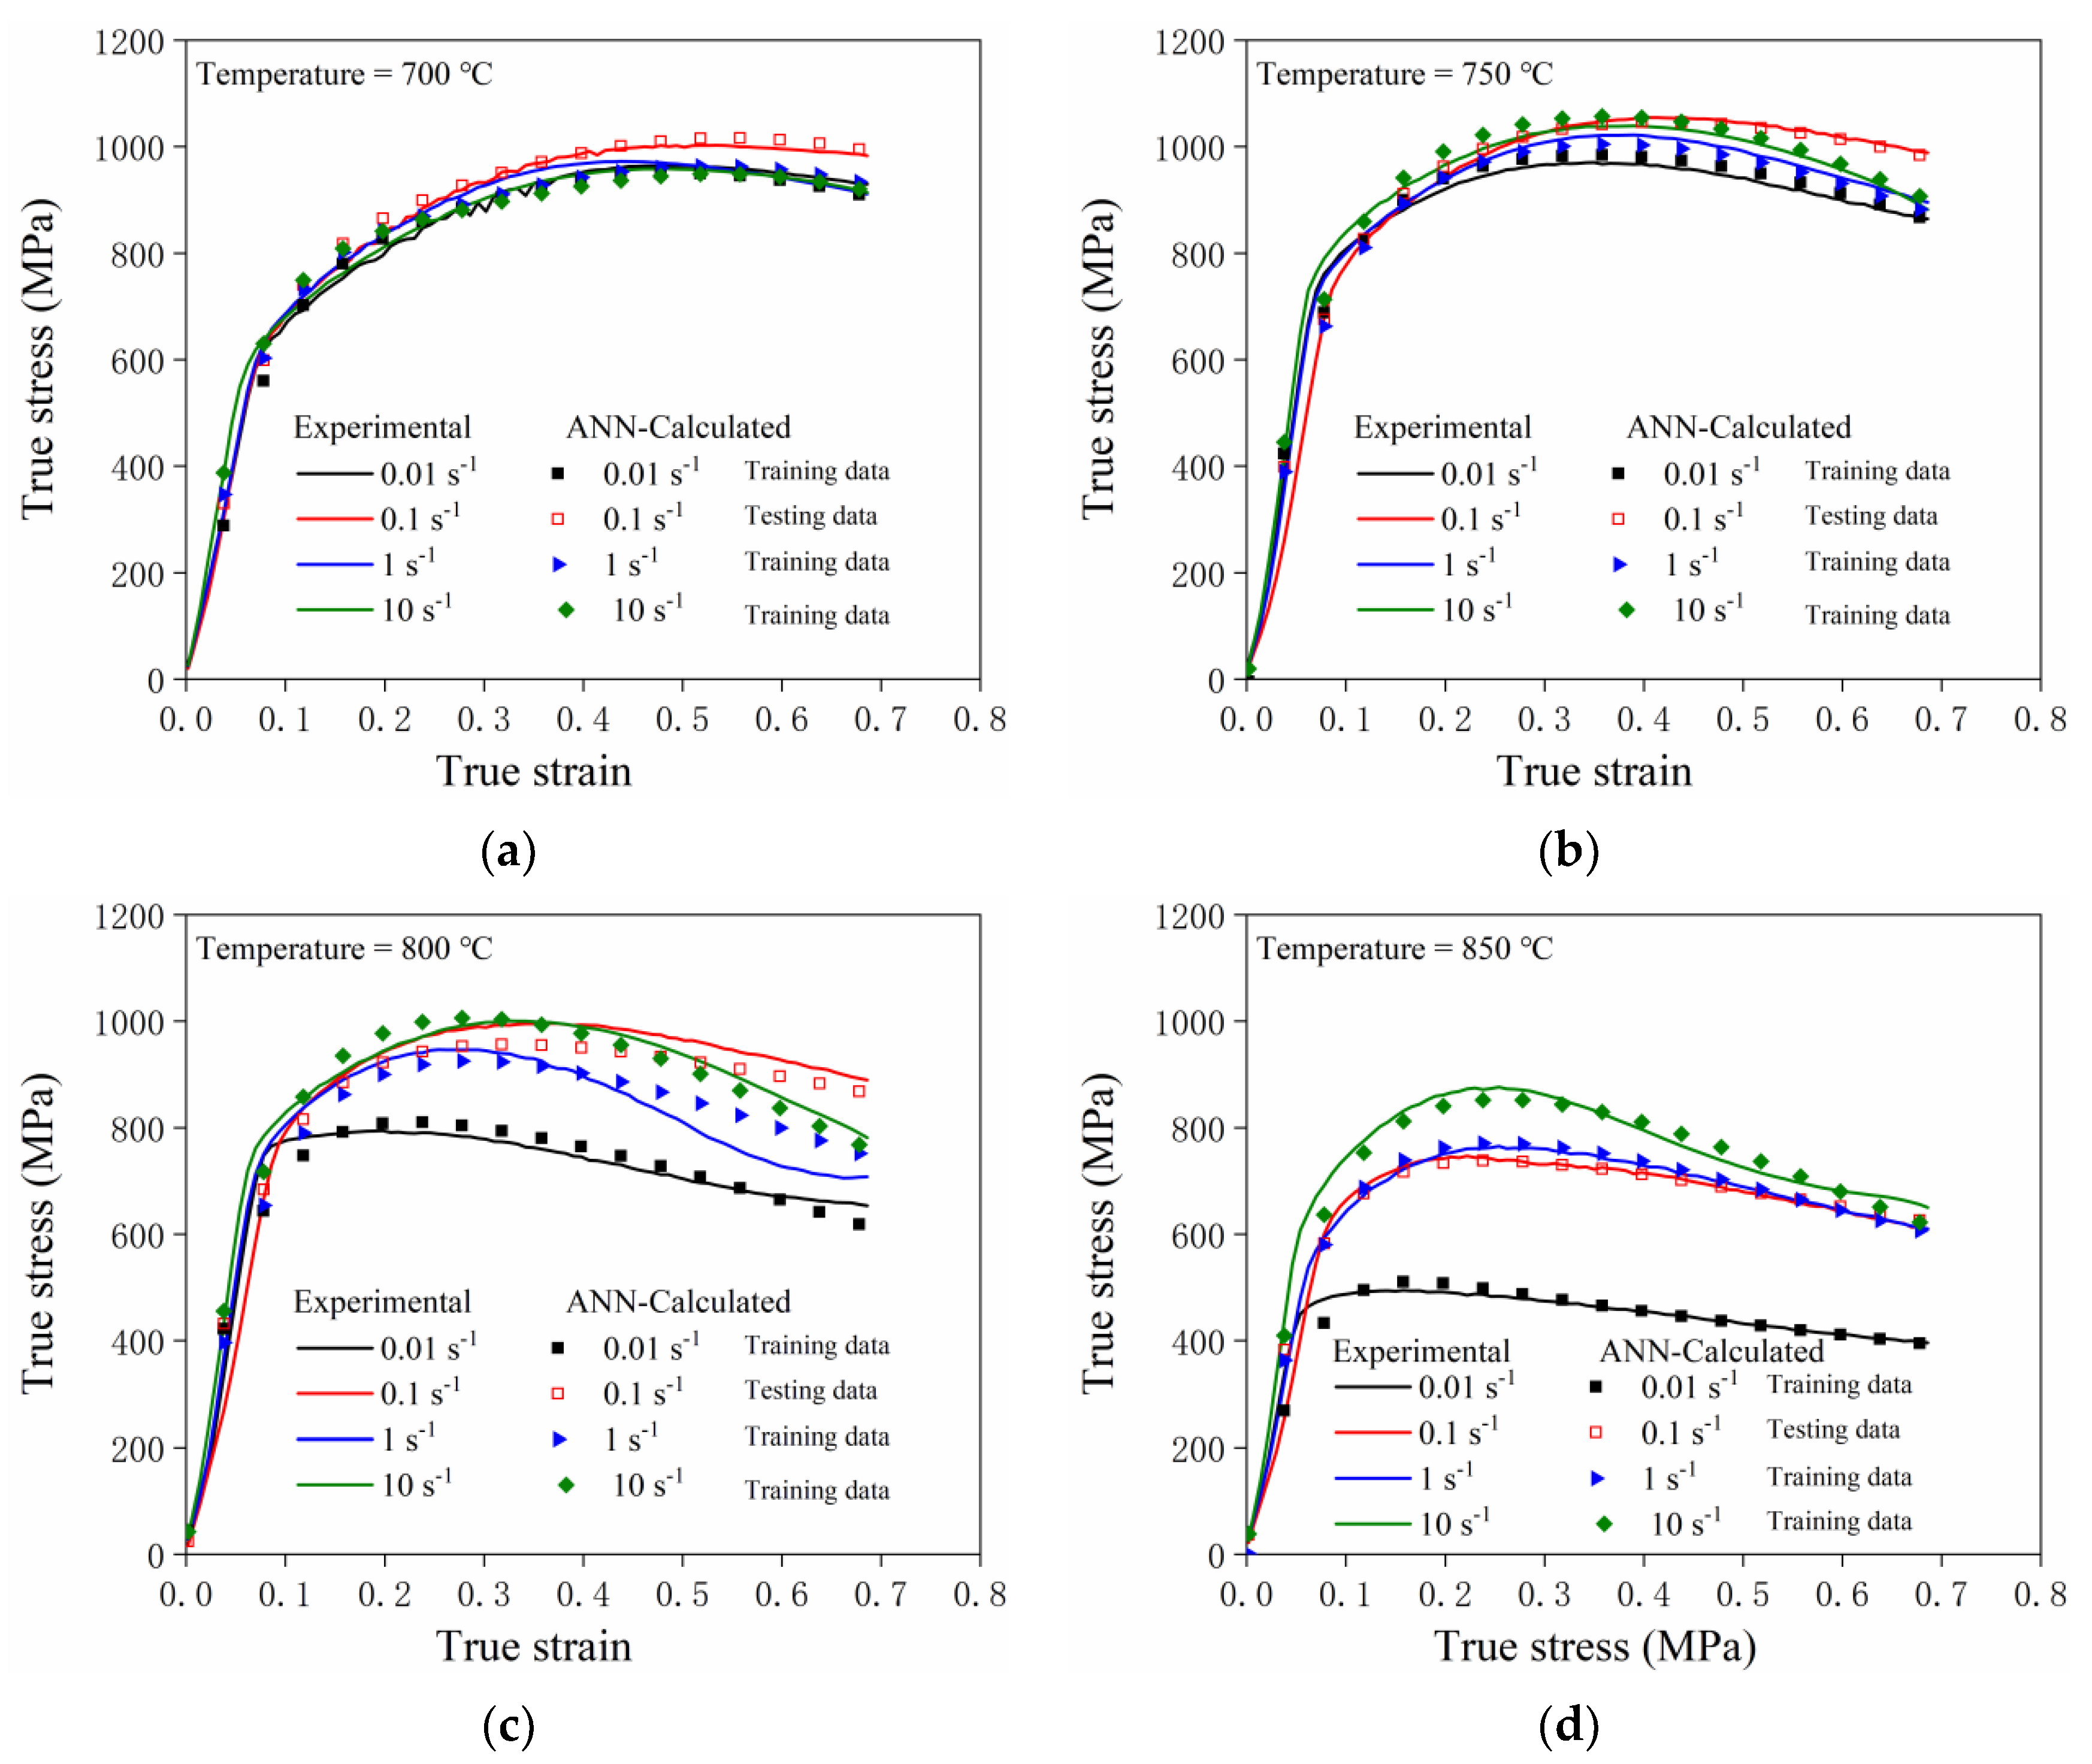
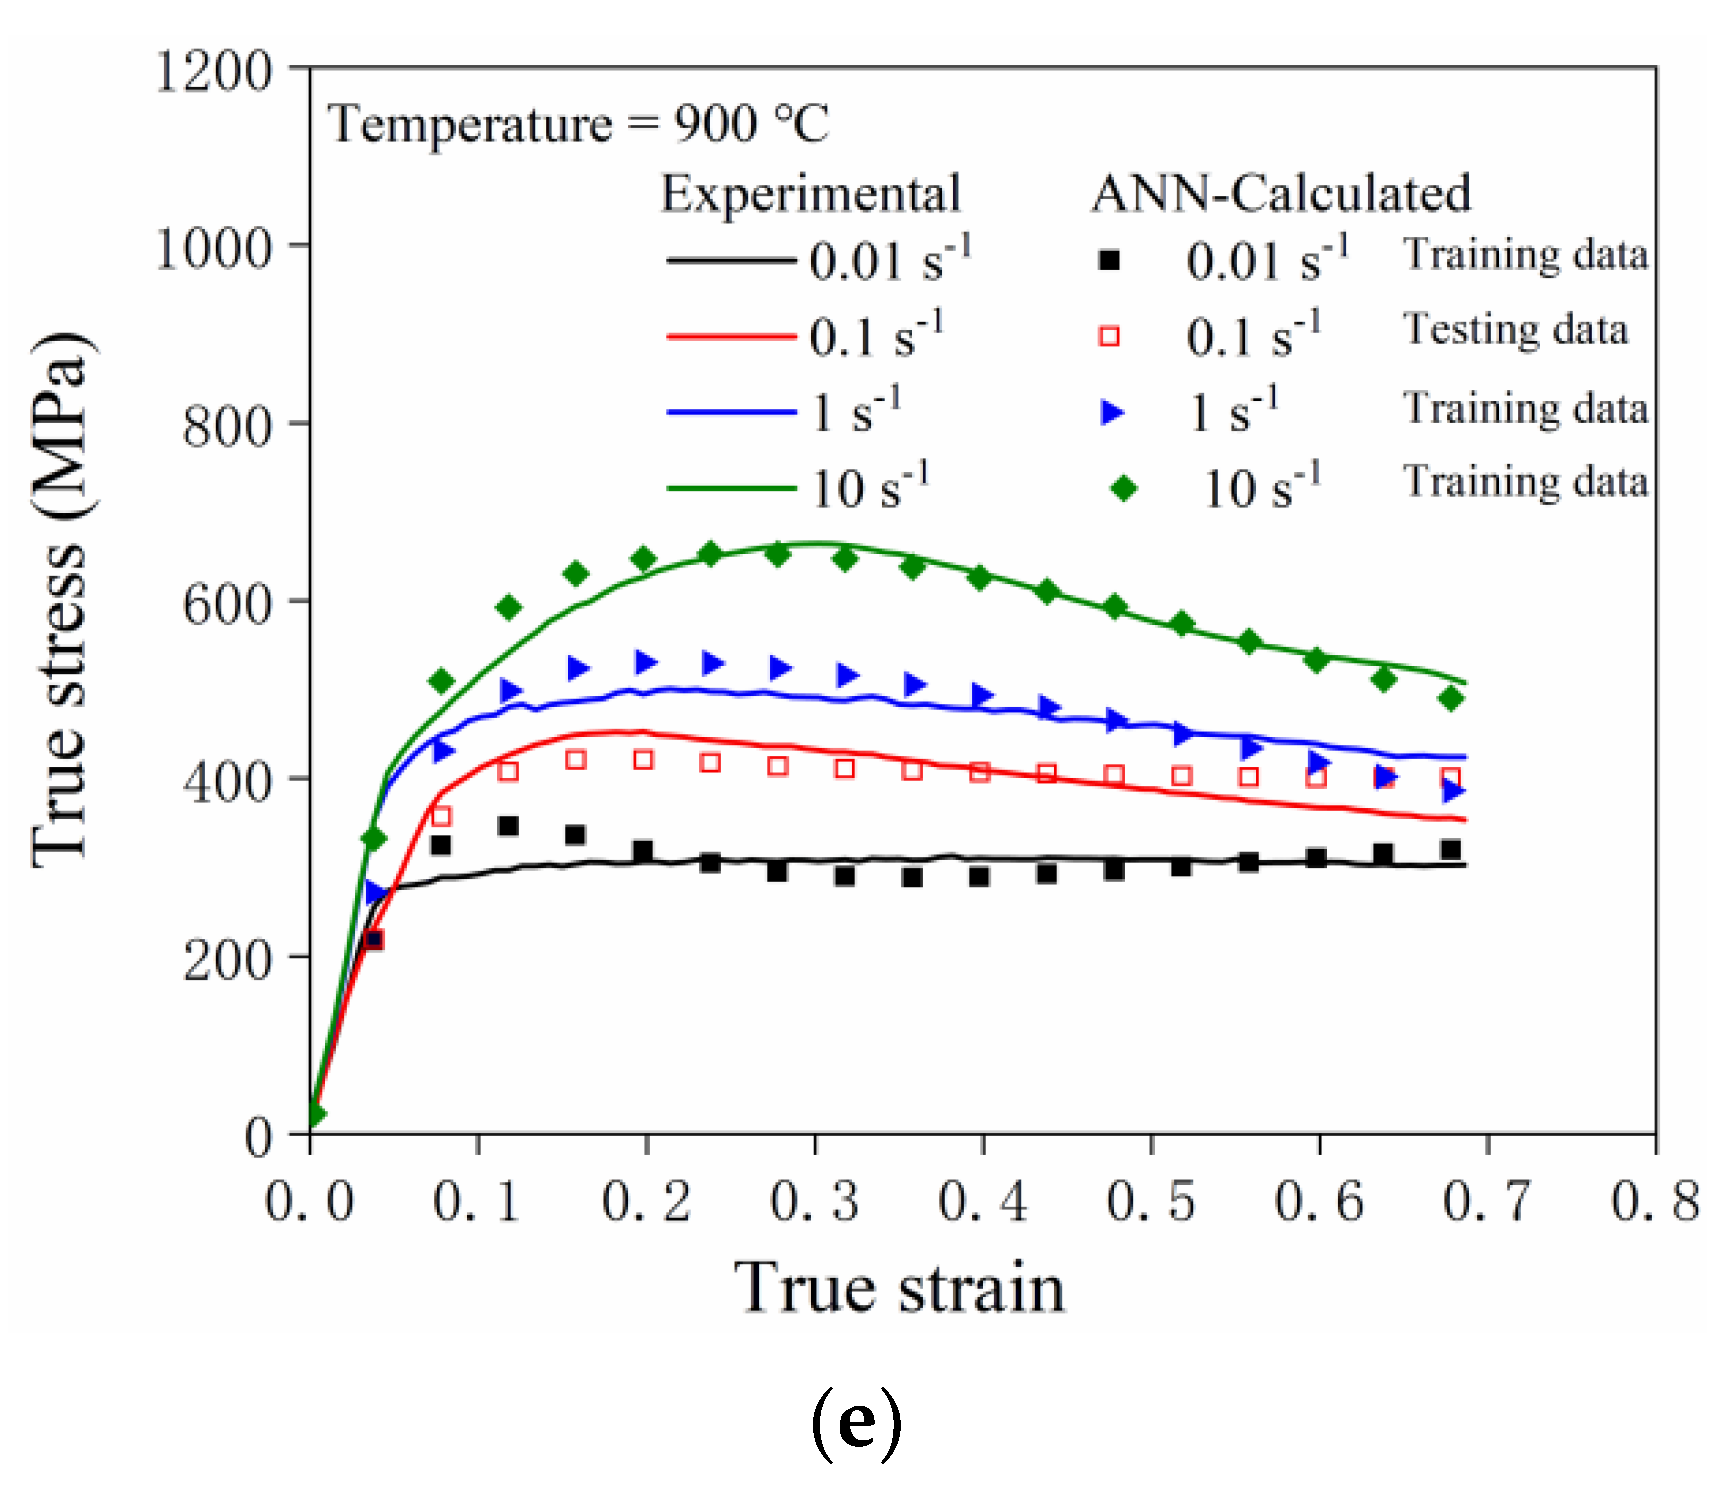
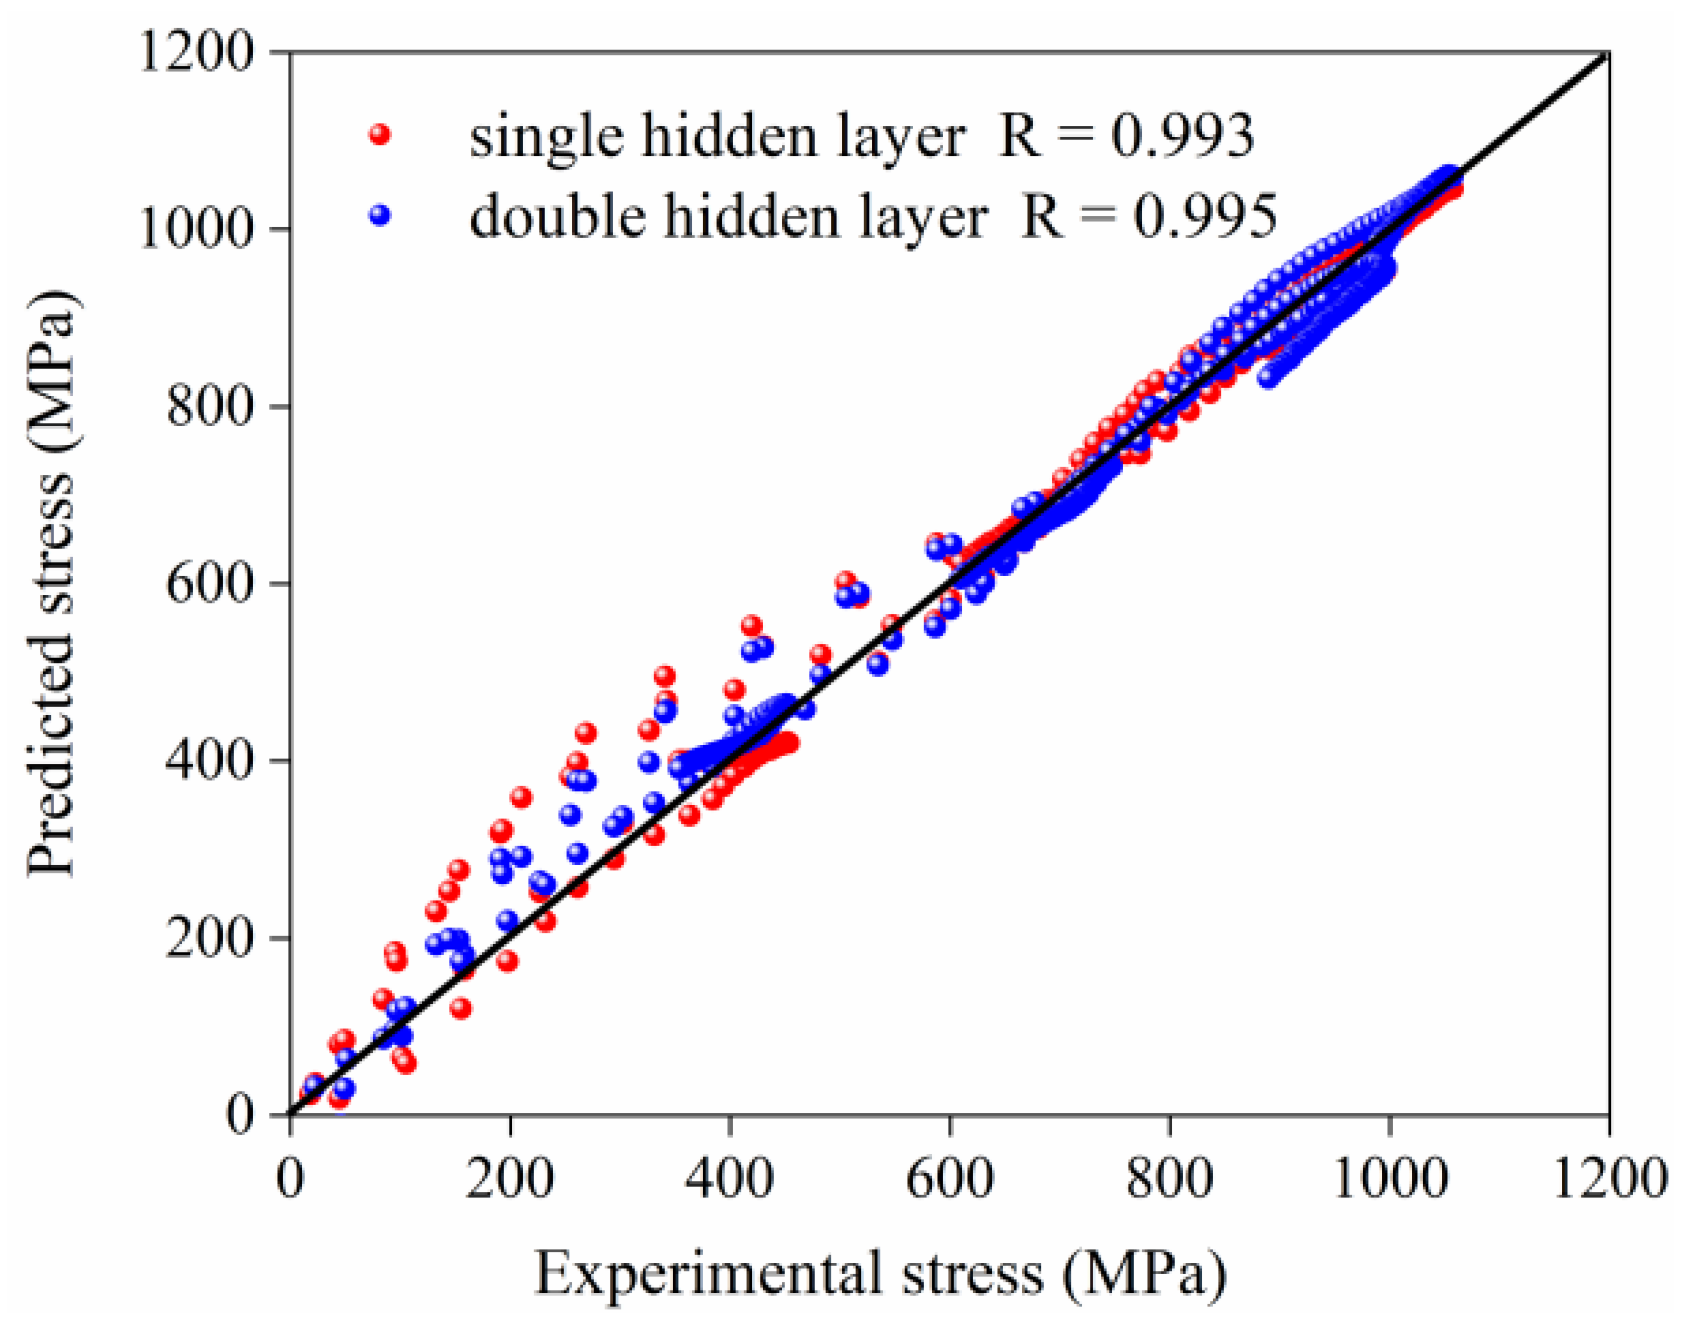
Figure 9 shows the comparison between the predicted flow stress data and the experimental data after training with a double-layer hidden layer. The AARE between the predicted value and the experimental value is 4.34%. Figure 10 represents the correlation between the experimental data and predicted data of the training set. It can be concluded that the correlation coefficient after training with a single hidden layer is 0.993, and the correlation coefficient after training with a double hidden layer is 0.995. According to the results of training error and correlation coefficient analysis, it can be shown that the convergence of the double hidden layer is faster and the prediction accuracy is higher.
Table 3 shows the comparative analysis of the errors between the constitutive equation model and the ANN model. It can be seen from Table 3 that the AARE of the Arrhenius constitutive model for predicting GH4169 warm deformation behavior is large, while the ANN double-layer hidden layer has high prediction accuracy and small AARE.
3.4. Compression Test Simulation and Verification
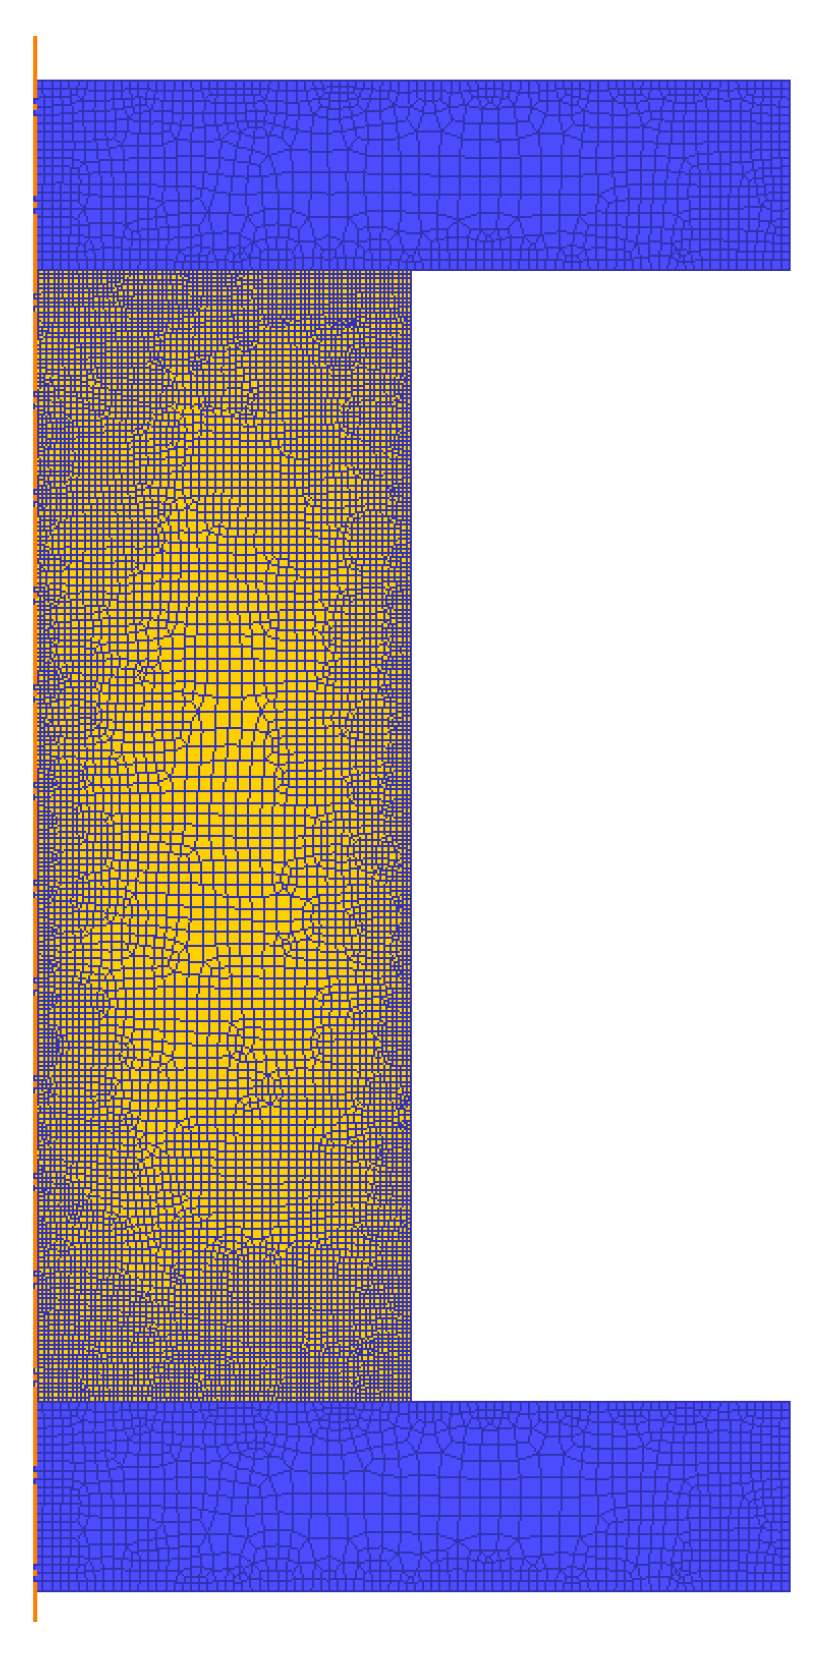
To verify the effectiveness of the developed BP-ANN model of the GH4169 superalloy during warm forming, FEM simulations were carried out to predict the loading force under different hot compression test conditions. The FEM model established in the commercial software DEFORM is show in Figure 11. The anvils and specimen are defined as rigid and rigid-plastic objects, respectively. The flow stress–strain relationship calculated by the ANN model is imported into DEFORM in the form of data. The materials can be defined, and data can be imported in the link of defining materials. The friction coefficient between the sample and the die indenter is set as 0.1.
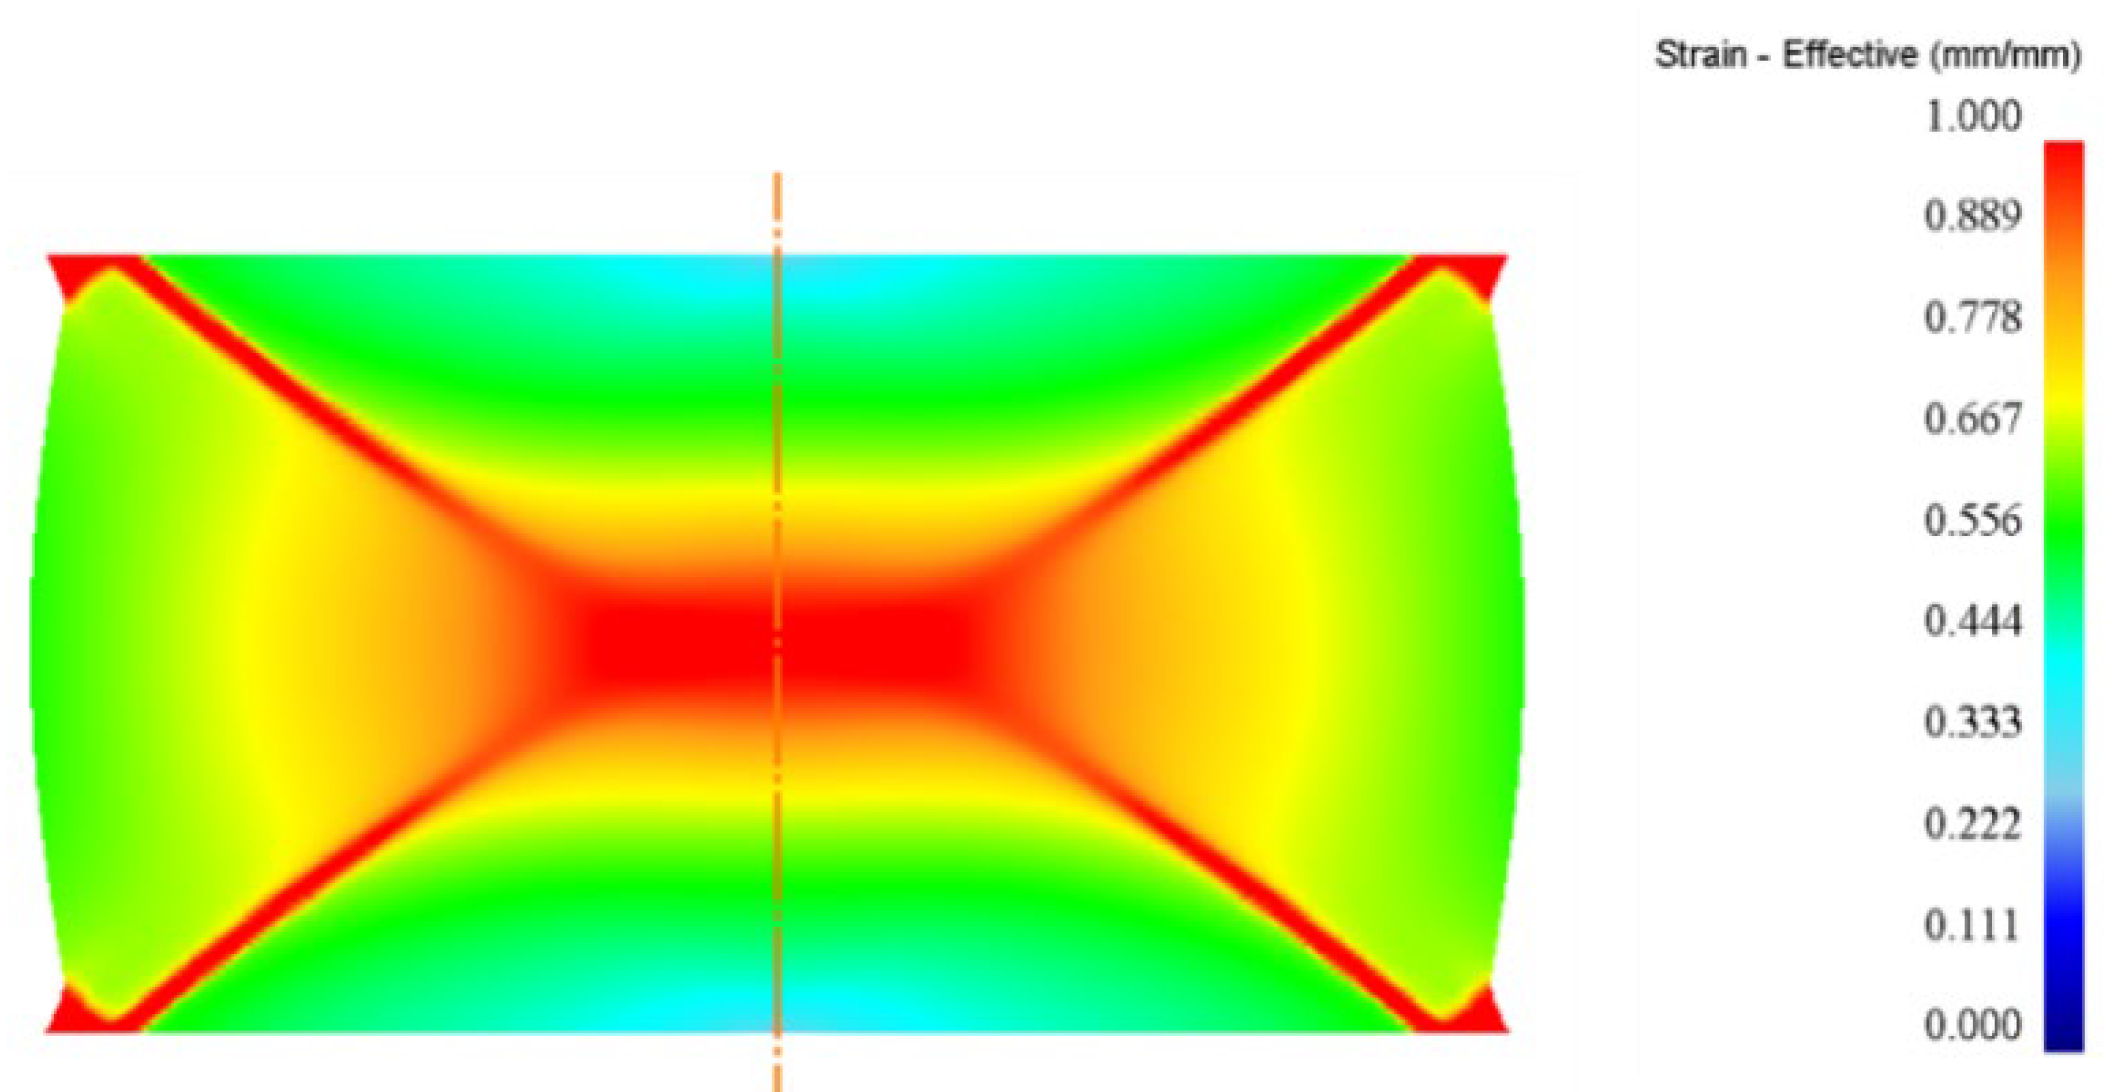
Figure 12 shows the equivalent strain distribution after compression at a deformation temperature of 800 °C and strain rate of 0.1 s−1. This is the elevation view. The height of this contour image is 6 mm. Owing to the influence of friction, the equivalent strain in the four corners, diagonal, and central area of the specimen is larger. In the process of hot compression, these regions have a large amount of deformation, which is conducive to dynamic recrystallization and leads to a fine grain microstructure [15].
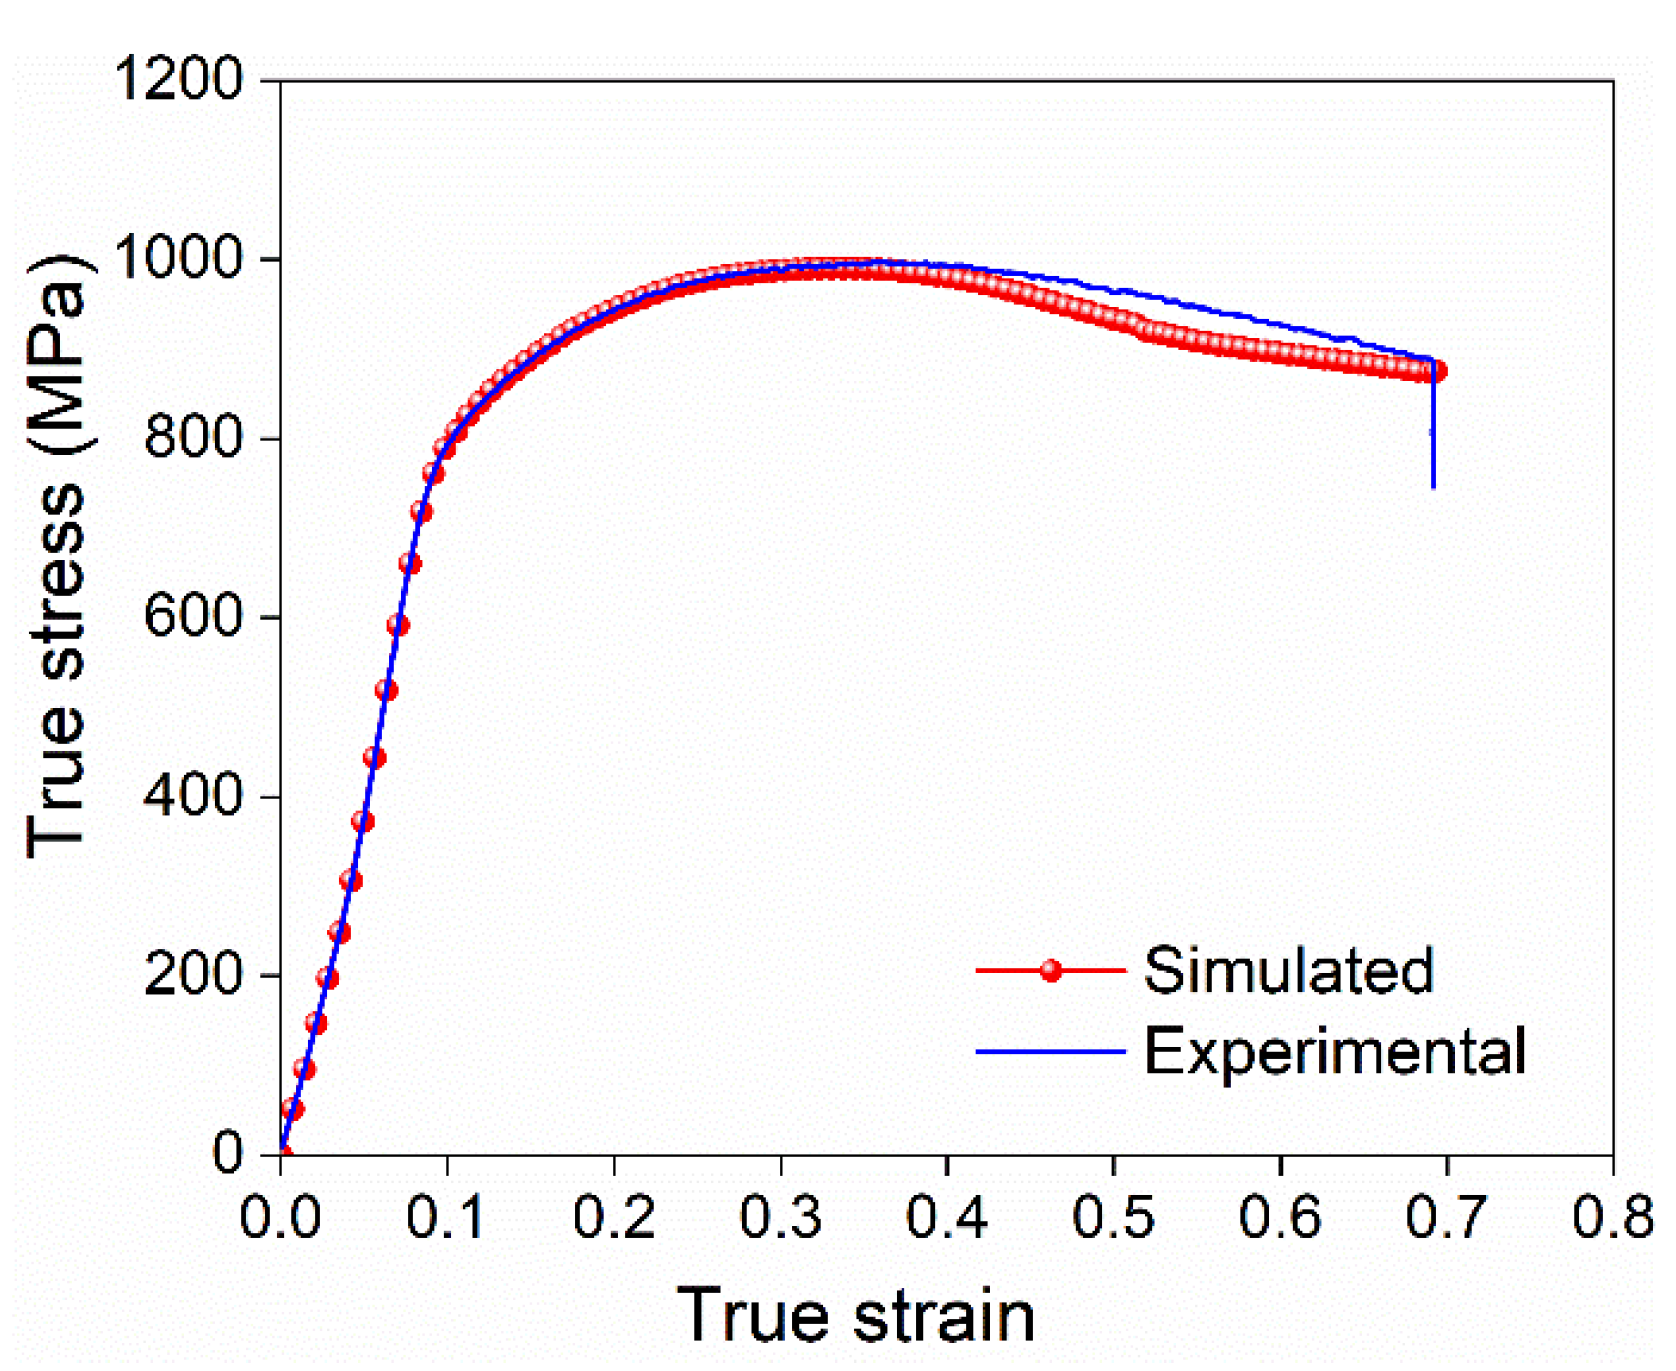
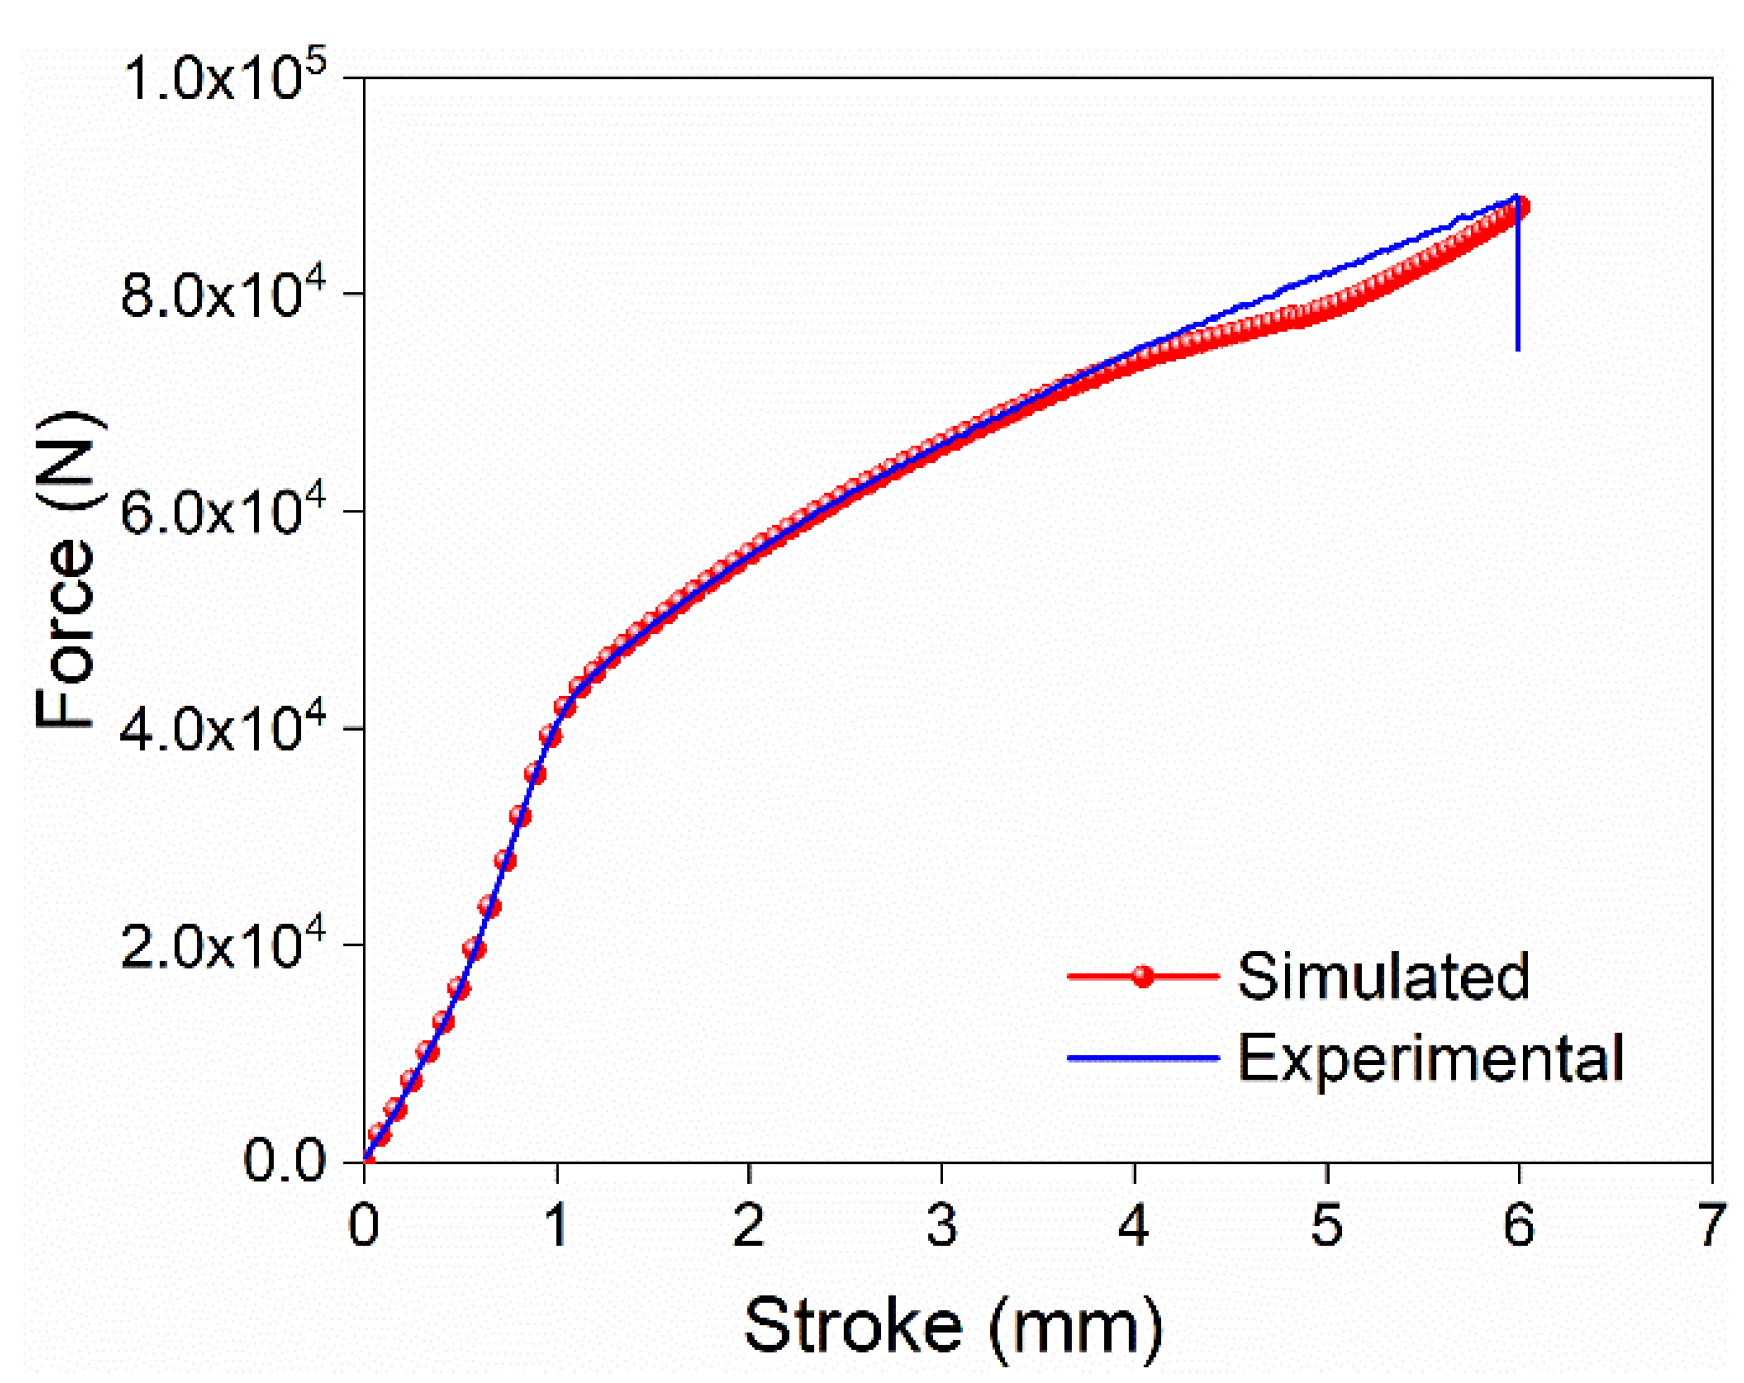
After FEM simulation, the stress–strain curve and loading force–stroke curve can be extracted. The comparison between the simulated stress–strain curve and the obtained stress–strain curve is shown in Figure 13. Figure 14 shows the comparison between the simulated load–travel curve and experimental force–stroke curve. It can be seen that the simulation result is highly consistent with the test result. Therefore, it is clear that the ANN model established in this work can effectively predict the flow stress of the GH4169 superalloy during warm forming. In addition, the ANN model is also reliable when applied to FE simulations of warm forming.
4. Conclusions
The constitutive model parameters (α, Q, lnA3, and n) of GH4169 superalloy were calculated by the constitutive equation model. The AARE is about 29.95%, indicating that the Arrhenius constitutive model cannot accurately describe the constitutive relationship of GH4169 superalloy during the warm deformation process.
A double hidden layer BP model was established to predict the flow stress of GH4169 superalloy. The AARE between the predicted data and the experimental data is about 4.34%, indicating that the BP model has a high accuracy in predicting flow stress, and the prediction accuracy is higher than that of the Arrhenius constitutive equation model.
A finite element model was established to describe the warm forming process of GH4169 superalloy. The effectiveness of the BP model with double hidden layers proposed was verified by comparing the stress–strain curves of the simulation and compression test.
Author Contributions
P.C., writing—review and editing; J.Z., methodology and original draft preparation; D.W., project administration; S.Z. and P.Z., data curation. All authors have read and agreed to the published version of the manuscript.
Funding
This research was funded by [Research on testing technology and standard of key service performance of high speed precision sliding bearing, 360522004S1A].
Institutional Review Board Statement
Not applicable.
Informed Consent Statement
Not applicable.
Data Availability Statement
Date sharing not applicable.
Conflicts of Interest
The authors declare no conflict of interest.
References
- Lu, X.D.; Du, J.H.; Deng, Q. High temperature structure stability of GH4169 superalloy. Mater. Sci. Eng. A 2013, 559, 623–628. [Google Scholar] [CrossRef]
- An, X.L.; Zhang, B.; Chu, C.L.; Zhou, L.; Chu, P.K. Evolution of microstructures and properties of the GH4169 superalloy during short-term and high-temperature processing. Mater. Sci. Eng. A 2019, 744, 255–266. [Google Scholar] [CrossRef]
- Chen, M.-S.; Ma, Y.-Y.; Lin, Y.C.; Lou, Y.-M.; Li, H.-B.; Wang, G.-Q.; Chen, Q. An innovative annealing treatment method and its mechanism to refine deformed mixed grains of initial aged GH4169 superalloy. J. Alloys Compd. 2022, 907, 164325. [Google Scholar] [CrossRef]
- Wang, Y.C.; Lei, L.M.; Shi, L.; Liang, F.; Wan, H.Y.; Zhang, B.; Zhang, G.P. Effect of heat treatment on strain hardening ability of selective laser melted precipitation-hardened GH4169 superalloy. Mater. Charact. 2022, 190, 112064. [Google Scholar] [CrossRef]
- Chen, L.; Ding, H.; Liu, T.; Luo, R.; Cao, Y.; Zhang, Y.; Liu, Y.; Yuan, F.; Qiu, Y.; Cui, S.; et al. Thermal deformation behavior and microstructure evolution of GH4169 superalloy under the shear-compression deformation conditions. Mater. Des. 2021, 212, 110195. [Google Scholar] [CrossRef]
- Chen, M.-S.; Chen, Q.; Lou, Y.-M.; Lin, Y.C.; Li, H.-B.; Ma, Y.-Y.; Wang, G.-Q. Effect of cooling recrystallization annealing treatment on properties of an initial aged deformed GH4169 superalloy. Mater. Sci. Eng. A 2022, 831, 142232. [Google Scholar] [CrossRef]
- Geng, P.; Qin, G.; Zhou, J.; Li, T.; Ma, N. Characterization of microstructures and hot-compressive behavior of GH4169 superalloy by kinetics analysis and simulation. J. Mater. Process. Technol. 2021, 288, 116879. [Google Scholar] [CrossRef]
- Yang, X.; Li, W.; Ma, J.; Hu, S.; He, Y.; Li, L.; Xiao, B. Thermo-physical simulation of the compression testing for constitutive modeling of GH4169 superalloy during linear friction welding. J. Alloys Compd. 2016, 656, 395–407. [Google Scholar] [CrossRef]
- Chen, X.-M.; Lin, Y.C.; Li, X.-H.; Chen, M.-S.; Yuan, W.-Q. Investigation on strain dependence of metadynamic recrystallization behaviors of GH4169 superalloy. Vacuum 2018, 149, 1–11. [Google Scholar] [CrossRef]
- Ning, Y.; Fu, M.W.; Chen, X. Hot deformation behavior of GH4169 superalloy associated with stick δ phase dissolution during isothermal compression process. Mater. Sci. Eng. A 2012, 540, 164–173. [Google Scholar] [CrossRef]
- Ahmadi, H.; Ashtiani, H.; Heidari, M. A comparative study of phenomenological, physically-based and artificial neural network models to predict the Hot flow behavior of API 5CT-L80 steel. Mater. Today Commun. 2020, 25, 101528. [Google Scholar] [CrossRef]
- Zhou, Z.; Zhang, R.; Cui, C.; Zhou, Y.; Sun, X. Hot compression behaviors and deformation mechanisms of a Ni–Co-based superalloy with columnar grains. Mater. Sci. Eng. A 2022, 833, 142370. [Google Scholar] [CrossRef]
- Tan, Y.B.; Ma, Y.H.; Zhao, F. Hot deformation behavior and constitutive modeling of fine grained Inconel 718 superalloy. J. Alloys Compd. 2018, 741, 85–96. [Google Scholar] [CrossRef]
- Geng, P.; Qin, G.; Zhou, J.; Zou, Z. Hot deformation behavior and constitutive model of GH4169 superalloy for linear friction welding process. J. Manuf. Processes 2018, 32, 469–481. [Google Scholar] [CrossRef]
- Zhu, Y.; Cao, Y.; Liu, C.; Luo, R.; Li, N.; Shu, G.; Huang, G.; Liu, Q. Dynamic behavior and modified artificial neural network model for predicting flow stress during hot deformation of Alloy 925. Mater. Today Commun. 2020, 25, 101329. [Google Scholar] [CrossRef]
- Deb, S.; Muraleedharan, A.; Immanuel, R.J.; Panigrahi, S.K.; Racineux, G.; Marya, S. Establishing flow stress behaviour of Ti-6Al-4V alloy and development of constitutive models using Johnson-Cook method and Artificial Neural Network for quasi-static and dynamic loading. Theor. Appl. Fract. Mech. 2022, 119, 103338. [Google Scholar] [CrossRef]
- Liu, J.; Chang, H.; Hsu, T.Y.; Ruan, X. Prediction of the flow stress of high-speed steel during hot deformation using a BP artificial neural network. J. Mater. Process. Technol. 2000, 103, 200–205. [Google Scholar] [CrossRef]
- Chen, X.M.; Nie, L.-Y.; Hu, H.W.; Lin, Y.C.; Liu, Y.-X.; Wu, Z.-L.; Zhou, X.J.; Zhang, J.; Lu, X.-Z. High-temperature deformation characteristics and constitutive models of Inconel 625 superalloy. Mater. Today Commun. 2022, 32, 103855. [Google Scholar] [CrossRef]
- Huang, W.; Lei, L.; Fang, G. Comparison Between Four Flow Stress Models Characterizing the Constitutive Behavior of Hot Deformation of 40Mn Steel. J. Mater. Eng. Perform. 2021, 30, 9149–9164. [Google Scholar] [CrossRef]
- Churyumov, A.; Kazakova, A.; Churyumova, T. Modelling of the Steel High-Temperature Deformation Behaviour Using Artificial Neural Network. Metals 2022, 12, 447. [Google Scholar] [CrossRef]
- Ren, J.; Wang, R.; Feng, Y.; Peng, C.; Cai, Z. Hot deformation behavior and microstructural evolution of as-quenched 7055 Al alloy fabricated by powder hot extrusion. Mater. Charact. 2019, 156, 109833. [Google Scholar] [CrossRef]
- Yang, Y.; Peng, X.; Ren, F.; Wen, H.; Su, J.; Xie, W. Constitutive Modeling and Hot Deformation Behavior of Duplex Structured Mg–Li–Al–Sr Alloy. J. Mater. Sci. Technol. 2016, 32, 1289–1296. [Google Scholar] [CrossRef]
- Askariani, S.A.; Hasan Pishbin, S.M. Hot deformation behavior of Mg-4Li-1Al alloy via hot compression tests. J. AlloyS Compd. 2016, 688, 1058–1065. [Google Scholar] [CrossRef]
Figure 1.
(a) Microstructure of the as-extruded GH4169 alloy, (b) schematic diagram of the deformation process.
Figure 1.
(a) Microstructure of the as-extruded GH4169 alloy, (b) schematic diagram of the deformation process.

Figure 2.
The curves of true stress–strain of GH4169 superalloy at different temperatures. (a) 700 °C; (b) 750 °C; (c) 800 °C; (d) 850 °C; and (e) 900 °C.
Figure 2.
The curves of true stress–strain of GH4169 superalloy at different temperatures. (a) 700 °C; (b) 750 °C; (c) 800 °C; (d) 850 °C; and (e) 900 °C.


Figure 3.
The linear relationship fitting at peak stress: (a) and (b) .

Figure 4.
Relationship between lnZ and ln[sinh(ασ)].

Figure 5.
The predicted flow stress values were compared with the experimental values at different strain rates. (a) 700 °C; (b) 750 °C; (c) 800 °C; (d) 850 °C; and (e) 900 °C.
Figure 5.
The predicted flow stress values were compared with the experimental values at different strain rates. (a) 700 °C; (b) 750 °C; (c) 800 °C; (d) 850 °C; and (e) 900 °C.

Figure 6.
BP neural network structure of the constitutive equation.

Figure 7.
Variation in MSE with the number of iterations in the hidden layer.

Figure 8.
The flow stress prediction data of a single-layer hidden layer are compared.


Figure 9.
The predicted flow stress data of the double-layer hidden layer were compared with the experimental data. (a) 700 °C; (b) 750 °C; (c) 800 °C; (d) 850 °C; and (e) 900 °C.
Figure 9.
The predicted flow stress data of the double-layer hidden layer were compared with the experimental data. (a) 700 °C; (b) 750 °C; (c) 800 °C; (d) 850 °C; and (e) 900 °C.


Figure 10.
The flow stress predicted by the BP network is correlated with the data obtained by compression test.
Figure 10.
The flow stress predicted by the BP network is correlated with the data obtained by compression test.

Figure 11.
Finite element model of the compression test.

Figure 12.
The nephogram of equivalent strain distribution.

Figure 13.
Comparison between the simulated stress–strain curves and compression test.

Figure 14.
Head load–stroke curve comparison.


Table 1.
The chemical composition of GH4169 alloy (wt.%).
| C | Mn | Si | P | S | Cr | Ni | Al | Ti | B | Mo | Nb | Fe |
|---|---|---|---|---|---|---|---|---|---|---|---|---|
| 0.027 | 0.04 | 0.08 | 0.004 | 0.002 | 18.71 | 52.85 | 0.46 | 0.96 | 0.0092 | 3.04 | 5.07 | Bal. |
Table 2.
Each parameter value under different strain.
| ε | lnA3 | n | Q (kJ/mol) | |
|---|---|---|---|---|
| 0.10 | 150.56 | 0.00141 | 50.39 | 1538.81 |
| 0.15 | 119.26 | 0.00125 | 36.96 | 1071.63 |
| 0.20 | 122.27 | 0.00118 | 34.75 | 1096.48 |
| 0.25 | 94.14 | 0.00115 | 24.01 | 847.68 |
| 0.30 | 99.63 | 0.00115 | 23.22 | 897.91 |
| 0.35 | 57.60 | 0.00122 | 12.36 | 530.47 |
| 0.40 | 35.51 | 0.00139 | 7.14 | 340.88 |
| 0.45 | 20.11 | 0.00186 | 3.67 | 212.92 |
| 0.50 | 13.27 | 0.00364 | 1.65 | 164.52 |
| 0.55 | 14.83 | 0.00371 | 1.74 | 179.17 |
| 0.60 | 12.01 | 0.01189 | 0.49 | 158.62 |
Table 3.
Flow stress error predicted by the constitutive equation and artificial neural network.
| Error (%) | Constitutive Equation Model | ANN Single Layer Hidden Layer | ANN Double Hidden Layer |
|---|---|---|---|
| AARE | 29.95 | 5.45 | 4.34 |
Publisher’s Note: MDPI stays neutral with regard to jurisdictional claims in published maps and institutional affiliations. |
© 2022 by the authors. Licensee MDPI, Basel, Switzerland. This article is an open access article distributed under the terms and conditions of the Creative Commons Attribution (CC BY) license (https://creativecommons.org/licenses/by/4.0/).
Share and Cite
MDPI and ACS Style
Cheng, P.; Wang, D.; Zhou, J.; Zuo, S.; Zhang, P. Comparison of the Warm Deformation Constitutive Model of GH4169 Alloy Based on Neural Network and the Arrhenius Model. Metals 2022, 12, 1429. https://doi.org/10.3390/met12091429
AMA Style
Cheng P, Wang D, Zhou J, Zuo S, Zhang P. Comparison of the Warm Deformation Constitutive Model of GH4169 Alloy Based on Neural Network and the Arrhenius Model. Metals. 2022; 12(9):1429. https://doi.org/10.3390/met12091429
Chicago/Turabian StyleCheng, Peng, Decheng Wang, Junying Zhou, Shanchao Zuo, and Pengfei Zhang. 2022. "Comparison of the Warm Deformation Constitutive Model of GH4169 Alloy Based on Neural Network and the Arrhenius Model" Metals 12, no. 9: 1429. https://doi.org/10.3390/met12091429
Note that from the first issue of 2016, this journal uses article numbers instead of page numbers. See further details here.