
Optimum Magnetic Properties of Non-Oriented Electrical Steel Produced by Compact Strip Production Process


1
School of Metallurgy and Resources, Anhui University of Technology, Maanshan 243002, China
2
National Engineering Research Center of Continuous Casting Technology, China Iron & Steel Research Institute Group, Beijing 100081, China
3
School of Metallurgy, Northeastern University, Shenyang 110819, China
*
Author to whom correspondence should be addressed.
Metals 2022, 12(1), 64; https://doi.org/10.3390/met12010064
Submission received: 20 November 2021
/
Revised: 18 December 2021
/
Accepted: 22 December 2021
/
Published: 28 December 2021
(This article belongs to the Special Issue Texture, Microstructure and Properties of Electrical Steels)
Abstract
:Optimum grain size and effects of crystallographic textures on magnetic properties of Fe-0.65%Si non-oriented electrical steel produced by compact strip production (CSP) process were investigated by optical microscope, electron backscatter diffraction (EBSD), and X-ray diffraction (XRD) techniques. Magnetic induction and core loss show a decreasing trend with the increase of grain size, and grain sizes for optimal magnetic properties are in the range of 26–30 μm. Core loss would be mainly affected by grain size, whereas crystallographic texture would primarily affect magnetic flux density. Magnetic properties increase with increasing of texture factor (volume fraction ratio of {100}/{111}) and magnetic texture factor (volume fraction ratio of <100>/<111>), and increasing with the decrease of A-parameter (minimum angle between magnetization direction and the closest <100> direction) and , respectively. Simultaneously, with increasing of A-parameter and , a linear decrease of B50 was obtained.
1. Introduction
Non-oriented electrical steel is an extremely important Fe-Si soft magnetic alloy with many factors affecting its magnetic properties, among which alloy composition, grain size, and texture component content have the greatest influence [1,2,3]. As the grain size of the annealed sheet increases, the magnetic domain size would also increase and hysteresis loss (Ph) decrease, but both eddy current loss (Pe) and the abnormal eddy loss (Pa) considering the magnetic domain structure would increase [4,5,6,7]. Meanwhile, grain size of the optimum magnetic properties would obviously be correlated with composition and cleanliness of the steel.
Due to the magneto-crystalline anisotropy of ferromagnetic materials where the <100> crystal directions are the easy magnetization axes of bcc iron, texture of non-oriented electrical steels has a profound effect on the magnetic properties, especially on core loss and magnetic induction. Hence, ideal crystal texture of <100> crystal directions is always sought for improving magnetic properties of non-oriented electrical steel [2,3]. In order to correlate the crystallographic texture to magnetic properties, texture factor (ratio of {001}<uvw> to {111}<uvw>), magnetic texture factor (ratio of <100> to <111>), A-parameter (minimum angle between magnetization direction and the closest <100> direction), and E (magnetic anisotropic properties) have been proposed, which usually evaluate the relative volume factions of specific orientations in the complete texture [8,9,10,11,12,13,14,15]. Magnetic properties and texture factor, magnetic texture factor, A-parameters, and E are directly related. Therefore, the magnetic properties of non-oriented electrical steel could be quantified by analyzing the content of different textures. K.M. Lee et al. [9] showed that magnetic properties and magnetic anisotropy parameters which were determined by the texture have a strict linear relationship. While the grain size and alloy element content were equivalent, Sidor J.J. et al. [13] studied the influence of the microstructure and texture of non-oriented silicon steel on the magnetic properties through model establishment and texture data analysis, and concluded that there is a strict corresponding relationship between texture components and magnetic properties.
Simultaneously, non-oriented electrical steel in the CSP process has the advantages of high efficiency and low energy consumption [16,17,18,19], and the fine and developed columnar crystals themselves belong to the <001> direction and the hot-rolling rough-rolling process is omitted, which makes it beneficial to higher content of favorable texture components [20,21,22] and which is especially suitable for improving the magnetic properties. However, due to the large difference between CSP process and the conventional slab process, there are few systematic and in-depth studies on the influence of the microstructure and texture of non-oriented electrical steel in CSP process on the magnetic properties. Therefore, this research carried out experiments on CSP non-oriented electrical steel cold-rolled sheets and annealed sheets. The detailed relationship between the magnetic properties, microstructure, and texture of non-oriented electrical steel in the CSP process were studied, with the aim to provide the theoretical basis of optimization magnetic properties of CSP process non-oriented electrical steel.
2. Materials and Methods
The chemical composition of Fe-0.65%Si non-oriented electrical steel produced by CSP process with 70 mm in thickness used in the present study is given in Table 1 [18]. Hot rolled bands were plastically deformed from 2.5 mm to 0.5 mm with cold rolling. Afterwards, the cold rolled sheets were annealed in 30%H2 + 70%N2 atmosphere. The initial annealing temperature was set to 700 °C, increasing to 980 °C every 20 °C, and the annealing time was set to 3 min and 5 min according to the situation of the continuous annealing furnace on site. In order to ensure the accuracy of annealing test, each annealing process adopts four rolling direction and four transverse samples.
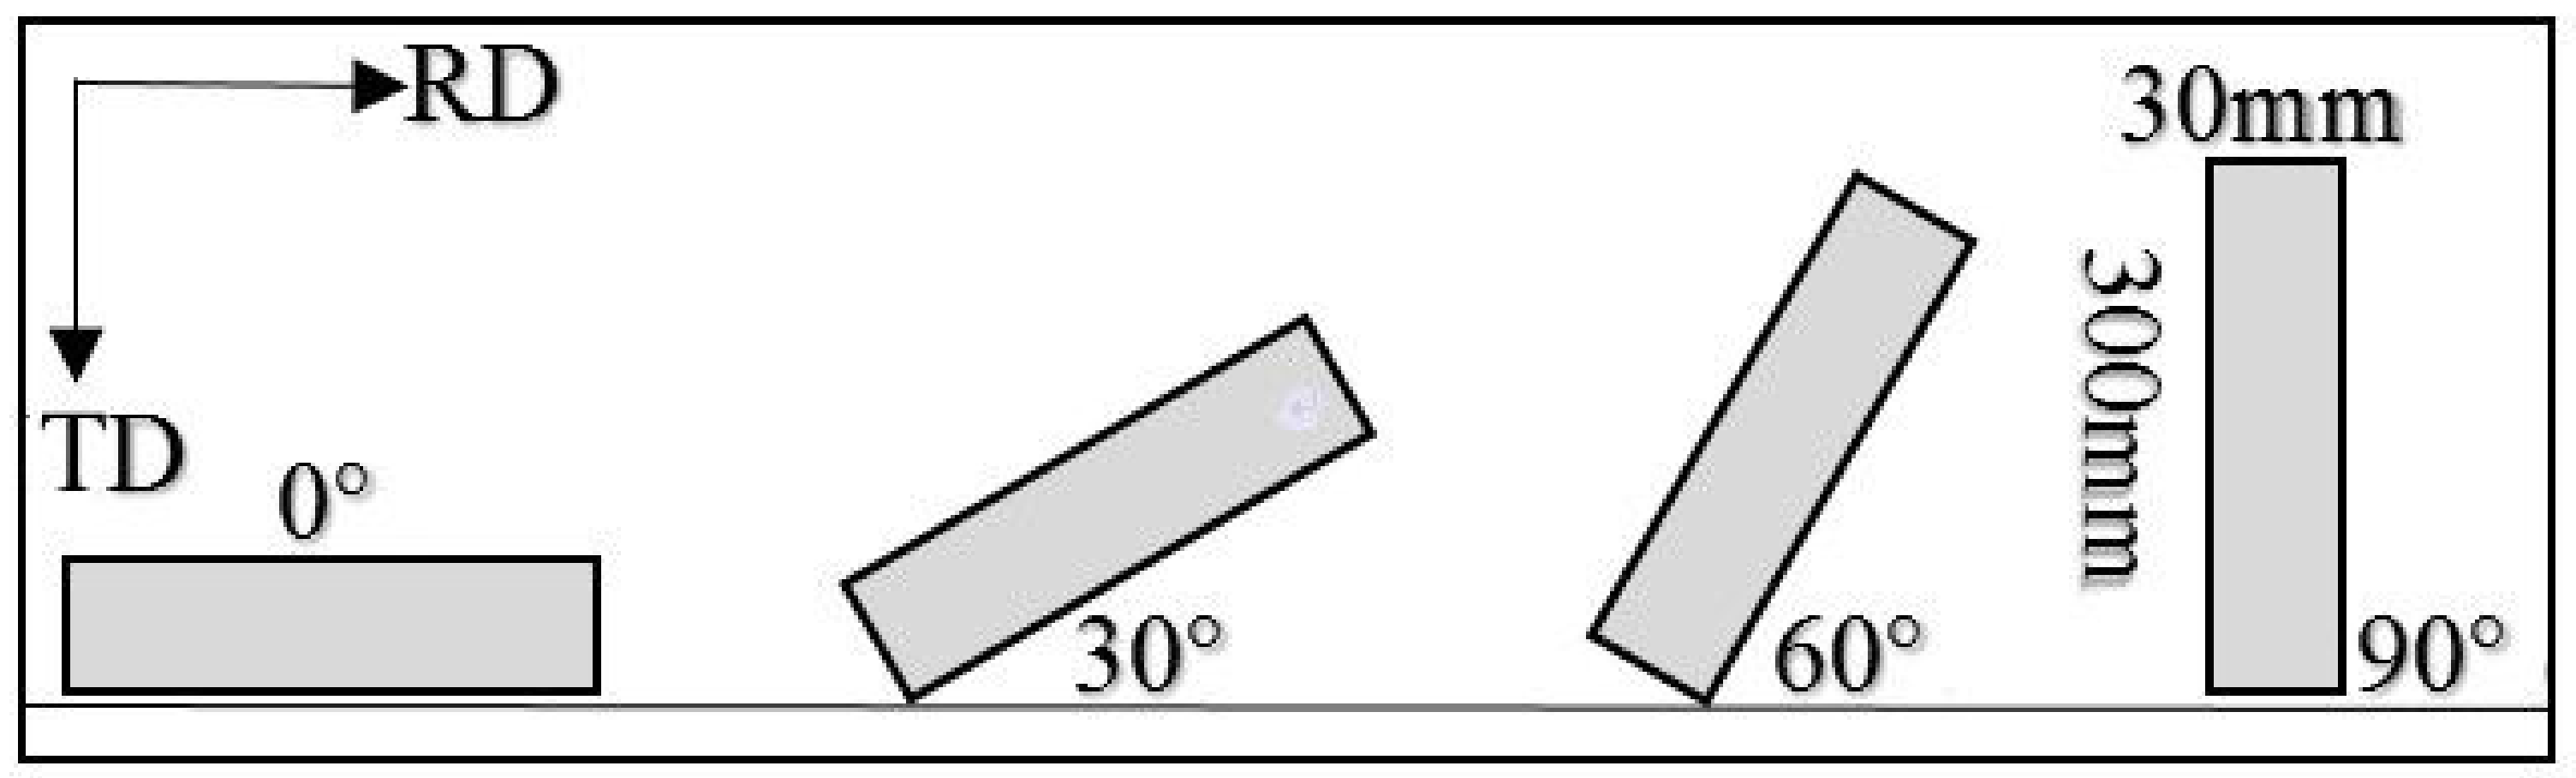
In order to study effects of texture on the magnetic properties, the annealed Fe-0.65%Si non-oriented electrical steel plate in the CSP process was sampled, and the rolling direction was sheared at 0° (rolling direction RD), 30°, 60°, and 90° (transverse TD) to make a 30 × 300 mm sample for microstructure, macro-texture and micro-texture inspection. The sampling diagram is shown in Figure 1.
Microstructure was optically observed on the longitudinal section as defined by the RD and the ND using ZEISS-Axio Scope A1 optical microscope. Macro-textures were measured at surface, quarter, and center thickness layers using PANalytical EMPYREAN SERIES 2 X-ray diffraction with a radiation source of Co K-alpha. Micro-textures of the samples also were analyzed by ZEISS SUPRA 55VP field emission scanning electron microscope equipped with EDAX OIM electron backscatter diffraction (EBSD) system. The measurements were made on the cross sections defined by the rolling and normal directions. The area fractions of various textures were calculated using OIM Analysis 6.1 software. Magnetic properties of final-annealed sheets with 30 mm in width and 300 mm in length were tested by MPG100D equipment. In order to ensure the accuracy of magnetic properties testing, three annealed sheets in transverse and rolling directions were selected to take the average value of magnetic properties by single sheet test.
3. Results and Discussions
3.1. Microstructure
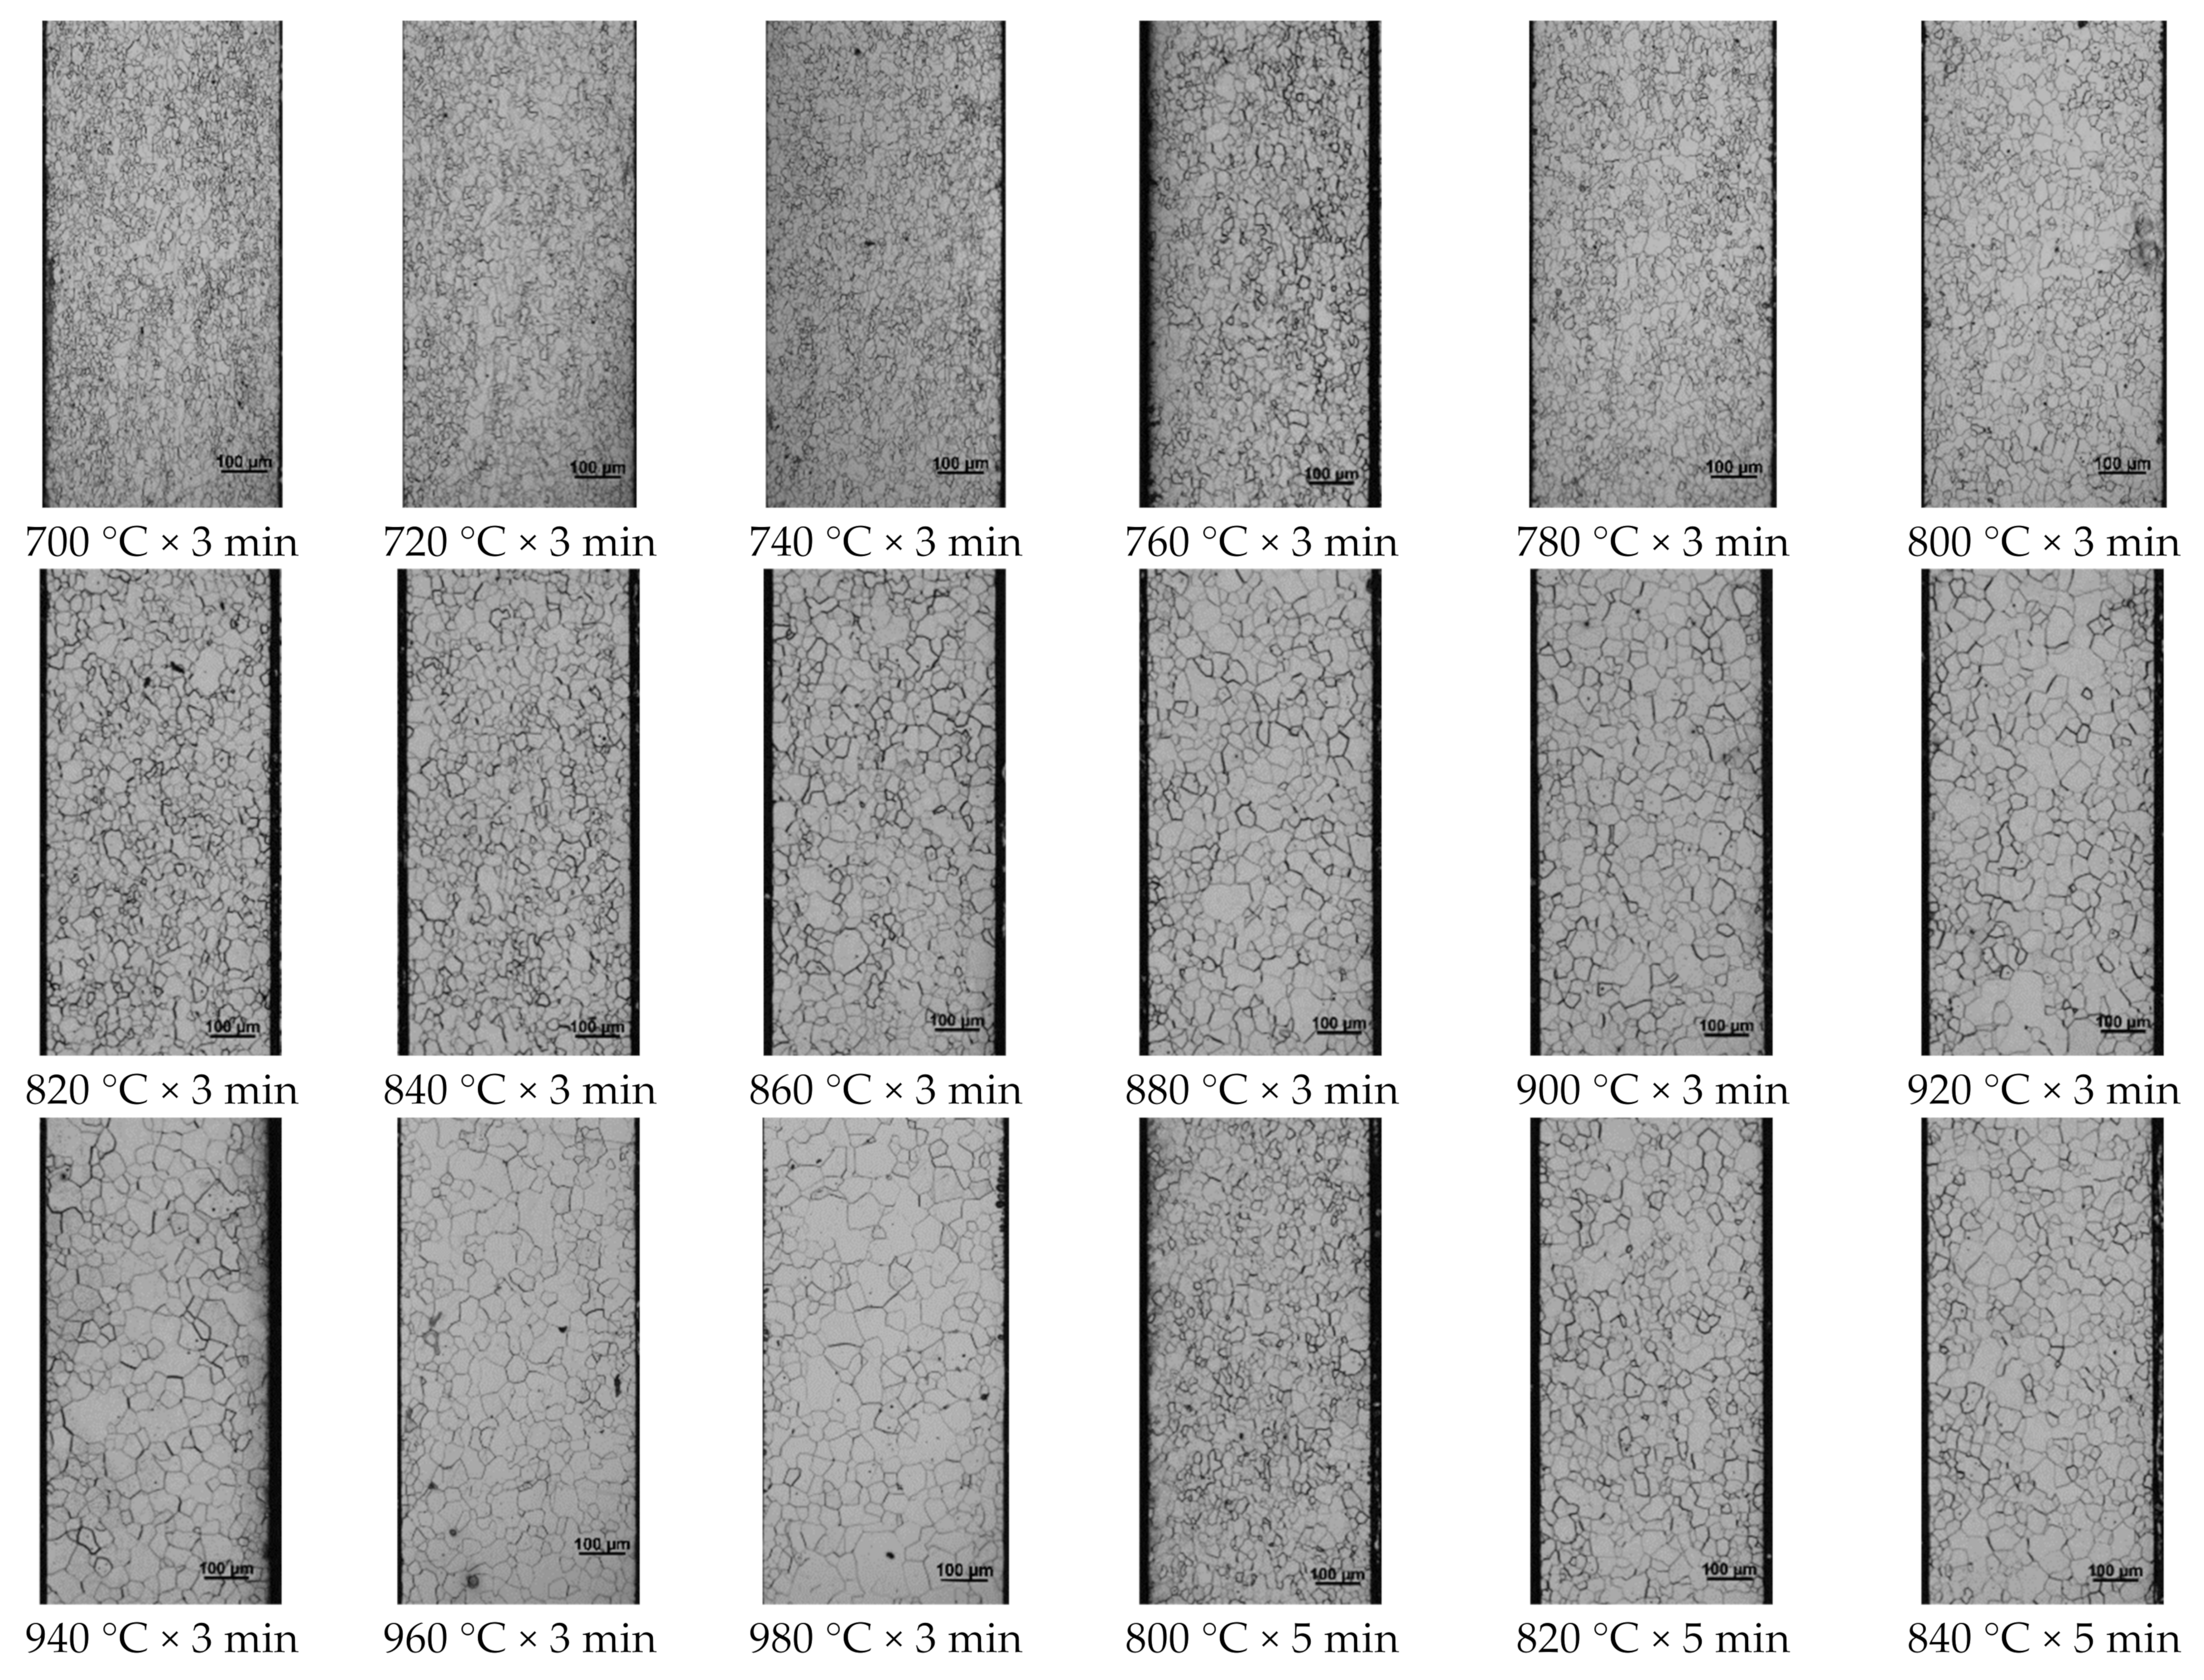
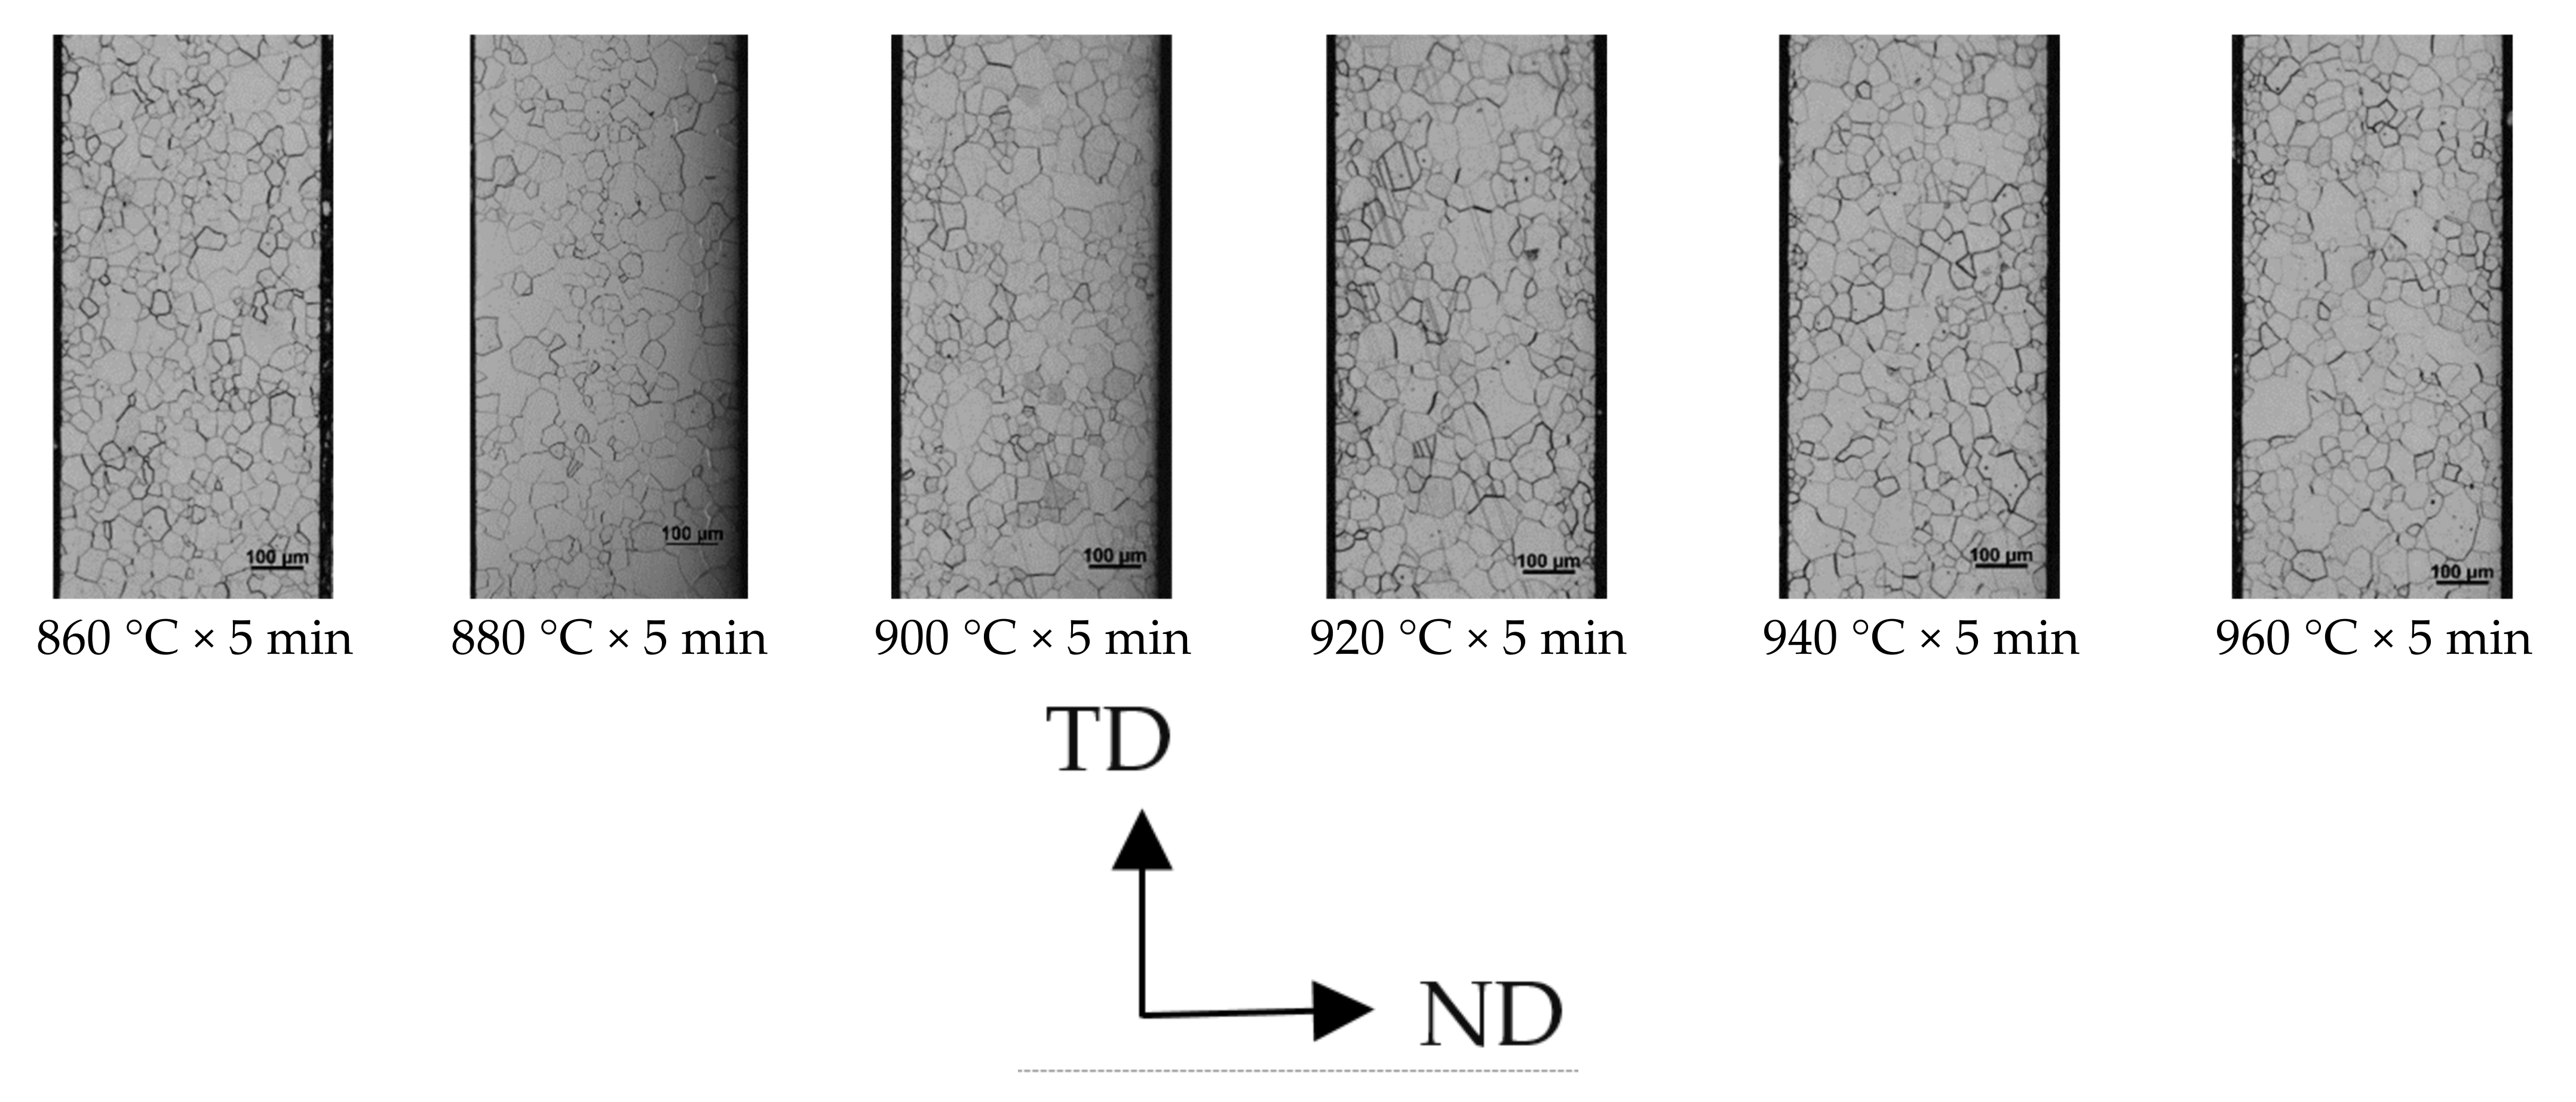
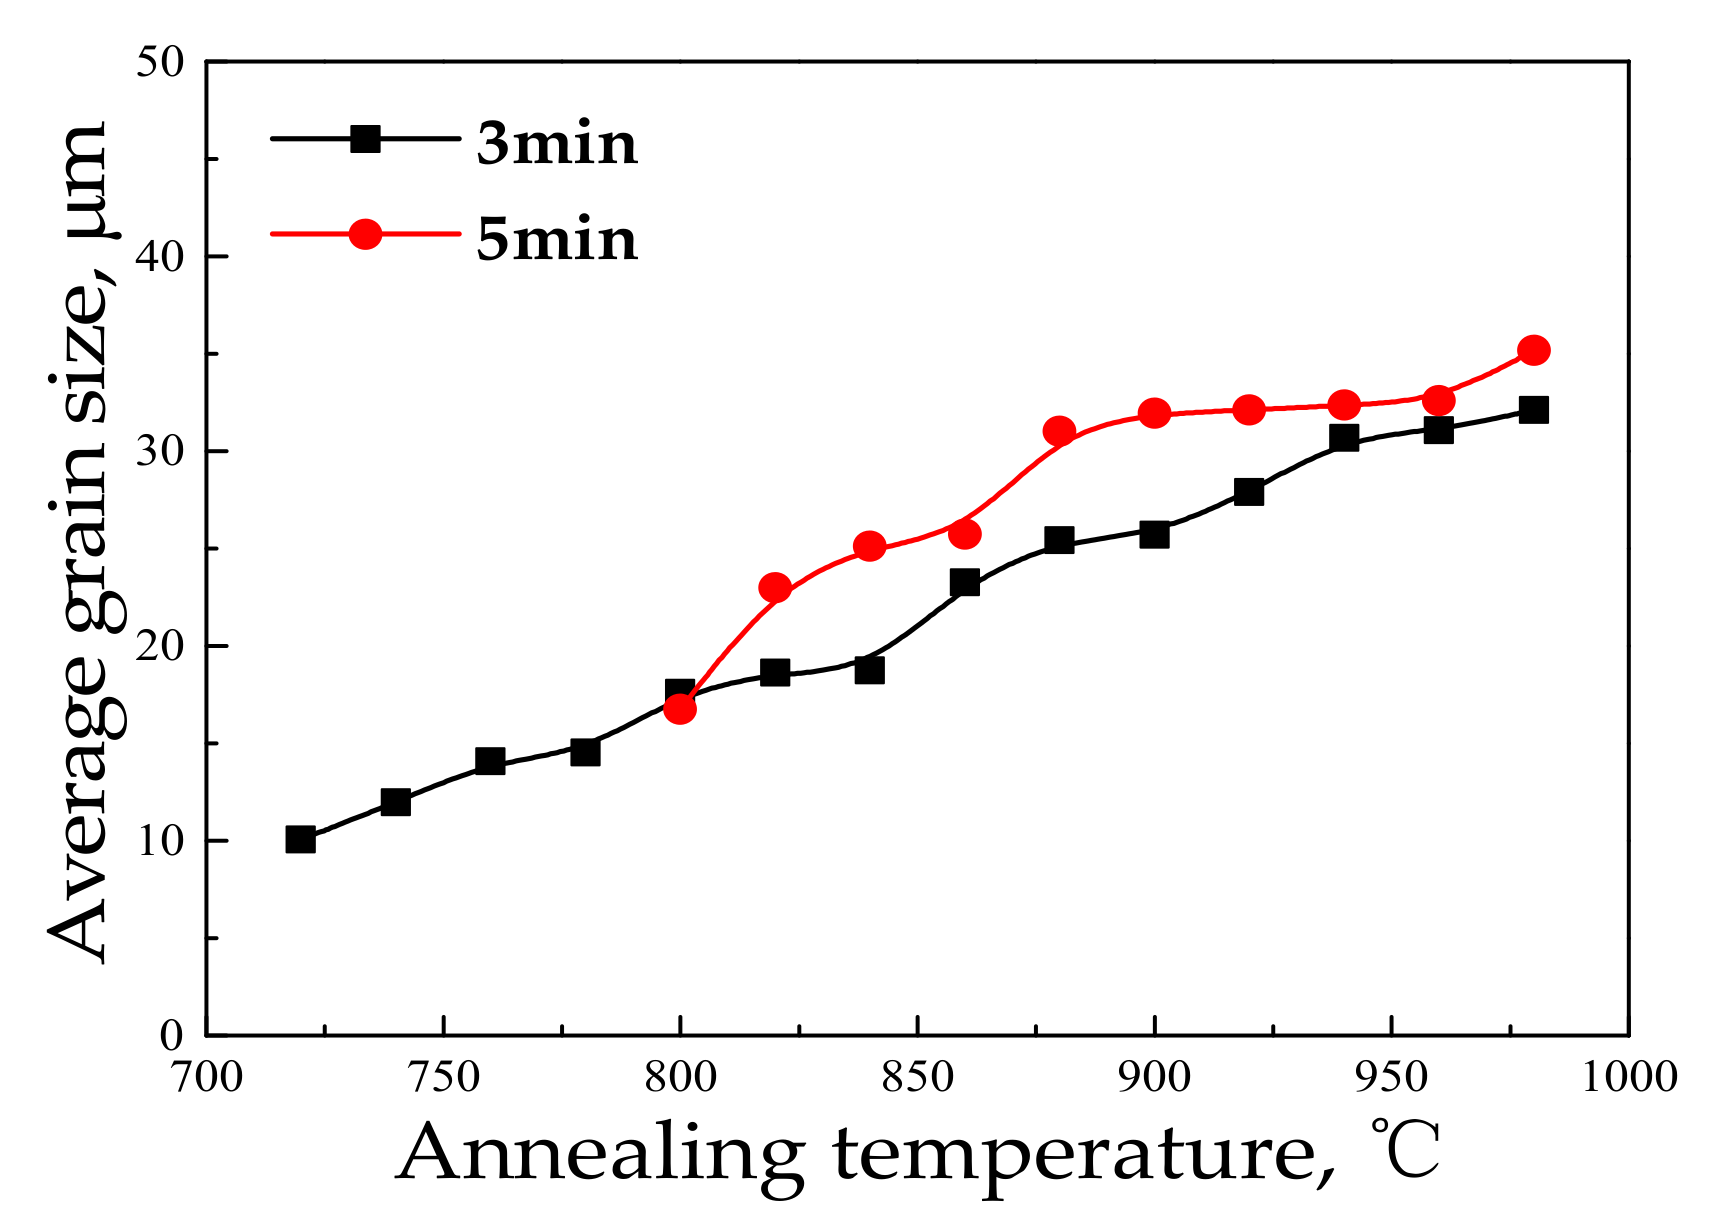
Microstructure and grain sizes of Fe-0.65%Si non-oriented electrical steel in the CSP process under different annealing processes are shown in Figure 2 and Figure 3.
As the annealing temperature increases, the grain size of the annealed sheet gradually becomes larger. Nonetheless, after annealing temperature is increased to 920 °C, grain size increases to a smaller extent, and the increase of grain size is reduced by extending annealing time.
3.2. Correlation of Microstructure and Magnetic Properties
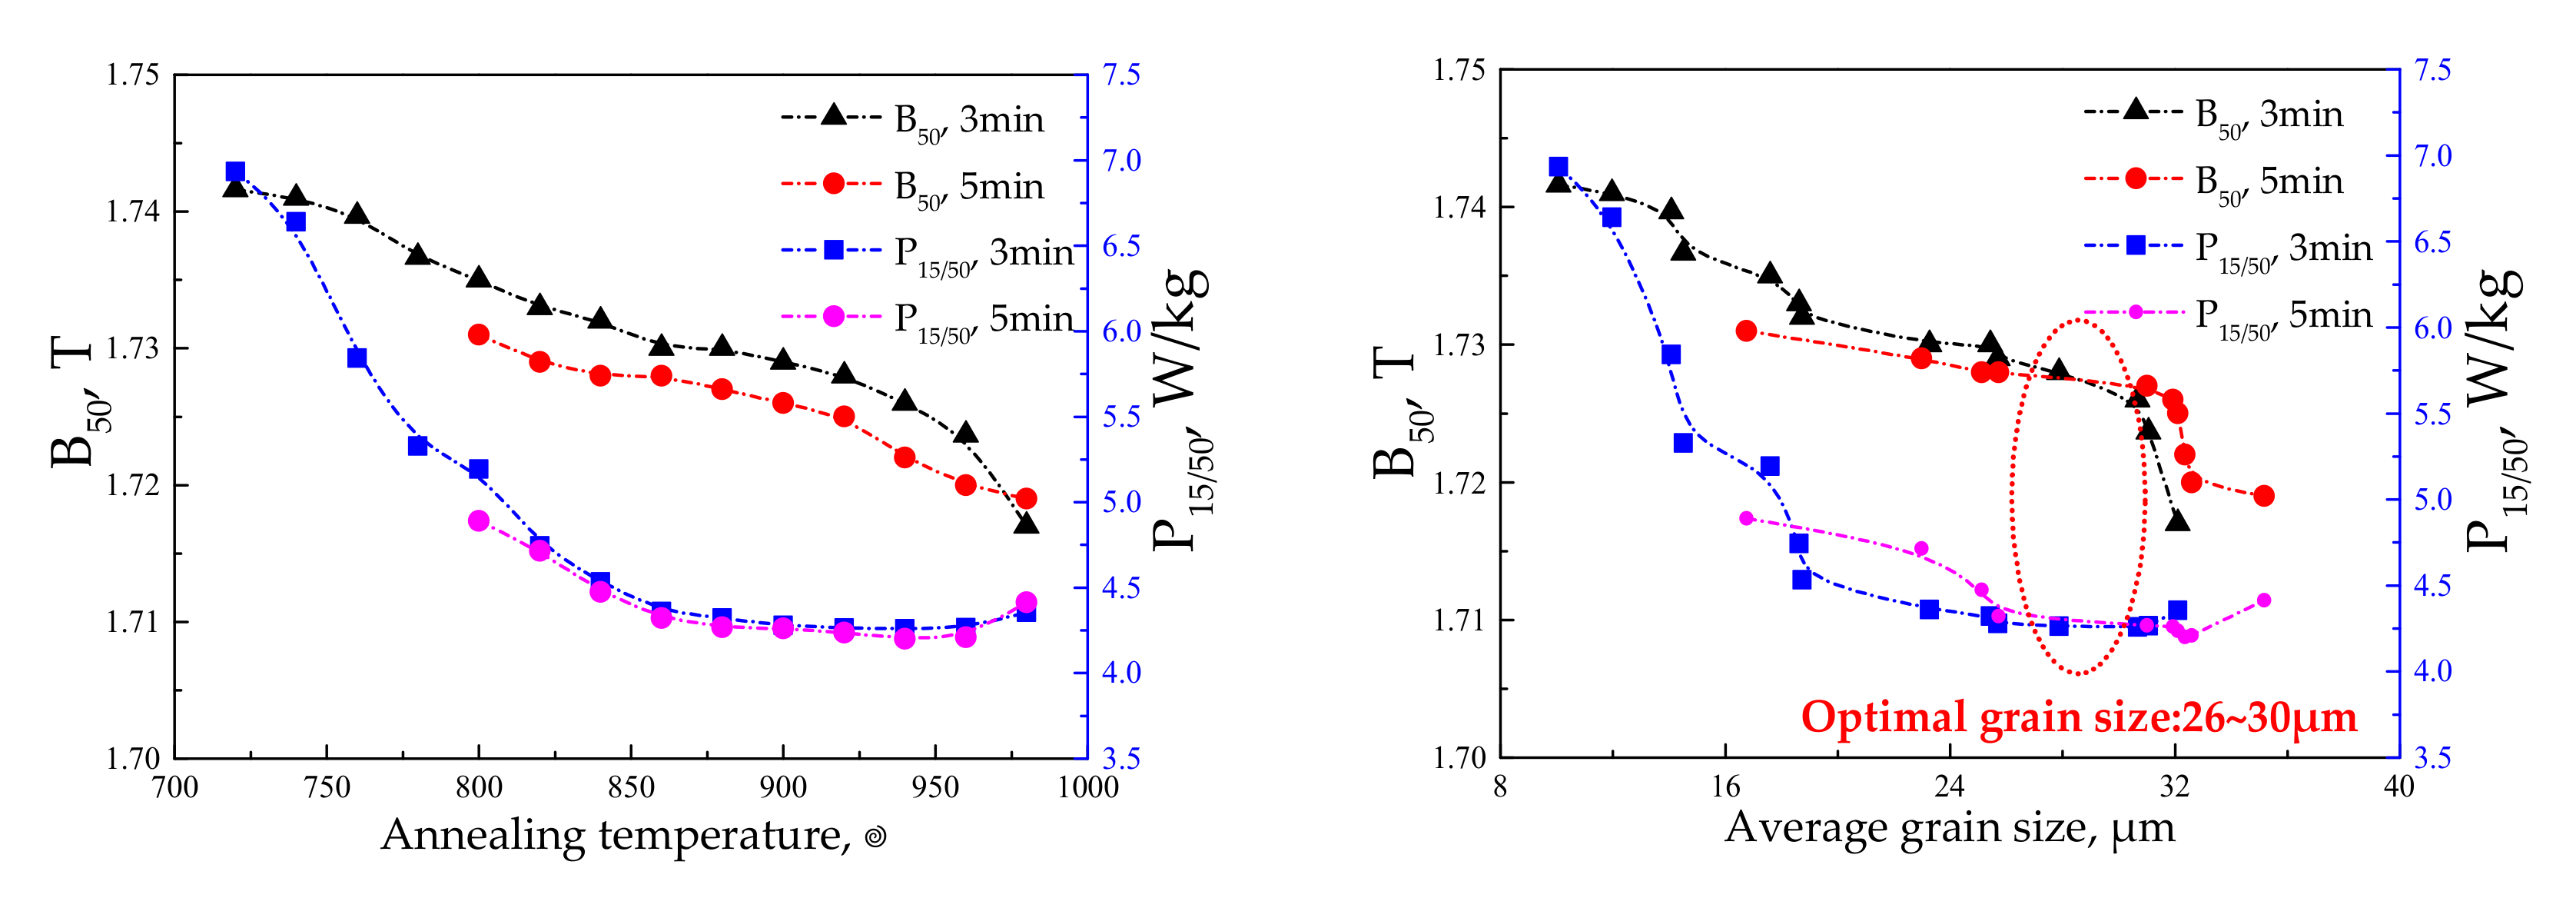
At power frequency, hysteresis loss (Ph) is inversely proportional to the grain size D, and eddy current loss (Pe) is directly proportional to D. There is an optimal critical grain size to minimize core loss of the annealed sheet [23,24]. Therefore, in the case of a fixed cold rolling reduction rate, the reasonable annealing temperature and time are particularly critical to the grain size of the annealed sheet. The variation trend of magnetic properties of Fe-0.65%Si annealed sheet with annealing temperature and grain size are shown in Figure 4.
Core loss (P15/50 was determined at induction of 1.5 T and 50 Hz) of Fe-0.65%Si annealed sheet shows a downward trend with the increase of annealing temperature, and the downward trend is smaller after 880 °C and slightly increases after 940 °C. Magnetic induction (B50 was determined at a magnetic field strength of H = 5000 A/m) shows a downward trend with the increase of annealing temperature, and drops rapidly after reaching 920 °C. Therefore, a proper annealing process is a prerequisite for improving the magnetic properties. Relationship between grain size and magnetic properties shows as formula (1) [25]
where D is grain size, γ is the domain wall energy per unit domain wall area, K1 is the magneto-crystalline anisotropy constant, and δ is the magnetic domain width.
With the increase of D, the number of grain boundaries decreases, the area occupied by grain boundaries decreases, and the hysteresis loss decreases. Meanwhile, under the condition of power frequency, Ph usually accounts for 60–80% of PT (total core loss) in non-oriented electrical steel [1,2,3]. Therefore, P15/50 of the annealed sheet decreases as the annealing temperature increases. Because of the eddy current loss would increase with the magnetic domain width [1,2,3], it is speculated that as the annealing temperature continues to increase, the grain size of the annealed sheet exceeds the critical grain size, causing the eddy current loss to be greater than the reduction in hysteresis loss, and thus the core loss of the annealed plate increases. With the increase of grain size, the magnetic induction intensity and core loss decreased. Taking into account annealing temperature, annealing time (as shown in Figure 3), P15/50 and B50 of the Fe-0.65%Si non-oriented electrical steel annealed sheet, as shown in Figure 4, grain size for optimal magnetic properties is 26–30 μm.
3.3. Textures and Magnetic Properties
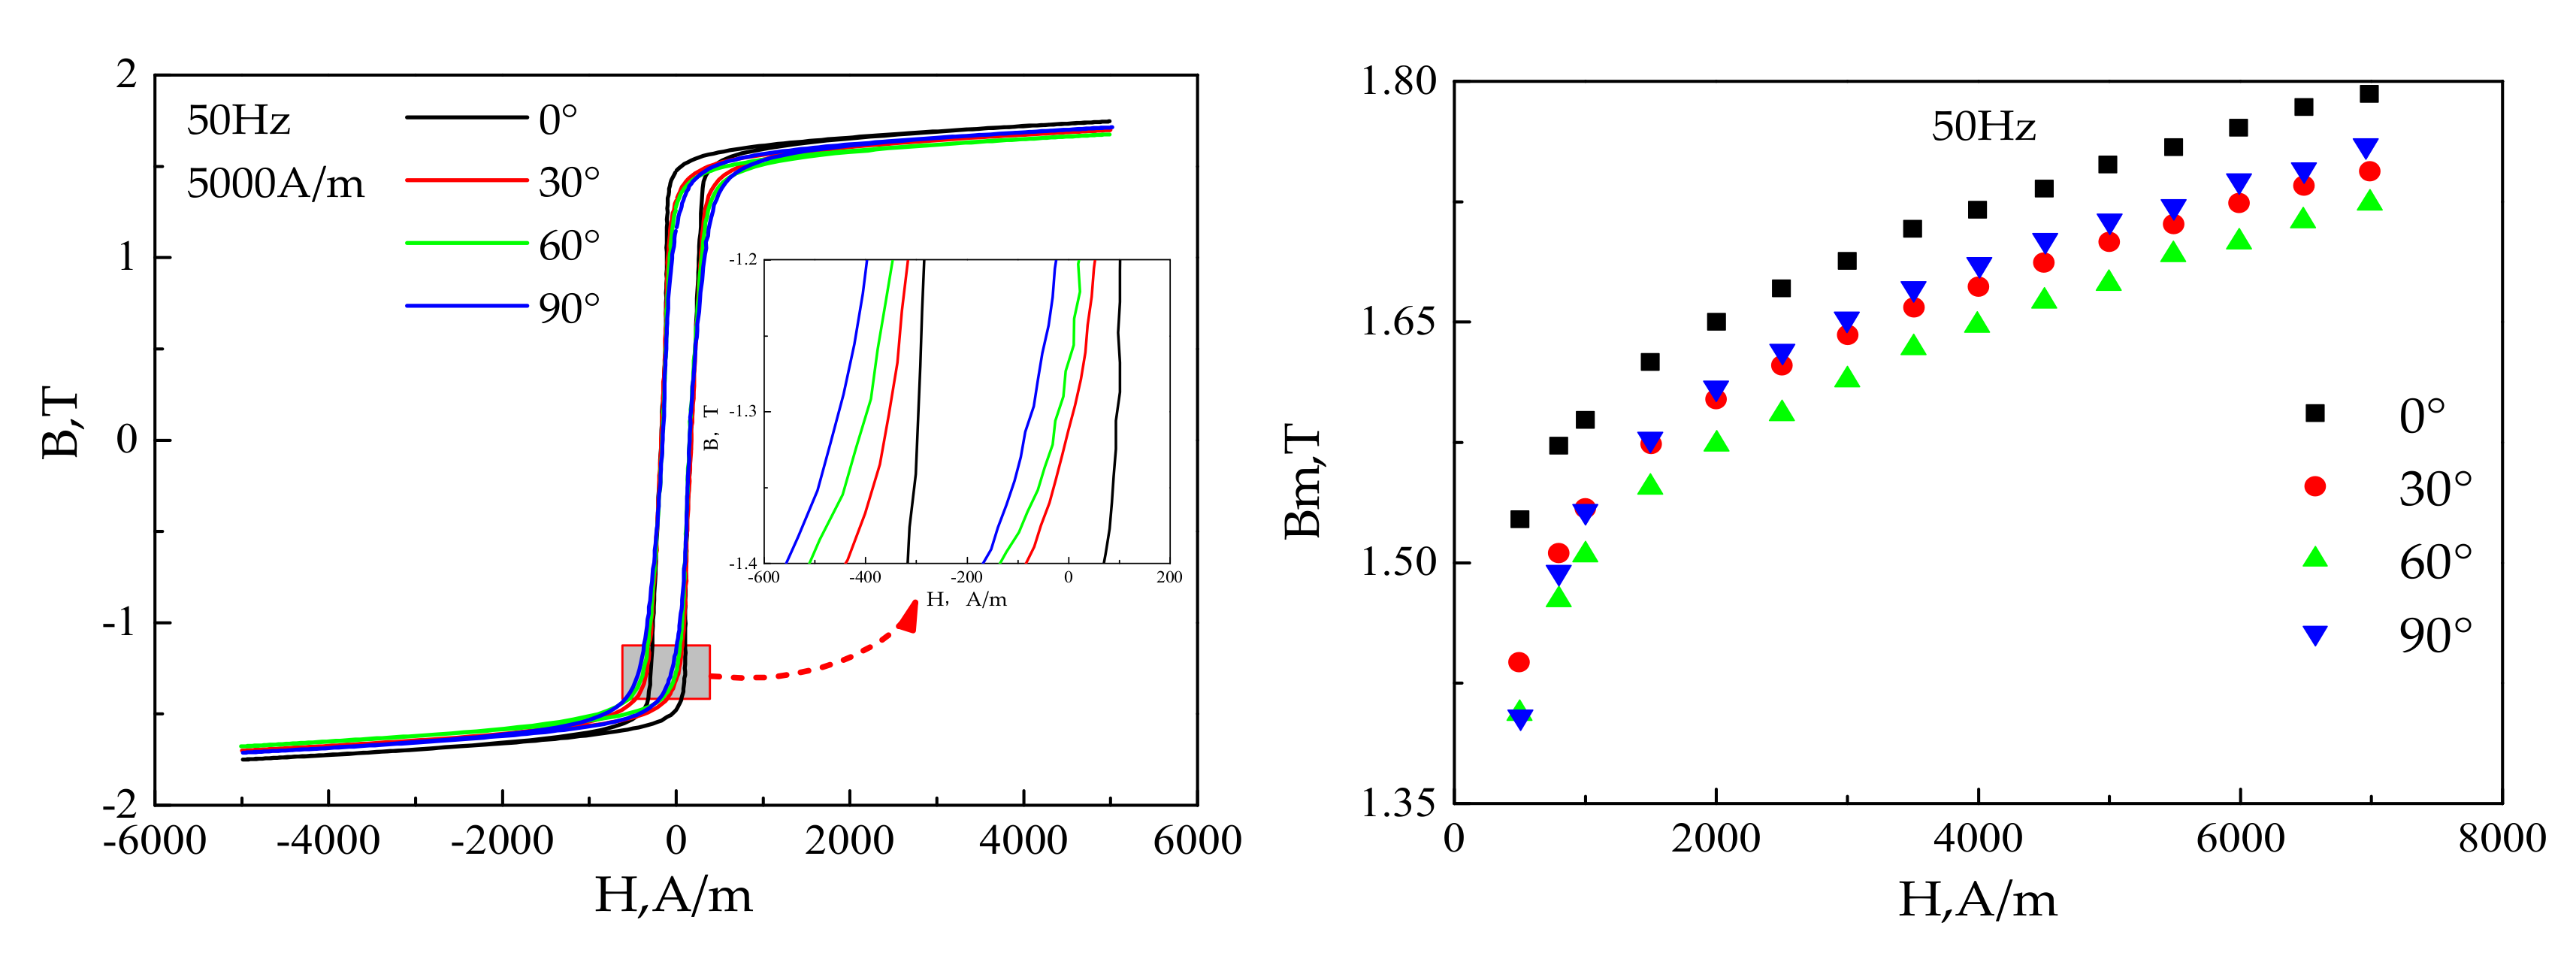
Measurement the magnetic hysteresis loop at 50 Hz and 5000 A/m and the magnetization curve at 50 Hz of samples at 0°, 30°, 60°, and 90° with the rolling direction (in subsequent studies, they will be named: 0° sample, 30° sample, 60° sample, and 90° sample) of Fe-0.65%Si which were annealed in 30%H2 + 70%N2 atmosphere at 880 °C are shown in Figure 5 and Figure 6. The order of the area enclosed by the hysteresis loop of samples is 60°, 30°, 90°, and 0° sample, so the hysteresis loss is also in this order at 50 Hz and 5000 A/m. The magnetization curve shows that the order of the degree of difficulty of magnetization in each sample is 60° (difficult) →30°→90°→0° (easy).
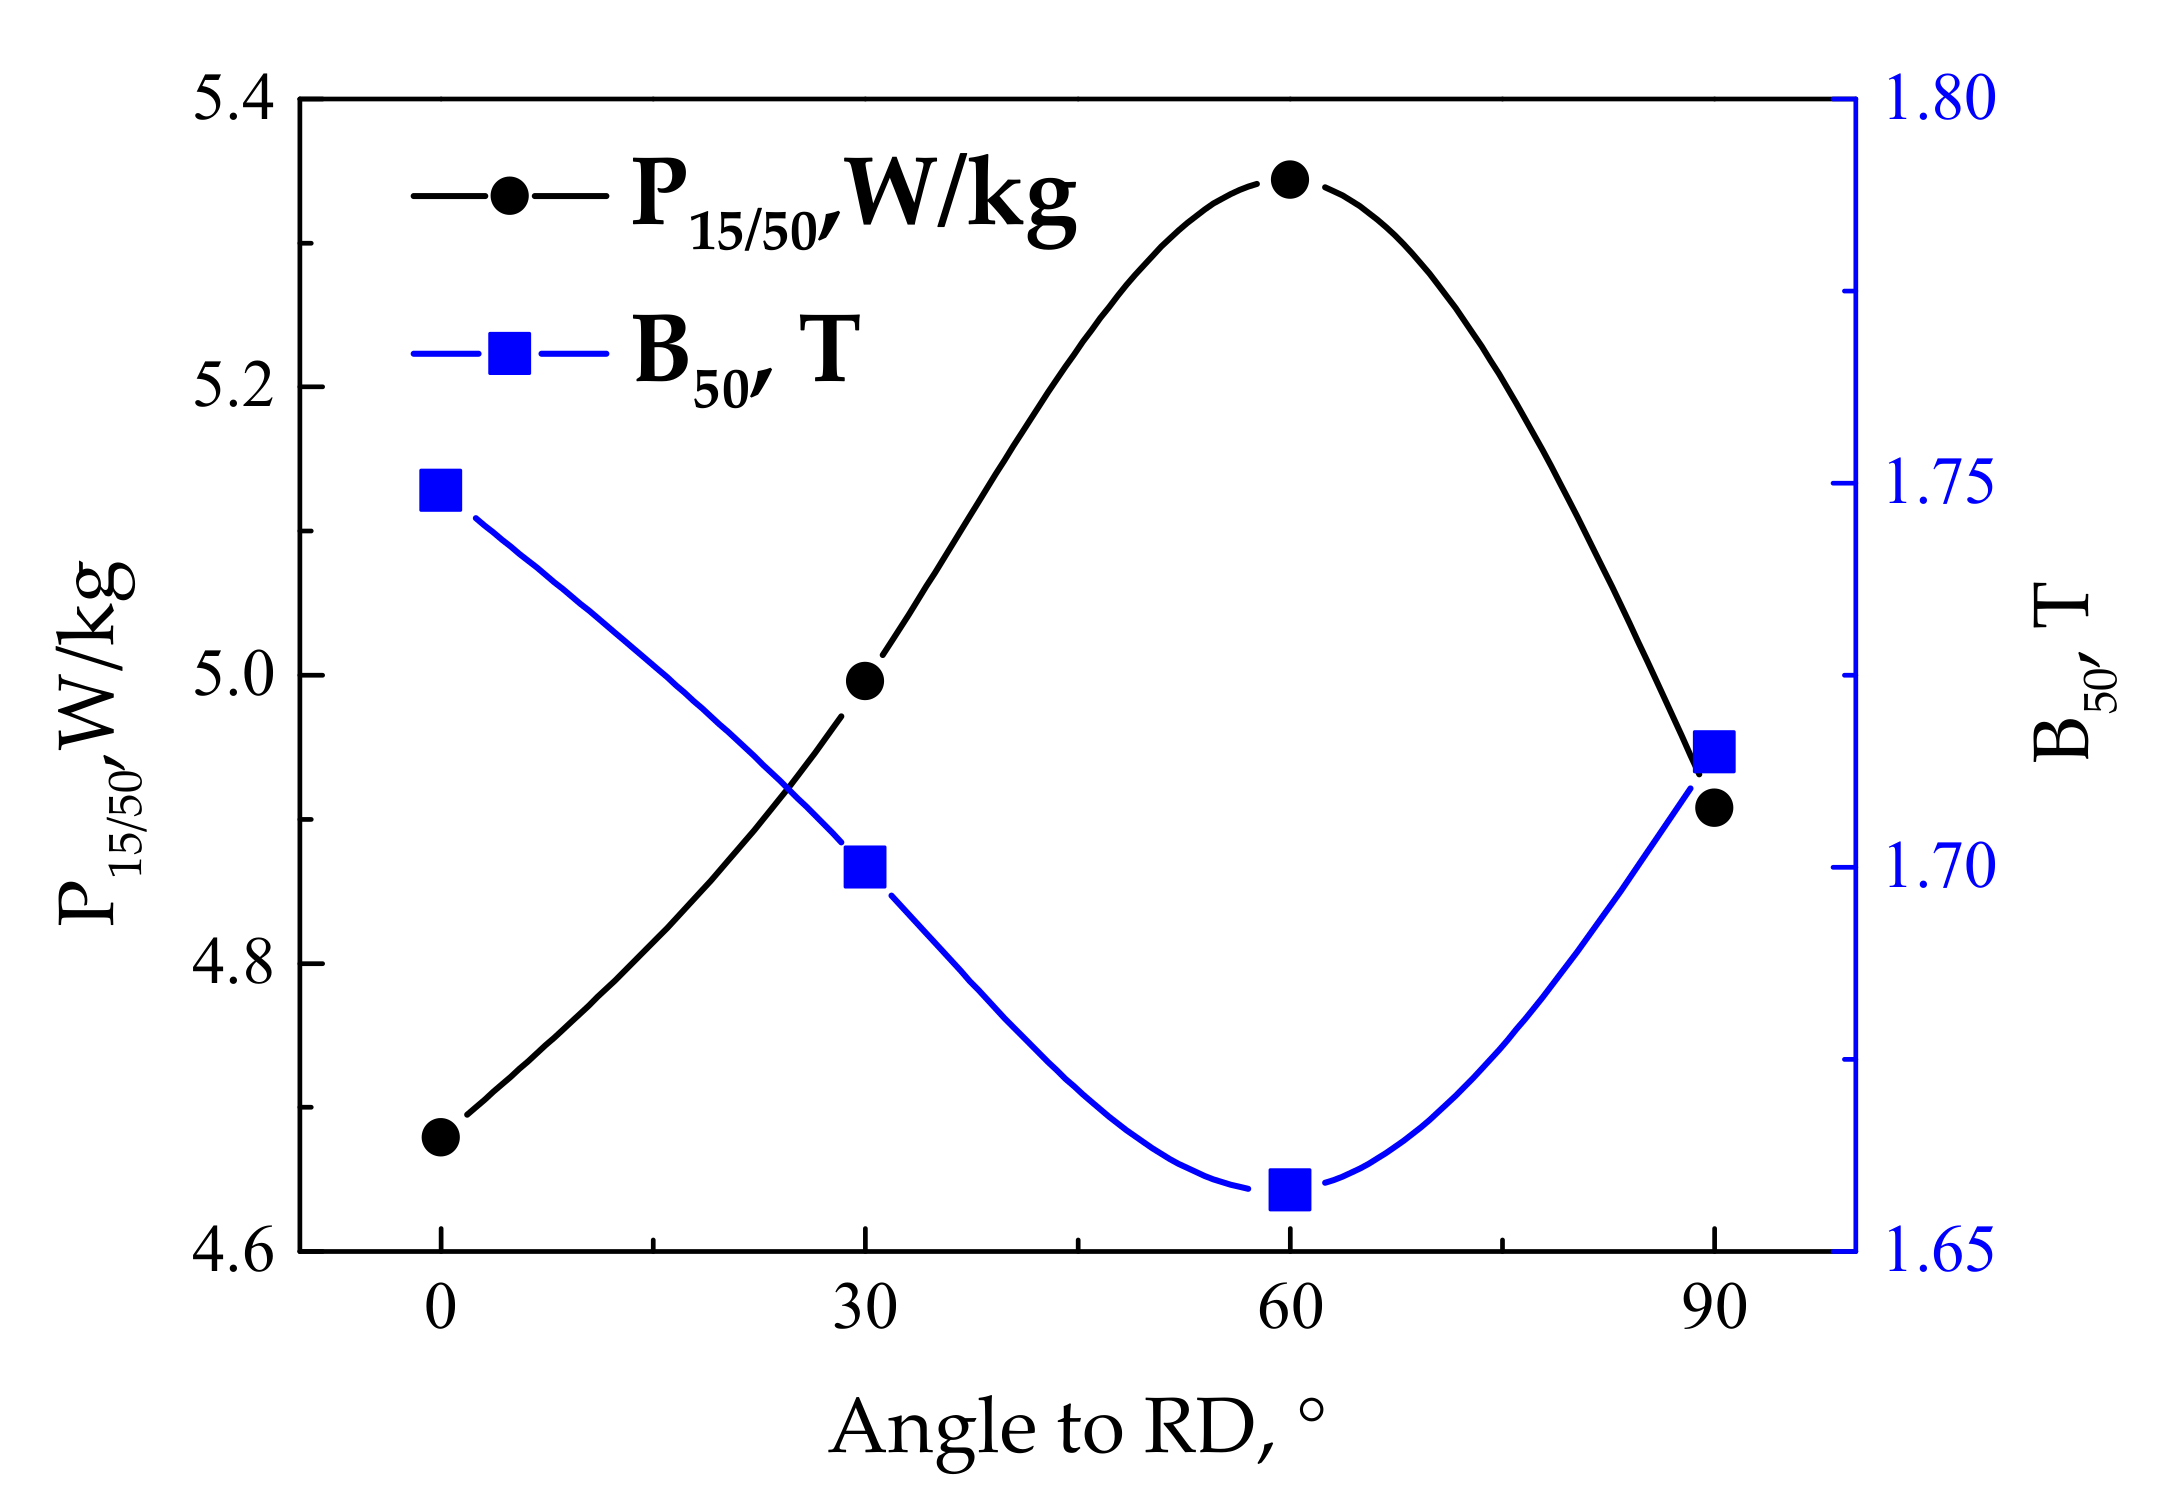
Magnetic properties of Fe-0.65%Si non-oriented electrical steel annealed sheet samples at different angles with the rolling direction are shown in Figure 6. Changing trend of magnetic induction and core loss are opposite, and magnetic properties change in the order of 60° (the worst)→30°→90°→0° (the best), which corresponds exactly to hysteresis loops at 50 Hz, 5000 A/m in Figure 5. Since samples are from the same annealed sheet, the influence of chemical composition and grain size on the magnetic properties could be excluded, thus the changing trend of magnetic properties in Figure 6 is caused by changing of texture.
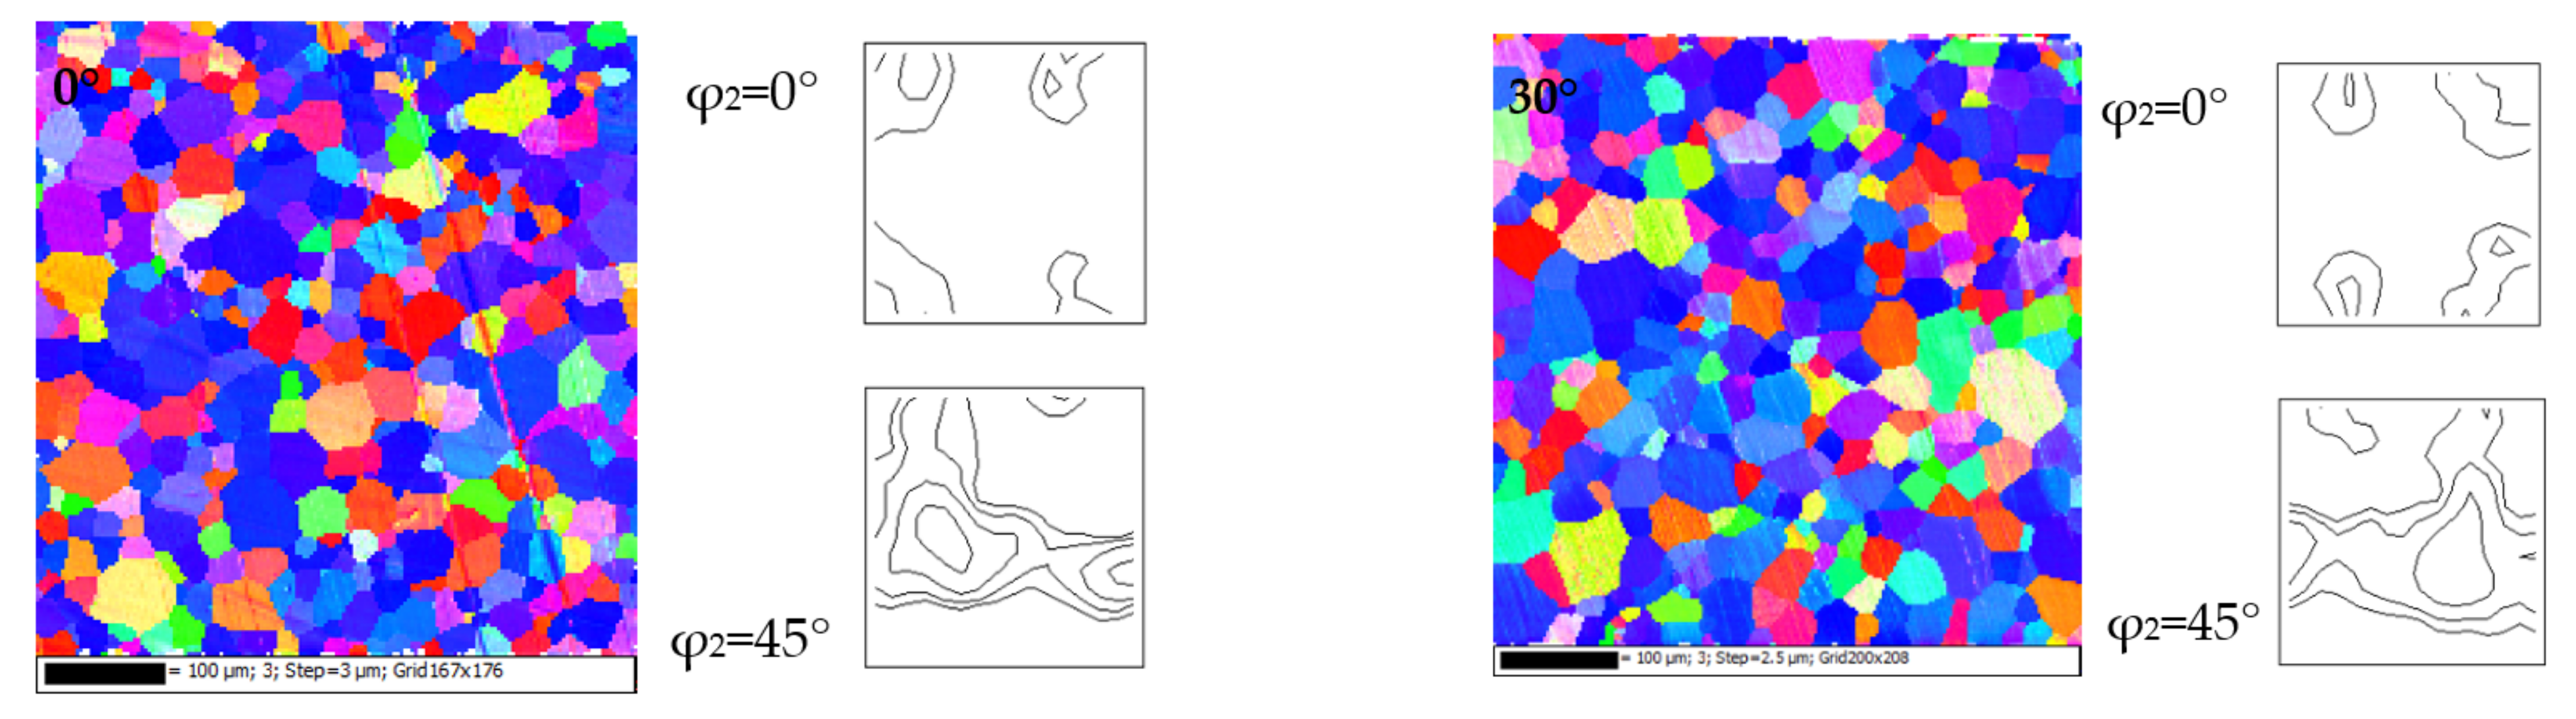
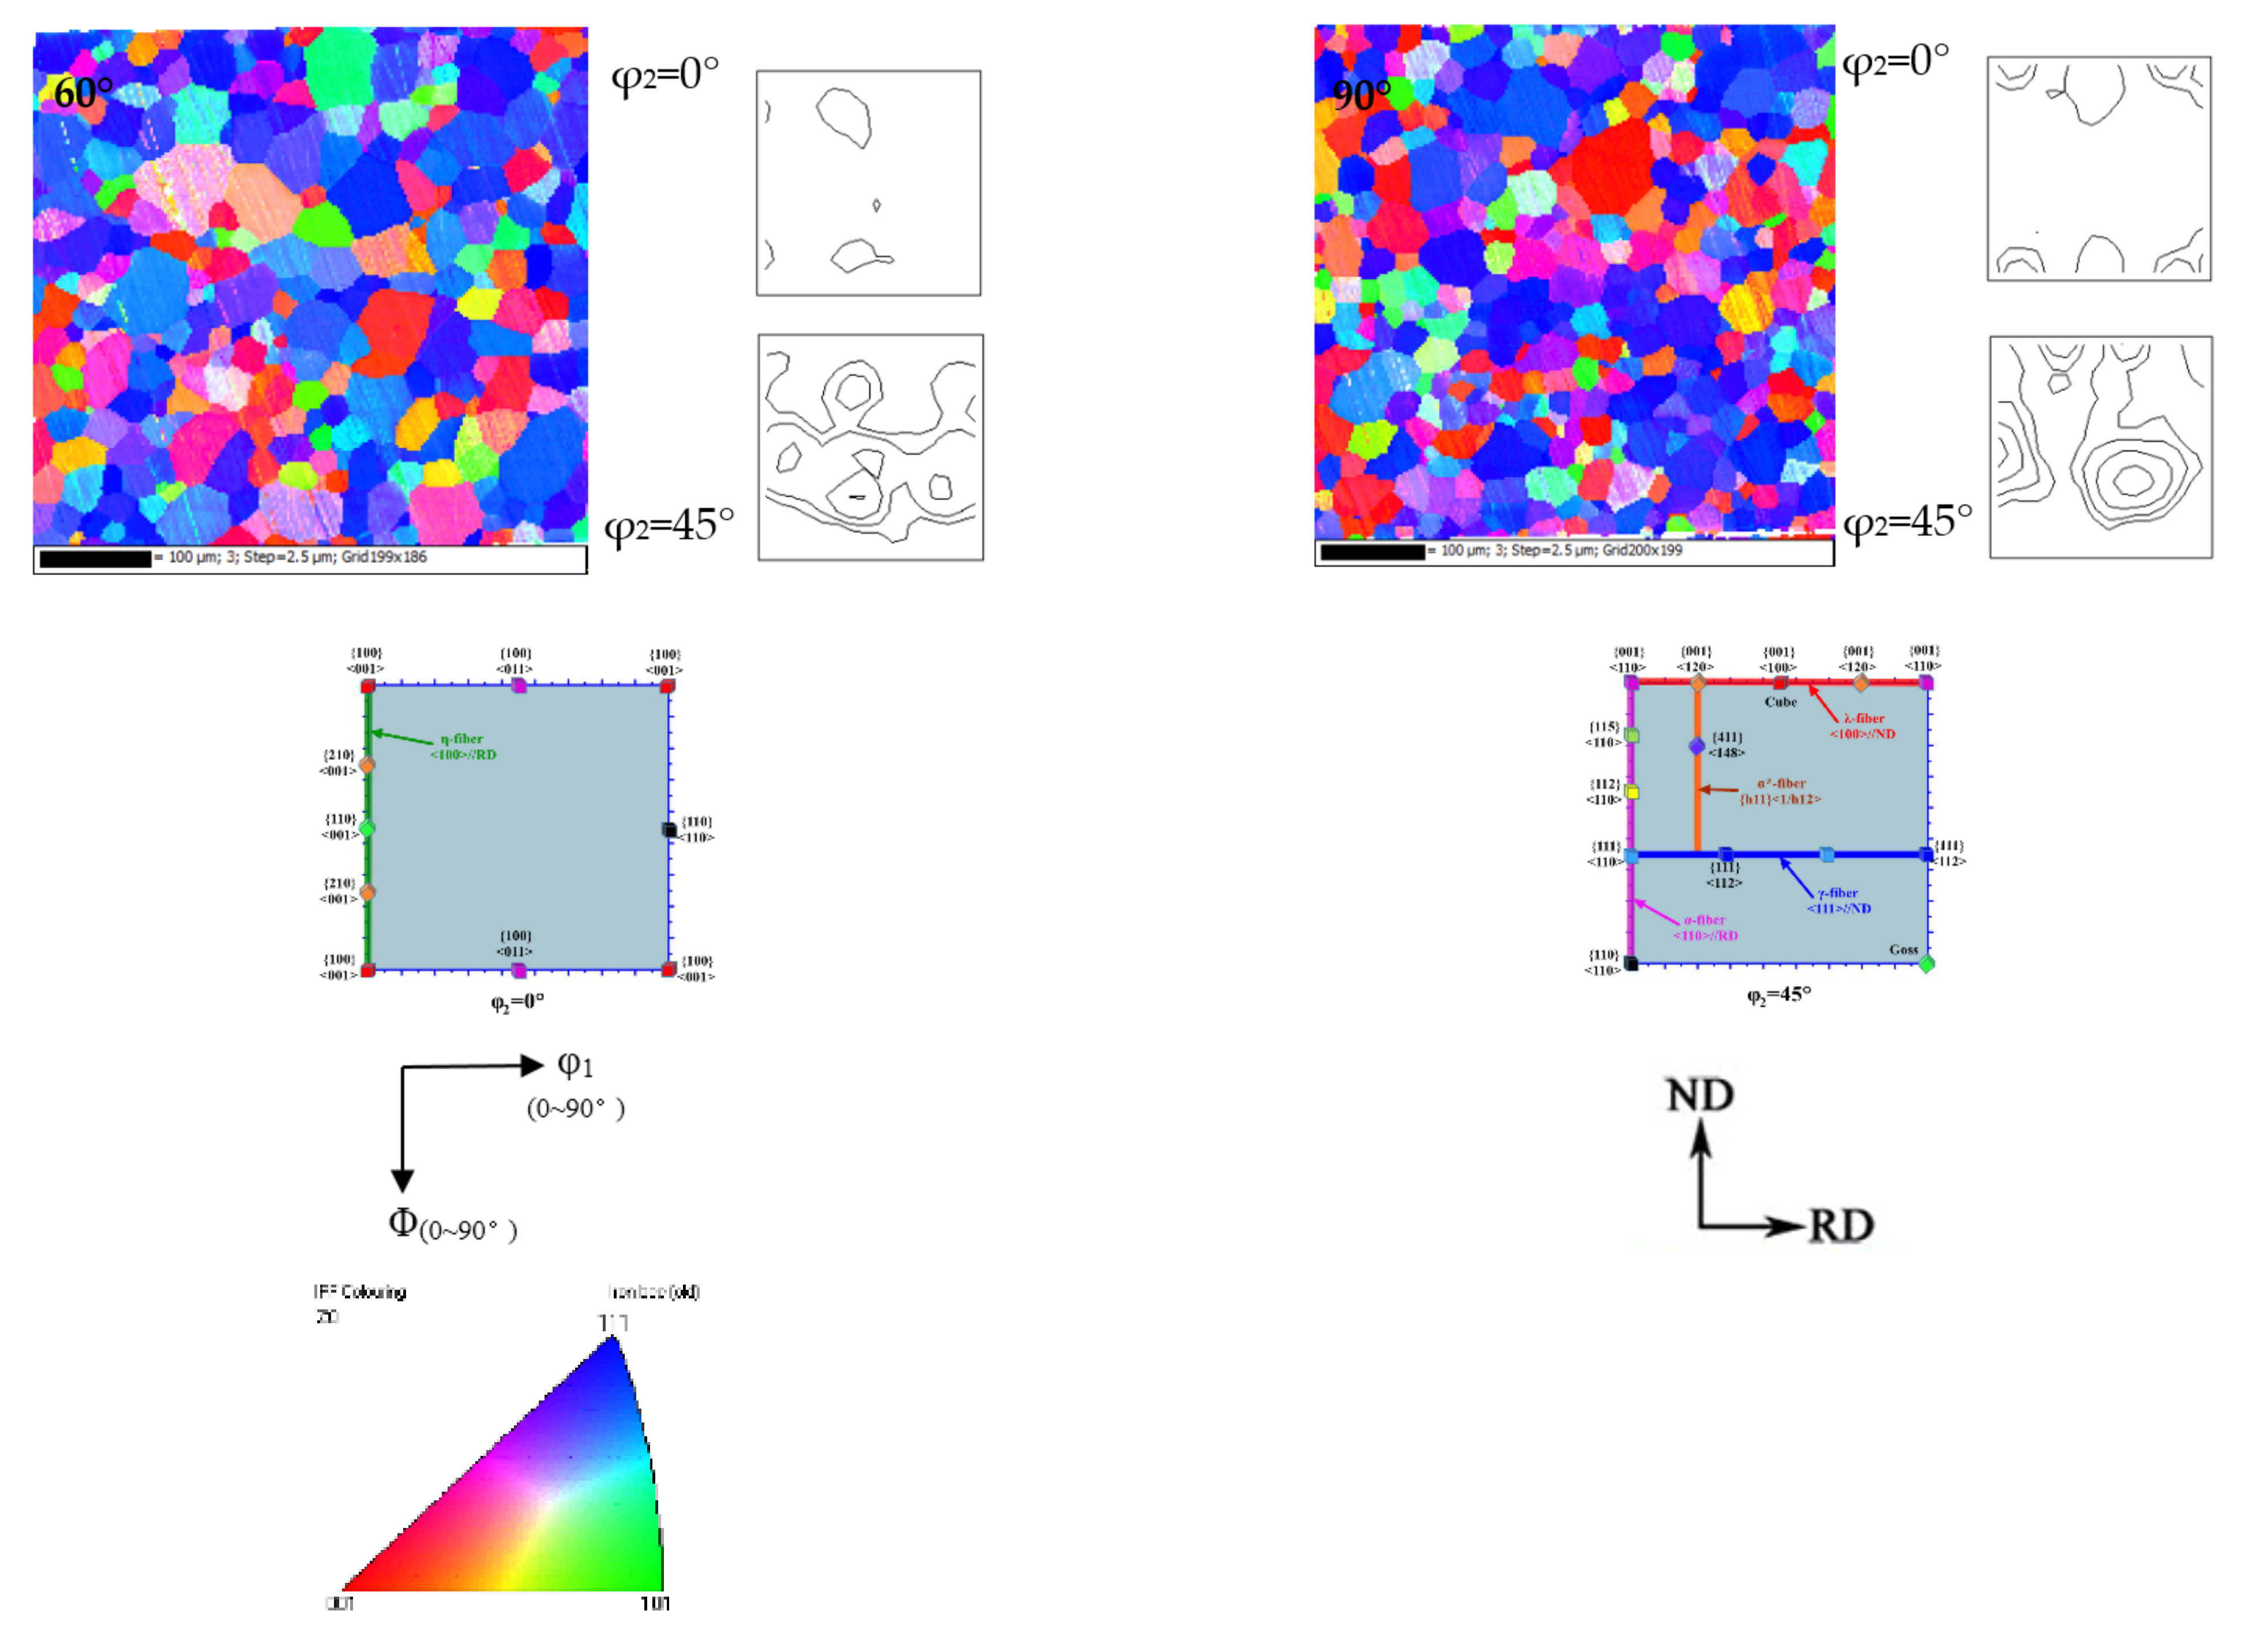
In order to study effects of texture on magnetic properties in detail, the EBSD inverse pole figure (IPF) maps and ODF cross-sectional view of φ2 = 0° and φ2 = 45° are shown in Figure 7. The particular texture component was defined in a deviation angle of 15°.
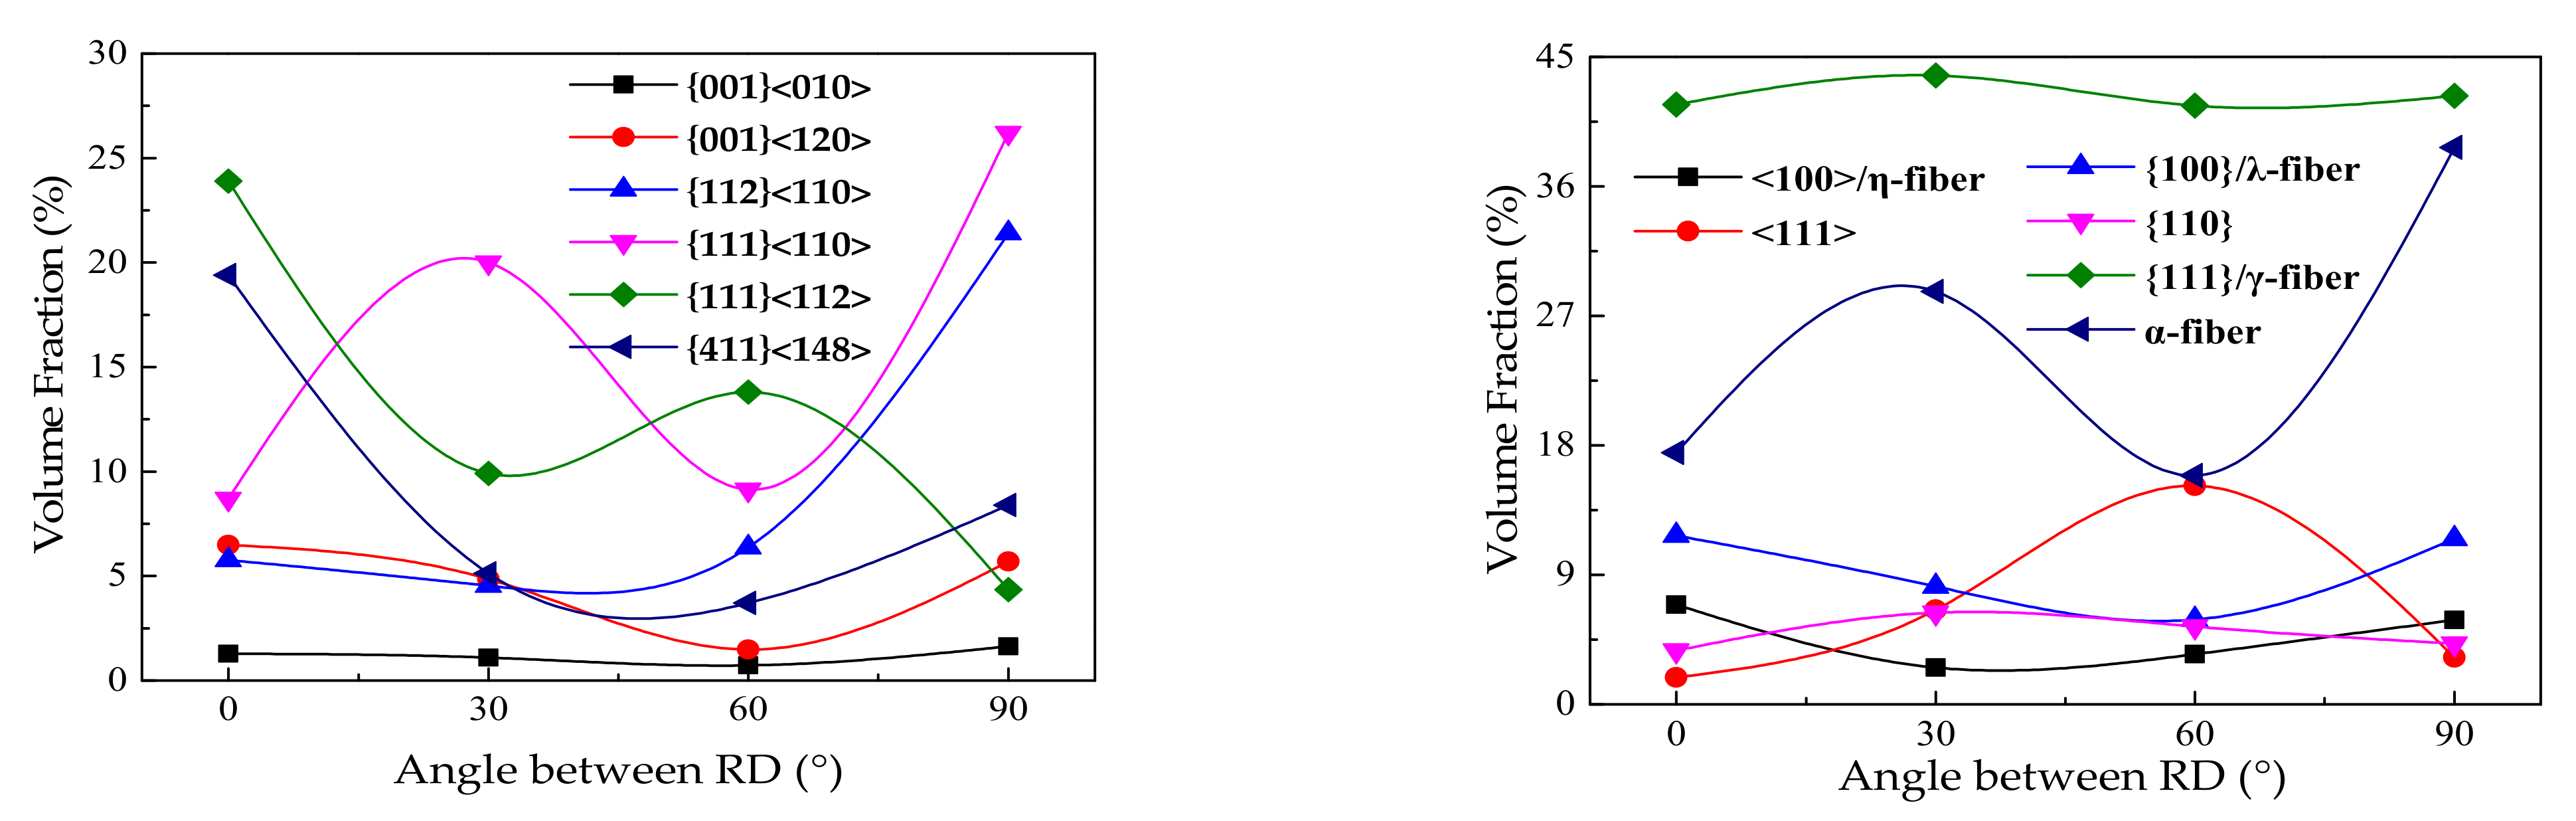
As shown in Figure 7, texture in the thickness direction of different angles to the rolling direction is mainly γ-fiber texture with {111}<110> and {111}<112>, and most of the grains are {111} plane-oriented grains (blue part) and {100} plane-oriented grains (red part). Figure 8 shows the statistics of the main texture volume fractions involved in different annealed sheet samples.
As seen from Figure 8, the content of each texture changes regularly with changing of the angle with the rolling direction. <100>/η-fiber texture and {001}/λ-fiber texture in different sample does not change much. The content of {001}/λ-fiber texture in of 0° and 90° samples is relatively high, reaching 11.73% and 11.51%, respectively. The content of α-fiber texture varies greatly, and the maximum content is 38.71% in 0° sample. The content of magnetically harmful <111> texture in the 60° sample is the highest, reaching 15.21%. The volume fractions of γ-fiber texture in each plate is between 41.63% and 43.73%. With the change of the angle to the rolling direction (0–90°), {411}<148> and {001}<120> decrease first and then increase, and the content in 0° sample are the largest (19.40% and 6.49%, respectively), that of 60° sample are the smallest (3.70% and 1.48%, respectively).
According to the volume fractions of each texture of the samples at different angles to the rolling direction, favorable textures of 0° sample is the highest, and magnetic harmful textures is the lowest. However, texture distribution of 60° sample is opposite to that of 0° sample. The texture distribution in the thickness directions of 30° and 90° samples are similar. Therefore, changing trend of magnetic properties in Figure 6 is caused, that is, the rolling direction magnetic properties are the best, and 60° sample magnetic properties are the worst.
3.4. Correlation of Texture and Magnetic Properties
BCC crystal has the lowest magneto-crystalline anisotropy in the <001> direction which is the easy magnetization direction and the <111> direction has maximum magneto-crystalline anisotropy energy which is the direction of difficult magnetization, thus {100} texture with the most <001> easy magnetization directions is the most ideal texture for non-oriented electrical steel [2,3]. However, in industrial products, {100} texture is too difficult to obtain. With aim to study the relationship between different textures and magnetic properties, texture factor, magnetic texture factor, A-parameter and E, etc. could be used to quantitatively analyze the relationship between texture and magnetic properties.
Texture factor is better compared to magnetic properties measured in all the directions in the steel sheet as it cannot ‘distinguish’ the individual directions in the sheet plane, but this parameter is an incomplete analysis of the easy magnetization directions in the texture. Thus, magnetic texture factor is a higher value represents a better magnetic quality. A-parameter and anisotropy parameter [26] are very similar in that they both evaluate the angles between the magnetization direction and the three easy <001> axes of each orientation present in the sample. Anisotropy parameter is a reduced form derived from the basic magneto-crystalline anisotropy energy equation, and can also be averaged over the measured texture (ODF or discrete orientations).
For magnetically soft materials, correlation of anisotropic magnetic properties with texture data is often based on analysis of the magneto-crystalline anisotropy energy E and A-parameter, which, in a cubic crystal, is defined by [13,14]
Here, crystallographic direction is expressed by the vector , which is a unit vector of the rolling direction RD = [u v w]. The first term, K0, is independent of textures and is usually ignored. In pure iron at ambient temperature, the anisotropy constants are K1 = 4.8 × 10⁴ J/m3 and K2 = ± 0.5 × 10⁴ J/m3 [11,14]. Let the angles between the magnetization direction (e.g., RD) and the three ([100], [10], and [1]) easy axes of a crystal be α1, α2, and α3, respectively. The f(g) is the orientation density function (ODF) calculated from the measured pole figures. Accordingly the third (and higher) terms in Equation (2) can be neglected, and there is a linear dependency of the magneto-crystalline anisotropy energy E on the anisotropy parameter .
In rotating applications, the angle θ changes constantly, and therefore, the direction averaged A-parameter and of non-oriented electrical steel are expressed as (4) and (5) [11,13,14]
Magneto-crystalline anisotropy energy E expresses the energy required for magnetization in the direction away from the easy magnetization direction <001>. If multiple magnetization directions are tested, this can be repeated for each magnetization direction and an average over all the directions can be obtained. It should be noted that the value of A(g) for an arbitrary crystal orientation falls in the range of 0–54.7°, while the value of h(g) is between 0 and 0.333. When one of the <001> directions is aligned in the magnetization direction, A(g) = 0° and h(g) = 0; when one of the <111> directions is in the magnetization direction, A(g) = 54.7° and h(g) = 0.333. Apparently, a low value of the A-parameter or the anisotropy parameter corresponds to a high magnetic quality of texture, as it implies that the <100> directions are aligned closer to the magnetization direction.
As calculating the texture factor and magnetic texture factor, OIM Analysis 6.1 analysis software was used to calculate the content of specific orientation grains and 15° of deviation angle is selected. Since the calculation of the A-parameter and the magnetic anisotropy parameter , the content of the specific texture needs to be considered as comprehensively as possible (mainly considering the texture components in the ODF cross-sectional view of φ2 = 0° and φ2 = 45°). Therefore, when calculating the A-parameter and the magnetic anisotropy parameter , a deviation angle of 10° is mainly used in the calculation of the distribution of specific orientation grains and the quantitative analysis.
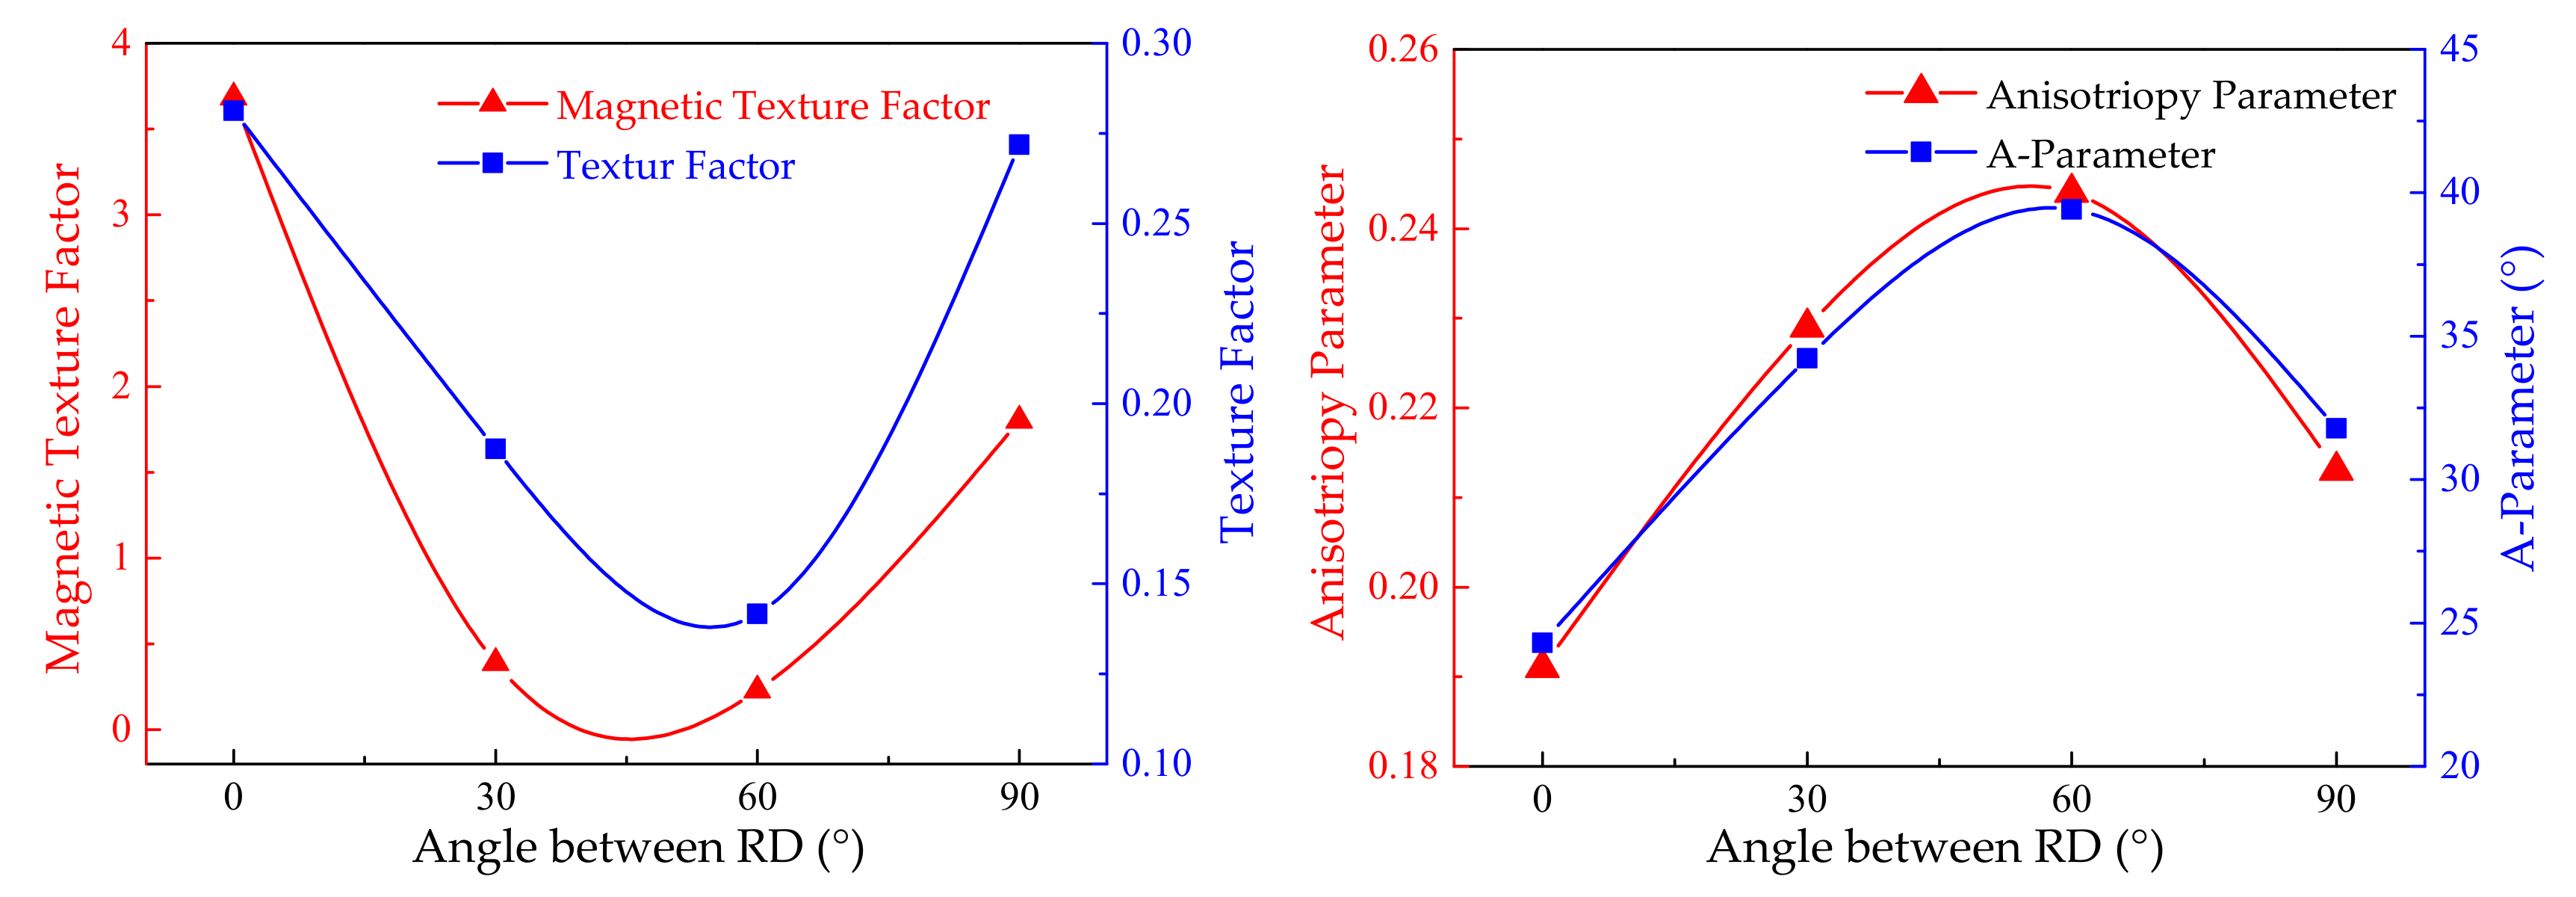
Calculating texture factor, magnetic texture factor, A-parameter, and magnetic anisotropy parameter of Fe-0.65%Si non-oriented electrical steel annealed sheets in the thickness direction of different samples are shown in Figure 9.
As shown in Figure 9, texture factor, magnetic texture factor, A-parameter, and magnetic anisotropy parameter show regular changes with the angle of the rolling direction. The minimum texture factor and magnetic texture factor is 60° sample (0.142 and 2.30, respectively), nonetheless A-parameter and magnetic anisotropy parameter are the largest (39.42° and 0.244, respectively). However, texture factor, magnetic texture factor, A-parameter, and magnetic anisotropy parameters of 0° sample are opposite to those of 60° sample (0.281, 3.685, 24.3°, and 0.191, respectively). Texture factor is not much different in the thickness direction of 0° (rolling direction) and 90° (transverse direction), and magnetic texture factor is also not much different between 30° and 60° samples.
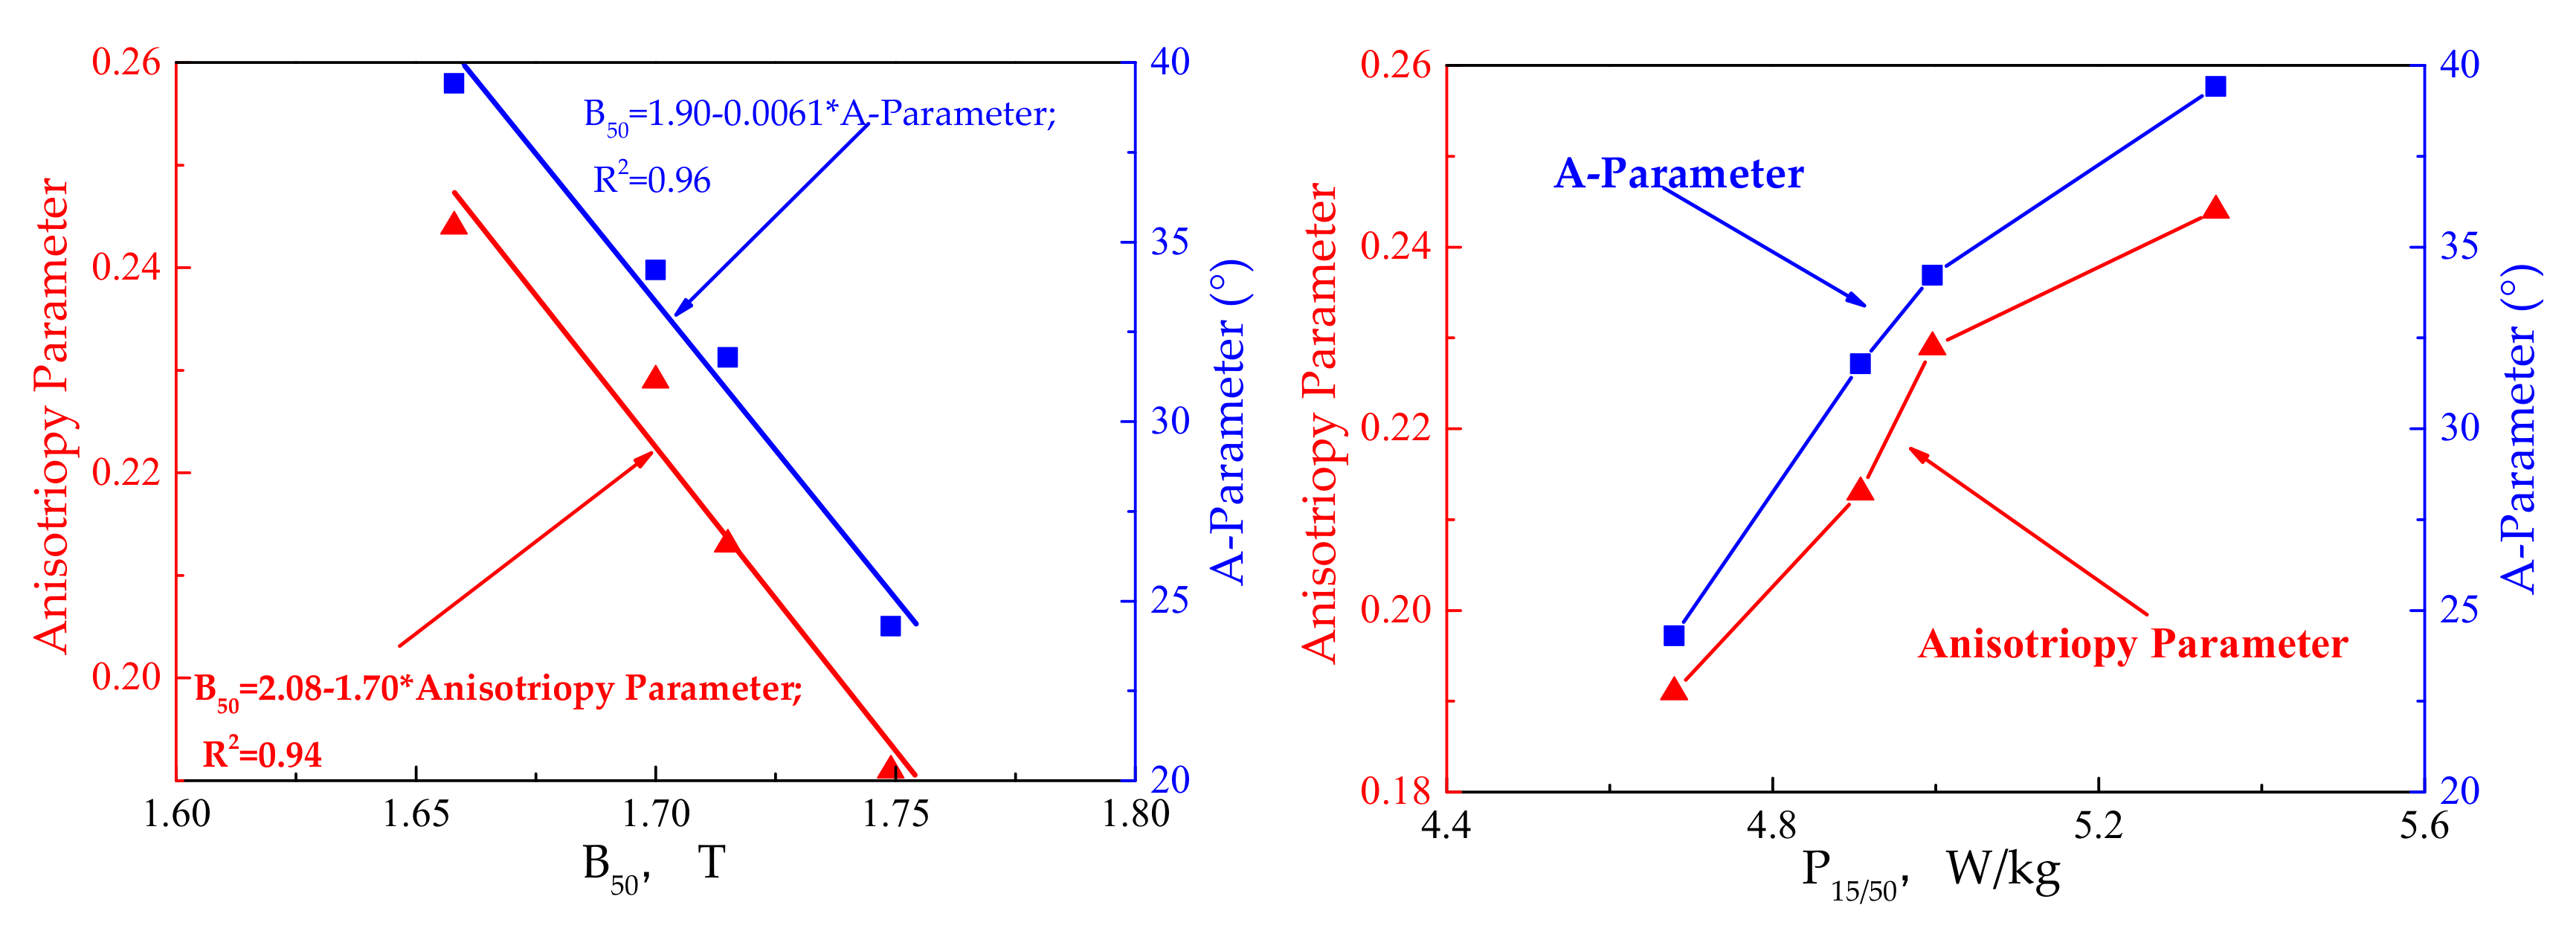
Combining variation tendency of texture-related parameters (shown in Figure 9) and magnetic properties (shown in Figure 6), magnetic properties of Fe-0.65%Si non-oriented electrical steel increase with texture factor and magnetic texture factor and decrease with increasing of A-parameter and magnetic anisotropy parameter . A-parameter and magnetic anisotropy parameter were evaluated the relative volume factions of specific orientations in the complete texture and texture selection was more partial when calculating the texture factor and magnetic texture factor. Therefore, in order to analyze the relationship between magnetic properties and texture of non-oriented electrical steel in detail, the influence of A-parameters and magnetic anisotropy parameters on magnetic properties of Fe-0.65%Si non-oriented electrical steel is shown in Figure 10.
As seen in Figure 10, A-parameter and magnetic anisotropy parameter are distributed in 24.3–39.42° and 0.191–0.244, respectively. P15/50 and B50 are distributed in 4.678–5.344 W/kg and 1.658–1.749 T, respectively. Particularly, there is a linear change trend between B50 and A-parameter and magnetic anisotropy parameter . P15/50 and B50 decrease with increasing of A-parameter and magnetic anisotropy parameter , obviously. Therefore, as the chemical composition, cleanliness and grain size are equivalent, texture has a decisive influence on P15/50 and B50.
Under power frequency conditions, magnetic hysteresis loss Ph usually accounts for about 60–80% of core loss PT of non-oriented electrical steel, and the magnetic hysteresis loss decreases linearly with the decrease of A-parameter and magnetic anisotropy parameter [1,13,14]. Therefore, A-parameter and magnetic anisotropy parameter could only explain 60–80% of the change of P15/50, which results in the change rule with A-parameter and magnetic anisotropy parameter of P15/50 in Figure 10. Regression analysis of the relationship between A-parameter and magnetic anisotropy parameter on B50 of Fe-0.65%Si non-oriented electrical steel can be obtained
Combining Figure 10, Formulas (6) and (7), A-parameter and magnetic anisotropy parameter could explain 60–80% of the change of P15/50, and changing of A-parameter and magnetic anisotropy parameter could better express the change trend of magnetic induction B50.
4. Summary and Conclusions
The effect of grain size and crystallographic texture on magnetic properties of Fe-0.65%Si non-oriented electrical steel produced by CSP process were investigated, following conclusions were obtained:
- (1)
- Magnetic induction and core loss of Fe-0.65%Si non-oriented electrical steel would decrease with the increase of grain size. The grain size of best magnetic properties is 26–30 μm.
- (2)
- γ-fiber texture and α*-fiber texture are the main texture component of rolling direction sample and 60° sample, but strength of {111}<112> texture is stronger and content of magnetic harmful texture is the largest in 60° sample. γ-fiber texture is the main texture component in 30° and 90°samples.
- (3)
- Magnetic properties increase with increasing of the texture volume fraction ratio of {100}/{111} and <100>/<111>, and increase with the decreasing of A-parameter and , respectively. Simultaneously, with increasing of A-parameter and , a linear decrease of B50 was obtained.
Author Contributions
Formal analysis, methodology, investigation, resources, data curation, and writing, J.C. and J.Q.; Validation, F.G.; Project administration and funding acquisition, S.Q. and H.W. All authors have read and agreed to the published version of the manuscript.
Funding
This research was funded by the National key research and development plan, (Shengtao Qiu, grant no. 2016YFB0300305) and National Natural Science Foundation of China (Haijun Wang, no. 51804003).
Institutional Review Board Statement
Not applicable.
Informed Consent Statement
Not applicable.
Data Availability Statement
Not applicable.
Acknowledgments
Financial support from the National key research and development plan (no. 2016YFB0300305) and National Natural Science Foundation of China (no. 51804003).
Conflicts of Interest
The authors declare no conflict of interest.
References
- He, Z.Z.; Zhao, Y.; Luo, H.W. Electrical Steel; Metallurgical Industry Press: Beijing, China, 2012. [Google Scholar]
- Zhang, Z.G.; Wang, D.P. Texture and Magnetic Properties of Non-Oriented Silicon Steel; Metallurgical Industry Press: Beijing, China, 2012. [Google Scholar]
- Mao, W.M.; Yang, P. Material Science Principle of Electrical Steel; Higher Education Press: Beijing, China, 2013. [Google Scholar]
- Shiozaki, M.; Kurosaki, Y. The effects of grain size on the magnetic properties of nonoriented electrical steel sheets. J. Mater. Eng. 1989, 11, 37–43. [Google Scholar] [CrossRef]
- PremKumar, R.; Samajdar, I.; Viswanathan, N.; Singal, V.; Seshadri, V. Relative effect(s) of texture and grain size on magnetic properties in a low silicon non-grain oriented electrical steel. J. Magn. Magn. Mater. 2003, 264, 75–85. [Google Scholar] [CrossRef]
- Campos, M.F.D.; Teixeira, J.C.; Landgraf, F.J.G. The optimum grain size for minimizing energy losses in iron. J. Magn. Magn. Mater. 2006, 301, 94. [Google Scholar] [CrossRef]
- Leuning, N.; Steentjes, S.; Hameyer, K. Effect of grain size and magnetic texture on iron-loss components in NO electrical steel at different frequencies. J. Magn. Magn. Mater. 2019, 469, 373–382. [Google Scholar] [CrossRef]
- Takashima, M.; Komatsubara, M.; Morito, N. {001}<210> Texture Development by Two-stage Cold Rolling Method in Non-oriented Electrical Steel. ISIJ Int. 1997, 37, 1263–1268. [Google Scholar] [CrossRef]
- Lee, K.; Park, S.; Huh, M.; Kim, J.; Engler, O. Effect of texture and grain size on magnetic flux density and core loss in non-oriented electrical steel containing 3.15% Si. J. Magn. Magn. Mater. 2014, 354, 324–332. [Google Scholar] [CrossRef]
- Mehdi, M.; He, Y.; Hilinski, E.J.; Edrisy, A. Texture Evolution of a 2.8 Wt Pct Si Non-oriented Electrical Steel and the Elimination of the <111>//ND Texture. Metall. Mater. Trans. A 2019, 50, 3343–3357. [Google Scholar] [CrossRef]
- Gomes, E.; Schneider, J.; Verbeken, K.; Barros, J.; Houbaert, Y. Correlation between Microstructure, Texture, and Magnetic Induction in Nonoriented Electrical Steels. IEEE Trans. Magn. 2010, 46, 310–313. [Google Scholar] [CrossRef] [Green Version]
- Yang, P.; Wang, N.; Gu, X.F.; Mao, W.M. Texture Characteristics and Control Methods in Non-oriented Silicon Steel. In Proceedings of the 14th China Electrotechnical Steel Academic Annual Conference, Ningbo, China, 21–22 December 2017; pp. 77–84. [Google Scholar]
- Sidor, J.J.; Verbeken, K.; Gomes, E.; Schneider, J.; Rodriguez-Calvillo, P.; Kestens, L.A. Through process texture evolution and magnetic properties of high Si non-oriented electrical steels. Mater. Charact. 2012, 71, 49–57. [Google Scholar] [CrossRef]
- Kang, H.G.; Lee, K.M.; Huh, M.Y.; Kim, J.S.; Park, J.T.; Engler, O. Quantification of magnetic flux density in non-oriented electrical steel sheets by analysis of texture components. J. Magn. Magn. Mater. 2011, 323, 2248–2253. [Google Scholar] [CrossRef]
- Campos, M.F.D.; Landgraf, F.J.G.; Tschiptschin, A.P. A method to estimate magnetic induction from texture in non-oriented electrical steels. J. Magn. Magn. Mater. 2001, 226, 1536–1538. [Google Scholar] [CrossRef]
- Xia, X.L.; Wang, L.T.; Pei, Y.H.; Dong, M. Current Situation of Non-oriented Silicon Steel Produced by CSP Process of Masteel. Anhui Metall. 2016, 78, 57–62. [Google Scholar]
- Chen, T.Y. Inclusion Evolution and Numerical Simulation of Non-Oriented Silicon Steel under CSP Process; Wuhan University of Science and Technology: Wuhan, China, 2019. [Google Scholar]
- Qiao, J.-L.; Guo, F.-H.; Hu, J.-W.; Xiang, L.; Qiu, S.-T.; Wang, H.-J. Precipitates in Compact Strip Production (CSP) Process Non-Oriented Electrical Steel. Metals 2020, 10, 1301. [Google Scholar] [CrossRef]
- Li, J.; Sun, Y.; Zhao, Y.; Yu, X.-J.; Li, B. Effect of Al Content on Magnetic Properties of Non-Oriented Electrical Steel by Simulated CSP Process. J. Iron Steel Res. 2007, 14, 364–367. [Google Scholar] [CrossRef]
- Li, J.J.; Yue, E.B.; Wang, L.T.; Zhu, T.; Zhao, P. Effects of Main Processes on Microstructure, Precipitates and Magnetic Properties of Low Carbon and Low Silicon Non-oriented Silicon Steel Produced by CSP Process. J. Iron Steel Res. 2010, 22, 59–63. [Google Scholar]
- Li, C.Y.; Chen, Q.A.; Liu, Z.D.; Tang, G.B.; Zhu, T. Texture Evolution of Non-oriented Electrical Steel during CSP-Cold Rolling-Annealing. Iron Steel 2007, 42, 60–63. [Google Scholar]
- Zhu, T.; Wang, Y.J.; Zhai, X.; Yang, H.; Kong, X.H. Full Process Non-Oriented Electrical Steel Produced by CSP Process. J. Beijing Univ. Sci. Technol. 2009, 31, 862–866. [Google Scholar]
- Thomson, J.J. On the heat produced by eddy currents in an iron plate exposed to an alternating magnetic field. Electrician 1892, 28, 599. [Google Scholar]
- Wang, J.; Yang, P.; Zhang, L.; Mao, W.M. Formation of a sharp {100}<011> texture in Fe-3%Si-1.7%Mn-0.05%C silicon steel sheets. J. Mater. Sci. 2016, 51, 10116–10126. [Google Scholar] [CrossRef]
- Tian, M.B. Magnetic Materials; Tsinghua University Press: Beijing, China, 2000. [Google Scholar]
- Leo, K.; Sigrid, J. Texture Control during the Manufacturing of Nonoriented Electrical Steels. Texture Stress Microstruct. 2008, 2008, 9. [Google Scholar]
Figure 1.
Schematic diagram of Fe-0.65%Si annealed sheet.

Figure 2.
Microstructure of Fe-0.65%Si non-oriented electrical steel TD samples in different annealing processes.
Figure 2.
Microstructure of Fe-0.65%Si non-oriented electrical steel TD samples in different annealing processes.


Figure 3.
Change trend of grain sizes (TD samples) with annealing temperature of Fe-0.65%Si non-oriented electrical steel.
Figure 3.
Change trend of grain sizes (TD samples) with annealing temperature of Fe-0.65%Si non-oriented electrical steel.

Figure 4.
Trend of magnetic properties of Fe-0.65%Si non-oriented electrical steel with annealing temperature and grain size.
Figure 4.
Trend of magnetic properties of Fe-0.65%Si non-oriented electrical steel with annealing temperature and grain size.

Figure 5.
Hysteresis loops of Fe-0.65%Si non-oriented electrical steel at 50 Hz, 5000 A/m and Magnetization curves at 50 Hz.
Figure 5.
Hysteresis loops of Fe-0.65%Si non-oriented electrical steel at 50 Hz, 5000 A/m and Magnetization curves at 50 Hz.

Figure 6.
In-plane variation of Magnetic properties for Fe-0.65%Si non-oriented electrical steel annealed sheet.
Figure 6.
In-plane variation of Magnetic properties for Fe-0.65%Si non-oriented electrical steel annealed sheet.

Figure 7.
EBSD inverse pole figure (IPF) maps, φ2 = 0° and φ2 = 45° ODF section of Fe-0.65%Si annealed sheet with different angles to rolling direction, (levels: 1, 2, 4, 8).
Figure 7.
EBSD inverse pole figure (IPF) maps, φ2 = 0° and φ2 = 45° ODF section of Fe-0.65%Si annealed sheet with different angles to rolling direction, (levels: 1, 2, 4, 8).


Figure 8.
Texture in each direction of Fe-0.65%Si non-oriented electrical steel annealed sheet.

Figure 9.
Variation trend of Texture Factor, Magnetic Texture Factor, A-parameter and magnetic anisotropy parameter of Fe-0.65%Si non-oriented electrical steel annealed sheet.
Figure 9.
Variation trend of Texture Factor, Magnetic Texture Factor, A-parameter and magnetic anisotropy parameter of Fe-0.65%Si non-oriented electrical steel annealed sheet.

Figure 10.
Effects of A-parameters and magnetic anisotropy parameter on magnetic properties of Fe-0.65%Si non-oriented electrical steel.
Figure 10.
Effects of A-parameters and magnetic anisotropy parameter on magnetic properties of Fe-0.65%Si non-oriented electrical steel.


Table 1.
Main chemical composition of non-oriented electrical steel.
| Elements | C | Si | Mn | P | S | Al | N | Cu | Ti |
|---|---|---|---|---|---|---|---|---|---|
| Content, wt % | 0.0030 | 0.65 | 0.25 | 0.075 | 0.0040 | 0.30 | 0.0035 | 0.030 | 0.0030 |
Publisher’s Note: MDPI stays neutral with regard to jurisdictional claims in published maps and institutional affiliations. |
© 2021 by the authors. Licensee MDPI, Basel, Switzerland. This article is an open access article distributed under the terms and conditions of the Creative Commons Attribution (CC BY) license (https://creativecommons.org/licenses/by/4.0/).
Share and Cite
MDPI and ACS Style
Cong, J.; Guo, F.; Qiao, J.; Qiu, S.; Wang, H. Optimum Magnetic Properties of Non-Oriented Electrical Steel Produced by Compact Strip Production Process. Metals 2022, 12, 64. https://doi.org/10.3390/met12010064
AMA Style
Cong J, Guo F, Qiao J, Qiu S, Wang H. Optimum Magnetic Properties of Non-Oriented Electrical Steel Produced by Compact Strip Production Process. Metals. 2022; 12(1):64. https://doi.org/10.3390/met12010064
Chicago/Turabian StyleCong, Junqiang, Feihu Guo, Jialong Qiao, Shengtao Qiu, and Haijun Wang. 2022. "Optimum Magnetic Properties of Non-Oriented Electrical Steel Produced by Compact Strip Production Process" Metals 12, no. 1: 64. https://doi.org/10.3390/met12010064
Note that from the first issue of 2016, this journal uses article numbers instead of page numbers. See further details here.