
Subsurface Microstructural Evolution during Scratch Testing on Bcc Iron


1
MikrotribologieCentrum µTC Fraunhofer Institute for Mechanics of Materials, 76131 Karlsruhe, Germany
2
Karlsruhe Institute of Technology (KIT), Institute for Applied Materials (IAM), Kaiserstrasse 12, 76131 Karlsruhe, Germany
3
KIT IAM-CMS MicroTribology Center (μTC), Strasse am Forum 5, 76131 Karlsruhe, Germany
*
Author to whom correspondence should be addressed.
Metals 2021, 11(8), 1258; https://doi.org/10.3390/met11081258
Submission received: 6 July 2021
/
Revised: 31 July 2021
/
Accepted: 2 August 2021
/
Published: 10 August 2021
Abstract
:Subsurface microstructures influence the friction and wear behavior of metallic tribological systems, among other factors. To gain a basic understanding of the microstructural changes occurring during sliding processes, face-centered cubic model systems, for example a copper system with a sapphire sphere sliding against it, were previously characterized. Such systems showed the evolution of the dislocation self-organization phenomenon called the dislocation trace line. To test the occurrence of this dislocation arrangement in bcc metals, in this study a ruby ball was slid against electropolished bcc iron under an increasing normal load. The wear track topography and subsurface microstructure were characterized using white light interferometry and scanning transmission electron microscopy. The analysis suggested that at least for bcc iron, the evolution of a dislocation trace line is connected with the onset of pronounced plastic deformation.
1. Introduction
Subsurface plastic deformation is inherently connected to the tribological behavior of many metallic tribological systems in all wear regimes—it has been observed in ultra-low wear regimes with wear coefficients of 10−10 mm3/(N m) [1,2,3,4,5], in lubricated systems in mild wear regimes [6,7], and in dry sliding systems [8,9,10]. Subsurface plastic deformation is also visible in severe wear regimes with wear coefficients of 70 mm3/(N m). Under fretting load, the friction force significantly influences the subsurface plastic deformation and wear particle formation [11,12], consequently influencing the wear behavior. Cutting processes as an example of extreme wear induce plastic deformation below the finished surface in addition to material removal. This holds true for cutting with geometrically defined [1,13] and undefined cutting edges [14,15,16]. Chandrasekar performed extensive research in this field, showing the formation of bumps and folds as a consequence of a machining process that did not produce a chip due to the low cutting depth [17]. Beckmann et al. [18] explained the formation of bulges with the protrusion of grains having a “soft” orientation allowing plastic deformation in the free surface, which is not restricted by other grains.
In addition to the subsurface plastic deformation in tribological systems that is more or less technically motivated, several authors have addressed subsurface plastic deformation in model systems [19,20,21,22].
In 1983, Heilmann [23] suggested that lattice rotation is likely the strongest during the first of many possible sliding passes. Compared to the testing that has been performed for multiple cycles, there is significantly less research on the onset of plastic deformation under a tribological load, although there have recently been attempts to investigate this regime in some detail. For these experiments, high-purity copper samples were tribologically loaded with sapphire spheres for a single trace [24,25,26]. The results demonstrated that after a mild singular tribological load, dislocations self-organize at depths of between roughly 100 and 500 nm under sliding contact in a fashion that leads to a horizontal line-like contrast in TEM foils cut parallel to the sliding direction. This contrast was then referred to as the dislocation trace line (DTL). The occurrence of the DTL, which was also found in arrays of copper alloys and nickel [27,28], was explained through the motion of dislocations in the complex stress field associated with the moving sphere. It was recently observed that this dislocation self-organization is also the location where a localized simple shear of the subsurface material occurs in the sliding direction [24]. Moreover, it was found to be present for a wide range of experimental parameters, such as the counterbody size and normal load [26], as well as for various sliding speeds [29], meaning its occurrence warrants a closer look. It is believed that the DTL is the demarcation line between the development of a nanocrystalline layer and the bulk material underneath as sliding progresses.
In this context, the authors here address the following questions: (1) Does a DTL evolve in materials with a body-centered cubic (bcc) crystal structure? To investigate this question, experiments were performed on an α-iron sample. (2) Is the onset of the DTL a function of the normal load? To answer this question, the load during the tribological experiments was increased. This allowed the ex situ analysis of the subsurface microstructure under different normal loads and the identification of possible transitions. These might allow us to learn about the ongoing fundamental processes.
2. Materials and Methods
2.1. Materials
Pure iron (Goodfellow, Bad Nauheim, Germany) was used as a bcc model system, which was heat treated at 10−6 mbar and 700 °C for three hours. The surface to be subjected to tribological loads was ground using silicon carbide grinding papers of P800, P1200, P2500 and P4000 mesh (Struers, Willich, Germany), along with mechanical polishing with 3 and 1 μm diamond suspensions (Cloeren Technology GmbH, Wegberg, Germany). Finally, the sample was electropolished with A2 electrolyte (Struers, Willich, Germany) at 35 V, 19 °C, and a flow rate of 10 (arbitrary unit of Struers) for 30 s, yielding an average profile roughness of Ra = 33 nm, and a 3D average roughness Sa = 150 nm, as well as 3D peak, core, and valley heights of Spk = 174 nm, Sk = 440 nm, and Svk = 250 nm respectively. The average grain size was 110 µm and the hardness was 115 HV 0.01/20.
The counterbody was a ruby ball (Spherotec, Fulda, Germany) with a nominal diameter of 500 µm (measured: 502 µm). All experiments were performed unlubricated in a standard lab environment.
2.2. Methods
A Hysitron TI 950 nanoindenter with a 3D-Omniprobe (max. normal load 7 N; Hysitron, Minnesota; now Bruker, Billerica, MA, USA) allowed measurements in all three directions in space with a resolution of 100 µN in the normal direction and a lateral resolution of 300 µN. In the following step, the force in the z-direction was the normal force, while the force in the x-direction was the friction force opposite to the sliding direction. The force in the y-direction was the force measured perpendicular to the sliding direction (lateral force). The TI 950 instrument was used with a custom-made tip to accommodate the ruby ball, which was glued into the holder with cyanoacrylate (62592, Uhu, Bühl, Germany) and cleaned with acetone and isopropyl alcohol. Light and confocal microscopy excluded contamination of the ruby ball after gluing and material transfer after the experiments.
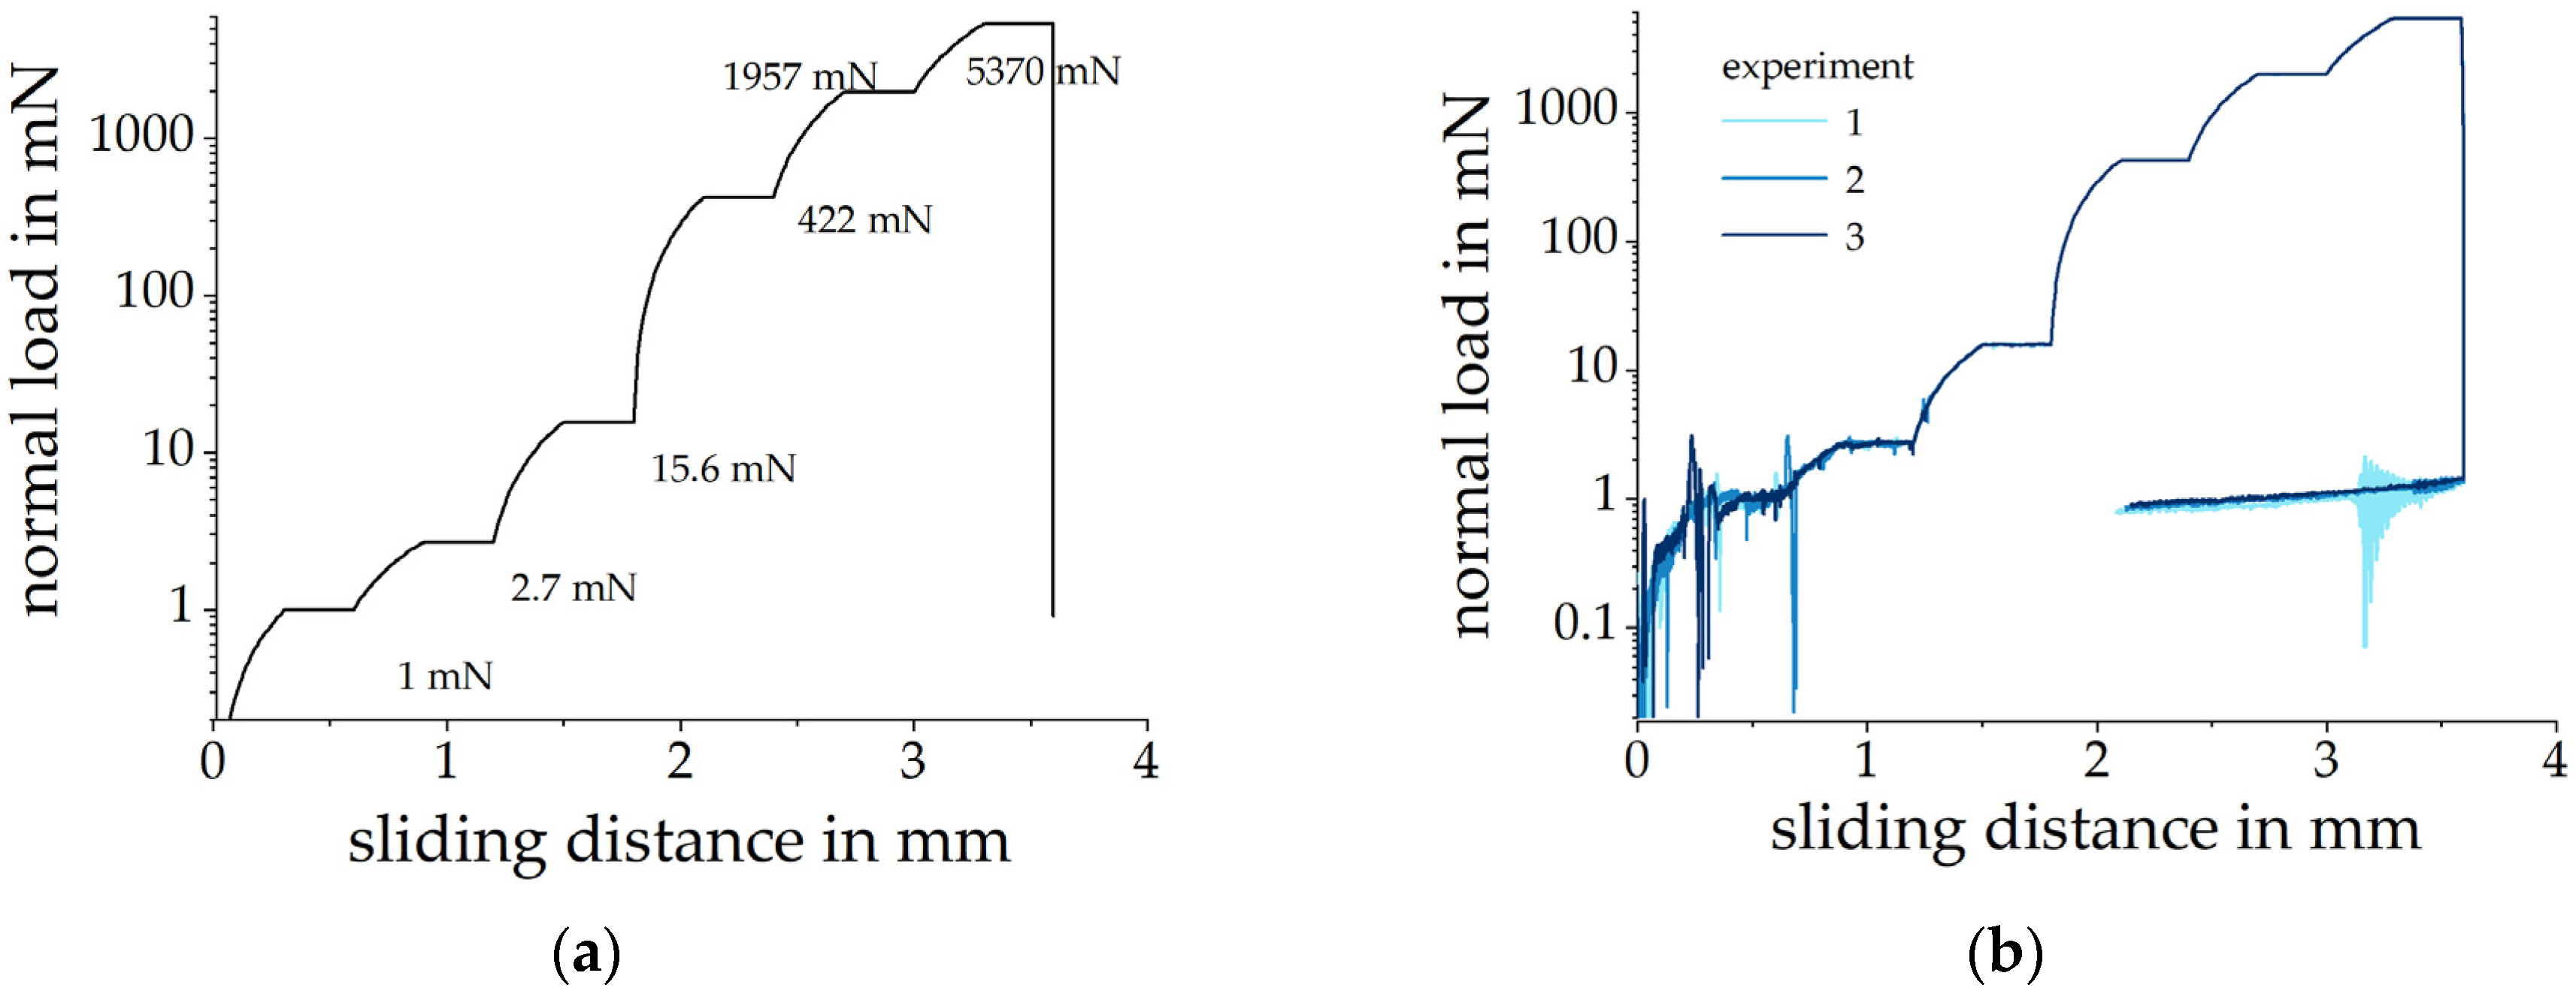
Two repetitions of the scratch experiment were performed, which showed a very good correlation, as presented in the results section. Additionally, twelve experiments were performed up to a defined normal load. The sliding speed used for all experiments was 25 µm/s. For higher speeds, the load control of the system was overshot. An indent with a diameter of approx. 40 µm set at a lateral distance of 200 µm from the start of the scratch experiment allowed identification of the start position of each experiment (see red arrow in Figure 2). The load function consisted of segments (length of 300 µm) with increasing and constant loads (see Figure 1a). The constant load segments allowed the subsurface analysis after known constant sliding conditions. The normal loads of 1, 2.7, 15.6, 422, 1957, and 5370 mN corresponded to Hertzian pressures of 400 MPa, 540 MPa, 1 GPa, 3 GPa, 5 GPa, and 7 GPa (5730 mN), respectively. Purely elastic conditions in a “ball-on-flat” geometry were used to calculate the Hertzian pressures [30,31]. In the experiments, significant plastic deformation occurred and the true pressures were significantly lower than the Hertzian ones.
The scratches were analyzed using white light interferometry (Contour GTK, Bruker, Billerica, MA, USA), scanning electron microscopy (SEM), and transmission scanning electron microscopy (T-SEM). The electron microscope used for surface imaging, transmission electron microscopy (TEM) foil preparation, and T-SEM was a Helios 650 (FEI, now Thermo Fisher, Waltham, MA, USA). TEM foils were prepared by thinning with the Ga+-ion beam after covering the area of interest with electron- and ion-beam-assisted Pt deposition. See Greiner et al. [25] and Ruebeling et al. [26] for detailed method and parameter descriptions.
3. Results
3.1. Friction Experiments
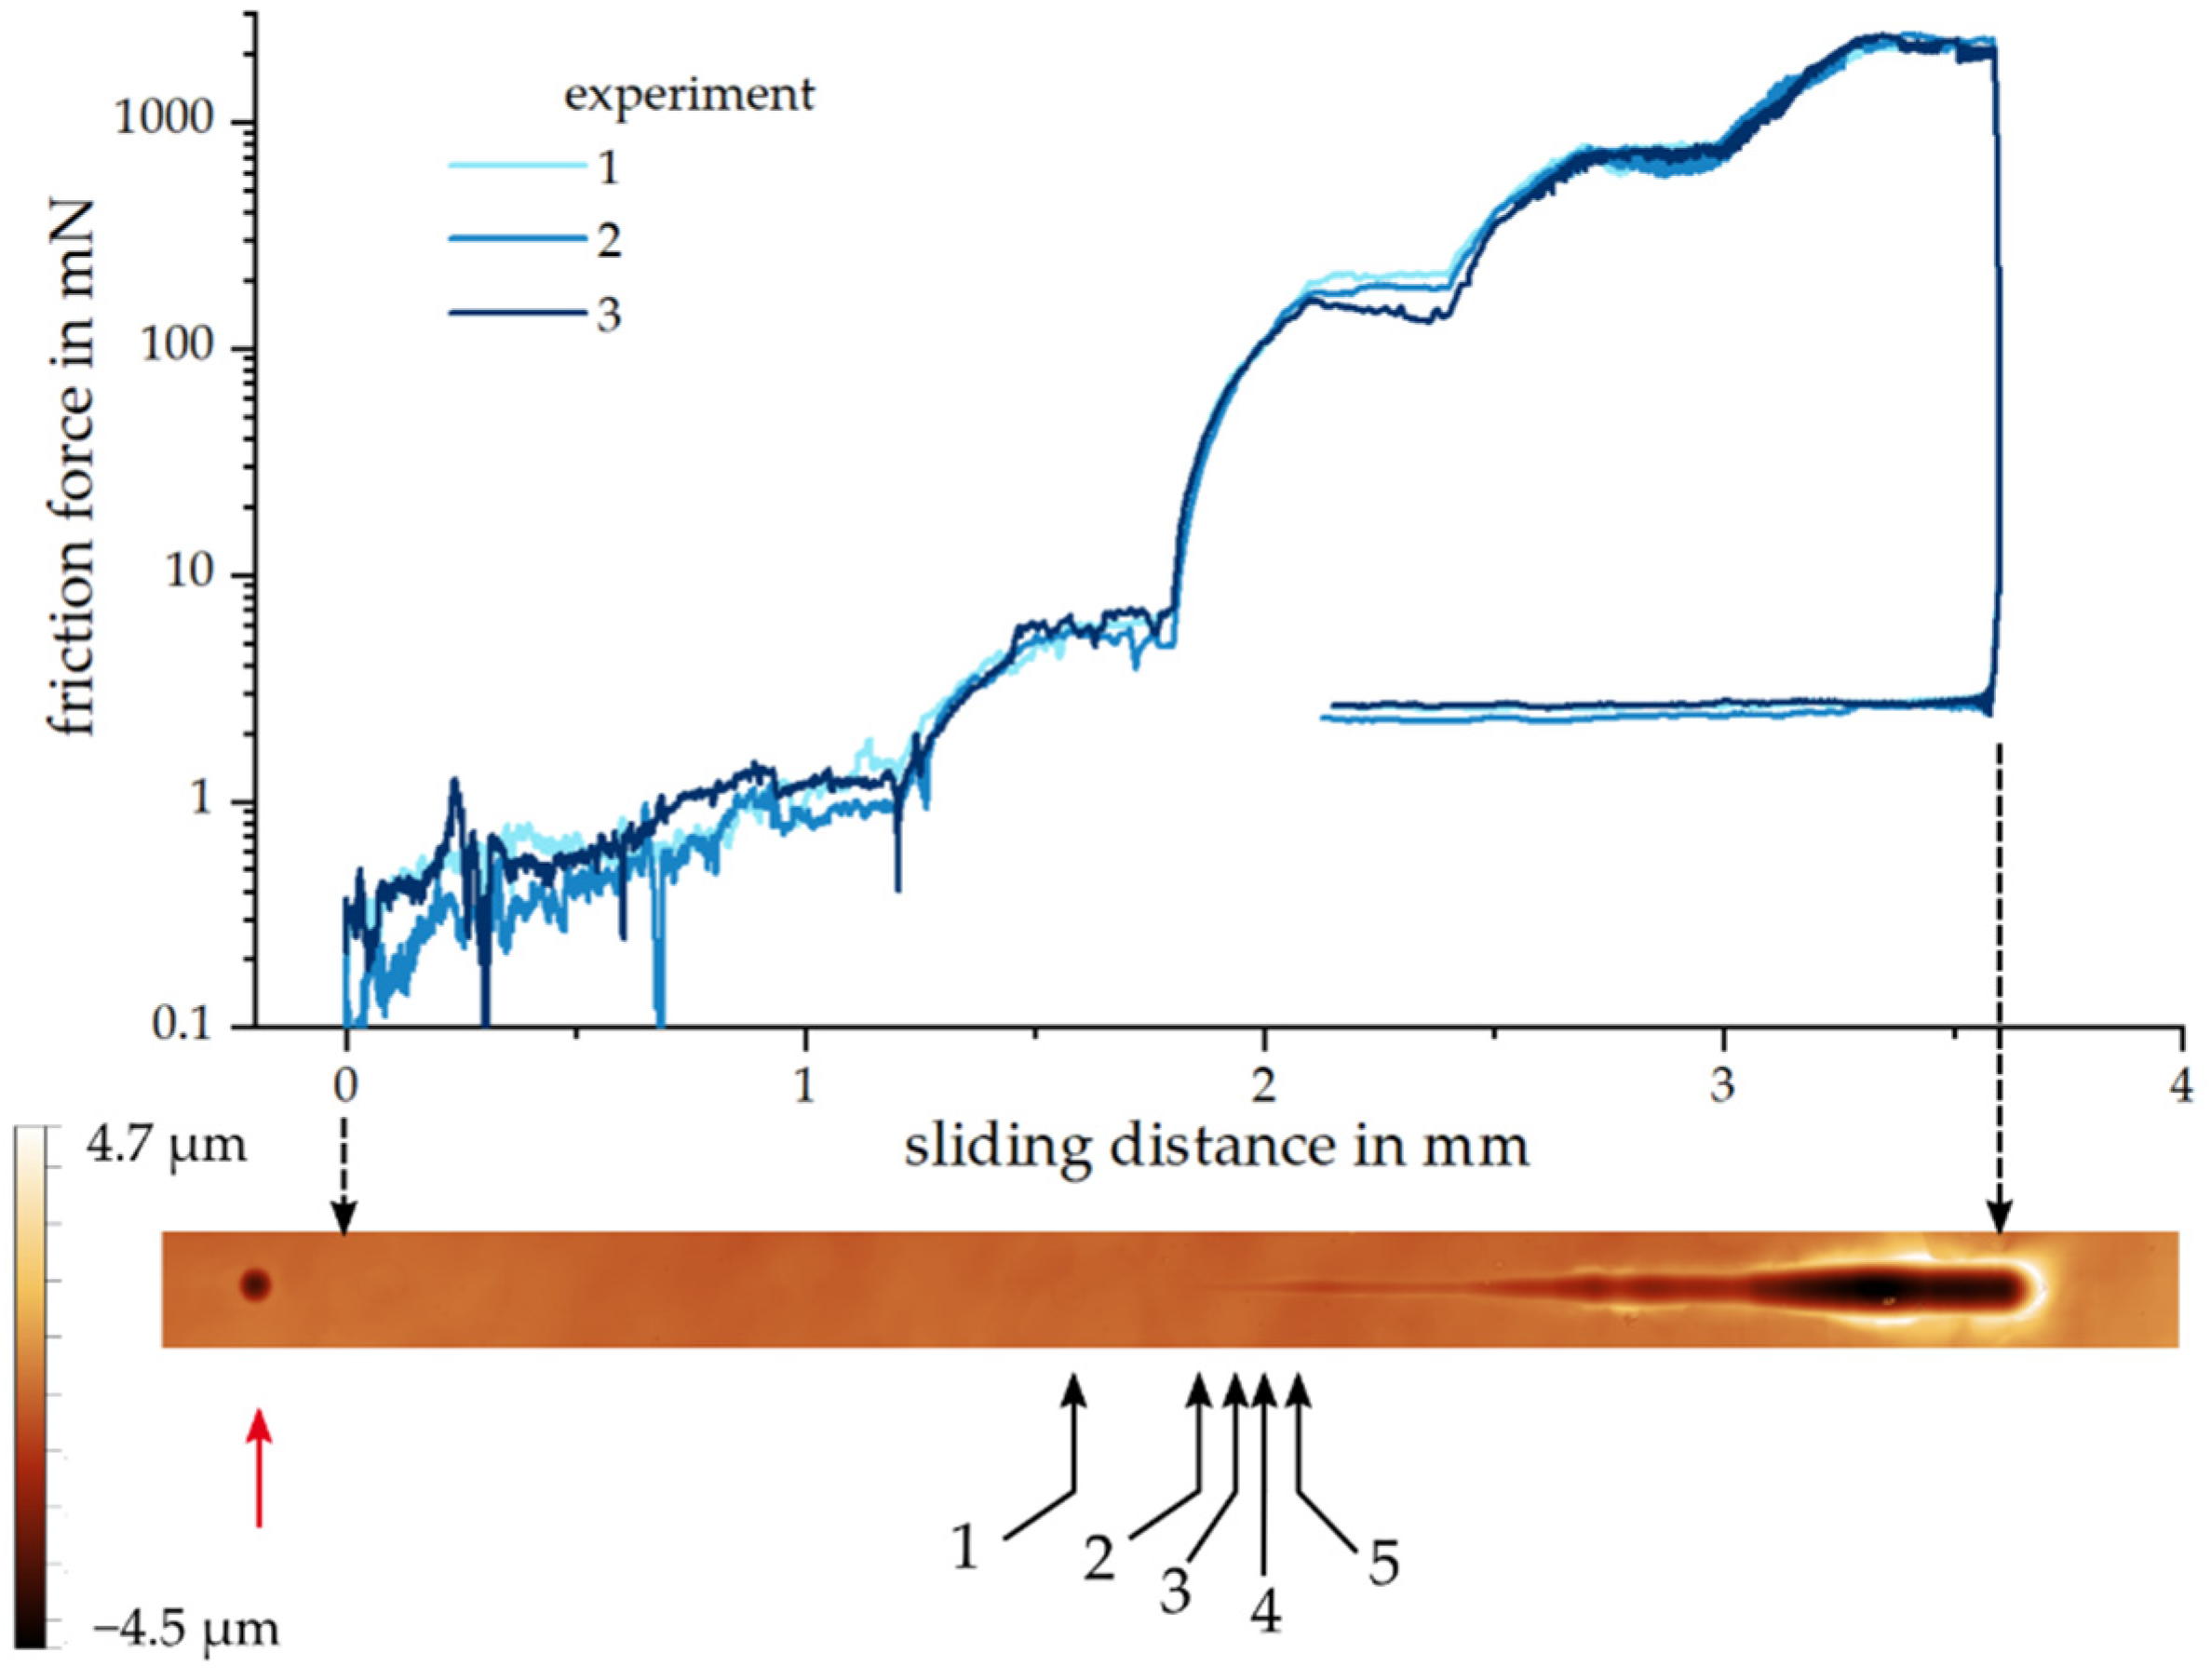
Experiments were load-controlled and the normal load was adjusted by the instrument with an accuracy of better than 5% from a load of 10 mN (see Figure 1b). After reducing the normal load at the end of the wear track, the friction force was measured at 1 mN. We did not lift off the sphere directly at the end of the wear track, but rather made the system travel back a distance of about 1.5 mm with a normal force of 1 mN. This was done in order to avoid overshooting of the load control during lift-off and artefacts at the end of the wear track. After the reduction of the normal load, the system measured a friction force of 3 mN. We assumed that this was drift due to higher loads applied over the course of the experiments (Figure 2).
A topography image of a wear track is shown in Figure 2. The indent set 200 µm in the negative sliding direction for the identification of the start of the wear track is visible, as well as the scratch at higher loads. The remaining changes in topography (i.e., a wear track) are visible from a sliding distance of 1.246 mm onwards, corresponding to a normal load of 4.85 mN in the load ramp segment from 2.7 to 15.6 mN. The friction force at the onset of the wear track with a wear track depth of less than 100 nm is about 1 mN (see Figure 2 and Figure 3).
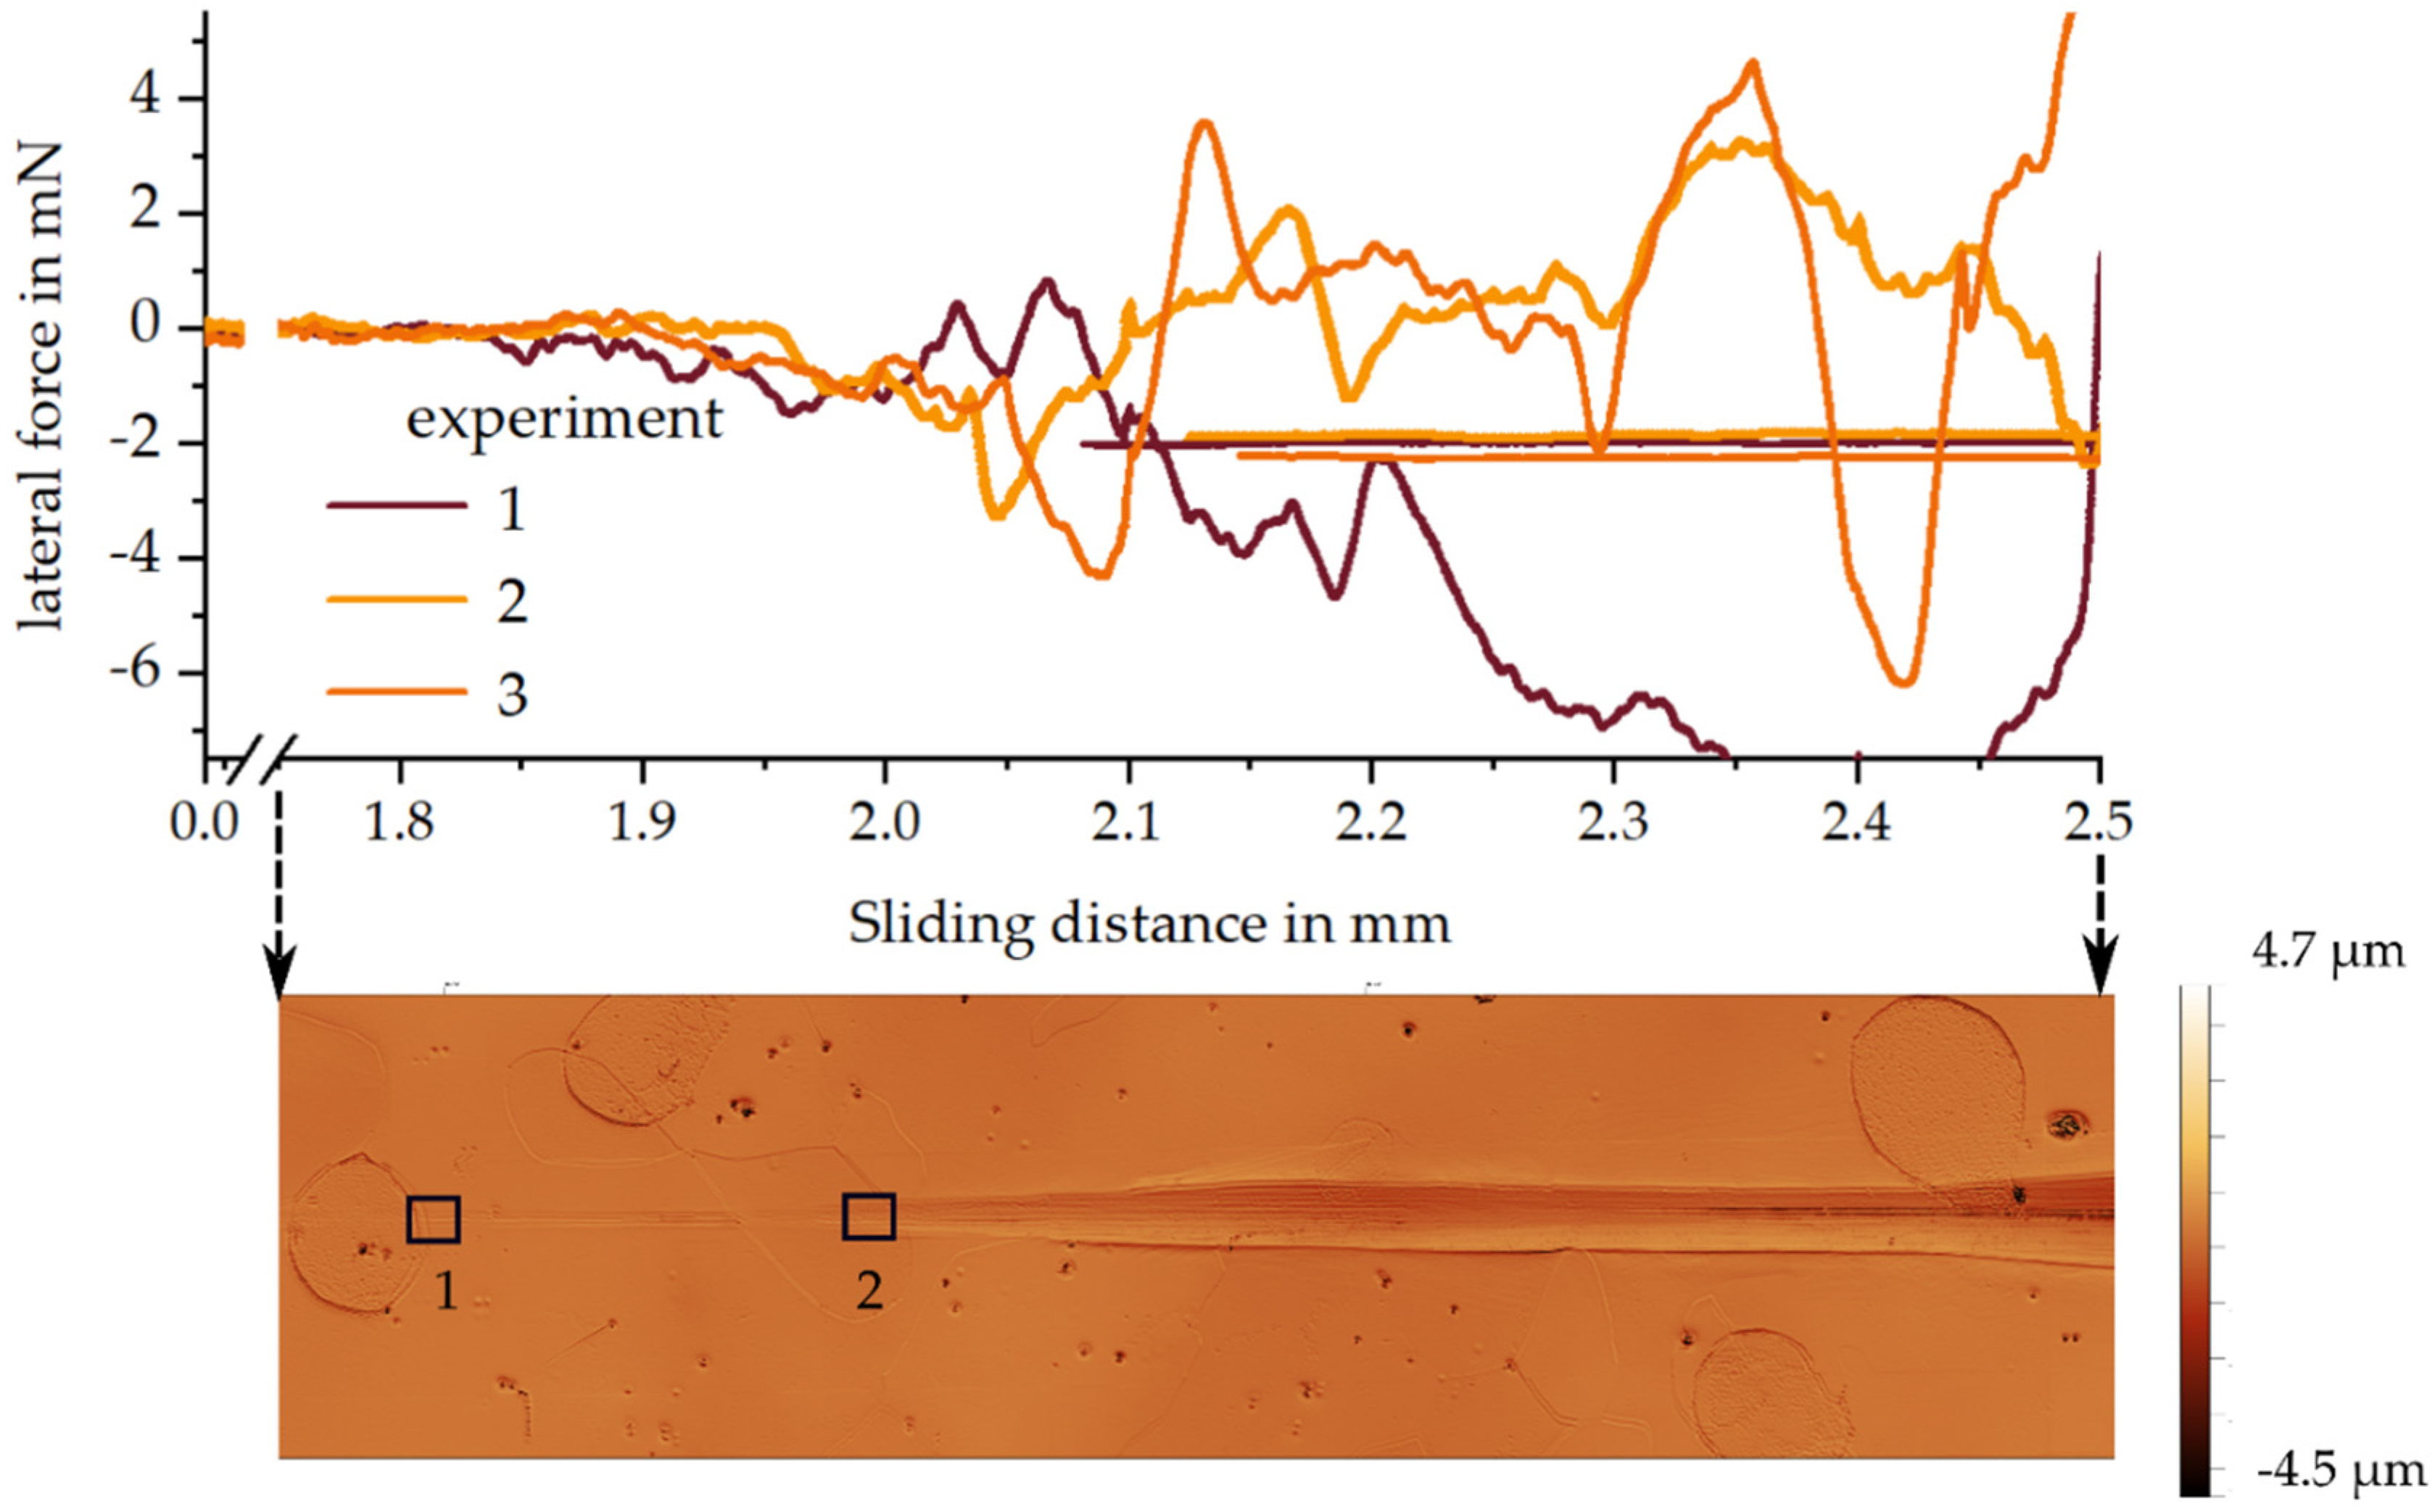
Figure 4 shows the lateral force signal for a sliding distance range of 1.5–2.5 mm, together with the representative topography of wear track no. 3. The lateral force significantly increases with the wear track depth in the segment where the normal load increases to 15.6 mN.
A friction experiment (not shown here) was performed up to a peak load of 203 mN and a sliding distance of 1.949 mm. This experiment did not show a significant increase in lateral force at the end of the wear track. White light interferometry revealed a height increase in the sliding direction at the end of the wear track of approx. 80 nm, whereas no height increase in the lateral direction was found.
3.2. Electron Microscopy
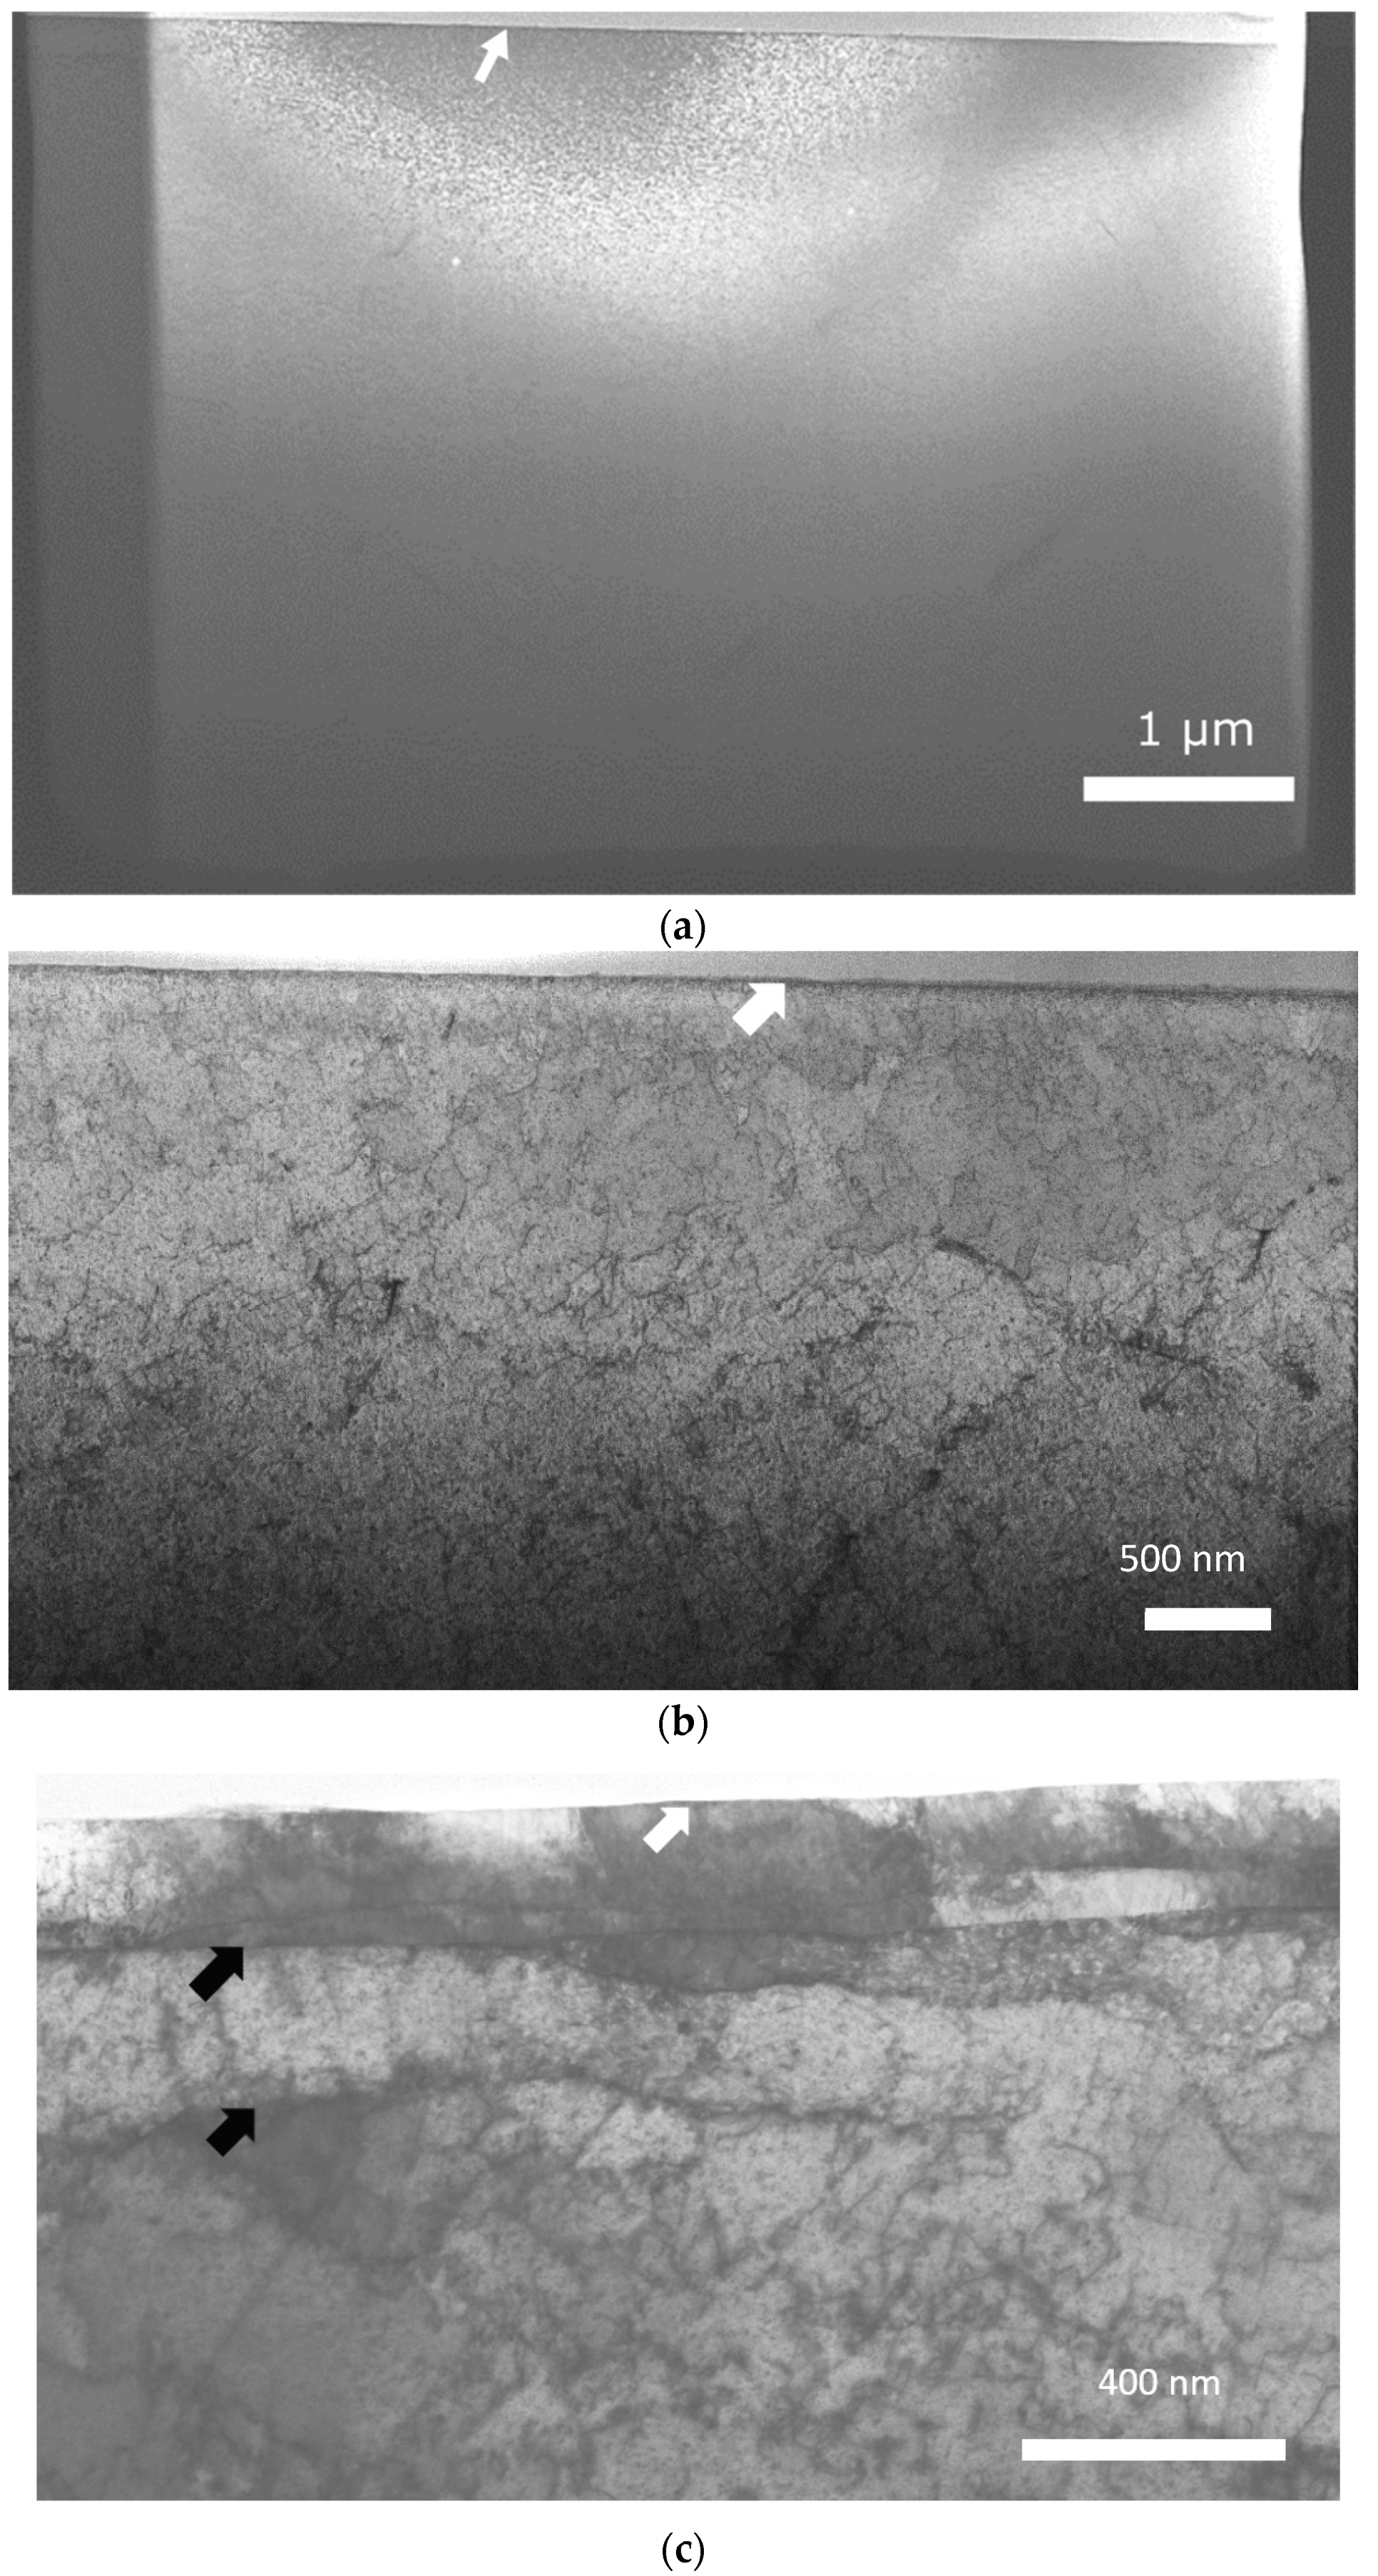
TEM foils were prepared from the unworn sample in the segment with a constant load of 5370 mN and in the segment of the load increase from 2.7 to 15.6 mN for wear track 1. In this latter segment, one foil represented the subsurface of the wear track prior to the onset of a lateral force signal (wear track length 1.8 mm), while a second foil characterized the subsurface microstructure of the wear track after the onset of a lateral force (wear track length 1.967 mm). The T-SEM bright field images of these foils are shown in Figure 5. The foil presented in Figure 5b from the shallow part of the wear track, i.e., before formation of a distinct sliding trace (Figure 4, rectangle 1), shows dislocations, although not the phenomenon of dislocation rearrangement called DTL [25]. Compared to the unworn subsurface after electropolishing shown in Figure 5a, the dislocation density increases. In the shallow wear track of experiment 3, a TEM foil was prepared as well and a result comparable to that of wear track 1, i.e., no visible DTL, was found (see Supplementary Materials Figure S2). In contrast, the foil prepared at the length of 1.967 mm (Figure 5c) shows two pronounced DTLs with depths of 190 and 440 nm under the surface. From the contrast of the T-SEM images in Figure 5b,c, subgrains are not clearly visible. The increased dislocation density is visible and homogeneous for the complete TEM foil. For the determination of a gradient in dislocation density, the size of the TEM foil is too small. The gradient in the dislocation density is deeper in the material.
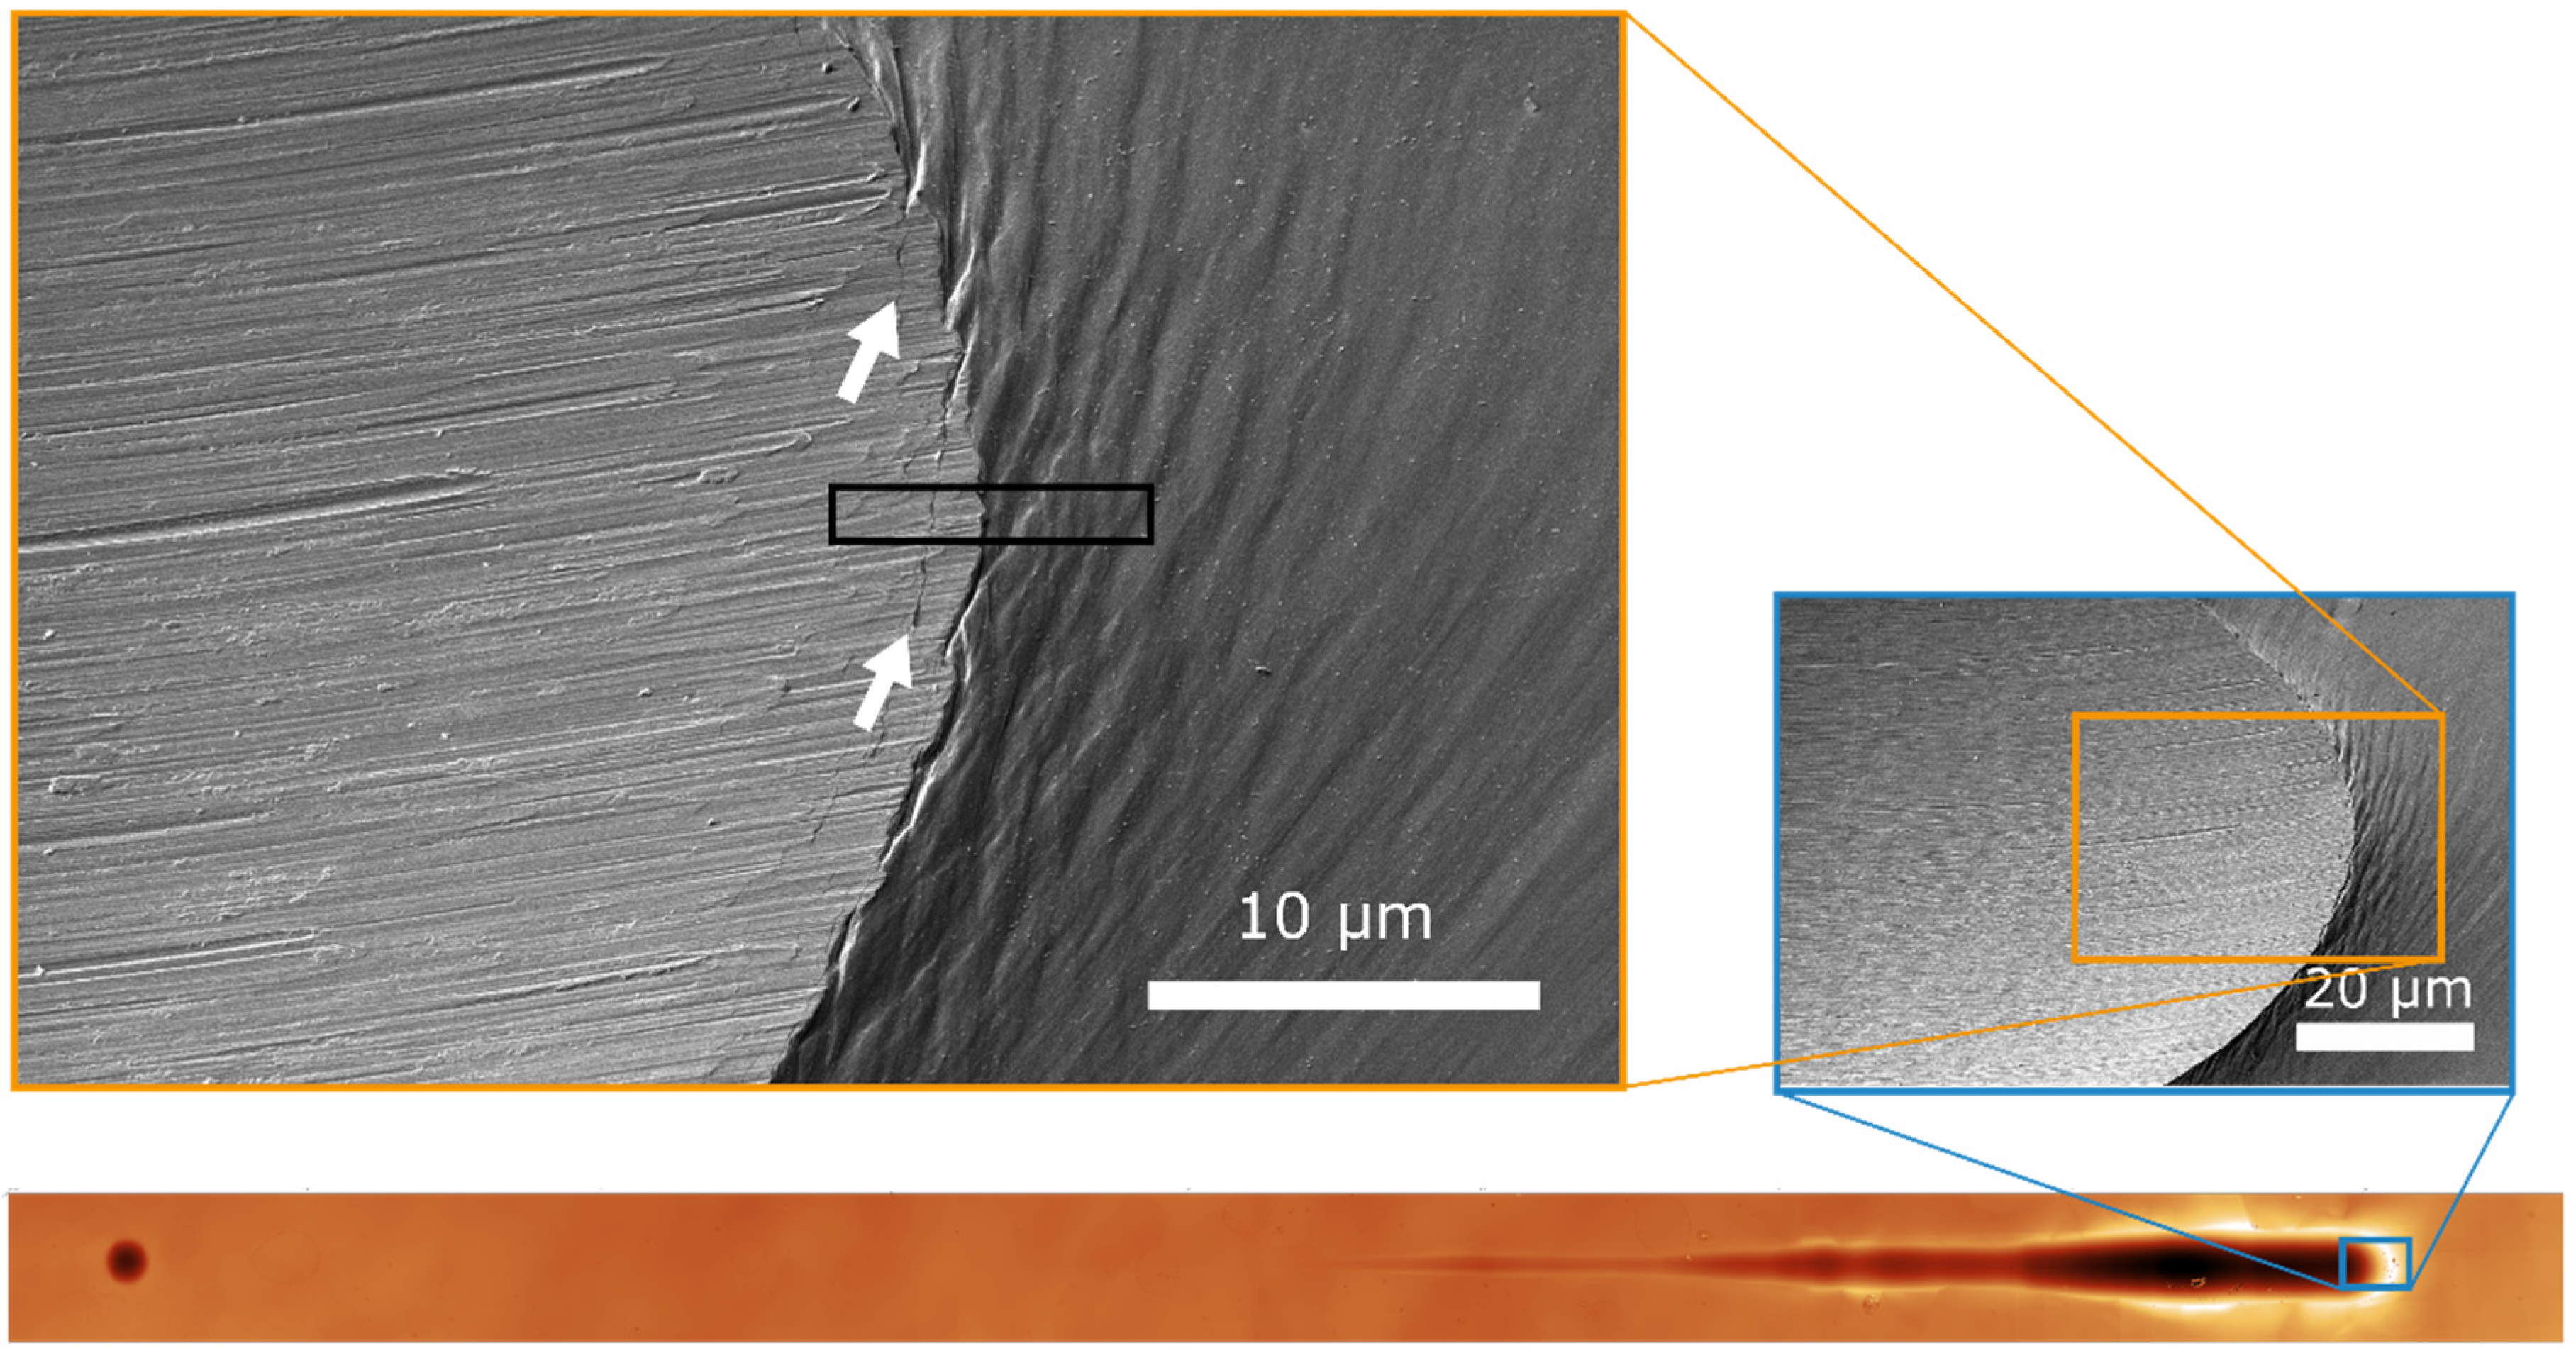
SEM imaging of the end of the wear track (Figure 6) shows a surface with protrusions or waviness in front of the wear track in the sliding direction because of material extrusion due to the severe ploughing of the ruby ball at the high loads. At the very end of the wear track, a compression of the described protrusions by the ruby ball is visible, leaving a small line between the former waves that were extruded during sliding. The line is only visible at distances less than one micron from the end of the wear track in the sliding direction (see white arrows in Figure 6).
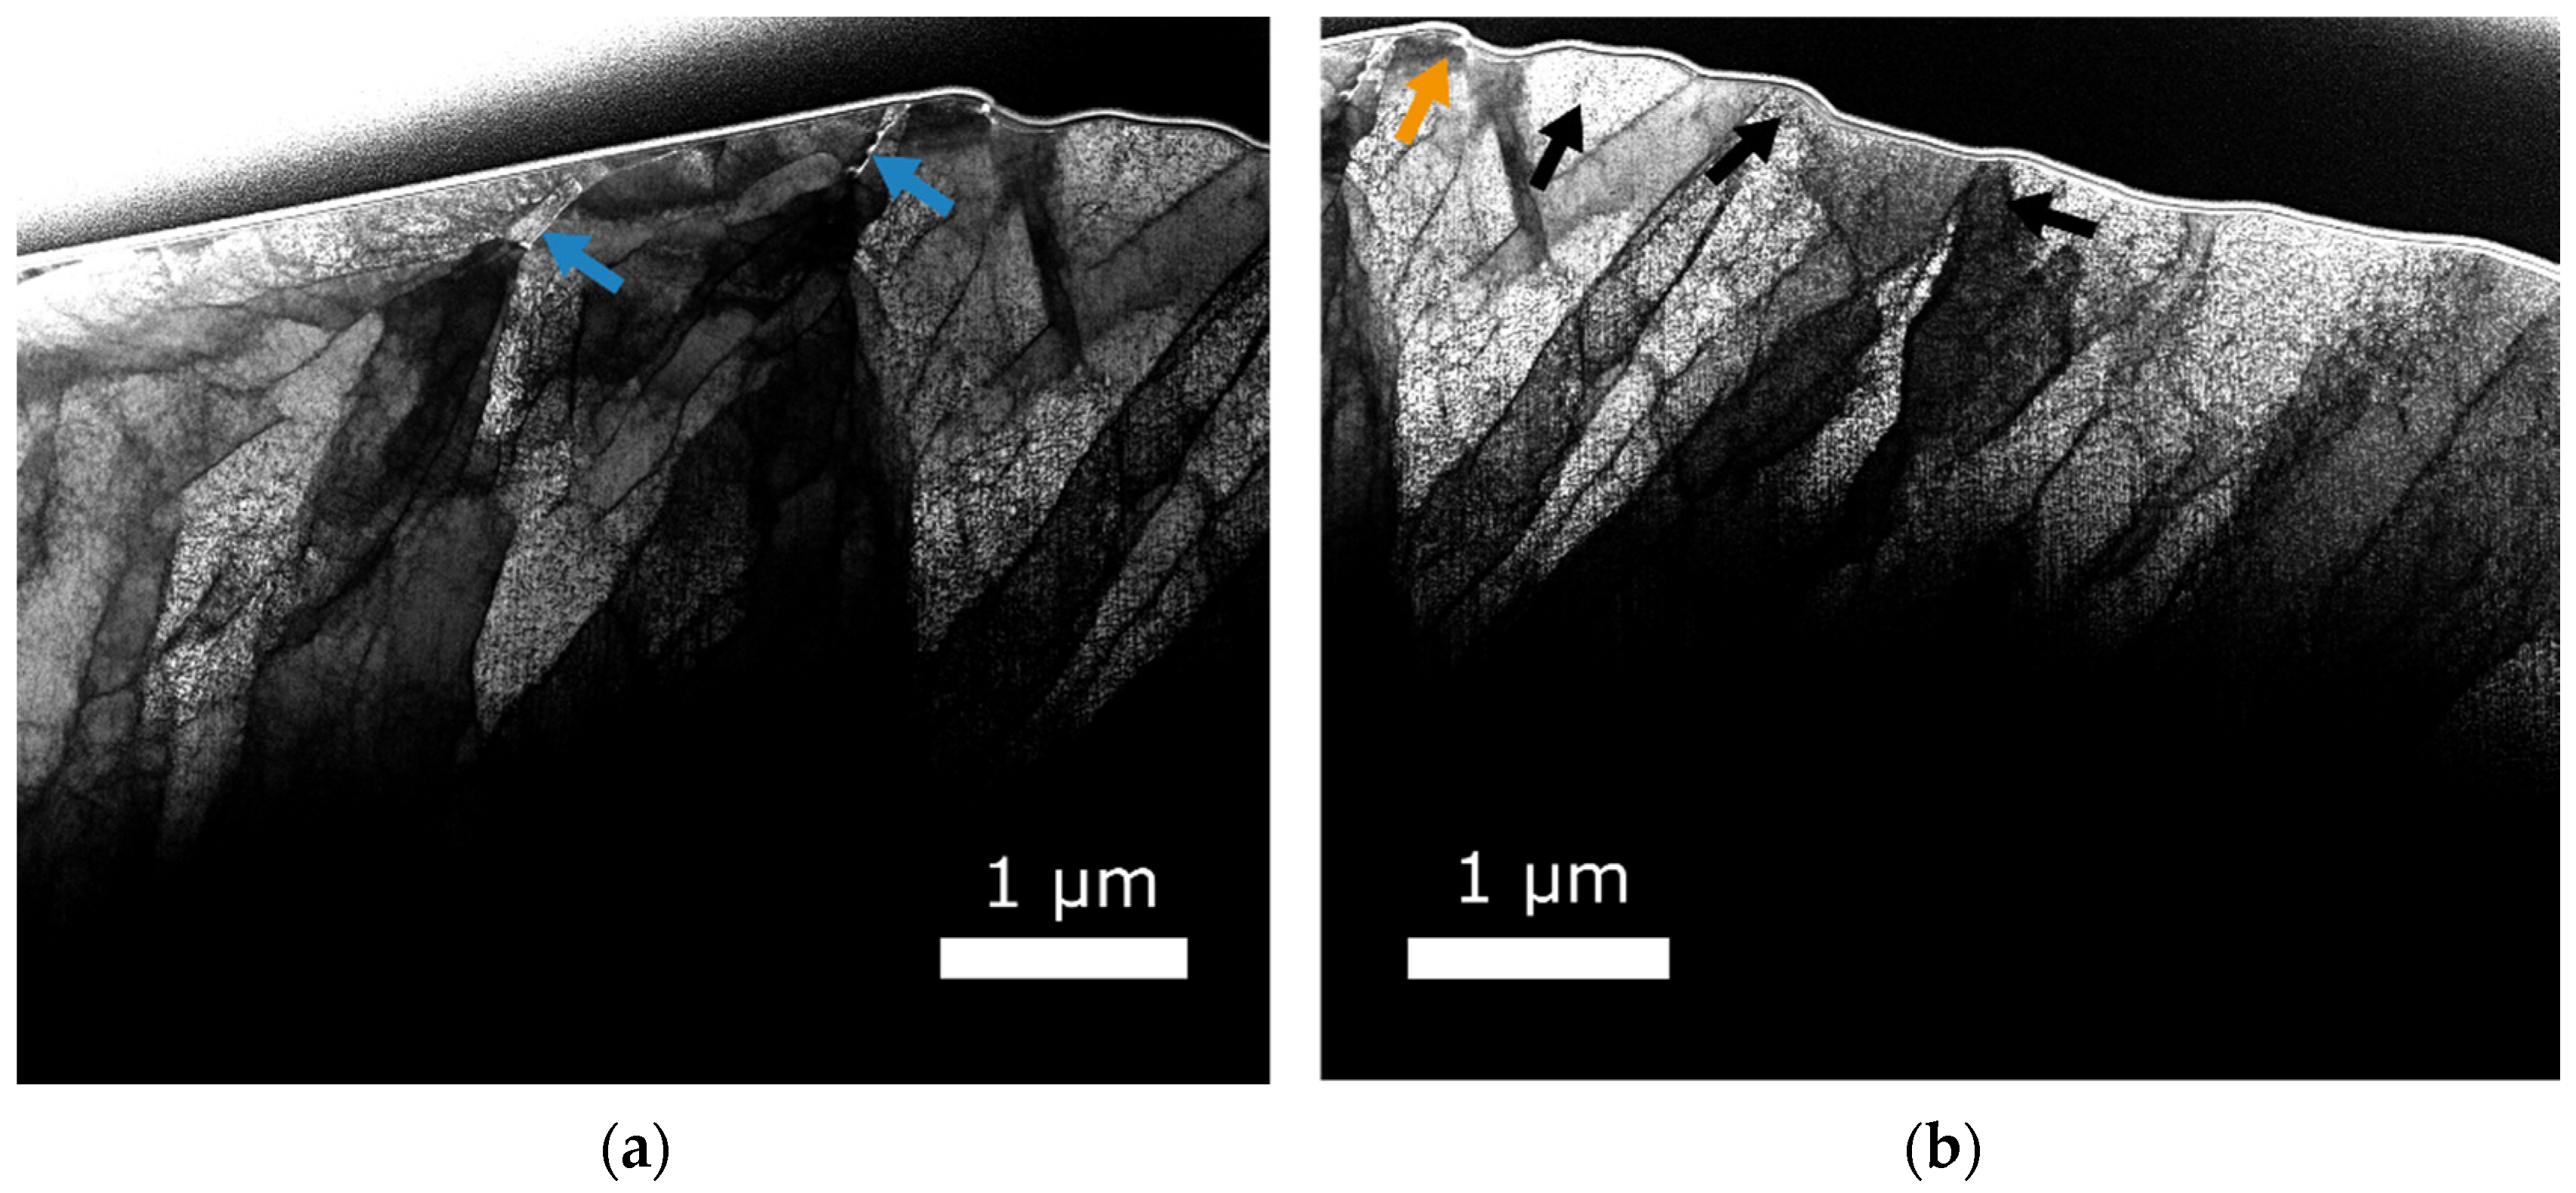
Figure 7 shows bright field T-SEM images of the TEM foil prepared from the end of the wear track in experiment 1. The corresponding topography and the orientation of the foil are presented in Figure 6. The part of the foil that represents the wear track subsurface is shown in Figure 7a. Figure 7b highlights the part of the foil that represents the subsurface of the area in front of the wear track. In Figure 7b, it is visible that the protrusions shown in Figure 6 are connected to distinct grains (marked by black arrows in Figure 7b) under the corresponding protrusion, while other grains do not form protrusions. Both images of the foil show grain refinement with elongated grains measuring a few microns in length and several hundred nanometers in width. Interestingly, a DTL is visible at the end of the wear track with small grains of less than a micron in diameter, as well as directly after the formation of a distinct wear track, where the grains are larger than 2 µm.
4. Discussion
The topography image in Figure 6 clearly shows the extrusion and folding of the protrusions. The areas between the single protrusions become thinner as they approach the wear track and become a small black line when they enter the contact area with the ball (see white arrows in Figure 6). As the ruby ball surpasses the bulges formed due to plastic deformation during ploughing, it plastically deforms those bulges, leaving a folded surface behind. These folds are visible in the TEM bright field image as whitish lines (blue arrows in Figure 7a). Both sides of this line are former surfaces, being folded together by the surpassing ruby ball. The development of a fold is also visible from the very end of the wear track, as indicated by a yellow arrow in Figure 7b. This kind of folding mechanism was already observed by Narayan et al. [17]. The relation of the protrusions with the folding was discussed by Beckmann et al. [18]. Due to the specific orientation of certain grains relative to others, the slip systems are oriented in a direction that favors plastic deformation out of the surface. In other grains, plastic deformation does not take place, as the necessary Peierls stress in the respective slip systems is not reached.
We explicitly want to mention that the DTL found in subsurfaces from many experiments was not due to the folding of the two former surfaces. This is visible in Figure 7a, where the whitish line is visible as a line decreasing from the surface at an angle of approx. 45°. A small gap still seems to exist between the former surfaces, making the line in the T-SEM appear white. This line ends below the surface at a depth of approx. 400 nm. At the bottom of the grain on the left of the line (as the ruby ball comes from the left), a black line is visible, which is considered as a DTL. In contrast to the whitish line resulting from the approaching and folding of the two surfaces, this DTL has a different contrast in the electron microscope. The contrast is parallel to the surface and does not show an inclining angle. The trace line fades to the left, as the surrounding material experienced less plastic deformation than the fold itself, while the next whitish line due to the fold is visible (Figure 7a). A second image highlighting this situation is shown in the Supplementary Materials (Figure S1). The protrusions visible in Figure 7b are precursors of the folds. For the plastic deformation of the grains forming the protrusions during movement of the counterpart (here the ruby ball), dislocation motion is necessary. We assume that due to dislocation of multiplication mechanisms, the dislocation density in the grains being extruded out of the surface and then folded is higher than that of the grains that did not protrude out of the surface due to their different orientations. The appearance of the DTL is a consequence of this higher dislocation density. The difference in dislocation density is a possible explanation for the observation of the DTL fading to the left and reappearing after the next fold. With continuing sliding and more plastic deformation, the dislocation density increases by so much that a continuous trace line below the worn surface can form. Correspondingly, in the very shallow wear track, before the onset of a lateral force, the DTL is not visible (see Figure 5a). An increased dislocation density is visible in the subsurface, although only after the appearance of a distinct wear track is a DTL visible. It seems that with the formation of the continuous sliding trace and the related plastic deformation, a dislocation density threshold is crossed that allows the formation of the DTL. For the very shallow wear track depth of 100 nm, there is only minor plastic deformation, which seems not to create enough dislocations for the trace line formation. This is in agreement with the onset of the lateral force, which correlates with the onset of the bulging of the material lateral to the friction direction.
The lateral force would be an indicator of the onset of ploughing, as the formation of a bulge in the sliding direction correlated to the formation of bulges in the lateral direction. To test this indicator, scratch experiments with the load functions shown above were conducted but stopped before the lateral force was expected to rise above the noise threshold (wear track length of 1.95 mm). When interrupted, the experiments showed a lateral force, which was always connected to bulging in the lateral direction. From one of these interrupted experiments, a significant friction force of 72.8 mN, a lateral force in the noise floor of the system, and a bulge formation measuring 80 nm in height in the sliding direction were found. No height increase in the lateral direction was visible. This means that the lateral force is a good indicator for the onset of ploughing, although bulge formation in the sliding direction can occur before bulging in the lateral direction. Further experiments are necessary to quantify the conditions producing this bulge formation in the sliding direction with a missing bulge formation in the lateral direction.
5. Conclusions
We analyzed the subsurface microstructural evolution in bcc iron during scratch testing with increasing loads. The formation of a dislocation trace line that was reported for fcc materials was confirmed here as well. A certain amount of plastic deformation was a necessary condition for the formation of the dislocation trace line. This effect was visible from grains at the end of the wear track that underwent more plastic deformation than other neighboring grains. A second indicator for the threshold of plastic deformation for trace line formation was the appearance of the trace line only after the formation of a distinct wear track, i.e., not only isolated scratches. Moreover, the lateral force can be used as rough indicator for the onset of ploughing, although the formation of small bulges in the sliding direction is possible before the measurement of a lateral force and connected bulges on the left and the right of the wear track.
Supplementary Materials
The following are available online at https://www.mdpi.com/article/10.3390/met11081258/s1: Figure S1: Bright field image of the TEM foil prepared from the end of the wear track 1. Figure S2: Bright field image of the TEM foil prepared from wear track 3 before the onset of ploughing. The black arrow indicates the surface.
Author Contributions
Conceptualization, D.L., F.R., and C.G.; methodology, D.L. and F.R.; investigation, D.L. and F.R.; writing—original draft preparation, D.L.; writing—review and editing, D.L. All authors have read and agreed to the published version of the manuscript.
Funding
This research was partially funded by the European Research Council (ERC) under grant no. 771237, TriboKey.
Data Availability Statement
The data presented in this study are openly available in KITopen at doi 10.5445/IR/1000136268.
Conflicts of Interest
The authors declare no conflict of interest. The funders had no role in the design of the study; in the collection, analyses, or interpretation of data; in the writing of the manuscript, or in the decision to publish the results.
References
- Linsler, D.; Schröckert, F.; Scherge, M. Influence of subsurface plastic deformation on the running-in behavior of a hypoeutectic AlSi alloy. Tribol. Int. 2016, 100, 224–230. [Google Scholar] [CrossRef]
- Perrin, K.; Pandosh, J.; Searle, A.; Shaub, H.; Sprague, S. Radioactive Tracer Study of Start-Up Wear Versus Steady-State Wear in a 2.3 Liter Engine. In SAE International Fall Fuels and Lubricants Meeting and Exhibition, OCT. 16; SAE International 400 Commonwealth Drive: Warrendale, PA, USA, 1995. [Google Scholar]
- Scherge, M.; Martin, J.M.; Pöhlmann, K. Characterization of wear debris of systems operated under low wear-rate conditions. Wear 2006, 260, 458–461. [Google Scholar] [CrossRef]
- Shakhvorostov, D.; Gleising, B.; Büscher, R.; Dudzinski, W.; Fischer, A.; Scherge, M. Microstructure of tribologically induced nanolayers produced at ultra-low wear rates. Wear 2007, 263, 1259–1265. [Google Scholar] [CrossRef]
- Fischer, A.; Weiss, S.; Wimmer, M.A. The tribological difference between biomedical steels and CoCrMo-alloys. J. Mech. Behav. Biomed. Mater. 2012, 9, 50–62. [Google Scholar] [CrossRef] [Green Version]
- Zhang, J.; Alpas, A.T. Transition between mild and severe wear in aluminium alloys. Acta Mater. 1997, 45, 513–528. [Google Scholar] [CrossRef]
- Rigney, D.A. Large strains associated with sliding contact of metals. Mater. Res. Innov. 1998, 1, 231–234. [Google Scholar] [CrossRef]
- Argibay, N.; Chandross, M.; Cheng, S.; Michael, J.R. Linking microstructural evolution and macro-scale friction behavior in metals. J. Mater. Sci. 2017, 52, 2780–2799. [Google Scholar] [CrossRef]
- Cihan, E.; Jungjohann, K.; Argibay, N.; Chandross, M.; Dienwiebel, M. Effect of Environment on Microstructure Evolution and Friction of Au–Ni Multilayers. Tribol. Lett. 2020, 68, 503001. [Google Scholar] [CrossRef] [Green Version]
- Sawyer, W.G.; Argibay, N.; Burris, D.L.; Krick, B.A. Mechanistic Studies in Friction and Wear of Bulk Materials. Annu. Rev. Mater. Res. 2014, 44, 395–427. [Google Scholar] [CrossRef] [Green Version]
- Berthier, Y.; Vincent, L.; Godet, M. Fretting fatigue and fretting wear. Tribol. Int. 1989, 22, 235–242. [Google Scholar] [CrossRef]
- Vincent, L.; Berthier, Y.; Dubourg, M.C.; Godet, M. Mechanics and materials in fretting. Wear 1992, 153, 135–148. [Google Scholar] [CrossRef]
- Outeiro, J.C.; Campocasso, S.; Denguir, L.A.; Fromentin, G.; Vignal, V.; Poulachon, G. Experimental and numerical assessment of subsurface plastic deformation induced by OFHC copper machining. CIRP Ann. 2015, 64, 53–56. [Google Scholar] [CrossRef] [Green Version]
- Eder, S.J.; Cihak-Bayr, U.; Bianchi, D.; Feldbauer, G.; Betz, G. Thermostat Influence on the Structural Development and Material Removal during Abrasion of Nanocrystalline Ferrite. ACS Appl. Mater. Interfaces 2017, 9, 13713–13725. [Google Scholar] [CrossRef] [Green Version]
- Grützmacher, P.; Gachot, C.; Eder, S.J. Visualization of microstructural mechanisms in nanocrystalline ferrite during grinding. Mater. Des. 2020, 195, 109053. [Google Scholar] [CrossRef]
- Karpuschewski, B.; Welzel, F.; Risse, K.; Schorgel, M. Reduction of Friction in the Cylinder Running Surface of Internal Combustion Engines by the Finishing Process. Procedia CIRP 2016, 45, 87–90. [Google Scholar] [CrossRef] [Green Version]
- Sundaram, N.K.; Guo, Y.; Chandrasekar, S. Mesoscale Folding, Instability, and Disruption of Laminar Flow in Metal Surfaces. Phys. Rev. Lett. 2012, 109, 106001. [Google Scholar] [CrossRef] [Green Version]
- Beckmann, N.; Romero, P.A.; Linsler, D.; Dienwiebel, M.; Stolz, U.; Moseler, M.; Gumbsch, P. Origins of Folding Instabilities on Polycrystalline Metal Surfaces. Phys. Rev. Appl. 2014, 2, 64004. [Google Scholar] [CrossRef]
- Hughes, D.A.; Dawson, D.B.; Korellls, J.S.; Weingarten, L.I. Near surface microstructures developing under large sliding loads. JMEP 1994, 3, 459–475. [Google Scholar] [CrossRef]
- Greiner, C.; Gagel, J.; Gumbsch, P. Solids Under Extreme Shear: Friction-Mediated Subsurface Structural Transformations. Adv. Mater. 2019, 31, e1806705. [Google Scholar] [CrossRef]
- Rice, S.L.; Nowotny, H.; Wayne, S.F. A Survey of the Development of Subsurface Zones in the Wear of Materials. KEM 1991, 33, 77–100. [Google Scholar] [CrossRef]
- Bowden, F.P.; Moore, A.J.W.; Tabor, D. The Ploughing and Adhesion of Sliding Metals. J. Appl. Phys. 1943, 14, 80–91. [Google Scholar] [CrossRef]
- Heilmann, P.; Clark, W.; Rigney, D.A. Orientation determination of subsurface cells generated by sliding. Acta Metall. 1983, 31, 1293–1305. [Google Scholar] [CrossRef]
- Haug, C.; Ruebeling, F.; Kashiwar, A.; Gumbsch, P.; Kübel, C.; Greiner, C. Early deformation mechanisms in the shear affected region underneath a copper sliding contact. Nat. Commun. 2020, 11, 839. [Google Scholar] [CrossRef] [Green Version]
- Greiner, C.; Liu, Z.; Schneider, R.; Pastewka, L.; Gumbsch, P. The origin of surface microstructure evolution in sliding friction. Scr. Mater. 2018, 153, 63–67. [Google Scholar] [CrossRef]
- Ruebeling, F.; Xu, Y.; Richter, G.; Dini, D.; Gumbsch, P.; Greiner, C. Normal Load and Counter Body Size Influence the Initiation of Microstructural Discontinuities in Copper during Sliding. ACS Appl. Mater. Interfaces 2021, 13, 4750–4760. [Google Scholar] [CrossRef]
- Laube, S.; Kauffmann, A.; Ruebeling, F.; Freudenberger, J.; Heilmaier, M.; Greiner, C. Solid solution strengthening and deformation behavior of single-phase Cu-base alloys under tribological load. Acta Mater. 2020, 185, 300–308. [Google Scholar] [CrossRef]
- Liu, Z.; Messer-Hannemann, P.; Laube, S.; Greiner, C. Tribological performance and microstructural evolution of α-brass alloys as a function of zinc concentration. Friction 2020, 8, 1117–1136. [Google Scholar] [CrossRef]
- Chen, X.; Schneider, R.; Gumbsch, P.; Greiner, C. Microstructure evolution and deformation mechanisms during high rate and cryogenic sliding of copper. Acta Mater. 2018, 161, 138–149. [Google Scholar] [CrossRef]
- Greenwood, J.A. Analysis of elliptical Hertzian contacts. Tribol. Int. 1997, 30, 235–237. [Google Scholar] [CrossRef]
- Hertz, H. Über die Berührung fester elastischer Körper. J. Reine Angew. Math. 1881, 92, 156–171. [Google Scholar] [CrossRef]
Figure 1.
Normal load during the experiments: (a) load function; (b) normal load signals for the three experiments.
Figure 1.
Normal load during the experiments: (a) load function; (b) normal load signals for the three experiments.

Figure 2.
Friction force for all three experiments. The topography of the sliding trace for experiment 1 is visible in the bottom of the figure. The scale of the topography image corresponds to the graph abscissa. The numbered arrows indicate the positions of the line profiles shown in Figure 3. The red arrow marks the indent, which was made before the sliding experiment started.

Figure 3.
Profiles across wear track 1 at the positions indicated in Figure 2.
Figure 3.
Profiles across wear track 1 at the positions indicated in Figure 2.

Figure 4.
Lateral force of all three experiments in the sliding distance range of 1.5–2.5 mm. The topography of the corresponding wear track length for experiment 3 is shown in the bottom of the figure. The scale of the topography image corresponds to the graph abscissa. The black rectangles indicate the positions of the TEM foils shown in Figure 5b,c. The foils were prepared parallel to the sliding direction.

Figure 5.
T-SEM images (30 kV, 0.1 nA) of foils prepared from the unworn sample (a) and at sliding distances of (b) 1.8 mm with 28 mN normal load and (c) 1.967 mm with 250 mN normal load in the wear track of experiment 1. The white arrows indicate the sample surfaces, while the black arrows mark the DTLs at depths of 190 and 440 nm. The positions of the foils within the wear track are indicated by the black rectangles in Figure 4, where foil b is prepared from the position in rectangle 1 and foil c from the position in rectangle 2. All foils in the wear track were prepared parallel to the sliding direction.

Figure 6.
Topography of the end of the wear track in experiment 1. The white arrows highlight the dark line resulting from the compression of the folds by the ruby ball. The black rectangle indicates the position of the TEM foil shown in Figure 7. The foil was prepared parallel to the sliding direction.

Figure 7.
Bright field T-SEM images (30 kV, 0.1 nA) of a foil prepared from the end of the wear track shown in Figure 6 (black rectangle). Sliding direction from left to right. Foils were taken along the sliding direction. (a) Part of the foil showing the end of the wear track. The ruby ball flattened the surface. The blue arrows indicate the white lines originating from folding of two former surfaces. (b) Image of the foil taken from the area directly in front of the wear track. The black arrows mark the grains that formed protrusions. The yellow arrow indicates the development of a fold.

Publisher’s Note: MDPI stays neutral with regard to jurisdictional claims in published maps and institutional affiliations. |
© 2021 by the authors. Licensee MDPI, Basel, Switzerland. This article is an open access article distributed under the terms and conditions of the Creative Commons Attribution (CC BY) license (https://creativecommons.org/licenses/by/4.0/).
Share and Cite
MDPI and ACS Style
Linsler, D.; Ruebeling, F.; Greiner, C. Subsurface Microstructural Evolution during Scratch Testing on Bcc Iron. Metals 2021, 11, 1258. https://doi.org/10.3390/met11081258
AMA Style
Linsler D, Ruebeling F, Greiner C. Subsurface Microstructural Evolution during Scratch Testing on Bcc Iron. Metals. 2021; 11(8):1258. https://doi.org/10.3390/met11081258
Chicago/Turabian StyleLinsler, Dominic, Friederike Ruebeling, and Christian Greiner. 2021. "Subsurface Microstructural Evolution during Scratch Testing on Bcc Iron" Metals 11, no. 8: 1258. https://doi.org/10.3390/met11081258
Note that from the first issue of 2016, this journal uses article numbers instead of page numbers. See further details here.