Influence of the Energy Density for Selective Laser Melting on the Microstructure and Mechanical Properties of Stainless Steel

Department of Physics and Chemistry of Materials, Institute of Metals and Technology, Lepi pot 11, 1000 Ljubljana, Slovenia
*
Author to whom correspondence should be addressed.
Metals 2020, 10(7), 919; https://doi.org/10.3390/met10070919
Submission received: 18 June 2020
/
Revised: 5 July 2020
/
Accepted: 7 July 2020
/
Published: 9 July 2020
(This article belongs to the Special Issue Microstructure-Mechanical Property Relationships in Metallic Materials)
Abstract
:We have investigated the impact of the process parameters for the selective laser melting (SLM) of the stainless steel AISI 316L on its microstructure and mechanical properties. Properly selected SLM process parameters produce tailored material properties, by varying the laser’s power, scanning speed and beam diameter. We produced and systematically studied a matrix of samples with different porosities, microstructures, textures and mechanical properties. We identified a combination of process parameters that resulted in materials with tensile strengths up to 711 MPa, yield strengths up to 604 MPa and an elongation up to 31%, while the highest achieved hardness was 227 HV10. The correlation between the average single-cell diameter in the hierarchical structure and the laser’s input energy is systematically studied, discussed and explained. The same energy density with different SLM process parameters result in different material properties. The higher energy density of the SLM produces larger cellular structures and crystal grains. A different energy density produces different textures with only one predominant texture component, which was revealed by electron-backscatter diffraction. Furthermore, three possible explanations for the origin of the dislocations are proposed.
1. Introduction
Selective laser melting (SLM) is one of the most commonly used additive manufacturing (AM) processes used to obtain products with superior properties. The line-by-line and layer-by-layer nature of SLM makes it suitable for processing many metal products from a powder feedstock. The stainless steel AISI 316L is one of the most widely used alloys, due to its excellent mechanical and corrosion-resistant properties, finding applications in the automotive [1], aeronautics, construction, energy [2], heavy-industry, food-preparation [3], and medical sectors [4,5]. AISI 316L is an extensively studied metallic material in SLM research [6,7], due to the simplicity of its single-phase (γFe-austenite) microstructure [8,9]. The AM process is particularly advantageous for prototyping, aviation, aerospace and medicine [10] because of the design freedom, which allows for bionic structures [11], leading to a substantial reduction in the component’s weight [12].
Despite AISI 316L’s single-phase microstructure, the SLM working parameters greatly influence the microstructure’s development. The process windows (known as process maps) that define the optimum working parameters for stable melting [13] include the laser power (P), scanning speed (v) and hatch spacing (h). Controlling these parameters results in a lower porosity and fewer defects [14], which impact the component’s density [15], mechanical and corrosion properties [16,17]. A lower P creates melt pools with a conductive shape, typical for the SLM process, while a higher P transforms the melt pools into a keyhole shape, typical of directed energy-deposition (DED) processes [18]. A higher v means a process with a reduced energy density (E), since the laser will move more quickly over the surface of the developing component. The value of h is always in combination with the focal diameter (d). With a d overlay of h, the melting pools are wider, which results in multiple laser passes and a wider area being remelted. The metal powder also has an influence on the final properties of the product. The initial powder shape, size and mechanical properties define the powder’s effectiveness for AM processing and impact on the final properties [19]. Recent studies have explained how the developments of the grain size [20,21] and the texture [22,23] are defined by the AM processing parameters [24]. Nevertheless, any attempt to correlate the SLM working parameters with the microstructure and mechanical properties still leaves a number of unanswered questions. A systematic study that considers the influence of the SLM process parameters and how they affect the porosity, texture, microstructure, cellular structure, hardness, mechanical properties and corrosion resistance is absent. For example, Sun et al. [24] predicted the shape of the melt pools and the resulting texture, but only for a single combination of parameters. Other authors [25] varied v and associated it with the different textures that were formed. In another report, a clear, layered pattern was found, due only to the scanning strategy [26]. The cellular structure was studied and then partially explained by Zhong [27], where P was held constant, with v and d being changed. The correlation with the cell sizes was studied using the same E. The authors confirmed that a lower v for the laser increases the cell size. The impact of the different SLM process parameters on the mechanical properties also received the attention of two groups. Zhong et al. [28] studied how the tensile strength, yield strength and elongation are connected to hierarchical structures on the macro-, micro- and nanoscale. Marbury [29] explained the influence of lattice geometries on the mechanical properties for the same E.
Much AM activity is now focused on how to achieve both high strength and high ductility [30,31,32,33]. Many studies have looked at the mechanical properties of SLM-produced AISI 316L. Wang et al., [14] for example, achieved almost 60% of elongation at a tensile strength of 640 MPa. Zhang et al. [34] reported 692 MPa of tensile strength, 457 MPa of yield strength and 28% of elongation. A lower tensile strength, with a higher yield strength, was reported by Sanchez-Avila et al. [35]. Montero-Sistiaga et al. [36] used a scanning strategy with 45° of rotation per layer, with a hardness of 213 HV being achieved.
The main goal of this investigation is a systematic study of the influence of the AM process parameters on the microstructure, texture and mechanical properties. In spite of the extensively studied AM stainless steels, it is not usually systematically and transparently interpreted. There is also no precise explanation of the hierarchical structure in the literature. Different forms were SLM processed for the tensile tests, hardness measurements, light microscopy (LM) and scanning electron microscopy (SEM). We used the electron channeling contrast imaging (ECCI) technique to observe the dislocations, the cellular and the hierarchical structure. The electron-backscattered diffraction (EBSD) technique was used for the texture, grain size and orientation. We also correlated the input E, which we used for the process with the grain growth. Based on all of these findings, we propose an explanation for the origin of the dislocations during the SLM process.
2. Materials and Methods
2.1. Process Parameters and Models
Figure 1 shows the AconityMINI (Aconity 3D GmbH, Herzogenrath, Germany) SLM equipment used in our investigation. The AconityMINI allows for the control of the laser power P, scanning speed v and focal diameter d (defined by the manufacturer from the defocus 3D scan head Df). All the parameters were selected according to the printer manufacturer’s recommendation and were systematically varied. Table 1 presents the parameters used for the tests. The P values varied between 150 W and 350 W, the v values were set to 400 mm/s and 800 mm/s, and the d values were set to 60 μm and 80 μm. The hatch distance h (80 μm) and the layer thickness l (30 µm) were kept constant. The energy density E was calculated using equation [26]:
Cubes with dimensions 10 × 10 × 10 mm3 (Figure 2a) and cylinders with a diameter of 20 mm and a height of 5 mm (Figure 2b) were produced for the microstructural characterization and the hardness measurements. Quads (Figure 2c) with dimensions 10 × 5 × 60 mm3 were designed and used for the tensile tests. For all the SLM-processed samples, a simple hatching with a 33° rotation per layer was performed.
2.2. Metal Powder
The AISI 316L powder used here was produced by LPW Technology Ltd., Runcorn, UK. The chemical composition of the powder is shown in Table 2, while the physical properties are shown in Table 3. Figure 3 shows the powder prior to processing. It has reasonably spherical particles with a minority of satellites that have similar sizes (between 15 µm and 45 µm).
2.3. Microscopy and Mechanical Properties
A ZEISS Axio Imager Z2m (Carl Zeiss AG, Oberkochen, Germany) was used for the Light microscopy (LM). SEM analyses were performed on a ZEISS FIB-SEM CrossBeam 550 (Carl Zeiss AG, Oberkochen, Germany) with an EDAX Hikari super EBSD Camera (Ametek Inc., Bervyn, PA, USA) The EBSD used a 70° tilt angle with an acceleration voltage of 15 kV and a probe current of 5 nA.
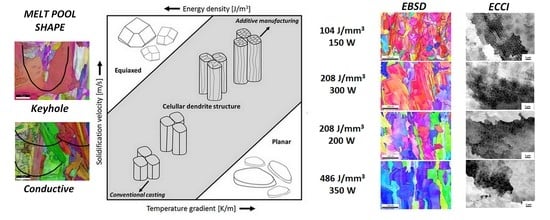
ECCI was used to reveal the dislocation cellular structure. ECCI is a powerful technique for observing crystal defects, such as dislocations, stacking faults, twins and grain boundaries in a SEM. At the crystal defects the electrons are back scattered and under certain conditions the defects are shown as white features on a dark background. The ECCI was performed at 30 kV and a probe current of 2 nA.
The samples for the EBSD and ECCI were mechanically polished with 1-µm diamond, followed by 10 min of (fumed silica suspension) OPS finishing. All the examined samples in this study were analyzed by microscopy in parallel (cross-section bottom-top) with the build direction. For the texture analysis, the coordinate system was defined such that the SLM building direction is the same as the rolling direction in a standard coordinate system. All our microscopy results are presented in a coordinate system where the vertical axes correspond to the build direction. EBSD inverse pole figures in the Z-direction (IPF Z) mappings were performed to define the grain shape and the texture for five areas of 430 × 340 µm2. The microstructure is shown on a representative micrograph, while the texture is presented as a sum of all five pole figures.
The tensile tests were made on three samples produced with the same selected conditions in accordance with the Deutsches Institute für Normung (DIN) 50125 standard (quads, which were further shaped to the Metric ISO thread M6 testing probes). The samples were tested perpendicular to the build direction. The Vickers hardness was measured with an Instron Tukon 2100B (Instron, Norwood, NJ, USA) using 10 kgf.
3. Results and Discussion
3.1. Light Microscopy
Twenty cubes were SLM processed using different parameters of d in order to create two process windows [37,38]. Low-magnification micrographs obtained with the LM were used to determine the porosity, which was the basis for establishing the process windows. The process windows were created for d = 60 µm (Figure 4a) and d = 80 µm (Figure 4b). It is important to create processing windows that lead to appropriate mechanical properties to correlate with the microstructures (Figure 4) and the crystallographic texture (Figure 5). Both process windows have a safety zone, which is approximately in the middle. The most suitable parameters for both values of d are around 250 W and 400 mm/s. The creation of porous microstructures with too high or too low v and/or P is also the same for both process windows. This is represented by the unsafety zones at the edges of both the presented process maps. The major difference between the two process windows is that the safety zone for the d = 80 µm is much wider than the d = 60 µm. It is important to mention that not all the parameters are included in these process windows since certain parameters do not work for all shapes. We believe that the heat transfer significantly influences the material’s residual stresses and, consequently, the mechanical properties, and so for any shape of the AM samples the parameters could not be directly applied. This observation is particularly relevant to the quads, since the highest energy density of sample 2 could not be prepared with the defined parameters [39]. Nevertheless, the parameters were optimal for the cubes and cylinders.
3.2. Porosity
The porosity was studied on all the SLM-processed samples in micrographs with an area of 3.57 mm2. The samples with a lower porosity and different E range were selected for further investigation. Table 4 shows that the lowest porosity of 0.02% was measured for samples 7 and 14. The lowest pore density was also measured for samples 7 and 14, i.e., 38.1 mm−2 and 43.7 mm−2, respectively. The purpose of the porosity investigation was to find how the pore density is related to the measured properties. For subsequent studies the samples with the lowest porosity were selected, because they had the best mechanical properties. From the results it was clear that the same E (208 J/mm3) produced a similar porosity of 0.02%, even though the other parameters were different. An insufficient energy density (sample 20) does not provide satisfactory melting of the powders during the SLM process, which resulted in the largest pores with an increased porosity.
3.3. Texture Analysis (EBSD)
EBSD inverse pole figures in the Z-direction (IPF Z) micrographs with marked high-angle grain boundaries (over 15°) and Euler pole figures (001), (110) and (111) are shown in Figure 5. For each of the four selected samples, one primary texture component is present (Figure 5). This is different for each set of parameters and shows that the process parameters have an impact on the texture development. The highest E (sample 2, Figure 5a) resulted in a texture with a dominant shear component F, which also appeared in the texture of sample 14, only with a smaller volume fraction. The texture of sample 7 (Figure 5b), which was produced with the same E as sample 14 (Figure 5c), shows the component D to be dominant. The same recrystallized texture component, i.e., a cube, was also dominant in sample 14, with some initiations of the texture component F. For sample 20 (Figure 5d), which had the lowest E, the cube texture component was observed [20,24].
We have observed in Figure 5 the basic texture component is a cube, but at the same time a shear texture component can also be present in the texture. In comparison to making samples with the same E (208.33 J/mm3), different values of P and v had a strong influence on the texture. A higher v generates a larger local area heated to the same temperature and creates better conditions for the recrystallized cube texture component. A lower v and lower P generate better conditions for rolling texture components, with orientations in the direction perpendicular to the build. The shear texture component, which can be observed in sample 2, produced with a larger E, has an orientation in the diagonal direction with respect to the vertical AM build. However, each of the four samples had a single dominant texture component, which is an indicator of the anisotropic distribution of the properties.
The FCC crystal structure has a <001> solidification direction [24]. This is evident in samples 14 and 20 (Figure 5c,d), since the selected energy leads to this kind of solidification, while a higher sum input energy creates different melt pool dynamic conditions [40,41], which also has an influence on the solidification and crystallization. We assume that at a higher input energy during the SLM process the conditions for keyhole-shaped melt pools are favorable [18,25]. Figure 6 shows both types of melt pools found in this study. At lower energy densities, more-or-less conductive-shaped melt pools are found Figure 6b, while at higher energies, we have found some keyhole-shaped melt pools, but they are very rare and not desirable in the SLM process due to the undesired voids in the wake of the laser beam [42]. In conventional laser welding the keyhole mode is favorable because of forming a narrow heat-affected zone [43]. In the literature [18,42], the transition energy density for the formation of the keyhole melt pools is similar to our conditions for our samples at an energy density higher than 200 J/mm3. Grains in the middle of the keyhole-shaped melt pool are small with different orientations Figure 6a and on the outer side of the melt pool is one larger grain with the shape of a melt pool, and this grain grew perpendicular to the melt pool boundary [18]. The keyhole-shaped melt pools have a tendency to solidify radially towards the melt pool center and the shape of the grains does not completely follow the melt pool boundaries [18]. The keyhole-shaped melt pools in our samples are by definition [18] at the limit of the aspect ratio (0.8). We also did not find any voids in the wake of the laser beam. On the other hand, conductive-shaped melt pools do not have a distinctive growth of the crystal grains in specific directions and do not start/end with the shape of the melt pool boundary. In contrast, for the EBSD maps in Figure 5d we observed some grains with the shape of melt pool boundaries. Most of the grains grow through melt pools, but sporadically crystallization starts at the melt pool boundaries. This is more common when the input energy is lower. The lower energy input is responsible for a conductive-shaped melt pool, where growth is typically in the build direction.
3.4. Grain Size and Morphology
The EBSD IPF Z micrographs were taken from selected samples to compare E with the characteristics of the grains (Figure 5 and Table 5). Sample 2 has an over two times larger E (486 J/mm3) than samples 7 and 14. The highest E results in the largest grains. Samples 7 and 14 have the same E (208 J/mm3) and have average grain size diameters of 18.6 µm and 12.7 µm, respectively. These grain sizes are in the range of the grains obtained by other research groups [8,14]. On the other hand, the average grain area is one-time larger for sample 14, which indicates that the grain shape has changed significantly. Like with the development of the cellular structure, we also observed that the same E with the other parameters being different has an impact on the grain shape and size. Finer grain microstructures are obtained at lower E, due to higher cooling rates since shorter growth times are available for the growth of the grains as previously described and explained by DebRoy et al. [8].
With an increase in the input energy, both the length of the low-angle (5°–15°) and the length of the high-angle (15°–65°) boundaries as well as the boundary density decrease. The same energy input results in different lengths of the low- and high-angle boundaries (Table 5). SLM process parameters have a minor impact on geometrical necessary dislocation density (GND) as shown in Table 5. The results of the GND analysis show similar values in comparison with industrial process parameters [22].
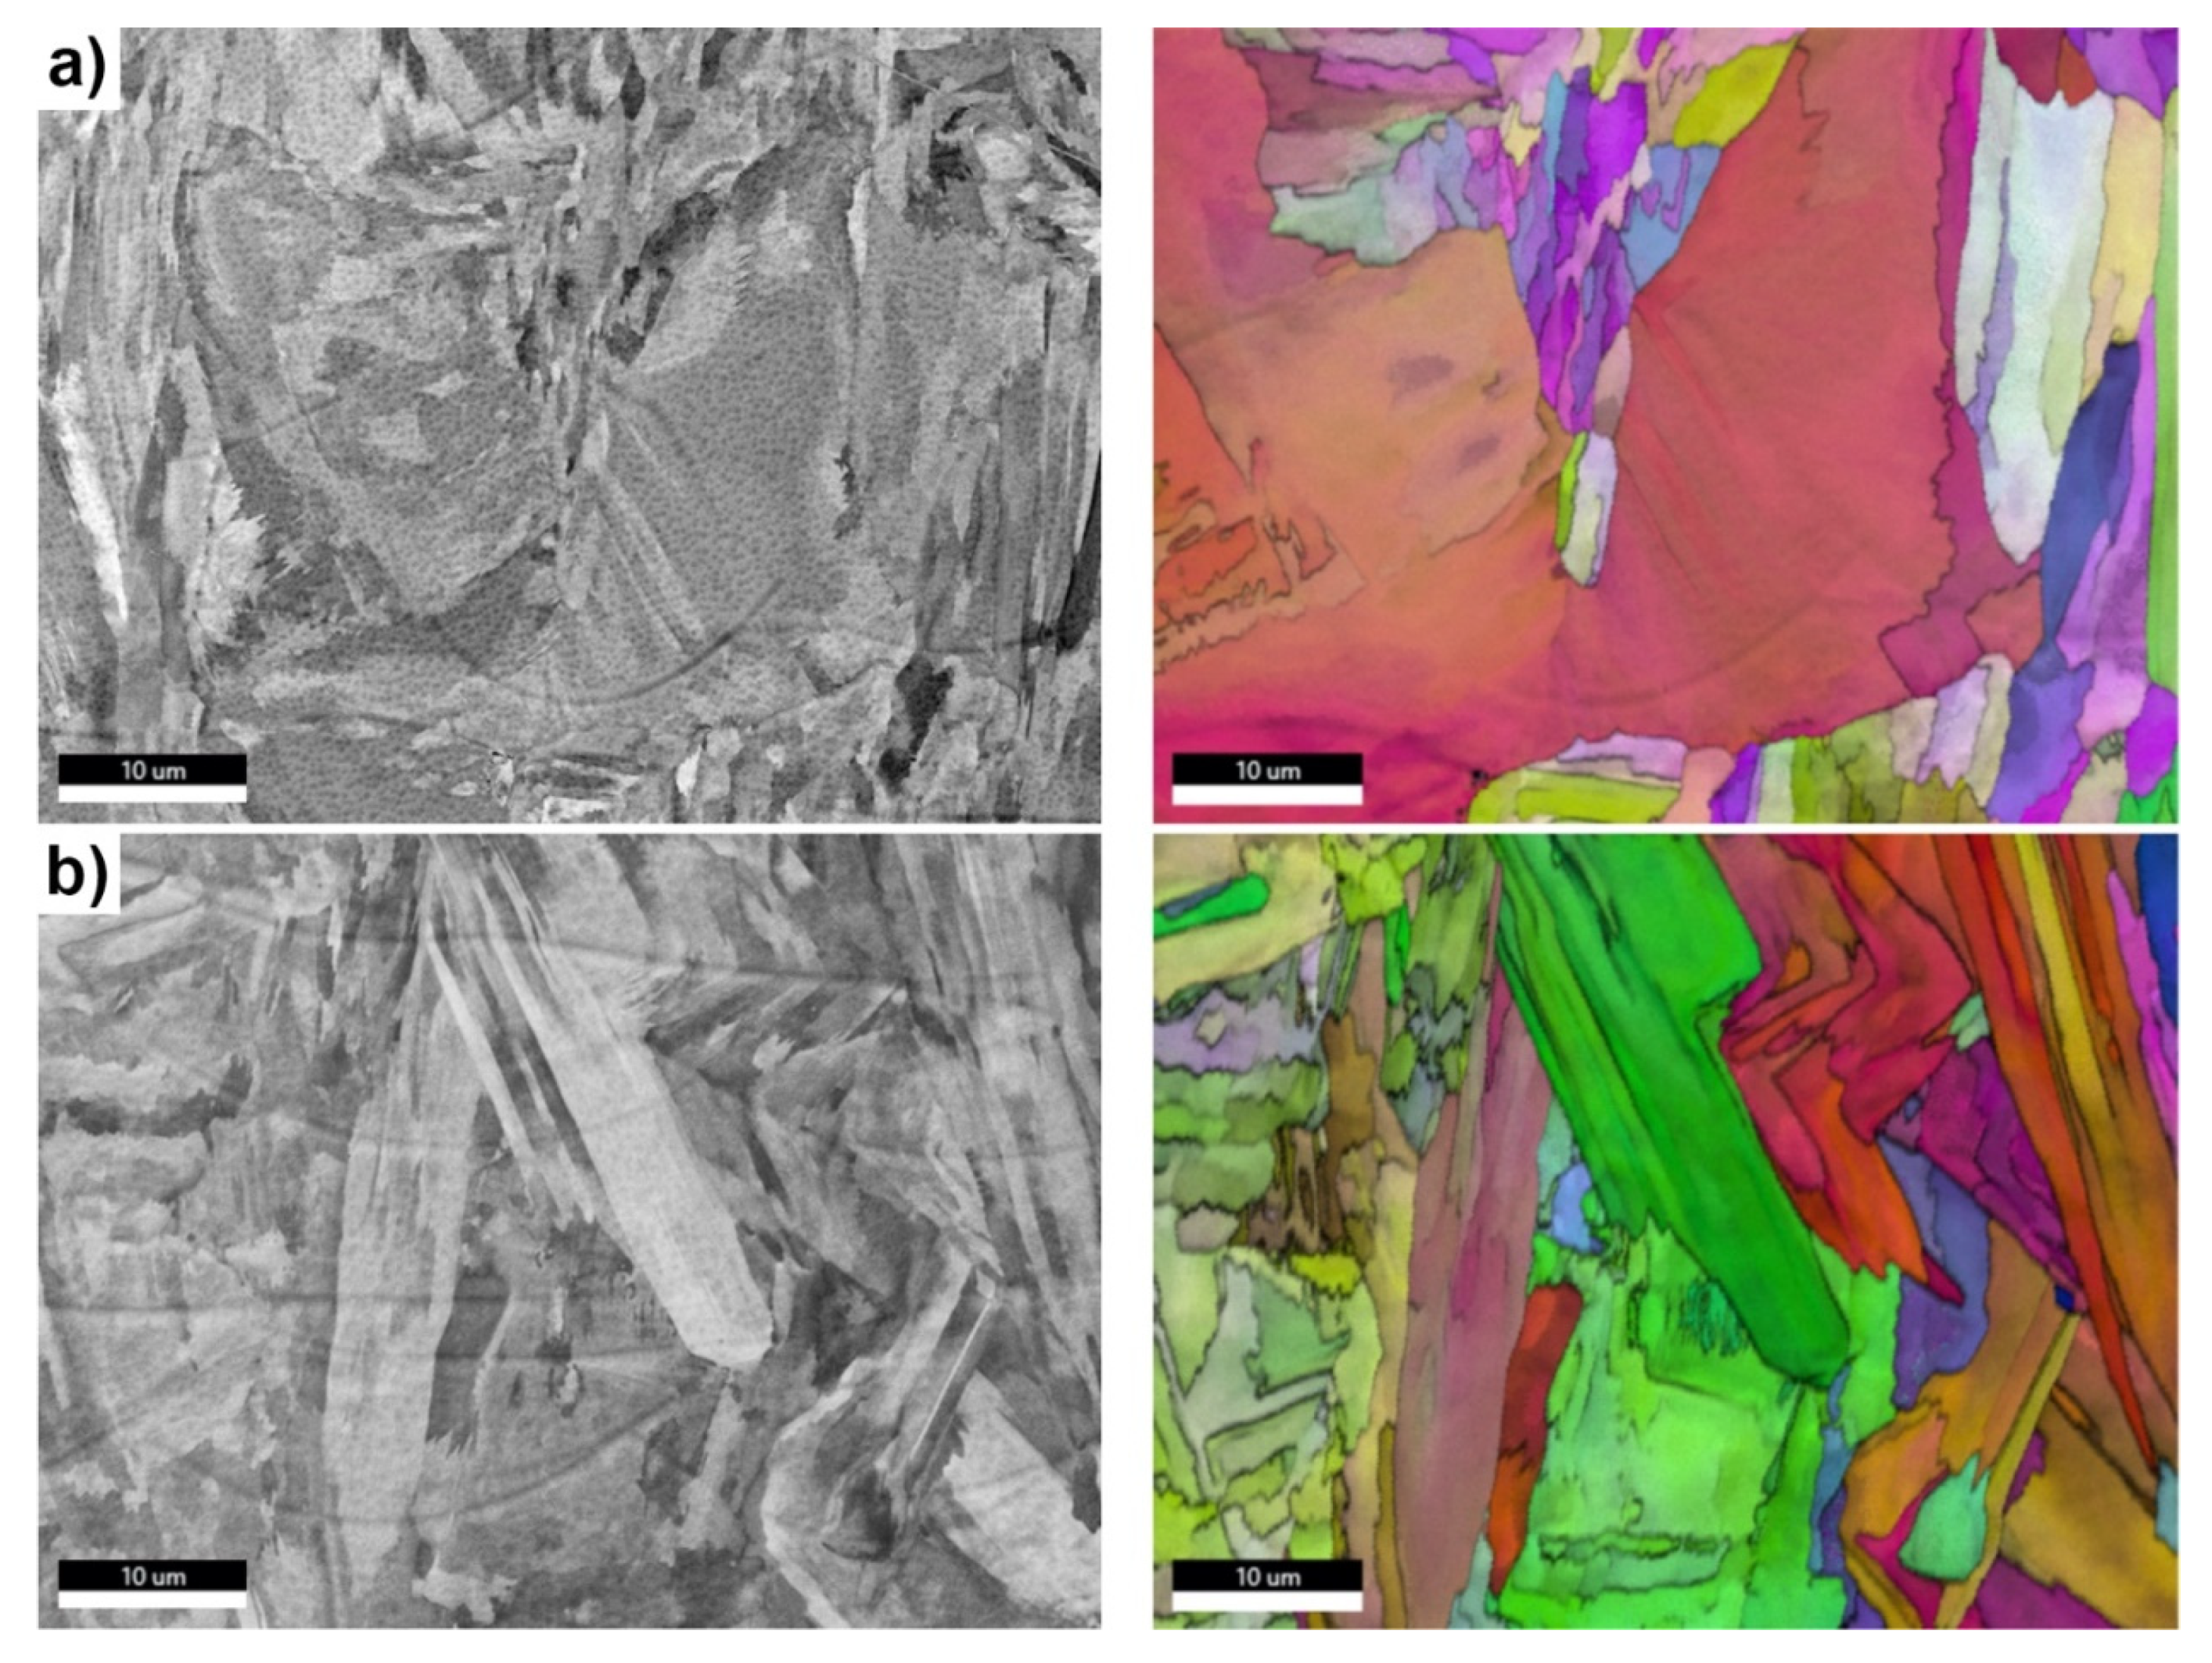
The more we move in the direction of a higher E, the more the grain and sub-grain shapes become similar to conventionally cast structures [44,45]. When we move to a lower E, we begin to notice some grains that have the shape of melt pools and at the same time clusters of nano-dendrites become more noticeable. Backscattered images of selected SLM samples with different process parameters show different grain patterns at low magnification (Figure 7). Sample 2 exhibits a growth direction in the AM building direction, while sample 7 has a typical zigzag growth with macro zigzag boundaries. These microstructure patterns occur with certain combination of SLM parameters. Some minor zigzag growth is also evident in sample 14, which has typical growth in all directions, and the dendrites become finer. Sample 20 has very small dendrites and growth in the build direction; however, here and there crystallization starts in the bottom of the melt pools and the grains follow the melt pool’s shape. Zigzag microstructure pattern is typical for direct energy deposition (DED) inclined towards the scanning direction [46,47].
Figure 8 shows a histogram of the grain size diameter of the four selected samples. Sample 2, produced with the highest E, has many very large grains: around 40% of the area has a grain size diameter of 170 µm and there are no small grains. Samples 7 and 14 have different grain size distributions, even though the same E was applied during the SLM process. Sample 14 has many small grains, but at the same time the largest number (around 50%) of the largest grains (200 µm) was observed. On the other hand, sample 7 has a smaller number of small grains, but a larger number of grains above 100 µm in diameter (approximately 85% of the total area). The low energy input creates small grains with an almost Gaussian distribution of diameters below 70 µm.
3.5. Cellular Structure Analysis
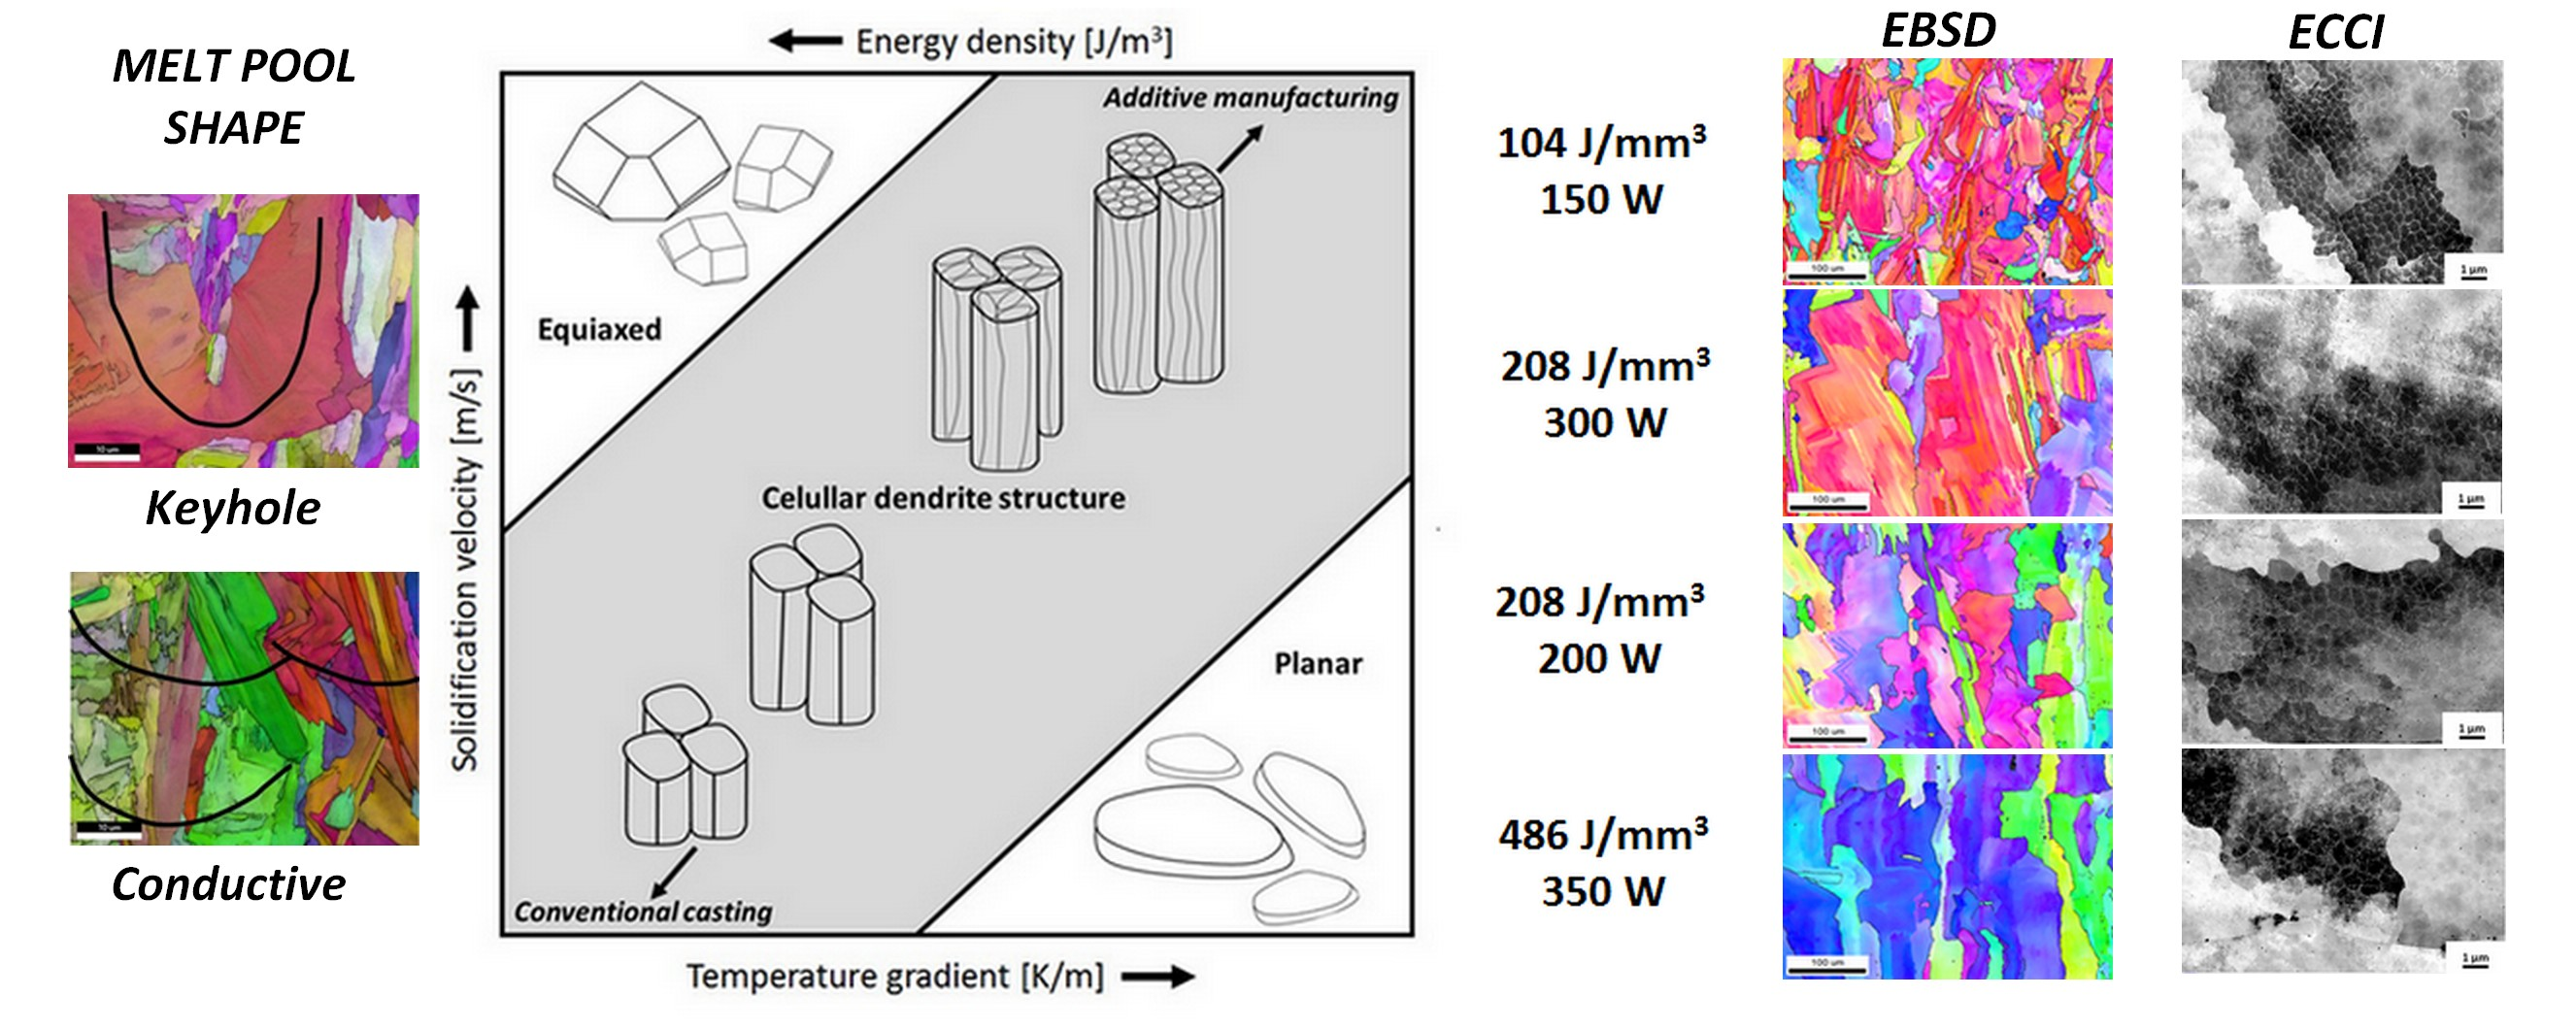
It was already reported that during rapid solidification hierarchical structures are formed [14,22]. Correlative ECCI and EBSD analyses were used to explain the hierarchical structures shown in Figure 9. Figure 9a is an ECCI image with the corresponding EBSD IPF Z image (Figure 9b) and an EBSD unique grain color (UGC) image showing separate grains, where the grain boundaries are larger than 15° (Figure 9c). Each grain consists of a few dendrite sub-grains, the orientations of which are all slightly different, as indicated by the different shades of the same color. A higher magnification (Figure 9d,e) of the same area reveals a substructure where dendrite sub-grains can correlate with the dislocation tubes. Each dendrite sub-grain consists of a few dislocation tubes. This dislocation tubes are well known cellular structures [14,22], the shape of which depend on the sample cut and are actually in most cases dislocation tubes. The solidification conditions, particularly temperature gradient and solidification velocity, define the formation of elongated cells or dislocation tubes. In the ECCI image (Figure 9d) we can observe perpendicular dislocation tubes aligned vertically. Dislocations and nano-oxides [14,22,42] define the tube walls. In Figure 9e the scheme of the hierarchical structure is overlapped with the EBSD image to explain the details. Figure 9f schematically represents each block of hierarchical structure, which is typical for AM metallic materials, and varies depending on the AM parameters. An individual dendrite sub-grain has a difference in misorientation. For instance, the observed grain in Figure 9e has the very left sub-grain (red colored) with an 8° misorientation, while the shades of the orange-colored dendrites’ sub-grains, represented by other sub-grains, have only a minor misorientation (0.5 to 3°). All these variations depend on the local conditions during the solidification.
Figure 10 reveals the typical cellular microstructure of the four differently processed SLM samples from the (ECCI) images. In our case, the dislocation tubes were cut perpendicular or the cells are not elongated. The cells’ diameters are directly related to the E of the SLM process. A larger E results in a larger cell diameter. By increasing E to higher values, the solidification conditions approach those occurring in conventional casting, and therefore we can observe that the dislocation cells are increasing and would eventually vanish, and the size of the dendrites would increase.
The conditions during the SLM processes, i.e., rapid solidification with several remeltings and reheatings due to the building up of the subsequent layers, cause high stresses and consequently the formation of a high dislocation density. There are three possible explanations for the origin of the dislocations. The first is melt pool formation and rapid solidification with the growth of nano-dendrites due to the temperature gradient in the heat-flux direction. This bunch of nano-dendrites grows in general in the radial direction with a slight misorientation, which is compensated during solidification by the formation of dislocations. The second is again due to melt pool formation and rapid solidification. The melt pool has a larger volume compared to the solidifying surroundings and during solidification the newly forming solid matter is affected by the local tensile stress, so large numbers of dislocations are formed. The third origin of the dislocations can be explained by the segregation of the Mo and Cr in the interdendritic areas, which are the last to be solidified. These are the areas of the nano-dendrites and the bunch of nano-dendrites. The SLM process increases the number of dislocations that are created at interdendritic areas as a consequence of the dendrites’ orientation accommodation during rapid solidification.
Figure 11 shows the kernel average misorientation (KAM) of four selected samples. From the images as well as from the KAM calculations there is a clear trend of an increasing dislocation density with a decreasing of E (results in Table 5).
Figure 12 shows a schematic presentation of how the grain size and the shape depend on the solidification conditions. By increasing the energy density the temperature gradient is reduced [43]. At a high solidification velocity and a low temperature gradient an equiaxed grain shape is formed. A high temperature gradient and a low solidification velocity create a planar grain structure. In between, a columnar grain shape is formed (grey area in Figure 12). When we move to AM conditions, a higher solidification velocity and a larger temperature gradient, a cellular dislocation structure is also formed. The SLM parameters are in the columnar area, but by changing the parameters we can obtain an equiaxed grain structure, when isotropic material properties are preferred. By increasing both the solidification velocity and the temperature gradient the conditions are those of an SLM process, while decreasing the velocity and the gradient results in conditions that are closer to conventional casting.
3.6. Hardness
The presented hardness values are listed in Table 6. The hardness values of samples 2 and 14 are very similar, i.e., 196 HV10 and 194 HV10, respectively. The difference is less than 2 HV10, which is in the range of the measurement uncertainty. Low hardness values are correlated with a higher E, which causes tempering during the SLM process on next-layer laser passes. Comparing samples 7 and 14 reveals that P plays a more important role in the tempering process than v. Sample 14 was subjected to more tempering. A lower E causes more stress to remain in the material due to the lower tempering effect resulting from the next laser passes and so results in a higher hardness (227 HV). In a comparison with our higher hardness value, Wang et al. [14] operated with higher P (400 W) and produce material with lower hardness 213 ± 12 HV. Their scanning strategy was 45° rotation, which can be the defined parameter in comparison to our strategy with 33° per layer.
3.7. Mechanical Testing
When comparing three selected samples with different E, sample 14 has the best properties. The lowest tensile strength was measured for sample 7, i.e., 694 MPa. A higher, although similar, value was obtained for sample 20. The yield-strength values for all three samples are from 587 MPa to 604 MPa. The difference between the mechanical properties is less than 5% (Table 7). The SLM process parameters influence the mechanical properties, but in this study, we selected parameters close to optimal, which means the mechanical properties do not differ a great deal. Zhang et al. [34] investigated the mechanical properties of material produced with an E of 150 J/mm3 (P = 100 W, v = 200 mm/s, d = 50 μm). Their tensile strength 692 ± 40, yield strength 457 ± 54 and elongation 28 ± 6 results are very comparable for all our parameter combinations. We confirmed that the average values of the mechanical properties from the literature are also achieved with higher or lower E. Compared to Sanchez-Avila et al. [35] the parameter combination (P = 98.86 W, v = 200 mm/s, d = 200 μm) for our results are similar only to their elongation (26%). It is obvious that for 936 MPa tensile strength and 635 MPa of yield strength, a larger d is the important and necessary parameter.
4. Conclusions
The SLM process parameters were experimentally investigated on a dedicated laboratory device. The laser’s power, scanning speed and focal diameter were varied to obtain the parameters for improved mechanical properties. Based on the present study, the following conclusions can be drawn:
- A higher energy density leads to a larger cellular structure and larger grains. A lower energy density created some grains with melt pool shapes and at the same time clusters of nano-dendrites were more noticeable in the EBSD micrographs. The SLM parameters also have an impact on the growth direction. At high energy, the growth is parallel, changing to zigzag at moderate energy. Specific parameters promote growth in all directions, while a lower energy again makes the growth parallel to the build direction. A lower energy causes a sporadic start to the crystallization at the melt pool boundaries; therefore, in the EBSD maps, the melt pool patterns become more visible.
- A specific SLM process produces different textures, with only a single main texture component. It was observed that with a lower energy density (samples 14 and 20) the textures were associated with the basic cube texture component.
- Specific SLM parameters lead to macro zigzag boundaries. The dislocation density increased with a decrease in the energy density.
- The created process windows, based on the LM micrographs and the calculated porosity, prove that the most appropriate working parameters are in the middle for all the investigated laser powers and scanning speeds (250 W and 600 mm/s).
- Some parameters (350 W, 400 mm/s and 60 µm) resulted in a small porosity and a good hardness, but they were not appropriate for processing the quad shape for the tensile tests.
- The combination of a low laser power and a low scanning speed resulted in the highest hardness value (227 HV10).
- With the three selected parameter combinations and the hatching strategy for AISI 316L, a high tensile strength (711 MPa), yield strength (604 MPa) and elongation (31%) were achieved.
- We proposed three different origins for the dislocations, which should be confirmed with additional studies and experiments.
To obtain the optimum properties, it is crucial to optimize the process parameters on each SLM device so that the desired mechanical properties can be achieved. By varying the process parameters, the texture, size and shape of the grains, as well as the dislocation cell structure changes. With SLM laboratory equipment, a lot of parameters can be changed easily, leading to the rapid optimization of SLM process parameters, which are crucial for tailored mechanical properties.
Author Contributions
Data curation, Č.D., J.K. and I.P.; formal analysis, Č.D.; funding acquisition, M.G.; investigation, Č.D., J.K. and I.P.; project administration, M.G.; supervision, M.G.; writing—original draft, J.K.; writing—review and editing, Č.D., I.P. and M.G. All authors have read and agreed to the published version of the manuscript.
Funding
The authors acknowledge the financial support from the Slovenian Research Agency (research core funding No. P2-0132).
Conflicts of Interest
The authors declare no conflict of interest.
References
- Bajaj, P.; Hariharan, A.; Kini, A.; Kürnsteiner, P.; Raabe, D.; Jägle, E.A. Steels in additive manufacturing: A review of their microstructure and properties. Mater. Sci. Eng. A 2020, 772, 138633. [Google Scholar] [CrossRef]
- Şahin, S.; Übeyli, M. A review on the potential use of austenitic stainless steels in nuclear fusion reactors. J. Fusion Energy 2008, 27, 271–277. [Google Scholar] [CrossRef]
- Peroni, L.; Scapin, M.; Fichera, C.; Lehmhus, D.; Weise, J.; Baumeister, J.; Avalle, M. Investigation of the mechanical behaviour of AISI 316L stainless steel syntactic foams at different strain-rates. Compos. Part B Eng. 2014, 66, 430–442. [Google Scholar] [CrossRef]
- Tiwari, S.K.; Mishra, T.; Gunjan, M.K.; Bhattacharyya, A.S.; Singh, T.B.; Singh, R. Development and characterization of sol-gel silica-alumina composite coatings on AISI 316L for implant applications. Surf. Coat. Technol. 2007, 201, 7582–7588. [Google Scholar] [CrossRef]
- Núñez, P.J.; García-Plaza, E.; Hernando, M.; Trujillo, R. Characterization of surface finish of electropolished stainless steel AISI 316L with varying electrolyte concentrations. Procedia Eng. 2013, 63, 771–778. [Google Scholar] [CrossRef] [Green Version]
- Herzog, D.; Seyda, V.; Wycisk, E.; Emmelmann, C. Additive manufacturing of metals. Acta Mater. 2016, 117, 371–392. [Google Scholar] [CrossRef]
- Stern, A.; Rosenthal, Y.; Dresler, N.; Ashkenazi, D. Additive manufacturing: An education strategy for engineering students. Addit. Manuf. 2019, 27, 503–514. [Google Scholar] [CrossRef]
- DebRoy, T.; Wei, H.L.; Zuback, J.S.; Mukherjee, T.; Elmer, J.W.; Milewski, J.O.; Beese, A.M.; Wilson-Heid, A.; De, A.; Zhang, W. Additive manufacturing of metallic components—Process, structure and properties. Prog. Mater. Sci. 2018, 92, 112–224. [Google Scholar] [CrossRef]
- Culmone, C.; Smit, G.; Breedveld, P. Additive manufacturing of medical instruments: A state-of-the-art review. Addit. Manuf. 2019, 27, 461–473. [Google Scholar] [CrossRef]
- Trivedi, M.; Jee, J.; Silva, S.; Blomgren, C.; Pontinha, V.M.; Dixon, D.L.; Van Tassel, B.; Bortner, M.J.; Williams, C.; Gilmer, E.; et al. Additive manufacturing of pharmaceuticals for precision medicine applications: A review of the promises and perils in implementation. Addit. Manuf. 2018, 23, 319–328. [Google Scholar] [CrossRef]
- Lyczkowska-Widlak, E.; Lochynski, P.; Nawrat, G.; Chlebus, E. Comparison of electropolished 316L steel samples manufactured by SLM and traditional technology. Rapid Prototyp. J. 2019, 25, 566–580. [Google Scholar] [CrossRef]
- Sun, J.; Shen, L.; Wang, W.; Liu, Z.; Chen, H.; Duan, J. Study of Microstructure and Properties of 316L with Selective Laser Melting Based on Multivariate Interaction Influence. Adv. Mater. Sci. Eng. 2020, 2020, 8404052. [Google Scholar] [CrossRef] [Green Version]
- Kempen, K.; Thijs, L.; Yasa, E.; Badrossamay, M.; Verheecke, W.; Kruth, J.P. Process optimization and microstructural analysis for selective laser melting of AlSi10Mg. In Proceedings of the Solid Freeform Fabrication Symposium, Austin, TX, USA, 8–10 August 2011. [Google Scholar]
- Wang, Y.M.; Voisin, T.; McKeown, J.T.; Ye, J.; Calta, N.P.; Li, Z.; Zeng, Z.; Zhang, Y.; Chen, W.; Roehling, T.T.; et al. Additively manufactured hierarchical stainless steels with high strength and ductility. Nat. Mater. 2018, 17, 63–70. [Google Scholar] [CrossRef] [PubMed] [Green Version]
- Aoyagi, K.; Wang, H.; Sudo, H.; Chiba, A. Simple method to construct process maps for additive manufacturing using a support vector machine. Addit. Manuf. 2019, 27, 353–362. [Google Scholar] [CrossRef]
- Kale, A.B.; Kim, B.K.; Kim, D.I.; Castle, E.G.; Reece, M.; Choi, S.H. An investigation of the corrosion behavior of 316L stainless steel fabricated by SLM and SPS techniques. Mater. Charact. 2020, 163, 110204. [Google Scholar] [CrossRef]
- Donik, Č.; Kocijan, A.; Paulin, I.; Hočevar, M.; Gregorčič, P.; Godec, M. Improved biodegradability of Fe–Mn alloy after modification of surface chemistry and topography by a laser ablation. Appl. Surf. Sci. 2018, 453, 383–393. [Google Scholar] [CrossRef] [Green Version]
- Tenbrock, C.; Fischer, F.G.; Wissenbach, K.; Schleifenbaum, J.H.; Wagenblast, P.; Meiners, W.; Wagner, J. Influence of keyhole and conduction mode melting for top-hat shaped beam profiles in laser powder bed fusion. J. Mater. Process. Technol. 2020, 278, 116514. [Google Scholar] [CrossRef]
- Li, R.; Shi, Y.; Wang, Z.; Wang, L.; Liu, J.; Jiang, W. Densification behavior of gas and water atomized 316L stainless steel powder during selective laser melting. Appl. Surf. Sci. 2010, 256, 4350–4356. [Google Scholar] [CrossRef]
- Andreau, O.; Koutiri, I.; Peyre, P.; Penot, J.D.; Saintier, N.; Pessard, E.; De Terris, T.; Dupuy, C.; Baudin, T. Texture control of 316L parts by modulation of the melt pool morphology in selective laser melting. J. Mater. Process. Technol. 2019, 264, 21–31. [Google Scholar] [CrossRef] [Green Version]
- Griffiths, S.; Rossell, M.D.; Croteau, J.; Vo, N.Q.; Dunand, D.C.; Leinenbach, C. Effect of laser rescanning on the grain microstructure of a selective laser melted Al-Mg-Zr alloy. Mater. Charact. 2018, 143, 34–42. [Google Scholar] [CrossRef]
- Godec, M.; Zaefferer, S.; Podgornik, B.; Šinko, M.; Tchernychova, E. Quantitative multiscale correlative microstructure analysis of additive manufacturing of stainless steel 316L processed by selective laser melting. Mater. Charact. 2020, 160, 110074. [Google Scholar] [CrossRef]
- Godec, M.; Donik, C.; Kocijan, A.; Podgornik, B.; Skobir Balantič, D.A. Effect of post-treated low-temperature plasma nitriding on the wear and corrosion resistance of 316L stainless steel manufactured by laser powder-bed fusion. Addit. Manuf. 2020, 32, 101000. [Google Scholar] [CrossRef]
- Sun, Z.; Tan, X.; Tor, S.B.; Chua, C.K. Simultaneously enhanced strength and ductility for 3D-printed stainless steel 316L by selective laser melting. NPG Asia Mater. 2018, 10, 127–136. [Google Scholar] [CrossRef]
- Sun, S.H.; Hagihara, K.; Nakano, T. Effect of scanning strategy on texture formation in Ni-25 at.%Mo alloys fabricated by selective laser melting. Mater. Des. 2018, 140, 307–316. [Google Scholar] [CrossRef]
- Kurzynowski, T.; Stopyra, W.; Gruber, K.; Ziólkowski, G.; Kuznicka, B.; Chlebus, E. Effect of scanning and support strategies on relative density of SLM-ed H13 steel in relation to specimen size. Materials 2019, 12, 239. [Google Scholar] [CrossRef] [Green Version]
- Zhong, Y. Sub-Grain Structure in Additive Manufactured Stainless Steel 316L. Ph.D. Thesis, Stockholm University, Stockholm, Sweden, 2017. [Google Scholar]
- Zhong, Y.; Liu, L.; Wikman, S.; Cui, D.; Shen, Z. Intragranular cellular segregation network structure strengthening 316L stainless steel prepared by selective laser melting. J. Nucl. Mater. 2016, 470, 170–178. [Google Scholar] [CrossRef]
- Marbury, F. Characterization of SLM Printed 316L Stainless Steel and Investigation of Micro Lattice Geometry; California Polytechnic State University: San Luis Obispo, CA, USA, 2017. [Google Scholar]
- Fang, T.H.; Li, W.L.; Tao, N.R.; Lu, K. Revealing extraordinary intrinsic tensile plasticity in gradient nano-grained copper. Science 2011, 311, 1587–1590. [Google Scholar] [CrossRef] [Green Version]
- Wu, X.; Yang, M.; Yuan, F.; Wu, G.; Wei, Y.; Huang, X.; Zhu, Y. Heterogeneous lamella structure unites ultrafine-grain strength with coarse-grain ductility. Proc. Natl. Acad. Sci. USA 2015, 112, 14501–14505. [Google Scholar] [CrossRef] [Green Version]
- Wei, Y.; Li, Y.; Zhu, L.; Liu, Y.; Lei, X.; Wang, G.; Wu, Y.; Mi, Z.; Liu, J.; Wang, H.; et al. Evading the strength-ductility trade-off dilemma in steel through gradient hierarchical nanotwins. Nat. Commun. 2014, 5, 1–8. [Google Scholar] [CrossRef] [Green Version]
- Xu, X.; Ganguly, S.; Ding, J.; Guo, S.; Williams, S.; Martina, F. Microstructural evolution and mechanical properties of maraging steel produced by wire + arc additive manufacture process. Mater. Charact. 2018, 143, 152–162. [Google Scholar] [CrossRef]
- Zhang, K.; Guo, X.; Sun, L.; Meng, X.; Xing, Y. Fabrication of coated tool with femtosecond laser pretreatment and its cutting performance in dry machining SLM-produced stainless steel. J. Manuf. Process. 2019, 42, 28–40. [Google Scholar] [CrossRef]
- Sánchez-Ávila, D.; Barea, R.; Martínez, E.; Blasco, J.R.; Portolés, L.; Carreño, F. Determination of the instantaneous strain rate during small punch testing of 316 L stainless steel. Int. J. Mech. Sci. 2018, 149, 93–100. [Google Scholar] [CrossRef]
- Montero-Sistiaga, M.L.; Godino-Martinez, M.; Boschmans, K.; Kruth, J.P.; Van Humbeeck, J.; Vanmeensel, K. Microstructure evolution of 316L produced by HP-SLM (high power selective laser melting). Addit. Manuf. 2018, 23, 402–410. [Google Scholar] [CrossRef]
- Yakout, M.; Elbestawi, M.A.; Veldhuis, S.C. Density and mechanical properties in selective laser melting of Invar 36 and stainless steel 316L. J. Mater. Process. Technol. 2019, 266, 397–420. [Google Scholar] [CrossRef]
- Leicht, A.; Rashidi, M.; Klement, U.; Hryha, E. Effect of process parameters on the microstructure, tensile strength and productivity of 316L parts produced by laser powder bed fusion. Mater. Charact. 2020, 159, 110016. [Google Scholar] [CrossRef]
- Leicht, A.; Klement, U.; Hryha, E. Effect of build geometry on the microstructural development of 316L parts produced by additive manufacturing. Mater. Charact. 2018, 143, 137–143. [Google Scholar] [CrossRef]
- Dai, D.; Gu, D. Tailoring surface quality through mass and momentum transfer modeling using a volume of fluid method in selective laser melting of TiC/AlSi10Mg powder. Int. J. Mach. Tools Manuf. 2015, 88, 95–107. [Google Scholar] [CrossRef]
- Khairallah, S.A.; Anderson, A.T.; Rubenchik, A.; King, W.E. Laser powder-bed fusion additive manufacturing: Physics of complex melt flow and formation mechanisms of pores, spatter, and denudation zones. Acta Mater. 2016, 108, 36–45. [Google Scholar] [CrossRef] [Green Version]
- Yan, F.; Xiong, W.; Faierson, E.J. Grain Structure Control of Additively Manufactured Metallic Materials. Materials 2017, 10, 1260. [Google Scholar] [CrossRef] [Green Version]
- Ning, J.; Sievers, D.E.; Garmestani, H.; Liang, S.Y. Analytical Thermal Modeling of Metal Additive Manufacturing by Heat Sink Solution. Materials 2019, 12, 2568. [Google Scholar] [CrossRef] [Green Version]
- Wang, Y.; Yu, C.; Xing, L.; Li, K.; Chen, J.; Liu, W.; Ma, J.; Shen, Z. Grain structure and texture of the SLM single track. J. Mater. Process. Technol. 2020, 281, 116591. [Google Scholar] [CrossRef]
- Kou, S. Welding Metallurgy, 2nd ed.; Wiley: New York, NY, USA, 2003; ISBN 978-0-471-46093-0. [Google Scholar]
- Parimi, L.L.; Ravi, G.; Clark, D.; Attallah, M.M. Microstructural and texture development in direct laser fabricated IN718. Mater. Charact. 2014, 89, 102–111. [Google Scholar] [CrossRef]
- Lian, Y.; Gan, Z.; Yu, C.; Kats, D.; Liu, W.K.; Wagner, G.J. A cellular automaton finite volume method for microstructure evolution during additive manufacturing. Mater. Des. 2019, 169, 107672. [Google Scholar] [CrossRef]
Figure 1.
AconityMINI laboratory selective laser melting (SLM) equipment with an enlarged image of the working chamber.
Figure 1.
AconityMINI laboratory selective laser melting (SLM) equipment with an enlarged image of the working chamber.

Figure 2.
Processed shapes with the building direction bottom up: (a) cube; (b) cylinder; (c) quad.

Figure 3.
Scanning electron microscopy (SEM) image of initial AISI 316L powder.

Figure 4.
Process windows based on light microscopy (LM) micrographs with different laser focal diameters: (a) d = 60 mm and (b) d = 80 mm.
Figure 4.
Process windows based on light microscopy (LM) micrographs with different laser focal diameters: (a) d = 60 mm and (b) d = 80 mm.

Figure 5.
Electron-backscattered diffraction (EBSD) inverse pole figures in the Z-direction IPF Z micrographs and Euler pole figures (001), (110) and (111) of selected SLM parameters: for (a) sample 2; (b) sample 7; (c) sample 14 and (d) sample 20. Grain boundaries over 15° are marked with black lines. Image view is parallel to the build direction—bottom to top.

Figure 6.
Backscattered-electron image of different melt pool shapes and an EBSD IPF Z map micrograph: (a) is a keyhole-shaped melt pool (sample 7) and (b) is a conductive-shaped melt pool (sample 20). Image view is parallel to build direction—bottom to top.
Figure 6.
Backscattered-electron image of different melt pool shapes and an EBSD IPF Z map micrograph: (a) is a keyhole-shaped melt pool (sample 7) and (b) is a conductive-shaped melt pool (sample 20). Image view is parallel to build direction—bottom to top.

Figure 7.
Backscattered images of selected SLM samples with different process parameters: (a) sample 2; (b) sample 7; (c) sample 14 and (d) sample 20. Image view is parallel to the build direction—bottom to top.
Figure 7.
Backscattered images of selected SLM samples with different process parameters: (a) sample 2; (b) sample 7; (c) sample 14 and (d) sample 20. Image view is parallel to the build direction—bottom to top.

Figure 8.
Grain size histograms of selected additive manufacturing (AM) SLM parameters for samples 2, 7, 14 and 20.
Figure 8.
Grain size histograms of selected additive manufacturing (AM) SLM parameters for samples 2, 7, 14 and 20.

Figure 9.
Explanation of the hierarchical structure: (a) correlation of SEM electron channeling contrast imaging (ECCI) image with (b) EBSD image and (c) corresponding marked dendrite grains (unique grain color, UGC); (d) ECCI of dendrite sub-grains with dislocation tubes and nano-oxides; (e) with correlated EBSD image of ECCI image (d) and (f) scheme of hierarchical structure with legend of building blocks.

Figure 10.
ECCI for selected AM parameters at two different magnifications 25 k and 100 k: (a) sample 2; (b) sample 7; (c) sample 14 and (d) sample 20.
Figure 10.
ECCI for selected AM parameters at two different magnifications 25 k and 100 k: (a) sample 2; (b) sample 7; (c) sample 14 and (d) sample 20.

Figure 11.
Kernel average misorientation (KAM) images of selected AM parameters: (a) sample 2; (b) sample 7; (c) sample 14 and (d) sample 20.
Figure 11.
Kernel average misorientation (KAM) images of selected AM parameters: (a) sample 2; (b) sample 7; (c) sample 14 and (d) sample 20.

Figure 12.
Schematic presentation of the impact of temperature gradient and solidification velocity on the microstructure.
Figure 12.
Schematic presentation of the impact of temperature gradient and solidification velocity on the microstructure.


Table 1.
Selective laser melting (SLM) operating parameters. Samples studied in detail are marked in bold.
Table 1.
Selective laser melting (SLM) operating parameters. Samples studied in detail are marked in bold.
| Sample | Laser Power P (W) | Scanning Speed v (mm/s) | Focal Diameter d (μm) | Energy Density E (J/mm3) |
|---|---|---|---|---|
| 1 | 350 | 400 | 80 | 364 |
| 2 | 350 | 400 | 60 | 486 |
| 3 | 300 | 400 | 80 | 312 |
| 4 | 300 | 400 | 60 | 417 |
| 5 | 250 | 400 | 80 | 260 |
| 6 | 250 | 400 | 60 | 347 |
| 7 | 200 | 400 | 80 | 208 |
| 8 | 200 | 400 | 60 | 278 |
| 9 | 350 | 800 | 80 | 182 |
| 10 | 350 | 800 | 60 | 243 |
| 11 | 150 | 400 | 80 | 156 |
| 12 | 300 | 800 | 80 | 156 |
| 13 | 150 | 400 | 60 | 208 |
| 14 | 300 | 800 | 60 | 208 |
| 15 | 250 | 800 | 80 | 130 |
| 16 | 250 | 800 | 60 | 174 |
| 17 | 200 | 800 | 80 | 104 |
| 18 | 200 | 800 | 60 | 139 |
| 19 | 150 | 800 | 80 | 78 |
| 20 | 150 | 800 | 60 | 104 |
Table 2.
Chemical composition in wt %, obtained by Induced coupled plasma optical emission spectroscopy (ICP OES), of the AISI 316 L powder.
Table 2.
Chemical composition in wt %, obtained by Induced coupled plasma optical emission spectroscopy (ICP OES), of the AISI 316 L powder.
| Elements | C | Si | Mn | Cr | Ni | Mo | Fe |
|---|---|---|---|---|---|---|---|
| wt % | 0.006 | 0.22 | 1.6 | 17.7 | 13.6 | 2.8 | balance |
Table 3.
Physical properties of the feedstock powder.
| Material | Flow Rate (g/s) | Angle of Repose (°) | Apparent Density (g/cm3) | Tap Density (g/cm3) |
|---|---|---|---|---|
| AISI 316L Powder | 3.0 ± 0.7 | 44 ± 2 | 4.59 ± 0.01 | 4.82 ± 0.03 |
Table 4.
Porosity measurements for different energy densities.
| Sample/ (E (J/mm3)) | Porosity (%) | Pore Density (mm−2) | Largest Pore (µm) |
|---|---|---|---|
| 2/(486) | 0.03 ± 0.01 | 120 ± 3 | 13 ± 1 |
| 7/(208) | 0.02 ± 0.01 | 38 ± 6 | 14.3 ± 0.5 |
| 14/(208) | 0.02 ± 0.01 | 44 ± 5 | 9 ± 1 |
| 20/(104) | 0.45 ± 0.01 | 256 ± 2 | 105 ± 8 |
Table 5.
Quantitative microstructural properties measured and those calculated from the scanning electron microscopy (SEM) results.
Table 5.
Quantitative microstructural properties measured and those calculated from the scanning electron microscopy (SEM) results.
| Sample/ (E (J/mm3)) | Average Grain Size Diameter (µm) | Average Diameter of Single Cell (µm) | Geometrically Necessary Dislocation Density 1013 (m−2) | Total Boundary Length (5°–15°) (mm) | Total Boundary Length (15°–65°) (mm) | Boundary Density (5°–65°) (mm−1) |
|---|---|---|---|---|---|---|
| 2/(486) | 26 ± 2 | 0.6 ± 0.2 | 5.1 ± 0.2 | 4.4 ± 0.3 | 5.1 ± 0.3 | 65 ± 3 |
| 7/(208) | 19 ± 2 | 0.5 ± 0.1 | 6.0 ± 0.2 | 4.4 ± 0.2 | 5.2 ± 0.2 | 67 ± 3 |
| 14/(208) | 13 ± 1 | 0.4 ± 0.1 | 5.7 ± 0.3 | 9.2 ± 0.4 | 6.3 ± 0.3 | 107 ± 5 |
| 20/(104) | 10 ± 1 | 0.3 ± 0.1 | 6.1 ± 0.3 | 14.4 ± 0.4 | 20.9 ± 0.6 | 242 ± 7 |
Table 6.
Hardness measurements with added SLM process parameters.
| Sample | Hardness (HV10) | Laser Power P (W) | Energy Density E (J/mm3) |
|---|---|---|---|
| 2 | 196 ± 6 | 350 | 486 |
| 7 | 207 ± 4 | 200 | 208 |
| 14 | 194 ± 3 | 300 | 208 |
| 20 | 227 ± 3 | 150 | 104 |
Table 7.
Results of the tensile tests.
| Sample/ (E (J/mm3)) | Tensile Strength (MPa) | Yield Strength (MPa) | Elongation (%) |
|---|---|---|---|
| 7/(208) | 694 ± 3 | 587 ± 5 | 29 ± 1.7 |
| 14/(208) | 711 ± 4 | 604 ± 2 | 31 ± 2.4 |
| 20/(104) | 700 ± 2 | 597 ± 3 | 29 ± 2.6 |
© 2020 by the authors. Licensee MDPI, Basel, Switzerland. This article is an open access article distributed under the terms and conditions of the Creative Commons Attribution (CC BY) license (http://creativecommons.org/licenses/by/4.0/).
Share and Cite
MDPI and ACS Style
Donik, Č.; Kraner, J.; Paulin, I.; Godec, M. Influence of the Energy Density for Selective Laser Melting on the Microstructure and Mechanical Properties of Stainless Steel. Metals 2020, 10, 919. https://doi.org/10.3390/met10070919
AMA Style
Donik Č, Kraner J, Paulin I, Godec M. Influence of the Energy Density for Selective Laser Melting on the Microstructure and Mechanical Properties of Stainless Steel. Metals. 2020; 10(7):919. https://doi.org/10.3390/met10070919
Chicago/Turabian StyleDonik, Črtomir, Jakob Kraner, Irena Paulin, and Matjaž Godec. 2020. "Influence of the Energy Density for Selective Laser Melting on the Microstructure and Mechanical Properties of Stainless Steel" Metals 10, no. 7: 919. https://doi.org/10.3390/met10070919
Note that from the first issue of 2016, this journal uses article numbers instead of page numbers. See further details here.