Impact of Precipitate Morphology on the Dissolution and Grain-Coarsening Behavior of a Ti-Nb Microalloyed Linepipe Steel


1
Ferrous Physical Metallurgy Group, University of Pittsburgh, Pittsburgh, PA 15261, USA
2
United States Steel Corporation, Pittsburgh, PA 15120, USA
*
Author to whom correspondence should be addressed.
Metals 2020, 10(1), 89; https://doi.org/10.3390/met10010089
Submission received: 28 November 2019
/
Revised: 31 December 2019
/
Accepted: 1 January 2020
/
Published: 4 January 2020
(This article belongs to the Special Issue High-Strength Low-Alloy Steels)
Abstract
:The relationship between precipitate morphology and dissolution on grain coarsening behavior was studied in two Ti-Nb microalloyed Linepipe (LP) Steels. The developed understanding highlights the importance of the complex relationship between precipitate constitutive make-up, dissolution mechanism and grain boundary (GB) pinning force. Equilibrium-based empirical solubility products were used to calculate precipitate volume fractions and compared to experimental measurements. Scanning Electron Microscopy (SEM), Electron Backscatter Diffraction (EBSD) and Electron Probe Micro-Analysis (EPMA) were conducted on bulk samples. Transmission Electron Microscopy (TEM)-based techniques were used on C-replica extractions and thin-foils. A retardation in the grain-coarsening temperature compared to the predicted coarsening temperature based on equilibrium calculations was noticed. In addition, a consistent NbC epitaxial formation over pre-existing TiN was observed. The resulting reduction in total precipitate/matrix interface area and the low energy of the TiN/NbC interface are pointed to as responsible mechanisms for the retardation in the kinetics of precipitates’ dissolution. This dissolution retardation mechanism suggests that a lower Nb content might be effective in controlling the grain coarsening behavior of austenite.

1. Introduction
The understanding of the dissolution and re-precipitation of Nb, Ti and or Ti-Nb carbo-nitrides during the high-temperature processing of austenite is of essential importance for the microstructural refinement of austenite. During the hot deformation of High-Strength Low-Alloy (HSLA) steel, there are a series of well-known steps; (1) reheating, (2) roughing deformation, and (3) finishing deformation. This paper focuses on the impact of the precipitate composition and morphology on two crucial aspects: precipitate dissolution and control of the grain-coarsening behavior of austenite. All are applied to the reheating of a Ti-Nb microalloyed linepipe steel.
The purpose of this work was to study the feasibility of producing similar as-reheated austenitic grain size using two steels with different Nb levels at constant Ti content. The impact of simple precipitation morphology on the grain-coarsening behavior of austenite during reheating follows the kinetics of precipitation dissolution. However, when the morphology of the precipitates is more complex, the dissolution of the precipitates does not follow the standard equilibrium predictions.
It is well-known that the type of precipitation species and precipitation stability are key for Prior-Austenite Grain Size (PAGS) control. Precipitates exert pinning forces on GBs, limiting their mobility [1,2,3,4,5,6]. Hence, when precipitates dissolve or coarsen, GBs detach from them and grain coarsening occurs. This gives importance to the dissolution of particles and the factors that affect it.
Previous research by Gong et al. have shown the higher stability of Nb-Ti carbo-nitrides as compared to Nb-only carbo-nitrides [7]. Gong’s work points out the faster dissolution rate of NbC as compared to TiNb-CN as the reason for this behavior, without considering the structural make-up of the particles as a factor. Gong et al. also point out that PAGS must be calculated considering solute drag effects to get accurate predictions. In a work by Ringer et al, precipitate shape has been proposed as a factor of the GB-pinning force [8]. It is suggested that, in the process of unpinning, the precipitate must first rotate to acquire coherency with the new grain, delaying grain growth in the process. Shape is a clear difference when comparing NbTi carbonitride cuboidal precipitates to Nb-only carbonitrides of more rounded shape. NbC has previously been reported to nucleate at pre-existing TiN [9,10,11]. If this heterogeneous formation of NbC on TiN particles happens during casting, as suggested by several authors [11,12], the dissolution process during reheating could be retarded. Slower dissolution kinetics, for instance, can be utilized for better PAGS control with lower levels of microalloying elements. Research has already shown epitaxial NbC on TiN as an effective precipitate for grain size control [13,14].
The complexity of TiN-NbC particles’ morphology and composition may slow down dissolution kinetics. The stability of NbC interfaces to TiN and TiC has been studied using ab initio calculations; researchers have shown how the NbC/TiC interface is the most stable [15]. They report a smaller mismatch of the NbC/TiC interface when compared to the NbC/TiN interface, as well as a lower interface energy 0.75 J·m−2, 3.6 times smaller than the NbC/TiN interface. This means that as the core-particle loses N and gains C, coherency improves between the layers. Hence, the interface between these two compounds stabilizes as they interdiffuse.
Not-complex particles may dissolve first. Then, microalloy elements in solution can interact with GB by forming solute-rich atmospheres around them. These atmospheres lower GB energy, reducing GB mobility and producing the well-known solute-drag effect.
The major goal of this work was to compare and understand the impact of the precipitate morphology and dissolution behavior on grain coarsening in an HSLA-LP steel.
2. Materials and Methods
The two alloys in Table 1 were studied. The Nb content was the only contrast in chemical composition. The alloys were produced as lab-heats at a partner industrial facility, hot-rolled down to 19 mm thickness and air-cooled. The chemical composition was provided by our partner steelmaking laboratory through Inductively Coupled Plasma Mass Spectroscopy. The initial hot rolled microstructure for both steels was Ferrite (F) and Pearlite (P).
By assuming equilibrium conditions, the empirical solubility products of the possible precipitates can be used to find their correspondent volume fraction, fv. Volume fraction was obtained as a function of temperature, based on the chemical compositions. A model that considers the mutual solubility of carbonitride was compared to a simple-precipitates model. See Appendix A and Appendix B for details.
Austenitization was done in vacuum quartz capsules containing one piece of each alloy. The capsules were austenitized to 1150, 1200, 1250 and 1300 °C for 1 h, then water quenched. The resulting specimens were cut in half, so half was used for Prior-Austenitic Grain Size measurements, and the other half for precipitate and dissolution assessment. The PAGS was revealed by first tempering the specimens at 600 °C for 24 h, followed by picral solution etching. The picral solution contained 100 mL of distilled de-ionized water, picric acid to saturation, 2 g of sodium dodecylbenzenesulfonate and six drops of hydrochloric acid. Etching was done at 90 °C.
PAGS measurements were done utilizing the free software ImageJ (1.52a, National Institutes of Health, Bethesda, MD, USA), by manually circling grains to obtain the average Feret diameter. Precipitates were quantified based on TEM analysis obtained from random locations of the specimens. Two sets of TEM micrographs were used with magnifications 2000× and 20,000×, to obtain representative samples of the smallest and the biggest particles. The software ImageJ was used to measure particle size and area fraction. The area fraction was converted to volume fraction by assuming the micrographs are representative of a volume as thick as an average precipitate.
Another method for revealing PAGS was reconstruction of austenitic EBSD maps, based on the quenched martensitic specimens. The specimens were ground, polished, vibro-polished for 3 h, then cleaned in an ultrasonic bath of ethanol for 10 min before scanning. EBSD was done using a 20 kV, 13 nA beam, in a hexagonal pattern with 0.3 μm step size. The martensitic EBSD maps were processed to reconstruct prior-austenite maps. MATLAB (R2017b, The Mathworks Inc., Natick, MA, USA) with MTEX toolbox was used, following the procedure proposed by Nyyssönnen, et al. [16,17]. This procedure starts by determining the experimental Orientation Relationship (OR) between martensite and its parent austenite. Kurdjumov-Sachs OR is first assumed, then followed by an iterative comparison of adjacent grains; this determines the experimental OR. This OR is then used for re-constructing the prior-austenite orientation map.
Thin foil specimens for TEM were produced by grinding specimens down to 100 μm thickness with 1200 grit sandpaper. Further grinding to 10–20 μm was done in a Fischione Model 200 dimpling grinder (Fischione Instruments, Export, PA, USA) using 3 nm diamond abrasive paste. Electropolishing was done on the thin foils using a Struers TenuPol-5 (Struers Inc., Cleveland, OH, USA) with 5% perchloric acid solution as electrolyte at −25 to −15 °C. Carbon replica extractions were obtained by evaporating 10–15 nm C-film on 3% Nital etched surfaces of the specimens. The film was then removed by immersion in 10% Nital and supported on copper grids for analysis.
Light microscopy was done in a Keyence Microscope (Keyence Corporation of America, Itasca, IL, USA). SEM analysis was done in a Zeiss Sigma 50vp FEG-SEM (Zeiss International, Oberkochen, Germany) equipped with Oxford Energy Dispersive Spectrometer (EDS) detector (Oxford Instruments, Abingdon, UK). EDS was used as qualitative method, utilizing only the factory-preset standardization of the Aztec software (V3.2 SP1, Oxford Instruments, Abingdon, UK). EBSD was done in a FEI Scios FIB/SEM Dual Beam system (Thermo Fisher, Hillsboro, OR, USA) with EDAX EBSD camera and TEAM software (V4.3, EDAX Inc., Mahwah, NJ, USA). TEM was done in a JEOL JEM2100F (JEOL Ltd., Tokyo, Japan) using 200 kV beam.
3. Results
3.1. Thermodynamic Calculations of Precipitate Volume Fraction
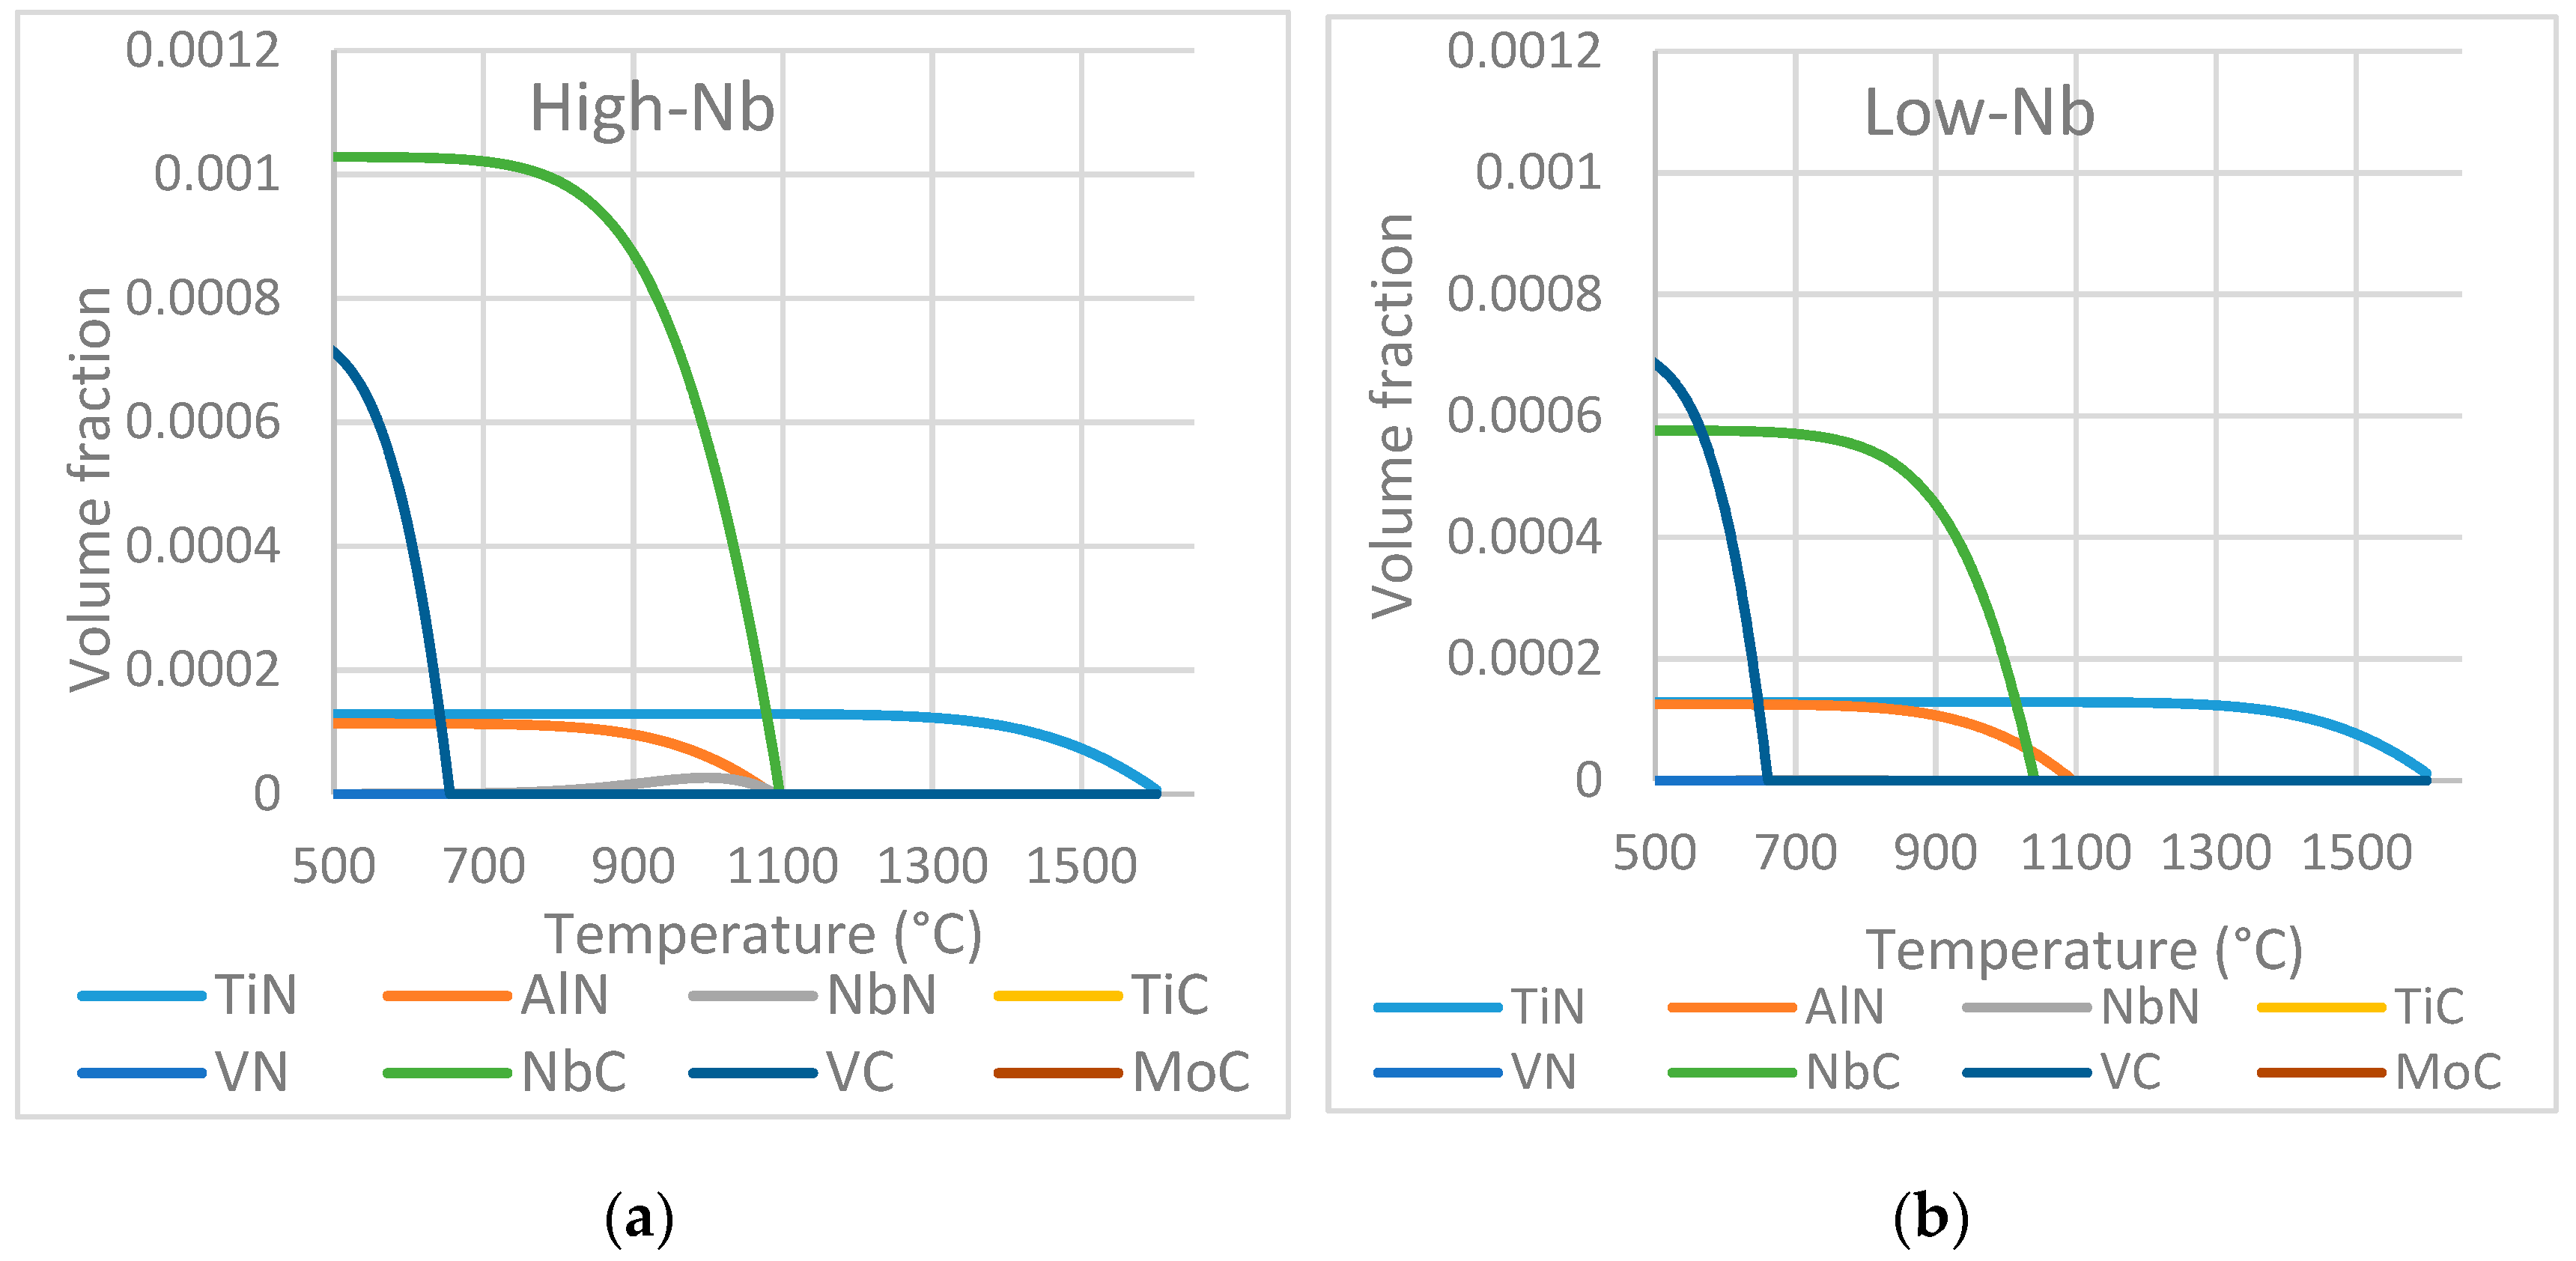
The results of theoretical equilibrium calculations of precipitates’ volume fractions (described in Appendix A) are shown in Figure 1. From all eight possible precipitates considered in the calculations: AlN, TiN, NbN, VN, TiC, NbC, VC and MoC, only four presented a significant amount in the Low-Nb steel, and five in the High-Nb steel. The volume fractions of VN, TiC and MoC remained zero at all temperatures of interest. The presence of NbN appeared only in the high-Nb alloy in the range of temperatures where NbC volume fraction declines. This precipitate occurrence is dependent on the amount of N available after all possible TiN and AlN have precipitated. According to this calculation, most simple carbides and nitrides dissolve below 1100 °C; above this temperature, only TiN remains stable.
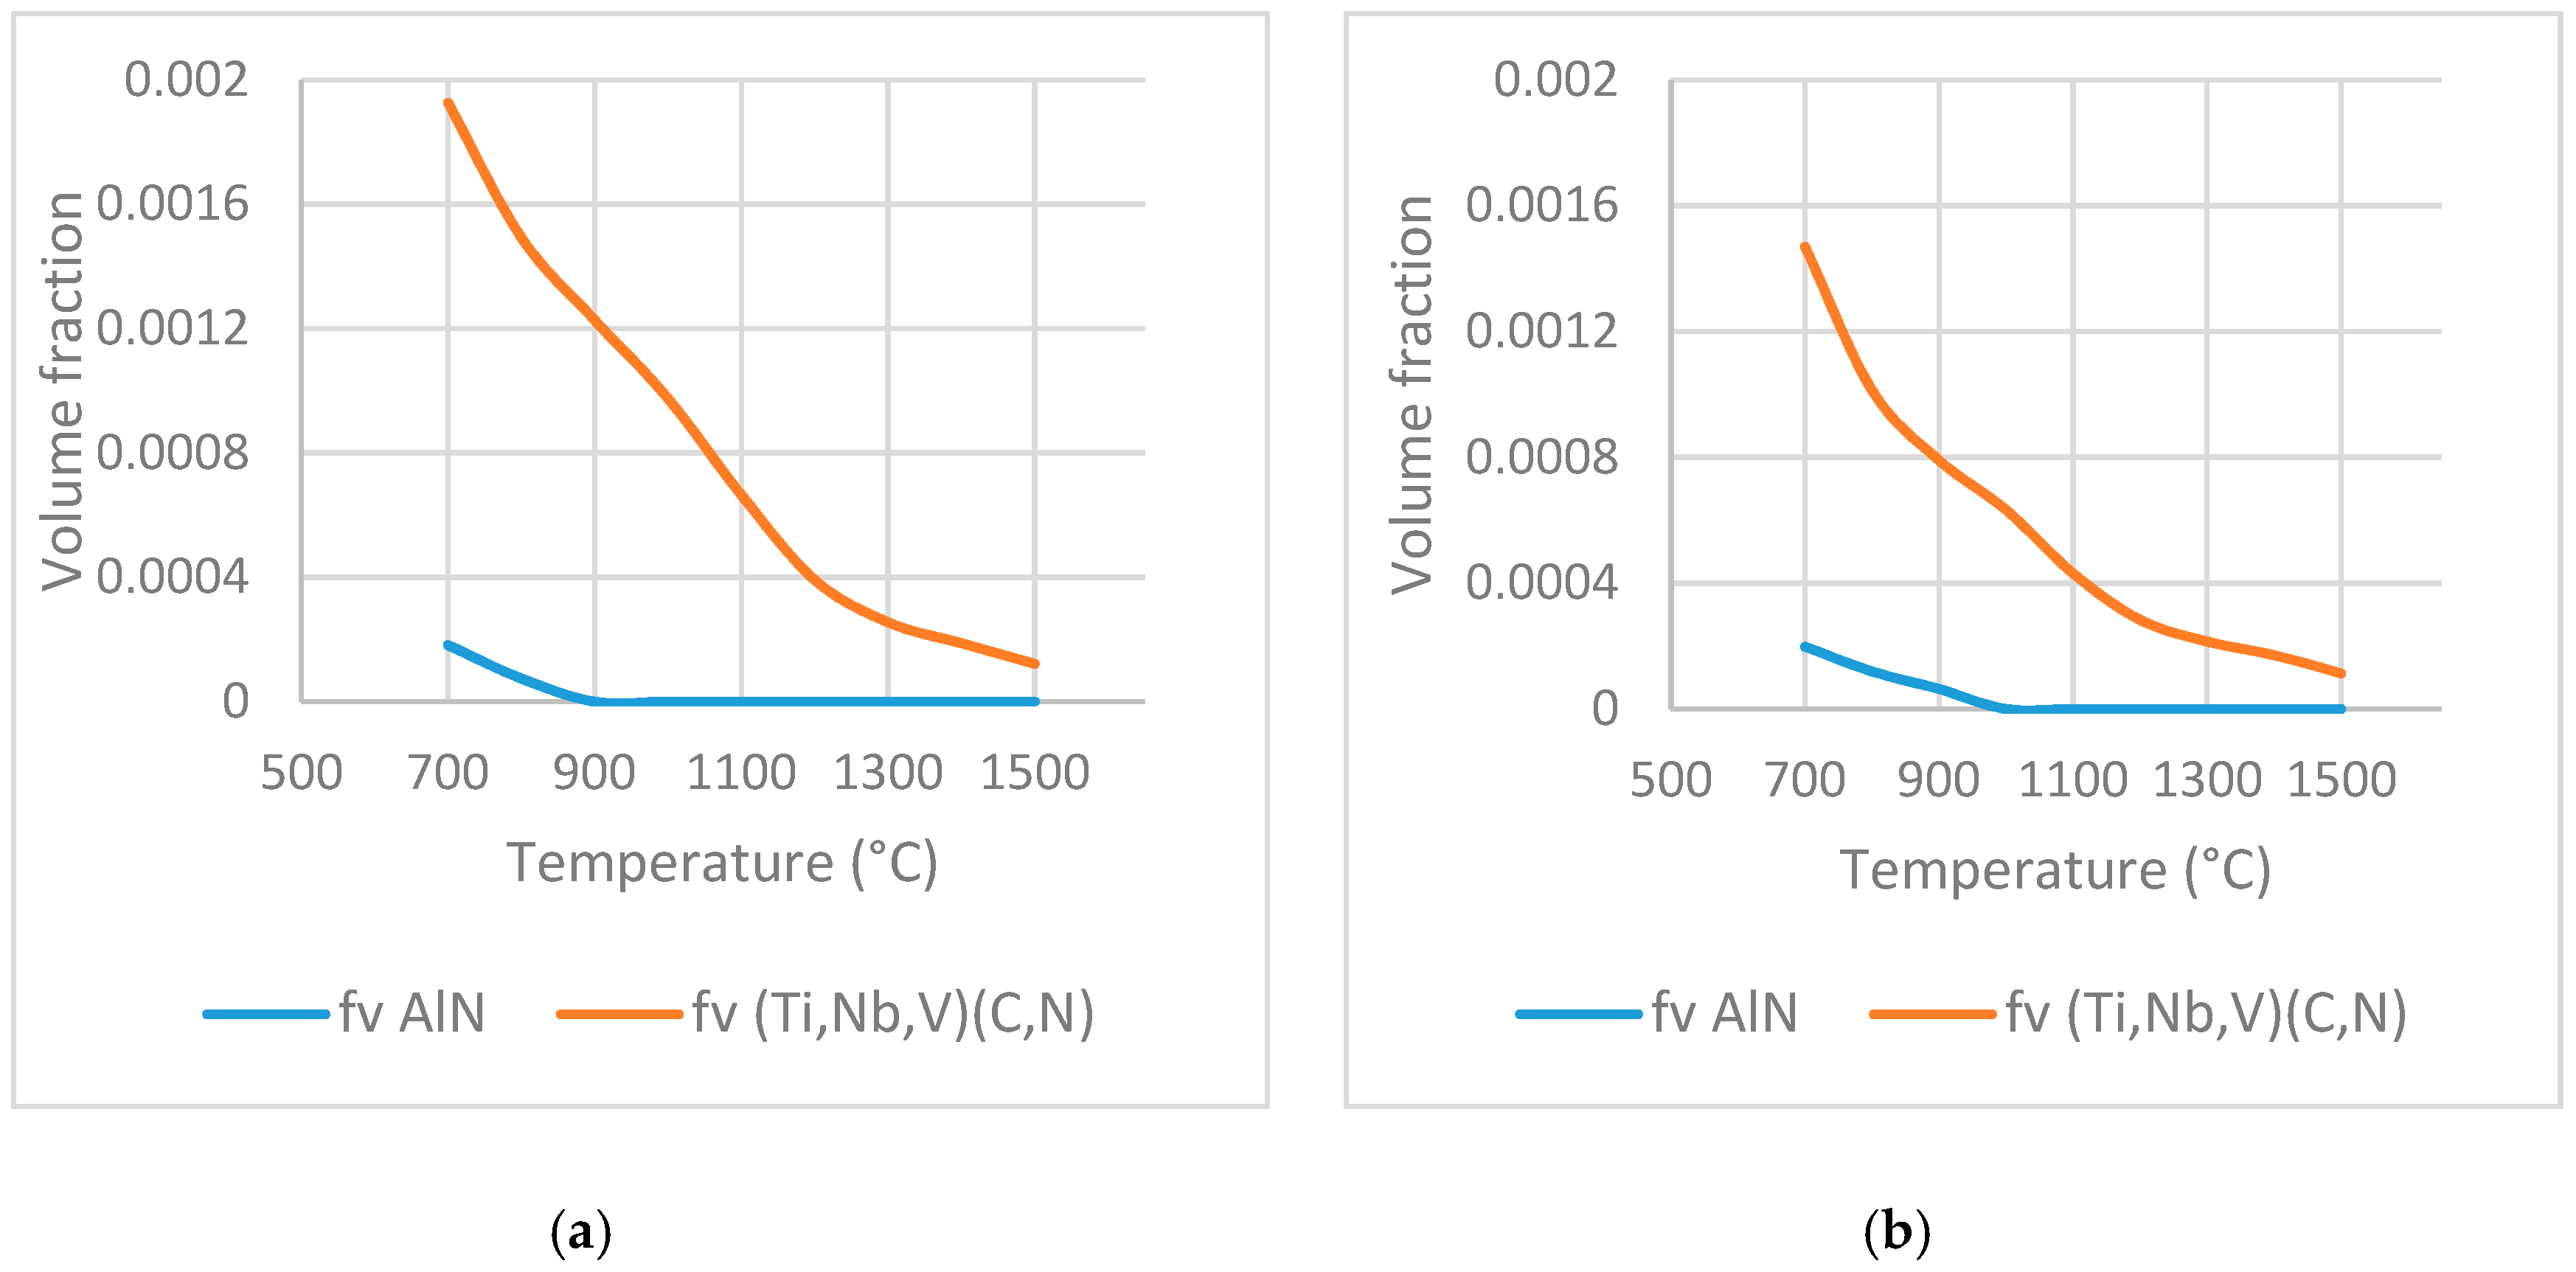
Considering the mutual solubility of carbides and nitrides (except AlN, see calculations in Appendix B), gives a contrasting result. In Figure 2, the volume fraction of complex (Ti,Nb,V)(C,N) particles is superior to that of TiN in Figure 1, especially in the range of our austenitization experiments, 1150–1300 °C.
Abnormal growth of austenitic grains starts when particles coarsen past a critical size [3] or their volume fraction is drastically reduced, producing a pinning force smaller than the grain growth force. This massive reduction in the volume fraction of precipitates occurs at around 1100 °C according to empirical calculations (Figure 1 and Figure 2). From the calculated volume fraction results, austenitic grain size can be predicted using Zener’s model if an average particle size is assumed. For instance, at 1100 °C, an average particle size of 100 nm would allow a grain size of 350 μm. This is a likely scenario; if equilibrium conditions are achieved during reheating, NbC is expected to dissolve at 1100 °C. The presence of a small fraction of relatively coarse TiN particles may allow grain growth above this temperature.
3.2. Experimental Precipitates Volume Fraction
The presence of Nb and Ti-Nb precipitates was verified by SEM, and TEM and their nature was determined by EDS and electron diffraction. Micrographs were taken from random locations to ensure a representative sampling. Based on the TEM micrographs, measurements of the precipitates were obtained, and volume fractions were calculated. Assuming sample thickness equals average precipitate thickness, the area fraction becomes equal to the volume fraction. As expected, the volume fraction decreases as austenitization temperature increases. Average particle size, on the other hand, increased with austenitization temperature. The stability of Nb-rich precipitates was higher than expected at temperatures above 1100 °C.
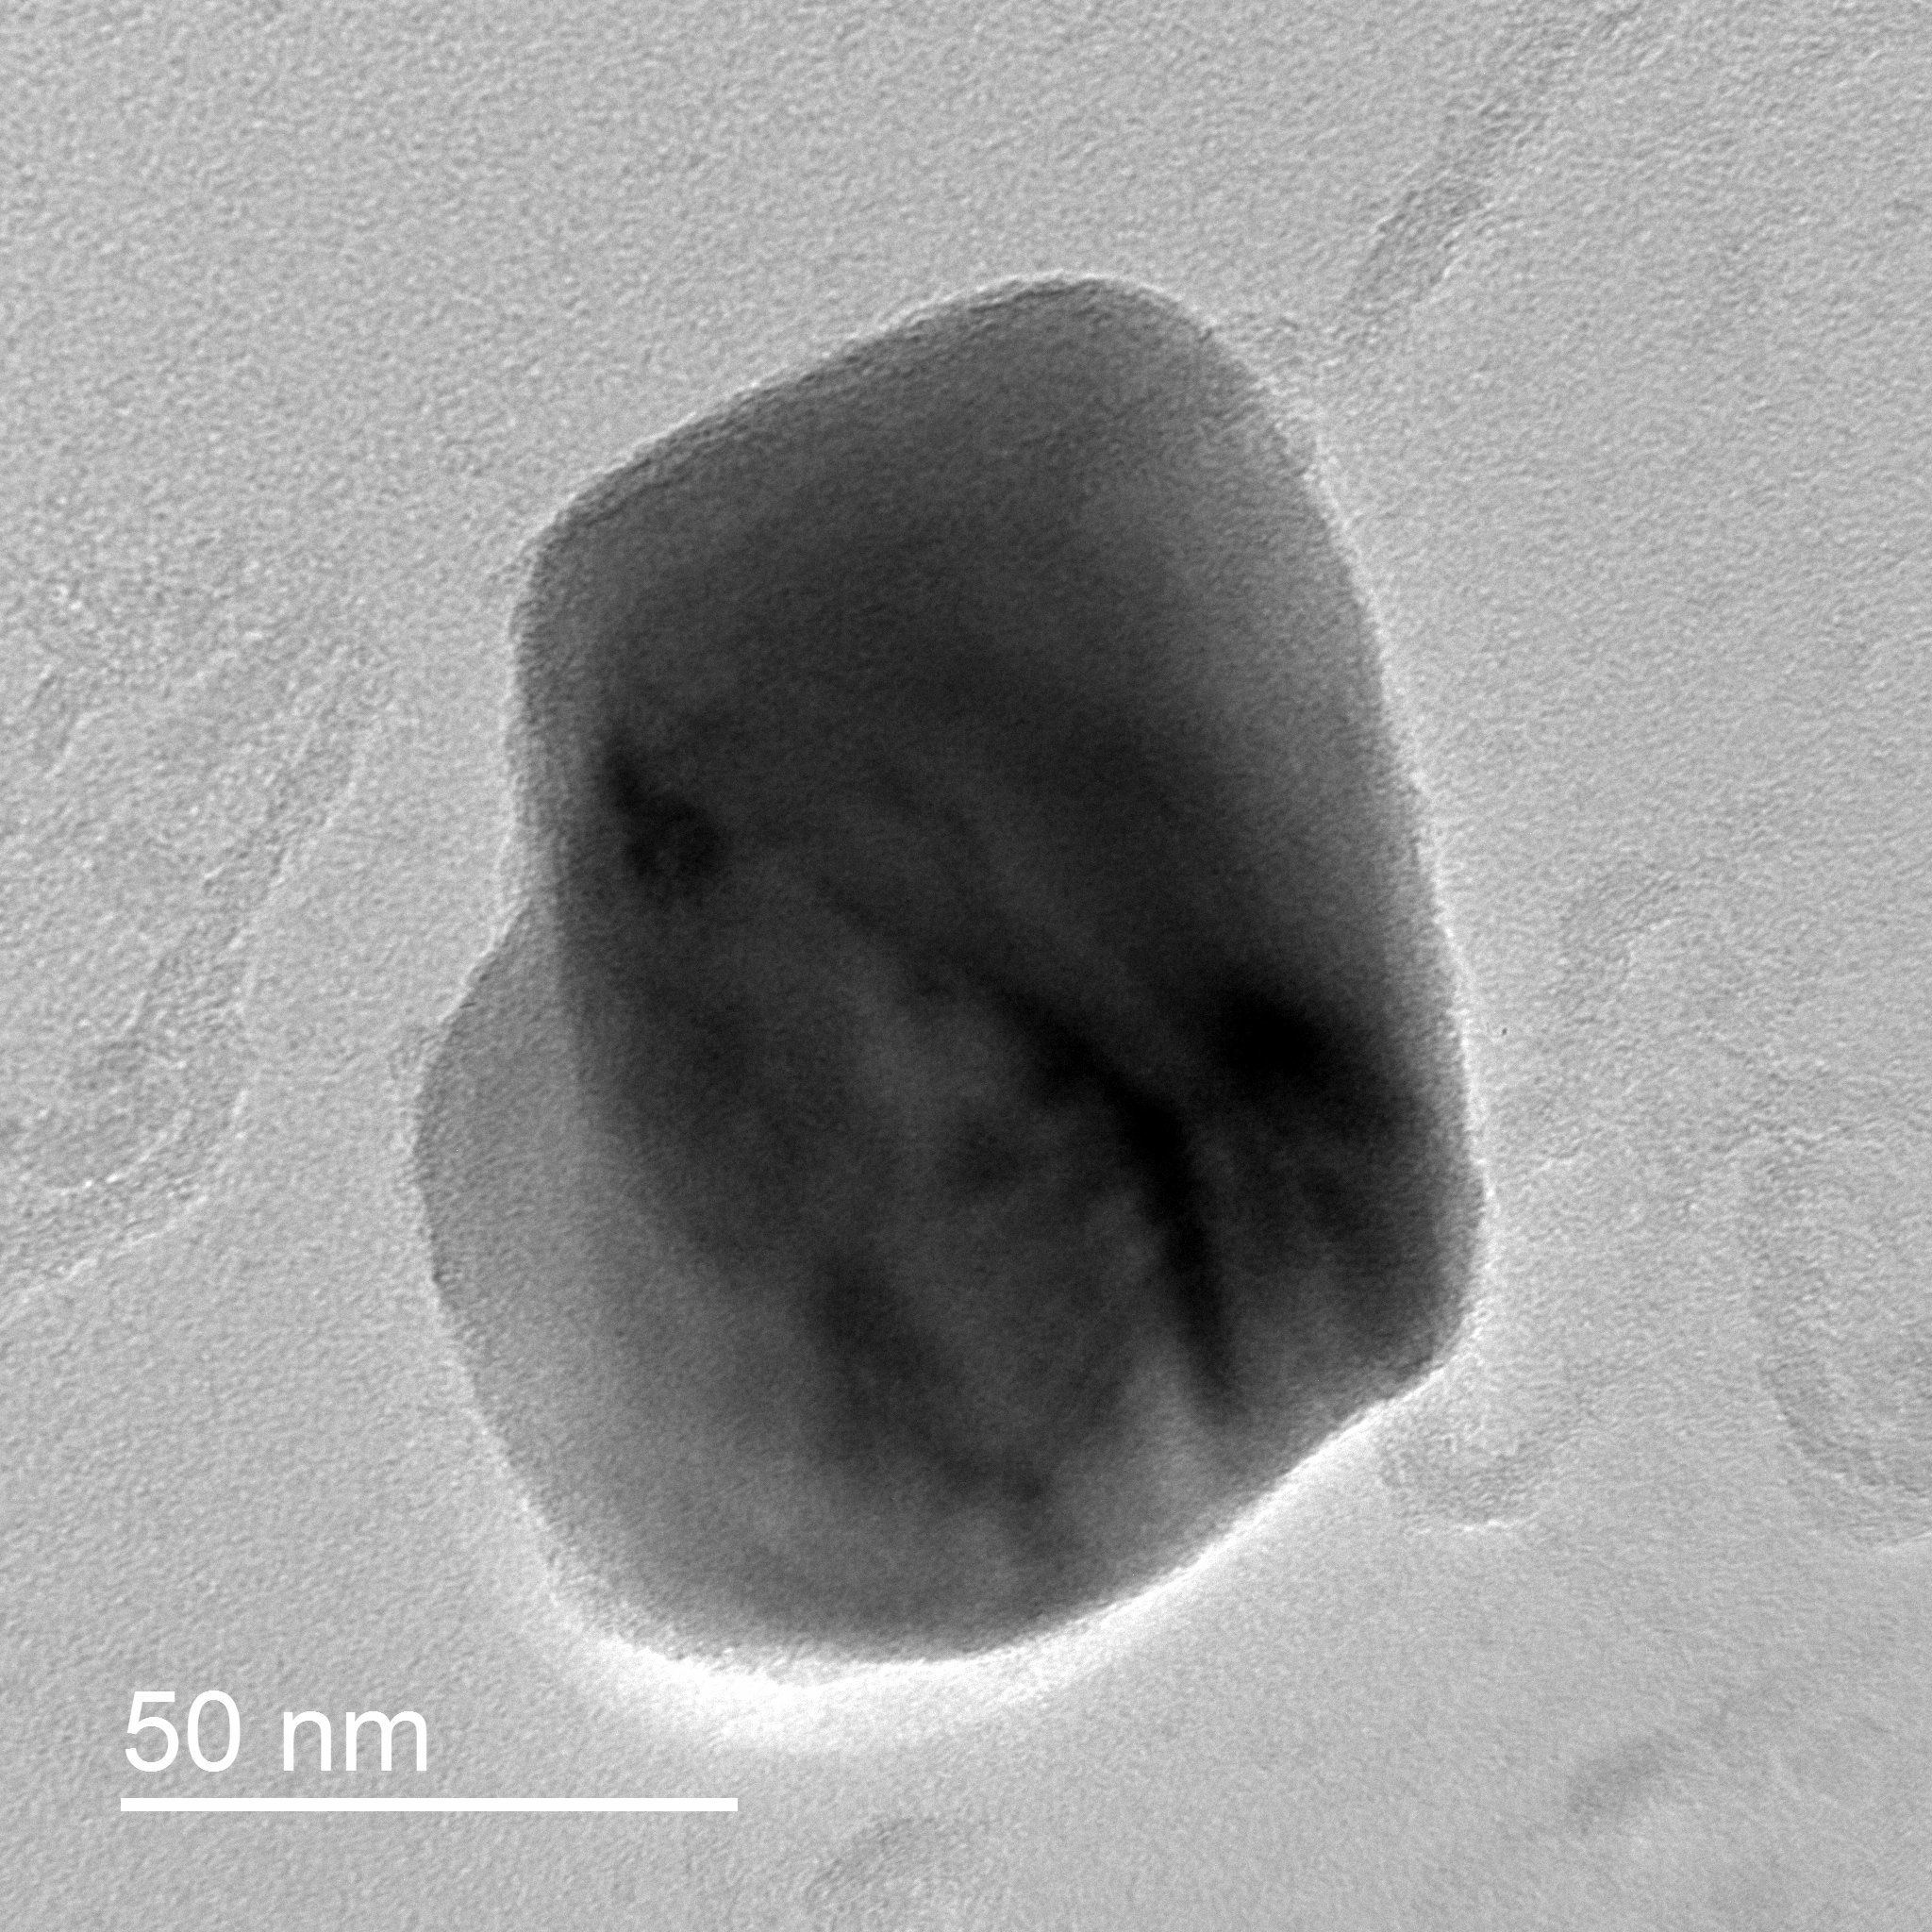
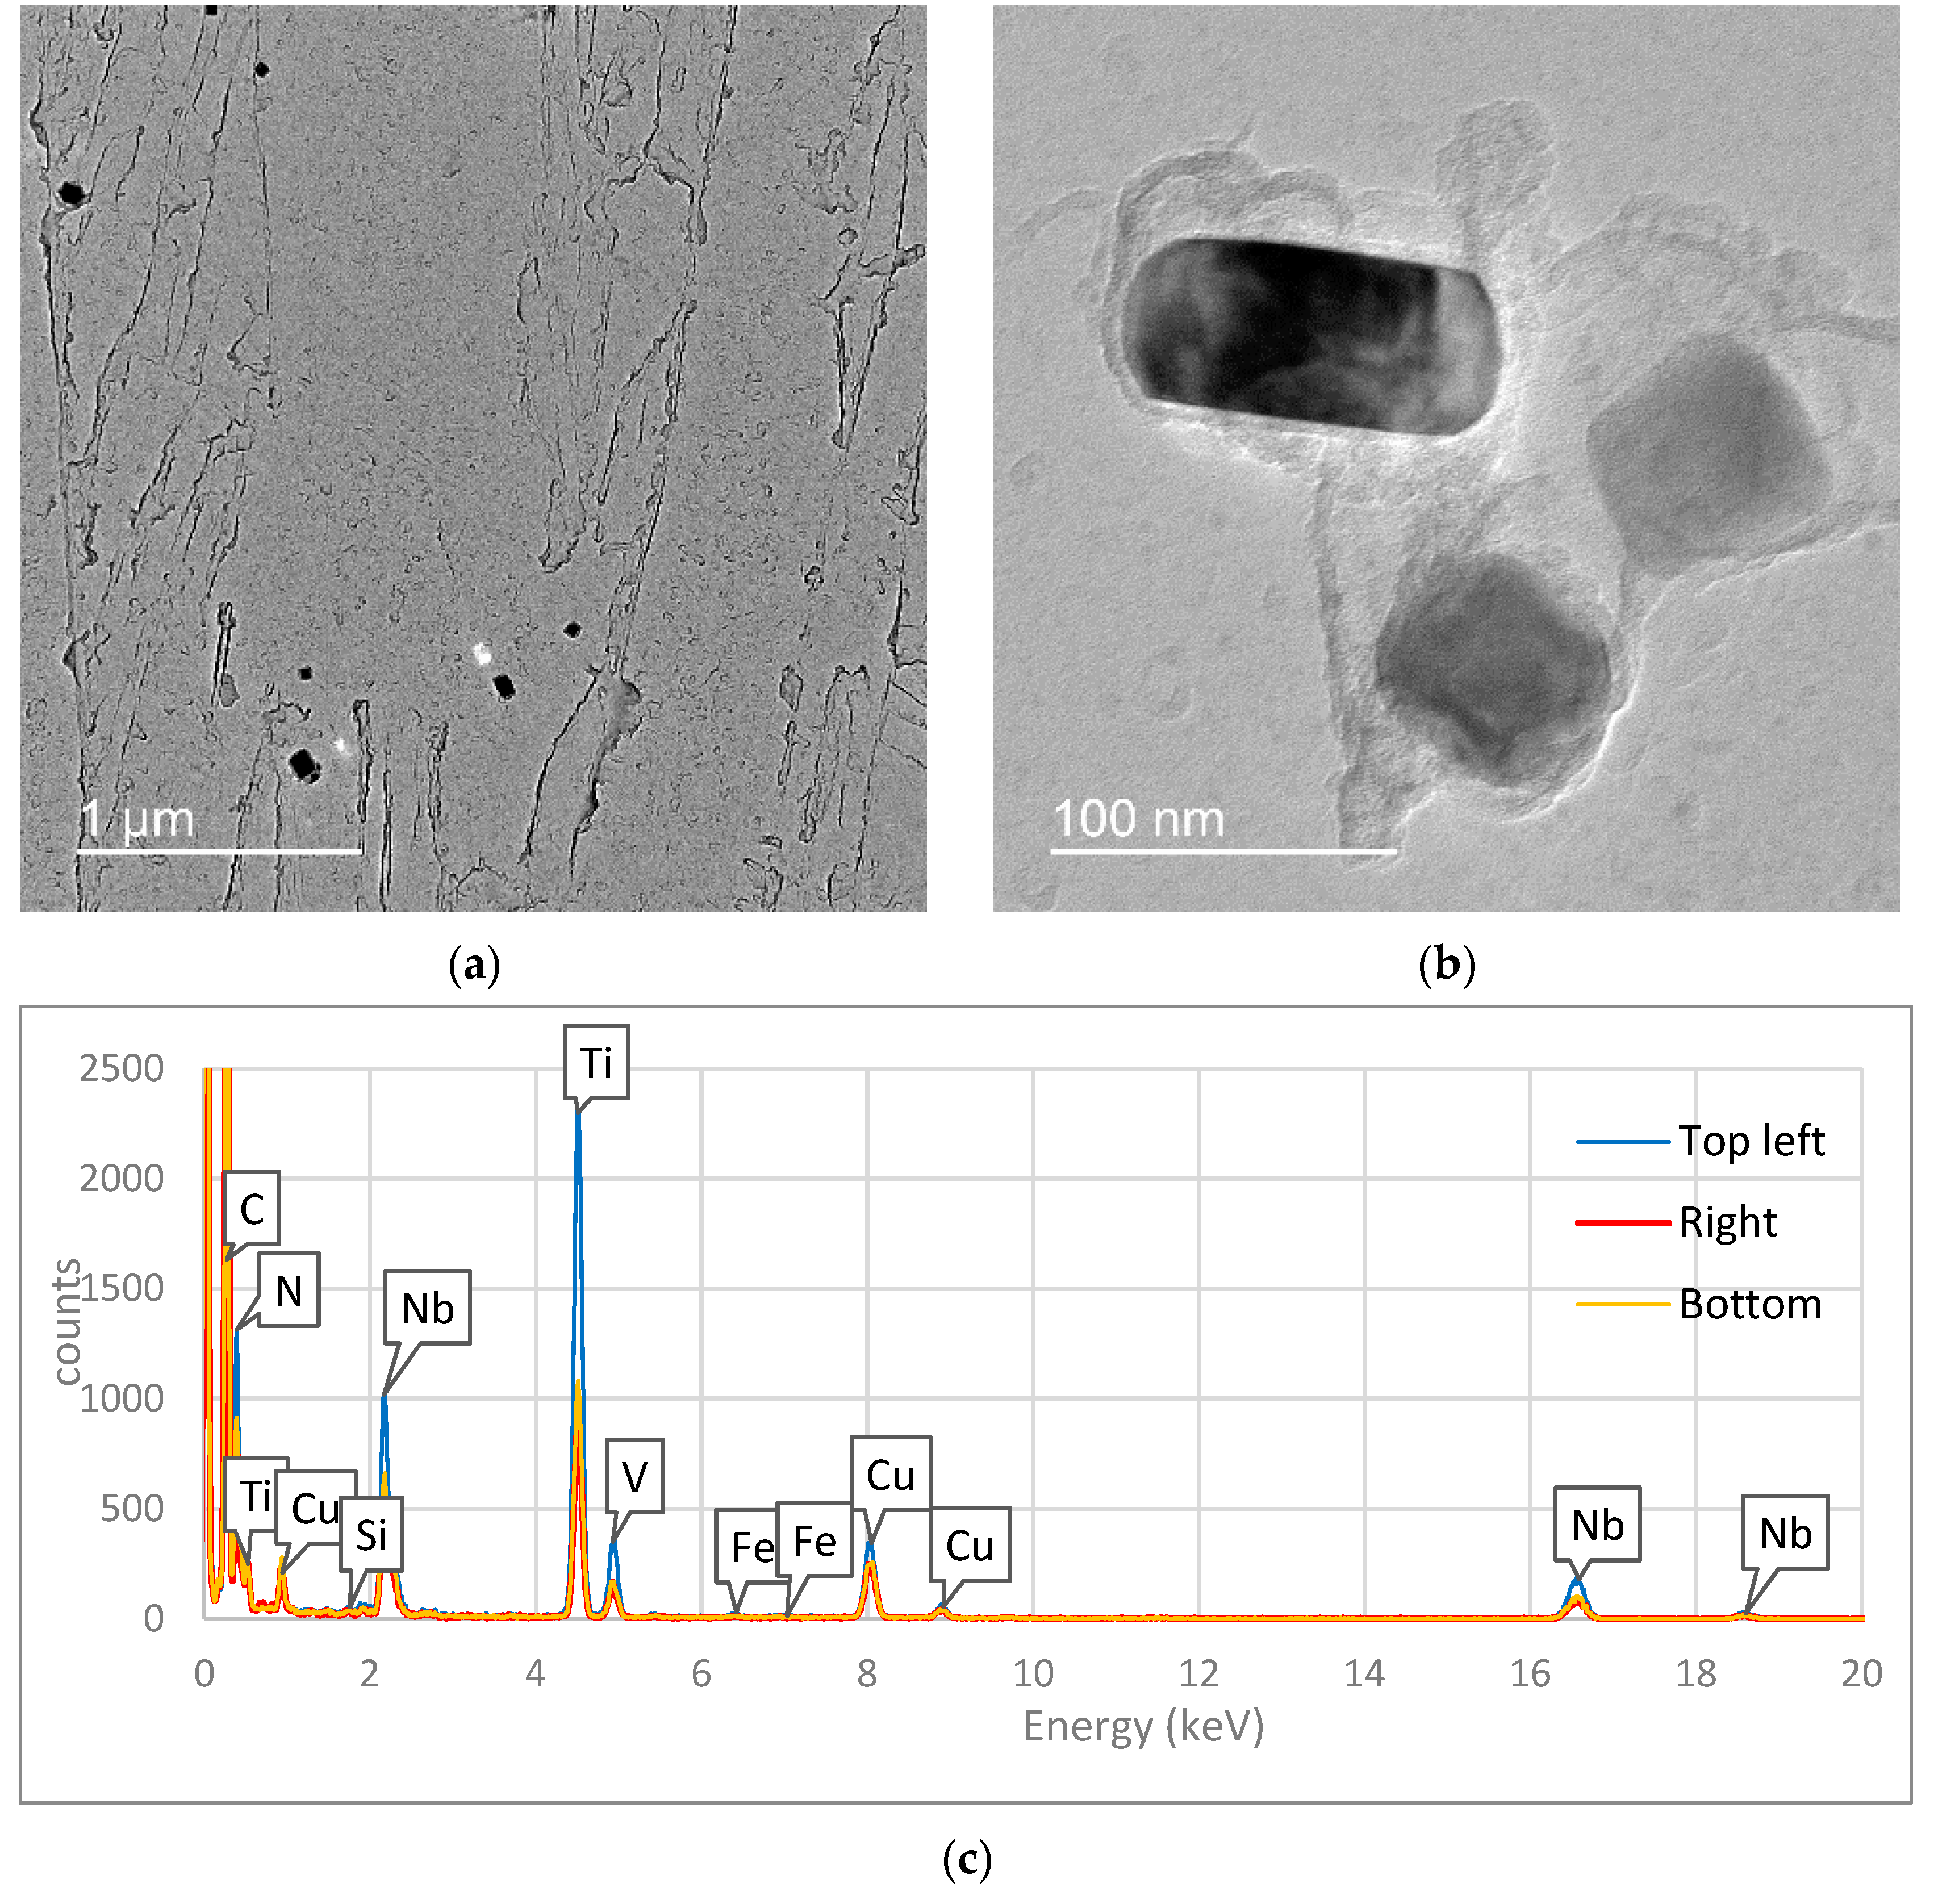
A good example of Nb-rich particles’ stability can be seen in Figure 3a. A micrograph obtained from the Low-Nb steel, austenitized to 1300 °C shows considerable presence of precipitates. These precipitates contain Nb, Ti and exist in a wide range of sizes. The stability of the particles was observed even during austenitization to 1300 °C for 1 h. Figure 3b was obtained from High-Nb steel austenitized to said conditions, and similar examples were seen in Low-Nb steel. EDS provided identification of these particles. Small objective lens aperture was used to selectively analyze every particle in Figure 3b. The chemical compositions of these particles are shown in Table 2. The C content is enhanced due to the C-replica film influence, and the copper due to the grid holding the replica. EDS shows that the particles contain Ti and Nb. V was detected in a fraction below the error of EDS method. The top-left particle in Figure 3b is richer in N and Ti than the other two. Similar particles were observed in both alloys at all tested temperatures, hence their complexity was further studied.
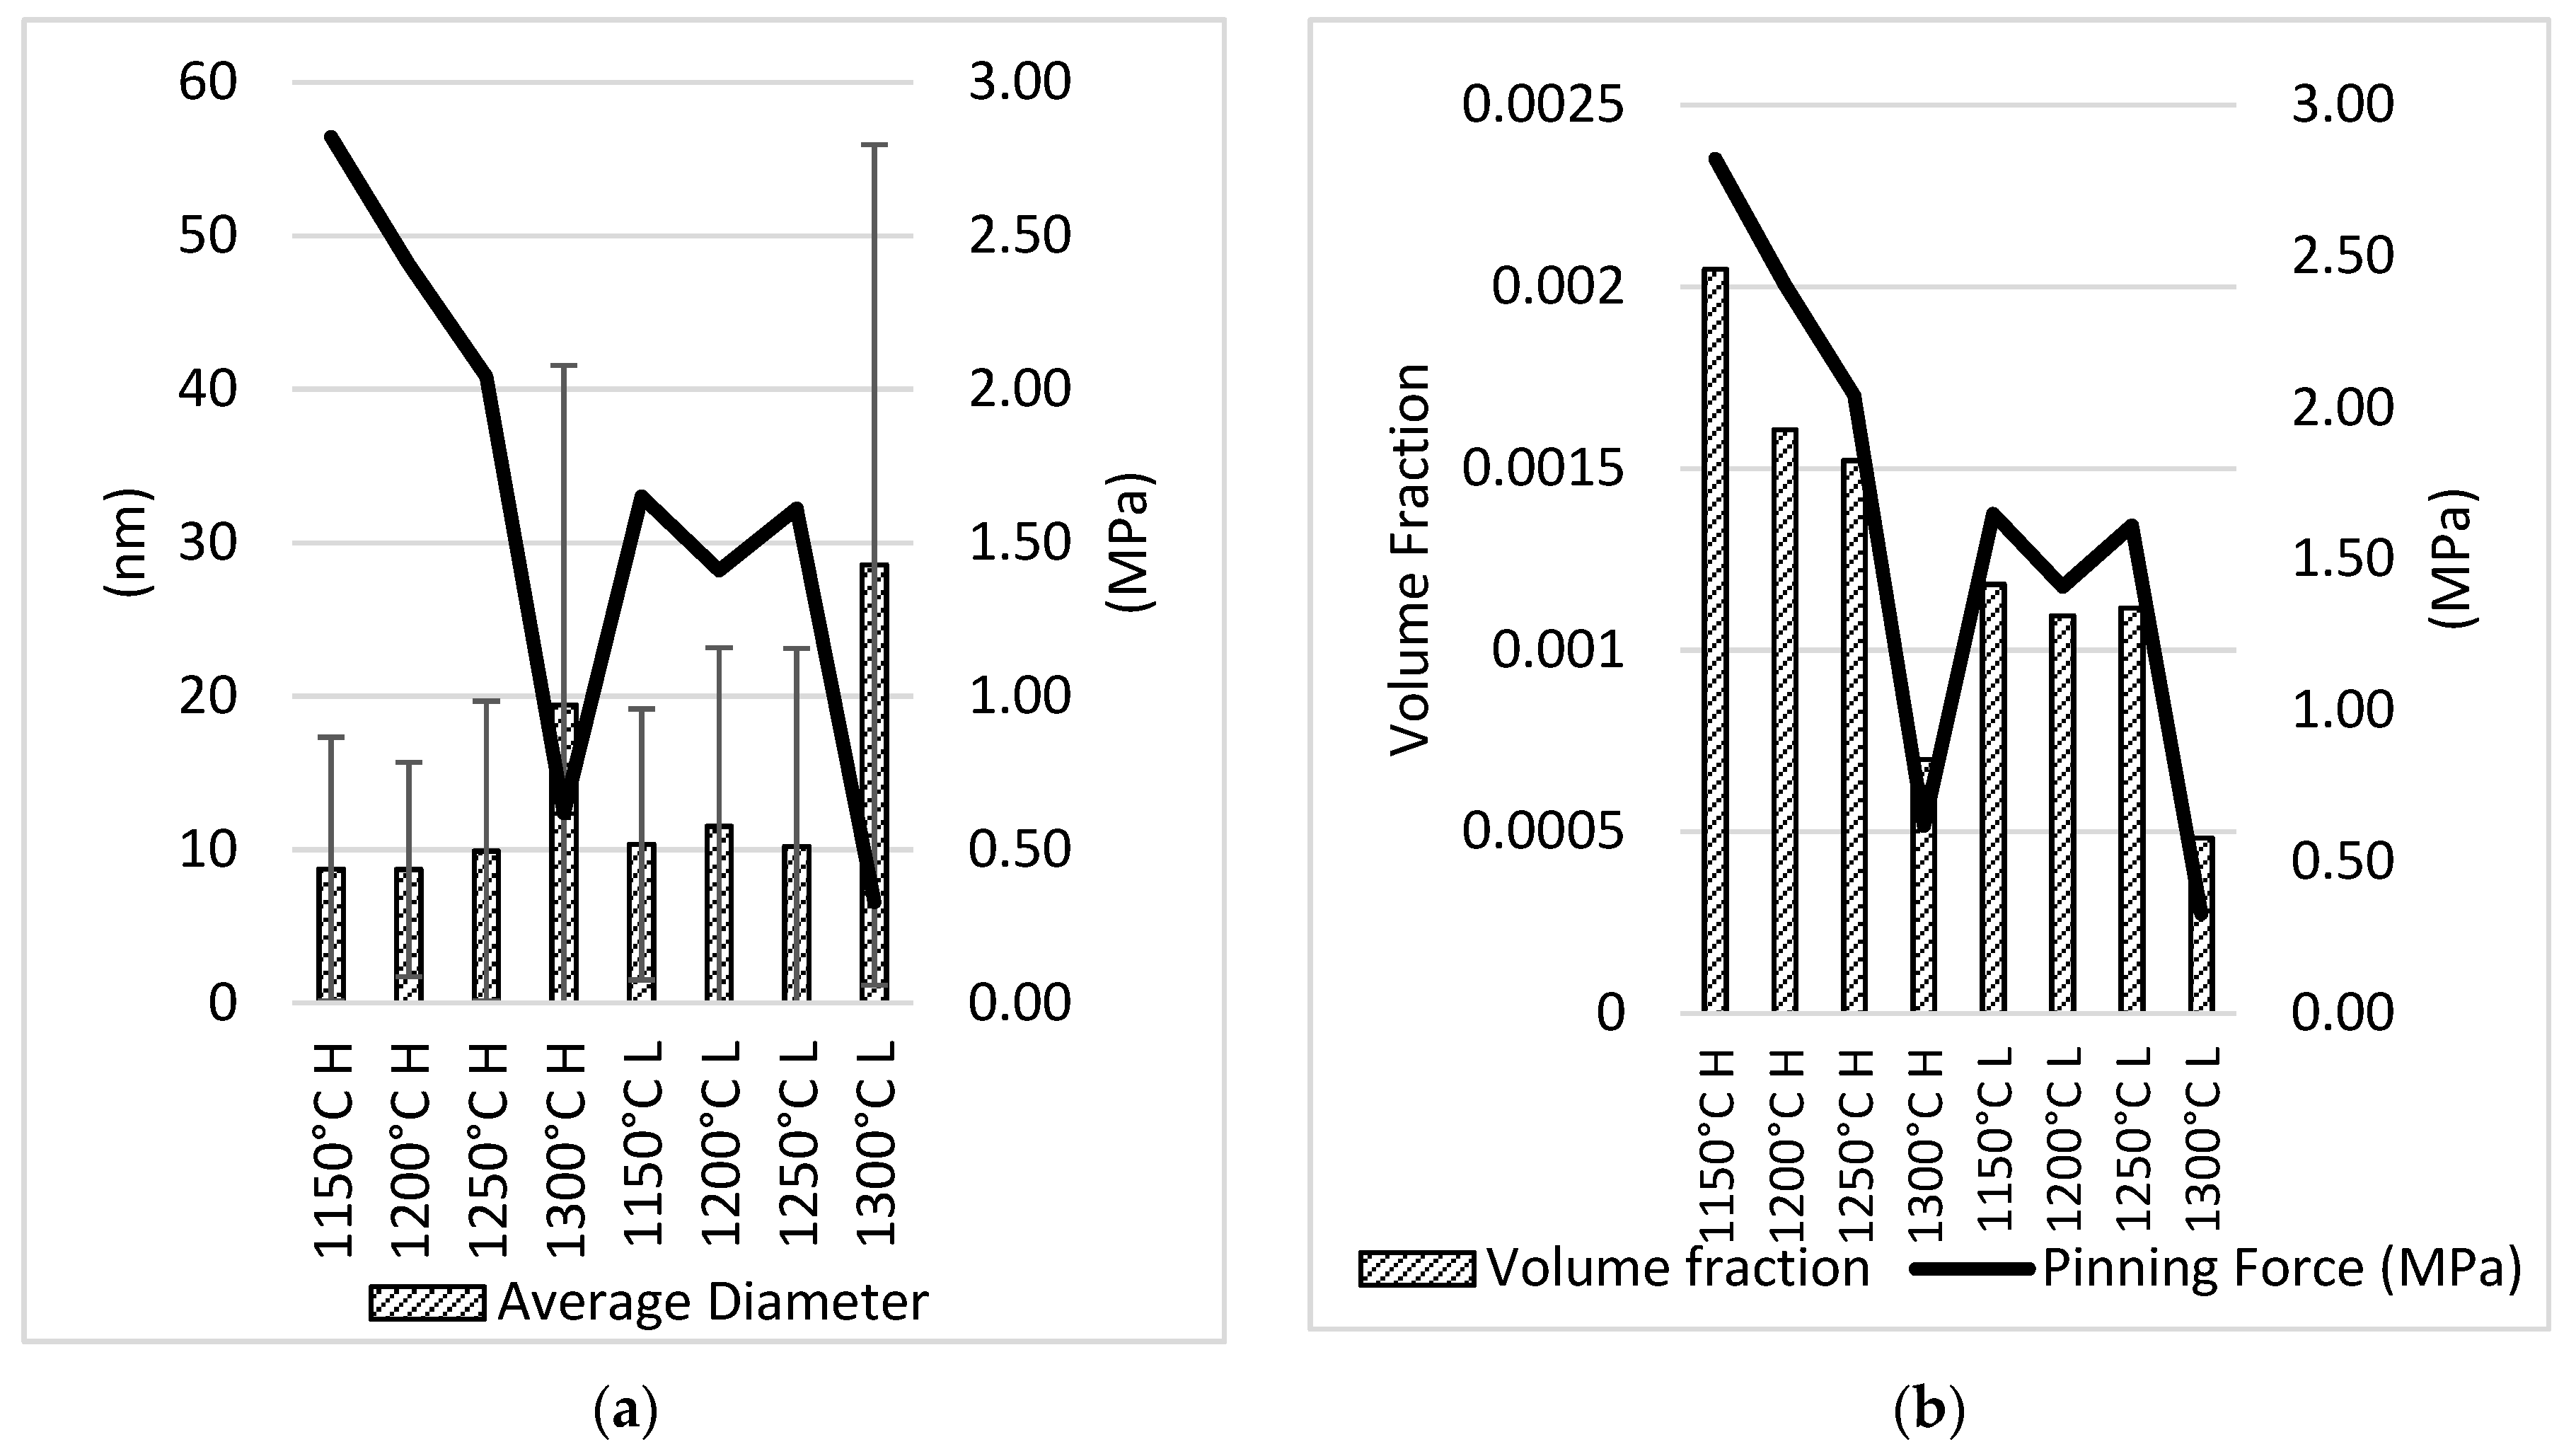
The overall results of the dissolution study by TEM are plotted in Figure 4. The average diameter of observed particles is very similar for both alloys up to 1250 °C, then it increases dramatically at 1300 °C amid a volume fraction reduction. The dissolution of small particles and Ostwald ripening of big particles are the phenomena responsible for this average size increase.
The pinning force associated to the particles was calculated using Zener’s model as expanded by Gladman [3] for flexible boundaries.
where, r, is the mean average particle radius, σ, is the interfacial energy between the particle and austenite per unit area and Ns, is the number of particles per unit area, that for a flexible boundary is given by [18]:
where fv, is the volume fraction of particles and, r, the mean particle radius. Pinning force calculations showed a trend dominated by volume fraction. The pinning force was high at austenitizing temperatures below 1250 °C for both alloys. At 1250 °C in the low-Nb steel, the pinning force was only 21% below the high-Nb alloy. This allowed both alloys to have homogeneous PAGS below 1250 °C.
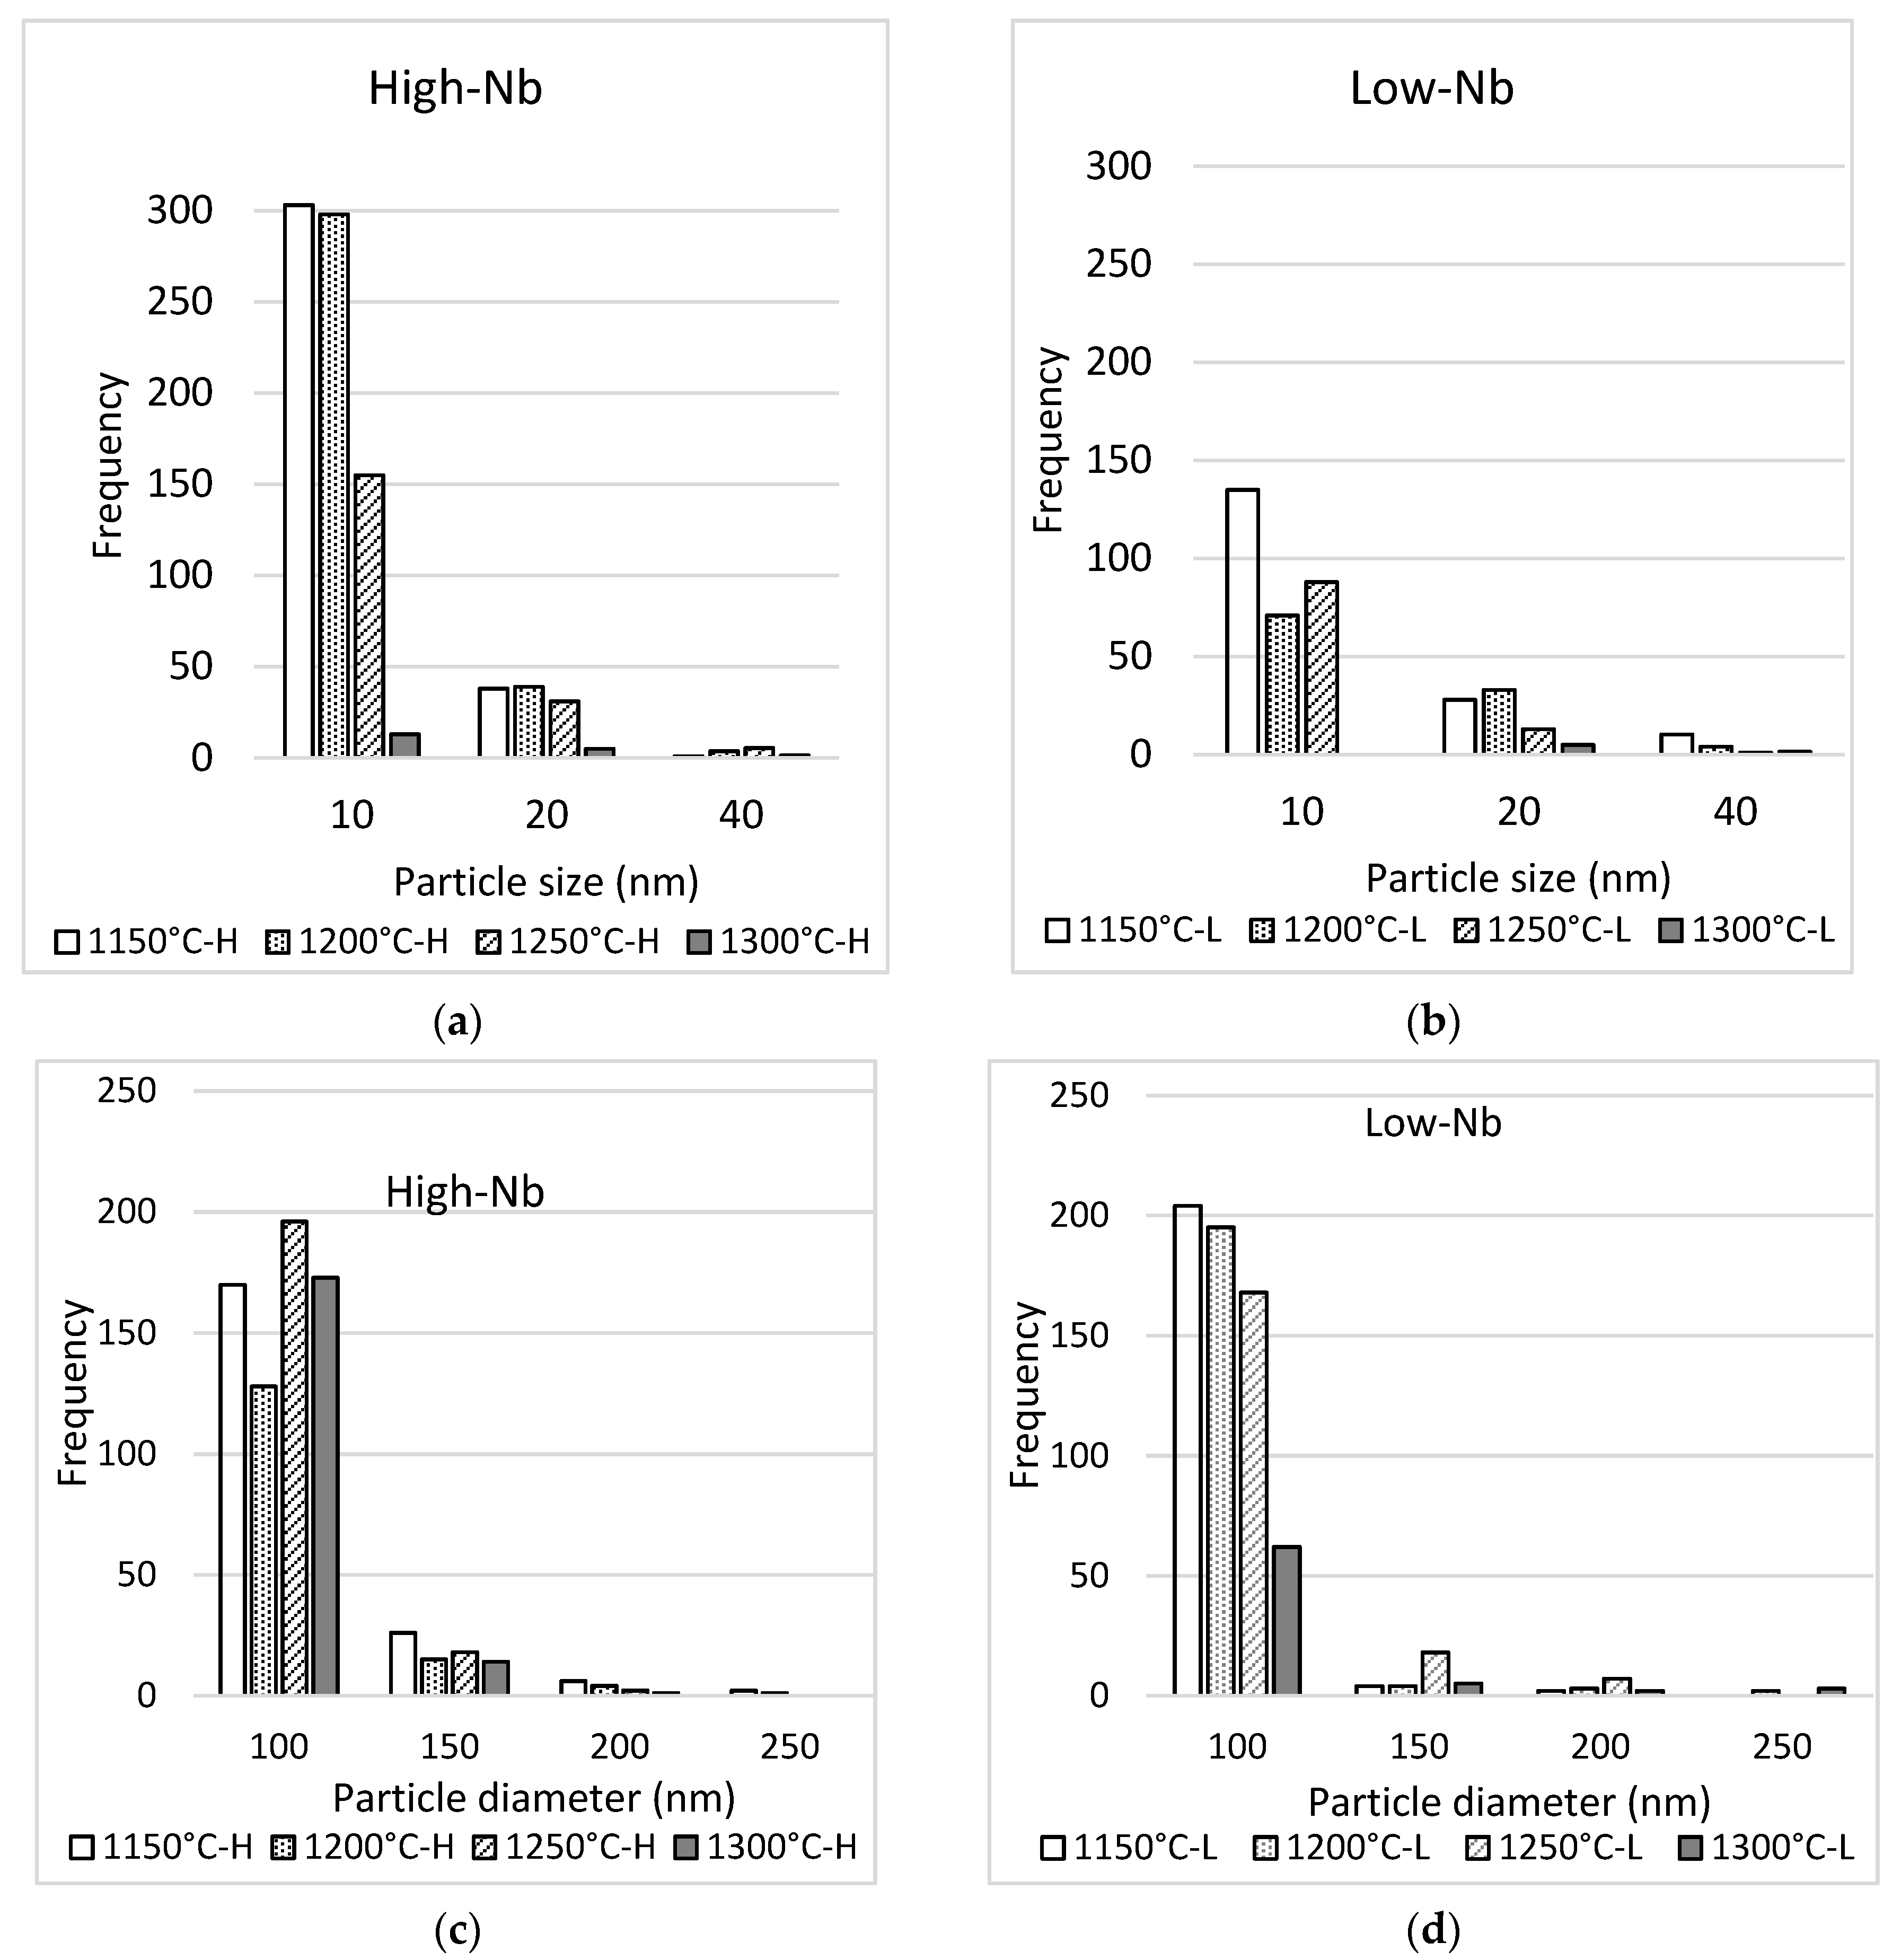
The size distribution of precipitates, shown in Figure 5, was analyzed in two categories for better visualization: precipitates smaller than 40 nm, namely small precipitates, and precipitates bigger than 40 nm, namely big precipitates. The size distribution change with temperature illustrates the simultaneous occurrence of Ostwald ripening phenomena and dissolution. Fortunately, the small particles show considerable stability at 1250 °C and below in the low-Nb steel.
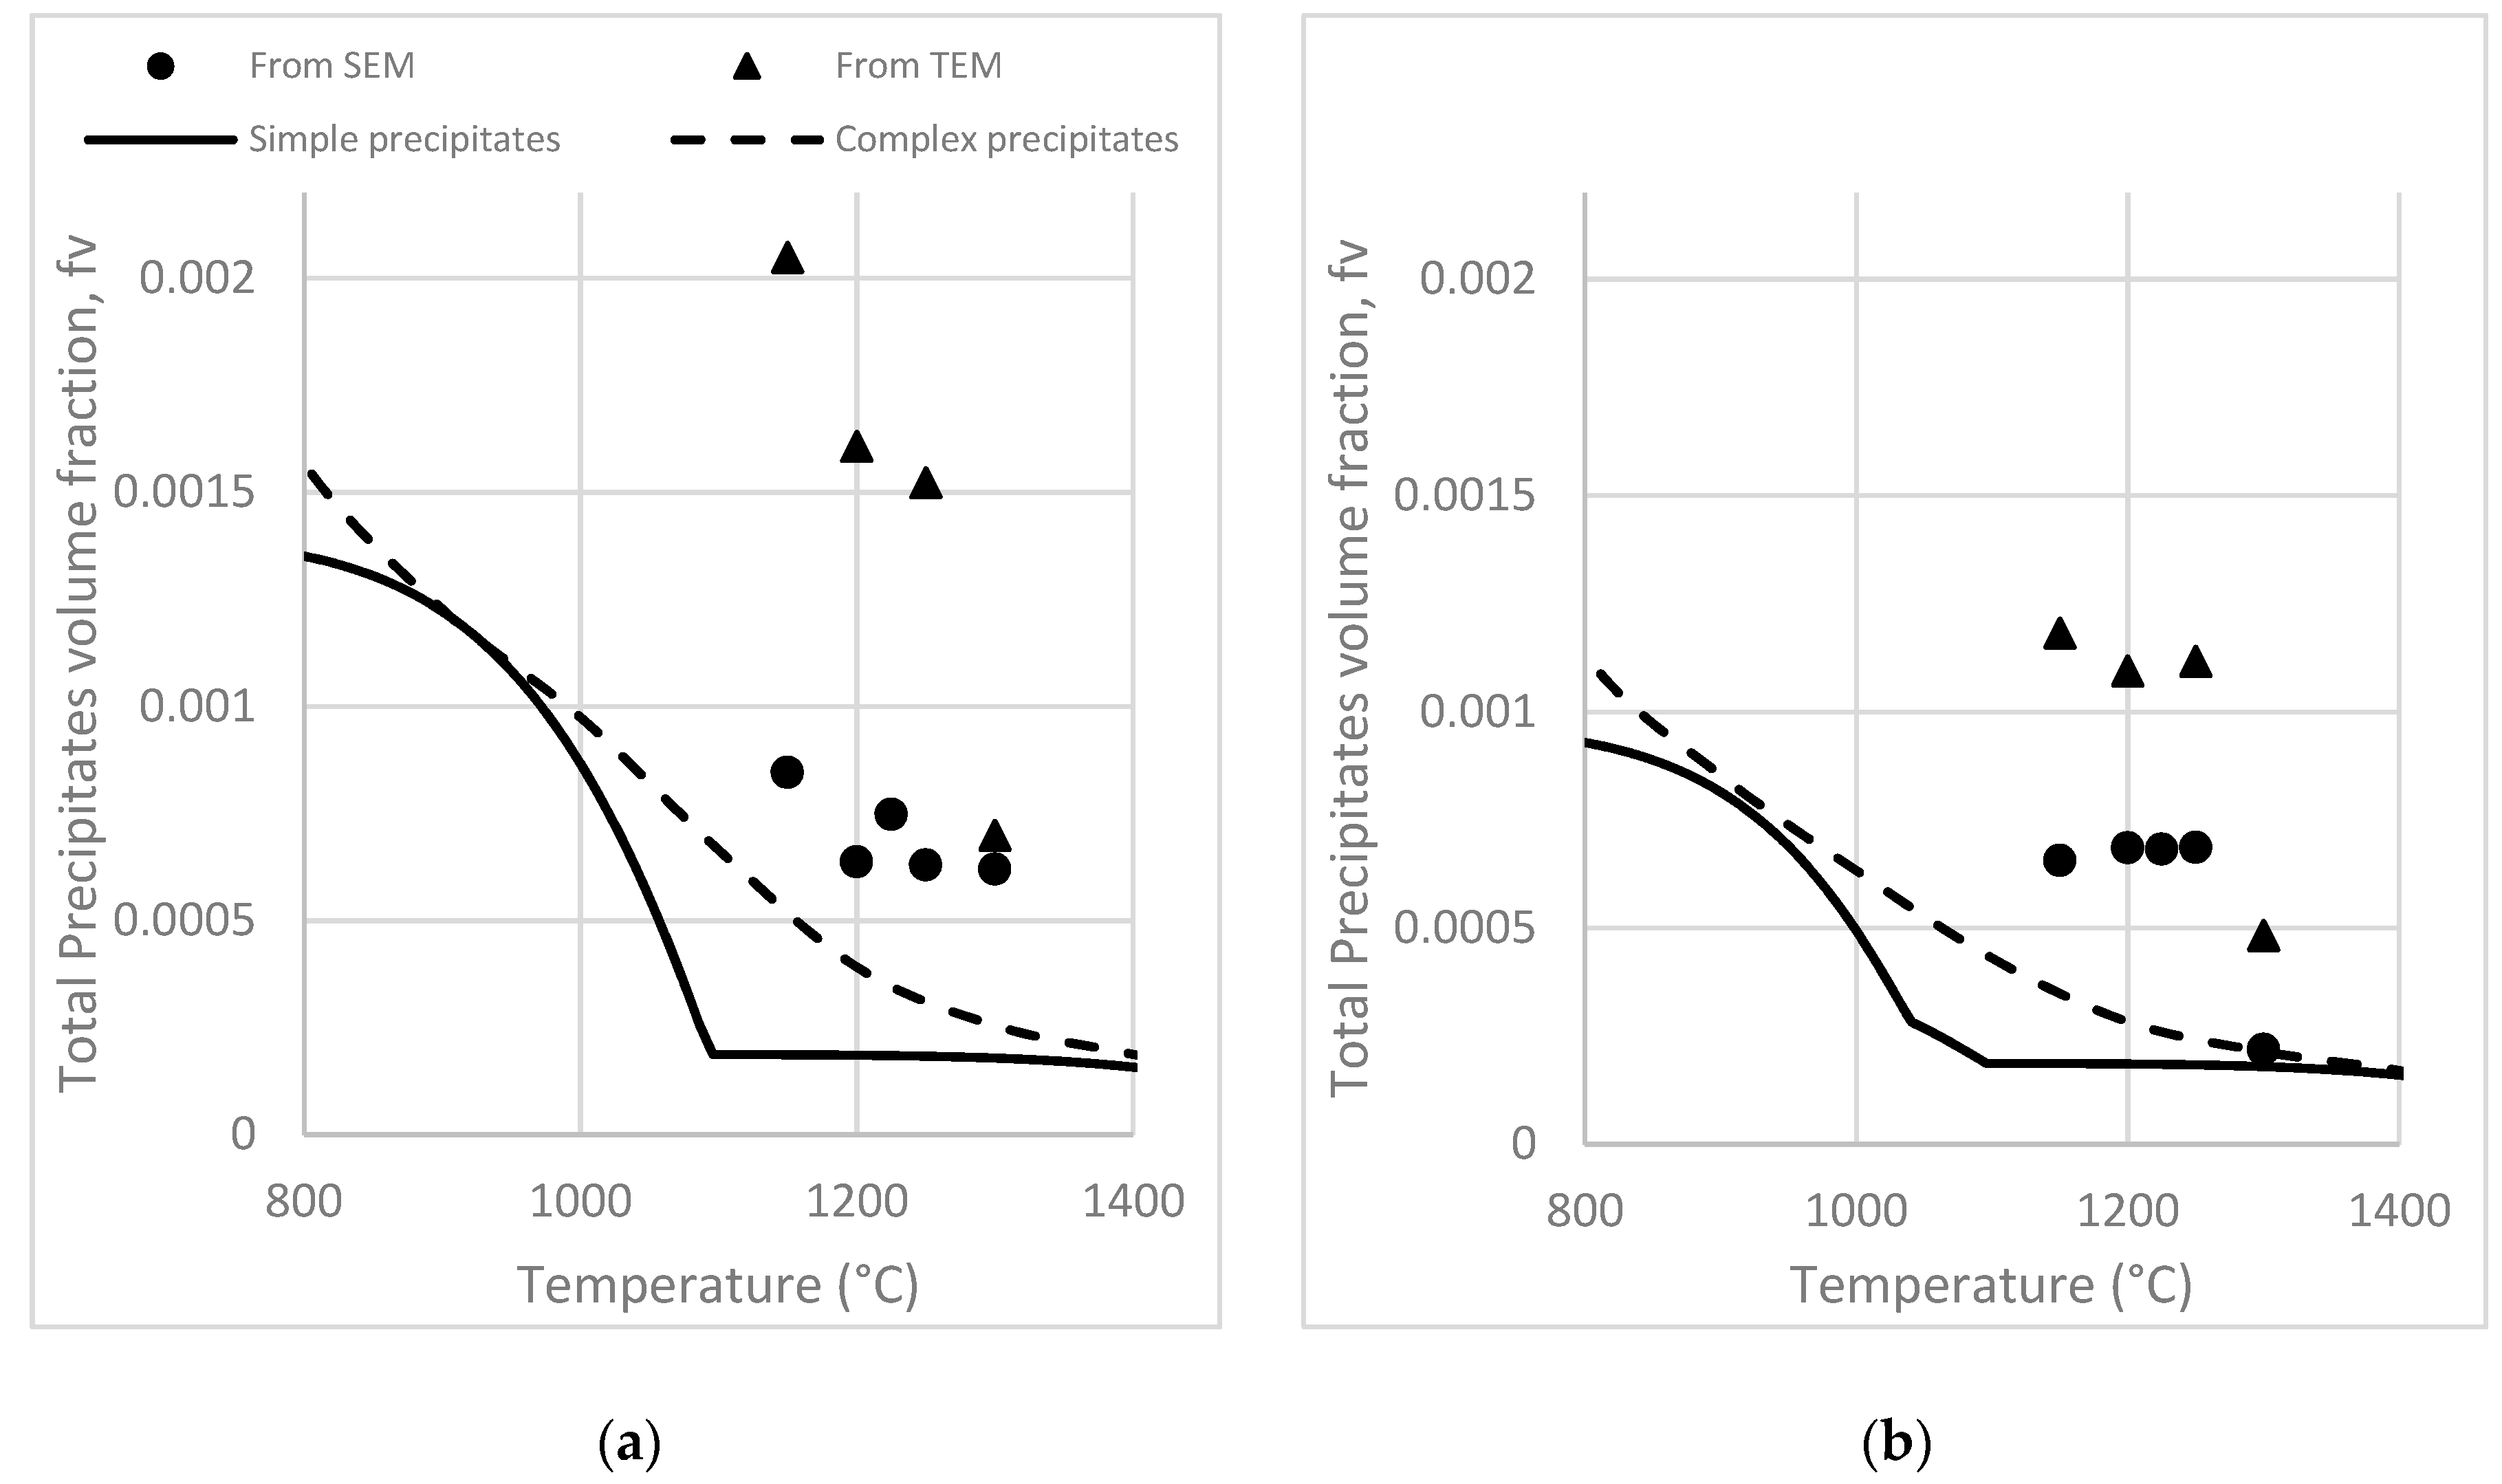
Comparing precipitate volume fraction calculations (from Section 3.1.) to experimentally-based volume fraction calculation, a shift in the dissolution behavior is observed, see Figure 6. Experimentally based calculated volume fraction is higher than in equilibrium conditions. After 1 h of soaking at temperature above 1100 °C, the complete dissolution of NbC was theoretically expected, according to the simple-precipitate approach calculations. Furthermore, the volume fraction of complex precipitates was expected to reduce considerably, according to the complex-precipitate approach calculations. Evidently, those equilibrium conditions were not reached, hence, dissolution was delayed. At these temperatures, Nb was found in complex particles containing both Nb and Ti, either in mutual solid solution or in epitaxially grown particles.
3.3. Precipitates Morphology and Complexity Observations
The coarsened particles were complex Nb-Ti(C,N) with various compositions. Particle coarsening by Ostwald ripening is known to occur at temperatures where there is high solute diffusivity and the particles are stable. Many of these particles were single-phase solid solution complex precipitates, whereas others showed diverse epitaxial morphologies.
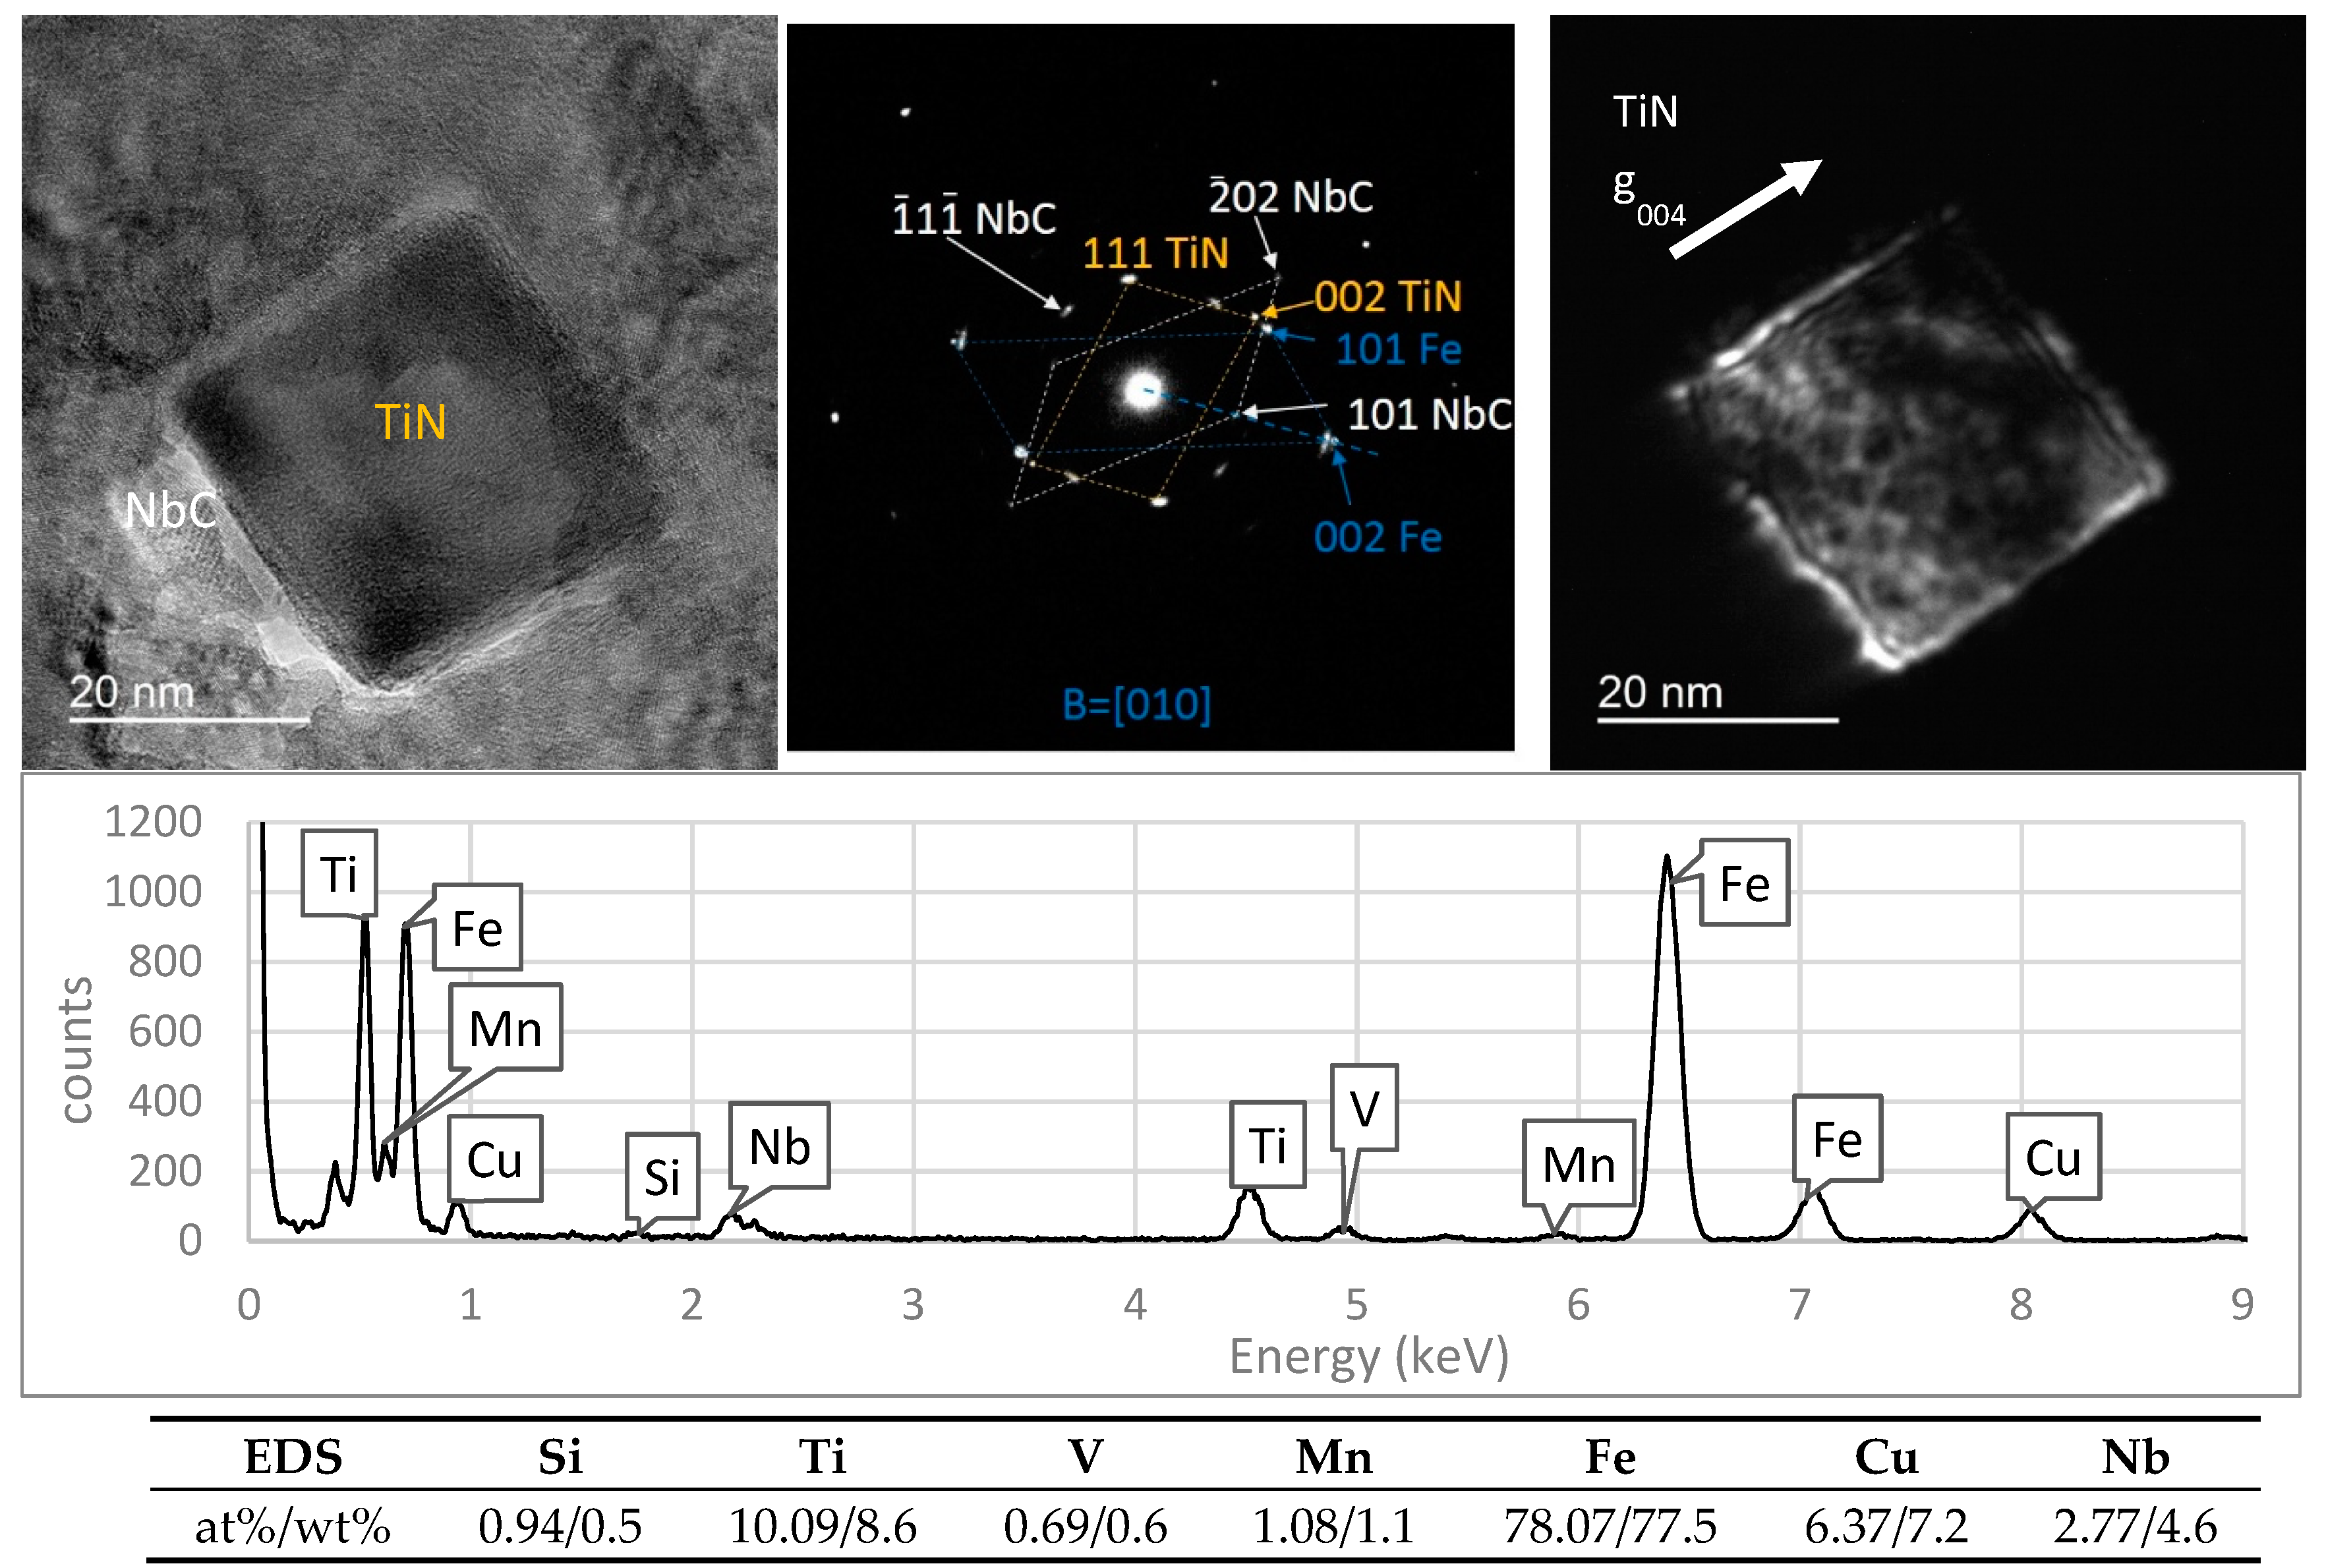
The higher experimental volume fraction, as compared to the calculated one, may be due to particles’ morphology and complexity. Precipitate analysis by TEM confirmed their complexity. The carbides were identified by Dark Field (DF) imaging and EDS. In Figure 7, an NbC particle was identified, adjacent to a TiN particle. The beam selected for DF is consistent with TiN interplanar spacing (004). Analysis of the Selected Area Diffraction Pattern (SADP) shows plane (101) from NbC parallel to (002) from the Fe (α’) matrix. This suggests coherence between these two phases at that set of planes. On the other hand, plane (101) Fe (α’) holds 6.76° with respect to (002) TiN and 13.6° with respect to (02) NbC. EDS analysis, shown at the bottom, did not detect C or N. The main microalloy elements are Ti and Nb. The detected V could be in solid solution in the matrix, or in the particles.
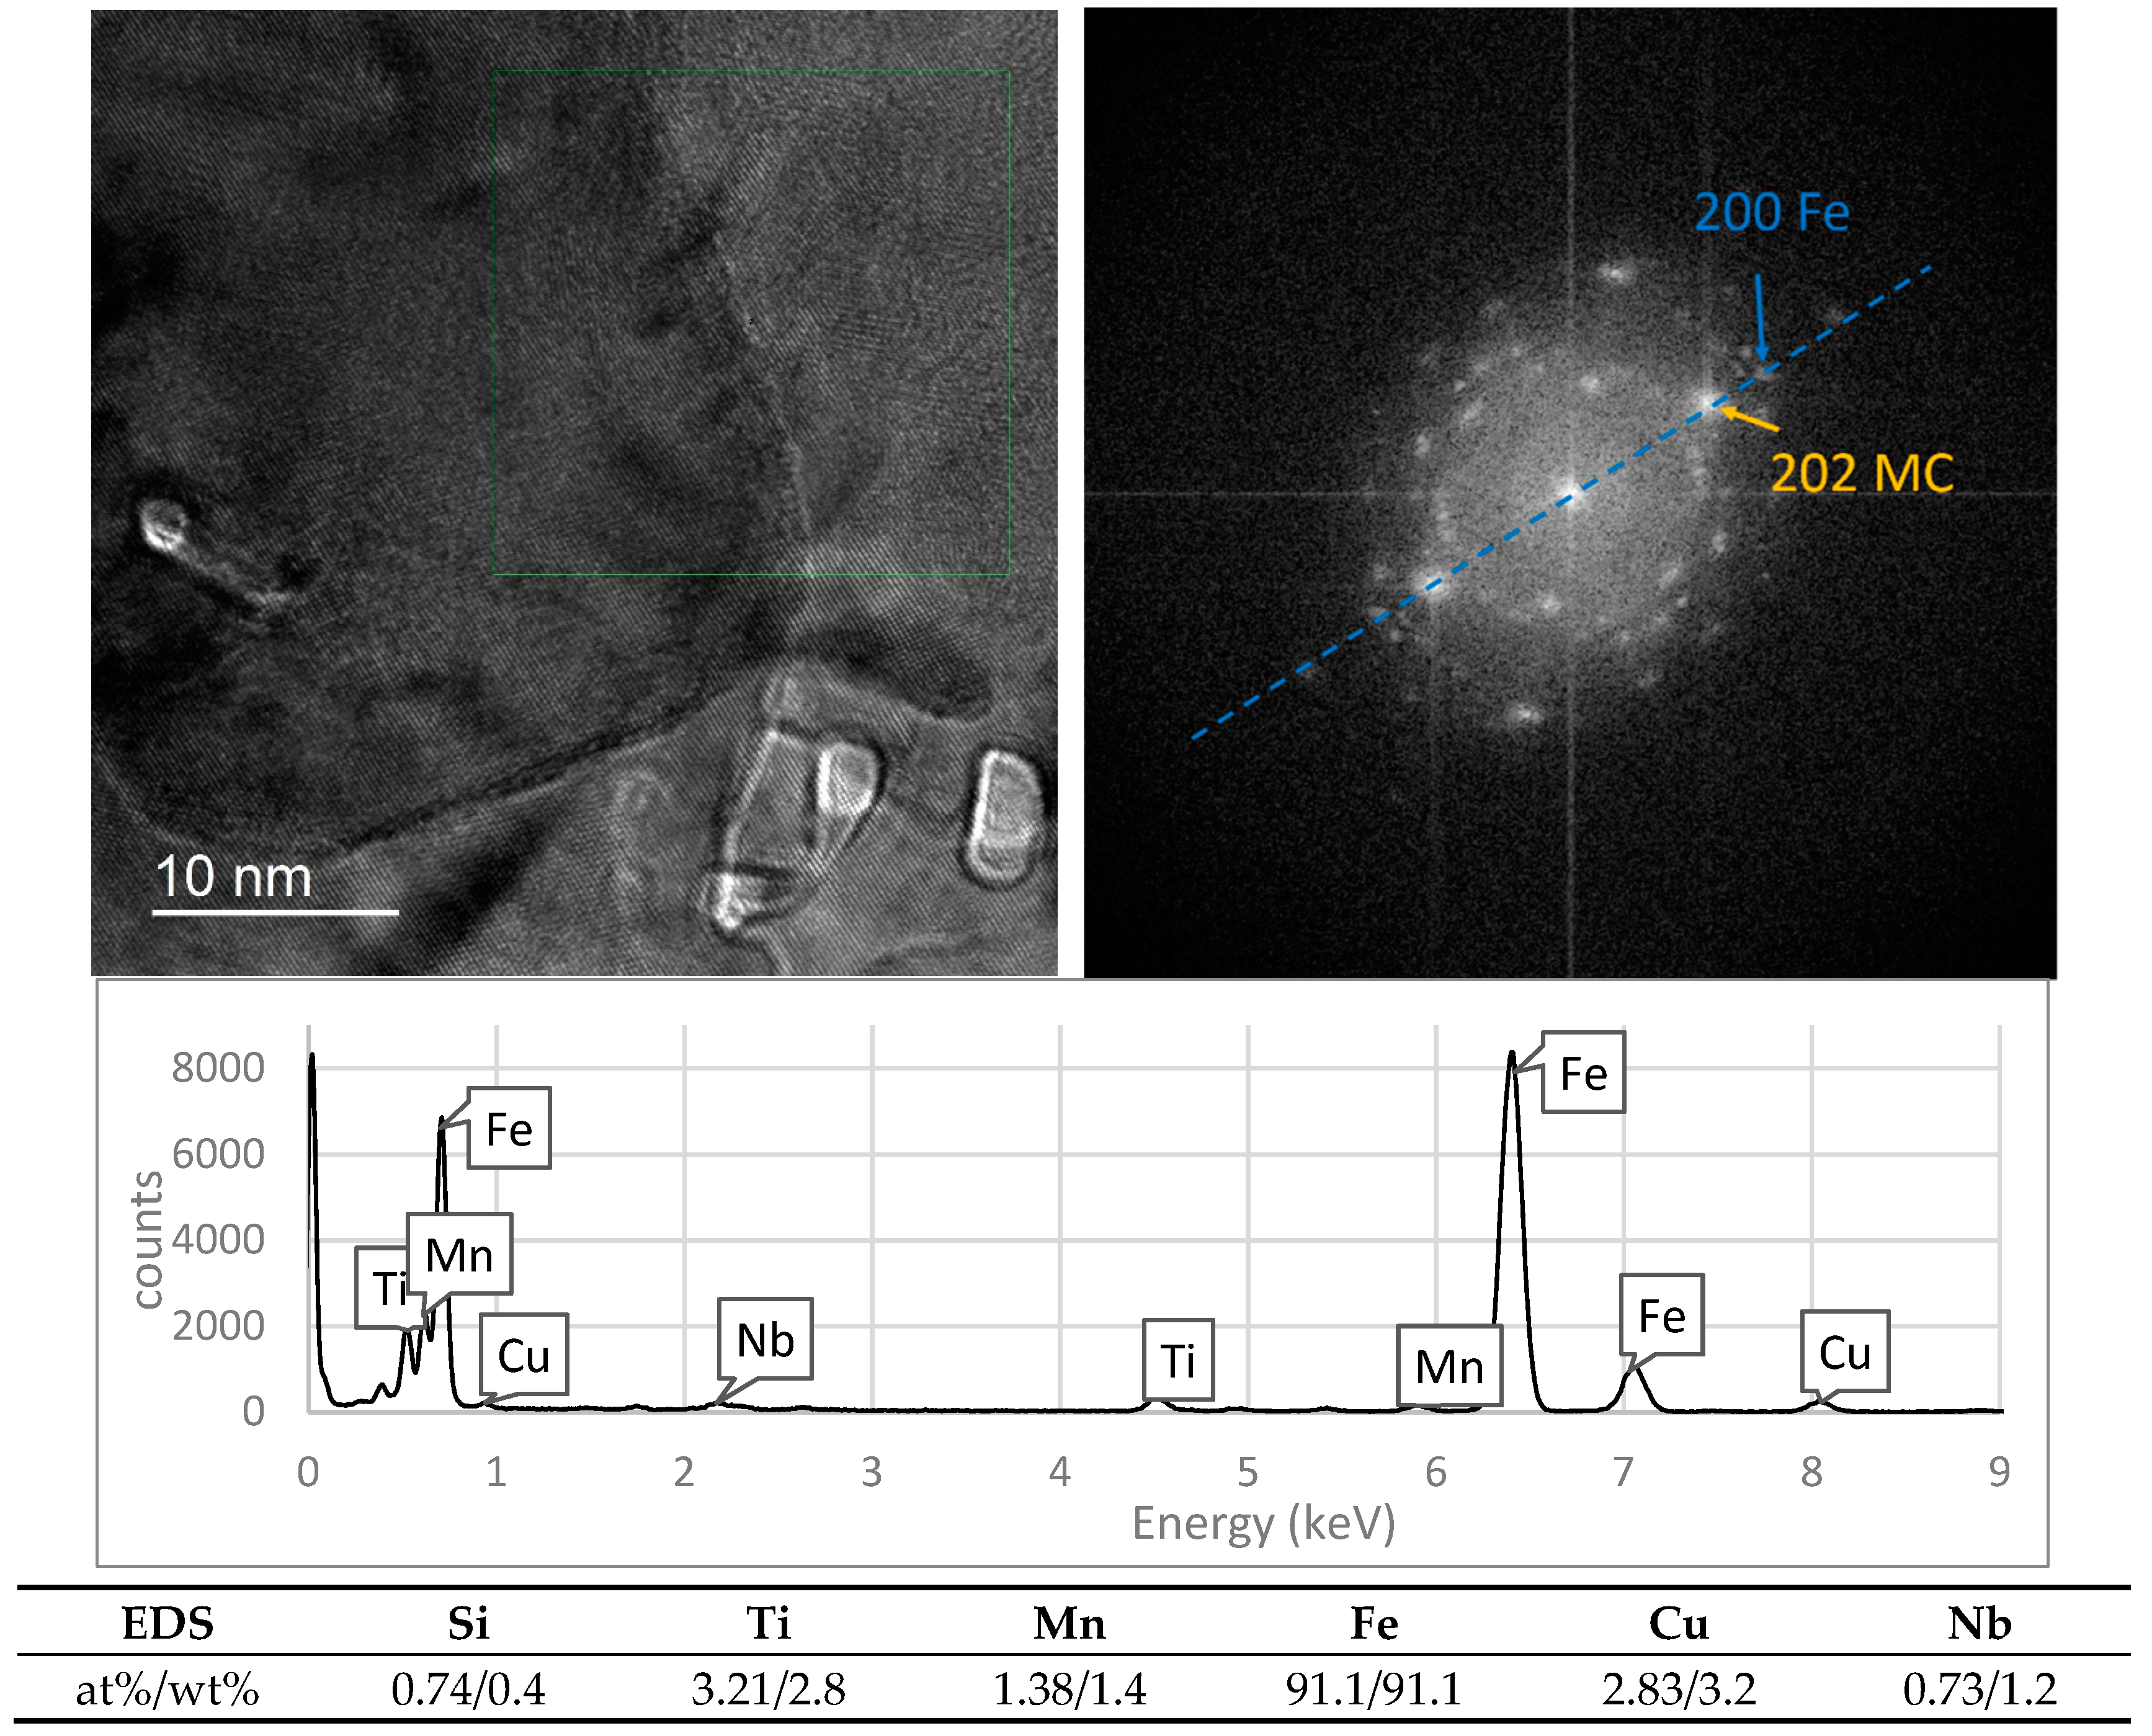
Coherency was found by High Resolution Transmission Electron Microscopy (HRTEM) in big complex particles—an example is presented in Figure 8. Continuity of fringes is observed at the matrix/particle interface. The corresponding Fast Fourier Transform (FFT) evidences the plane (202) from the carbide is parallel to (200) from the iron-based matrix.
NbC growth on pre-existing TiN has been reported in previous research works [9,10,11] as being formed during the solidification process. In the present study, numerous carbides contained Nb and Ti, and the reheating conditions were not enough to completely dissolve these complex particles. These particles have reportedly been effective at GB pinning and recrystallization inhibition [13].
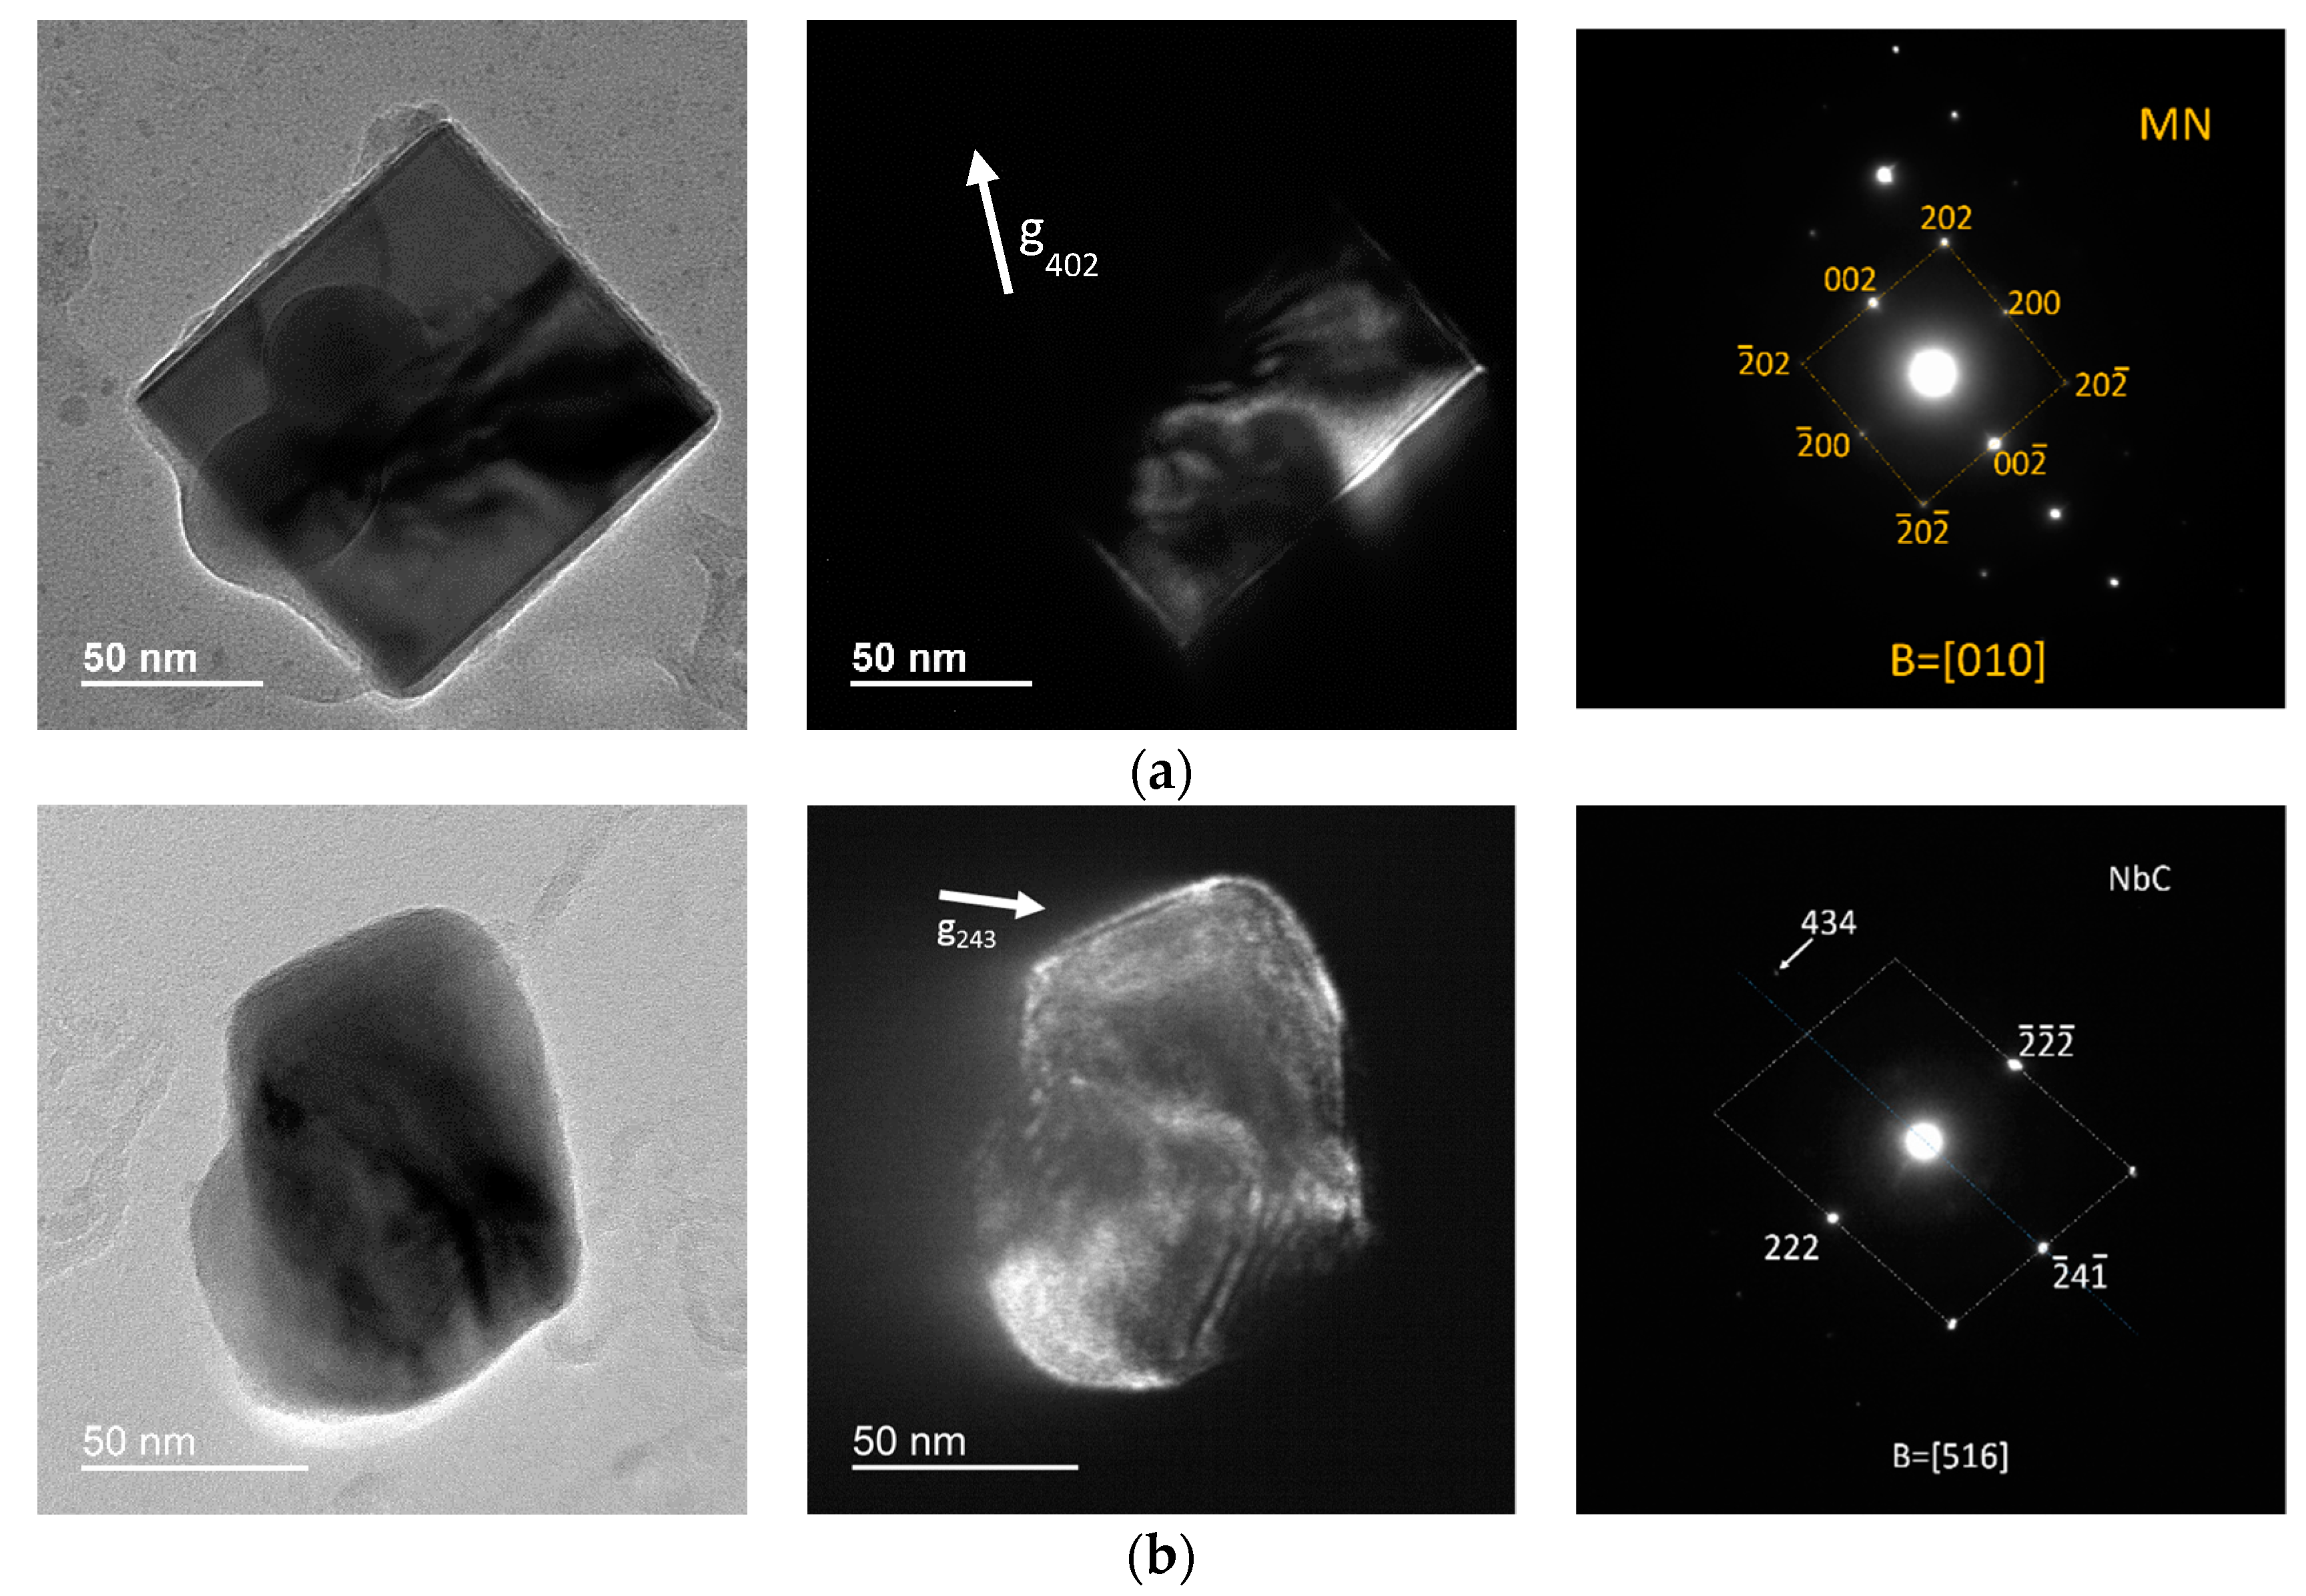
Precipitates in Figure 9 are examples of the complex precipitates found in both alloys within the 1150–1300 °C austenitization temperature range. Figure 9a is a particle found in low-Nb steel austenitized to 1300 °C for 1 h. Diffraction shows the [010] zone axis from where the beam [402] was used to produce the corresponding DF image. This DF image shows only half of the particle, indicating the bicrystalline nature of the particle. The precipitate in Figure 9b is an example of the presence of these complex precipitates at low austenitization temperatures. It was found in high-Nb steel austenitized to 1150 °C for 1 h. BF-DF of this particle shows its complex morphology.
Given the TEM evidence, it is highly likely that the epitaxial formation of precipitates is responsible for retarding dissolution. Two phenomena can be directly associated to the difficult dissolution of epitaxially grown precipitates: the reduction in the matrix/particle surface area and the low energy of particle/particle interfaces. Both phenomena hurdle the dissolution process. This may be responsible for the rich volume fraction of precipitates at high temperatures in both steels.
3.4. PAGS Measurements and Predictions
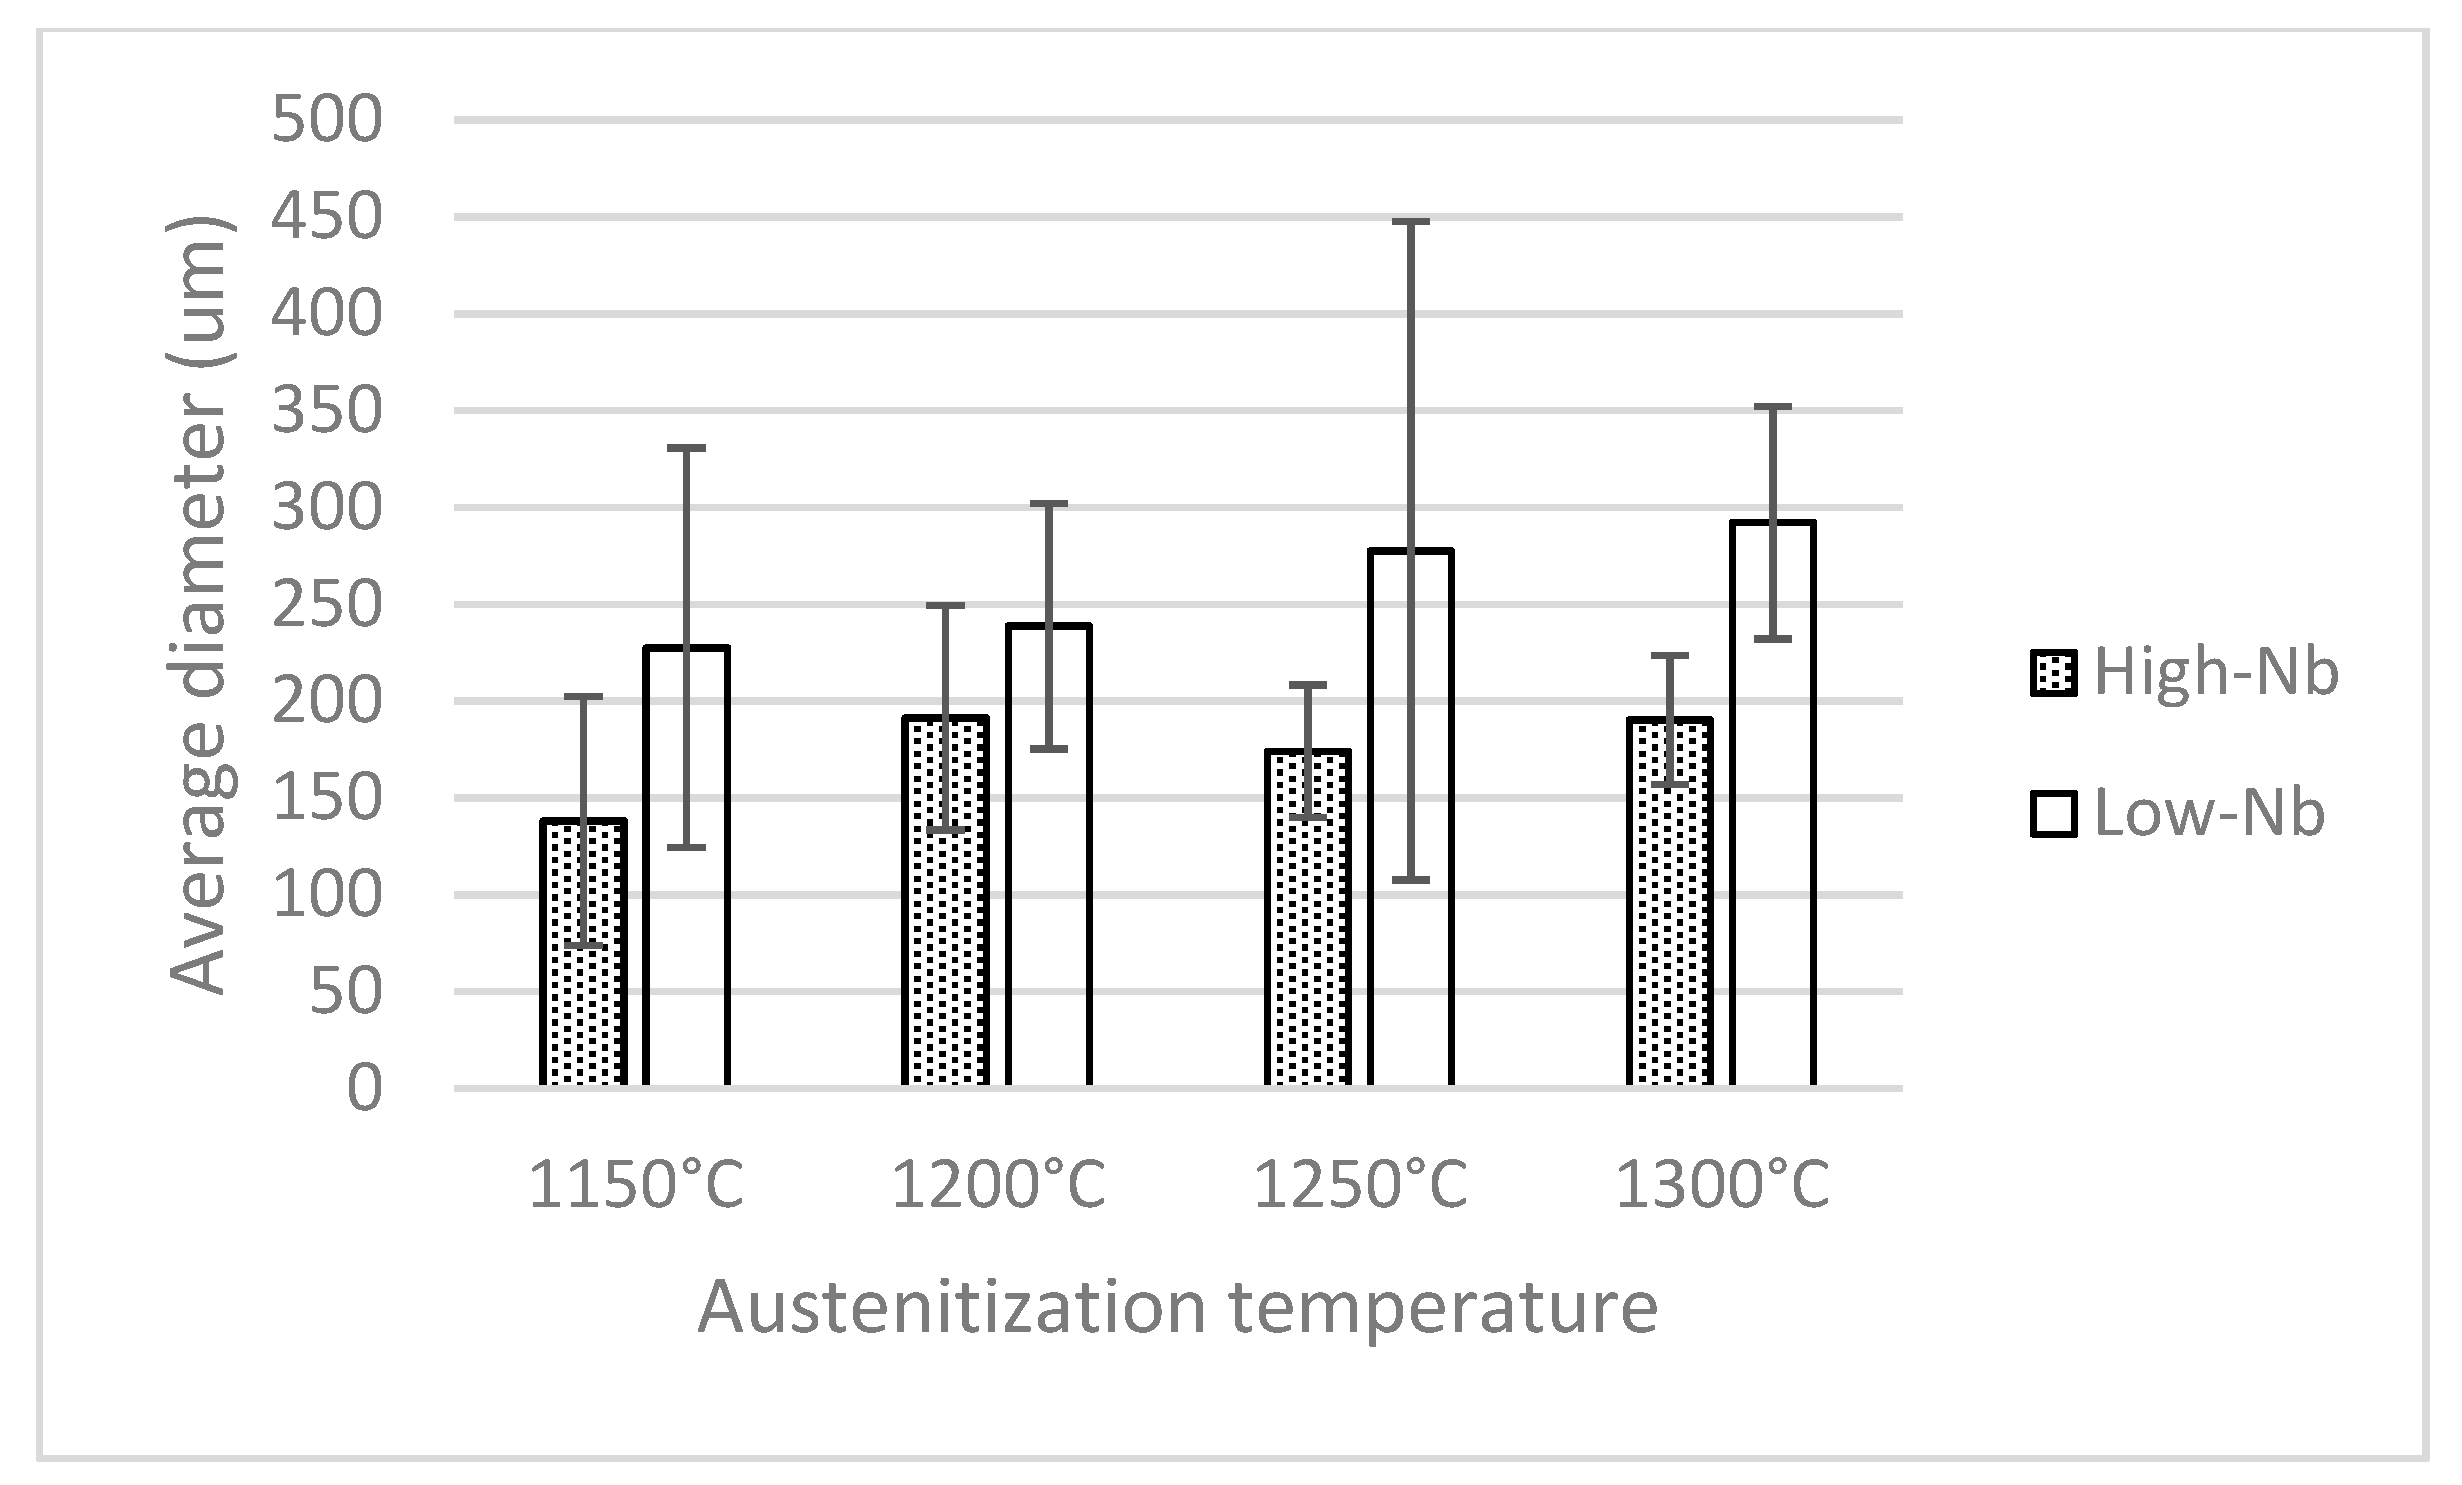
Measurements of PAGS are shown in Figure 10, where the average diameter of 50 grains is shown. A gradual increase in the average PAGS is observed as the temperature increases. The standard deviation at 1250 °C is broad for the low Nb steel, indicating that this steel has entered the abnormal growth stage. At 1300 °C the standard deviation is narrower, denoting homogeneous grain growth.
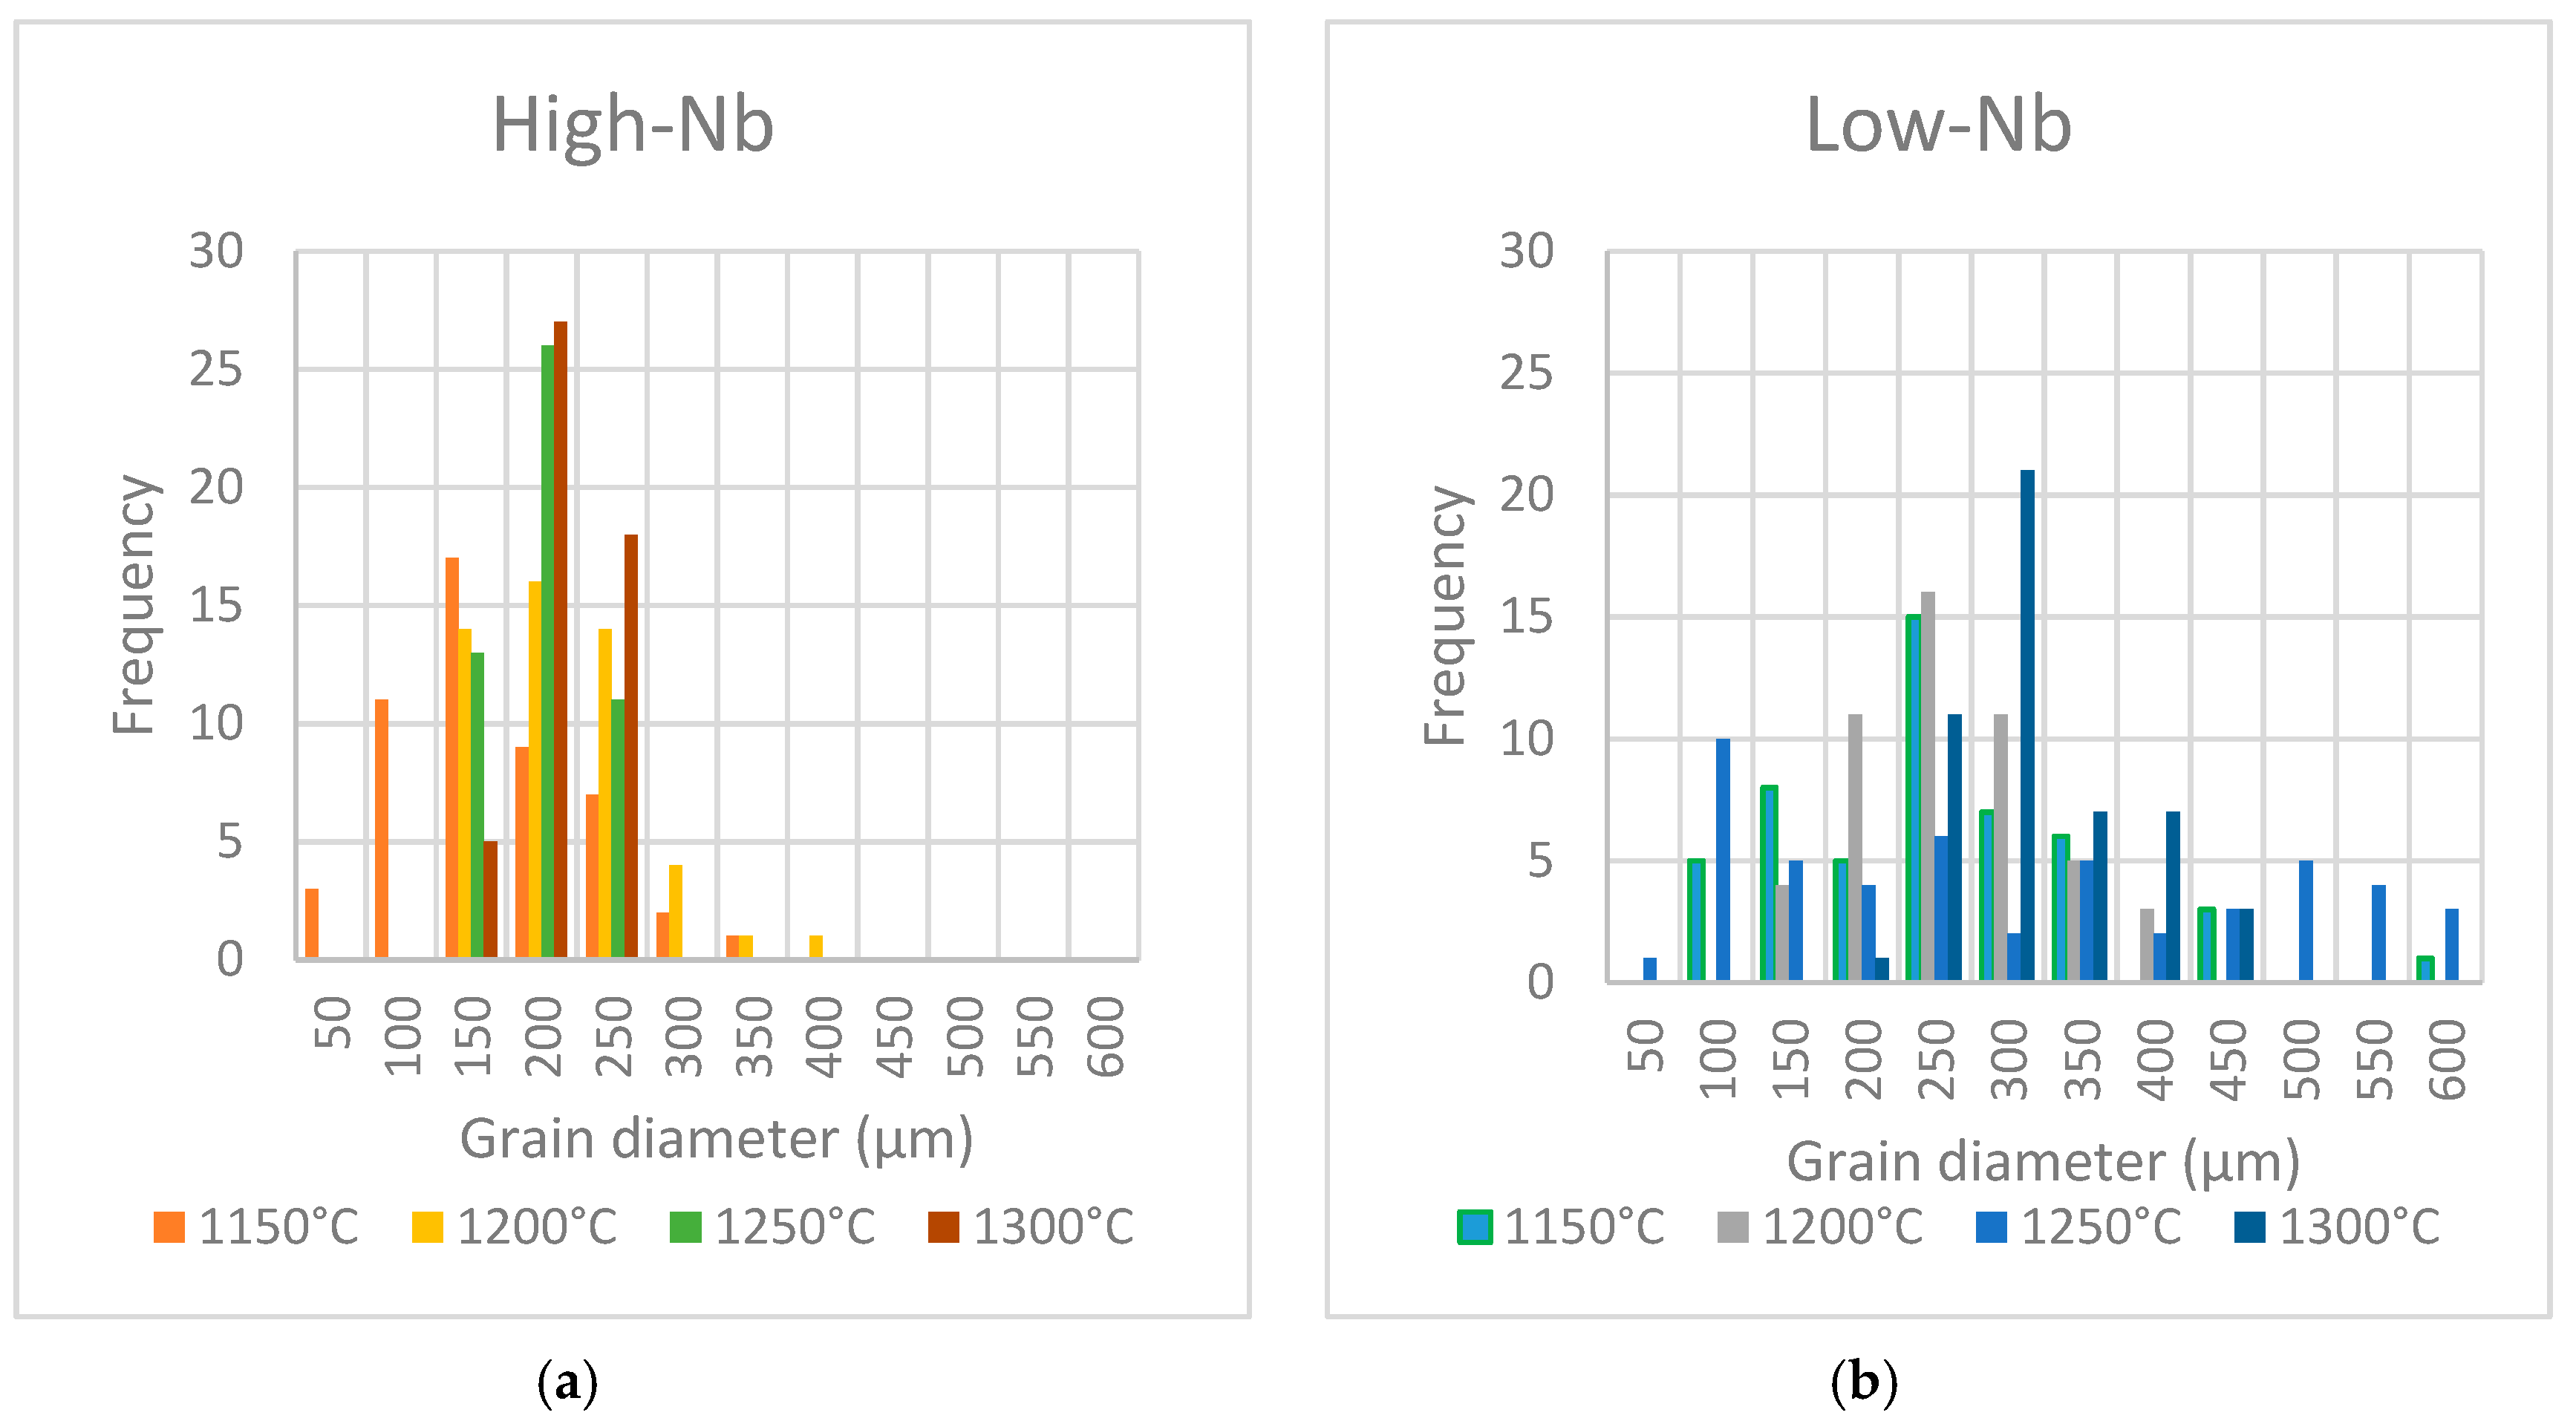
The grain size distribution is shown in Figure 11. The low-Nb steel maintains a stable size at 1150 and 1200 °C, peaking close to 250 μm on both cases. At 1250 °C, however, grain size distribution is spread, denoting abnormal growth. At 1300 °C, the small grains have yield way to the grown ones, hence the population is more normal.
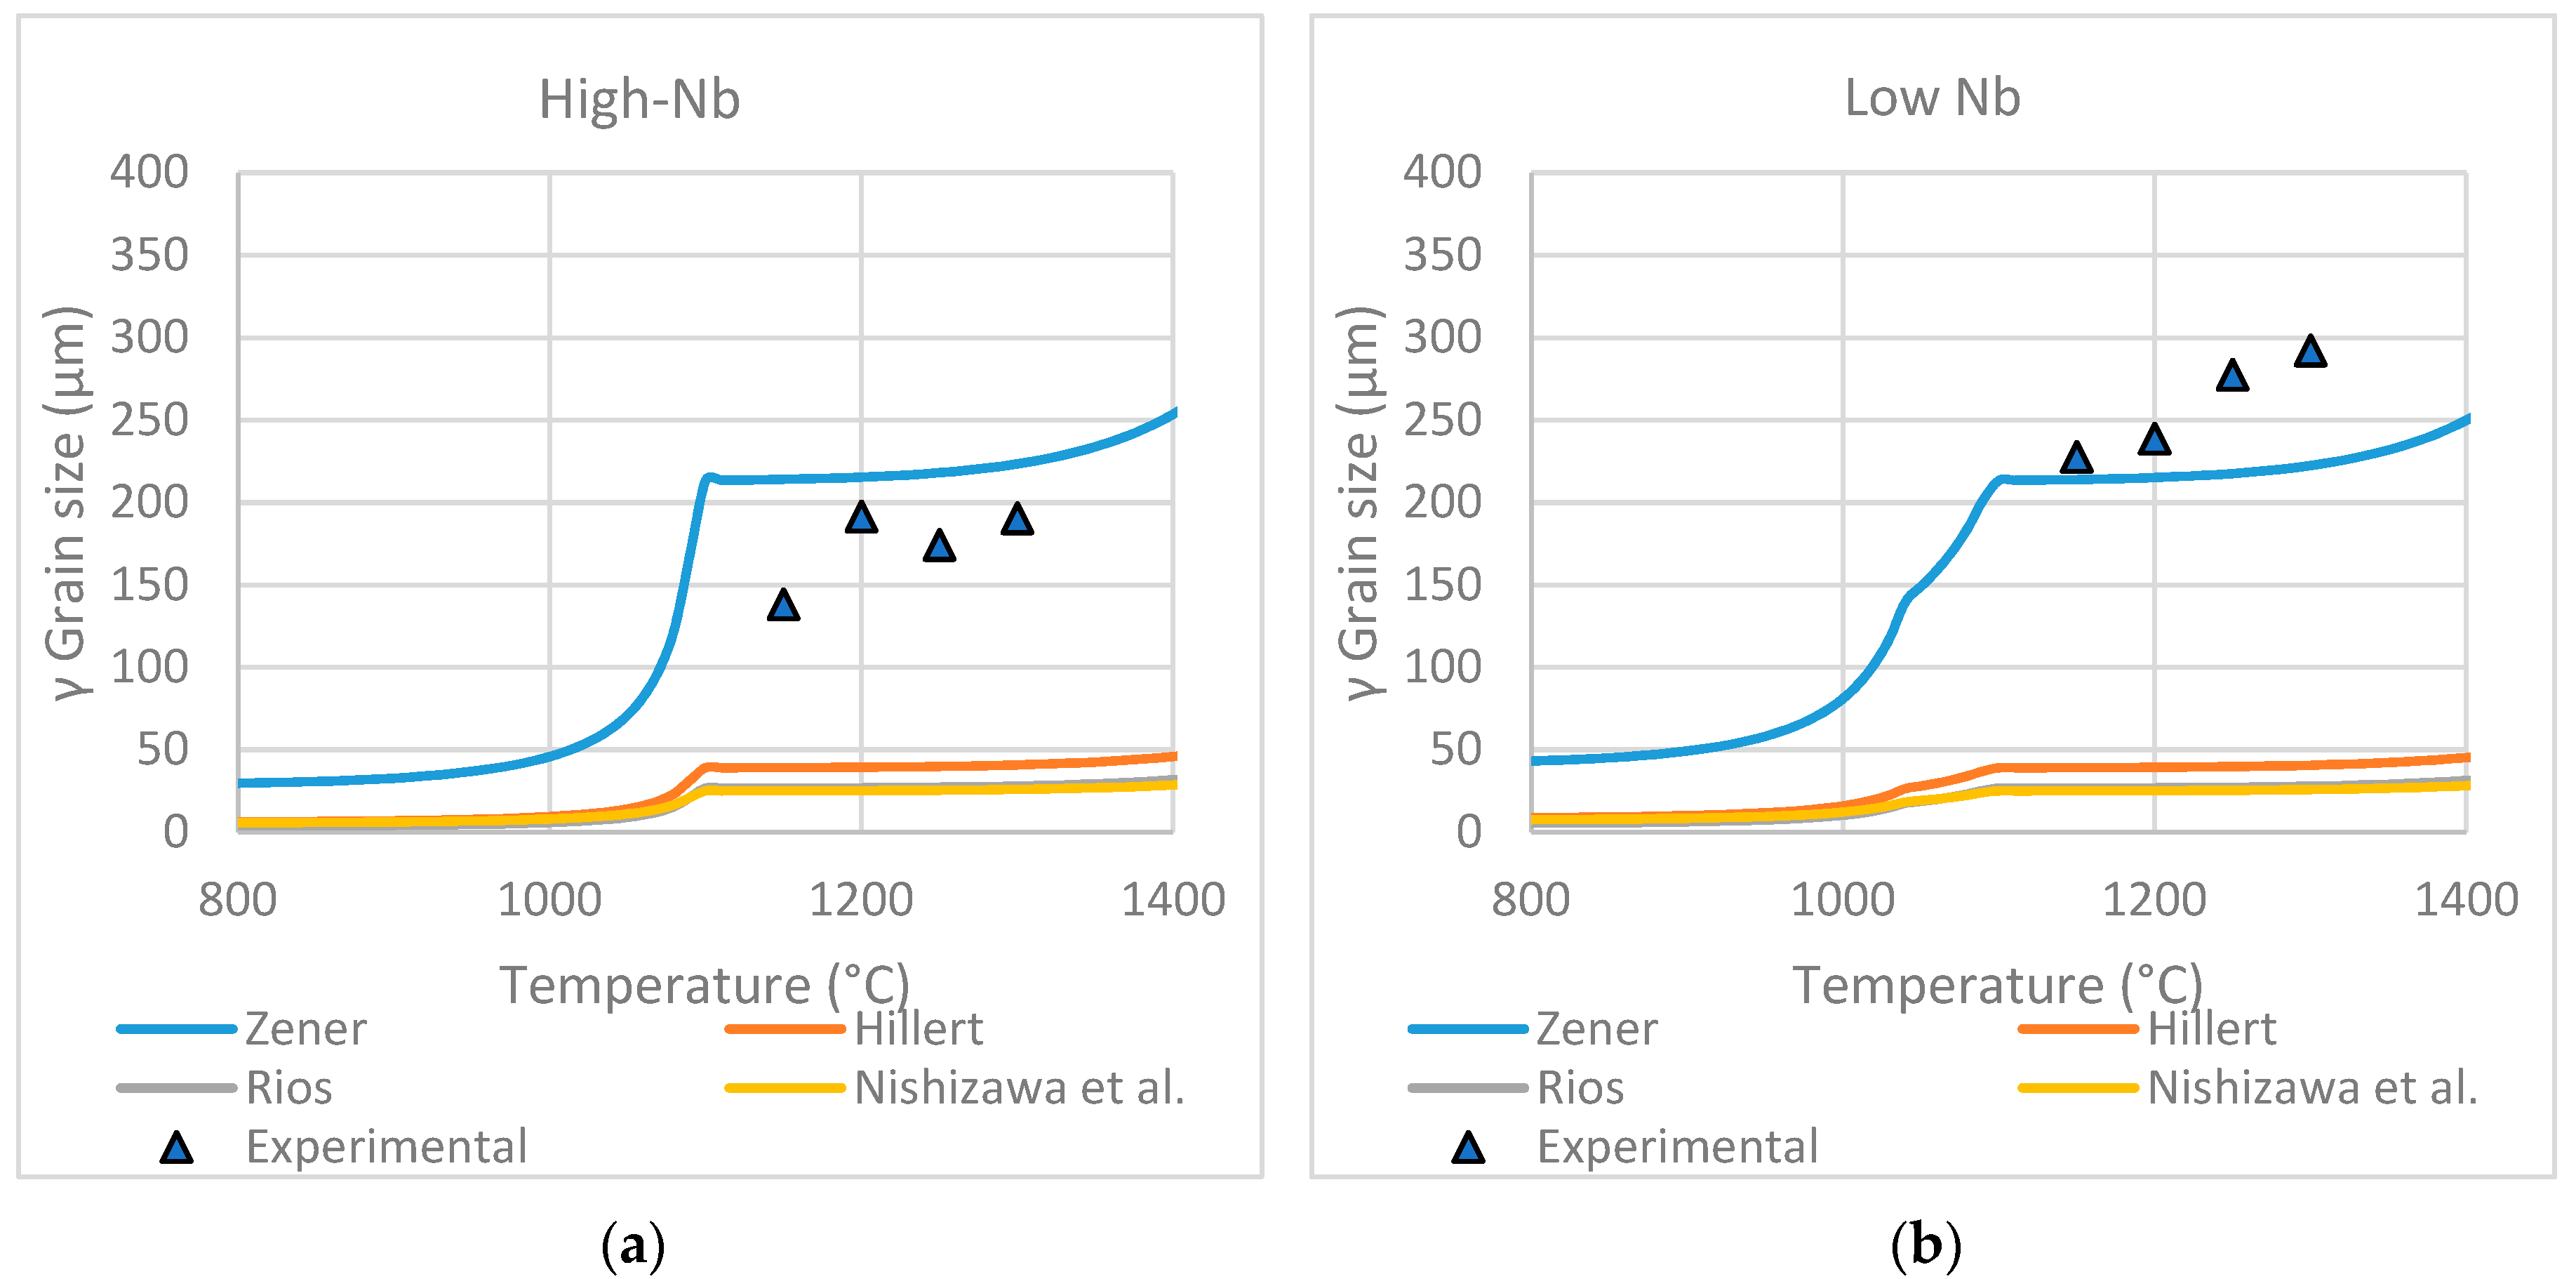
Zener’s model for precipitate-limited grain size was utilized to predict PAGS. Results in Figure 12 show coarsening starting at 1250 °C for the Low-Nb alloy and 1300 °C for the High-Nb alloy. Three other models by Gladman-Hillert [3], Rios [4,5], and Nishizawa, et al. [6] were used, predicting PAGS one order of magnitude smaller. However, a bigger mismatch is present if the measured precipitate volume fraction is used for estimating the PAGS. The estimation is too little compared to experimental results; these models need further reviewing for the present alloys.
3.5. EBSD Reconstruction of PAGB
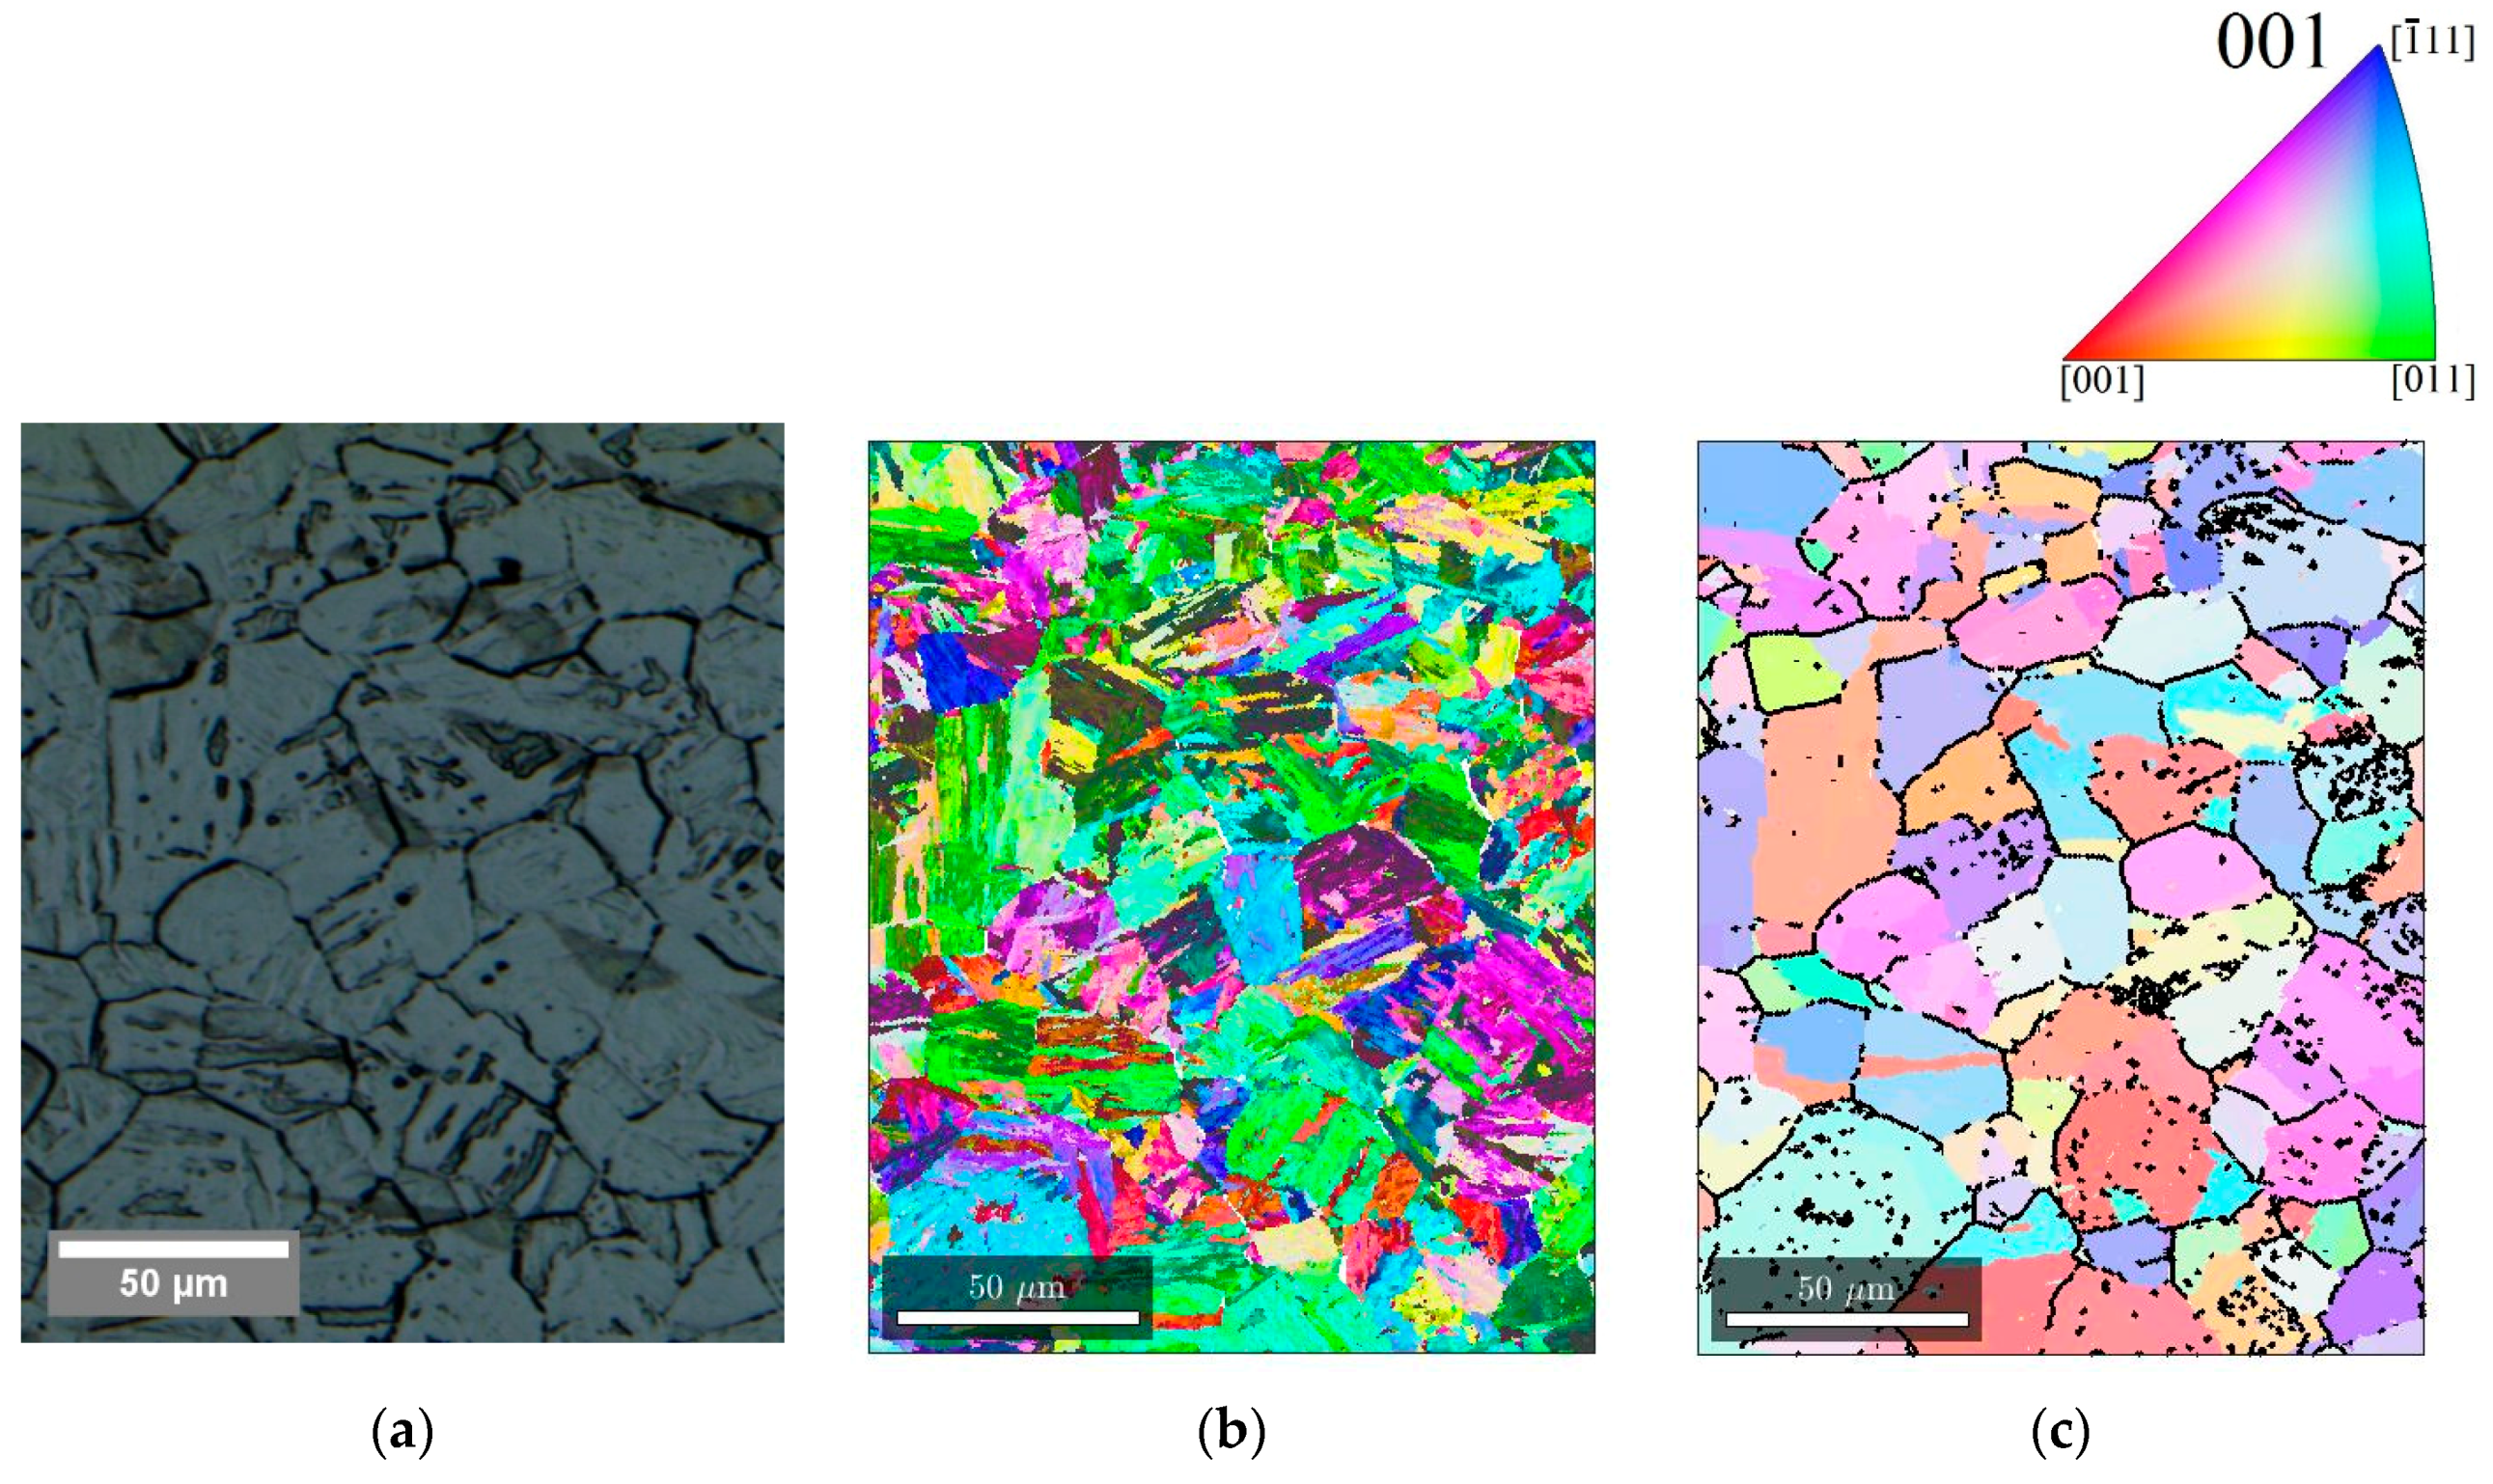
EBSD mapping was done on the samples that were quenched after austenitization. From the martensitic structure EBSD scans, maps of prior-austenite were reconstructed. Figure 13 shows the correspondence between PAGS revealed by etching, the martensitic EBSD Orientation Imaging Microscopy (OIM) map and reconstructed parent-phase austenite OIM map. Comparing Figure 13a to Figure 13c, a grain boundary correspondence is observed.
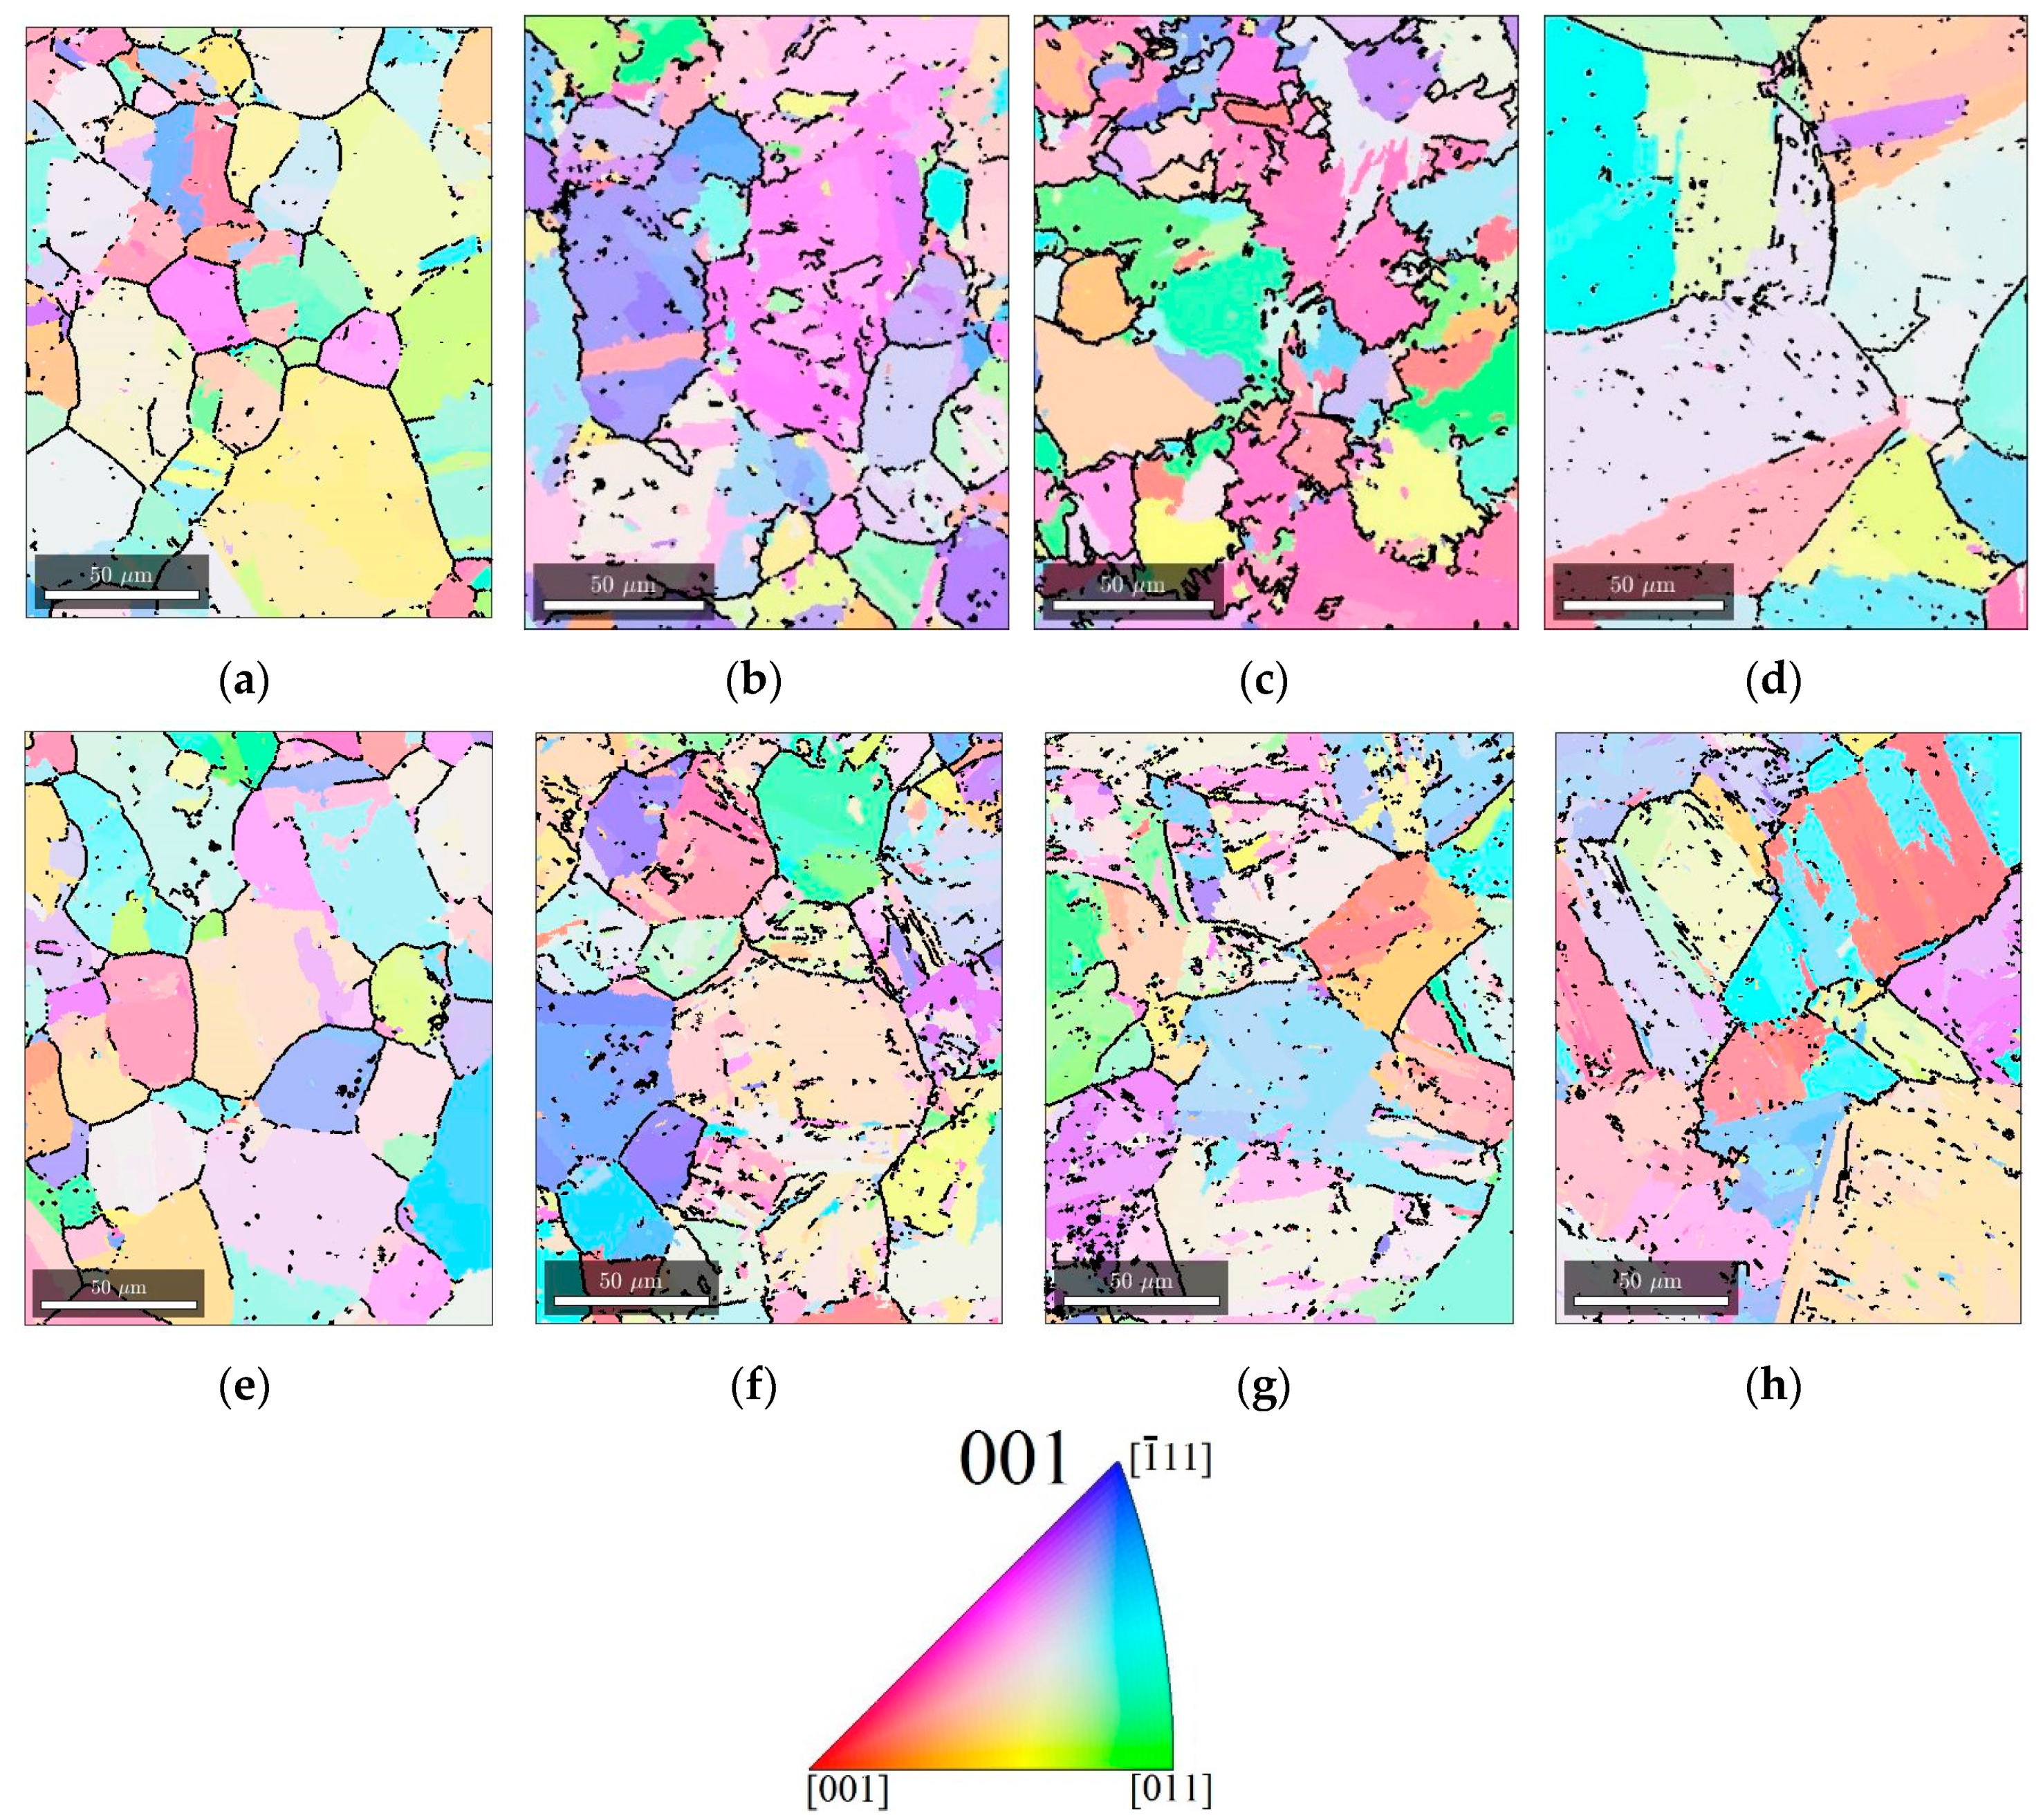
The resulting austenite maps showed similar grain sizes to the measurements presented in Figure 10. In Figure 14, the top row shows the grain coarsening behavior of the high-Nb alloy. Grain coarsening was avoided below 1300 °C. Meanwhile, the low-Nb alloy, shown in the bottom row of Figure 14, behaves according to the measurements by light microscopy on Figure 10 and Figure 11.
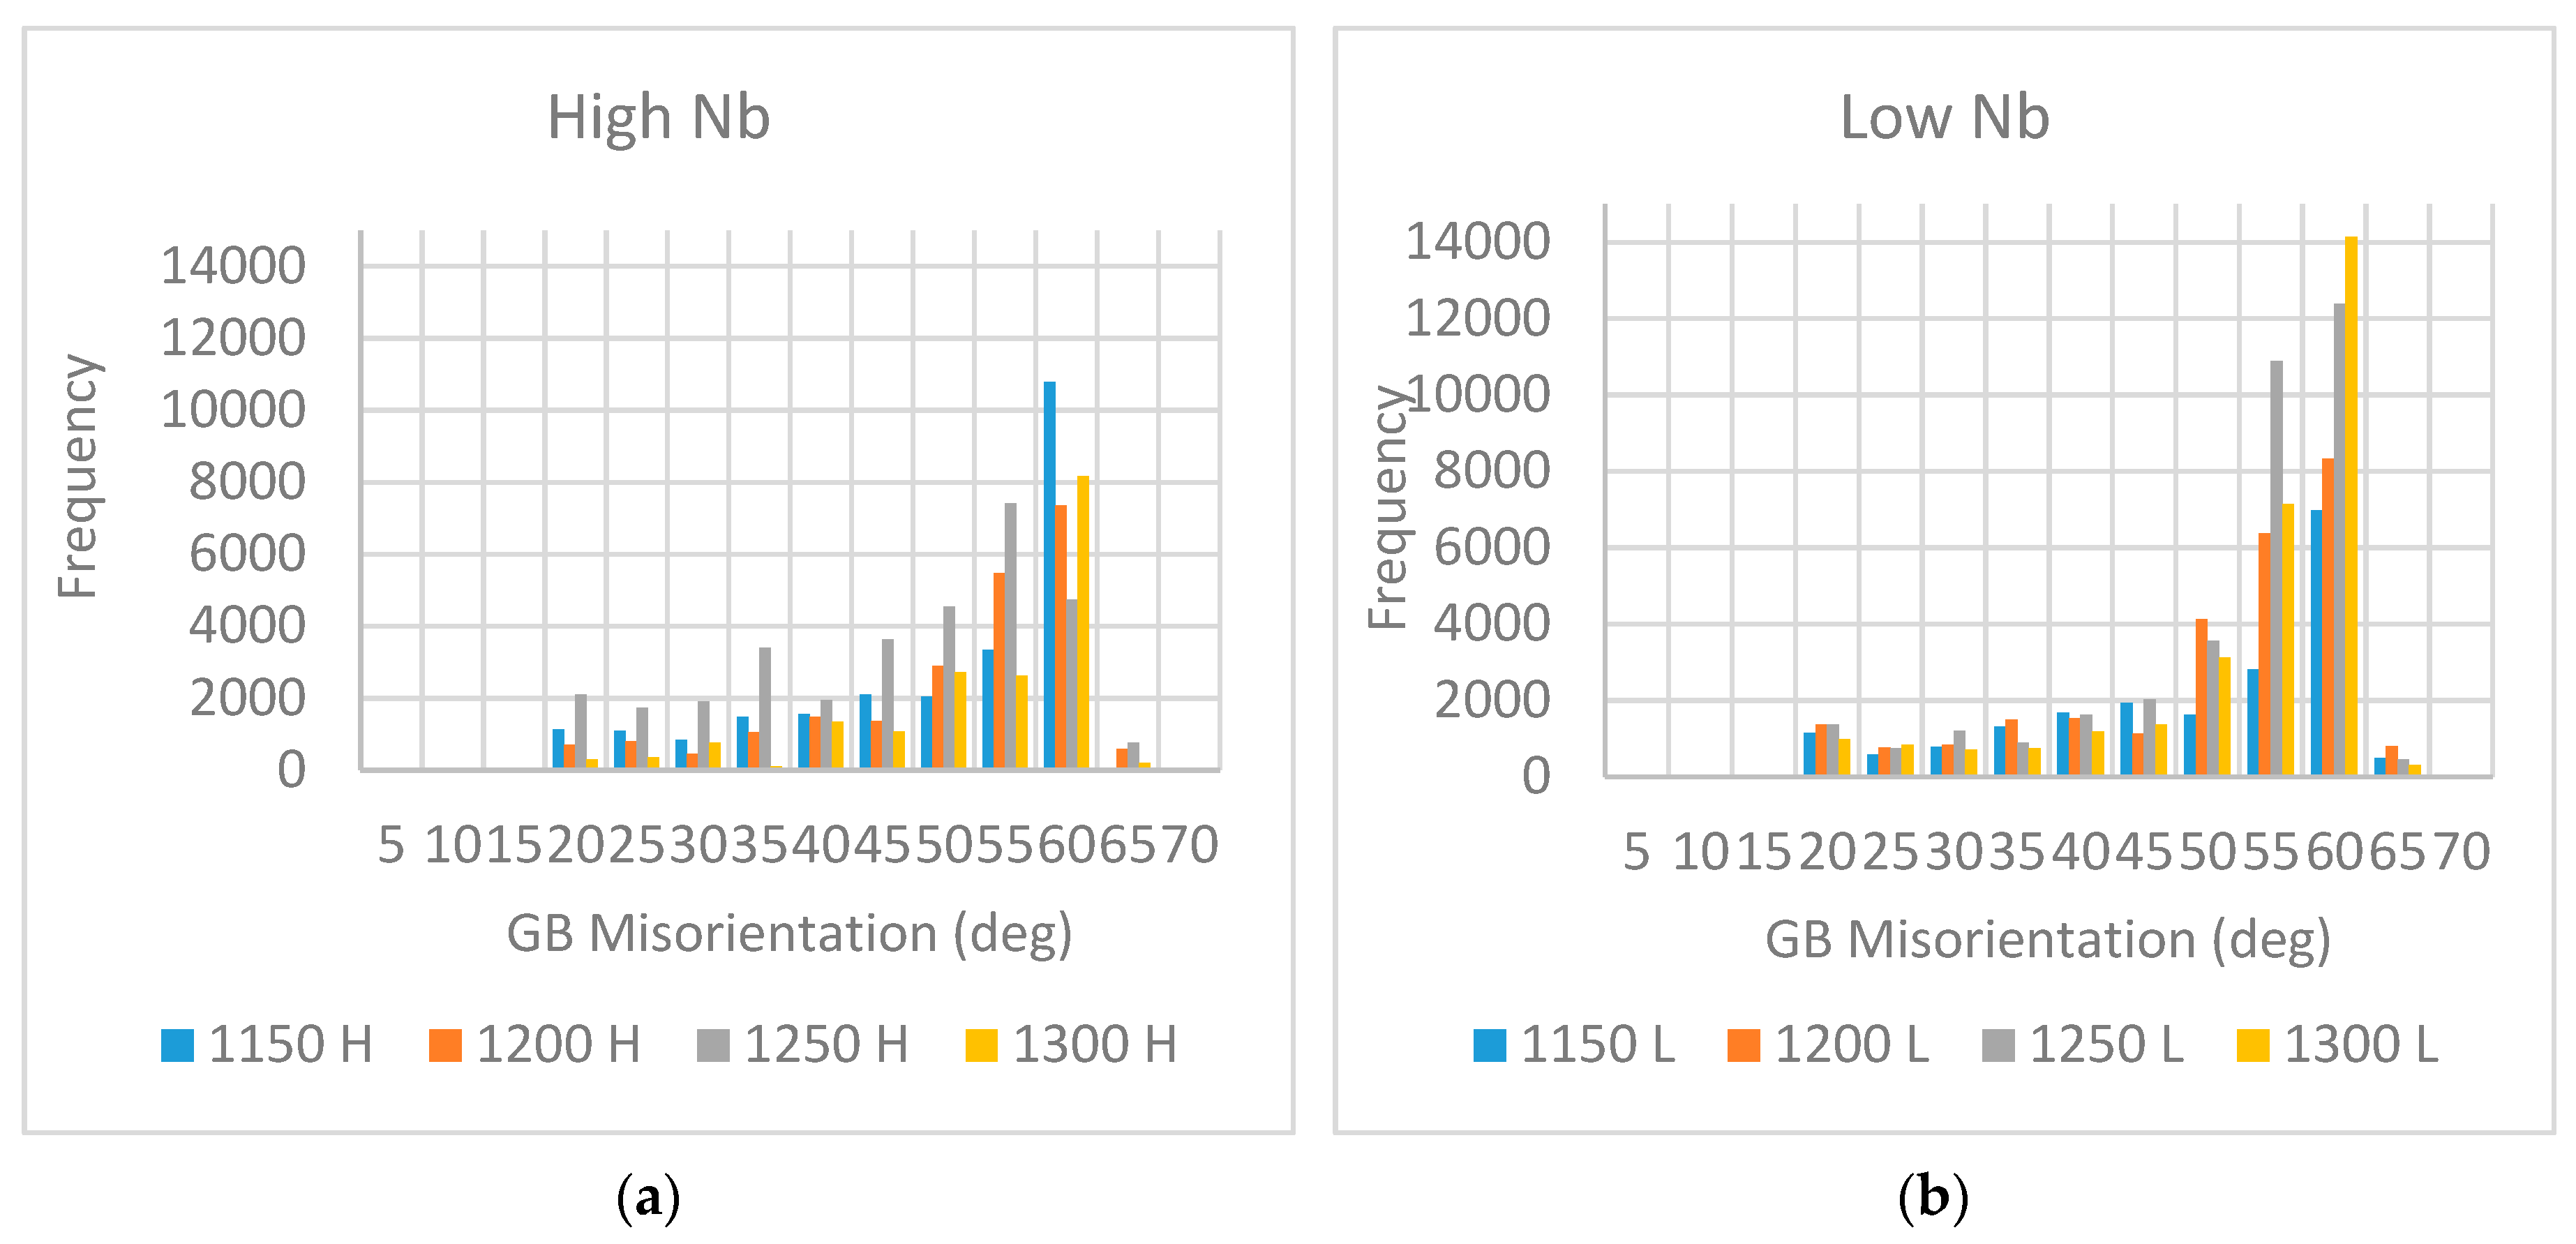
Grain Boundary Misorientation Distribution changes due to reheating temperature were observed thanks to the reconstructed austenitic maps. GB misorientation data was collected from the maps and its distribution is plotted in Figure 15. A clear trend of an increasing population of GBs with misorientation above 50° occurs in the low-Nb alloy, at the expense of GBs with misorientations 20–50°, whereas on the high-Nb alloy there is not a clear trend. This decrease in boundaries between 20° and 50° may be due to grain coarsening; it has been proposed by other authors [19,20] that GBs in this range have high energy and high mobility. A consequence of this high mobility is that these boundaries are more susceptible to disappear, as they close in on each other, devouring grains. This behavior is not observed in the high-Nb steel, where coarsening did not take place.
4. Discussion
The empirical volume fractions of precipitates, compared to the experimentally-based volume fractions, provided a better understanding of the observed retardation of the grain coarsening behavior. The experimentally based volume fraction exceeds calculated predictions, including calculations that consider the mutual solubility of precipitates, which happened experimentally. Mutual carbo-nitrides solubility produced complex and more stable particles.
The presence of complex precipitates explains the present experiments—the grain-coarsening temperature is higher than calculated. The jump in grain size of Low-Nb steel can be observed in Figure 14, where it happens between 1200 and 1250 °C. Moreover, the drop in experimental precipitate volume fraction is observed to happen after 1250 °C in Figure 6. This evidence strongly suggests that lower Nb contents are efficient to control PAGS, under the experimental conditions used in this study.
Grain-coarsening studies in similar alloys agree on the effectiveness of Ti-Nb microalloyed steels [12,21,22,23] to keep fine PAGS at high temperature. Alogab, et al. [21,24] have shown how Nb adds resistance to austenitic grain coarsening during carburization, through different heating rates and temperatures below 1100 °C. Their work treats TiN and NbC separately. A study by Zou and Kirkaldy [25] on very similar alloys agrees that Nb-Ti complex particles nucleate on Ti-rich particles, but, as they coarsen, the Nb content increases. Another study [23] used a very similar alloy to High-Nb steel and found abnormal growth after 1 h of soaking at 1050 °C. However, they did not report the occurrence of epitaxial NbC on TiN. Hence, their results agree with our hypothesis that Nb-Ti complex particles are responsible for the retardation of dissolution as compared to plain TiN or plain NbC.
Other studies involving very similar steels agree that (Nb,Ti)C precipitates are highly likely to form [22]. Zhang, et al. [15] have done first-principles calculations of interfacial energies between NbC, TiC and TiN, and have justified the heterogeneous nucleation of NbC at these particles’ surfaces. Graux, et al. [14] have modeled the PAGS in a Ti-Nb microalloyed steel, and have considered Ti-Nb particles. They have found (Ti,Nb)C stable after 30 min at 1200 °C. Furthermore, a theoretical study by Hutchinson, et al. [26] suggests that as NbC dissolves, Nb remains an important GB deterrent by solute drag.
The results of this work support the feasibility of using lower Nb contents while still maintaining good control of PAGS. The present work has shown that grain-coarsening behavior of a low-Nb alloy is controlled by a delay in the dissolution of the precipitates. However, further work is required to fully understand the relationship between the epitaxial growth of NbC on TiN and the retardation of the dissolution behavior. Future work should utilize an Nb-free alloy compared to two Nb-Ti bearing alloys. The mechanisms of dissolution of epitaxial particles need to be verified for these alloys. The role of factors like interfacial energy, morphology and phenomena like epitaxial growth, Ostwald ripening and GB-particle interactions need to be studied in alloys containing these precipitate types.
5. Conclusions
A low-Nb LP steel demonstrated good PAGS control up to 1200 °C with the holding times used in this study. This behavior exceeded empirical equilibrium-based expectations. The thermodynamic equilibrium equations used for predicting precipitates dissolution temperature need to be revised for the case of binary precipitates containing additional epitaxial precipitation, i.e., TiN + NbC.
Experimental evidence showed a higher dissolution temperature than calculated models predict, especially for complex precipitates. The epitaxial presence of NbC on TiN led to the conclusion of slower dissolution due to interface energy and area reduction. The reconstruction of prior austenite maps through the Nyyssönnen, et al. method proved useful and in close agreement with the traditional PAGS-revealing method.
Author Contributions
Conceptualization, G.S.-B., M.M. and C.I.G.; methodology, G.S.-B.; validation, G.S.-B., M.M. and C.I.G.; formal analysis, G.S.-B.; investigation, G.S.-B. and M.M.; resources, M.M. and C.I.G.; data curation, G.S.-B.; writing—original draft preparation, G.S.-B.; writing—review and editing, C.I.G.; visualization, G.S.-B.; supervision, C.I.G.; project administration, C.I.G.; funding acquisition, C.I.G. All authors have read and agreed to the published version of the manuscript.
Funding
This research was funded by the Pennsylvania Department of Community and Economic Development CMU Subcontract 1060145-406196—Pitt I# 0062204; Programa para el Desarrollo Profesional Docente, PRODEP DSA/103.5/15/9555; United States Steel Corporation, and the APC was funded by The Ferrous Physical Metallurgy research group at University of Pittsburgh.
Acknowledgments
We are grateful for the support of: PRODEP México, Universidad Veracruzana, Roberto Rocca Education Program and Pennsylvania Department of Community and Economic Development. The authors want to thank the Ferrous Physical Metallurgy Research Group fellows and collaborators at University of Pittsburgh, as much as to collaborators at United States Steel Corporation: Justin Bryan, Debra Giansante, Andrew Warble and Christopher Snyder.
Conflicts of Interest
The authors declare no conflict of interest. The funders had no role in the design of the study; in the collection, analyses, or interpretation of data; in the writing of the manuscript, or in the decision to publish the results.
Appendix A
The calculations for volume fractions were done in the following manner. Let us first consider the solubility products of the precipitates involved. The solubility product denotes the equilibrium concentrations of the alloying elements at a given temperature. For instance, the concentrations of M and N in equilibrium with the precipitate MmNn are given by
and are mole fractions of M and N in solution and K is the solubility product [27]. The solubility product changes with temperature, allowing for dissolution at higher temperature.
where ∆H represents the precipitate’s enthalpy of formation in the matrix and K0 is a constant. Empirical adaptations use weight percentages instead of molar fractions of the solutes, and express the solubility product, Ks, as
where T, is the temperature of the alloy and the constants A, and B, are experimentally determined. These values were collected for the involved precipitates in an austenitic matrix and, combined with mass balance equations, a series of quadratic equations was produced. Then, these equations were solved in order of precipitate stability as expected from Gibbs’ free energy of formation.
As the alloy cools down, for instance, the preferable nitride is TiN. After TiN forms, the remaining N is available to form AlN, NbN and VN, in that preferential order. Similarly, for carbides, the preferential order for carbon would be TiC, NbC, VC, MoC. Following that order, the system of equations was solved for the mass fraction of every element that is in precipitate form at temperature intervals of 10 °C, from 200 to 1500 °C.
Cooling from high temperatures, the first precipitate to be formed would be TiN. Hence, after all the possible TiN has been formed and equilibrium is reached, the following equations must hold true
where XT is the total mass fraction content in the bulk composition of species X, is the mass fraction of X that remains in solid solution and XTiN is the mass fraction of the species X in the form of TiN. Now, considering the stoichiometric mass ratio of TiN and following the same nomenclature, Equation (A4) can be re-written as
The solid solution contents of N and Ti in equilibrium with TiN are related through the solubility product, KTiN. So, substituting TiTiN from Equation (A1) into Equation (A6), we can write
Now, notice that NT and TiT are known fractions from our bulk composition, and KTiN is known as a function of temperature from experimental reports in the literature (See Table A1).

Table A1.
Solubility products of precipitates of interest in Austenite.
| Reference | |||
|---|---|---|---|
| A | B | ||
| 3.42 | 7900 | Gladman [28] | |
| 2.8 | 8500 | Gladman [28] | |
| 5.33 | 10,475 | Gladman [28] | |
| 3.82 | 15,020 | Gladman [28] | |
| 1.8 | 7750 | Gao-Baker [2] | |
| 4.45 | 6560 | Turkdogan [29,30] | |
| 2.86 | 7700 | Turkdogan [29,30] | |
| 1.29 | 523 | Pavlina, et al. [31] | |
Hence, Equation (A7) can be rearranged and solved for
as a quadratic equation for every temperature of interest.
Once is found as the solid solution concentration of nitrogen in equilibrium with TiN, the simple mass balance from Equation (A6) helps us find NTiN, the amount of N in TiN. This way, the amount of TiN present at every temperature during cooling is found using the stoichiometric mass ratio.
Calculations for the mass fraction of every precipitate followed this method. Every new calculation considered new mass balance equations, accounting for the mass already precipitated in the higher temperature stable precipitates. For instance, when calculating MoC mass fraction, the mass balance equation for carbon must consider that precipitations of TiC, NbC and VC have already happened. Hence it must be written
When MoC precipitates, however, all other considered carbides are already present, so the amount of carbon present in each is known. Hence, the only unknowns in this equation are CMoC and .
Appendix B
Solubility product models that consider the complexity of precipitates mutual solubility have been proposed elsewhere [32,33,34]. The present work used a simplified system of equations, inspired by Xu, et al.’s work. A system of 21 equations was reduced to eight equations and eight unknowns. The eight main equations came from two equations of activity of the precipitates, and six equations of the mass balance of C, N, Ti, Nb, V and Al. These eight equations were fed with the other 13 equations, relating the solubility products of seven precipitates (AlN, TiC, TiN, NbC, NbN, VC and VN) and the activities of the six involved components.
The first two main equations state assumptions of activities equal to one, for a stable precipitate in the matrix. The mutual solubility of TiC, TiN, NbC, NbN, VC and VN is considered, so the combined activity of this complex precipitate is 1, whereas AlN is insoluble, so its activity remains 1:
Mass balance provided the other six main equations. For every element, the amount present in every phase must add up to the total bulk content of that component, MT. Hence, the molar fractions, X, of three phases were considered: the matrix, the volume fraction of aluminum nitride, XAlN, and the molar fraction of the mutually soluble precipitates, Xcmplx.
At this point, there are 14 unknowns (six activities, two molar fractions and six concentrations) that outnumber the eight equations, but the following equations can be considered to simplify the system. The activities of all considered nitrides and carbides can be replaced by functions of temperature and the activities of the individual elements, utilizing the solubility products, K.
Therefore, the activity of every element may be replaced by the product of the activity coefficient,
, of the element, and that element’s concentration in solution . can be written as a function of concentrations and Wagner interaction coefficients, , of every component on a given element. These coefficients can be found in the literature
Substituting activities from Equations (A25)–(A30) into Equations (A18)–(A24), and then substitute (A18)–(A24) into (A10)–(A17) transforms Equations (A10)–(A17) into a system of eight equations with eight unknowns. Furthermore, if the solid solution is regarded as dilute, due to the very small amounts of solutes, the activities of the individual components can be approximated to their concentration in solid solution. This transforms Equations (A10)–(A17) into a much simpler system of eight equations and eight unknowns (six concentrations and two molar fractions):
This system has numerous sets of solutions for a given temperature. Many of these solutions include complex and negative numbers, others fail to provide concentration values between zero and the bulk content of a component. Discretion was used to choose the right solution and obtain a reliable trend. The system of equations was solved with Wolfram Mathematica computing software.
References
- Cuddy, L.J.; Raley, J.C. Austenite grain coarsening in microalloyed steels. Metall. Trans. A 1983, 14, 1989–1995. [Google Scholar] [CrossRef]
- Gao, N.; Baker, T.N. Austenite Grain Growth Behaviour of Microalloyed Al–V–N and Al–V–Ti–N Steels. ISIJ Int. 1998, 38, 744–751. [Google Scholar] [CrossRef] [Green Version]
- Gladman, T. On the theory of the effect of precipitate particles on grain growth in metals. Proc. R. Soc. Lond. Ser. A Math. Phys. Sci. 1966, 294, 298–309. [Google Scholar]
- Rios, P.R. On the relationship between pinning force and limiting grain radius. Scr. Mater. 1996, 34, 1185–1188. [Google Scholar] [CrossRef]
- Rios, P.R. A theory for grain boundary pinning by particles. Acta Metall. 1987, 35, 2805–2814. [Google Scholar] [CrossRef]
- Nishizawa, T.; Ohnuma, I.; Ishida, K. Examination of the Zener relationship between grain size and particle dispersion. Mater. Trans. JIM 1997, 38, 950–956. [Google Scholar] [CrossRef] [Green Version]
- Gong, P.; Palmiere, E.J.; Rainforth, W.M. Dissolution and precipitation behaviour in steels microalloyed with niobium during thermomechanical processing. Acta Mater. 2015, 97, 392–403. [Google Scholar] [CrossRef]
- Ringer, S.P.; Li, W.B.; Easterling, K.E. On the interaction and pinning of grain boundaries by cubic shaped precipitate particles. Acta Metall. 1989, 37, 831–841. [Google Scholar] [CrossRef]
- Hong, S.G.; Jun, H.J.; Kang, K.B.; Park, C.G. Evolution of precipitates in the Nb-Ti-V microalloyed HSLA steels during reheating. Scr. Mater. 2003, 48, 1201–1206. [Google Scholar] [CrossRef]
- Ma, X.; Miao, C.; Langelier, B.; Subramanian, S. Suppression of strain-induced precipitation of NbC by epitaxial growth of NbC on pre-existing TiN in Nb-Ti microalloyed steel. Mater. Des. 2017, 132, 244–249. [Google Scholar] [CrossRef]
- Craven, A.J.; He, K.; Garvie, L.A.J.; Baker, T.N. Complex heterogeneous precipitation in titanium–niobium microalloyed Al-killed HSLA steels—I. (Ti,Nb)(C,N) particles. Acta Mater. 2000, 48, 3857–3868. [Google Scholar] [CrossRef]
- Wang, R.; Garcia, C.I.; Hua, M.; Cho, K.; Zhang, H.; DeArdo, A.J. Microstructure and Precipitation Behavior of Nb, Ti Complex Microalloyed Steel Produced by Compact Strip Processing. ISIJ Int. 2006, 46, 1345–1353. [Google Scholar] [CrossRef] [Green Version]
- Subramanian, S.V.; Xiaoping, M.; Rehman, K. Austenite Grain Size Control in Upstream Processing of Niobium Microalloyed Steels by Nano-Scale Precipitate Engineering of TiN-NbC Composite. In Energy Materials 2014; Springer: Cham, Switzerland, 2014; pp. 639–650. [Google Scholar]
- Graux, A.; Cazottes, S.; De Castro, D.; San Martín, D.; Capdevila, C.; Cabrera, J.M.; Molas, S.; Schreiber, S.; Mirković, D.; Danoix, F.; et al. Precipitation and grain growth modelling in Ti-Nb microalloyed steels. Materialia 2019, 5, 100233. [Google Scholar] [CrossRef] [Green Version]
- Zhang, H.; Huihui, X. First-principles study of NbC heterogeneous nucleation on TiC vs. TiN in microalloy steel. Ironmak. Steelmak. 2018. [Google Scholar] [CrossRef]
- Nyyssönen, T.; Isakov, M.; Peura, P.; Kuokkala, V.-T. Iterative Determination of the Orientation Relationship Between Austenite and Martensite from a Large Amount of Grain Pair Misorientations. Metall. Mater. Trans. A 2016, 47, 2587–2590. [Google Scholar] [CrossRef]
- Nyyssönen, T.; Peura, P.; Kuokkala, V.-T. Crystallography, Morphology, and Martensite Transformation of Prior Austenite in Intercritically Annealed High-Aluminum Steel. Metall. Mater. Trans. A 2018, 49, 6426–6441. [Google Scholar] [CrossRef]
- Palmiere, E.J.; Garcia, C.I.; DeArdo, A.J. The influence of niobium supersaturation in austenite on the static recrystallization behavior of low carbon microalloyed steels. Metall. Mater. Trans. A 1996, 27, 951–960. [Google Scholar] [CrossRef]
- Blancas, V. A New View of the Grain-Coarsening Behavior of Austenite in Ti-Microalloyed Low-Carbon Steels; University of Pittsburgh: Pittsburgh, PA, USA, 2016. [Google Scholar]
- Hayakawa, Y.; Szpunar, J.A. The role of grain boundary character distribution in secondary recrystallization of electrical steels. Acta Mater. 1997, 45, 1285–1295. [Google Scholar] [CrossRef]
- Alogab, K.A.; Matlock, D.K.; Speer, J.G.; Kleebe, H.J. The Influence of Niobium Microalloying on Austenite Grain Coarsening Behavior of Ti-modified SAE 8620 Steel. ISIJ Int. 2007, 47, 307–316. [Google Scholar] [CrossRef] [Green Version]
- Charleux, M.; Poole, W.J.; Militzer, M.; Deschamps, A. Precipitation Behavior and its Effect on Strengthening of an HSLA-NbTi Steel. Metall. Mater. Trans. A 2001, 32, 1635–1648. [Google Scholar] [CrossRef]
- Karmakar, A.; Kundu, S.; Roy, S.; Neogy, S.; Srivastava, D.; Chakrabarti, D. Effect of microalloying elements on austenite grain growth in Nb–Ti and Nb–V steels. Mater. Sci. Technol. 2014, 30, 653–664. [Google Scholar] [CrossRef]
- AlOgab, K.; Matlock, D.; Speer, J.; Kleebe, H. The Effects of Heating Rate on Austenite Grain Growth in a Ti-modified SAE 8620 Steel with Controlled Niobium Additions. ISIJ Int. 2007, 47, 1034–1041. [Google Scholar] [CrossRef] [Green Version]
- Zou, H.; Kirkaldy, J.S. Carbonitride precipitate growth in titanium/niobium microalloyed steels. Metall. Trans. A 1991, 22, 1511–1524. [Google Scholar] [CrossRef]
- Hutchinson, C.R.; Zurob, H.S.; Sinclair, C.W.; Brechet, Y.J.M. The comparative effectiveness of Nb solute and NbC precipitates at impeding grain-boundary motion in Nb steels. Scr. Mater. 2008, 59, 635–637. [Google Scholar] [CrossRef]
- Porter, D.A.; Easterling, K.E.; Sherif, M. Phase Transformations in Metals and Alloys, (Revised Reprint); CRC press: New York, NY, USA, 2009. [Google Scholar]
- Gladman, T. Precipitation hardening in metals. Mater. Sci. Technol. 1999, 15, 30–36. [Google Scholar] [CrossRef]
- Turkdogan, E. Causes and effects of nitride and carbonitride precipitation during continuous casting. Iron Steelmak. 1989, 16, 61. [Google Scholar]
- Homsher, C.N. Determination of the Non-Recrystallization Temperature (Tnr) in Multiple Microalloyed Steels; Colorado School of Mines: Denver, CL, USA, 2013. [Google Scholar]
- Pavlina, E.J.; Speer, J.G.; Van Tyne, C.J. Equilibrium solubility products of molybdenum carbide and tungsten carbide in iron. Scr. Mater. 2012, 66, 243–246. [Google Scholar] [CrossRef]
- Xu, K.; Thomas, B.G.; O’malley, R. Equilibrium Model of Precipitation in Microalloyed Steels. Metall. Mater. Trans. A 2011, 42, 524–539. [Google Scholar] [CrossRef]
- Wang, W.; Wang, H.R. A simple method to determine the complex carbonitride composition in multicomponent microalloyed austenite. Mater. Lett. 2007, 61, 2227–2230. [Google Scholar] [CrossRef]
- Xiaodong, L.; Solberg, J.K.; Gjengedal, R.; Kluken, A.O. An expression for solubility product of complex carbonitrides in multicomponent microalloyed austenite. Scr. Metall. Mater. 1994, 31, 1607–1612. [Google Scholar] [CrossRef]
Figure 1.
The calculated volume fraction of precipitates considering simple precipitates for: (a) high-Nb steel; (b) low-Nb steel.
Figure 1.
The calculated volume fraction of precipitates considering simple precipitates for: (a) high-Nb steel; (b) low-Nb steel.

Figure 2.
The calculated volume fraction of precipitates considering mutual solubility: (a) high-Nb steel; (b) low-Nb steel.
Figure 2.
The calculated volume fraction of precipitates considering mutual solubility: (a) high-Nb steel; (b) low-Nb steel.

Figure 3.
Transmission electron microscopy (TEM) micrograph examples (a) low magnification Low-Nb Steel austenitized at 1300 °C for 1 h; (b) high magnification from High-Nb Steel austenitized to 1300 °C for 1 h; (c) EDS spectra of particles in (b).
Figure 3.
Transmission electron microscopy (TEM) micrograph examples (a) low magnification Low-Nb Steel austenitized at 1300 °C for 1 h; (b) high magnification from High-Nb Steel austenitized to 1300 °C for 1 h; (c) EDS spectra of particles in (b).

Figure 4.
(a) Average diameter of precipitates at the different austenitization temperatures with soaking time of 1 h and corresponding pinning force; (b) volume fraction and corresponding pinning force. Measurements based on TEM micrography.
Figure 4.
(a) Average diameter of precipitates at the different austenitization temperatures with soaking time of 1 h and corresponding pinning force; (b) volume fraction and corresponding pinning force. Measurements based on TEM micrography.

Figure 5.
Distribution of particle size: (a,b) Particles smaller than 40 nm measured from ten 20,000× micrographs; (c,d) particles bigger than 40 nm, measured from five 5000× micrographs.
Figure 5.
Distribution of particle size: (a,b) Particles smaller than 40 nm measured from ten 20,000× micrographs; (c,d) particles bigger than 40 nm, measured from five 5000× micrographs.

Figure 6.
Experimental volume fraction of precipitates, compared to the calculated expectations: (a) high-Nb steel; (b) low-Nb steel.
Figure 6.
Experimental volume fraction of precipitates, compared to the calculated expectations: (a) high-Nb steel; (b) low-Nb steel.

Figure 7.
Bright field-Dark field (BF-DF) images and SADP from a precipitate in low-Nb steel austenitized at 1200 °C for 1 h.
Figure 7.
Bright field-Dark field (BF-DF) images and SADP from a precipitate in low-Nb steel austenitized at 1200 °C for 1 h.

Figure 8.
HRTEM, Fast Fourier Transform, and EDS results of a (Ti,Nb)(C,N) precipitate (big) in low-Nb steel austenitized at 1200 °C for 1 h.
Figure 8.
HRTEM, Fast Fourier Transform, and EDS results of a (Ti,Nb)(C,N) precipitate (big) in low-Nb steel austenitized at 1200 °C for 1 h.

Figure 9.
BF–DF and SADP of complex bicrystalline particles found in: (a) low-Nb steel austenitized at 1300 °C for 1 h.; (b) high-Nb steel austenitized to 1150 °C for 1 h.
Figure 9.
BF–DF and SADP of complex bicrystalline particles found in: (a) low-Nb steel austenitized at 1300 °C for 1 h.; (b) high-Nb steel austenitized to 1150 °C for 1 h.

Figure 10.
Average Feret diameter of Prior-Austenitic Grains. Measured from light microscopy after picral etching.
Figure 10.
Average Feret diameter of Prior-Austenitic Grains. Measured from light microscopy after picral etching.

Figure 11.
Grain size distribution of (a) high-Nb steel; and (b) Low-Nb steel.

Figure 12.
Experimentally determined PAGS compared to calculated predictions: (a) High-Nb steel; and (b) Low-Nb steel.
Figure 12.
Experimentally determined PAGS compared to calculated predictions: (a) High-Nb steel; and (b) Low-Nb steel.

Figure 13.
Comparison of the reconstructed PAGS maps to a picral etched micrograph. (a) Micrograph after picral etching; (b) EBSD OIM map from quenched specimen; (c) reconstructed OIM map of austenite, based on (b). High-Nb sample austenitized to 1150 °C for 1 h.
Figure 13.
Comparison of the reconstructed PAGS maps to a picral etched micrograph. (a) Micrograph after picral etching; (b) EBSD OIM map from quenched specimen; (c) reconstructed OIM map of austenite, based on (b). High-Nb sample austenitized to 1150 °C for 1 h.

Figure 14.
Reconstructed austenite EBSD OIM maps from austenitizing high-Nb steel to: (a) 1150 °C, (b) 1200 °C, (c) 1250 °C, (d) 1300 °C for 1 h; and from austenitizing Low-Nb Steel to: (e) 1150 °C, (f) 1200 °C, (g) 1250 °C and (h) 1300 °C for 1 h. All images are 150 × 190 μm2.
Figure 14.
Reconstructed austenite EBSD OIM maps from austenitizing high-Nb steel to: (a) 1150 °C, (b) 1200 °C, (c) 1250 °C, (d) 1300 °C for 1 h; and from austenitizing Low-Nb Steel to: (e) 1150 °C, (f) 1200 °C, (g) 1250 °C and (h) 1300 °C for 1 h. All images are 150 × 190 μm2.

Figure 15.
Distribution of GB misorientation for various temperatures on: (a) High-Nb steel and (b) low-Nb steel.
Figure 15.
Distribution of GB misorientation for various temperatures on: (a) High-Nb steel and (b) low-Nb steel.

Table 1.
Alloys used in this study (wt%).
| Alloy | C | Mn | Cu | Ni | Cr | Mo | Nb | V | Ti | N | Al | Si | Fe |
|---|---|---|---|---|---|---|---|---|---|---|---|---|---|
| High Nb | 0.05 | 1.5 | 0.1 | 0.25 | 0.25 | 0.15 | 0.090 | 0.06 | 0.01 | 0.007 | 0.04 | 0.25 | Base |
| Low Nb | 0.05 | 1.5 | 0.1 | 0.25 | 0.25 | 0.15 | 0.045 | 0.06 | 0.01 | 0.007 | 0.04 | 0.25 | Base |
Table 2.
EDS chemical composition measurements from precipitates in Figure 2b (at%/wt%).
Table 2.
EDS chemical composition measurements from precipitates in Figure 2b (at%/wt%).
| Spectra | C | N | Si | Ti | V | Fe | Cu | Nb |
|---|---|---|---|---|---|---|---|---|
| Top left | 41.82/20.1 | 32.51/18.2 | 0.15/0.2 | 16.03/30.7 | 0.54/1.1 | 0.1/0.2 | 2.93/7.5 | 5.92/22 |
| Right | 78.7/59.4 | 14.1/12.4 | 3.97/11.9 | 1.37/5.5 | 1.85/10.8 | |||
| Bottom | 73.5/52 | 17.13/14.1 | 5.35/15.1 | 1.61/6 | 2.34/12.8 |
© 2020 by the authors. Licensee MDPI, Basel, Switzerland. This article is an open access article distributed under the terms and conditions of the Creative Commons Attribution (CC BY) license (http://creativecommons.org/licenses/by/4.0/).
Share and Cite
MDPI and ACS Style
Solis-Bravo, G.; Merwin, M.; Garcia, C.I. Impact of Precipitate Morphology on the Dissolution and Grain-Coarsening Behavior of a Ti-Nb Microalloyed Linepipe Steel. Metals 2020, 10, 89. https://doi.org/10.3390/met10010089
AMA Style
Solis-Bravo G, Merwin M, Garcia CI. Impact of Precipitate Morphology on the Dissolution and Grain-Coarsening Behavior of a Ti-Nb Microalloyed Linepipe Steel. Metals. 2020; 10(1):89. https://doi.org/10.3390/met10010089
Chicago/Turabian StyleSolis-Bravo, Gregorio, Matthew Merwin, and C. Isaac Garcia. 2020. "Impact of Precipitate Morphology on the Dissolution and Grain-Coarsening Behavior of a Ti-Nb Microalloyed Linepipe Steel" Metals 10, no. 1: 89. https://doi.org/10.3390/met10010089
Note that from the first issue of 2016, this journal uses article numbers instead of page numbers. See further details here.