Comparison and Combination of Organic Solvent Nanofiltration and Adsorption Processes: A Mathematical Approach for Mitigation of Active Pharmaceutical Ingredient Losses during Genotoxin Removal


Abstract
:
1. Introduction
2. Mathematical Approach: Modelling Section
2.1. Set-Up and Boundaries
2.2. Organic Solvent Nanodiafiltrations (OSNd)
2.3. Adsorption
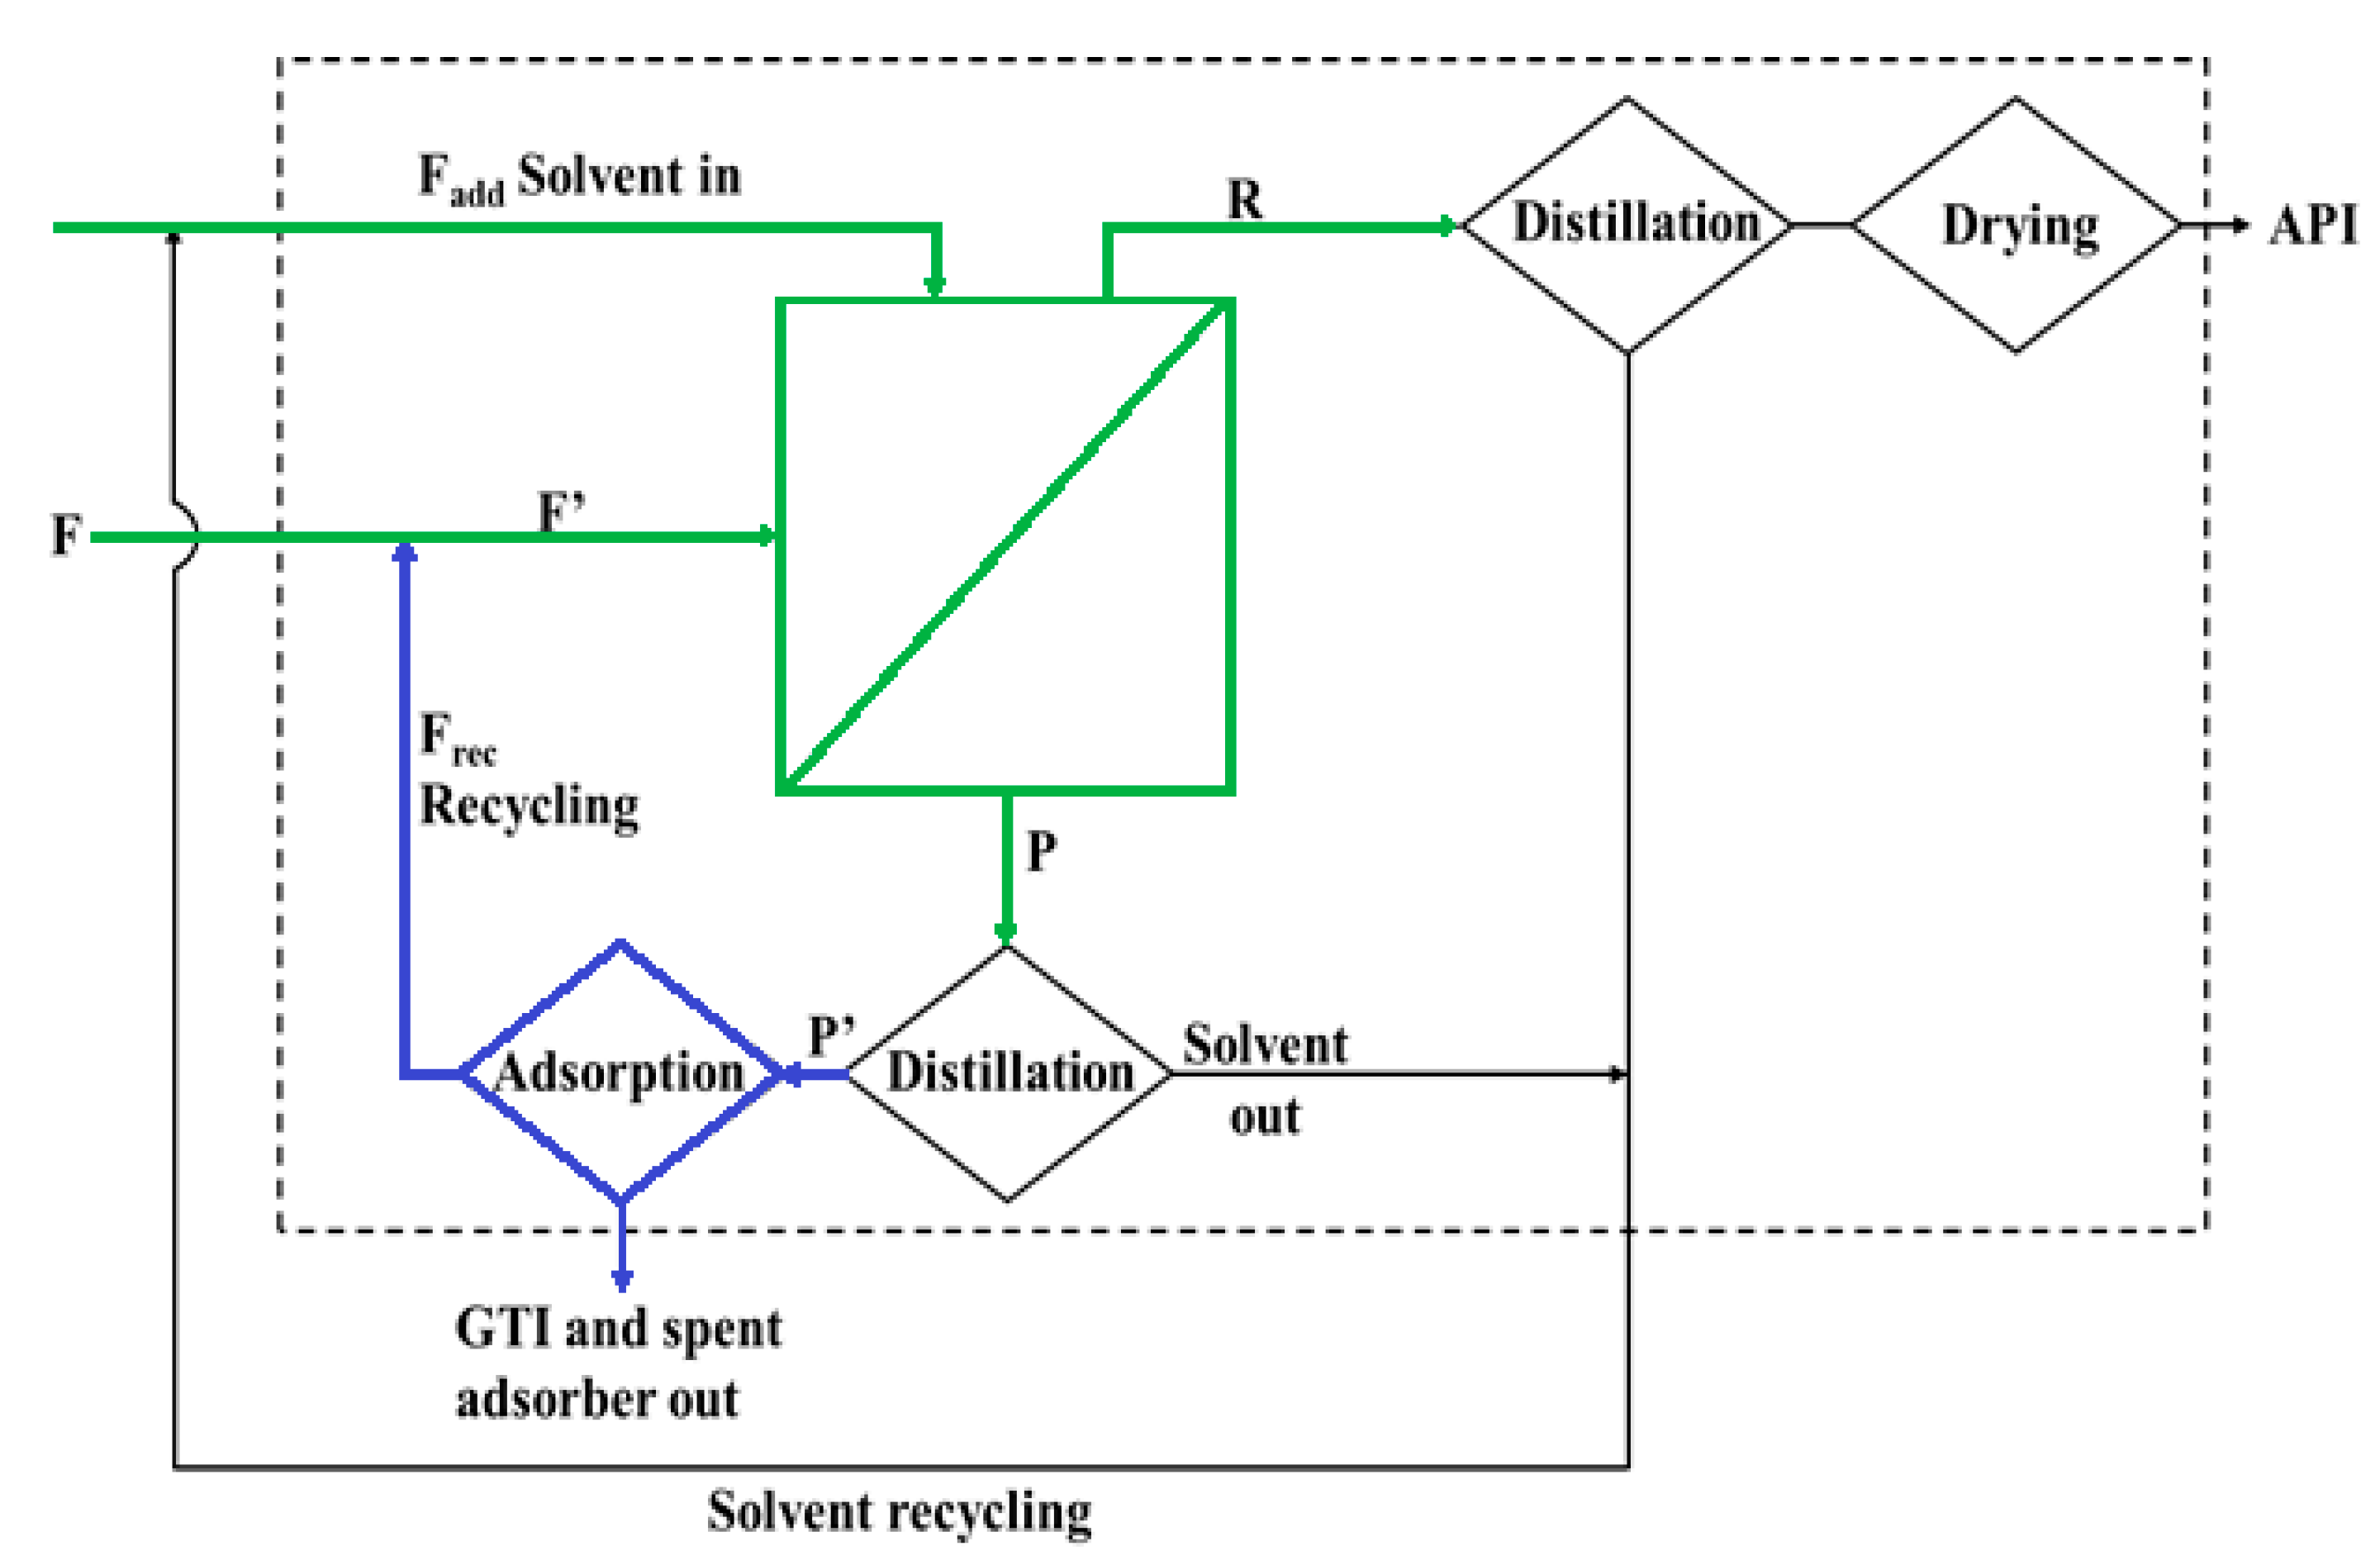
2.4. Hybrid Process
- (i)
- Diafiltration using an OSN membrane with recovery of purified API in retentate (R)
- (ii)
- Distillation to reduce volume of permeate (P), and
- (iii)
- Adsorption to remove GTIs, i.e., decrease the ratio of CGTI/CAPI for further recirculation of the stream back to feed the next batch OSN stage cycle.
3. Materials and Methods
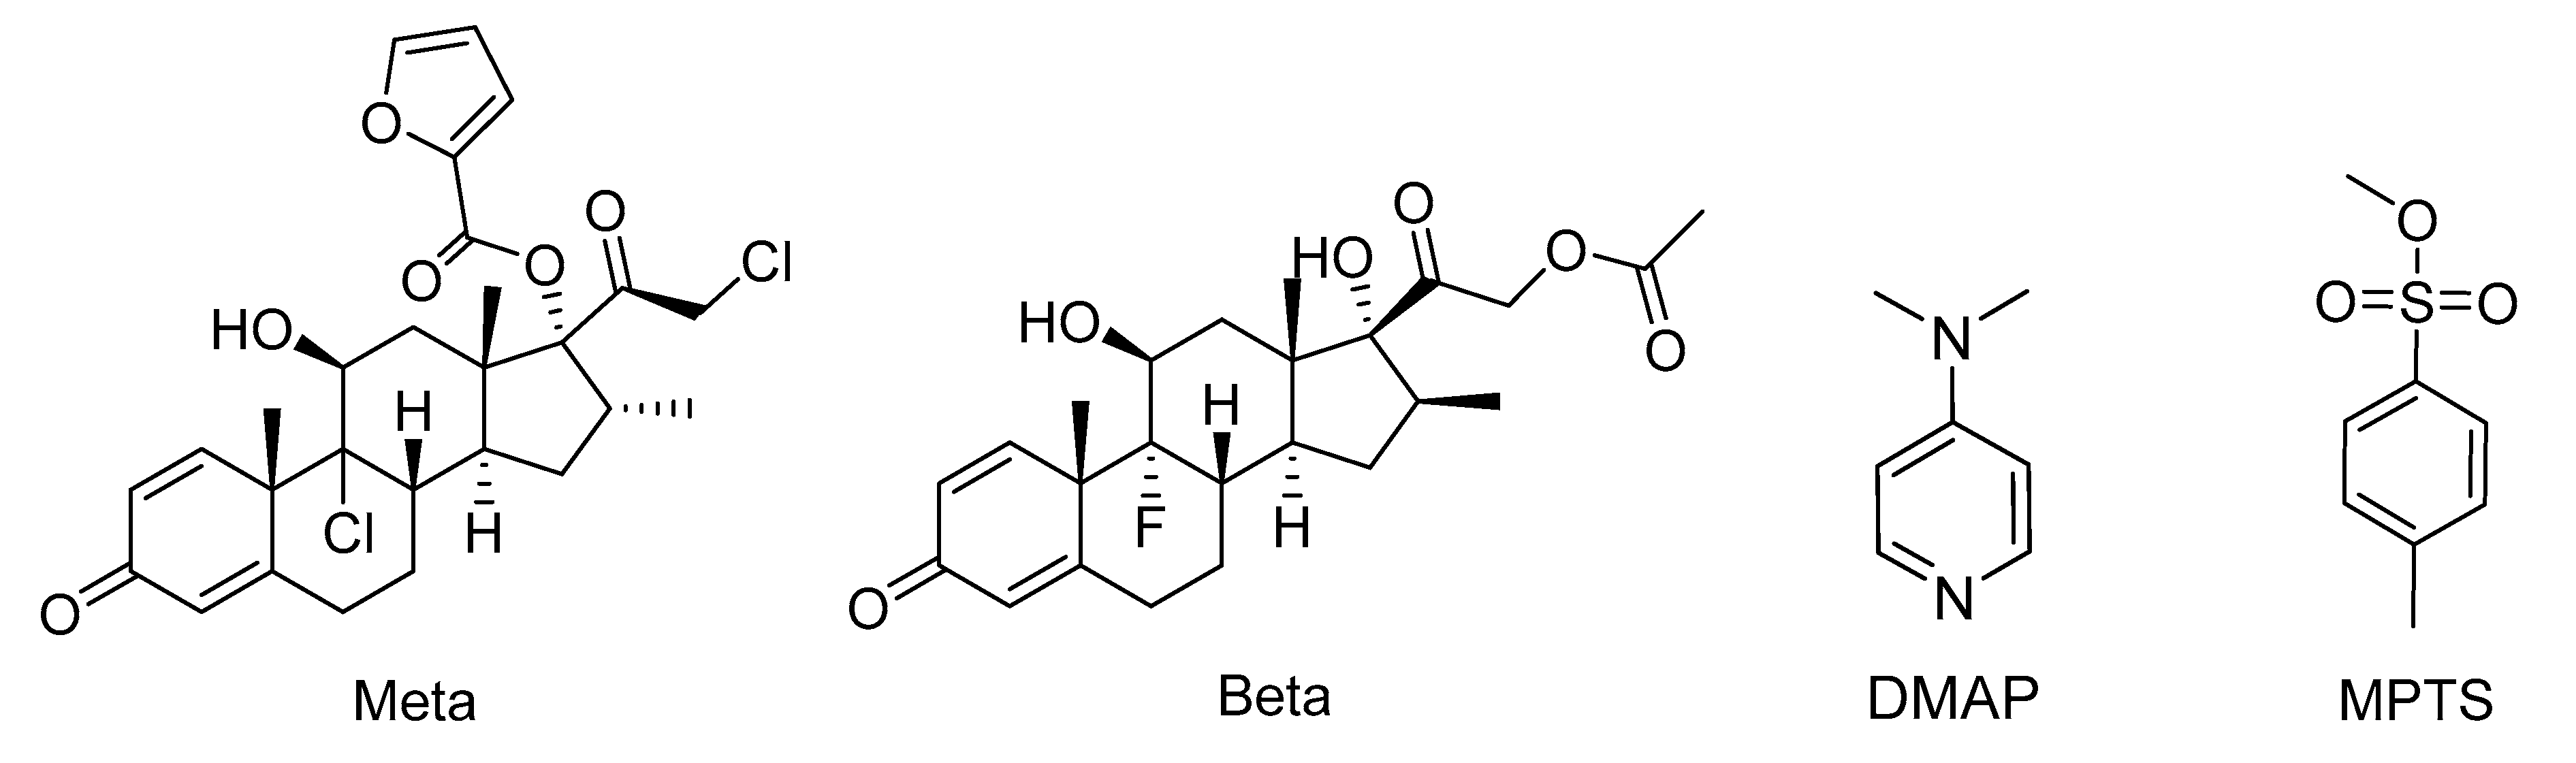
3.1. Materials
3.2. Apparatus and Analysis
3.3. Organic Solvent Nanofiltration (OSN) Experiments
3.4. Adsorption Experiments
3.5. Binding Adsorption Isotherm Experiments
4. Results and Discussion
4.1. Model Results: Decision Making Framework
4.1.1. OSN Diafiltration: Thresholds
4.1.2. Adsorption: Threshold
4.1.3. Hybrid Process Calculations
Hybrid Process Concept
- (i)
- the ratio of the recirculation to feed volumes and
- (ii)
- the amount of adsorber used. The amount of diavolumes is optimized for each cycle, in order to always ensure that the TTC value is met (target value of 7.5 mgGTI/gAPI on the retentate stream).
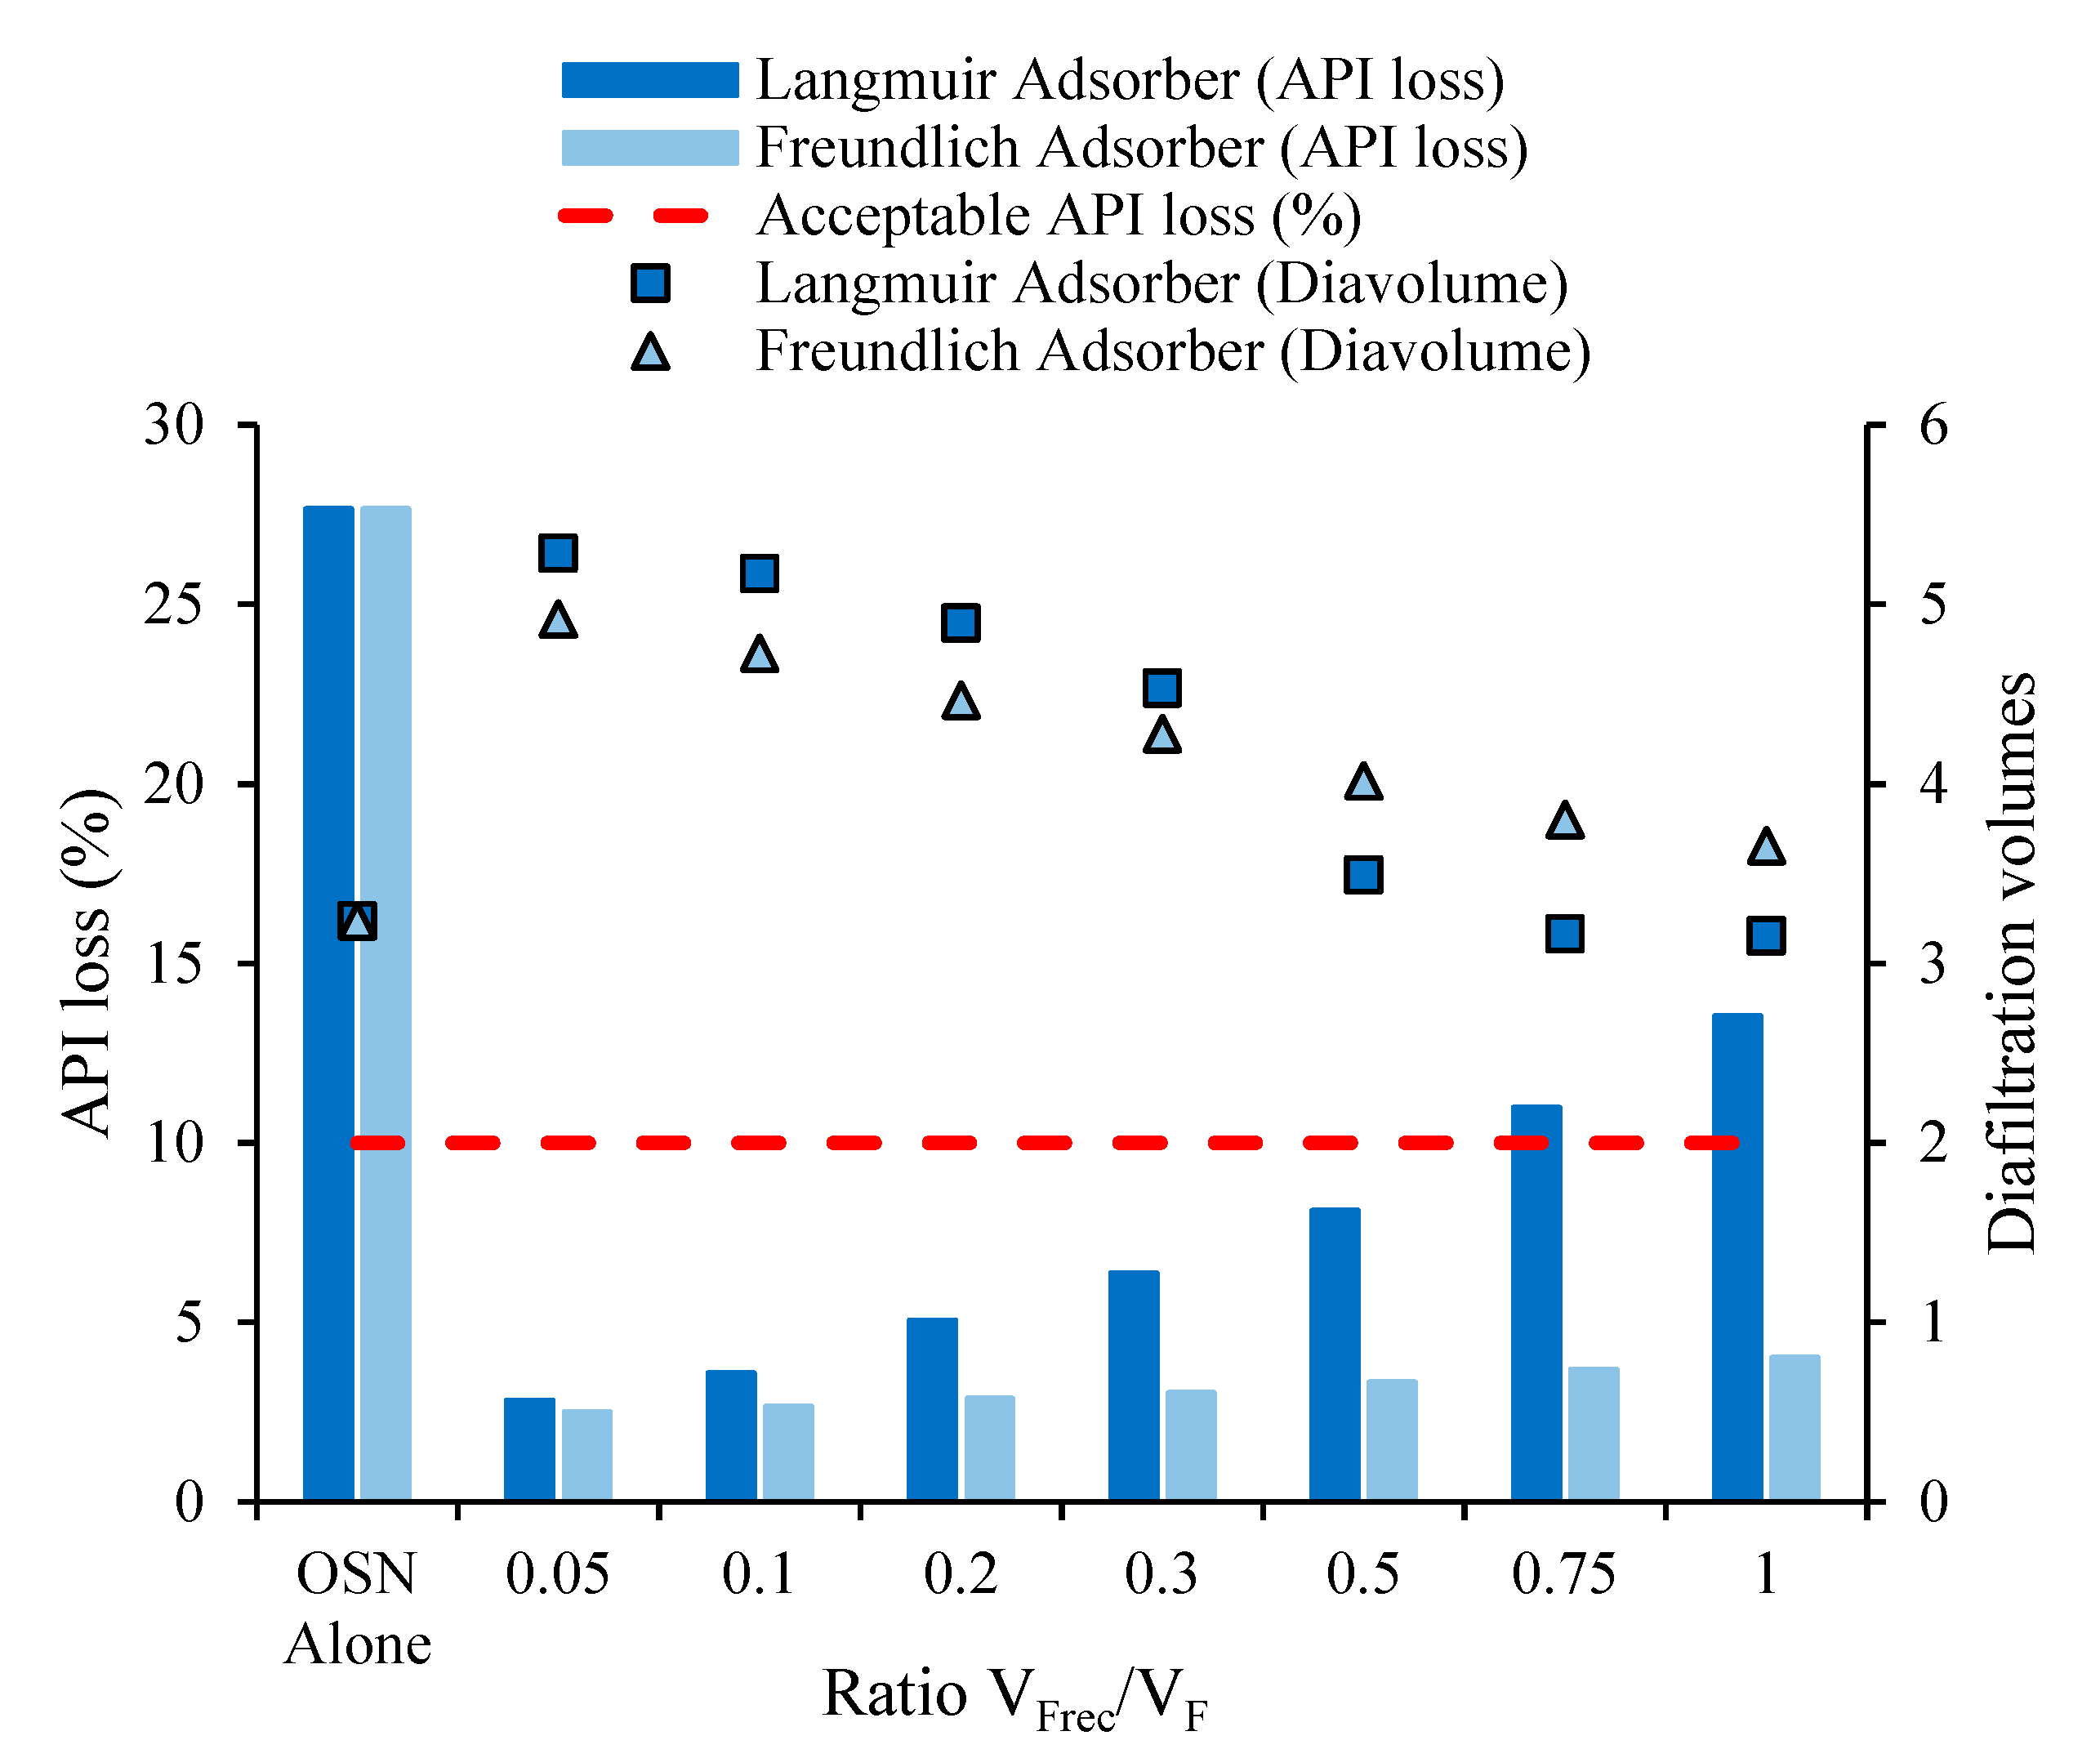
Effect of Recirculation to Feed Stream Ratio VRec/VF to a Fixed Load of Adsorber
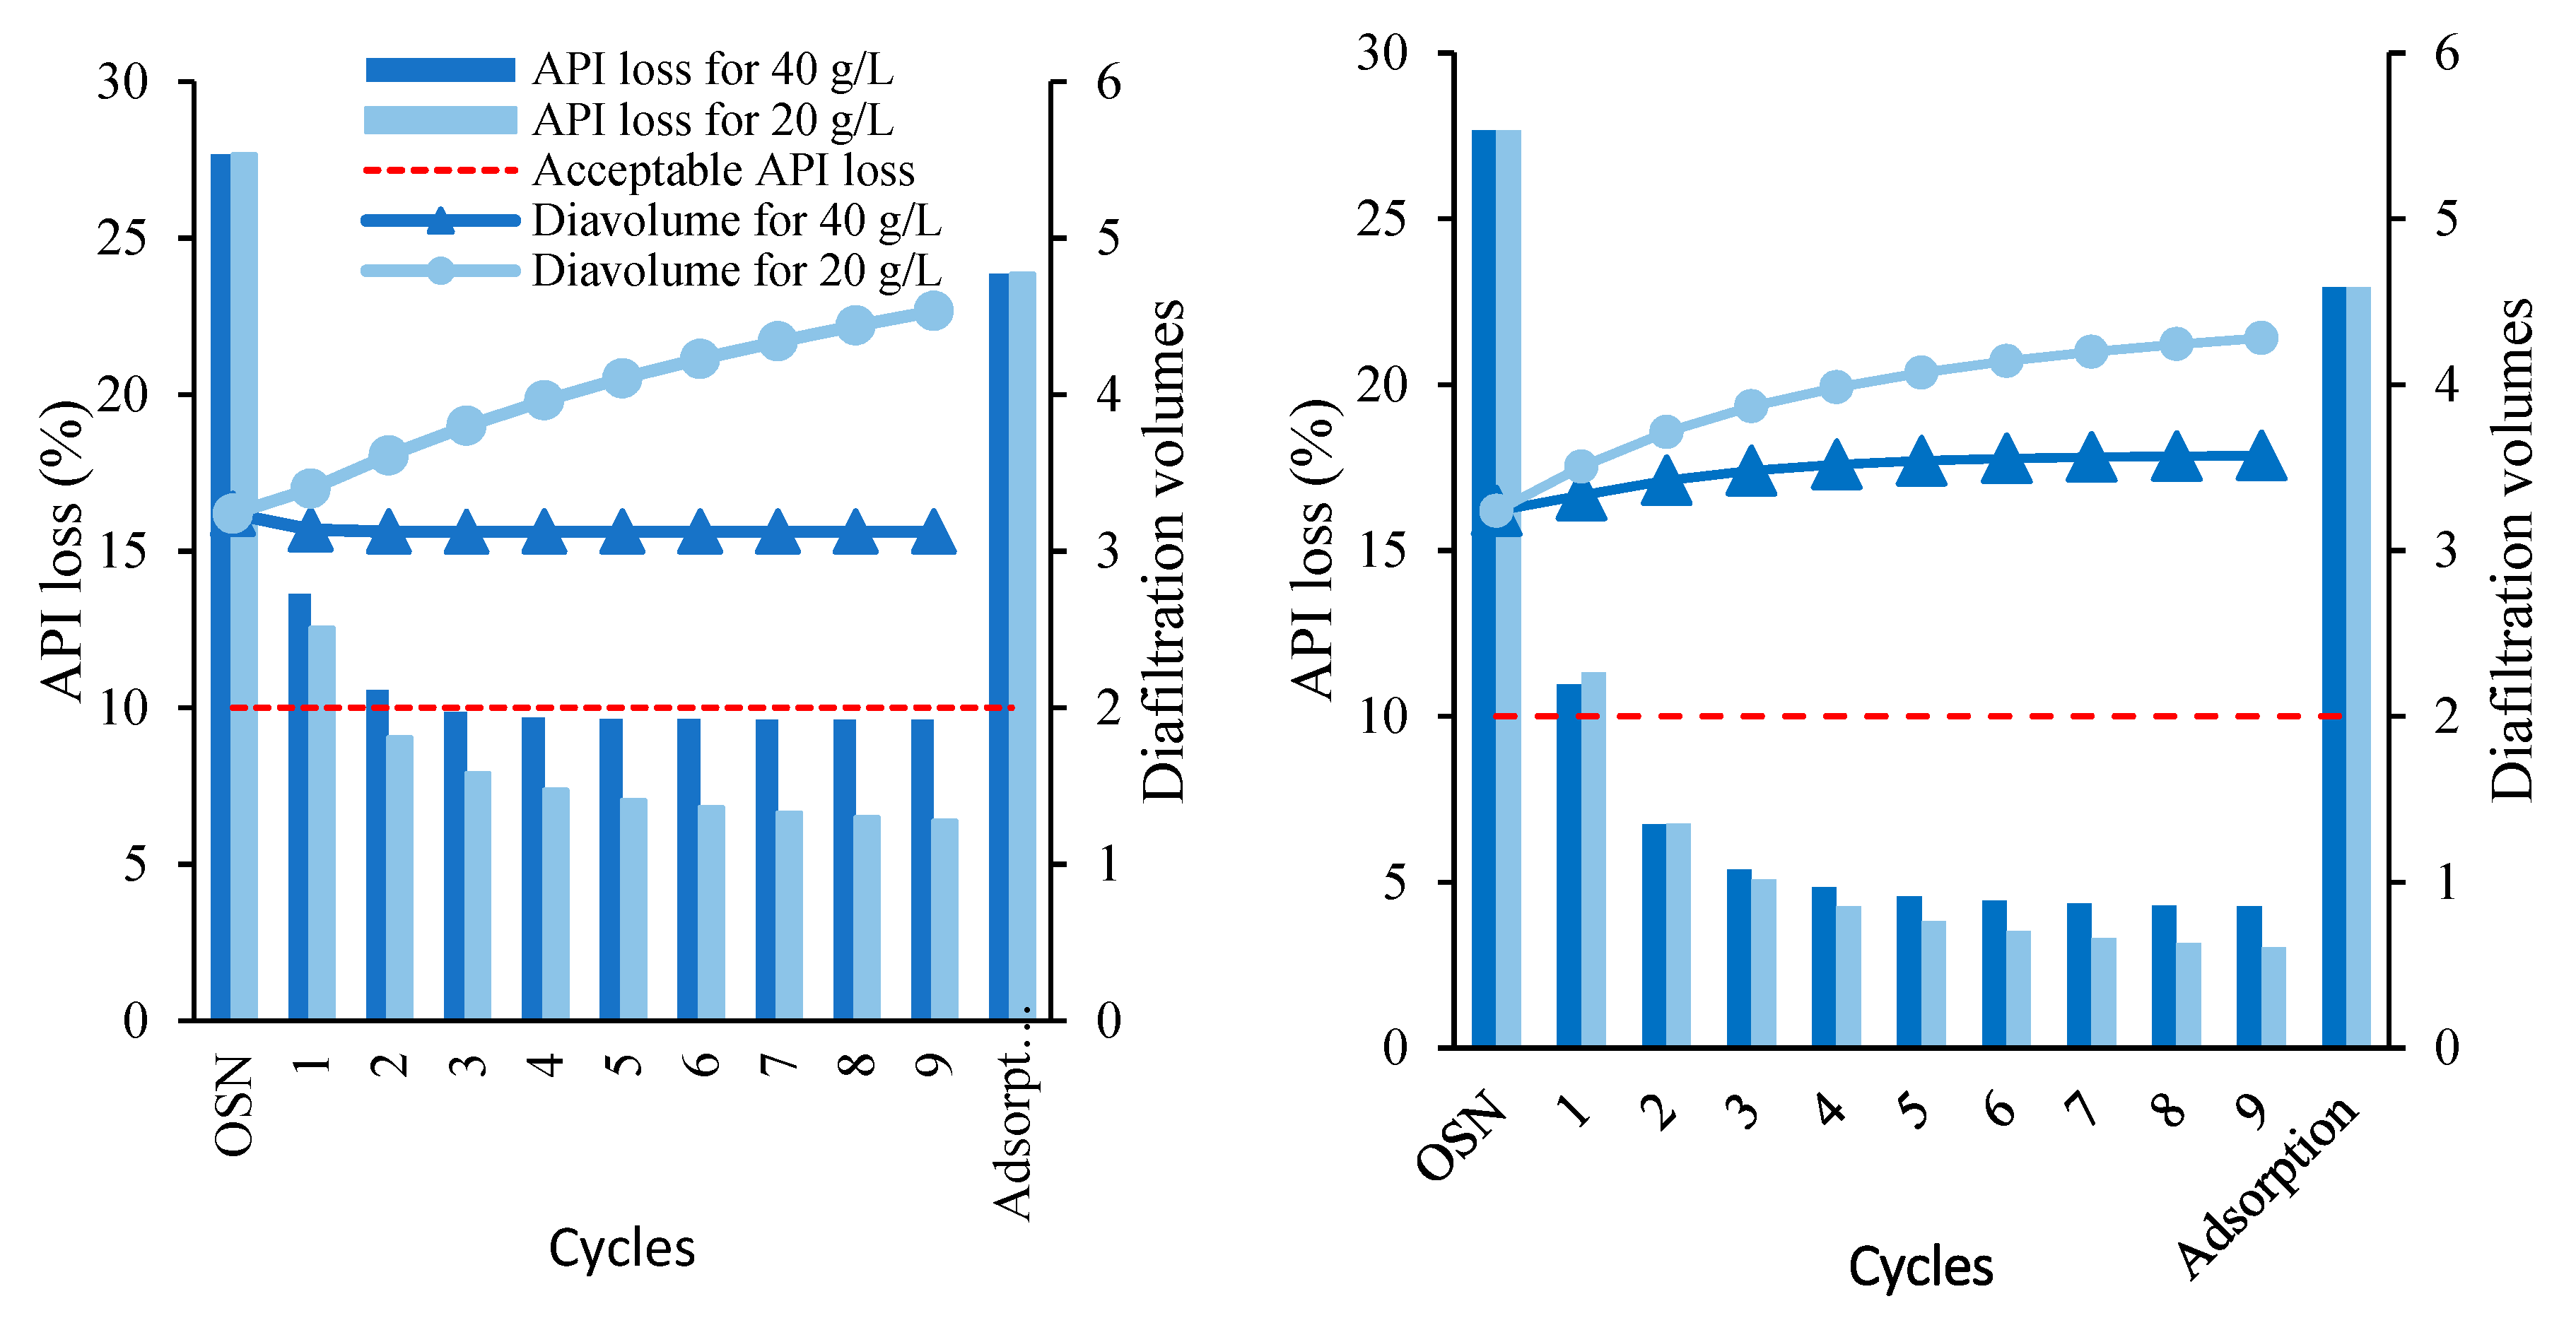
Effect of Adsorber Amount
Comparison of the Hybrid Process with Other Multi-Stage Processes
4.2. Experimental Assessment
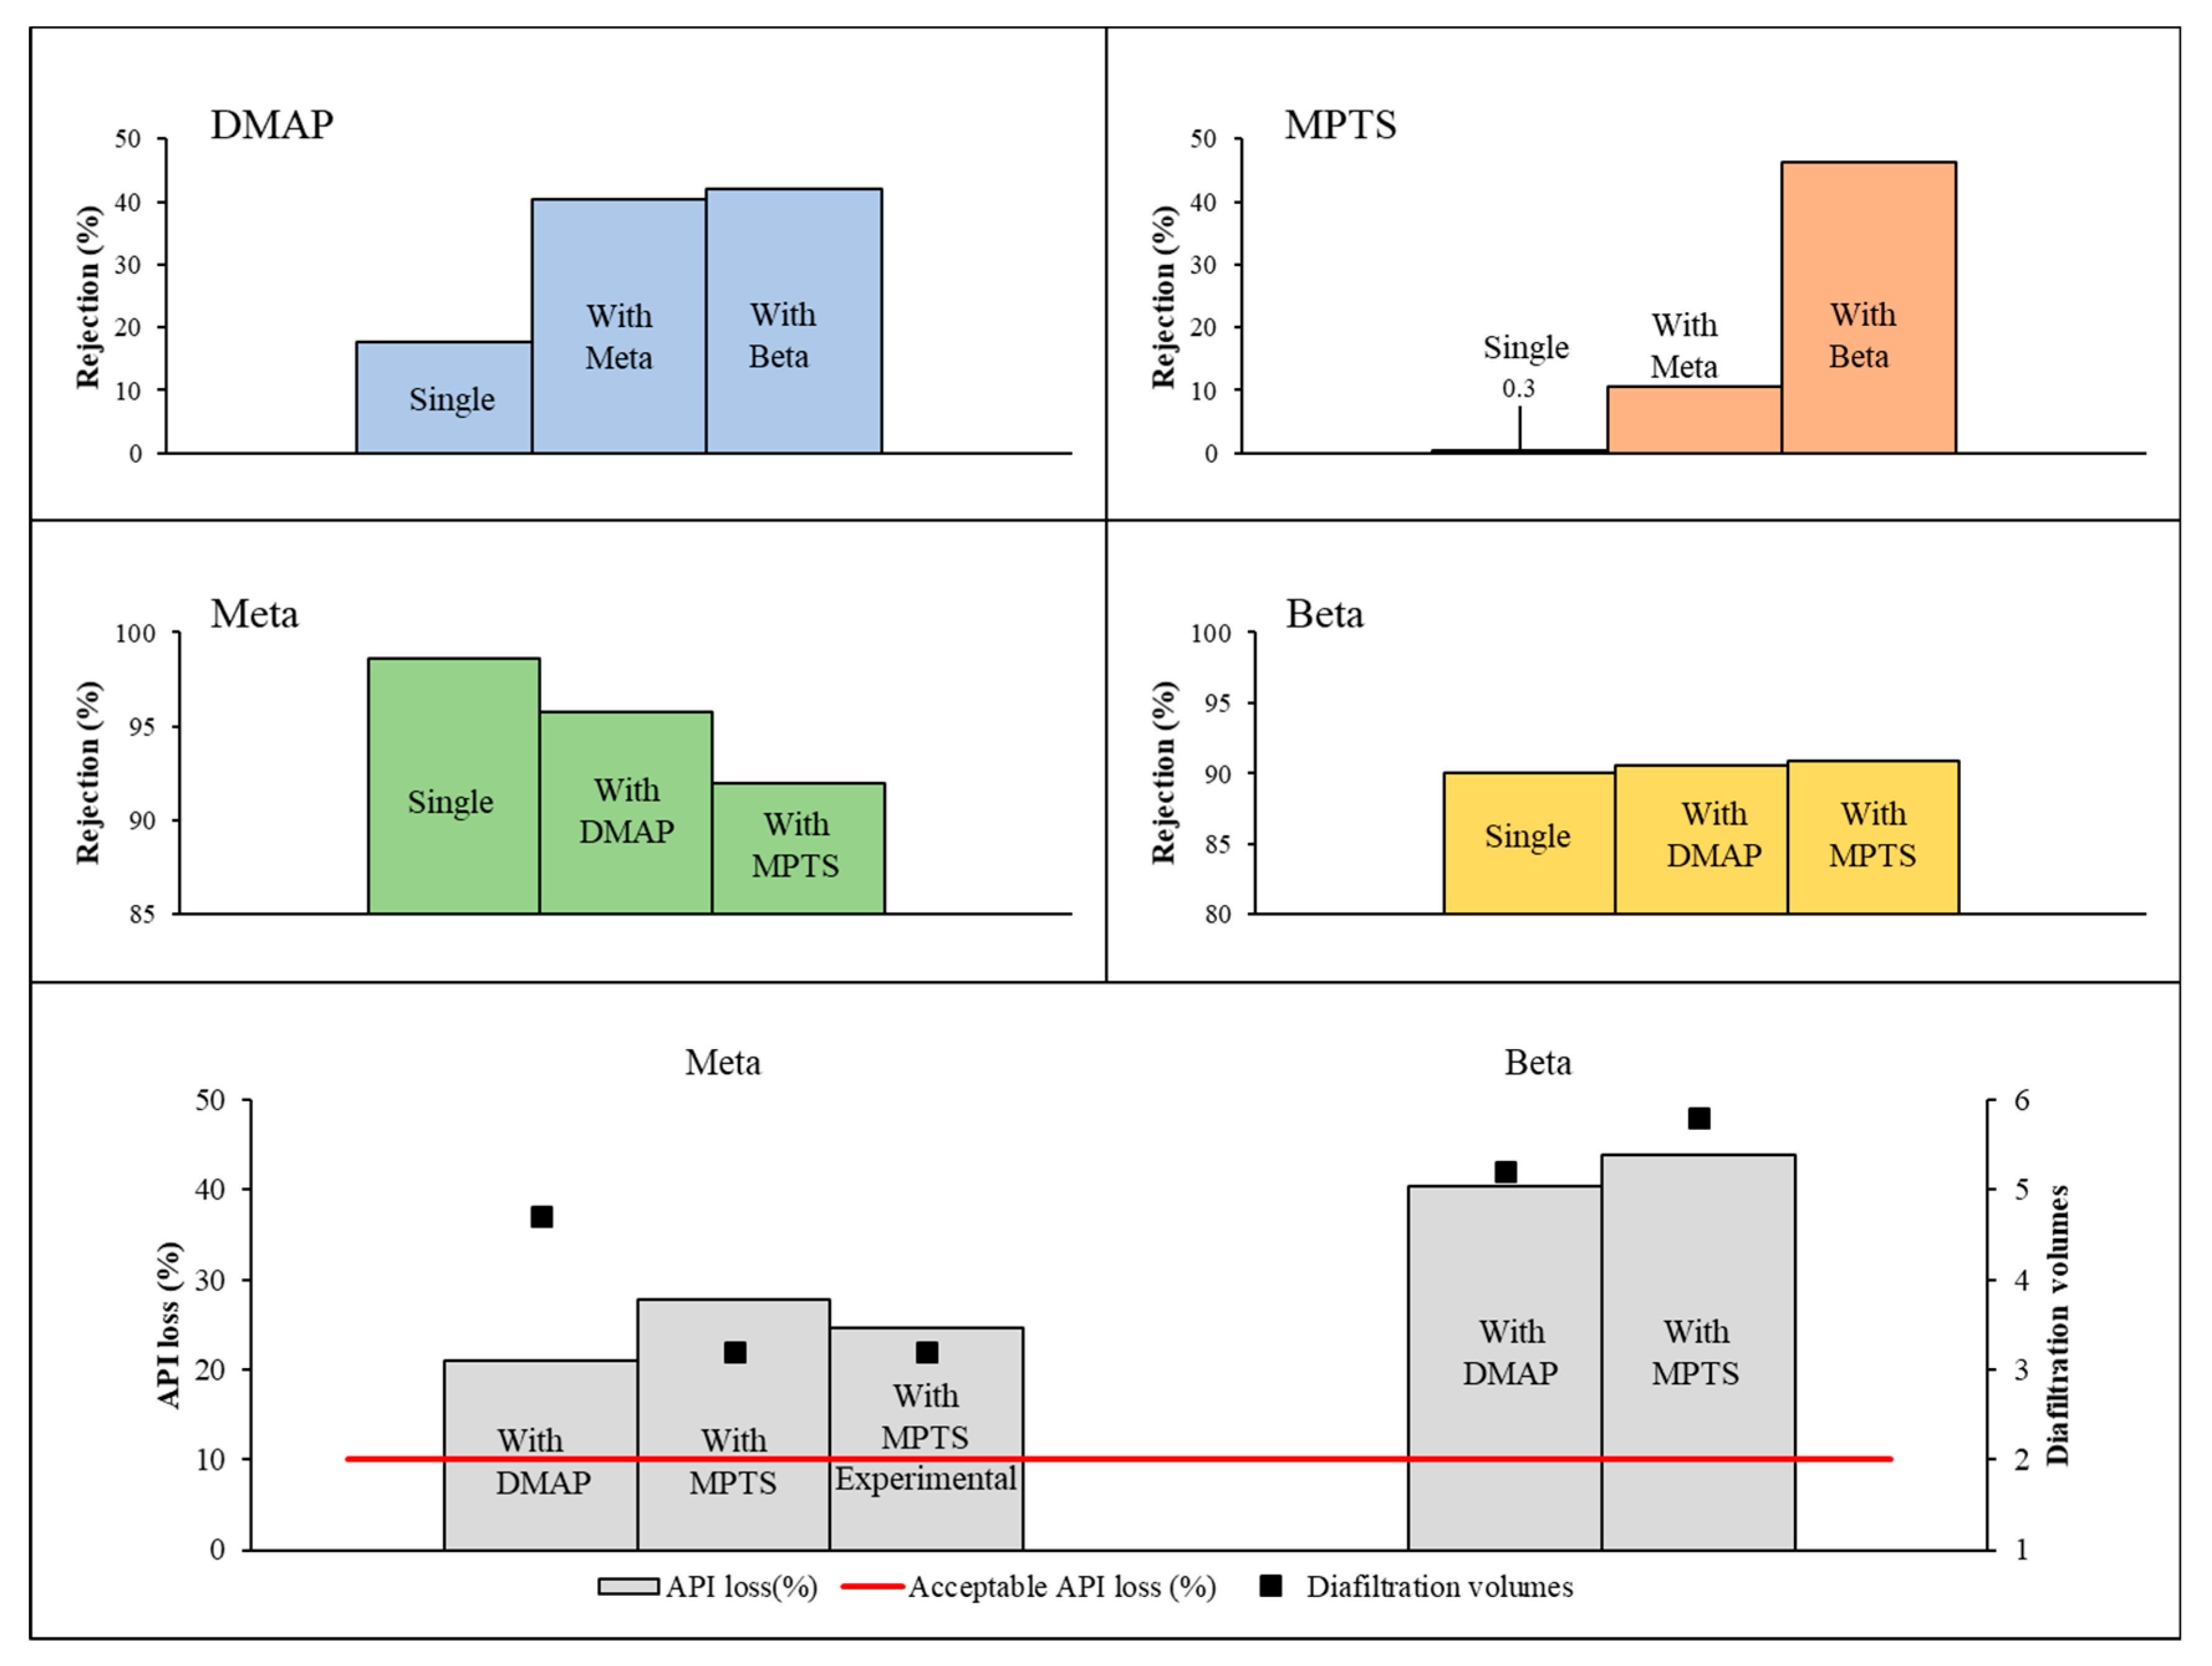
4.2.1. OSN diafiltration
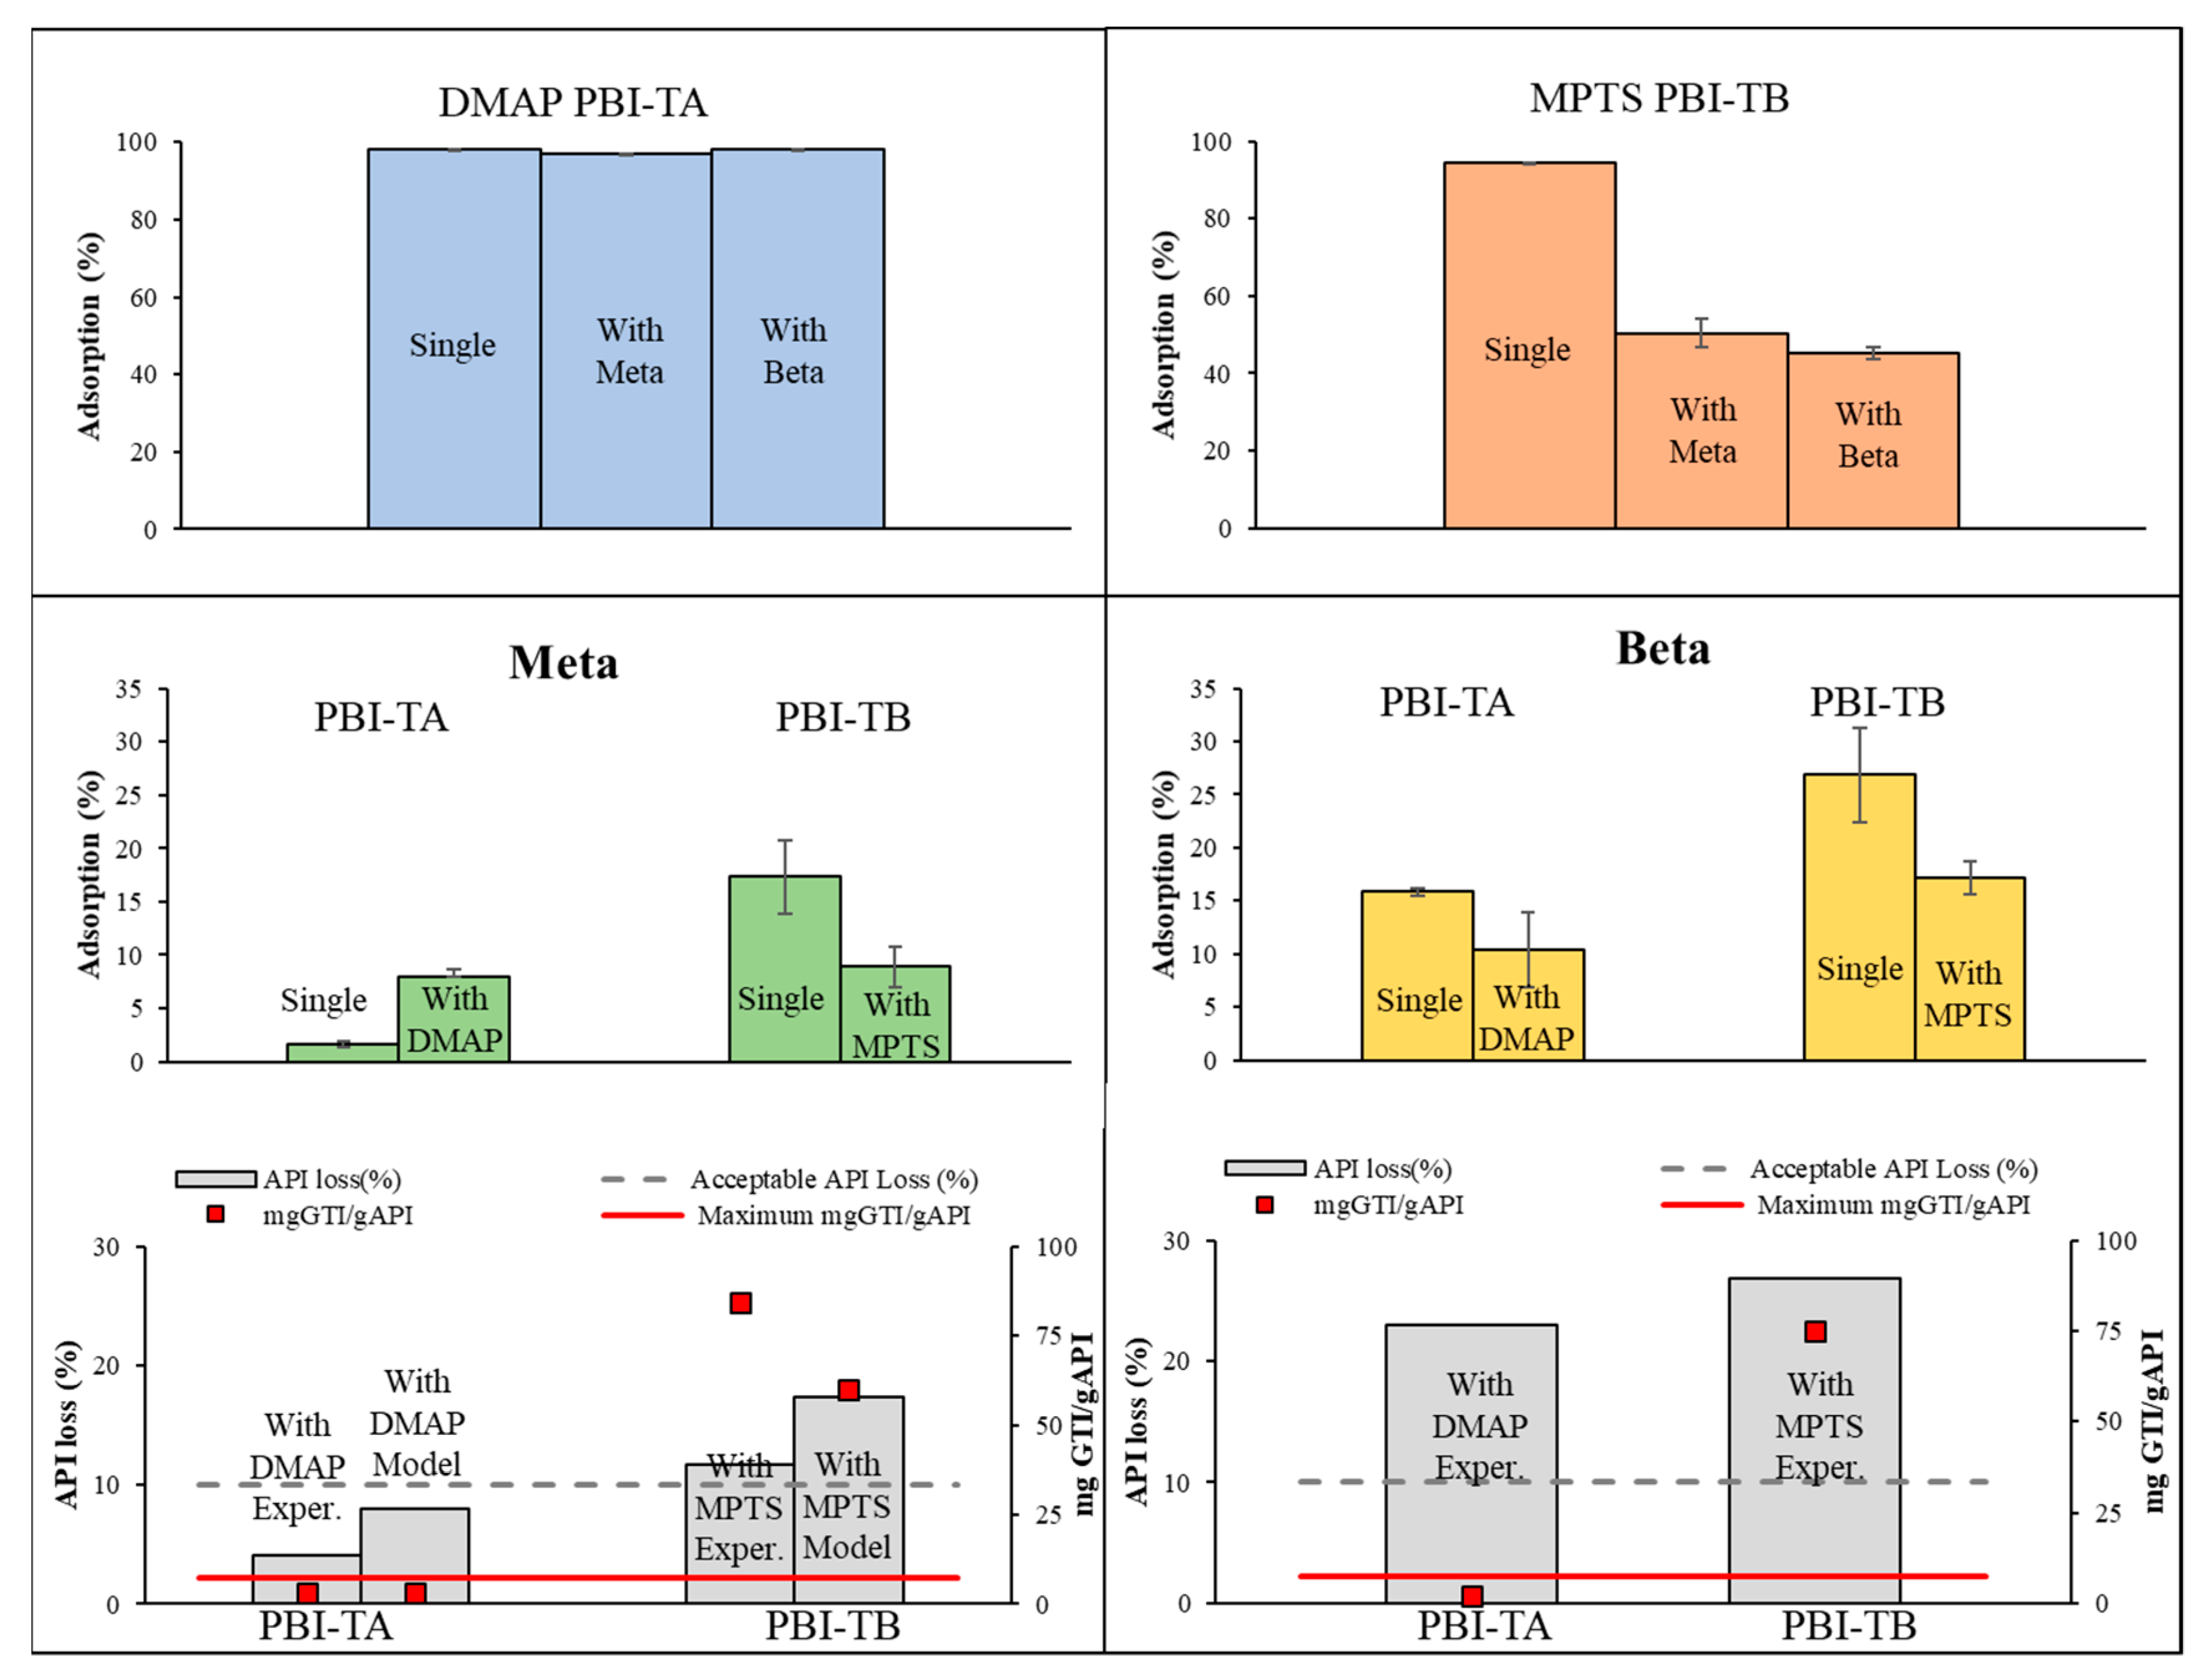
4.2.2. Adsorption
4.2.3. Hybrid Process
4.3. Economic and Environmental Analysis
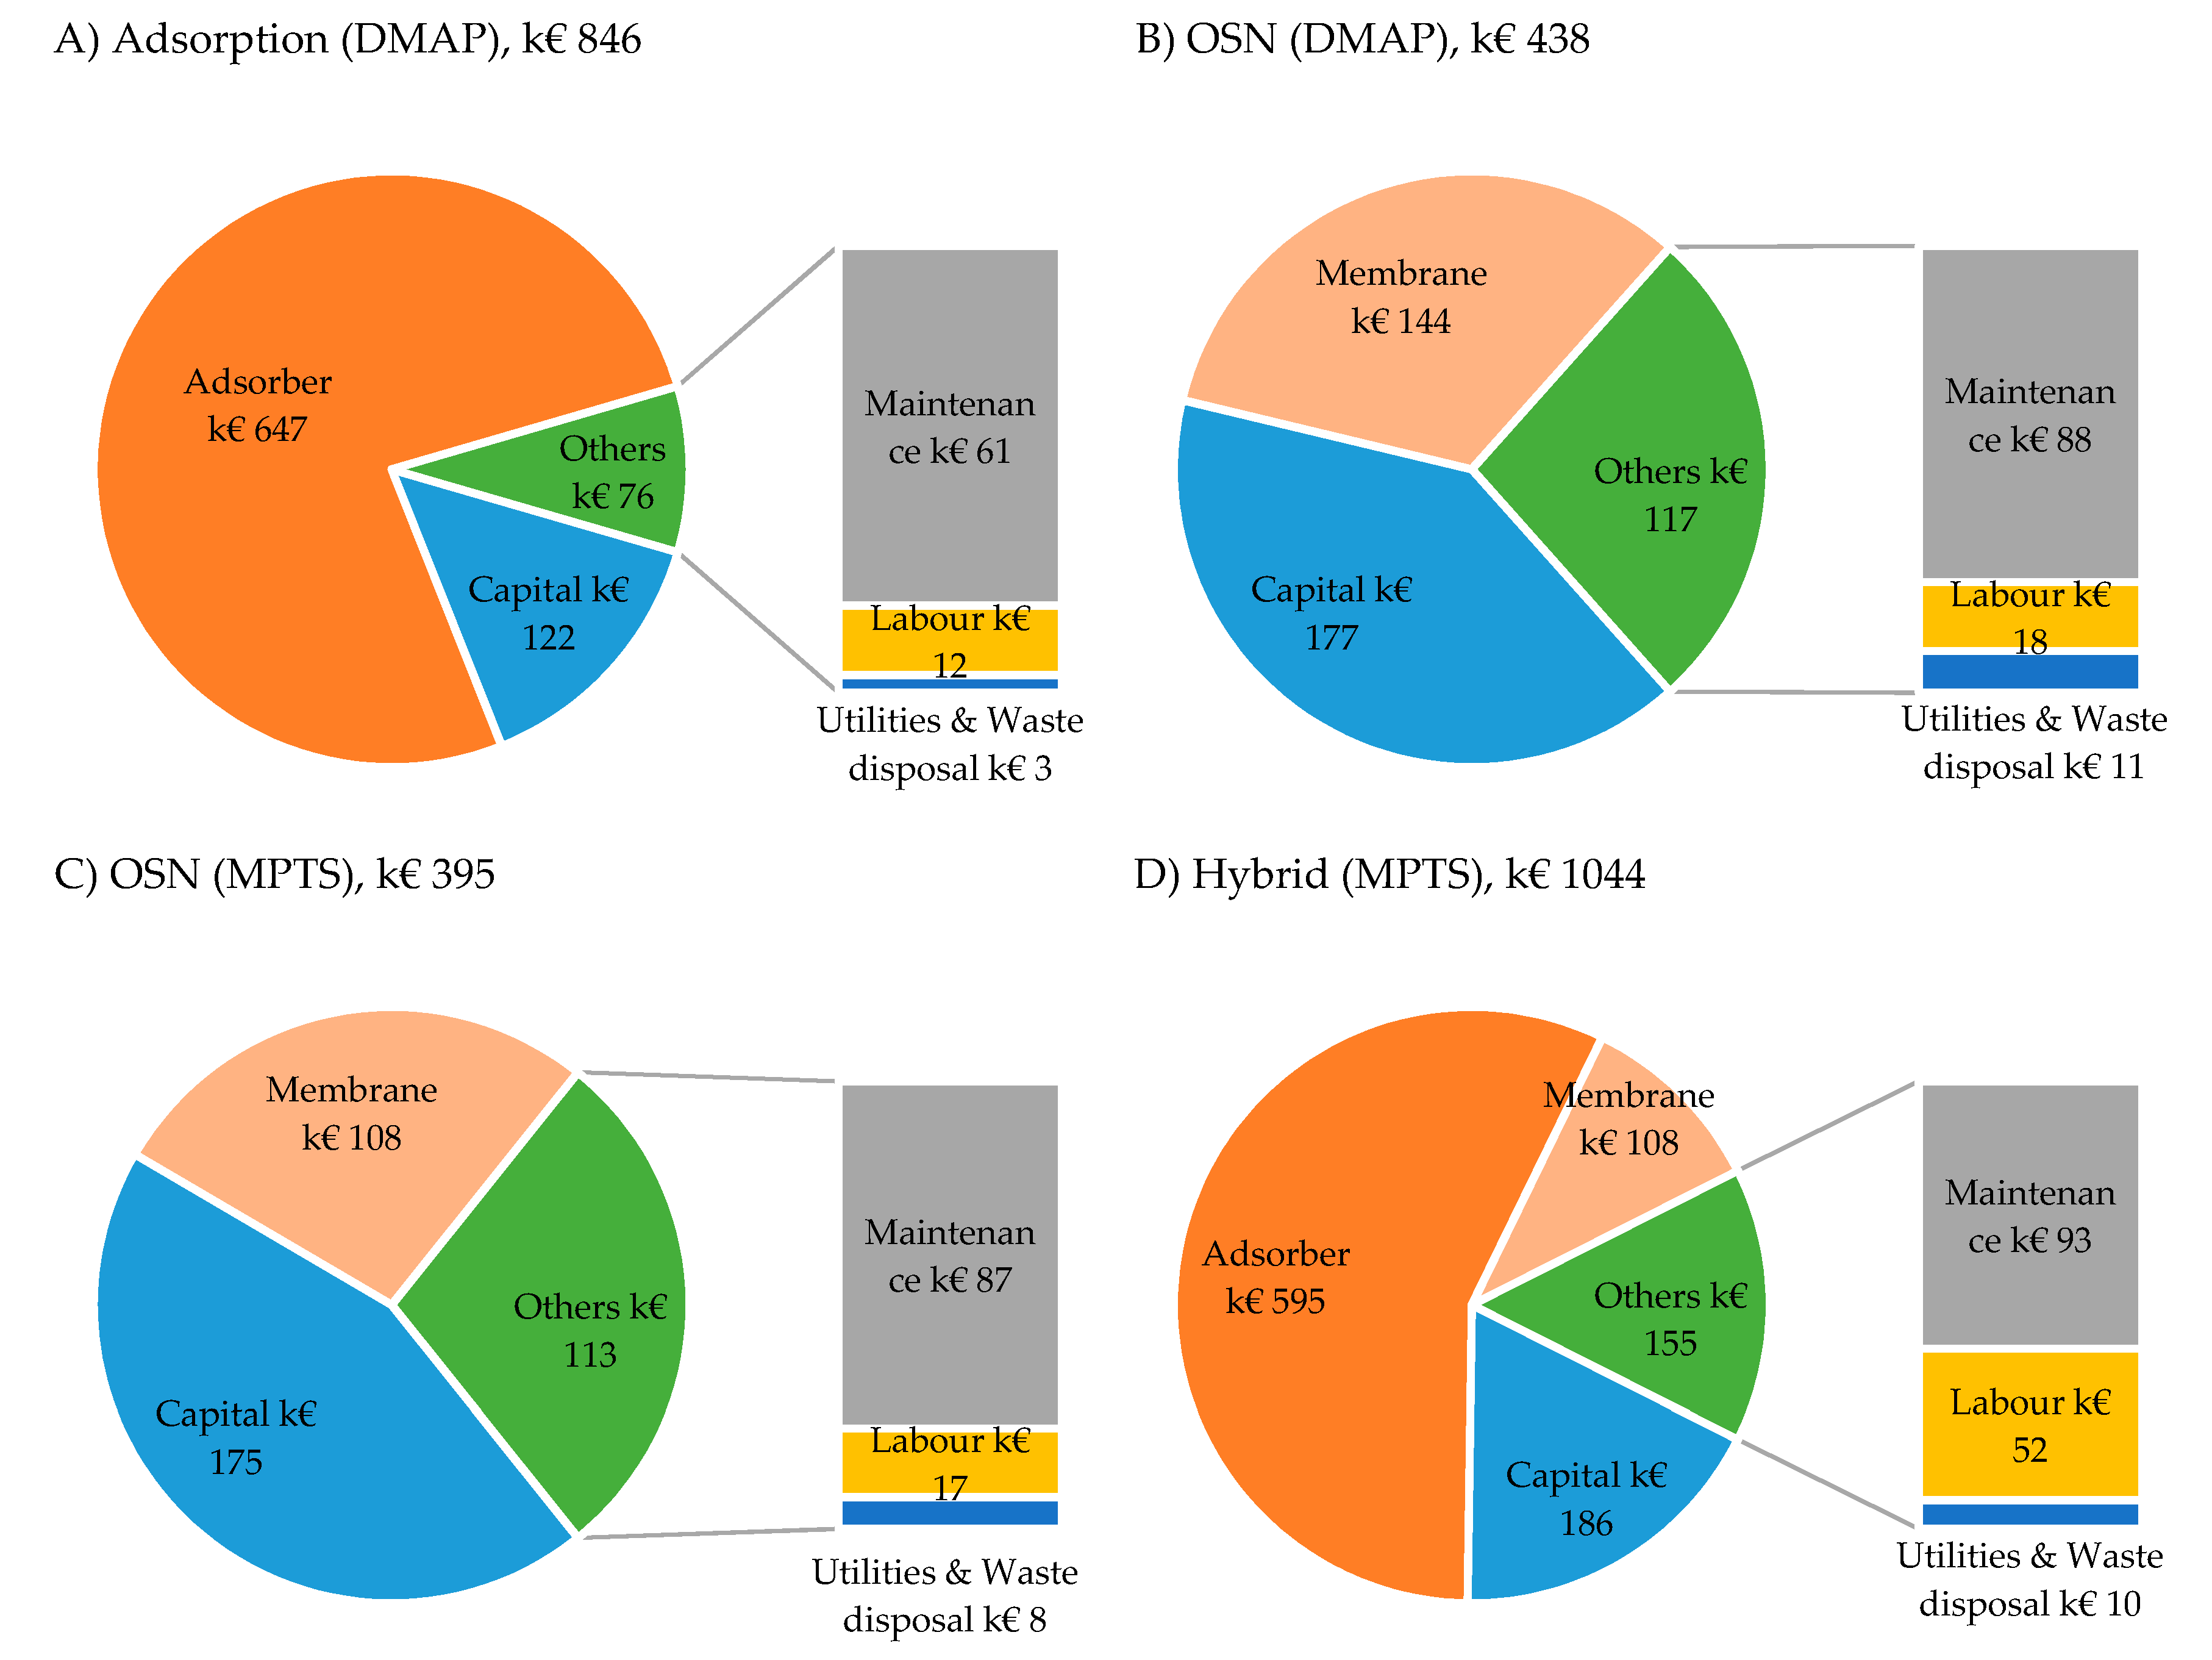
4.3.1. Process and Economic Model
- (i)
- Removal of DMAP from Meta solutions using different single stage processes-adsorption using PBI-TA or OSN—Is compared by evaluating the balance between process costs and revenue losses due to API losses balance.
- (ii)
- Removal of MPTS from Meta using only OSN or hybrid processes are compared to assess whether the recovery of the API on the hybrid process compensates the costs with additional stages.
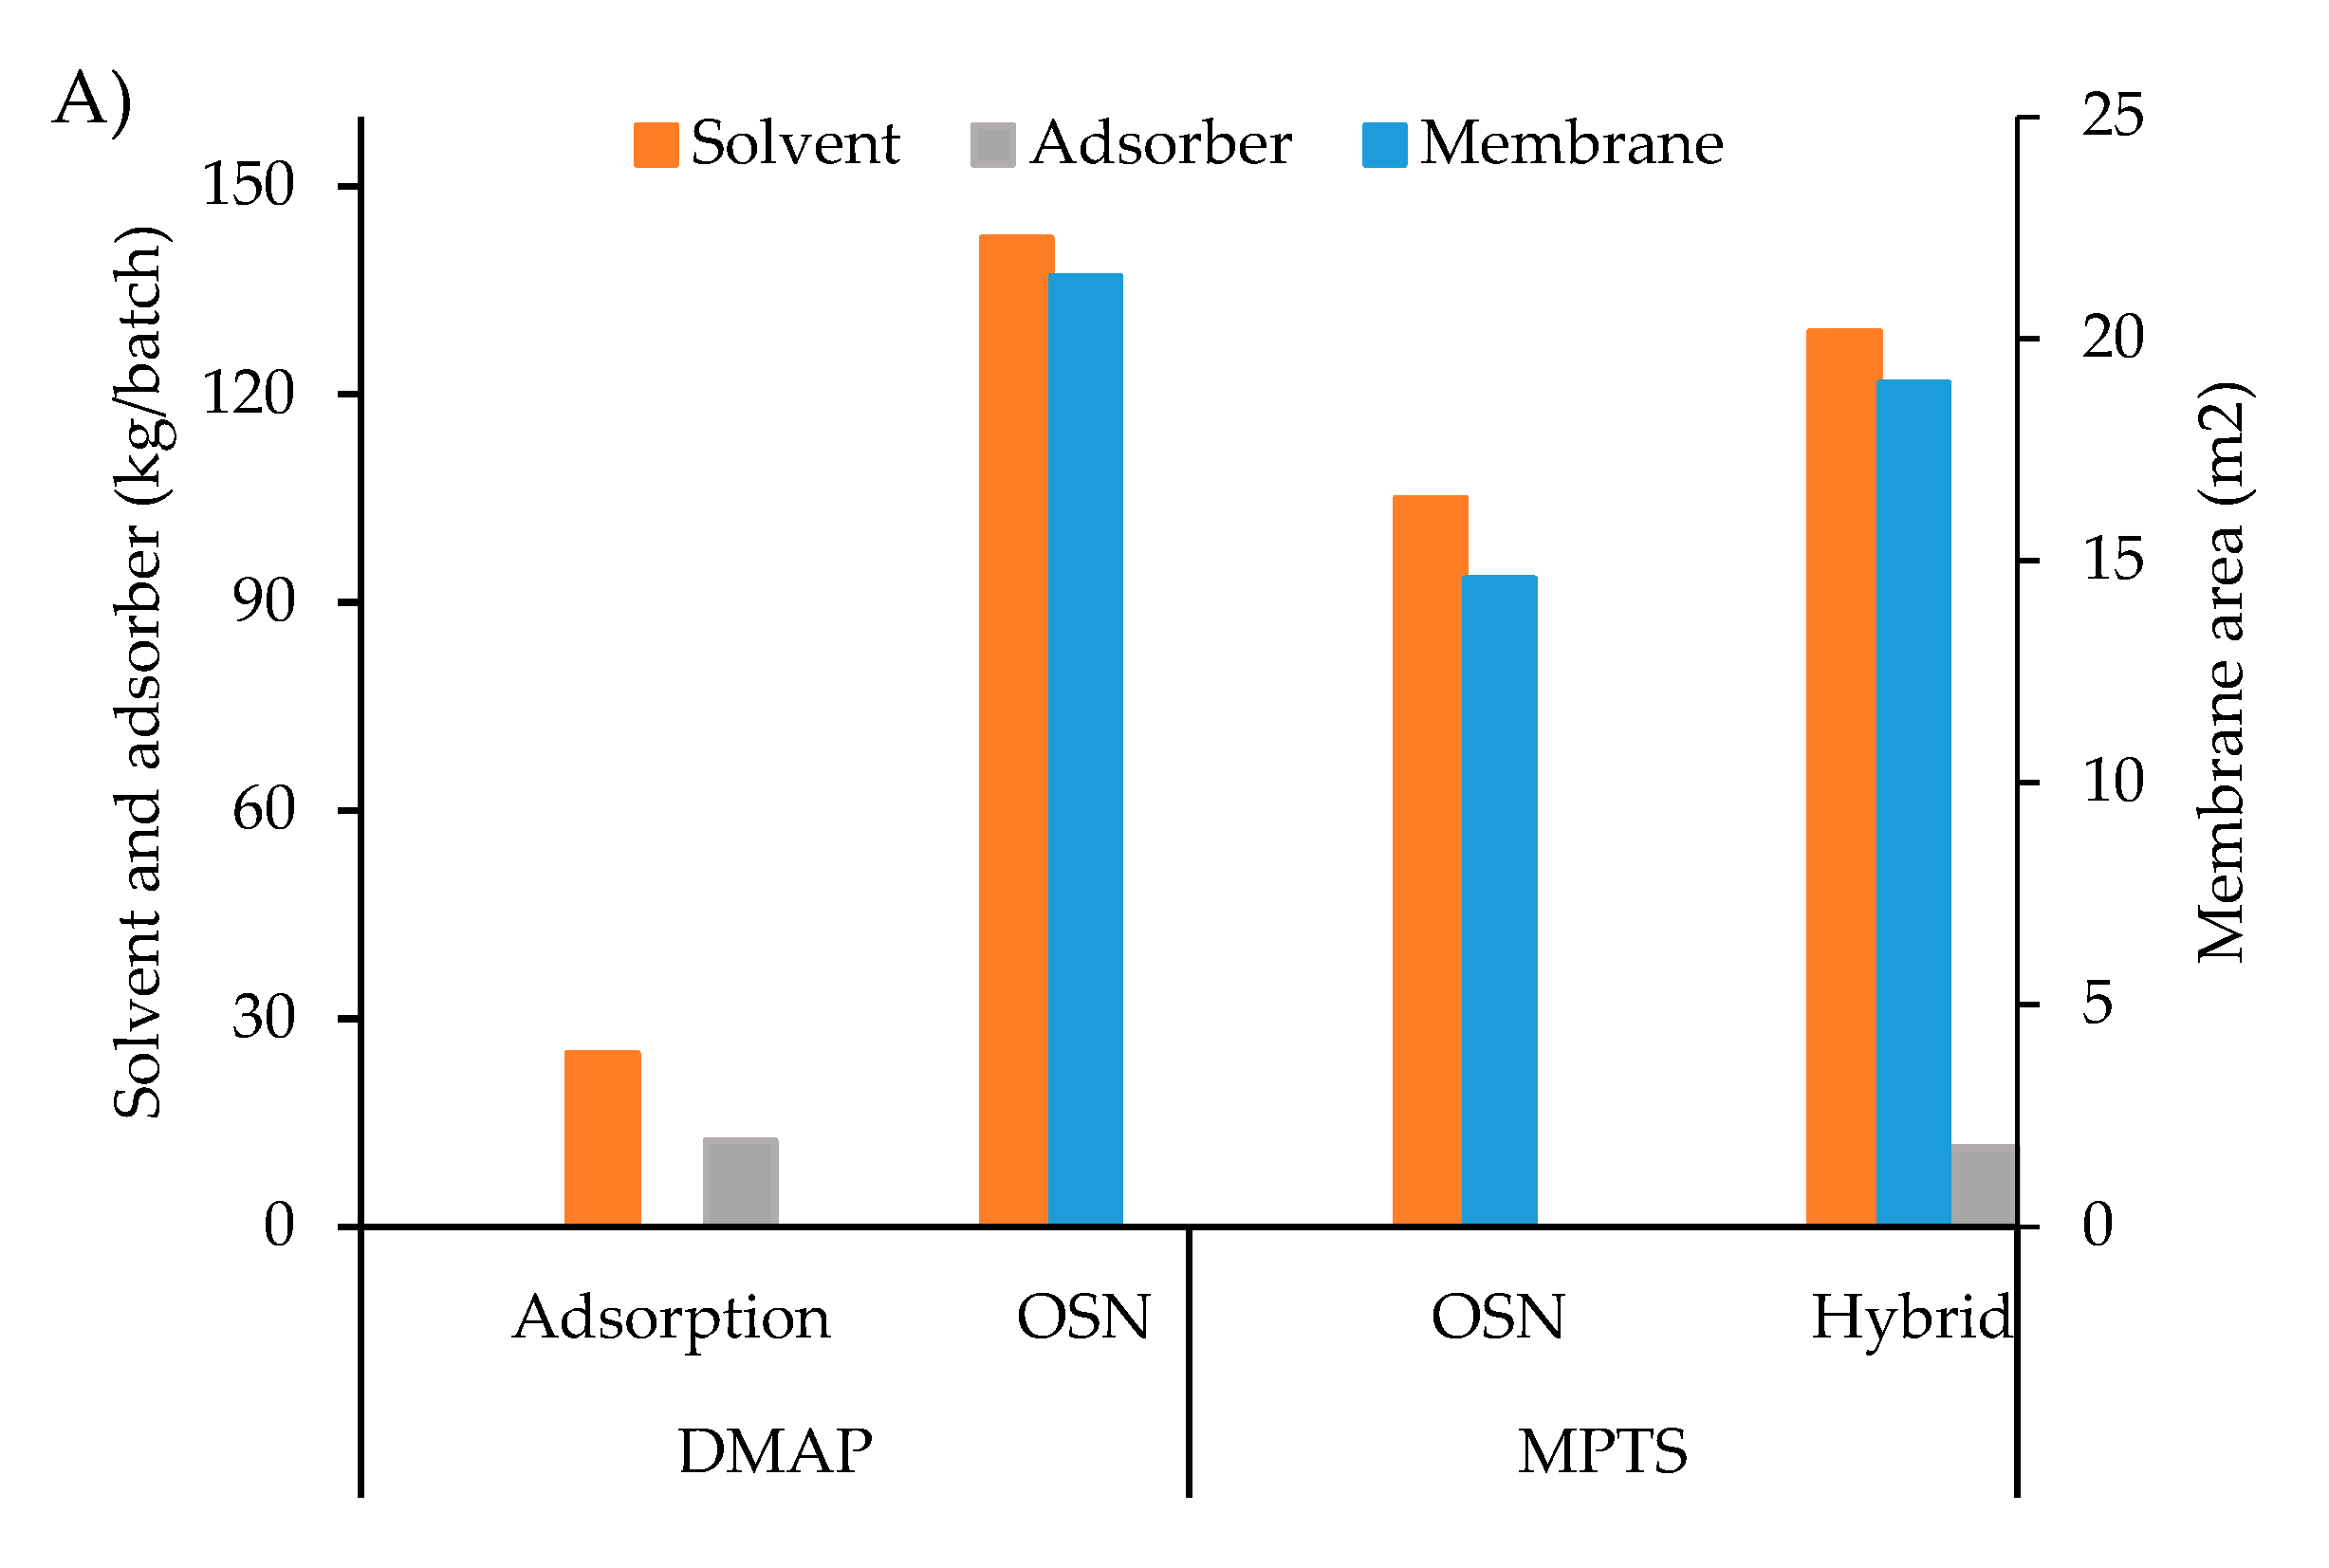
4.3.2. Environmental Analysis
5. Conclusions
Supplementary Materials
Author Contributions
Funding
Acknowledgments
Conflicts of Interest
References
- Teasdale, A.; Elder, D.; Chang, S.J.; Wang, S.; Thompson, R.; Benz, N.; Sanchez-Flores, I.H. Risk assessment of genotoxic impurities in new chemical entities: Strategies to demonstrate control. Org. Process Res. Dev. 2013, 17, 221–230. [Google Scholar] [CrossRef]
- EMEA. Guidelines on the “Limits of Genotoxic Impurities”; EMEA/CHMP/QWP/251344/2006; Committee for Medicinal Products for Human Use: London, UK, 2006. [Google Scholar]
- Snodin, D. ICH Guideline M7 on mutagenic impurities in pharmaceuticals. Regul. Rapp. 2017, 14, 5–9. [Google Scholar]
- Snodin, D.J. Genotoxic impurities: From structural alerts to qualification. Org. Process Res. Dev. 2010, 14, 960–976. [Google Scholar] [CrossRef]
- Szekely, G.; Sousa, M.C.A.; Gil, M.; Ferreira, F.C.; Heggie, W. Genotoxic impurities in pharmaceutical manufacturing: Sources, regulations, and mitigation. Chem. Rev. 2015, 16, 8182–8229. [Google Scholar] [CrossRef]
- Esteves, T.; Vicente, A.I.; Ferreira, F.A.; Afonso, C.A.M.; Ferreira, F.C. Mimicking DNA alkylation: Removing genotoxin impurities from API streams with a solvent stable polybenzimidazole-adenine polymer. React. Funct. Pol. 2018, 131, 258–265. [Google Scholar] [CrossRef]
- Bousquet, J. Mometasone furoate: An effective anti-inflammatory with a well-defined safety and tolerability profile in the treatment of asthma. Int. J. Clin. Pract. 2009, 63, 806–819. [Google Scholar] [CrossRef]
- Heggie, W.; Bandarra, J. Process for the Preparation of Mometasone Furoate. U.S. Patent 6177560 B1, 23 January 2001. [Google Scholar]
- Salem, I.I.; Alkhatib, M.; Najib, N. LC-MS/MS determination of betamethasone and its phosphate and acetate esters in human plasma after sample stabilization. J. Pharmaceut. Biomed. 2011, 56, 983–991. [Google Scholar] [CrossRef]
- Esteves, T.; Ferreira, F.A.; Pina, M.; Bandarra, J.; Ferreira, F.C. Screening commercial available resins for simultaneous removal of two potential genotoxins from API methanolic streams. Sep. Sci. Technol. 2019. [Google Scholar] [CrossRef]
- Székely, G.; Gil, M.; Sellergren, B.; Heggie, W.; Ferreira, F.C. Environmental and economic analysis for selection and engineering sustainable API degenotoxification processes. Green Chem. 2013, 15, 210–225. [Google Scholar] [CrossRef]
- Kecili, R.; Billing, J.; Leeman, M.; Nivhede, D.; Sellergren, B.; Rees, A.; Yilmaz, E. Selective scavenging of the genotoxic impurity methyl p-toluenesulfonate from pharmaceutical formulations. Sep. Purif. Technol. 2013, 103, 173–179. [Google Scholar] [CrossRef]
- Lee, C.; Helmy, R.; Strulson, C.; Plewa, J.; Kolodziej, E.; Antonucci, V.; Mao, B.; Welch, C.J.; Ge, Z.; Al-Sayah, M.A. Removal of electrophilic potential genotoxic impurities using nucleophilic reactive resins. Org. Process Res. Dev. 2010, 14, 1021–1026. [Google Scholar] [CrossRef]
- Zhou, L.; Mao, B.; Reamer, R.; Novak, T.; Ge, Z. Impurity profile tracking for active pharmaceutical ingredients: Case reports. J. Pharm. Biomed. Anal. 2007, 44, 421–429. [Google Scholar] [CrossRef] [PubMed]
- Vicente, A.I.; Esteves, T.; Afonso, C.A.M.; Ferreira, F.C. Solvent compatible polymer functionalized with adenine, a DNA base, for API degenotoxification: Preparation and characterization. Sep. Purif. Technol. 2017, 179, 438–448. [Google Scholar] [CrossRef]
- Esteves, T.; Viveiros, R.; Bandarra, J.; Heggie, W.; Casimiro, T.; Ferreira, F.C. Molecularly imprinted polymer strategies for removal of a genotoxic impurity, 4-dimethylaminopyridine, from an active pharmaceutical ingredient post-reaction stream. Sep. Purif. Technol. 2016, 163, 206–214. [Google Scholar] [CrossRef]
- Székely, G.; Valtcheva, I.B.; Kim, J.F.; Livingston, A.G. Molecularly imprinted organic solvent nanofiltration membranes—Revealing molecular recognition and solute rejection behaviour. React. Funct. Polym. 2015, 86, 215–224. [Google Scholar] [CrossRef]
- Székely, G.; Bandarra, J.; Heggie, W.; Sellergren, B.; Ferreira, F.C. A hybrid approach to reach stringent low genotoxic impurity contents in active pharmaceutical ingredients: Combining molecularly imprinted polymers and organic solvent nanofiltration for removal of 1,3-diisopropylurea. Sep. Purif. Technol. 2012, 86, 79–87. [Google Scholar] [CrossRef]
- Székely, G.; Bandarra, J.; Heggie, W.; Ferreira, F.C.; Sellergren, B. Design, preparation and characterization of novel molecularly imprinted polymers for removal of potentially genotoxic 1,3-diisopropylurea from API solutions. Sep. Purif. Technol. 2012, 86, 190–198. [Google Scholar] [CrossRef]
- Székely, G.; Bandarra, J.; Heggie, W.; Ferreira, F.C.; Sellergren, B. Organic solvent nanofiltration: A platform for removal of genotoxins from active pharmaceutical ingredients. J. Memb. Sci. 2011, 381, 21–33. [Google Scholar] [CrossRef]
- Boam, A.; Nozari, A. Fine chemical: OSN—A lower energy alternative. Filtr. Sep. 2006, 43, 46–48. [Google Scholar] [CrossRef]
- Rundquist, E.M.; Pink, C.J.; Livingston, A.G. Organic solvent nanofiltration: A potential alternative to distillation for solvent recovery from crystallisation mother liquors. Green Chem. 2012, 14, 2197–2205. [Google Scholar] [CrossRef]
- Ferreira, F.A.; Esteves, T.; Carrasco, M.P.; Bandarra, J.; Afonso, C.A.M.; Ferreira, F.C. Polybenzimidazole for Active Pharmaceutical Ingredient Purification: The Mometasone Furoate Case Study. Ind. Eng. Chem. Res. 2019, 58, 10524–10532. [Google Scholar] [CrossRef]
- Mulder, M. Basic Principles of Membrane Technology, 2nd ed.; Kluwer Acedemic Publishers: Dordrecht, The Netherlands, 1996. [Google Scholar]
- Borsig. Available online: https://www.borsig.de/uploads/tx_bcpageflip/BMT_-_Organic_Solvent_Nanofiltration_-_Internet__E_.pdf (accessed on 4 April 2020).
- Foo, K.Y.; Hameed, B.H. Insights into the modeling of adsorption isotherm systems. Chem. Eng. J. 2010, 156, 2–10. [Google Scholar] [CrossRef]
- Kim, J.F.; Silva, A.M.F.; Valtcheva, I.B.; Livingston, A.G. When the membrane is not enough: A simplified membrane cascade using Organic Solvent Nanofiltration (OSN). Sep. Pur. Technol. 2013, 116, 277–286. [Google Scholar] [CrossRef]
- Kim, J.F.; Szekely, G.; Valtcheva, I.B.; Livingston, A.G. Increasing the sustainability of membrane processes through cascade approach and solvent recovery—Pharmaceutical purification case study. Green Chem. 2014, 16, 133–145. [Google Scholar] [CrossRef]
- Peeva, L.; Burgal, J.S.; Valtcheva, I.B.; Livingston, A.G. Continuous purification of active pharmaceutical ingredients using multistage organic solvent nanofiltration membrane cascade. Chem. Eng. Sci. 2014, 116, 183–194. [Google Scholar] [CrossRef]
- Ferguson, S.; Ortner, F.; Quon, J.; Peeva, L.; Livingston, A.G.; Trout, B.L.; Myerson, A.S. Use of Continuous MSMPR Crystallization with Integrated Nanofiltration Membrane Recycle for Enhanced Yield and Purity in API Crystallization. Cryst. Growth Des. 2014, 14, 617–627. [Google Scholar] [CrossRef]
- Sinnott, R.K. Chemical Engineering Design, 4th ed.; Butterworth-Heinenmann: Oxford, UK, 2005. [Google Scholar]
- Jiménez-González, C.; Constable, D.J.C.; Ponder, C.S. Evaluating the “greenness” of chemical processes and products in the pharmaceutical industry—A green metrics primer. Chem. Soc. Rev. 2012, 41, 1485–1498. [Google Scholar] [CrossRef]
- Sheldon, R.A. The E factor 25 years on: The rise of green chemistry and sustainability. Green Chem. 2017, 19, 18–43. [Google Scholar] [CrossRef]


| API Loss (%) | ||||||||
|---|---|---|---|---|---|---|---|---|
| API Rejection | ||||||||
| 80% | 85% | 90% | 95% | 97.5% | 99% | 99.99% | ||
| GTI rejection | 0% | 47.7 | 36.7 | 25.0 | 12.7 | 6.4 | 2.6 | 0.0 |
| 10% | 52.3 | 40.4 | 27.7 | 14.1 | 7.1 | 2.9 | 0.0 | |
| 20% | 57.8 | 45.0 | 30.9 | 15.9 | 8.0 | 3.2 | 0.0 | |
| 30% | 64.5 | 50.7 | 35.1 | 18.1 | 9.1 | 3.7 | 0.0 | |
| 40% | 72.6 | 57.8 | 40.4 | 21.0 | 10.7 | 4.3 | 0.0 | |
| 50% | 82.2 | 67.0 | 47.7 | 25.0 | 12.7 | 5.1 | 0.0 | |
| 60% | 92.5 | 78.9 | 57.8 | 30.9 | 15.9 | 6.4 | 0.0 | |
| 70% | 99.4 | 92.5 | 72.6 | 40.4 | 21.0 | 8.5 | 0.0 | |
| API Loss (%) | |||||||||||||||||||
|---|---|---|---|---|---|---|---|---|---|---|---|---|---|---|---|---|---|---|---|
| Low <------------------------------------------------------------------------ API Adsorption Capacity ---------------------------------------------------------------------->High | |||||||||||||||||||
| Qmax = 0.0085 gAPI/gAdsorber | Qmax = 0.085 gAPI/gAdsorber | Qmax = 0.85 gAPI/gAdsorber | Qmax = 8.5 gAPI/gAdsorber | ||||||||||||||||
| (mgGTI/gAdsorber) | A1 | A2 | A3 | A4 | B1 | B2 | B3 | B4 | C1 | C2 | C3 | C4 | D1 | D2 | D3 | D4 | |||
| kL, API (L/gAPI) | 0.002 L/gAPI | 0.021 L/gAPI | 0.21 L/gAPI | 2.1 L/gAPI | 0.002 L/gAPI | 0.021 L/gAPI | 0.21 L/gAPI | 2.1 L/gAPI | 0.002 L/gAPI | 0.021 L/gAPI | 0.21 L/gAPI | 2.1 L/gAPI | 0.002 L/gAPI | 0.021 L/gAPI | 0.21 L/gAPI | 2.1 L/gAPI | |||
| kL, GTI (L/mgGTI) | |||||||||||||||||||
| High <------GTI Adsorption capacity----------> Low | Qmax = 1 | aI | 0.0081 | 4.23 | 34.34 | n.d. | n.d. | 38.06 | n.d. | n.d. | n.d. | n.d. | n.d. | n.d. | n.d. | n.d. | n.d. | n.d. | n.d. |
| aII | 0.081 | 1.86 | 14.45 | 54.60 | n.d. | 16.45 | n.d. | n.d. | n.d. | n.d. | n.d. | n.d. | n.d. | n.d. | n.d. | n.d. | n.d. | ||
| aIII | 0.81 | 1.62 | 12.55 | 44.99 | 74.74 | 14.33 | n.d. | n.d. | n.d. | n.d. | n.d. | n.d. | n.d. | n.d. | n.d. | n.d. | n.d. | ||
| aIV | 8.1 | 1.60 | 12.37 | 44.10 | 71.64 | 14.12 | n.d. | n.d. | n.d. | n.d. | n.d. | n.d. | n.d. | n.d. | n.d. | n.d. | n.d. | ||
| Qmax = 10 | bI | 0.0081 | 0.43 | 3.59 | 14.98 | 23.85 | 4.23 | 34.34 | n.d. | n.d. | 38.06 | n.d. | n.d. | n.d. | n.d. | n.d. | n.d. | n.d. | |
| bII | 0.081 | 0.19 | 1.57 | 6.16 | 8.89 | 1.86 | 14.45 | 54.60 | n.d. | 16.45 | n.d. | n.d. | n.d. | n.d. | n.d. | n.d. | n.d. | ||
| bIII | 0.81 | 0.16 | 1.37 | 5.34 | 7.66 | 1.62 | 12.55 | 44.99 | 74.74 | 14.33 | n.d. | n.d. | n.d. | n.d. | n.d. | n.d. | n.d. | ||
| bIV | 8.1 | 0.16 | 1.35 | 5.26 | 7.54 | 1.60 | 12.37 | 44.10 | 71.64 | 14.12 | n.d. | n.d. | n.d. | n.d. | n.d. | n.d. | n.d. | ||
| Qmax = 100 | cI | 0.0081 | 0.04 | 0.36 | 1.42 | 2.01 | 0.43 | 3.59 | 14.98 | 23.85 | 4.23 | 34.34 | n.d. | n.d. | 38.06 | n.d. | n.d. | n.d. | |
| cII | 0.081 | 0.02 | 0.16 | 0.62 | 0.88 | 0.19 | 1.57 | 6.16 | 8.89 | 1.86 | 14.45 | 54.60 | n.d. | 16.45 | n.d. | n.d. | n.d. | ||
| cIII | 0.81 | 0.02 | 0.14 | 0.54 | 0.76 | 0.16 | 1.37 | 5.34 | 7.66 | 1.62 | 12.55 | 44.99 | 74.74 | 14.33 | n.d. | n.d. | n.d. | ||
| cIV | 8.1 | 0.02 | 0.14 | 0.53 | 0.75 | 0.16 | 1.35 | 5.26 | 7.54 | 1.60 | 12.37 | 44.10 | 71.64 | 14.12 | n.d. | n.d. | n.d. | ||
| Qmax = 10,000 | dI | 0.0081 | 0.01 | 0.04 | 0.14 | 0.20 | 0.04 | 0.36 | 1.42 | 2.01 | 0.43 | 3.59 | 14.98 | 23.85 | 4.23 | 34.34 | n.d. | n.d. | |
| dII | 0.081 | 0.01 | 0.02 | 0.06 | 0.09 | 0.02 | 0.16 | 0.62 | 0.88 | 0.19 | 1.57 | 6.16 | 8.89 | 1.86 | 14.45 | 54.60 | n.d. | ||
| dIII | 0.81 | 0.01 | 0.01 | 0.05 | 0.08 | 0.02 | 0.14 | 0.54 | 0.76 | 0.16 | 1.37 | 5.34 | 7.66 | 1.62 | 12.55 | 44.99 | 74.74 | ||
| dIV | 8.1 | 0.01 | 0.01 | 0.05 | 0.08 | 0.02 | 0.14 | 0.53 | 0.75 | 0.16 | 1.35 | 5.26 | 7.54 | 1.60 | 12.37 | 44.10 | 71.64 | ||
| n = 1 | n = 2 | n = 3 | |||||||||||||||||
|---|---|---|---|---|---|---|---|---|---|---|---|---|---|---|---|---|---|---|---|
| KF,API | 0.001 | 0.01 | 0.05 | 0.10 | 0.25 | 0.50 | 0.001 | 0.01 | 0.05 | 0.10 | 0.25 | 0.50 | 0.001 | 0.01 | 0.05 | 0.10 | 0.25 | 0.50 | |
| KF,GTI | |||||||||||||||||||
| 0.05 | 25.17 | n.d | n.d | n.d | n.d | n.d | n.d | n.d | n.d | n.d | n.d | n.d | 99.99 | n.d | n.d | n.d | n.d | n.d | |
| 0.5 | 2.47 | 25.17 | n.d | n.d | n.d | n.d | 55.04 | 71.47 | n.d | n.d | n.d | n.d | 9.52 | 99.99 | n.d | n.d | n.d | n.d | |
| 1 | 1.23 | 12.46 | 64.91 | n.d | n.d | n.d | 26.92 | 34.73 | n.d | n.d | n.d | n.d | 4.74 | 49.14 | n.d | n.d | n.d | n.d | |
| 1.5 | 0.82 | 8.28 | 42.53 | 88.09 | n.d | n.d | 17.82 | 22.94 | n.d | n.d | n.d | n.d | 3.15 | 32.33 | n.d | n.d | n.d | n.d | |
| 3 | 0.41 | 4.12 | 20.90 | 42.23 | n.d | n.d | 8.84 | 11.36 | 58.99 | n.d | n.d | n.d | 1.58 | 15.96 | 84.13 | n.d | n.d | n.d | |
| 3.5 | 0.35 | 3.53 | 17.87 | 36.07 | 94.87 | n.d | 7.57 | 9.72 | 50.22 | n.d | n.d | n.d | 1.35 | 13.65 | 71.42 | n.d | n.d | n.d | |
| 6 | 0.20 | 2.06 | 10.36 | 20.90 | 53.38 | n.d | 4.31 | 5.66 | 28.80 | 58.99 | n.d | n.d | 0.79 | 7.93 | 40.67 | 84.13 | n.d | n.d | |
| 7.5 | 0.16 | 1.65 | 8.28 | 16.67 | 42.53 | 87.50 | 3.46 | 4.52 | 22.94 | 46.74 | n.d | n.d | 0.63 | 6.33 | 32.33 | 66.40 | n.d | n.d | |
| 10 | 0.12 | 1.23 | 6.20 | 12.46 | 31.62 | 65.22 | 2.60 | 3.39 | 17.12 | 34.73 | 90.35 | n.d | 0.47 | 4.74 | 24.09 | 49.14 | n.d | n.d | |
| 15 | 0.08 | 0.82 | 4.12 | 8.28 | 20.90 | 42.53 | 1,74 | 2.26 | 11.36 | 22.93 | 58.99 | n.d | 0.32 | 3.16 | 15.96 | 32.33 | 84.13 | n.d | |
| 30 | 004 | 0.41 | 2.06 | 4.12 | 10.36 | 20.90 | 0.87 | 1.13 | 5.66 | 11.36 | 28.80 | 58.99 | 0.16 | 1.58 | 7.93 | 15.96 | 40.68 | 84.13 | |
| Permeate mgGTI/gAPI | ||||||||
|---|---|---|---|---|---|---|---|---|
| API Rejection | ||||||||
| 80% | 85% | 90% | 95% | 97.5% | 99% | 99.99% | ||
| GTI rejection | 0% | 201.5 | 259.6 | 377.4 * | 733.3 | 1447.0 | 3589.3 | 201.5 |
| 10% | 184.4 | 236.3 + | 341.9 | 662.0 | 1304.2 | 3232.2 | 184.4 | |
| 20% | 167.5 & | 213.1 | 306.6 | 590.7 | 1161.4 | 2875.1 | 167.5 | |
| 30% | 150.9 | 190.1 | 271.3 | 519.5 | 1018.7 | 2518.1 | 150.9 | |
| 40% | 134.9 | 167.5 & | 236.3 + | 448.4 | 876.0 | 2161.0 | 134.9 | |
| 50% | 120.0 | 145.5 | 201.5 | 377.4 * | 733.3 | 1804.0 | 120.0 | |
| 60% | 107.5 | 124.8 | 167.5 & | 306.5 | 590.7 | 1447.1 | 107.5 | |
| 70% | 100.5 | 107.5 | 134.9 | 236.3 + | 448.4 | 1090.4 | 100.5 | |
| Cycles | API Loss (%) | mgGTI/gAPI | ||
|---|---|---|---|---|
| Model | Experimental | Model | Experimental | |
| 1 | 27.66 | 24.73 | 7.5 | 7.25 |
| 2 | 14.96 | 16.03 | 7.5 | 7.08 |
| 3 | 11.38 | 9.76 | 7.5 | 6.62 |
© 2020 by the authors. Licensee MDPI, Basel, Switzerland. This article is an open access article distributed under the terms and conditions of the Creative Commons Attribution (CC BY) license (http://creativecommons.org/licenses/by/4.0/).
Share and Cite
Ferreira, F.; Resina, L.; Esteves, T.; Ferreira, F.C. Comparison and Combination of Organic Solvent Nanofiltration and Adsorption Processes: A Mathematical Approach for Mitigation of Active Pharmaceutical Ingredient Losses during Genotoxin Removal. Membranes 2020, 10, 73. https://doi.org/10.3390/membranes10040073
Ferreira F, Resina L, Esteves T, Ferreira FC. Comparison and Combination of Organic Solvent Nanofiltration and Adsorption Processes: A Mathematical Approach for Mitigation of Active Pharmaceutical Ingredient Losses during Genotoxin Removal. Membranes. 2020; 10(4):73. https://doi.org/10.3390/membranes10040073
Chicago/Turabian StyleFerreira, Flávio, Leonor Resina, Teresa Esteves, and Frederico Castelo Ferreira. 2020. "Comparison and Combination of Organic Solvent Nanofiltration and Adsorption Processes: A Mathematical Approach for Mitigation of Active Pharmaceutical Ingredient Losses during Genotoxin Removal" Membranes 10, no. 4: 73. https://doi.org/10.3390/membranes10040073