
Relationship between Trace Element in Tumor and Prognosis in Lung Cancer Patients

Abstract
:1. Introduction
2. Materials and Methods
2.1. Method of the Current Study
2.2. Patient Population
2.3. Mutational Status Analysis
2.4. PIXE Analysis
2.5. Statistics and Analysis
3. Results
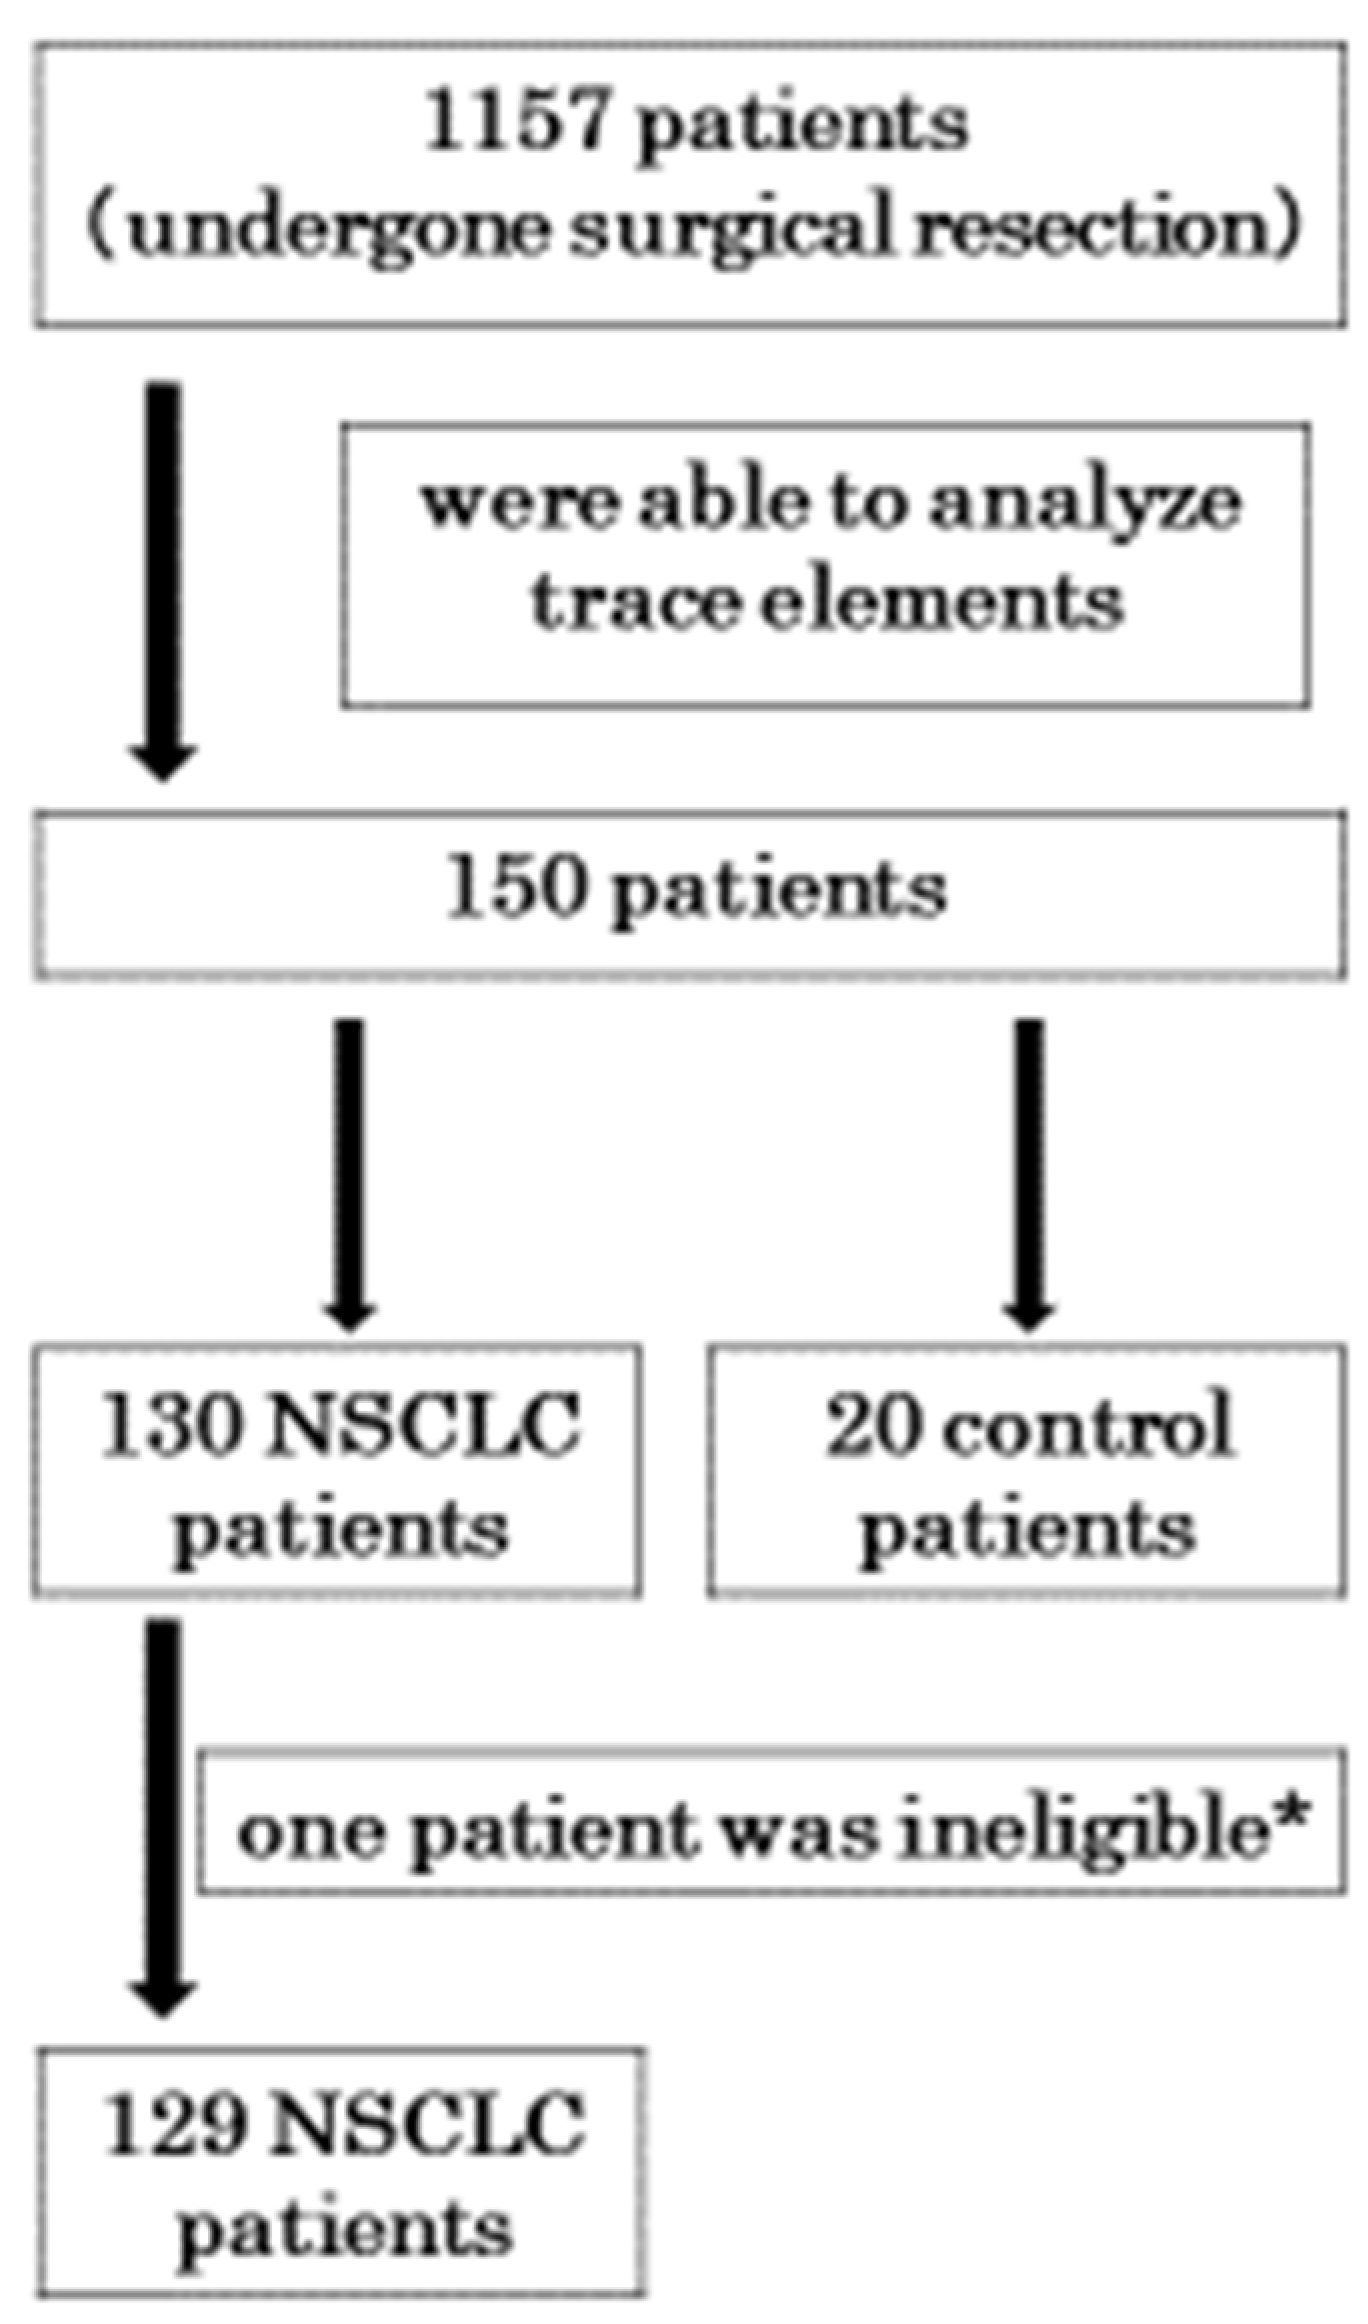
3.1. Patients
3.2. Characteristics
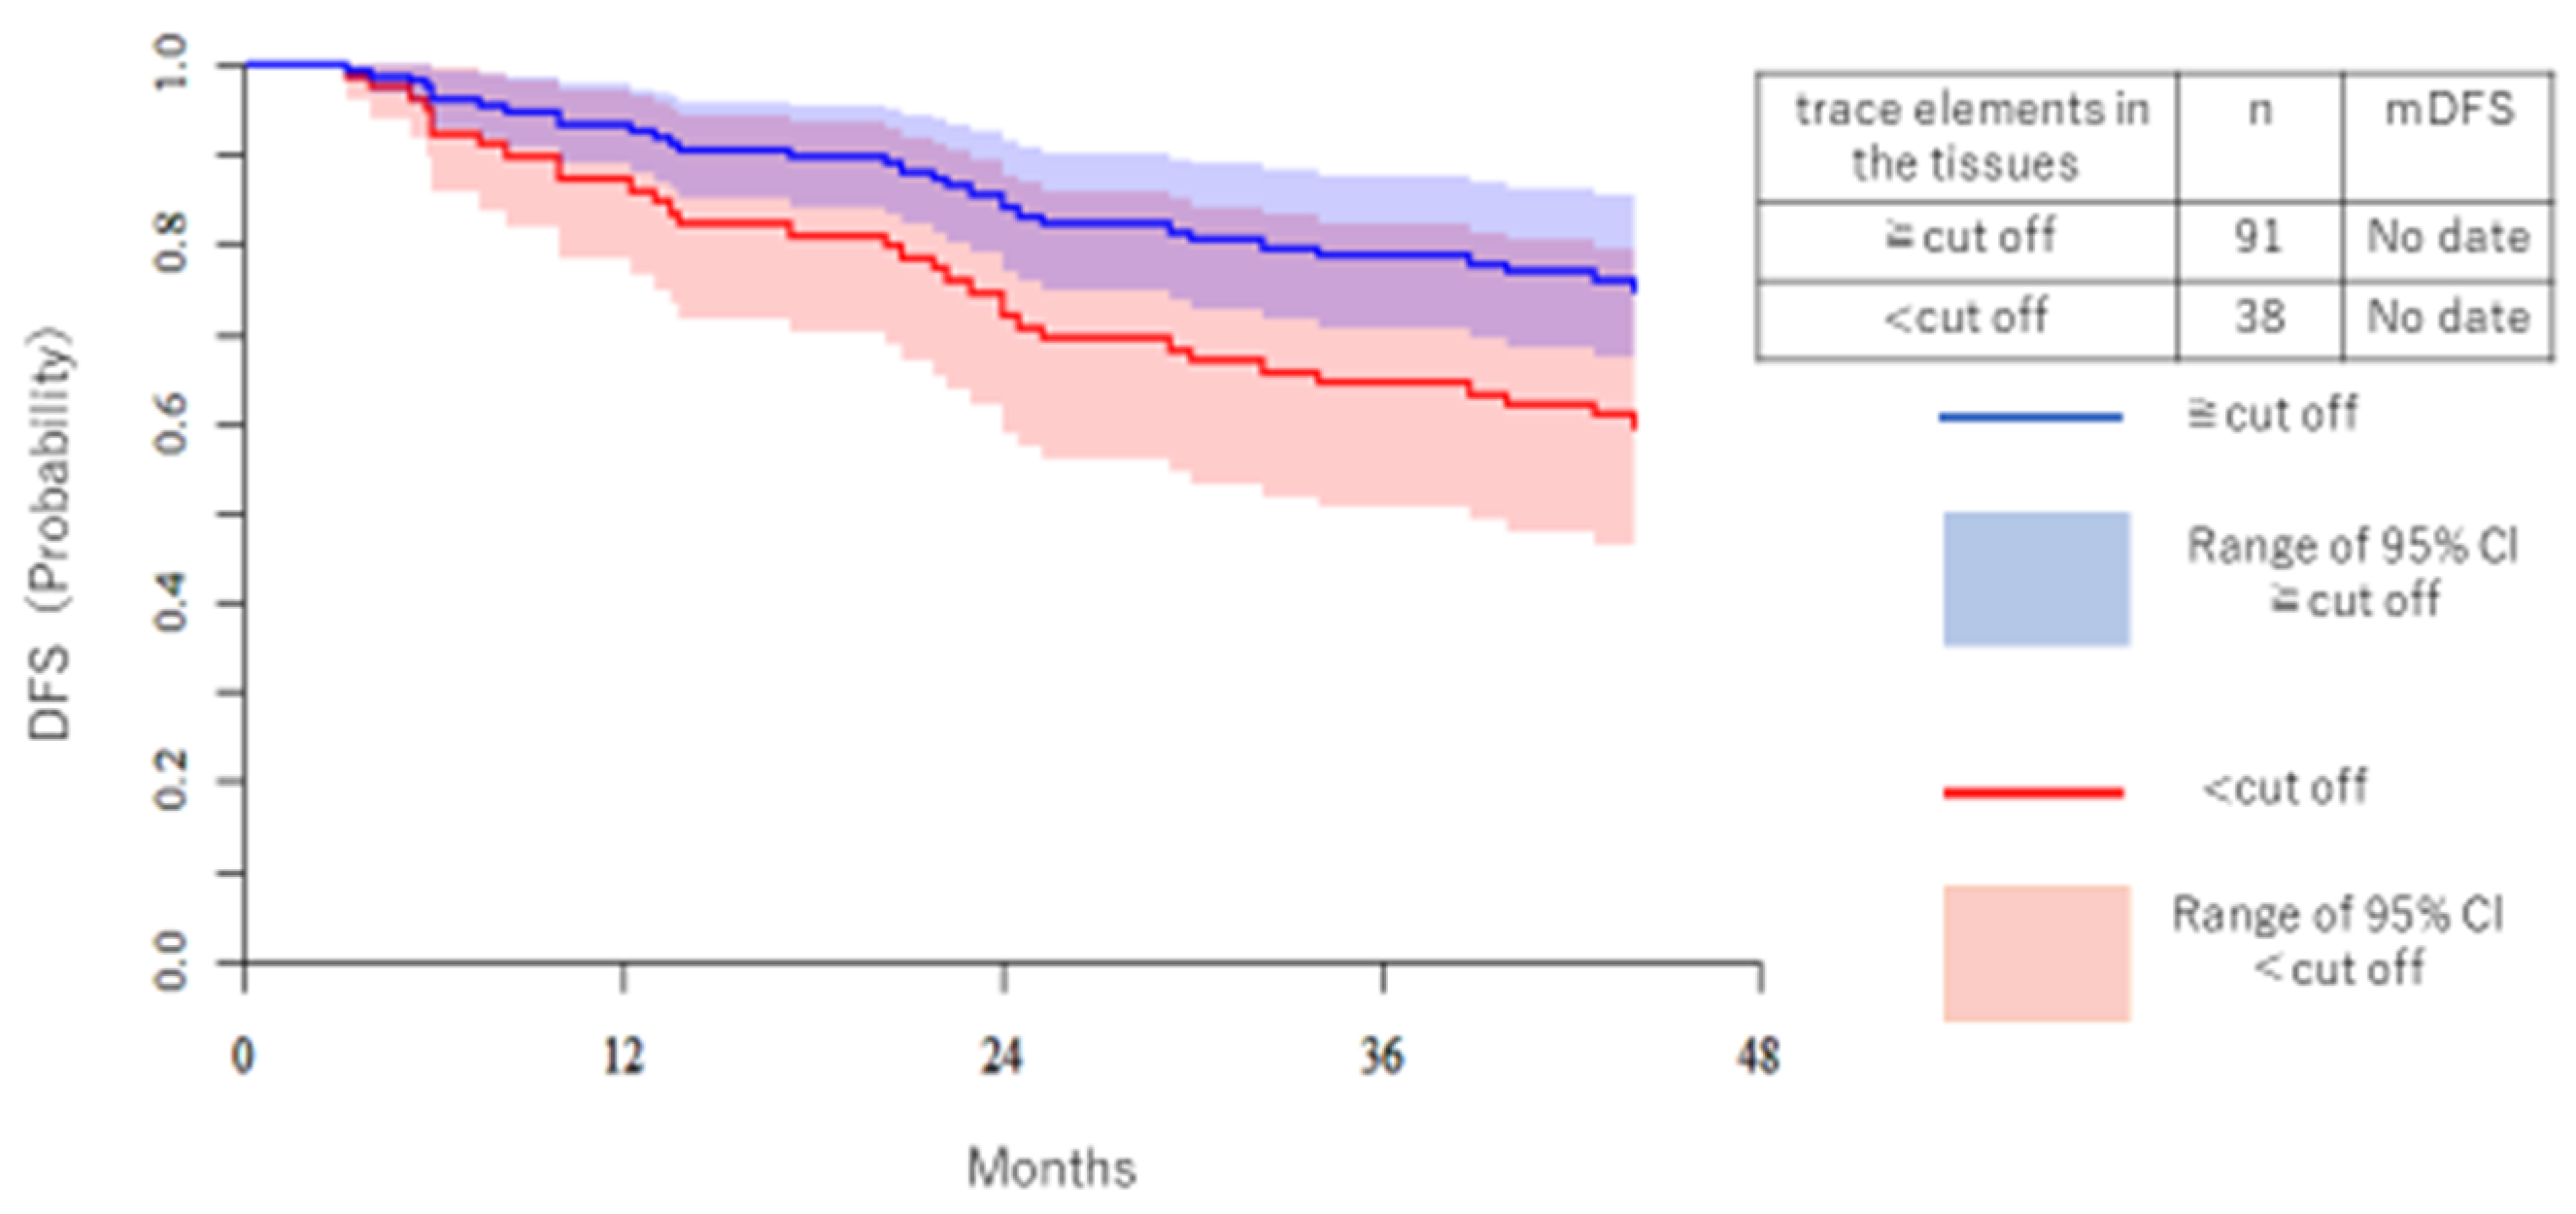
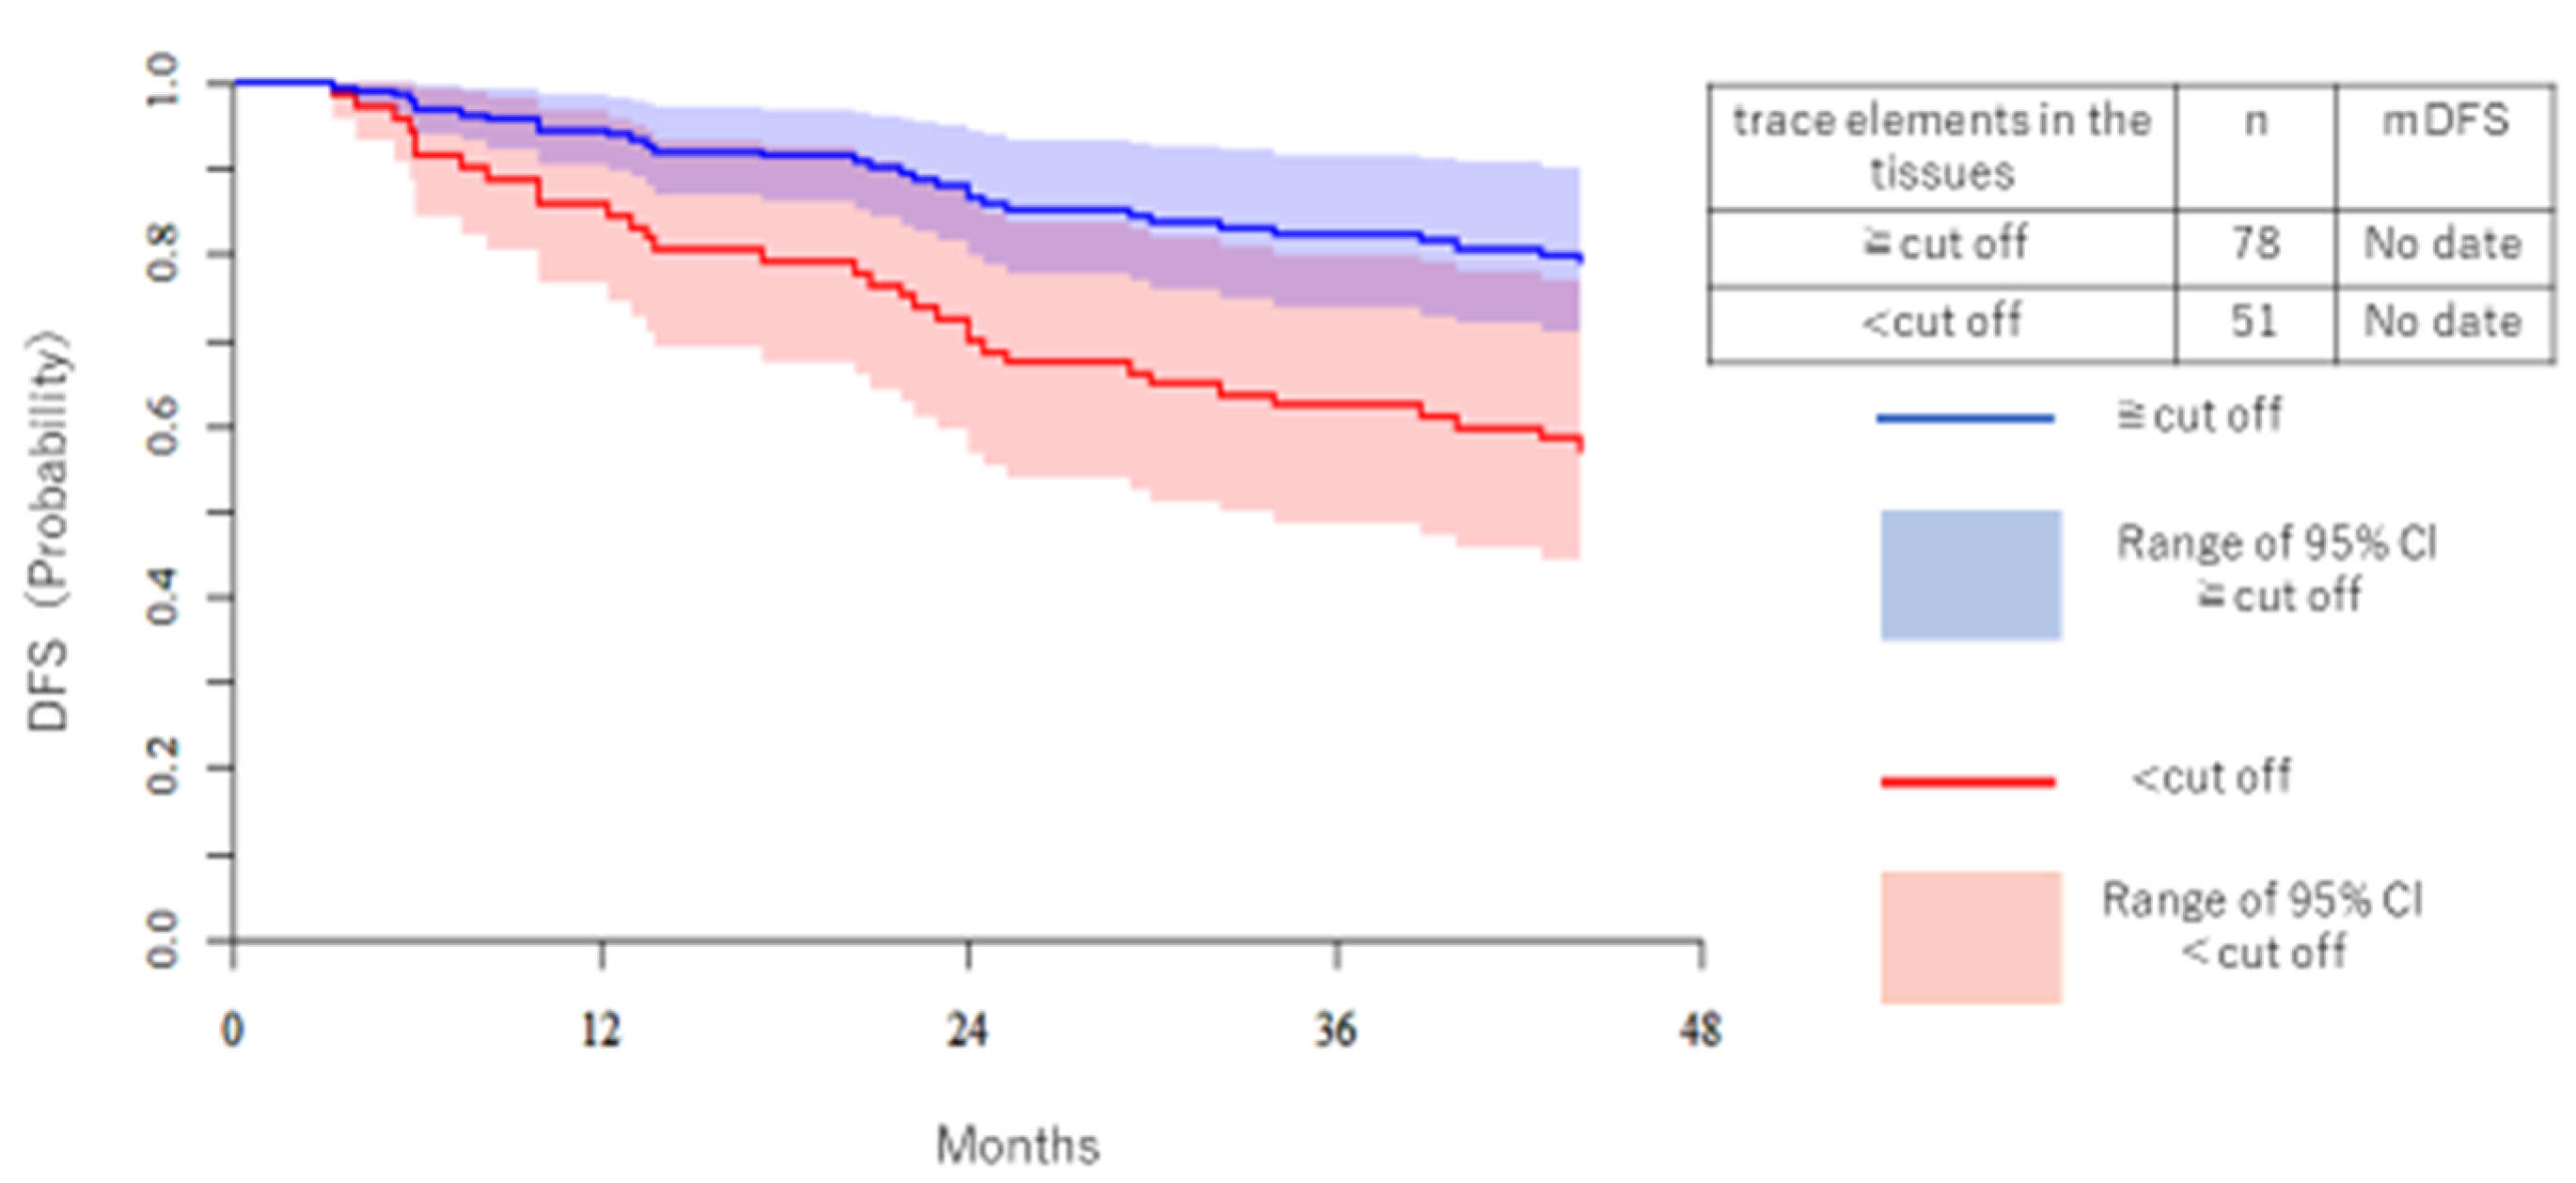
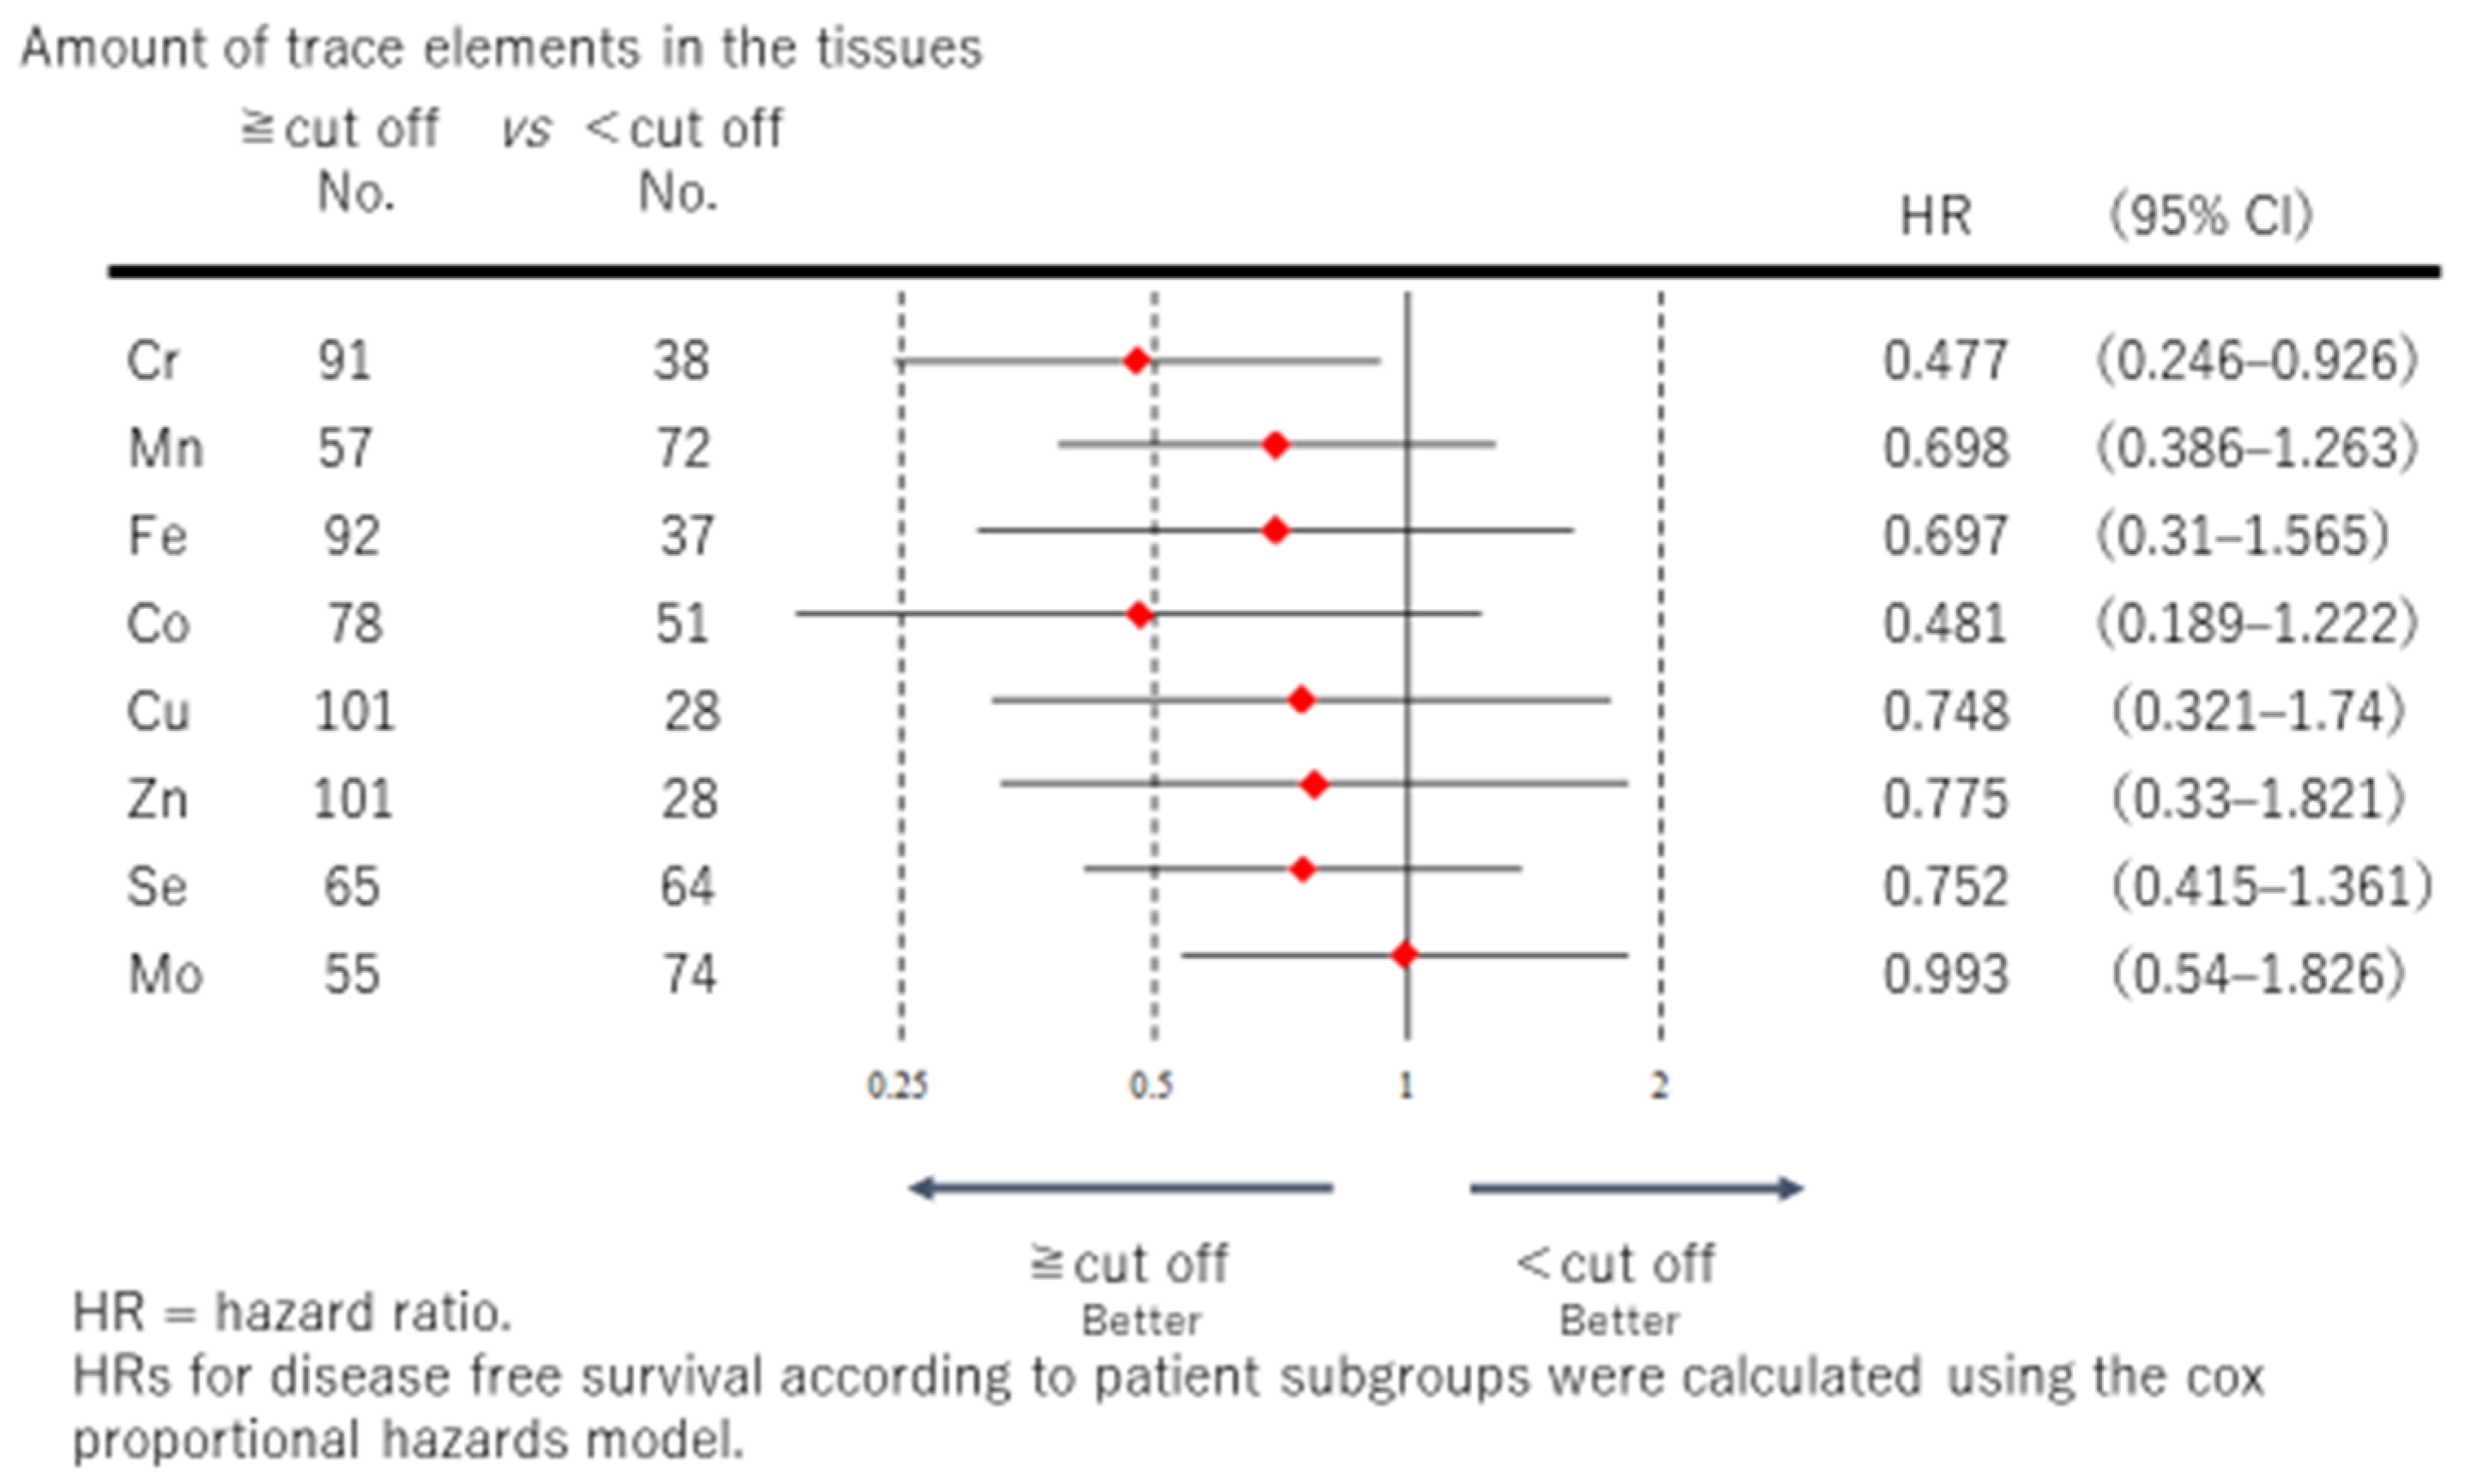
3.3. Disease-Free Survival (DFS)
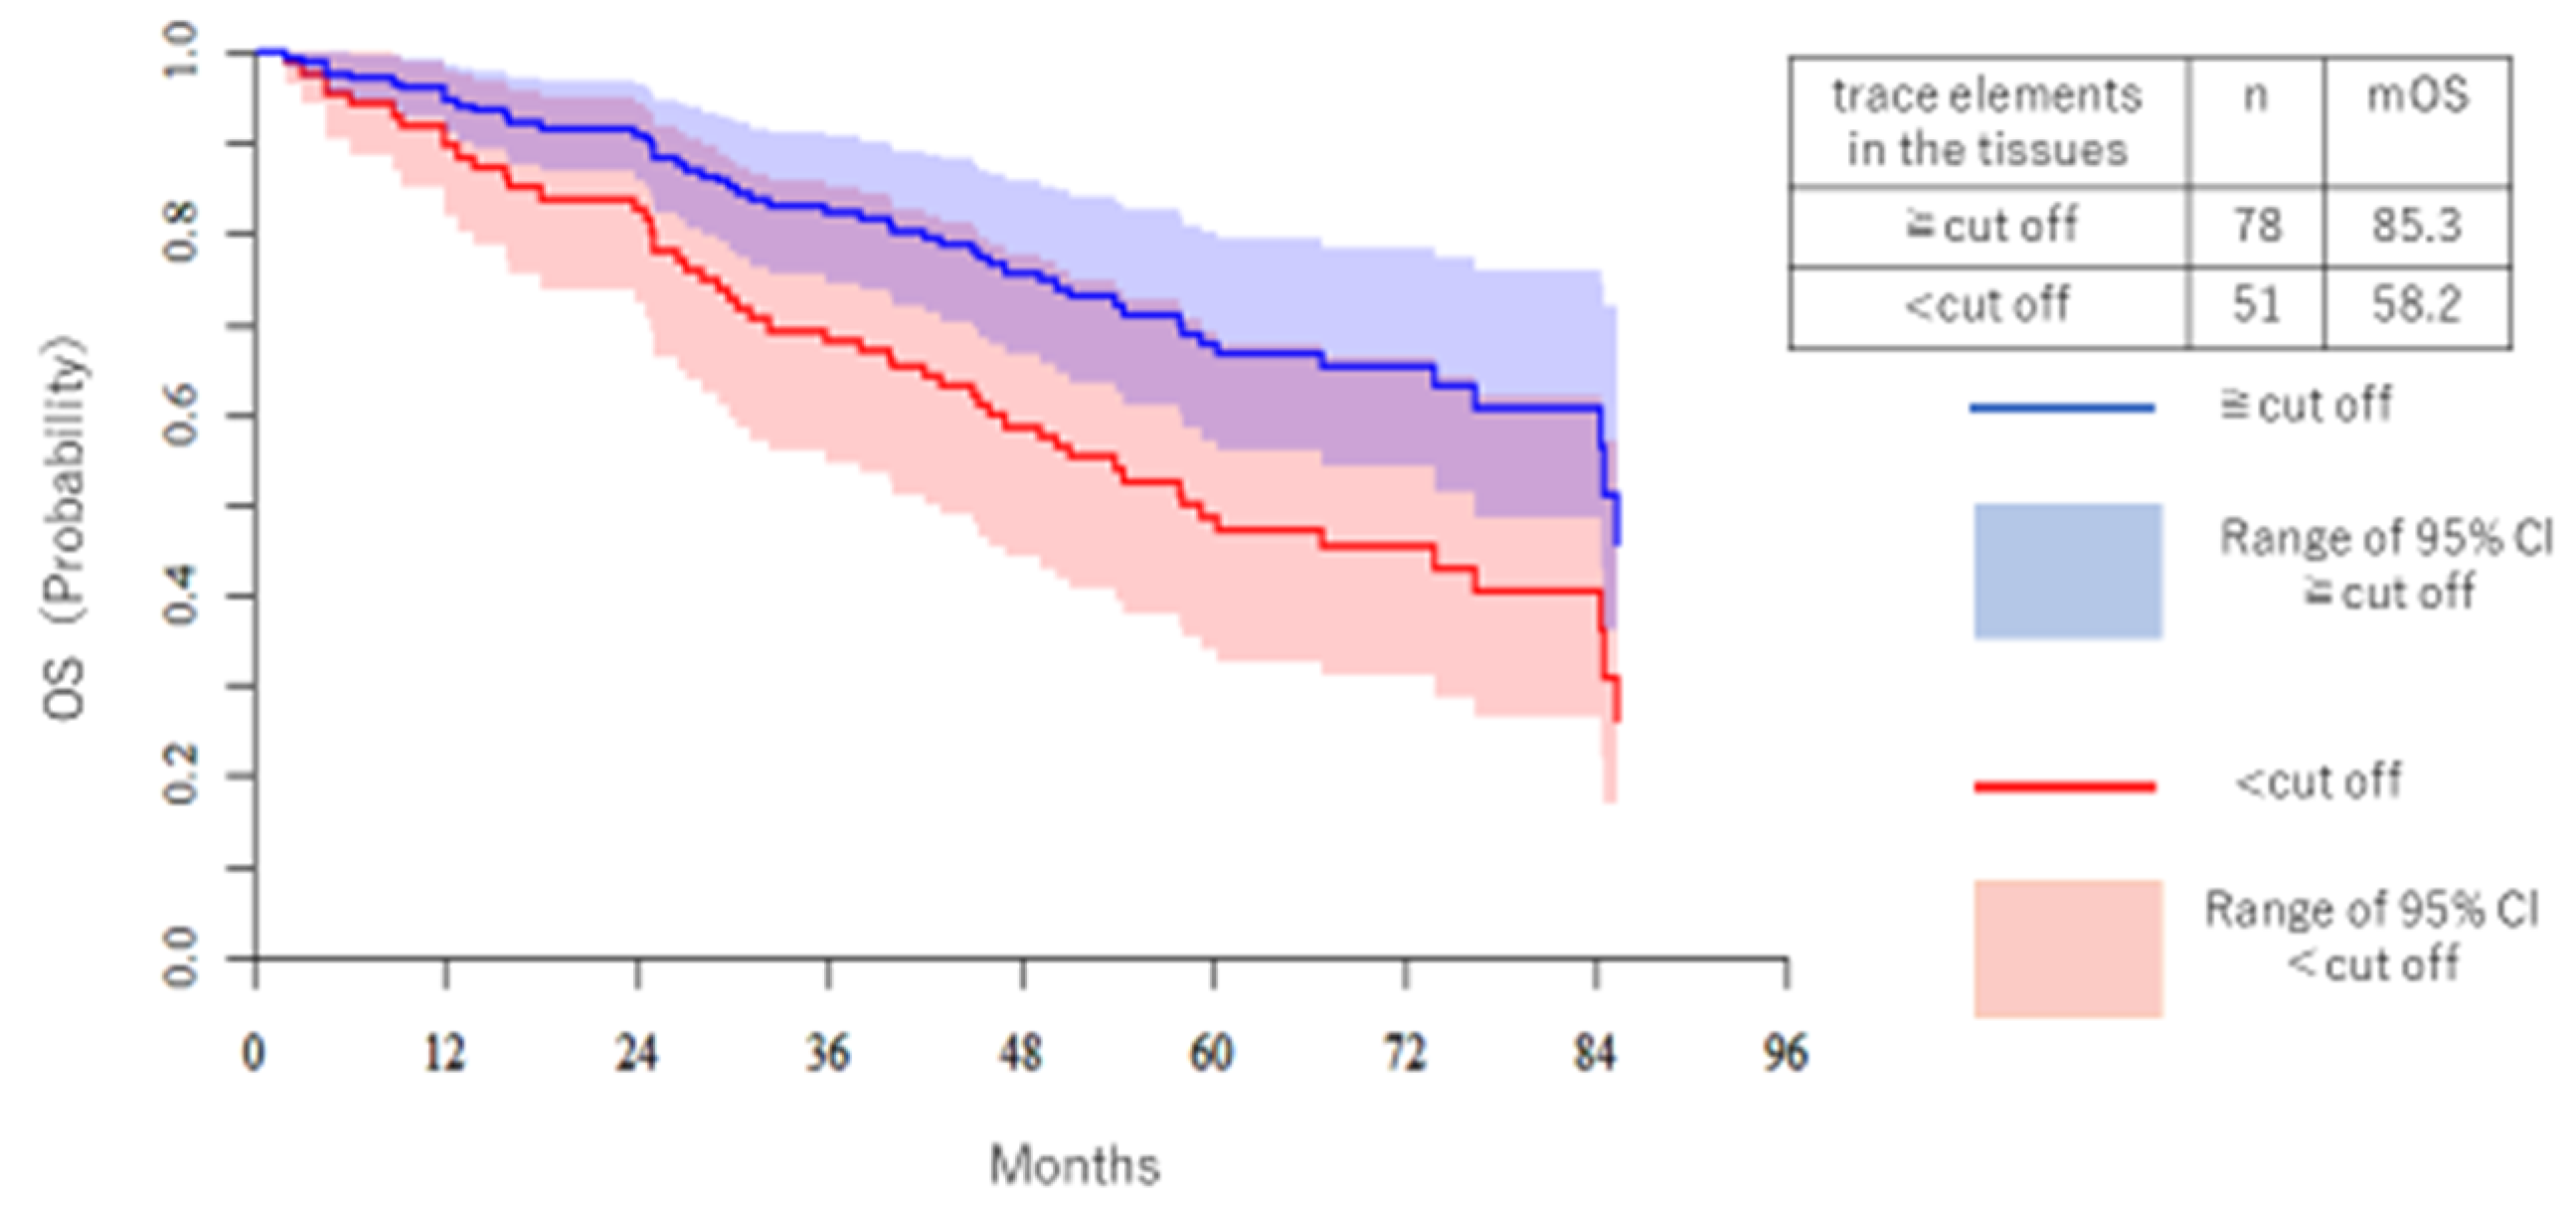
3.4. Overall Survival (OS)
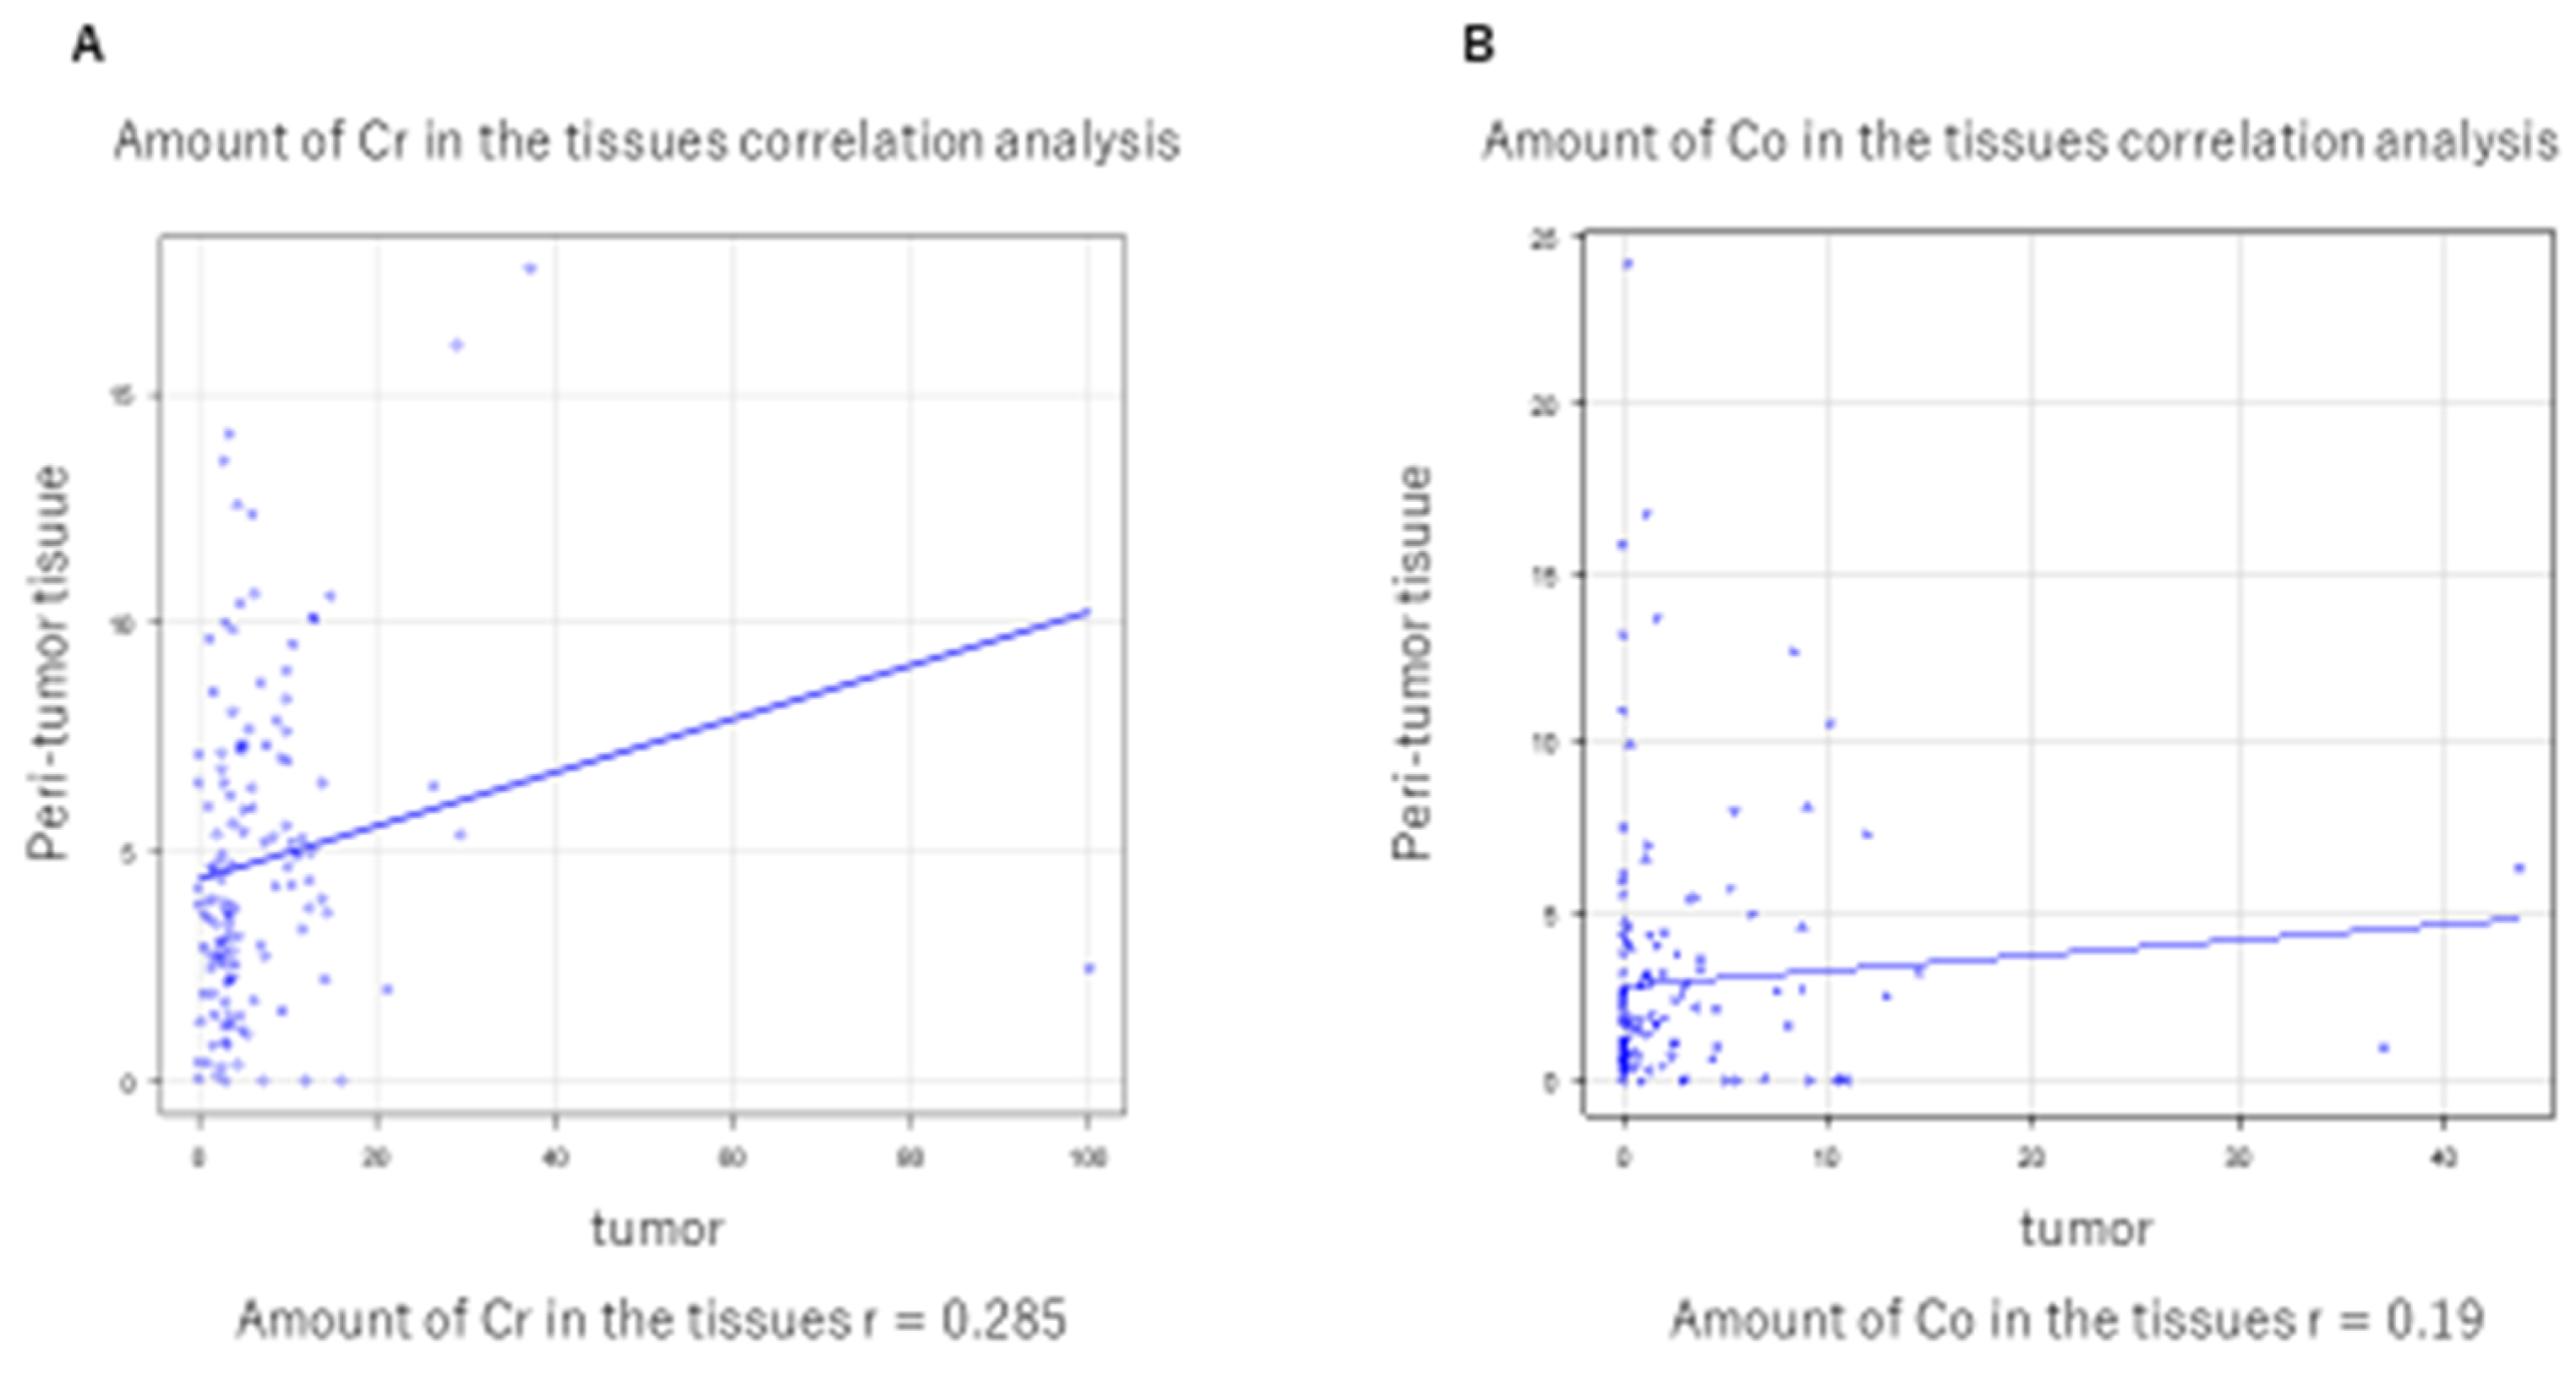
3.5. Correlation between Tumor Tissue and Nontumor Tissue
4. Discussion
5. Conclusions
Author Contributions
Funding
Institutional Review Board Statement
Informed Consent Statement
Conflicts of Interest
References
- Torre, L.A.; Bray, F.; Siegel, R.L.; Ferlay, J.; Lortet-Tieulent, J.; Jemal, A. Global cancer statistics, 2012. CA Cancer J. Clin. 2015, 65, 87–108. [Google Scholar] [CrossRef] [PubMed] [Green Version]
- Cetin, K.; Ettinger, D.S.; Hei, Y.J.; DO’Malley, C. Survival by histologic subtype in stage IV non-small cell lung cancer based on data from the surveillance, epidemiology and end results program. Clin. Epidemiol. 2011, 3, 139–148. [Google Scholar] [CrossRef] [PubMed] [Green Version]
- Chiba, R.; Morikawa, N.; Sera, K.; Ishida, K.; Nagashima, H.; Shigeeda, W.; Deguchi, H.; Tomoyasu, M.; Hosokawa, T.; Saito, H.; et al. Elemental and mutational analysis of lung tissue in lung adenocarcinoma patients. Transl. Lung Cancer Res. 2019, 8 (Suppl. 3), S224–S234. [Google Scholar] [CrossRef] [PubMed]
- Shimizu, Y.; Dobashi, K. Proton ion-microbeam elemental analysis for inhaled particle-induced pulmonary diseases: Application for diagnosis and assessment of progression. Curr. Med. Chem. 2013, 20, 789–793. [Google Scholar] [PubMed]
- Terakawa, A.; Ishii, K.; Matsuyama, S.; Kikuchi, Y.; Kawamura, T.; Takahashi, Y.; Miura, Y.; Karahashi, M.; Kusano, K.; Yamazaki, H.; et al. Concentration of cisplatin-incorporated polymeric micelles in a murine solid tumor evaluated using PIXE analysis. Int. J. PIXE 2014, 24, 41–47. [Google Scholar] [CrossRef] [Green Version]
- Terakawa, A.; Ishii, K.; Matsuyama, S.; Kikuchi, Y.; Kusano, K.; Karahashi, M.; Nozawa, Y.; Yamauchi, S.; Kikuchi, K.; Furumoto, S.; et al. Effects of a vascular disrupting agent for cancer treatment on normal tissue evaluated by PIXE analysis using quantum dots. Int. J. PIXE 2014, 24, 59–65. [Google Scholar] [CrossRef]
- Yoshida, K.; Yatabe, Y.; Park, J.Y.; Shimizu, J.; Horio, Y.; Matsuo, K.; Kosaka, T.; Mitsudomi, T.; Hida, T. Prospective validation for prediction of gefitinib sensitivity by epidermal growth factor receptor gene mutation in patients with non-small cell lung cancer. J. Thorac. Oncol. 2007, 2, 22–28. [Google Scholar] [CrossRef]
- Sera, K.; Yanagisawa, T.; Tsunoda, H.; Futatsugawa, S.; Hatakeyama, S.; Saitoh, Y.; Suzuki, S.; Orihara, H. Bio-PIXE at the Takizawa facility (Bio-PIXE with a baby cyclotron). Int. J. PIXE 1992, 2, 325–330. [Google Scholar] [CrossRef]
- Makuch, R.W. Adjusted survival curve estimation using covariates. J. Chronic Dis. 1982, 35, 437–443. [Google Scholar] [CrossRef]
- Gibb, H.J.; Lees, P.S.; Wang, J.; Grace O’Leary, K. Extended followup of a cohort of chromium production workers. Am. J. Ind. Med. 2015, 58, 905–913. [Google Scholar] [CrossRef] [PubMed]
- Petrilli, F.L.; Rossi, G.A.; Camoirano, A.; Romano, M.; Serra, D.; Bennicelli, C.; De Flora, A.; De Flora, S. Metabolic reduction of chromium by alveolar macrophages and its relationships to cigarette smoke. J. Clin. Investig. 1986, 77, 1917–1924. [Google Scholar] [CrossRef] [PubMed] [Green Version]
- Suzuki, Y.; Fukuda, K. Reduction of hexavalent chromium by ascorbic acid and glutathione with special reference to the rat lung. Arch. Toxicol. 1990, 64, 169–176. [Google Scholar] [CrossRef] [PubMed]
- Yamane, Y. Role of Micro Elements in Biological Systems. Jpn. J. Health Phys. 1990, 25, 269–277. [Google Scholar] [CrossRef]
- Yamane, Y. Trace metal metabolism, Japan. 1978, 6, 1–6.
- Sarafanov, A.G.; Todorov, T.I.; Kajdacsy-Balla, A.; Gray, M.A.; Macias, V.; Centeno, J.A. Analysis of iron, zinc, selenium and cadmium in paraffin-embedded prostate tissue specimens using inductively coupled plasma mass-spectrometry. J. Trace Elem. In Med. Biol. 2008, 22, 305–314. [Google Scholar] [CrossRef] [PubMed]
- Gellein, K.; Flaten, T.P.; Erikson, K.M.; Aschner, M.; Syversen, T. Leaching of Trace Elements from Biological Tissue by Formalin Fixation. Biol. Trace Elem. Res. 2008, 121, 221–225. [Google Scholar] [CrossRef] [PubMed]


| Cr (High) | Cr (Low) | Mn (High) | Mn (Low) | Fe (High) | Fe (Low) | Co (High) | Co (Low) | |
|---|---|---|---|---|---|---|---|---|
| N = 129 | 91 | 38 | 57 | 72 | 92 | 37 | 79 | 50 |
| Age | ||||||||
| 75≤ | 33 (36%) | 10 (26%) | 19 (33%) | 24 (33%) | 31 (34%) | 12 (32%) | 23 (29%) | 20 (40%) |
| <75 | 58 (64%) | 28 (74%) | 38 (67%) | 48 (67%) | 61 (66%) | 25 (68%) | 56 (71%) | 30 (60%) |
| Sex | ||||||||
| Male | 59 (64%) | 19 (50%) | 43 (75%) | 35 (49%) | 58 (63%) | 20 (54%) | 52 (66%) | 26 (52%) |
| Female | 32 (36%) | 19 (50%) | 14 (35%) | 37 (51%) | 44 (37%) | 17 (46%) | 27 (34%) | 24 (48%) |
| Smoking status | ||||||||
| Current or former | 54 (59%) | 14 (37%) | 36 (63%) | 32 (44%) | 53 (58%) | 15 (41%) | 51 (65%) | 17 (34%) |
| Never | 37 (41%) | 24 (64%) | 21 (37%) | 40 (56%) | 39 (42%) | 22 (59%) | 28 (35%) | 33 (66%) |
| Staging | ||||||||
| II≤ | 24 (26%) | 11 (29%) | 12 (21%) | 23 (32%) | 21 (23%) | 14 (38%) | 20 (25%) | 15 (30%) |
| I | 67 (74%) | 27 (71%) | 45 (79%) | 49 (68%) | 71 (77%) | 23 (62%) | 59 (75%) | 35 (70%) |
| Histologic features | ||||||||
| Adeno | 83 (91%) | 27 (71%) | 51 (89%) | 59 (82%) | 89 (97%) | 11 (30%) | 76 (96%) | 34 (68%) |
| Squamous | 8 (9%) | 11 (29%) | 6 (11%) | 13 (18%) | 3 (3%) | 16 (70%) | 3 (4%) | 16 (32%) |
| EGFR mutation | ||||||||
| (+) | 7 (8%) | 13 (34%) | 7 (12%) | 13 (18%) | 14 (15%) | 6 (16%) | 5 (6%) | 15 (30%) |
| (−) | 84 (92%) | 25 (66%) | 50 (88%) | 59 (82%) | 78 (85%) | 31 (84%) | 74 (94%) | 35 (70%) |
| Cu (High) | Cu (Low) | Zn (High) | Zn (Low) | Se (High) | Se (Low) | Mo (High) | Mo (Low) | |
|---|---|---|---|---|---|---|---|---|
| N = 129 | 101 | 28 | 101 | 28 | 64 | 65 | 56 | 73 |
| Age | ||||||||
| 75≤ | 35 (35%) | 8 (32%) | 31 (31%) | 12 (43%) | 22 (34%) | 21 (32%) | 19 (34%) | 24 (33%) |
| <75 | 66 (65%) | 20 (68%) | 70 (69%) | 16 (57%) | 42 (66%) | 44 (68%) | 37 (66%) | 49 (67%) |
| Sex | ||||||||
| Male | 61 (60%) | 17 (61%) | 59 (58%) | 19 (68%) | 43 (67%) | 35 (54%) | 33 (59%) | 45 (62%) |
| Female | 40 (40%) | 11 (39%) | 42 (42%) | 9 (32%) | 21 (33%) | 30 (46%) | 23 (41%) | 28 (38%) |
| Smoking status | ||||||||
| Current or former | 52 (51%) | 16 (57%) | 52 (51%) | 16 (57%) | 37 (58%) | 31 (48%) | 33 (59%) | 35 (48%) |
| Never | 49 (49%) | 12 (43%) | 49 (49%) | 12 (43%) | 27 (42%) | 34 (52%) | 23 (41%) | 38 (52%) |
| Staging | ||||||||
| II≤ | 28 (28%) | 7 (25%) | 26 (26%) | 9 (32%) | 14 (22%) | 21 (32%) | 13 (23%) | 22 (30%) |
| I | 73 (72%) | 21 (75%) | 75 (74%) | 19 (68%) | 50 (78%) | 44 (68%) | 43 (77%) | 51 (70%) |
| Histologic features | ||||||||
| Adeno | 97 (96%) | 13 (46%) | 99 (98%) | 11 (39%) | 59 (92%) | 51 (78%) | 46 (82%) | 64 (88%) |
| Squamous | 4 (4%) | 15 (54%) | 2 (2%) | 17 (61%) | 5 (8%) | 14 (22%) | 10 (8%) | 9 (12%) |
| EGFR mutation | ||||||||
| (+) | 19 (19%) | 1 (4%) | 14 (14%) | 6 (21%) | 6 (9%) | 14 (22%) | 5 (9%) | 15 (21%) |
| (−) | 82 (81%) | 27 (96%) | 87 (86%) | 22 (79%) | 58 (91%) | 51 (78%) | 51 (91%) | 58 (79%) |
Publisher’s Note: MDPI stays neutral with regard to jurisdictional claims in published maps and institutional affiliations. |
© 2021 by the authors. Licensee MDPI, Basel, Switzerland. This article is an open access article distributed under the terms and conditions of the Creative Commons Attribution (CC BY) license (http://creativecommons.org/licenses/by/4.0/).
Share and Cite
Saikawa, H.; Nagashima, H.; Cho, K.; Chiba, R.; Sera, K.; Shigeeda, W.; Tomoyasu, M.; Deguchi, H.; Takahashi, F.; Saito, H.; et al. Relationship between Trace Element in Tumor and Prognosis in Lung Cancer Patients. Medicina 2021, 57, 209. https://doi.org/10.3390/medicina57030209
Saikawa H, Nagashima H, Cho K, Chiba R, Sera K, Shigeeda W, Tomoyasu M, Deguchi H, Takahashi F, Saito H, et al. Relationship between Trace Element in Tumor and Prognosis in Lung Cancer Patients. Medicina. 2021; 57(3):209. https://doi.org/10.3390/medicina57030209
Chicago/Turabian StyleSaikawa, Hirotaka, Hiromi Nagashima, Katsuya Cho, Ryosuke Chiba, Koichiro Sera, Wataru Shigeeda, Makoto Tomoyasu, Hiroyuki Deguchi, Fumiaki Takahashi, Hajime Saito, and et al. 2021. "Relationship between Trace Element in Tumor and Prognosis in Lung Cancer Patients" Medicina 57, no. 3: 209. https://doi.org/10.3390/medicina57030209