Article

Advanced Analysis of Electrodermal Activity Measures to Detect the Onset of ON State in Parkinson’s Disease

by
Mercedes Barrachina-Fernández
1,2,
Laura Valenzuela-López
2,3,
Marcos Moreno-Verdú
2,3,
Francisco José Sánchez-Cuesta
2,3,
Yeray González-Zamorano
2,4,5,
Juan Pablo Romero
2,5,6,*,† and
Carmen Sánchez-Ávila
7,†
1
Programa en Ingeniería Biomédica, ETSI Telecomunicación, Polytechnic University of Madrid (UPM), Avenida Complutense, 30, 28040 Madrid, Spain
2
Brain Injury and Movement Disorders Neurorehabilitation Group (GINDAT), Institute of Life Sciences, Francisco de Vitoria University, 28223 Pozuelo de Alarcón, Spain
3
Facultad de Ciencias Experimentales, Universidad Francisco de Vitoria, 28223 Pozuelo de Alarcón, Spain
4
International Doctorate School, Department of Physical Therapy, Occupational Therapy, Rehabilitation and Physical Medicine, Universidad Rey Juan Carlos, 28933 Alcorcón, Spain
5
Cognitive Neuroscience, Pain, and Rehabilitation Research Group (NECODOR), Faculty of Health Sciences, Rey Juan Carlos University, 28032 Madrid, Spain
6
Brain Damage Unit, Hospital Beata María Ana, 28007 Madrid, Spain
7
Department Applied Mathematics, ETSI Telecomunicación, Polytechnic University of Madrid (UPM), 28040 Madrid, Spain
*
Author to whom correspondence should be addressed.
These authors contributed equally to this work.
Mathematics 2023, 11(23), 4822; https://doi.org/10.3390/math11234822
Submission received: 26 October 2023 / Revised: 20 November 2023 / Accepted: 21 November 2023 / Published: 29 November 2023

Abstract

:
Background: Electrodermal activity (EDA) serves as a prominent biosignal for assessing sympathetic activation across various scenarios. Prior research has suggested a connection between EDA and fluctuations in Parkinson’s disease (PD), but its precise utility in reliably detecting these fluctuations has remained unexplored. This study aims to evaluate the efficacy of both basic and advanced analyses of EDA changes in identifying the transition to the ON state following dopaminergic medication administration in individuals with PD. Methods: In this observational study, 19 individuals with PD were enrolled. EDA was continuously recorded using the Empatica E4 device, worn on the wrist, during the transition from the OFF state to the ON state following levodopa intake. The raw EDA signal underwent preprocessing and evaluation through three distinct approaches. A logistic regression model was constructed to assess the significance of variables predicting the ON/OFF state, and support vector machine (SVM) models along with various Neural Network (NN) configurations were developed for accurate state prediction. Results: Differences were identified between the ON and OFF states in both the time and frequency domains, as well as through the utilization of convex optimization techniques. SVM and NN models demonstrated highly promising results in effectively distinguishing between the OFF and ON states. Conclusions: Evaluating sympathetic activation changes via EDA measures holds substantial promise for detecting non-motor fluctuations in PD. The SVM algorithm, in particular, yields precise outcomes for predicting these non-motor fluctuation states.

1. Introduction

Parkinson’s disease (PD) is a progressive neurological disorder affecting more than 10 million people worldwide [1] and is the second most common neurodegenerative disease. PD symptoms appear gradually and worsen as disease progresses. Different motor and non-motor symptoms constitute the clinical hallmarks of PD, including bradykinesia, rigidity, tremor, or postural instability as cardinal motor symptoms, and cognitive/behavioral disorders, sleep disturbances, or autonomic alterations as frequent non-motor manifestations. Autonomous nervous system dysfunction symptoms are highly prevalent in PD, being present in up to 80% of cases [2], and might affect multiple physiological spheres (e.g., gastrointestinal, cardiovascular, urogenital, or thermoregulatory). Autonomic dysfunction imposes a significant burden on people with PD, deeply limiting their health-related quality-of-life [3].
Autonomous nervous system (dys)function can be assessed by capturing different physiological signals. Skin conductance measures have been traditionally used to evaluate the level of activation of the sympathetic division. To that end, the most used biosignal is electrodermal activity (EDA), which measures the electrical properties of the individual’s skin. Typically, it is recorded as a conductance or a potential signal through placing electrodes in contact with the skin [4], although recent developments now allow it to be acquired through different sensors. The amplitude of this measurement is strongly related to the autonomous nervous system activity. In the literature, the most expanded uses of this signal are studies linking EDA measurements to anxiety [5] or stress [6]. While there are not many studies that make use of these signals in the context of Parkinson’s disease, our recent literature review found that when they are utilized in this disease, they frequently employ a variety of methods without established normative values specific to Parkinson’s disease.
Dopaminergic replacement therapy represents the standard symptomatic treatment for PD. The ON state is the denomination used to designate when the medication is working and symptoms are controlled, while the OFF state defines the time when the medication effect is over or is not working. Fluctuations among ON/OFF states are common as the disease progresses; these fluctuations significantly affect quality-of-life of people with PD [7]. Its assessment, often in terms of onset, frequency, and severity, is crucial to perform treatment adjustments and, up to now, is usually conducted by relying on self-reported diaries filled in by patients.
The instrumental detection of fluctuations has been proved effective using accelerometers but it is limited to detecting changes in motor symptoms exclusively [8,
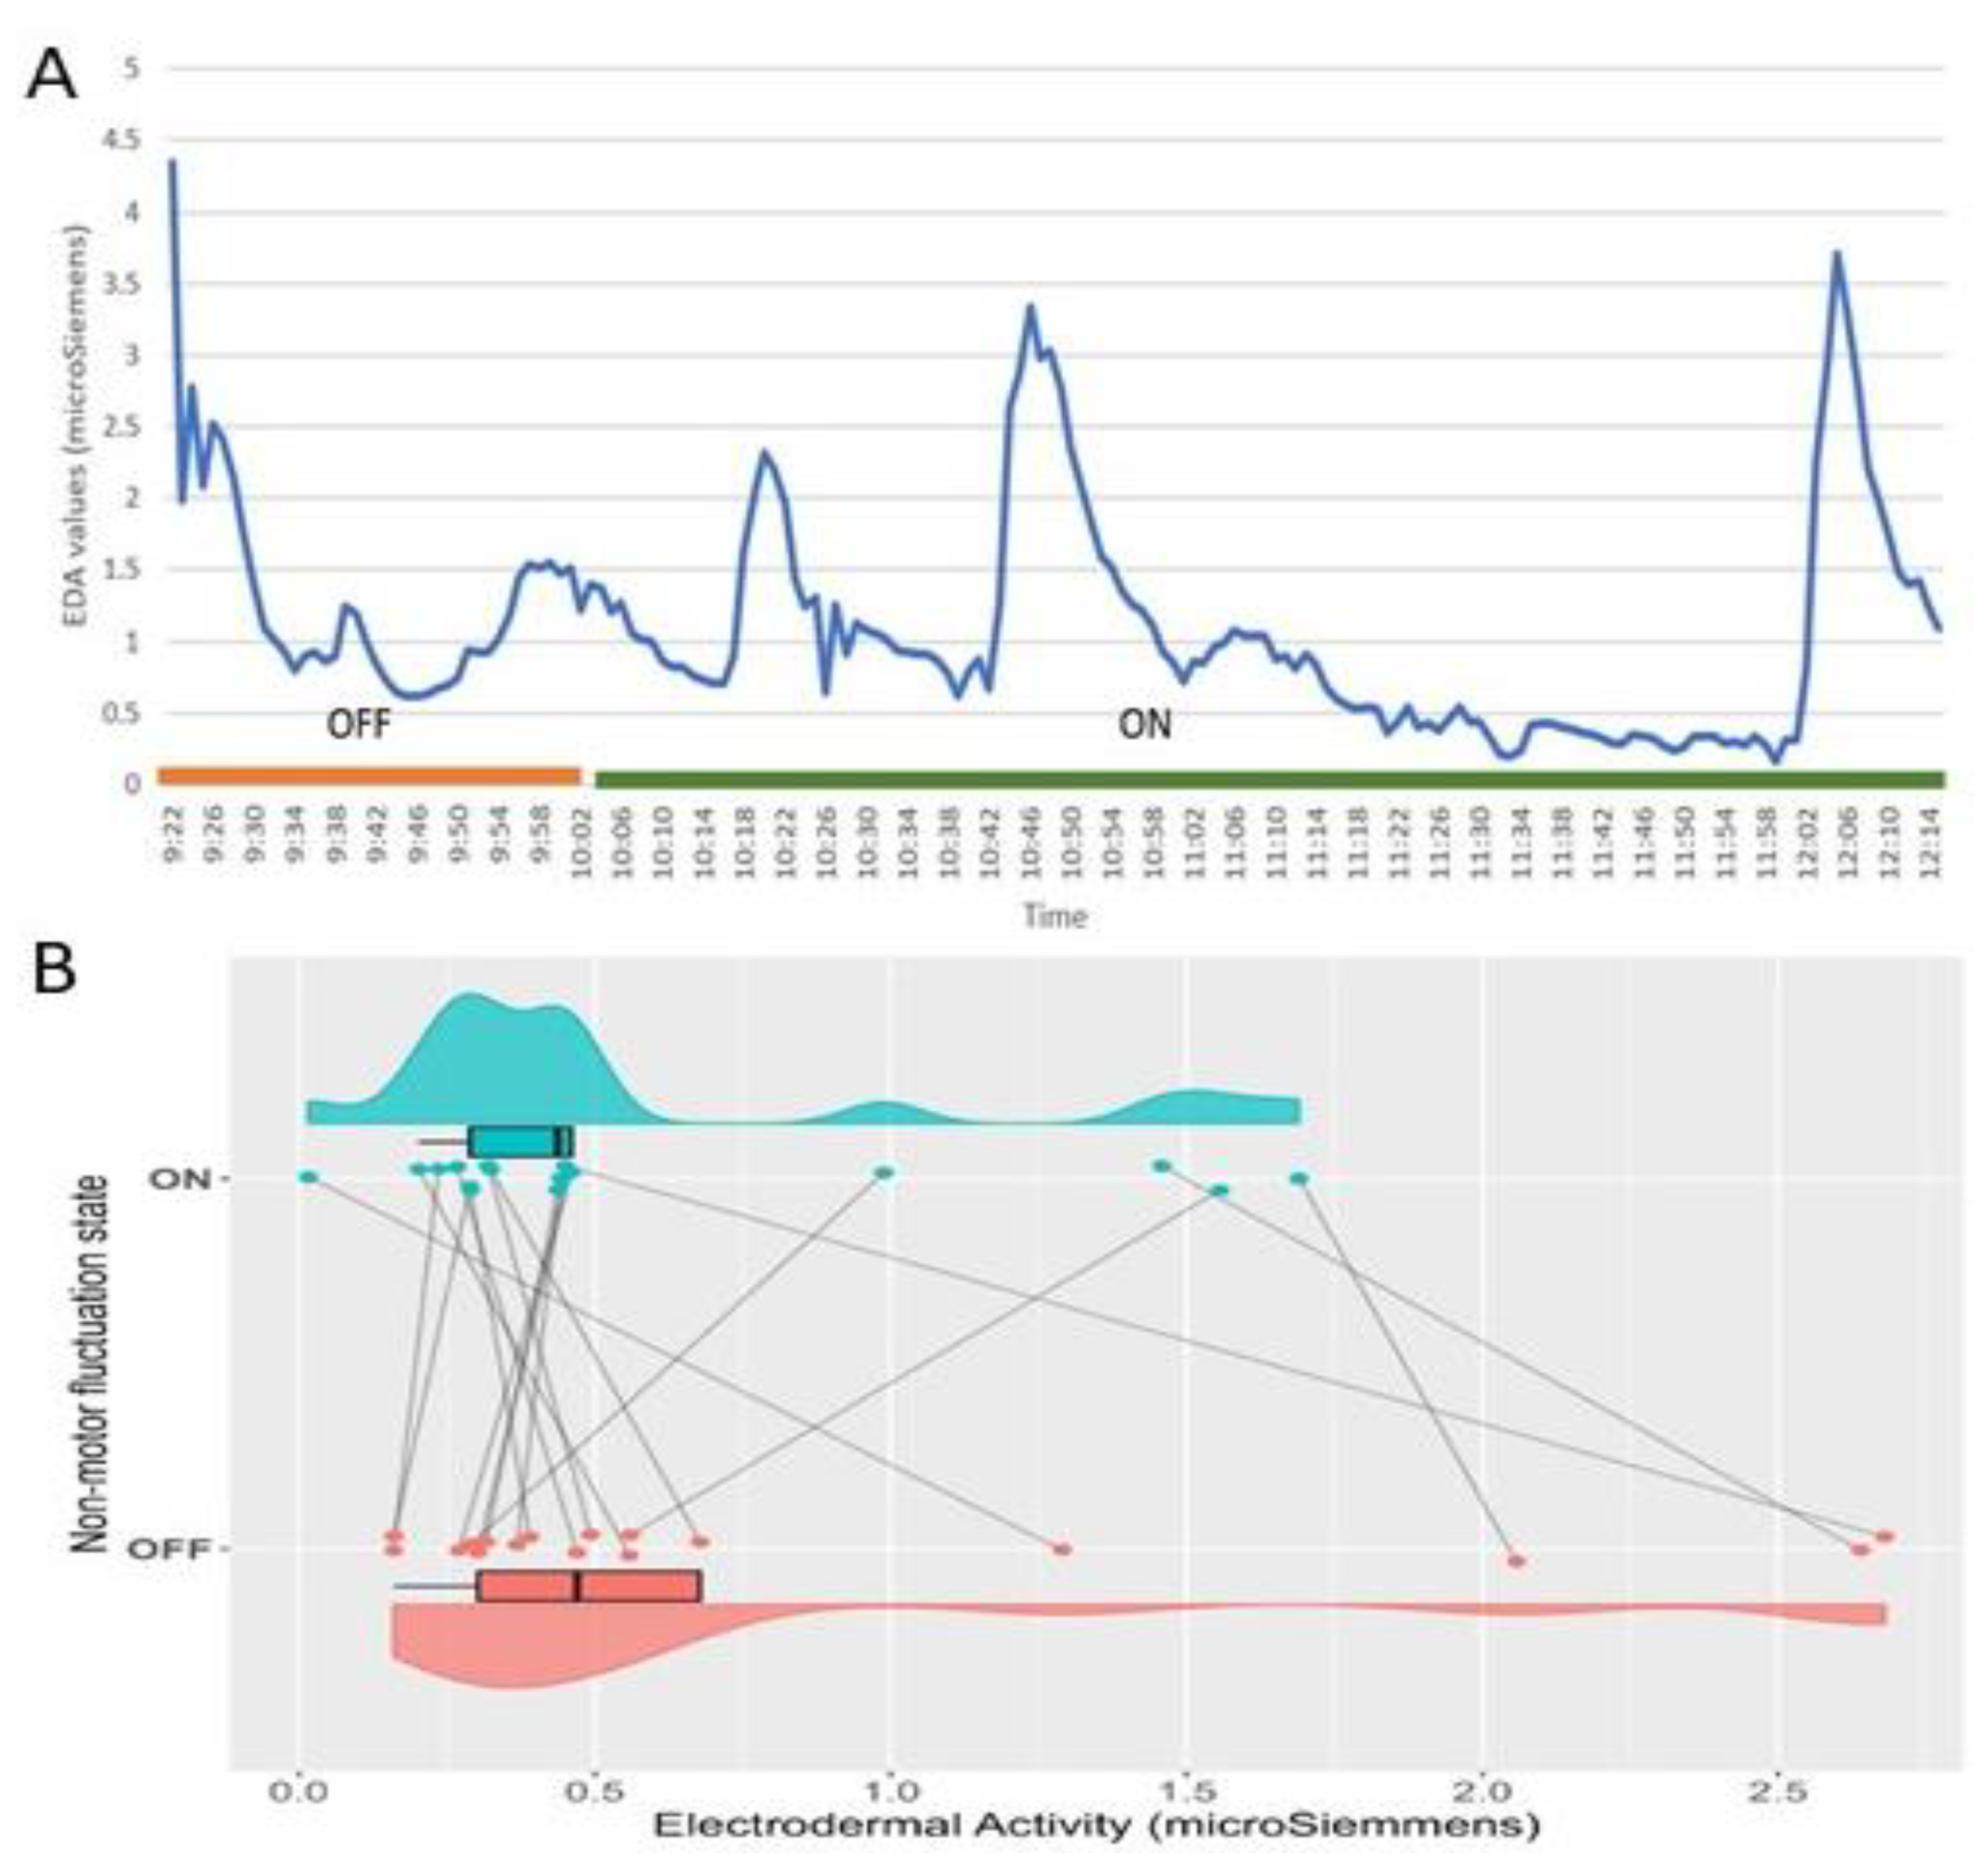
9]; the study of non-motor fluctuations remains notably unexplored. Previous evidence identified differences between the level of sweating (measured as the amplitude of the EDA) in PD patients in ON and OFF states, showing higher levels of EDA in the OFF state [10]. Moreover, previous studies suggest there might be a relationship between EDA measures and motor fluctuations in PD [11], but its usefulness to accurately detect their non-motor counterparts remains largely unexamined.
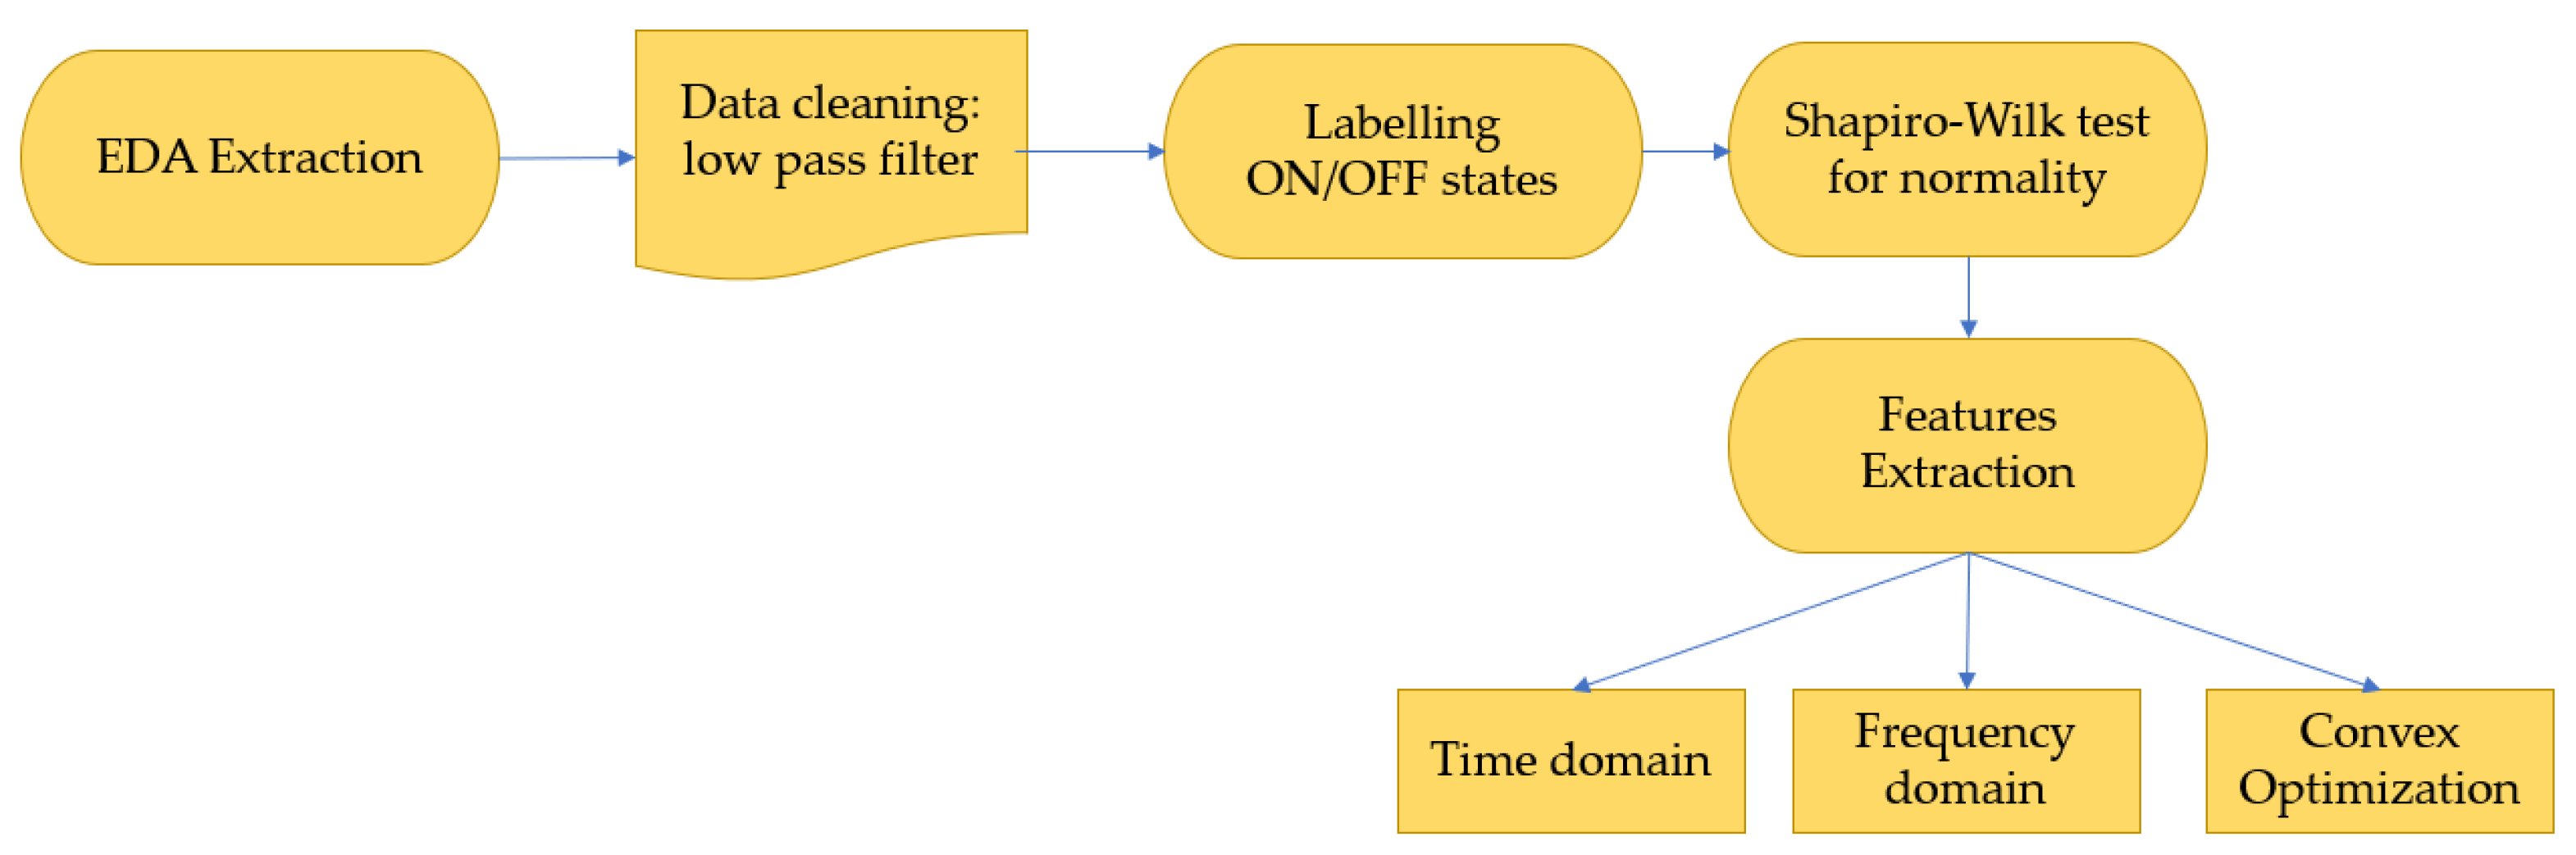
Different methods have been employed to analyze the EDA signal, with the most common approaches occurring in the time and frequency domains. Time domain analyses offer a wealth of information; however, pinpointing specific points, such as the onset of ON/OFF states or peaks, can be challenging due to the presence of noise and other events. [4,12]. On the other hand, frequency domain analysis offers fewer details but is generally more robust, sensitive, and simpler to implement [6]. However, there remains a scarcity of studies utilizing this domain to evaluate the EDA signal in PD. Some studies have employed the tonic and phasic decomposition of the signal to obtain results [13], and a recent study introduced a new index for evaluating the EDA signal from a stress perspective [14].
To date, signals from wearable sensors recording autonomic nervous system (ANS) activity, electrodermal activity (EDA), heart rate (HR), blood volume pulse (BVP), and skin temperature (TEMP), have been used in combination to look for markers to detect wearing-off in people on L-dopa [15].
Machine learning applications, a subset of artificial intelligence, have shown promise in addressing various challenges in medical diagnosis and treatment. In PD, these techniques have been used to analyze spatiotemporal features from different sensors related to motor features detection (e.g., accelerometers or gyroscopes) to identify the patient’s status [15] by employing methods like Support Vector Machines (SVM), artificial neural networks (ANN), or convolutional neural networks (CNN). There is remarkably scarce evidence regarding the use of these techniques to perform advanced analysis of nervous system (ANS) activity biosignals like EDA.
The objective of this study was to assess the capability of simple and advanced EDA analyses, along with a machine learning algorithm, to detect non-motor fluctuations in individuals with PD.

2. Materials and Methods

2.1. Study Design

An observational study design was conducted for recording EDA signals pre-post administration of levodopa, following the Strengthening the Reporting of Observational studies in Epidemiology (STROBE) standards [16]. All the methods were in accordance with the 1964 Declaration of Helsinki and ethical approval was obtained by an independent ethics committee for clinical research (Num 22/496). All patients gave written informed consent prior to enrollment.

2.2. Participants

2.2.1. Eligibility Criteria

Inclusion criteria were: (1) age >18 years, (2) clinical diagnosis of idiopathic PD according to the UK Brain Bank Criteria [17], (3) stabilized dosing of dopaminergic medication with at least one morning dosing of levodopa. Exclusion criteria were: (1) presence of cognitive impairment (MMSE < 24 points) [18], (2) diagnosis of other neurological diseases, (3) Intolerance to the off state, (4) motor impairments that prevents one from remaining seated for two hours, (5) previous diagnosis of autonomic impairment.

2.2.2. Characteristics

Twenty-three PD patients were initially enrolled, although data from four patients were not analyzed due to presence of events that altered the EDA recordings, such as fever (n = 1), high level of sweating during data collection (n = 1), missed data because of technical problems with the EDA sensor (n = 1), or extreme values of the EDA signal (n = 1). A group of 19 PD patients was finally analyzed. Their characteristics are shown in Table 1.

2.3. Acquisition of Electrodermal Activity

EDA signal was collected using the E4-Empatica device (Empatica Inc., Boston, MA, USA). The E4 device is a wristband, weighting 25 g, with a band of polyurethane, a battery of around 24 h, Bluetooth for the data transfer, and a flash memory up to 60 h of data storage [19]. It is composed of different sensors, including a PPG sensor to measure heart rate, a 3-axis accelerometer, and an infrared thermopile to measure skin temperature, in addition to the galvanic skin response (GSR) sensor to measure EDA, although only the latter was used for the purpose of this study. The GSR sensor measures the fluctuations of the skin’s electrical properties with a sampling frequency of 4 Hz and expressed in microSiemens (µS).

2.4. Experimental Procedure

The study was conducted from February 2023 to May 2023. There are two different phases in the protocol, before and after the medication intake. The different activities of each phase are detailed in Figure 1.
During the recruitment phase, the concepts of ON and OFF states were explained to the patients, and all participants demonstrated a clear ability to identify these states and associate them to the action of medication. To ensure standardized assessments, all patients were initially evaluated in the OFF state, defined as having abstained from dopaminergic medication for more than 12 h based on their usual dosing schedule and confirmed with the patient as feeling in OFF state. These assessments were conducted in the early morning before the first morning dose of dopaminergic medication and fasting.
The first procedural step involved attaching the Empatica device to the patients’ wrists and synchronizing it with a mobile phone for data recording. Once the device was set up, the patients’ Unified Parkinson’s Disease Rating Scale (UPDRS) Part III scores were assessed.
Subsequently, the patients were instructed to take their morning dose of dopaminergic medication with a glass of water, and the exact time of intake was recorded. After a 30-min rest period to allow for proper absorption of the medication, a light breakfast was provided. The patients were then asked to note the exact time when they felt they had entered a full ON state. This time was also noted, and a second UPDRS Part III assessment was performed.
Throughout this process, the electrodermal activity (EDA) signal was continuously recorded. To ensure a controlled environment and avoid potential stress-induced variations in EDA baseline levels, the patients’ total time spent at the hospital was approximately 2 h, with less than 1 h spent in the OFF state and around 1 h in the ON state. Room temperature was controlled, and the patients remained comfortably seated throughout the study.

2.5. Data Analysis

The different steps to evaluate the signal are reflected in Figure 2. The software used to perform this analysis was MATLAB version: 9.13.0 (R2022b) [20] and different toolboxes were utilized, including the Signal Processing Toolbox, the Statistics and Machine Learning Toolbox, and the script available for the convex optimization problem [13].

2.5.1. Pre-Processing

The EDA signal was filtered using a 5th order low-pass normalized cut-off frequency of 0.025 Hz Butterworth filter to deal with noise and motion artefacts [21]. For each patient, we labelled the EDA signal with the different states (OFF state, before levodopa, and ON state, when the patient stated they entered in a full ON state after levodopa intake) having a total of 2.221 min of recording session (14.44 h in OFF state and 22.58 h in ON state).

2.5.2. Feature Extraction (Time, Frequency, and Convex Optimization)

For the time domain features, the overall signal in ON and OFF states was considered to calculate the following parameters: mean, standard deviation, maximum, minimum, and the first differentiate. Then we calculated the count of the Skin Conductance Response (SCR) peaks, defined by the “peaks” of the EDA recorded by the electronic device and the sum of the areas under those peaks for all the patients included in this study [22]. After studying the overall signal, we split the EDA signal into windows of 30 s, to evaluate the average of those windows in each state. A total of 4.407 windows were obtained and all calculations were reapplied to each window.
For the frequency domain analysis, the Fast Fourier Transformation was used to convert the EDA time series of the ON and OFF states for each patient into a discrete Fourier transformation to perform a spectral analysis. The main feature calculated in the frequency domain was the average power in ON/OFF state analyzed [23].
Then, a convex optimization approach was used. According to this method, the EDA was divided into a 3-component signal: a phasic component, a tonic component, and noise [13]. The phasic component is defined by the short-time response to a specific stimulus, the tonic component is defined by limited changes to the baseline level as long as fluctuations, and the noise is defined as white gaussian noise [13]. This analysis considered the following features for each tonic and phasic component: the average value over time and its standard deviation, and the area under the curve.

2.5.3. Statistics Analysis

The statistical analysis was implemented in a script in MATLAB version: 9.13.0 (R2022b) using the statistics and machine learning toolbox. For all analyses, alpha was set at 0.05 for statistical significance and 95% confidence intervals were obtained. Descriptive statistics were used to summarize the different features extracted from the EDA signal and all covariates in ON/OFF states separately. For hypothesis testing, we first used a basic approach whereby a paired samples T-test or Wilcoxon signed rank test, according to the Shapiro–Wilk normality test, were used to compare the differences in EDA features from ON to OFF. Then, the relationship between EDA features and ON/OFF states was assessed with a logistic regression to identify the relationship between the features and the dependent variable. To improve the power of the statistical tests, the EDA signal was split into windows of 30 s [24] and the different features in each approach were calculated for each specific window. In logistic regression, the dependent variable was the fluctuation state (fstate) with two levels (OFF/ON) and the independent variables were all the above-mentioned EDA features in the time, frequency, and convex analyses, as well as socio-demographic and clinical characteristics (age, sex, H&Y state, LEDD, UPDRS-III, and disease duration).

2.5.4. Sophisticated Classification

The different features extracted in the time and frequency domains and from convex decomposition were used to create a classifier that discriminated between both fluctuation states, ON and OFF. The data provided to the classifier were all the EDA features (time, frequency, and convex approaches) as well as socio-demographic and clinical characteristics (age, H&Y stage, time with disease, and UPDRS-III difference between ON/OFF). The classifier selected was an SVM algorithm as it provides very good results in the literature in applications related to EDA measurements [25]. Initially, a Bayesian classifier was also considered but discarded as the accuracy results obtained were lower than 55%. The main functionality of the SVM method is that uses a hyperplane to discriminate between two different classes, in this case, the classes ON and OFF. The kernel function in a SVM is a relevant factor to solve the classification problem as it transforms the data used as input into the required output. There are different kernel functions utilized (e.g., linear, radial, sigmoid, and polynomial kernel). The data were divided into train/test set considering the rule 70%/30%. The total dataset had 4.407 different elements. To complete the analysis, different configurations of neural networks (ANN and SNN) have been used with the purpose of improving the performance obtained with the SVM. The behavior of neural networks is inspired in the human brain functionality. The network is composed of layers and the minimum unit is a neuron that has an input and it produces an output. It receives numerical input features and produces numerical outputs. The Artificial Neural Networks (ANNs) are based on continuous-valued activations and perform computations using operations such as weighted sums and activation functions. ANNs typically do not inherently capture the temporal dynamics of data, as they process input data instantaneously. The Spiking Neural Networks (SNN) transmit the information using discrete binary events and are designed to mimic the behavior of biological neurons more closely. SNNs are well-suited for tasks involving time-dependent data, such as event-driven processing, temporal coding, and precise spike timing.

3. Results

3.1. Basic Analysis

3.1.1. Time Domain

The average and median amplitude, number of peaks, and area under those peaks in OFF and ON states for the overall EDA signal and after signal windowing are shown in Table 2.
For the overall signal (see Figure 3A), there were statistically significant differences between ON and OFF according to the number of peaks of the EDA (t = −5, p < 0.001) with a mean difference = 63 (95% CI: 40.15, 84.79) and a large effect size (Cohen’s d = 1.62). There were no statistically significant differences between ON and OFF according to the mean, median, or area under the peaks (all p > 0.05).
After signal windowing (see Figure 3B), there were statistically significant differences between ON and OFF according to the mean amplitude of the EDA (t = 4.12, p < 0.001) with a mean difference = 0.78 (95% CI: −0.62, −0.22) and a small effect size (Cohen’s d = 0.27). Also, a statistically significant difference between ON and OFF according to the median amplitude of the EDA was found (t = 4.095, p < 0.001) with a mean difference = 0.57 (95% CI: −0.62, −0.21) and a small effect size (Cohen’s d = 0.13). Considering the number of peaks, a statistically significant difference was also found between the ON and OFF (t = −6.67, p < 0.001) with a mean difference = −0.16, (95% CI: 0.1, 0.19) and a small effect size (Cohen’s d = 0.15). Finally, statistically significant differences were found for the area under the peaks of the ON and OFF (t = −3.23, p = 0.0012) with a mean difference = −0.32 (95% CI: −0.14, −0.03) and a small effect size (Cohen’s d = 0.11).

3.1.2. Frequency Domain

The average power for overall signal in the OFF and ON states was 11.00 ± 27.73 µS2/Hz and 6.24 ± 16.04 µS2/Hz, respectively, which was statistically significant between them (t = 1.8, p = 0.04), with a mean difference = 4.76 (95% CI: −10.31, 0.79) and a small effect size (Cohen’s d = 0.21).
After signal windowing, the average power in the OFF and ON states was 15.02 ± 36.16 µS2/Hz and 6.65 ± 22.83 µS2/Hz, respectively, which was statistically significant between them (t = 5.15, p < 0.001), with a mean difference = 8.37 (95% CI: −3.41, −7.61) and a small effect size (Cohen’s d = 0.27).

3.1.3. Convex Optimization Approach

The phasic and tonic component average values and the average area under the curve in the ON and OFF state for the overall signal and after signal windowing are shown in Table 3.
For the overall signal, neither the tonic or phasic components showed statistically significant differences between ON and OFF according to the mean amplitude or area under the peaks (all p > 0.05).
After signal windowing, there were statistically significant differences between ON and OFF according to the area under the peaks for the tonic component (t = −1.96, p = 0.04) with a mean difference = −0.21 (95% CI: 0.01, 5.26) and a small effect size (Cohen’s d = 0.15). There were no statistically significant differences between ON and OFF according to the mean amplitude for the tonic and phasic components or the area under the peaks for the phasic component (all p > 0.05).

3.2. Advanced Analysis

The values of the estimated coefficients, standard errors, and p-values of the logistic regression model are shown in Appendix A Table A1. The EDA features that showed a significant prediction ability to detect ON/OFF states were the amplitudes, the SCR peaks, the power (frequency domain), and the amplitude of the tonic component. The most relevant EDA features to distinguish between ON/OFF were the amplitude of the tonic component (log odds = 10.51) and the area under the curve of the phasic component (log odds = 8.297). Additionally, the age, the H&Y state, the disease duration, the LEDD (in the morning), the total daily LEDD, and the UPDRS III also showed a significant prediction ability, although neither of them showed log odds > 1. The performance of this model showed an accuracy, precision, recall, and F1 of 60.28%, 65.22, 72.48%, and 67.01%, respectively.

3.3. Sophisticated Classification

The answer to the classification problem was solved using a SVM model and different neural networks (NN) models. Those results are presented below.

3.3.1. SVM

The results of the different SVM classifiers used are shown in Table 4. The classifier with the greatest accuracy was the radial type, whereas the most specific was the linear kernel and the one with greatest sensitivity was the polynomial kernel.

3.3.2. Neural Network Models

The type of neural networks used in this work were artificial neural networks and spiking neural networks. The results provided by them are shown in Table 5.
Different configurations were tested trying to find the best performance. As presented in the results, the best classification provided by the neural networks in terms of accuracy is provided by the artificial neural network of two hidden layers, the best specificity performance is provided by the spiking neural network of one hidden layer, and finally, the best sensitivity is provided by the artificial neural network of one hidden layer. In general terms, the best global classifier performance is provided by the artificial neural network of two hidden layers.

3.4. Evaluation of the Intermediate State

Apart from solving the problem of the classification between the OFF and ON states using the electrodermal activity in PD patients, it is also interesting to evaluate what happens in the intermediate state, that is in the process of changing from OFF state to ON. This intermediate state has been measured as the time between the ingestion of the medication and the reported ON state from the patient. The average time in this intermediate state for the patients considered in the database was 1.329 s.
We have used the ANN configuration with two hidden layers, presented in the previous section, as it provided the best global performance. The already trained model has been used to extract the OFF or ON state of the patient to understand the changing process.
Figure 4 shows a sample of the transitioning process for a PD patient from OFF to ON state. The figure shows the state predicted by the ANN model considering windows of 30 s and it shows how the transition from OFF to ON state is not a sudden change but a slow and smooth change that combines characteristics of both, until its final stabilization.

4. Discussion

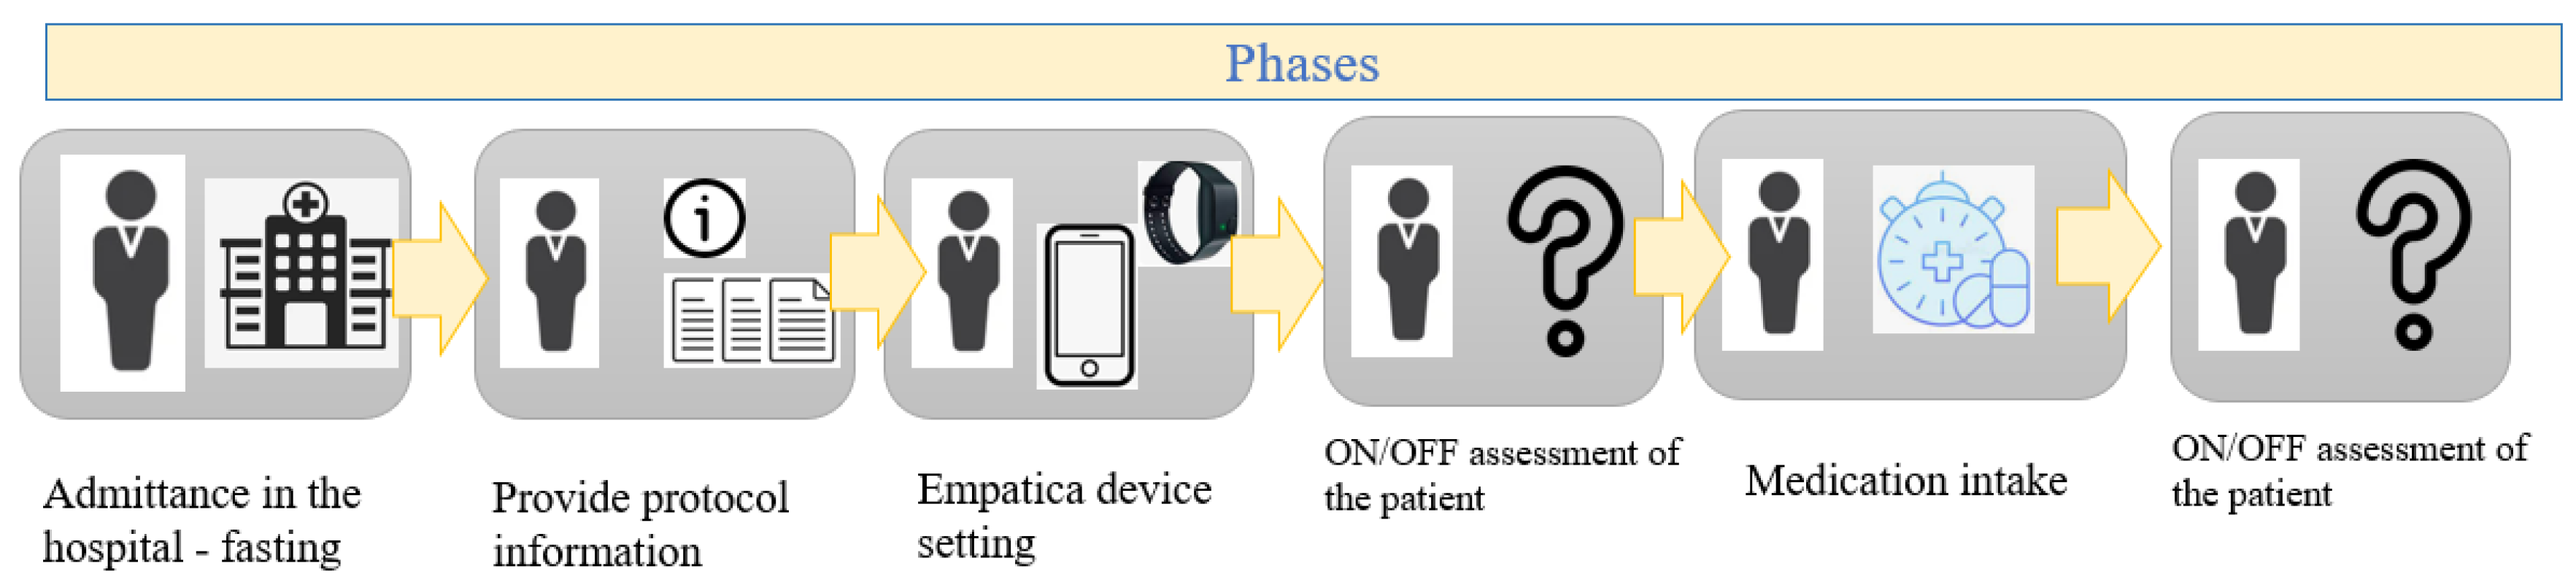
This study evaluated the characteristics of the electrodermal activity in the PD patients in response to dopaminergic medication administration and thus corresponding to the different states known as OFF (without medication) and ON (with medication).
Although there are no normative values for EDA in PD, we have determined that the mean value of the overall EDA signal decreases with dopaminergic activation (1.62 ± 2.56 µS for the OFF period and 1.18 ± 1.7 µS for the ON period). The windowing procedure appears to increase those values but keeps a similar trend (2.16 ± 3.34 µS and 1.36 µS ± 2.4 µS for the OFF and ON states, respectively). We identified differences in the time domain (amplitude mean, amplitude median, SCR number of peaks, and the area under peaks), in the frequency (average power), and in the complex optimization approach (under the peaks for the tonic component) concluding a small effect size between those states. The average mean values for the overall signal and for the windowed signal comparing the ON and OFF states showed a higher arousal activity in the OFF state, as patients without levodopa drugs are more nervous, more excited, more affected by pain, and, therefore, they tend to sweat more because of a higher sympathetic tone [10]. Moreover, windowing the signal was useful to extract characteristics about the signal that later allowed us to train different ML models to predict the OFF and ON states.
Using logistic regression as a straightforward analytical approach to detect signal changes resulting from LEDD administration, our model showed a moderate accuracy of 67.01%. This model incorporated the EDA features mentioned earlier, as well as socio-demographic and clinical characteristics. When assessing the socio-demographic and clinical variables, we found that age, Hoehn and Yahr (H&Y) stage, disease duration, LEDD dosage, and UPDRS score were all significant factors in the evaluated model. In our study, we found that the average amplitude of the EDA signal did not show statistical significance. Interestingly, this parameter is considered a crucial measure in various models within the literature for predicting patient status [25]. This discrepancy might be attributed to the limitations of the logistic regression model, which may fail to capture non-linear relationships between variables or handle complex decision boundaries, especially in cases of multicollinearity. Furthermore, the AuC-ROC score of the model is only 0.603, indicating that for a reliable and accurate discrimination between ON and OFF states, more sophisticated analytical approaches should be employed to enhance predictive capabilities. In the context of discriminating between ON and OFF states, the current model’s performance might be hindered by the intricate and multifaceted nature of Parkinson’s disease dynamics. Employing advanced analytical techniques and machine learning algorithms could potentially unlock hidden patterns and yield higher predictive accuracy.
The application of machine learning techniques is widespread in the medicine and biomedicine fields and its usage in Parkinson patients may allow to identify the complex relationships between the characteristics of the patient’s data. The usage of the SVM algorithm to evaluate the EDA signal has been previously reported [25] to detect stress conditions in individuals or to identify boredom, pain, or surprised emotions [26] providing very good results. Moreover, the utilization of neural network to evaluate the EDA in patients was studied previously in order to identify the arousal status with very promising results [27].
The first ML model proposed, a SVM model was tested with different kernel configuration to extend the potential relationship between the data. The results provided promising metrics to identify the fluctuations in Parkinson patients, achieving an accuracy of 72% using a radial based function in the kernel of the SVM. The radial based function of the SVM model provides the best results of the different configurations tested. This function is powerful and more complex than the linear and polynomial ones as its main property is the capacity of combining different polynomial kernels several times looking for non-linear separable data [28]. This type of kernel is likely more suitable for these signals, given the presence of non-linear relationships among the utilized features that can be effectively captured by this type of kernel function [29]. In the literature, this function is among the most commonly employed when working with SVM methods for arousal classification [30]. Consequently, our study demonstrates that SVM methods can effectively identify autonomic changes in response to levodopa intake in PD patients, producing promising results. Both techniques employed a cross-validation mechanism to assess the model’s generalization performance on an independent dataset [31]. This process involves creating various subsets from the training data to detect any potential overfitting in the model.
The results presented above demonstrate the robustness of the Support Vector Machine (SVM) in accurately identifying the state of the patient (ON or OFF). The literature has already established that SVM-based models exhibit strong robustness and precision compared to other classifiers [32]. This study not only validates the effectiveness of SVM using the EDA signal to identify stress levels [25] and emotional arousal [26], but also to determine the fluctuation state of PD patients.
However, there is room for improvement in terms of enhancing the performance of the designed models. Various configurations of neural networks were explored to assess their capacity to detect the fluctuation states in PD patients.
The results obtained from the artificial and spiking configurations of the neuronal networks demonstrated a very solid performance. This indicates that these neural network models effectively captured the complex relationships among input features, thereby improving upon models like logistic regression that fail to capture the non-linear patterns in the data. The primary distinction between the two models is that, despite our dataset’s limitations, spiking neural networks offer an efficient approach to conserving energy and reducing computational costs, as opposed to traditional neural networks [33].
Both neural network approaches presented here are viable options for deploying an application with embedded machine learning algorithms aimed at identifying the status of the patient. This would allow for medication adjustments based on the patient’s state, ultimately leading to an enhanced quality of life.
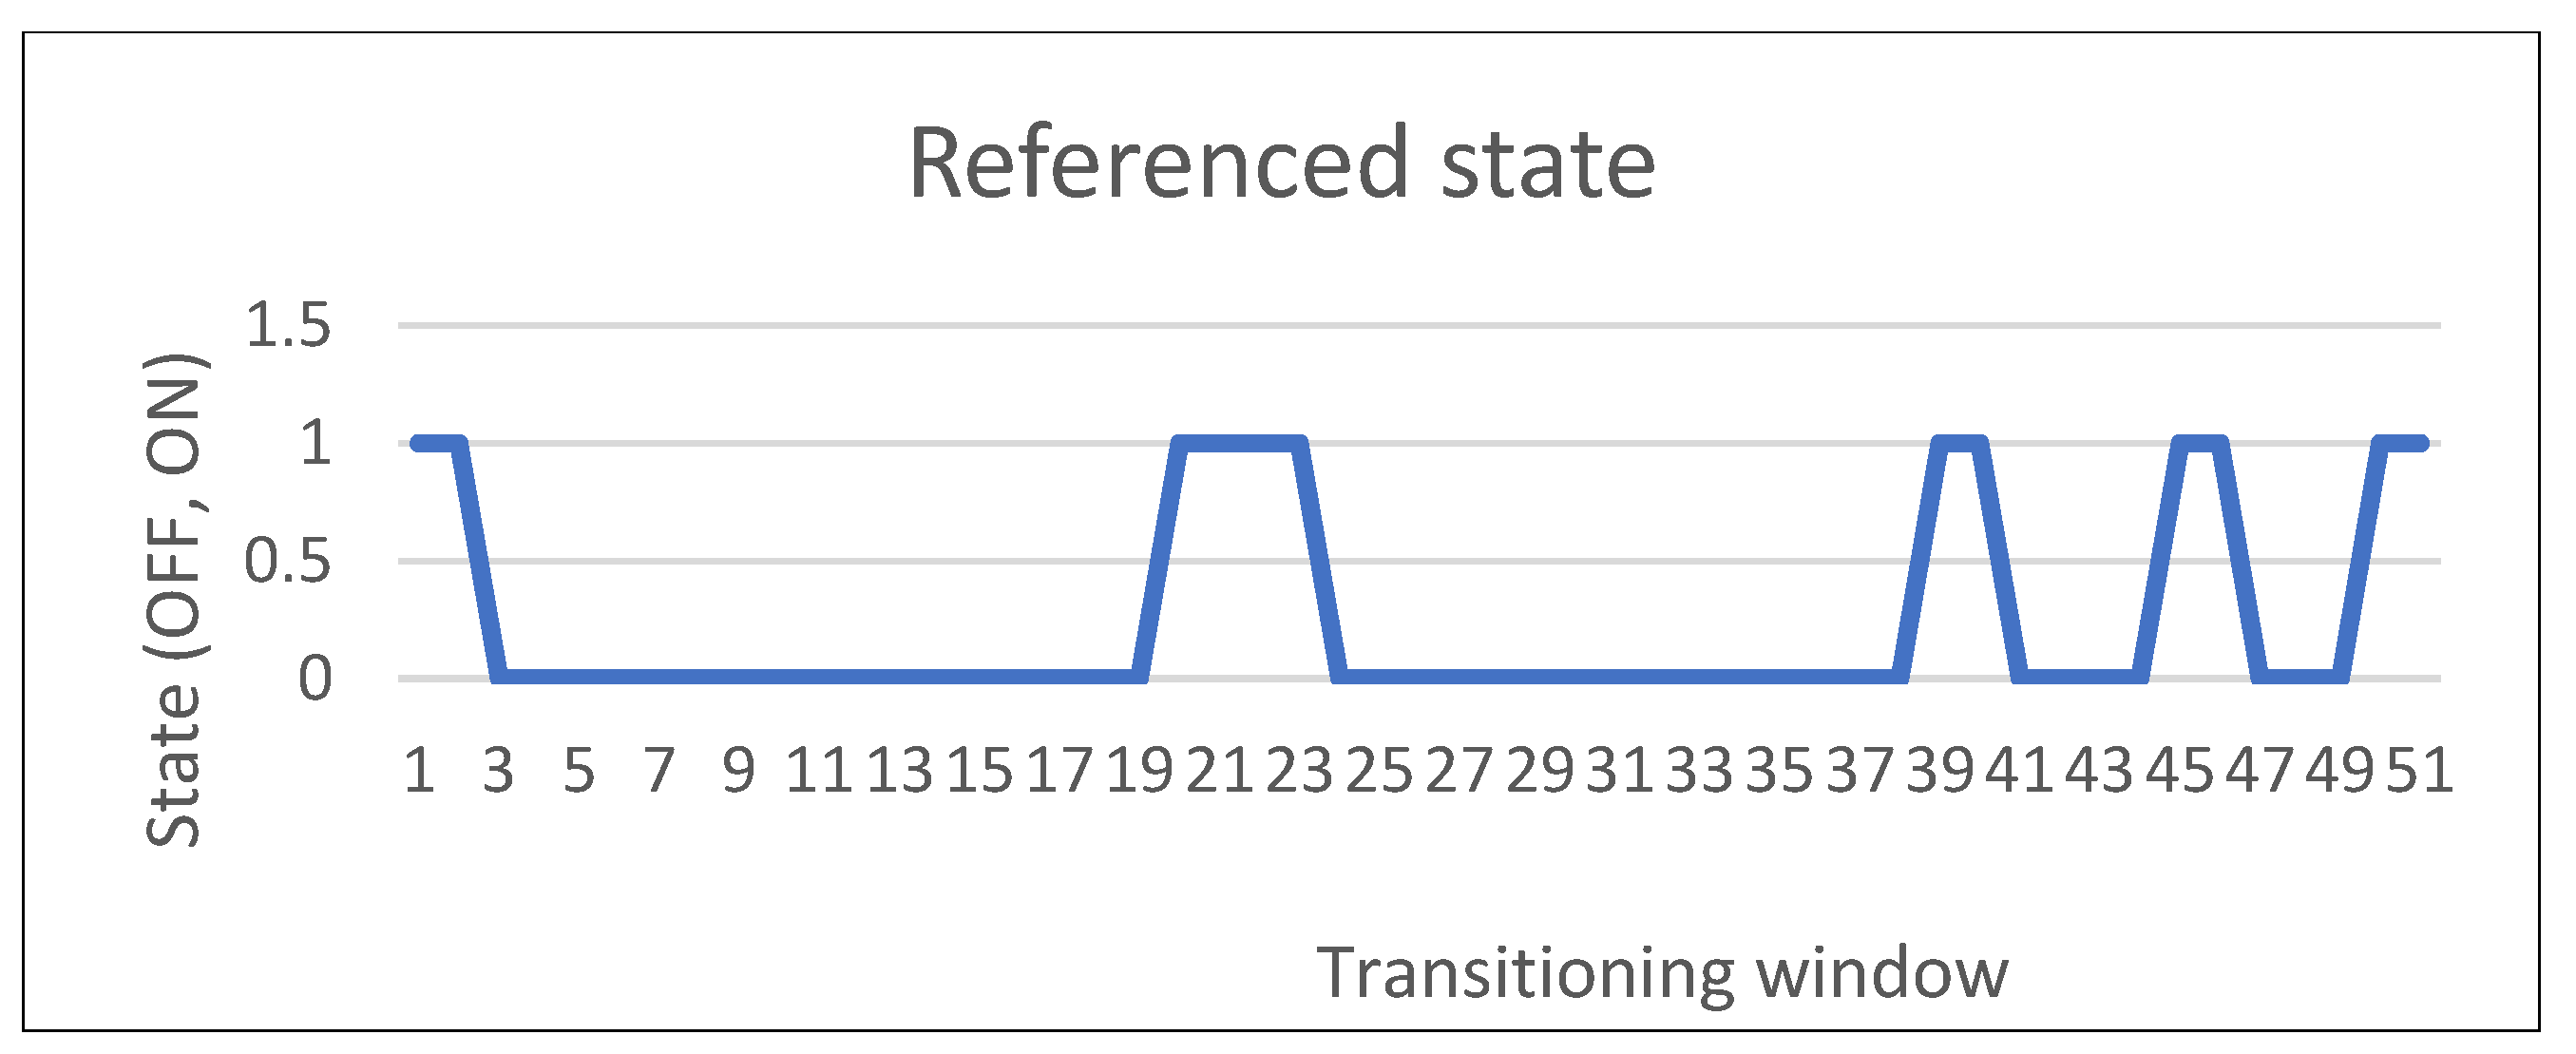
The transition between the OFF and ON state, called in our study the intermediate state, was also evaluated using the information gathered from the PD patients and the ANN with the best performance obtained in the model construction. The results showed that the transition between both states is not a sudden change but a smooth transition from one to another, clearly conditioned to the levodopa pharmacokinetics and absorption [34].
EDA serves as a potential biomarker for Parkinson’s disease (PD), facilitating the detection of changes in dopaminergic stimulation. Depending on the choice of features and the design of the model, the patient’s condition can be assessed with greater precision. To explore this potential, we constructed a neural network-based model utilizing these features to enhance its performance.
Our proposed approach harnesses the power of a single non-invasive device, such as Empatica, to capture EDA data. This approach distinguishes itself from other contemporary analysis techniques, described in the literature [35], which rely on canonical correlation analysis and utilize four biosignals (EDA, temperature, heart rate, and blood pressure volume).
However, it’s important to note that our model’s performance could not be personalized for each individual due to the limited number of patients in our database. Also. the sample of patients recruited for the database created had heterogeneous clinical characteristics (H&Y state, age, LEDD) that could also have conditioned the results obtained in the models. In the future, as the database expands, we envision the potential for individualized models to further optimize performance outcomes.

5. Conclusions

In this study, we examined the analysis of electrodermal activity in Parkinson’s disease (PD) patients and its association with non-motor fluctuations. We investigated the characteristics of electrodermal activity in PD patients during different medication stages, referred to as ‘OFF’ (without medication) and ‘ON’ (with medication), identifying some differences between both conditions.
We employed a logistic model to assess the significance of considered variables, including electrodermal activity features, as well as social, demographic, and clinical factors, in classifying the states of PD patients. Additionally, we constructed SVM and various NN models to identify its power and suitability to discriminate between the OFF and ON states with a good level of accuracy.
While our study utilized a dataset from 19 patients to identify these ‘ON/OFF’ states, future work could benefit from adopting an intra-patient approach, using patient-specific characteristics to train the model, thus enhancing accuracy. Longer recording sessions during ‘OFF’ and ‘ON’ periods could provide valuable data for individualized algorithm training. Additionally, exploring other machine learning techniques such as convolutional neural networks or generative adversarial networks could be considered to assess their performance compared to the classifiers built in this study.
Furthermore, our analysis focused solely on electrodermal activity to discriminate between states, but there is potential to incorporate data from other biosignals, such as heart rate, temperature, or blood volume pulse, as features in the algorithms introduced here, enriching the potential relationships identified between the data.
The potential of combining biosignals with machine learning algorithms for the characterization and treatment of PD fluctuations remains a promising avenue for further development.

Author Contributions

Conceptualization, M.B.-F. and J.P.R.; methodology, M.B.-F. and J.P.R.; validation, M.B.-F. and C.S.-Á.; formal analysis, M.B.-F.; investigation, M.B.-F., L.V.-L. and M.M.-V.; resources, Y.G.-Z. and F.J.S.-C.; data curation, M.B.-F.; writing—original draft preparation, M.B.-F. and M.M.-V.; writing—review and editing, M.B.-F. and M.M.-V.; supervision, J.P.R. and C.S.-Á.; project administration, J.P.R.; funding acquisition, J.P.R. All authors have read and agreed to the published version of the manuscript.

Funding

This research was funded by the Spanish Ministry of Science and Innovation, grant number PID2020-113222RBC21/AEI/10.13039/501100011033.

Data Availability Statement

The data presented in this study are available on request from the corresponding author. The data are not publicly available due to privacy restrictions.

Conflicts of Interest

The authors declare no conflict of interest.

Appendix A

Table A1. Results of the logistic regression model. Abbreviations: AUC: Area Under de Curve; H & Y: Hoehn and Yahr; LEDD: L-dopa equivalent daily dose, SCR: Skin Conductance Response, UPDRS-III: Unified Parkinson’s Disease Rating Scale-Motor Part. * The values with asterisk indicate that they are statistically significant (values lower than 0.05).
Variable EstimateStandard Errorp-Value
Intercept0.680.240.014 *
EDA featuresAmplitude (time domain)0.050.040.18
SCR peaks0.310.062<0.001 *
Area under Curve0.250.0340.27
Power (frequency domain)−0.016<0.001<0.001 *
Amplitude (phasic component)−9.957 × 1052.14 × 1060.64
Area Under Curve (phasic component)8.2971.78 × 1040.64
Amplitude (tonic component)10.514.610.02 *
Area Under Curve (tonic component)0.0820.0390.04 *
Sociodemographic and clinical characteristicsAge−0.023.76 × 103<0.001 *
H & Y state0.32140.087<0.001 *
Disease duration−0.0290.01430.038 *
LEDD (morning)−3.261 × 10−41.17 × 10−40.005 *
LEDD 4.84 × 10−35.541 × 10−4<0.001 *
UPDRS-III−0.0188.026 × 10−30.017 *

References

  1. Parkinson.org Parkinson Foundation. Statistics. 2022. Available online: https://www.parkinson.org/understanding-parkinsons/statistics (accessed on 13 June 2023).
  2. Zesiewicz, T.A.; Baker, M.J.; Wahba, M.; Hauser, R.A. Autonomic Nervous System Dysfunction in Parkinson’s Disease. Curr. Treat. Options Neurol. 2003, 5, 149–160. [Google Scholar] [CrossRef] [PubMed]
  3. Chen, Z.; Li, G.; Liu, J. Autonomic Dysfunction in Parkinson’s Disease: Implications for Pathophysiology, Diagnosis, and Treatment. Neurobiol. Dis. 2020, 134, 104700. [Google Scholar] [CrossRef] [PubMed]
  4. Boucsein, W. Electrodermal Activity; Springer Science & Business Media: Berlin/Heidelberg, Germany, 2012. [Google Scholar]
  5. Kritikos, J.; Tzannetos, G.; Zoitaki, C.; Poulopoulou, S.; Koutsouris, D. Anxiety Detection from Electrodermal Activity Sensor with Movement & Interaction during Virtual Reality Simulation. In Proceedings of the 2019 9th International IEEE/EMBS Conference on Neural Engineering (NER), San Francisco, CA, USA, 20–23 March 2019; pp. 571–576. [Google Scholar]
  6. Posada-Quintero, H.; Florian, J.P.; Orjuela-Cañón, A.D.; Chon, K.H. Electrodermal Activity Is Sensitive to Cognitive Stress under Water. Front. Physiol. 2018, 8, 1128. [Google Scholar] [CrossRef] [PubMed]
  7. Rodríguez-Violante, M.; Ospina-García, N.; Dávila-Avila, N.M.; Cruz-Fino, D.; De la Cruz-Landero, A.; Cervantes-Arriaga, A. Motor and Non-Motor Wearing-off and Its Impact in the Quality of Life of Patients with Parkinson’s Disease. Arq. Neuropsiquiatr. 2018, 76, 517–521. [Google Scholar] [CrossRef] [PubMed]
  8. Pérez-López, C.; Samà, A.; Rodríguez-Martín, D.; Català, A.; Cabestany, J.; Moreno-Arostegui, J.M.; de Mingo, E.; Rodríguez-Mlinero, A. Assessing Motor Fluctuations in Parkinson’s Disease Patients Based on a Single Inertial Sensor. Sensors 2016, 16, 2132. [Google Scholar] [CrossRef] [PubMed]
  9. Reimer, J.; Grabowski, M.; Lindvall, O.; Hagell, P. Use and Interpretation of on/off Diaries in Parkinson’s Disease. J. Neurol. Neurosurg. Psychiatry 2004, 75, 3396–3400. [Google Scholar] [CrossRef]
  10. Dutkiewicz, J.; Szlufik, S.; Friedman, A. New Methods of Assessing Autonomic Disorders in Parkinson Disease Patients: Skin-galvanic Reaction. J. Neural Transm. 2019, 126, 1421–1424. [Google Scholar] [CrossRef]
  11. Nene, D. Ambulatory Monitoring of Electrodermal Activity (EDA) and Heart Rate Variability (HRV) for Prediction of Motor Fluctuations in Parkinson’s Disease (PD). Mov. Disord. 2019, 34, 25. [Google Scholar]
  12. Taamneh, S.; Tsiamyrtzis, P.; Dcosta, M.; Buddharaju, P.; Khatri, A.; Manser, M.; Pavlidis, I.A. Multimodal Dataset for Various Forms of Distracted Driving. Sci. Data 2017, 4, 170110. [Google Scholar] [CrossRef]
  13. Greco, A.; Valenza, G.; Lanata, A.; Scilingo, E.P.; Citi, L. cvxEDA: A Convex Optimization Approach to Electrodermal Activity Processing. IEEE Trans. Biomed. Eng. 2015, 63, 797–804. [Google Scholar] [CrossRef]
  14. Nardelli, M.; Greco, A.; Sebastiani, L.; Scilingo, E.P. ComEDA: A New Tool for Stress Assessment Based on Electrodermal Activity. Comput. Biol. Med. 2022, 150, 106144. [Google Scholar] [CrossRef]
  15. Barrachina-Fernández, M.; Maitín, A.M.; Sánchez-Ávila, C.; Romero, J.P. Wearable Technology to Detect Motor Fluctuations in Parkinson’s Disease Patients: Current State and Challenges. Sensors 2021, 21, 4188. [Google Scholar] [CrossRef] [PubMed]
  16. Von Elm, E.; Altman, D.G.; Egger, M.; Pocock, S.J.; Gøtzsche, P.C.; Vandenbroucke, J.P. The Strengthening the Reporting of Observational Studies in Epidemiology (STROBE) Statement: Guidelines for Reporting Observational Studies. Lancet 2007, 370, 1453–1457. [Google Scholar] [CrossRef] [PubMed]
  17. Hughes, A.J.; Daniel, S.E.; Kilford, L.; Lees, A.J. Accuracy of Clinical Diagnosis of Idiopathic Parkinson’s Disease: A Clinico-Pathological Study of 100 Cases. J. Neurol. Neurosurg. Psychiatry 1992, 55, 181–184. [Google Scholar] [CrossRef] [PubMed]
  18. Folstein, M.F.; Folstein, S.E.; McHugh, P.R. Mini-Mental State. A Practical Method for Grading the Cognitive State of Patients for the Clinician. J. Psychiatr. Res. 1975, 12, 189–198. [Google Scholar] [CrossRef] [PubMed]
  19. Empatica Device. Available online: https://www.empatica.com (accessed on 14 July 2023).
  20. The MathWorks, Inc. 2022. Available online: https://es.mathworks.com/ (accessed on 23 March 2023).
  21. Van Der Mee, D.J.; Gevonden, M.J.; Westerink, J.H.; De Geus, E.J.C. Validity of Electrodermal Activity-Based Measures of Sympathetic Nervous System Activity from a Wrist-Worn Device. Int. J. Psychophysiol. 2021, 168, 52–64. [Google Scholar] [CrossRef] [PubMed]
  22. Braithwaite, J.J.; Watson, D.G.; Jones, R.; Rowe, M. A Guide for Analysing Electrodermal Activity (EDA) & Skin Conductance Responses (SCRs) for Psychological Experiments. Psychophysiology 2013, 49, 1017–1034. [Google Scholar]
  23. Shukla, J.; Barreda-Angeles, M.; Oliver, J.; Nandi, G.C.; Puig, D. Feature Extraction and Selection for Emotion Recognition from Electrodermal Activity. IEEE Trans. Affect. Comput. 2019, 12, 857–869. [Google Scholar] [CrossRef]
  24. Boucsein, W.; Fowles, D.C.; Grimnes, S.; Ben-Shakhar, G.; Roth, W.T.; Dawson, M.E.; Filion, D.L.; Society for Psychophysiological Research Ad Hoc Committee on Electrodermal Measures. Publication Recommendations for Electrodermal Measurements. Psychophysiology 2012, 49, 1017–1034. [Google Scholar]
  25. Sánchez-Reolid, R.; Martínez-Rodrigo, A.; López, M.T.; Fernández-Caballero, A. Deep Support Vector Machines for the Identification of Stress Condition from Electrodermal Activity. Int. J. Neural Syst. 2020, 30, 2050031. [Google Scholar] [CrossRef]
  26. Jang, E.H.; Park, B.J.; Park, M.S.; Kim, S.H.; Sohn, J.H. Analysis of Physiological Signals for Recognition of Boredom, Pain, and Surprise Emotions. J. Physiol. Anthropol. 2015, 34, 1–12. [Google Scholar] [CrossRef] [PubMed]
  27. Chowdhury, A.; Tjondronegoro, D.; Chandran, V.; Zhang, J.; Trost, S. Prediction of Relative Physical Activity Intensity Using Multimodal Sensing of Physiological Data. Sensors 2019, 19, 4509. [Google Scholar] [CrossRef] [PubMed]
  28. Scholkopf, B.; Sung, K.K.; Burges, C.J.; Girosi, F.; Niyogi, P.; Poggio, T.; Vapnik, V. Comparing Support Vector Machines with Gaussian Kernels to Radial Basis Function Classifiers. IEEE Trans. Signal Process. 1997, 45, 2758–2765. [Google Scholar] [CrossRef]
  29. Orr, M.J. Introduction to Radial Basis Function Networks; IEEE: Piscataway, NJ, USA, 1996. [Google Scholar]
  30. Sánchez-Reolid, R.; López de la Rosa, F.; Sánchez-Reolid, D.; López, M.T.; Fernández-Caballero, A. Machine Learning Techniques for Arousal Classification from Electrodermal Activity: A Systematic Review. Sensors 2022, 22, 8886. [Google Scholar] [CrossRef] [PubMed]
  31. Ramezan, A.; Warner, C.A.; Maxwell, A. Evaluation of Sampling and Cross-Validation Tuning Strategies for Regional-Scale Machine Learning Classification. Remote Sens. 2019, 11, 185. [Google Scholar] [CrossRef]
  32. Berzal, F. Redes Neuronales & Deep Learning; Independent: Chicago, IL, USA, 2019; Volume II. [Google Scholar]
  33. Yamazaki, K.; Vo-Ho, V.K.; Bulsara, D.; Le, N. Spiking Neural Networks and Their Applications: A Review. Brain Sci. 2022, 12, 863. [Google Scholar] [CrossRef] [PubMed]
  34. Olanow, W.; Poewe, W.; Rascol, O.; Stocchi, F. From OFF to ON–treating OFF episodes in Parkinson’s disease. US Neurol. 2020, 17, 36. [Google Scholar] [CrossRef]
  35. Arasteh, E. An Individualized Multi-Modal Approach for Detection of Medication “Off” Episodes in Parkinson’s Disease via Wearable Sensors. J. Pers. Med. 2023, 13, 1145. [Google Scholar] [CrossRef]
Figure 1. Phases in the protocol to record each session with the patients.
Mathematics 11 04822 g001
Figure 2. The signal pre-processing details the steps followed when working with the EDA signal.
Mathematics 11 04822 g002
Figure 3. (A). Example of electrodermal activity (EDA) signal evolution over time. (B). Raincloud plot showing the EDA signal according to the non-motor fluctuation state. Each dot represents a single participant.
Mathematics 11 04822 g003
Figure 4. Example of states per window in the intermediate phase between OFF and ON states.
Mathematics 11 04822 g004
Table 1. Demographic and clinical data from participants. Abbreviatures: H&Y: Hoehn and Yahr; UPDRS-III: Unified Parkinson’s Disease Rating Scale-Motor Part; LEDD: L-Dopa Equivalent Daily Dose.
Variable Participants (N = 19)
Sex, Number of males (%)6 (31.58)
Age in years, mean ± SD60.8 ± 12.28
Disease duration in years, mean ± SD5.9 ± 4.1
H&Y stage, N (%)14 (21.05)
1.52 (10.53)
27 (36.84)
2.52 (10.53)
34 (21.05)
UPDRS III OFF score, mean ± SD 29.47 ± 13.6
UPDRS III ON score, mean ± SD 20 ± 10.15
UPDRS III OFF to ON change score, ± SD 9.73 ± 6.85
LEDD in mg/day, mean ± SD 672.98 ± 495.98
LEDD in mg/morning dose, mean ± SD 204.12 ± 672.98
Table 2. Main characteristics of the time features of the overall EDA signal and after signal windowing (considering a length of 30 s per window) in ON and OFF states. Abbreviations: SCR: Skin Conductance Response.
FeatureOverall SignalAfter Signal Windowing
StateState
OFFONOFFON
Amplitude, mean ± SD, µS1.62 ± 2.561.18 ± 1.72.16 ± 3.341.36 ± 2.4
Amplitude, median, µS1.430.941.210.64
SCR peaks, N83.78 ± 27.76146.26 ± 45.140.87 ± 0.631.03 ± 0.64
Area under peaks, µS2/Hz14.59 ± 32.6616.23 ± 29.891.2 ± 2.11.52 ± 1.9
Table 3. Main characteristics of the convex optimization features of the EDA signal in ON and OFF states for the overall signal and after signal windowing. Abbreviations: AUC: Area Under de Curve.
FeatureOverall SignalAfter Signal Windowing
StateState
OFFONOFFON
Amplitude, phasic average ± SD, µS2.64 ± 4.41.91 ± 1.960.32 ± 0.350.33 ± 0.29
Amplitude, tonic average ± SD, µS−1.86 ± 2.46−3.32 ± 5.79−0.36 ± 0.350.39 ± 0.34
AUC phasic component, µS2/Hz2.11 ± 2.692.91 ± 4.841.16 ± 1.191.33 ±1.18
AUC tonic component, µS2/Hz2.14 ± 2.062.84 ± 5.331.35 ± 1.371.56 ± 1.36
Table 4. Results of the Support Vector Machine (SVM) classifiers to discriminate between ON and OFF state based on Electrodermal Activity (EDA) features and socio-demographic and clinical characteristics of Parkinson’s disease. Abbreviations: NPV: Negative Predictive Value; PPV: Positive Predictive Value.
SVM TypeAccuracySpecificitySensitivityPPVNPV
Linear kernel0.630.980.420.9770.48
Radial kernel0.720.880.5070.770.7
Polynomial kernel0.610.820.670.9450.62
Sigmoid0.60.800.450.650.48
Table 5. Results of the Neural Networks (NN) to discriminate between ON and OFF state based on Electrodermal Activity (EDA) features and socio-demographic and clinical characteristics of Parkinson’s disease. Abbreviations: AuC: Area Under the Curve.
Neural Network TypeConfigurationAccuracySpecificitySensitivityAuCF Score
Artificial1 hidden layer0.860.860.860.850.89
Artificial2 hidden layers0.870.90.850.880.9
Spiking1 hidden layer0.820.910.760.870.89
Spiking2 hidden layers0.830.840.840.860.88
Disclaimer/Publisher’s Note: The statements, opinions and data contained in all publications are solely those of the individual author(s) and contributor(s) and not of MDPI and/or the editor(s). MDPI and/or the editor(s) disclaim responsibility for any injury to people or property resulting from any ideas, methods, instructions or products referred to in the content.

