Article

A New Similarity Measure of Fuzzy Signatures with a Case Study Based on the Statistical Evaluation of Questionnaires Comparing the Influential Factors of Hungarian and Lithuanian Employee Engagement

by
László T. Kóczy
1,2,*,
Dalia Susniene
3,
Ojaras Purvinis
3 and
Márta Konczosné Szombathelyi
4
1
Department of Informatics, Széchenyi István University, 9026 Győr, Hungary
2
Department of Telecommnnication and Media Informtics, Budapest University of Technology and Economics, 1111 Budapest, Hungary
3
School of Economics and Business, Kaunas University of Technology, 51368 Kaunas, Lithuania
4
Department of Marketing and Management, Széchenyi István University, 9026 Győr, Hungary
*
Author to whom correspondence should be addressed.
Mathematics 2022, 10(16), 2923; https://doi.org/10.3390/math10162923
Submission received: 5 July 2022 / Revised: 3 August 2022 / Accepted: 11 August 2022 / Published: 14 August 2022
(This article belongs to the Section Fuzzy Sets, Systems and Decision Making)

Abstract

:
Similarity between two fuzzy values, sets, etc., may be defined in various ways. The authors here attempt introducing a general similarity measure based on the direct extension of the Boolean minimal form of equivalence operation. It is further extended to hierarchically structured multicomponent fuzzy signatures. Two versions of this measure, one based on the classic min–max operations and one based on the strictly monotonic algebraic norms, are proposed for practical application. A real example from management science is chosen, namely the comparison of employee attitudes in two different populations. This example has application possibilities in the evaluation and analysis of employee behaviour in companies as, due to the complex aspects in analysing multifaceted behavioural paradigms in organizational management, it is difficult for companies to make reliable decisions in creating processes for better social interactions between employees. In the paper, the authors go through the steps of building a model for exploring a set of different features, where a statistical pre-processing step enables the identification of the interdependency and thus the setup of the fuzzy signature structure suitable to describe the partially redundant answers given to a standard questionnaire and the comparison of them with help of the (pair of the) new similarity measures. As a side result in management science, by using an internationally applied standard questionnaire for exploring the factors of employee engagement and using a sample of data obtained from Hungarian and Lithuanian firms, it was found that responses in Hungary and Lithuania were partially different, and the employee attitude was thus in general different although in some questions an unambiguous similarity could be also discovered.

1. Introduction

There are plenty of phenomena in the real world where proper characterisation may be done only by a large number of partly independent, partly redundant, often hierarchically structured descriptors. Such are all problems where humans are part of the system, such as in management, social, and other human-related engineering and modelling problems. The presence of human components means the presence of uncertainty. However, uncertainty may be of various natures. The two main types are a statistical and probabilistic uncertainty on one hand and a non-deterministic, ill-defined type of uncertainty on the other. The former may be modelled by classic probability theory and statistics, while the latter needs the deployment of fuzzy modelling. In this paper, a combined approach is presented and illustrated by a detailed case study. First, the statistical analysis helps evaluate a collection of questionnaires on employee attitudes. This is the starting point of the construction of the fuzzy signatures representing the complex replies to the questions in the forms, where the hierarchical interdependence of the individual questions is determined by the correlation coefficients among the answers. By calculating the arithmetic means of the fuzzy signatures (see in the next section) for both populations’ replies, two representative fuzzy signatures are obtained. The entirely new approach is the introduction of a measure for the comparison of the similarity (extended logical equivalence) of two FSigs, based on the fuzzy extension of a well-known Boolean formula, whose extension offers a multitude of novel formulae expressed by (negation, t-norm, t-conorm) triplet. In this study, two such triplets are selected, and calculations on the average signatures of the two populations based on the two versions of this novel similarity measure (degree) are presented.
The topic of the case study was chosen, as in our globalized world, businesses face many challenges, where their goal is to enhance the performance in a sustainable and increasingly efficient way. It is becoming increasingly clear to organizations that their main treasure is their staff. Therefore, an organizational policy should be pursued to align organizational goals with the individual goals of employees in order to achieve common goals. Thus, employee engagement is a crucial component of the businesses’ efficiency. As a pair of original collections of employee-attitude-related questionnaires was available to the authors, the comparison of the employee cultures of the origin countries of the two collections, Hungary and Lithuania, was performed with help of the new similarity measure.
Using the above-mentioned combined statistical- and fuzzy-signature-based approach as the primary model, we examined the relationship between workplace features as influential factors and the strategic role of employee engagement.
The case study is a complex enough problem to show how the two types of uncertainty may appear at the same time in the same problem. Here, the model build-up in such a complex situation combines both statistical and fuzzy approaches in a single entity, as both types of uncertainty are present. Computational intelligence and soft computing offer a very rich toolbox that includes various bio-inspired modelling and learning techniques resulting in very efficient algorithmic solutions to extremely complex problems with uncertainty, non-deterministic components, and vagueness. The case study is just an example for such a complex problem.
The aim of this study is to present a complex computational intelligence approach based on statistical analysis and fuzzy approaches. However, by the detailed analysis of the case study, we also attempt to contribute to the knowledge on the relationship between positive (organisational citizenship behaviour, OCB) and negative (counterproductive work behaviour, CWB) employee attitudes. These two main types of factors are influencing the employee attitudes in business organizations. A secondary aim is also to point out similarities and differences of two European nations’ management culture and traditions.
In order to construct the model, first, it is necessary to determine the interdependences and redundancies in the standard questionnaires and generally accepted OCB and CWB factors. This will be done by analysing the correlations between these factors of corporate and employee communication, corporate culture, and management style, thus obtaining a classification into closer connected subgroups and sub-subgroups of the uncertain (vague) features. This way, building up the fuzzy signature (FSig) descriptors is possible. By analysing the FSigs, it becomes possible to determine their respective impacts on the employees’ engagement and satisfaction with their careers, etc. Thus, the contribution of this paper is dedicated to presenting a novel comparison methodology based on the preliminary analysis, but at the same time, the evaluation of the real-life data in the case study may reveal some new facts for management science experts.

2. Fuzzy Signatures and Similarity

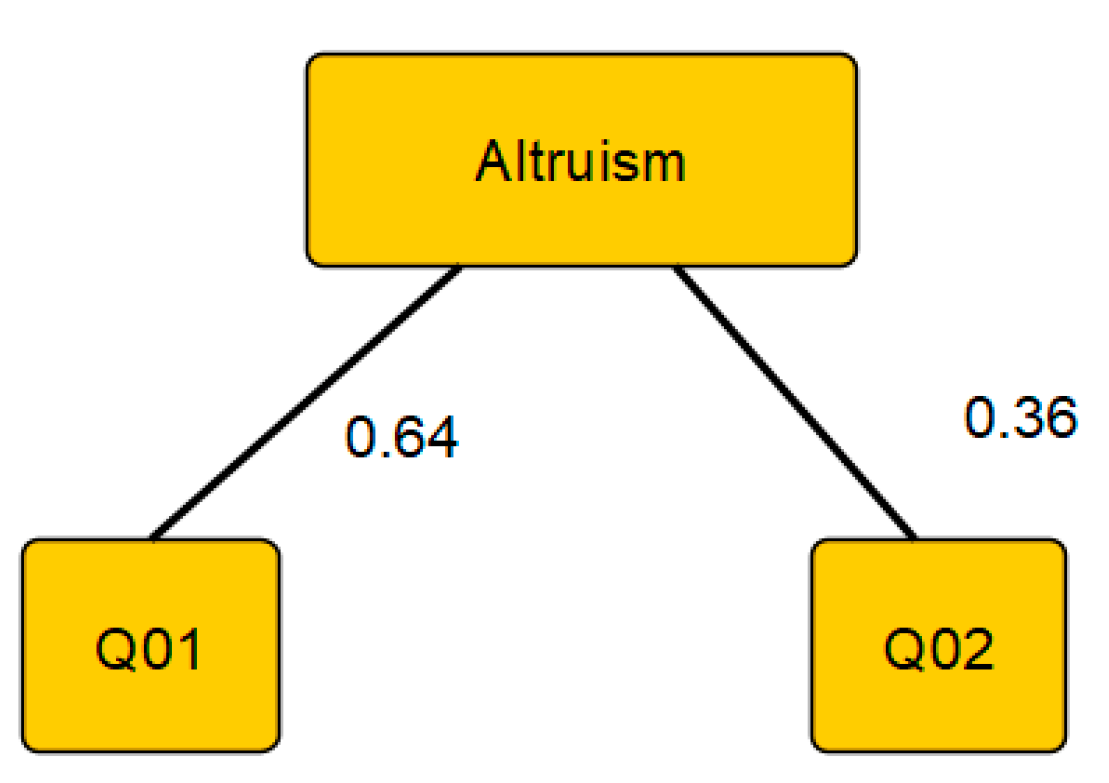
2.1. Fuzzy Signatures and Their Role in Modelling Employee Attitudes

The concept of fuzzy set was introduced by Zadeh [1]; in this definition, any member x of a universal set X is assigned a membership degree within the unit interval:
A = X , μ A , μ A : X [ 0 , 1 ]
Some time ago, we were motivated by an industrial project (classification of microscopic metallurgical images) to introduce and extension of the above, namely the concept of vector valued fuzzy sets (VVF) [2]. This led to the simple generalization of Zadeh’s definition into
A ¯ = X , μ A ¯ , μ A ¯ : X [ 0 , 1 ] k
Here, the k traditional fuzzy sets are interpreted as orthogonal components of a single k-dimensional membership function; i.e., each member x is now assigned k different degrees from the unit interval, with each of them expressing the degree of satisfying a certain property or feature.
A further extension of the concept of VVF leads to a hierarchically structured generalization of the definition of VVF. This was later motivated by further real-life applications (architectural and civil engineering problems, packaging, robot communication, etc.). This new extended concept was called fuzzy signature [3]. Some mathematical properties of FSigs were also investigated; for these, see, e.g., [4,5,6,7]. The definition of the FSig is as follows:
A f s i g = ( X , μ A ) ; μ A : X C 1 C 2 C k ,
where C i = [ 0 , 1 ] C i j or, where C i j (j being the sub-subsctript referring to the corresponding subtree of Ci) is defined recursively, in the same manner.
Of course, A f s i g can be also represented by a rooted tree graph, where the hierarchically nested sub-vectors are represented by sub-trees. In order to calculate simpler membership degrees, it is possible to reduce the sub-trees to their respective roots (in reality, intermediate nodes of the whole tree) and into a single membership degree assigned to the given (sub-)root by evaluating the aggregations assigned to each intermediate node (including the root). In order to calculate the reduced fuzzy degrees, each intermediate node of the tree graph (or each membership sub-vector) is assigned a fuzzy aggregation operator (a monotonic operator preserving the extremal values 0 and 1), whose execution combines the membership degrees at the leaves into a single value in [0,1]. This will be associated with the former root, now becoming a leaf of the reduced tree after the reduction. The complete FSig is defined by its tree graph (or nested vector) structure and the set of fuzzy aggregations assigned to all non-leaf nodes. This way, executing the aggregations on the values in the respective leaves, recursively, the whole FSig can be reduced to a single node with a single membership grade (in the root of the whole tree) if it is necessary for further processing, comparison, etc.
The case study discussed in this paper is based on some parts of a questionnaire on employee attitudes. This questionnaire had been developed by an international university research consortium for a worldwide cross-cultural management research project conducted by a University Fellows International Research Consortium [8] during a survey on communication styles used in the workplace. The questions and replies obtained by two parallel surveys, one in a group of Hungarian and the other one in some Lithuanian companies, have a natural hierarchy and a suggested structure of interconnectedness according to the relevant literature [5]. This hierarchy may be represented by a rooted tree graph where the root stands for the replying person, and the leaves of the tree contain the replies. These are expressed originally by numbers according to the so-called Likert scale that can be easily converted by a linear transformation into fuzzy membership degrees. The structure is represented by the tree graph and the types of interdependence by the fuzzy operators (aggregations). This complex combination of fuzzy graph and operations corresponds with the FSig definition, and thus, the case study can be very well-modelled and discussed in the language of FSigs.
It is a fortunate fact that two original and, so far in the major part, unpublished populations of responses to the questions, one obtained in Hungary and one in Lithuania, were available. In addition, the necessary expert domain knowledge from the side of management science—represented by the respective co-authors of this article—enabled the modelling of the selected part represented by the questionnaires. Thus, an interesting and consistent subset of the descriptors represented by the replies in both countries could be identified. The idea of model set-up based on FSigs incorporating the responses was already published by the authors [9]. To avoid repetition of the argumentation in the cited paper, here, the methodology of constructing the corresponding FSigs is straightforwardly applied. The procedure of modelling is only briefly presented in this paper for both sets.
At this point, assuming that two similar sets of responses are available, the new challenge emerges, namely whether these two populations of responses, reflecting the attitudes of two populations of employees coming from two different European countries, reflect essentially similar behaviour or whether there is a noticeable difference between the two. In order to carry out an educated comparison, a novel method is now proposed, based on a new similarity measure suitable for the comparison of two fuzzy membership degrees (or even membership functions), offering a straightforward generalisation of this measure to FSigs. The approach will be introduced in the next subsection.

2.2. A New Similarity Measure of Two Fuzzy Memberships and of Two Fuzzy Signatures

The similarity or equivalence of two fuzzy sets has been discussed in the relevant literature for several decades. (It often happened in the context of binary relations, cf., e.g., [10]). Usually, such definitions are based on the seemingly rather intuitive point of view that two fuzzy membership degrees are equivalent if they are equal. However, looking at the deeper semantics of fuzzy membership degrees, in a “philosophical” sense, it may be also considered from another point of view. As fuzzy membership degrees and membership functions express uncertainty, this problem can also be viewed by starting from the point that “the more uncertain is the belonging of a member to a set, i.e., the farther the membership degree(s) is(are) from the extreme values 0 and 1, the less this membership is certain itself”, and two values being equal but both being very uncertain may have a different real meaning. This approach raises the question regarding how two uncertain, ill-defined values (or whole concepts) may be compared in a way that matches the spirit of fuzzy sets and systems: the degree of similarity being expressed itself by a degree of truth. In this paper, a very obvious new definition of similarity will be introduced and applied, which can be, surprisingly, not found in the related literature.
Let us start with the consideration that fuzzy connectives (norms, aggregations, etc.) are always defined as extensions of their Boolean counterparts, with the strict condition that when substituting the arguments of any fuzzy operation OP by either one of the Boolean truth or membership values (the extremal values in the fuzzy truth degree range), the result must be identical with the result of the Boolean operation OP. As the range of fuzzy membership degrees is continuous, the number of possible extensions of any Boolean operator is infinite, and thus, in the fuzzy algebra, no canonical and minimal forms exist. Nevertheless, the extension of any Boolean canonical or minimal form directly into its fuzzy equivalent based on a set of corresponding simple fuzzy operations may be reasonable.
Similarity is a gradual concept, and thus, the measure or degree of similarity of two objects can be directly expressed by a value from [0, 1], where 0 stands for “no similarity at all”, and 1 expresses “absolute similarity = identity”.
In the previous literature, fuzzy similarity measures were defined in a way where the inherent uncertainty expressed by the membership degrees was not taken into account, and the following axiomatic properties were requested:
A fuzzy similarity measure Sim(A, B) is a mapping Sim:A×B[0, 1], where Sim is possessing the following properties [11]:
(S1) 0 ≤ Sim(A, B) ≤ 1 (boundedness by 0 and 1);
(S2) Sim(A, B) = Sim(B, A) (commutativity);
(S3) Sim(A, B) = 1 if A = B (self-identity);
(S4) Sim(A, −A) = 0 if A is a crisp set (exclusion);
(S5) If ABC, then Sim(A, C) ≤ S(A, B) and S(A, C) ≤ S(B, C) (monotonicity in terms of containment).
This required property set, however, can be debated. While (S1) is obvious, and (S2) does not restrict the inherent fuzzy nature of the problem we are going to discuss, (S3) has a “hidden crisp” semantics. It does not take into consideration that uncertain information may not lead to a certain conclusion. (S4) and (S5), again, do not restrict the inherent uncertainty of the similarity we are going to discuss; thus, this axiom set may be accepted without (S3).
Hence, by omitting (S3) but keeping the other properties, we propose that the new fuzzy measure of similarity is defined as the truth degree of equivalence in the logical sense. In the Boolean algebra, equivalence is expressed by the following minimal form based on the triplet of disjunction, conjunction, and negation:
A B = A B A B
⌝ This expression can be extended in a general form to fuzzy operations:
A B = s ( t A , B , t ( A , B ) )
where denotes the fuzzy extension of the logical equivalence operation, s stands for the s-norm (t-conorm) operation (extended disjunction), t denotes t-norm (extended conjunction), and—stands for fuzzy negation. The above formula has an infinite number of concrete implementations depending on what triplet of fuzzy operations is chosen. In this study, two alternative solutions are proposed. In the original crucial paper of Zadeh [1], the {min, max, 1 − x} triplet was presented, and in the literature, this combination of operations is rather popular and has been used in many applications. The formula thus becomes
Sim Z A , B = A B = max { min { A , B } , min { 1 A 1 B } }
It is less obvious how the other formula is derived. In the original paper of Zadeh, in a footnote, an alternative definition of the binary fuzzy connectives was proposed under the name of “interactive operations”. Later, the literature referred to these connectives as “algebraic” conjunction and disjunction. Their usability has been shown in many applications, and the algebraic structure of these two, with their respective generalisations, were discussed in a number of theoretical papers. Let us just mention here that in [2], already, the algebraic operations were applied, and their natural fitting with verbal statements and their connections were shown already in [12]. These so called Hamacher-operations [13] have a very interesting property: they are strictly monotonic wherever the arguments are different from 0 and 1. This strict monotonicity allows the definition of a novel similarity measure given below, which clearly expresses the uncertainty of the equivalence (or similarity) of two uncertain values in a stronger way:
Sim A l g A , B = A B = A B + ( 1 A ) ( 1 B ) A B ( 1 A ) ( 1 B )
as talg(A,B) = A*B and salg(A,B) = A + BA*B.
As mentioned above, already very early, several studies were published supporting the fact that the strictly monotonic norms have an important role in modelling real-life behaviour, especially where human reasoning is involved (cf. Rödder [12], whose results were based on real experiments). These observations were soon followed by the definition of the parametric class of Hamacher operations and t- and s-norms [13], of which the algebraic norm pair is the simplest representative.
It should be mentioned that fuzzy similarity in the sense of (1b) assigns fuzzy membership degrees the measure from (0, 1) unless the arguments A and B are crisp themselves. Therefore, e.g., Sim Z A , B = 1 ,   when   B = A is only satisfied if either A = 1, or A = 0. Otherwise, the degree of similarity of A with itself is exactly A. This is an interesting feature of the new measure that can be explained by the semantic interpretation of a fuzzy membership degree: the expression of the degree of uncertainty. Namely, it is impossible to tell with certainty anything about the similarity (or identity) of two uncertain features, even having the same degree of membership, as they may not be identical or even very similar in the case when the uncertainty of the two expresses different realities. It is even more surprising when strictly monotonic norms are used (referring to the open interval (0, 1) only), such as in (3). Here, if A = B, Sim A l g A , B = A 2 + (1 − 2A + A2) − A 2*(1 − 2A + A2) SimAlg(A,B) = 0.4375 if A = B. This is an even more characteristic expression of the fact “nothing certain can be said about uncertain features”.
Based on the above family of similarity measures, it is possible to compare more complex fuzzy objects, such as VVF elements, and also fuzzy signatures as defined above.
The aim of this study is to offer some theoretical–methodological contribution (the new similarity measure) by presenting its application on a real-life case study. This application will be the analysis of the umbrella term “Employee engagement” as it is understood in the management science field. The analysis will be done by testing the proposed model for comparing two populations of data obtained by questionnaires distributed at companies in two different countries, Hungary and Lithuania. The model intends to encompass the three employee engagement elements—trait engagement, state engagement, and behavioural engagement—and explore their interplay to obtain a holistic view of the phenomenon. For this purpose, the matching fuzzy signature structure of the available data will be determined by using statistical evaluation and the basic fuzzy definitions, and then, the average signatures of the two populations will be compared based on the above introduced family of similarity measures.

3. Employee Engagement: Introduction to the Application Study

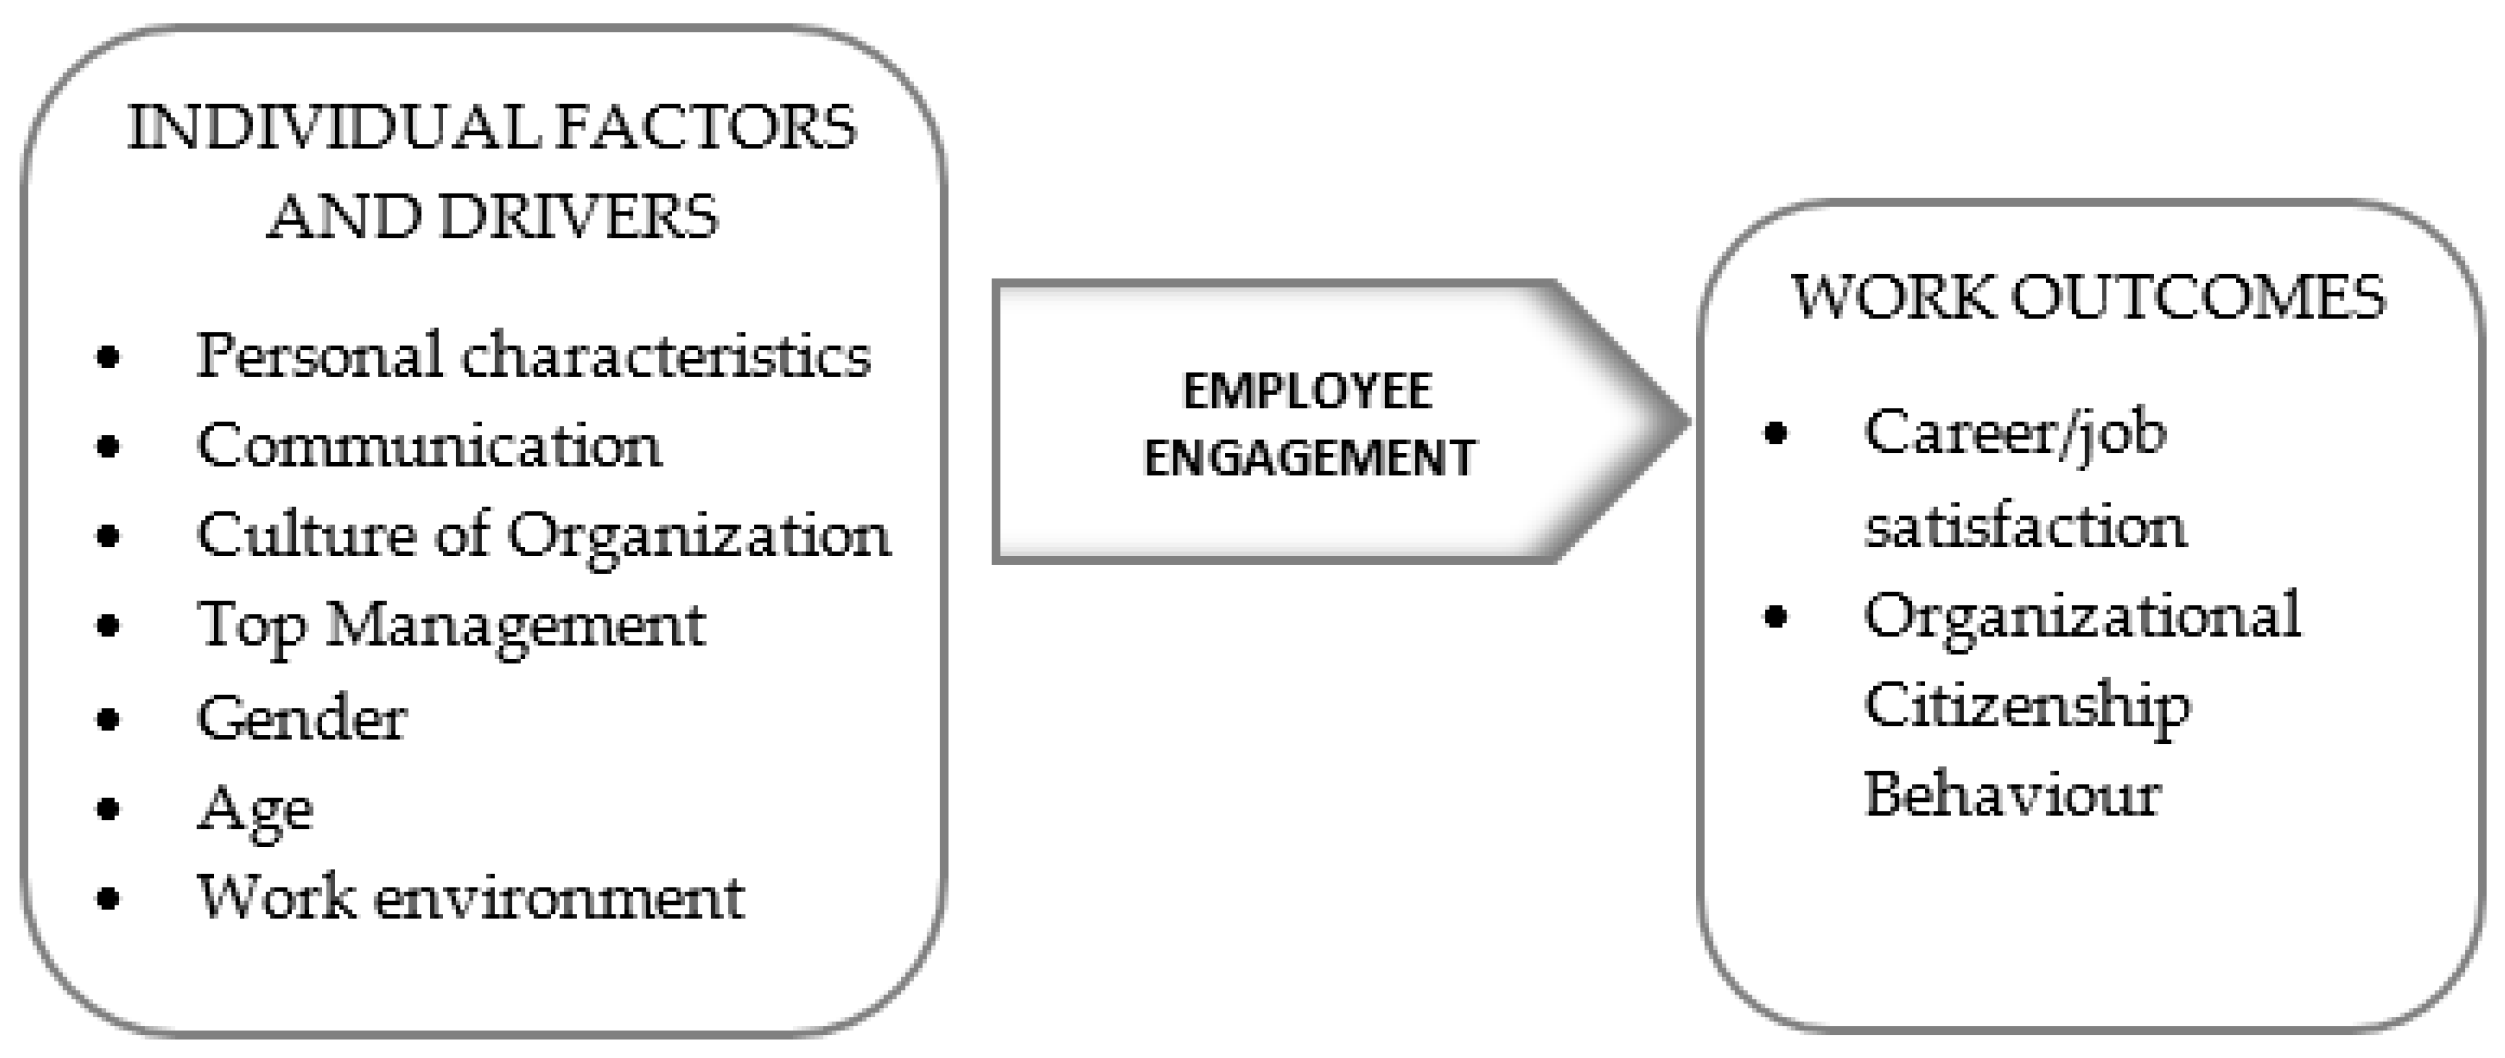
3.1. The Concept of Employee Engagement

The concept of employee commitment and engagement to work and the workplace has been at the centre of business and research interest since the 1990s [14,15,16,17,18,19]. Kahn [20] defined engagement as “the harnessing of organisation members’ selves to their work roles; in engagement, people employ and express themselves physically, cognitively, and emotionally during role performances”. The attitude of employees may be positively but also negatively inclined.
The positive and negative aspects of engagement are referred to in the literature as organizational citizenship behaviour (OCB) and counterproductive work behaviour (CWB). OCB and CWB are extremes, and thus, they should have a strong negative correlation.
Konovsky and Organ [21] identified five dimensions of OCB: altruism, courtesy, sportsmanship, civic virtue, and generalized compliance (conscientiousness). Altruism means voluntary helping; courtesy includes helping others to prevent interpersonal problems; sportsmanship denotes tolerating inconveniences without unnecessary complaining; civic virtue refers to a willingness to participate in organizational affairs. Finally, generalized compliance is a discretionary behaviour going beyond the minimum requirement level of the organization in areas of regulation and attendance.
The opposite is consciously destructive behaviour (CWB) that harms both the organization and the individuals questioning the organizational goals and values, thereby degrading employees’ and organizational performance. It has a negative effect on satisfaction and organizational culture and creates a bad mood [22].
In order to achieve, maintain, and increase employee engagement, we need to be aware of the factors that influence engagement, especially OCB. Various researchers [8,20,23,24,25,26,27,28] identified factors influencing employee behaviour, including organizational factors (e.g., organizational culture, organizational communication, leadership style) and individual characteristics (e.g., age, gender) that positively or negatively influence engagement towards the organization.
We argue that in order to understand employee engagement in an organisation, many more influencing factors need to be identified and explored, and especially, the relationships among them need to be examined. In order to do this, the model set up in [8] was tested (Figure 1).
The application study in this paper aims at contributing to analysing how behavioural engagement (both OCB and CWB) correlates with the engagement and perception of the organization.

3.2. The Methodology of Collecting Data

The method of the research in the application is based on a questionnaire developed by an international university research consortium for a worldwide cross-cultural management research project conducted by a University Fellows International Research Consortium [8], as mentioned above, during a survey on communication styles used in the workplace. The questionnaire was designed to include the issues on organizational culture and trust in top management, job satisfaction, OCB/CWB, gender differences, and styles of communication. The questionnaire was originally developed based on pilot testing. To accommodate the research questions, it consisted of the following eight sections:
  • Communication style;
  • Work experience, type, and size of a company and gender composition;
  • Personal characteristics;
  • Work environment and top management team;
  • Culture of organization;
  • OCB and CWB;
  • Career satisfaction;
  • Demographic data.
During the survey in Hungary, in the highly developed industrial region of Győr, a total of 1038 valid responses were received, while the Lithuanian research, restricted to the region of Panevezys, obtained 144 valid responses. In the survey, we tried to reflect all age groups, seniority levels, genders, and positions at work as well as different types of industries. The respondents were asked to respond on a nine-point Likert scale {1…9}.
During the response analysis, several statistical methods were used such as descriptive statistics, correlation analysis, and ANOVA (analysis of variance), in order to establish the structure of the fuzzy signatures.

4. Modelling Employee Engagement by Fuzzy Signatures

4.1. Transforming the Responses into Fuzzy Degrees

In the example presented in the previous section, which will serve as the case study and a validation example of the proposed approach, answers to the questions in the questionnaire were given using the widely deployed Likert scale, namely a scale from 1 to 9. It was an obvious idea to linearly transform these values into the closed-unit interval (i.e., to normalise the scale) in the absence of any argument supporting a non-linear transformation and thus to obtain fuzzy degrees expressing the degree of agreement with the statement in the relevant question:
f : [ 1 , 9 ] [ 0 , 1 ]
f(x) = (x − 1)/8
It is worth mentioning here that this application example illustrates how the theoretically continuous membership degrees are primarily chosen in practice only from a set of rational values, in this case, with nine elements. Nevertheless, in the course of further calculations and evaluations, the range of the degrees in use will open widely to a finer granulation scale although always remaining within the set of rational values in the unit interval.
After this transformation of the scale, further manipulations of the component degrees in the questionnaires by fuzzy aggregation (and other) operations will be possible. Here, the reader should be reminded the earlier remark that although first Zadeh and later numerous authors extended the classic set (and logic) operations to fuzzy sets, these extensions always had to conform with the rule that in the special case of binary membership values, the operations must reduce to the original binary operations whose name the extension bears. Thus, fuzzy complements (negations), fuzzy unions (disjunctions, t-conorms), and intersections (conjunctions, t-norms) have been defined in a plenitude; however, a wider class of binary (and multi-argument) operations was defined under the name of fuzzy aggregations. This wider class of operations includes both t-norms and co-norms and, further, the broad class of mathematical means (including geometric, weighted arithmetic, harmonic, etc., means), where the axiomatic conditions to satisfy are only the two borderline conditions (the preservation of the extreme values 0 and 1 of the binary membership degrees, as mentioned above) and monotonicity in terms of both (in the case of multiple aggregations, all) arguments. Other Boolean operations such as implication, equivalence, anti-valence, inhibition, etc., have also been extended to fuzzy sets and concepts but usually not in accordance with the Boolean minimal canonical forms, contrary to the similarity expression we proposed in Section 1.

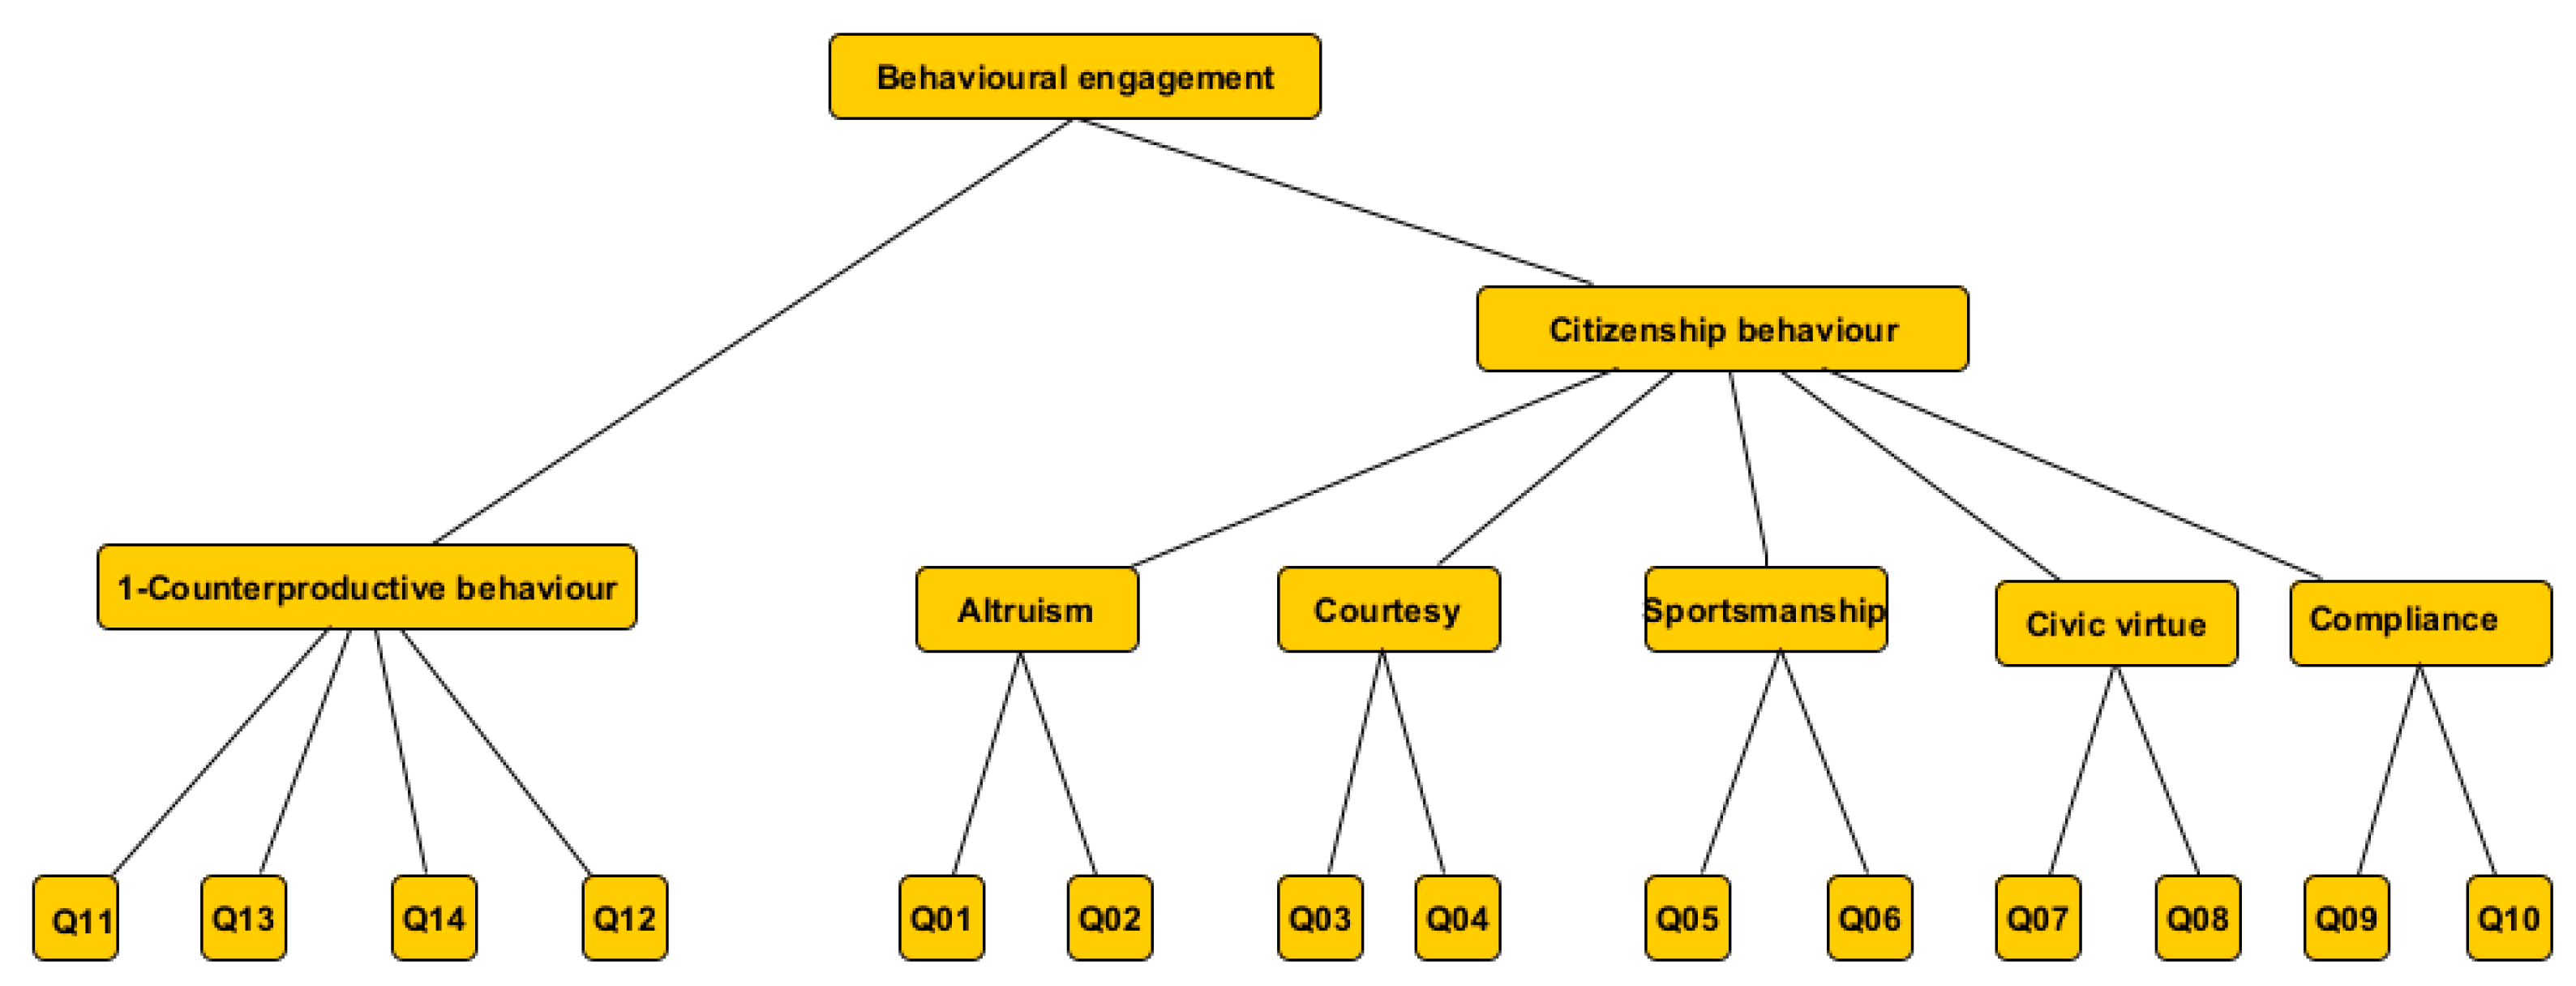
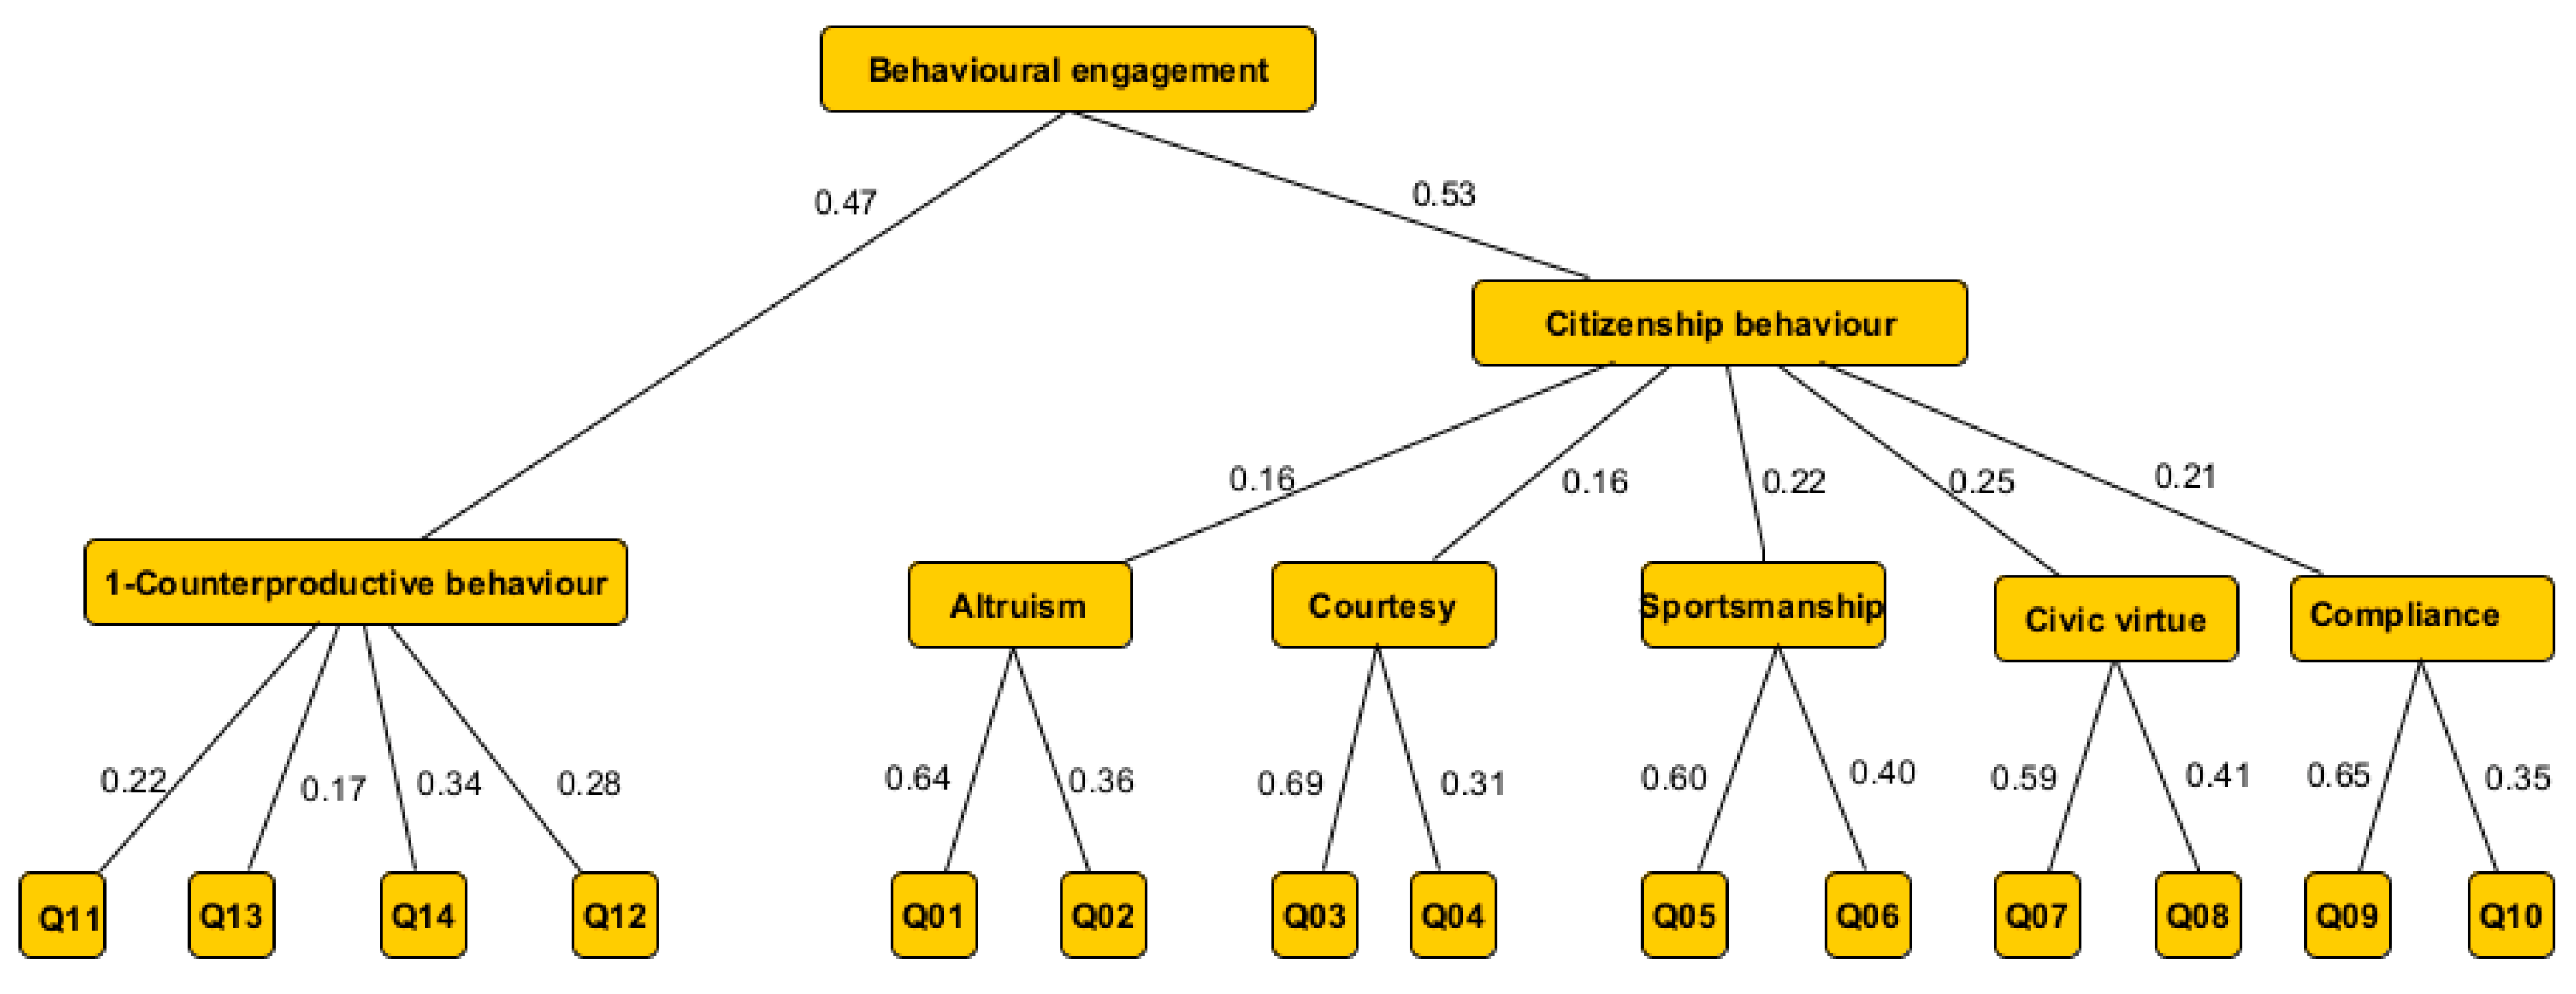
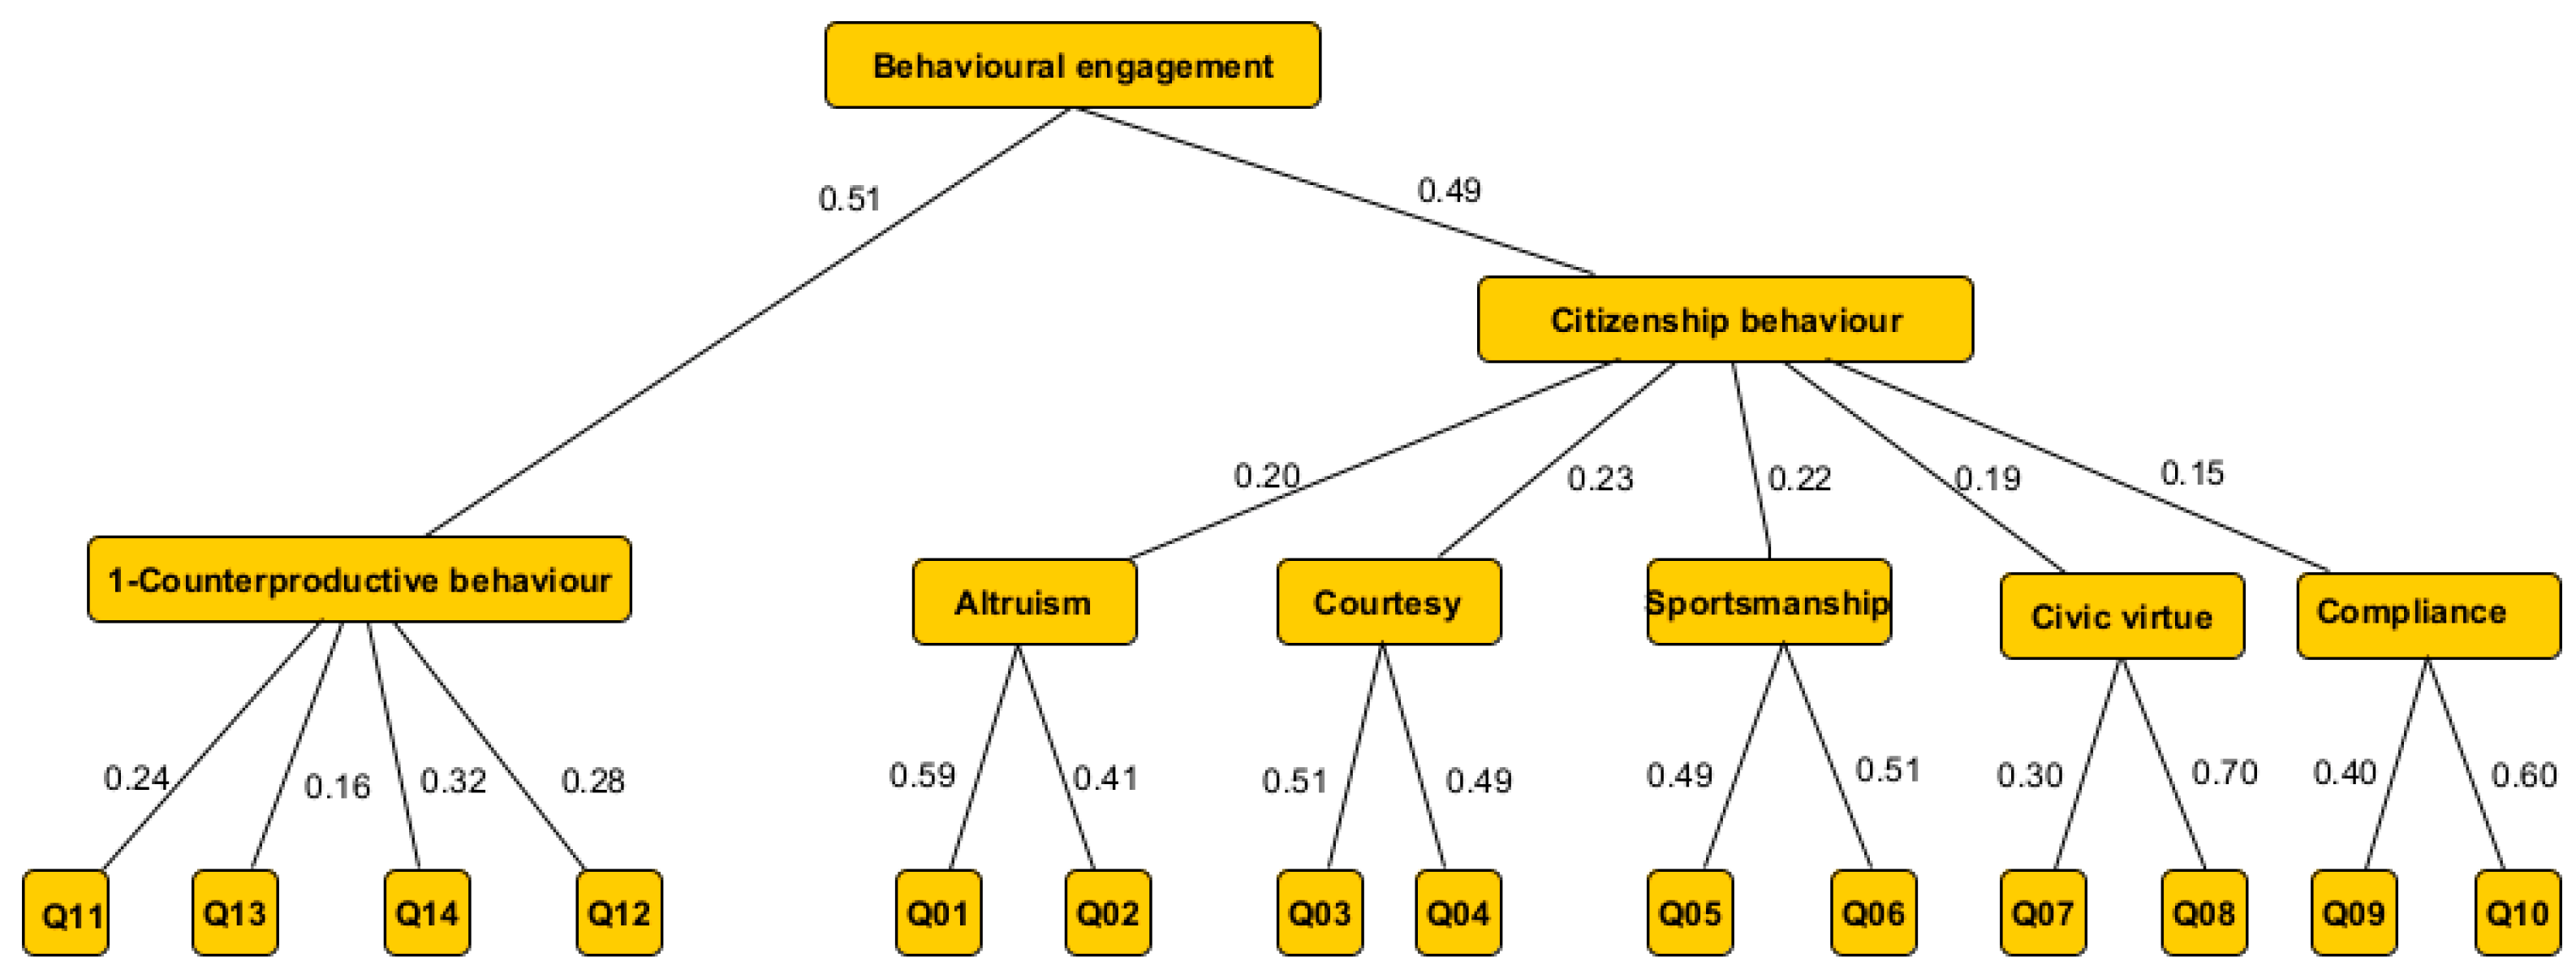
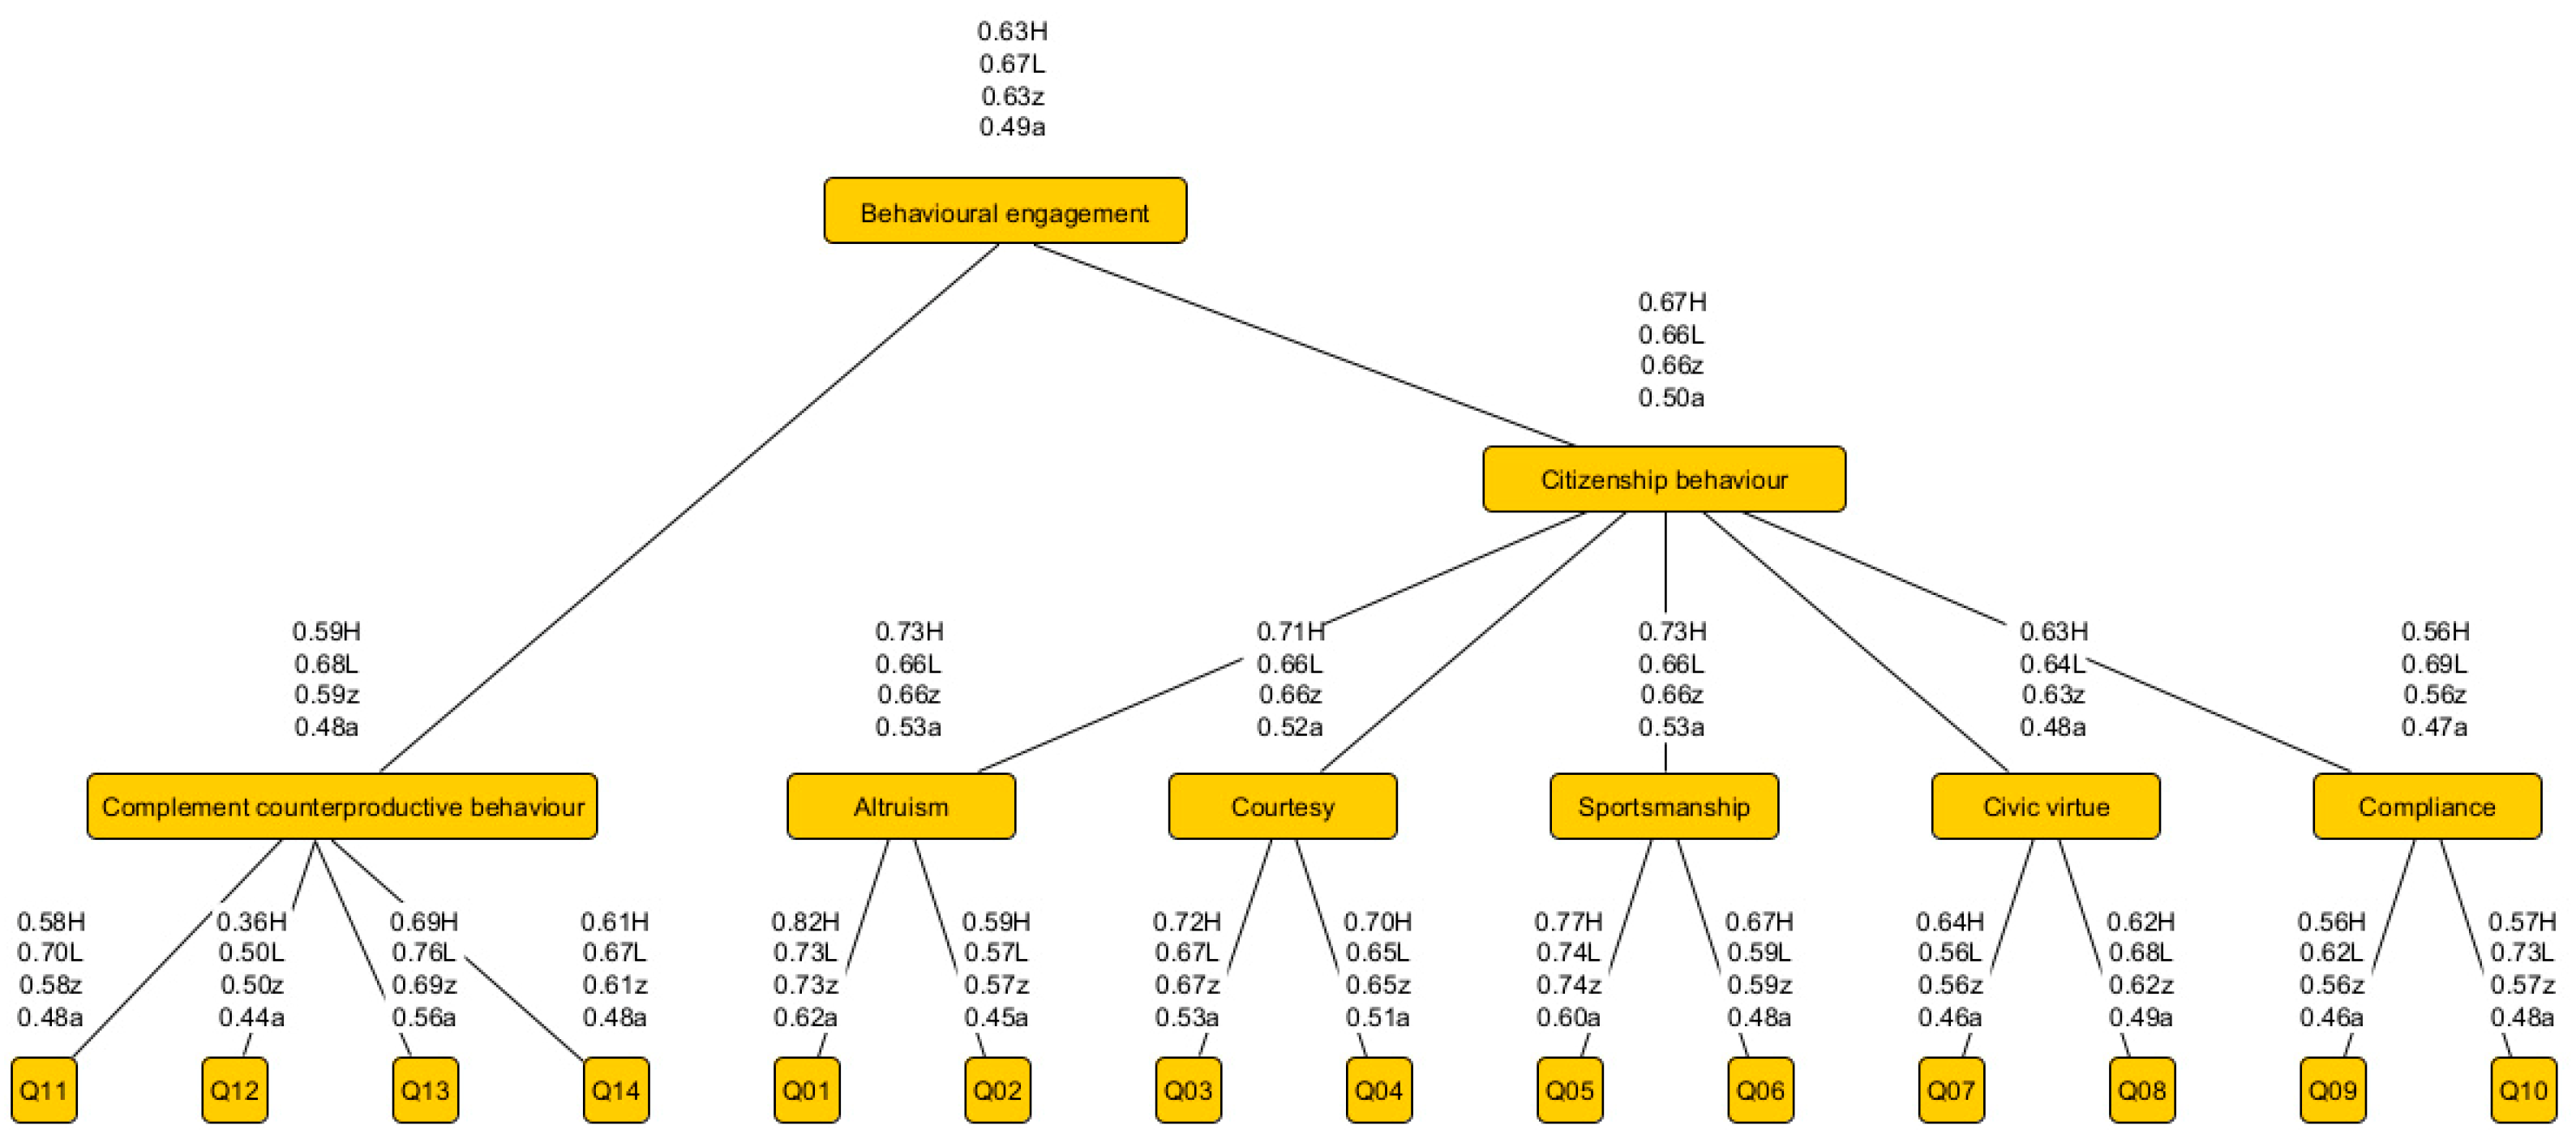
4.2. The Structure of the Proposed Fuzzy Model

It may be interesting to point out that the earliest, rather straightforward, and very general mathematical extension of the definition of fuzzy sets, the concept of L-fuzzy sets, was proposed in [29] by Goguen. Recalling this definition, we have:
  A L = X , μ A L ,   μ A L : X L  
Here, L denotes a rather wide possible extension of the unit interval [0,1]: an arbitrary algebraic lattice. Algebraic lattices [30] might be defined in two alternative ways, where both lead to the same abstractions. One starts from a partial ordering relation, while the other is based on a pair of binary operations with dual properties; namely, the operations join and meet, which are more general versions of the Boolean logic operations “or” and “and”. (This connection is not surprising, as Boolean algebra itself is a special lattice, where, compared to the general definition of algebraic lattice, some additional properties of the two operations are satisfied and, especially, the existence of the unary negation, which has some joint properties with the former two binary ones, the most well-known being the pair of De Morgan equations.)
The definition of the algebraic lattice is given in the next section. Let Y = {yi} be a set with a pair of binary operations over it, which are called join (∨) and meet (∧), for which operations the following axiomatic properties hold:
y 1 y 2 = y 2   y 1 ,   y 1   y 2 = y 2 y 1   ( commutativity ) y 1 y 2   y 3 = y 1     y 2     y 3 ,   y 1 y 2   y 3 = y 1     y 2     y 3   ( associativity ) y 1 y 1   y 2 = y 1 ,   y 1   y 1   y 2 = y 1   ( absorption ) .
Then, Y is a lattice for ∨ and ∧.
Lattices have further important properties (which, however, may be derived from the above three pairs), and for bounded lattices, the axioms of idempotence, identity, and boundary conditions also hold.
From the above definitions, join is the lowest upper bound, and meet is the greatest lower bound of any pair of elements in Y in the sense of the partial ordering in Y. In most applications, it is worthwhile considering a special class of bounded lattices called complete lattices. Here, all subsets of Y have both a supremum (the join of all respective elements) and an infimum (meet of all elements of the subset).
As the concept of fuzzy sets was generalised to the idea of fuzzy signatures (FSig) and fuzzy signature sets [3,4,5,6,7], as mentioned in Section 1, it could be interpreted that the values assigned by an FSig to any element of the universe are nested vectors of membership degrees from the interval [0, 1]. This way, somewhat similar algebraic properties to the originally defined fuzzy sets are obtained. It was an obvious question how the structure of the FSigs compares to Goguen’s extension. While FSigs with no relation to each other in any sense do not form any interesting algebra, it could be proven that FSigs deduced from a single “mother FSig”, i.e., by considering the set of all possible subtrees obtained by truncating the maximal FSig (the mother), form an L-fuzzy set, as the elements of the “family set” form an algebraic lattice, where join and meet can be defined [7].
As mentioned earlier, in the FSig approach, certain features are arranged within subgroups formally belonging to the same sub-vector (or sub-sub-vector, etc.) when those features (each of them assigned a membership degree) are closer related in semantics and meaning. Semantics in the context of the application example refers mainly to the interpretation of these sub-features by the responding employees and, at a higher level, by the deeper meanings of the corresponding questions assigned to them by the creators of the questionnaires. This may be expressed by the sub-tree within the FSig, where in the root of the sub-tree, the fuzzy aggregation operation determines the way the degrees of uncertainty of such sub-features are accumulated in a single degree (or, in the case of FSig sets, in a single membership function). The key factor is here to determine the proper aggregation in each “root of the subtrees”, i.e., each node within the graph that is not a leaf. In any application, these aggregations may be derived from analysing the expert domain knowledge related to those key behavioural patterns in the questions or may be determined in an objective way by performing a statistical analysis and, based on the results, applying some machine learning technique to optimally fit the parameters within the aggregations.
As this paper is focusing on the introduction and application of the new family of similarity measures and does not argue for the usage of the fuzzy signature, as has been done in [5] already, it is just mentioned that more traditional statistical methods have been applied for building up the signature itself. The essential point in using FSig is the fact that it allows multiple hierarchies with nested groups of features (subtrees in the representation), in which groups are first determined by the statistical interdependence of the individual features (replies). If “brute force” statistical comparisons were applied, the (partial) redundancies of the questions (having so many subjective elements and being often not thoroughly thought over by the management experts constructing the questionnaires) would be hidden, and often, replies with almost or partially identical semantics would be treated as independent. That would largely distort the result of the statistical analysis. This aspect also considers the fact that not only the respondents but the questioning experts are humans with vagueness in the formulation of questions and answers.
In our proposed model, the respondents’ replies in the Likert scale are interpreted as fuzzy degrees: they are necessarily fuzzy because these replies are unavoidably subjective and imprecise or vague (even non-deterministic in the sense that they may not be repeated exactly in another survey with the same respondents)—as all replies of this kind always are. It is, however, not at all obvious which of the questions mentioned above should form sub-vectors within the FSig model except the very general point in which management science experts agree that OCB- and CWB-related answers should form separate groups. This will be mapped into our model in the way that they form sub-trees, one hierarchical component of the FSig each. Thus, the overall structure of the FSig is
Q F S i g = Q O C B Q C W B
Thus, each respondent will be primarily characterized by a fuzzy-valued, 14 (10 + 4)-dimensional signature in the form of the above nested vector. The CWB part may not be directly generated from the fuzzified answer because of the next considerations.
It should be stressed once again that fuzzy signature graphs (nested vectors) contain fuzzy aggregations in the non-terminal (non-leaf) nodes. Aggregations, as mentioned above, however, are always monotonic increasing functions of their arguments. Because of this, components with a negative effect, such as the CWB attitudes, cannot be directly combined with the ones having a positive effect (OCB) in the overall evaluation of the attitude of the employee. As with aggregations in general, so the aggregations in the non-terminal nodes of the FSigs are also necessarily monotonic increasing functions of all arguments; it is necessary that instead of the fuzzified degrees obtained directly from the Likert scale values of the responses, which are monotonic decreasing with increasing loyalty and positive employee attitude, the complementary fuzzy membership degrees obtained from the original degrees assigned to the answers expressing the degree of “not being negative in the attitude” should be aggregated with the positive answers of the OCB components when the whole FSig is evaluated. The most commonly used negation satisfying all properties of the Boolean negation and, in addition, having some further “nice” symmetric and smoothness properties is the 1-µ negation as it was originally defined in [1]. Thus, in the case of CWB questions, a different function is used:
f : [ 1 , 9 ] [ 0 , 1 ] f = ( 9 x ) / 8
The crucial question now is how to construct the sub-structures and sub-sub-structures of the FSig QFSig apart from the obvious division into the two positive and negative semantics questions. We propose that, beyond the rather vague expert suggestions, the further structures may be determined by applying a statistical analysis of the answers, assuming here that especially the correlation analysis of the replies, including the cross correlation of each pair, would reveal the deeper connections of the respondents’ interpretations of the questions. Thus, the closer relationships among the degrees assigned to the answers would be revealed. This way, the proposed final FSig structure could be determined only after evaluating the correlation analysis of the replies. It is worthwhile mentioning that such a correlation analysis could also deliver a feedback to the team that constructed the original questionnaire by pointing out potential redundancies among the questions.
Our proposed approach to construct a model that properly reflects the general employee attitudes based on the obtained two national samples is to determine a fuzzy signature that adequately describes the OCB features. This also includes the hierarchical interdependencies among the replies and higher-level concepts within the OCB that can be determined by sub-group aggregation. These latter are then reflected by the sub-structures within the FSig. After step-by-step aggregation of the sub-graphs or sub-vectors according to the hierarchical FSig structure, such as, e.g., the one that will be presented in Figure 4, new, more concise descriptors based on higher-level elements of the multicomponent OCB descriptor may be obtained. This happens as a result of executing the fuzzy aggregation operations assigned to the non-terminal nodes. (The FSigs belonging to each response form together a FSig Set (FSigS) over the universe of discourse consisting of all (valid) responding persons.) This FSig models the complex structured problem of employees’ engagement and attitude towards their respective employers via the hierarchically structured FSig:
A = X ,   μ A ,   μ A   :   X Q FSig .
In the next section, two alternative FSig structures will be presented based on the above-mentioned considerations.

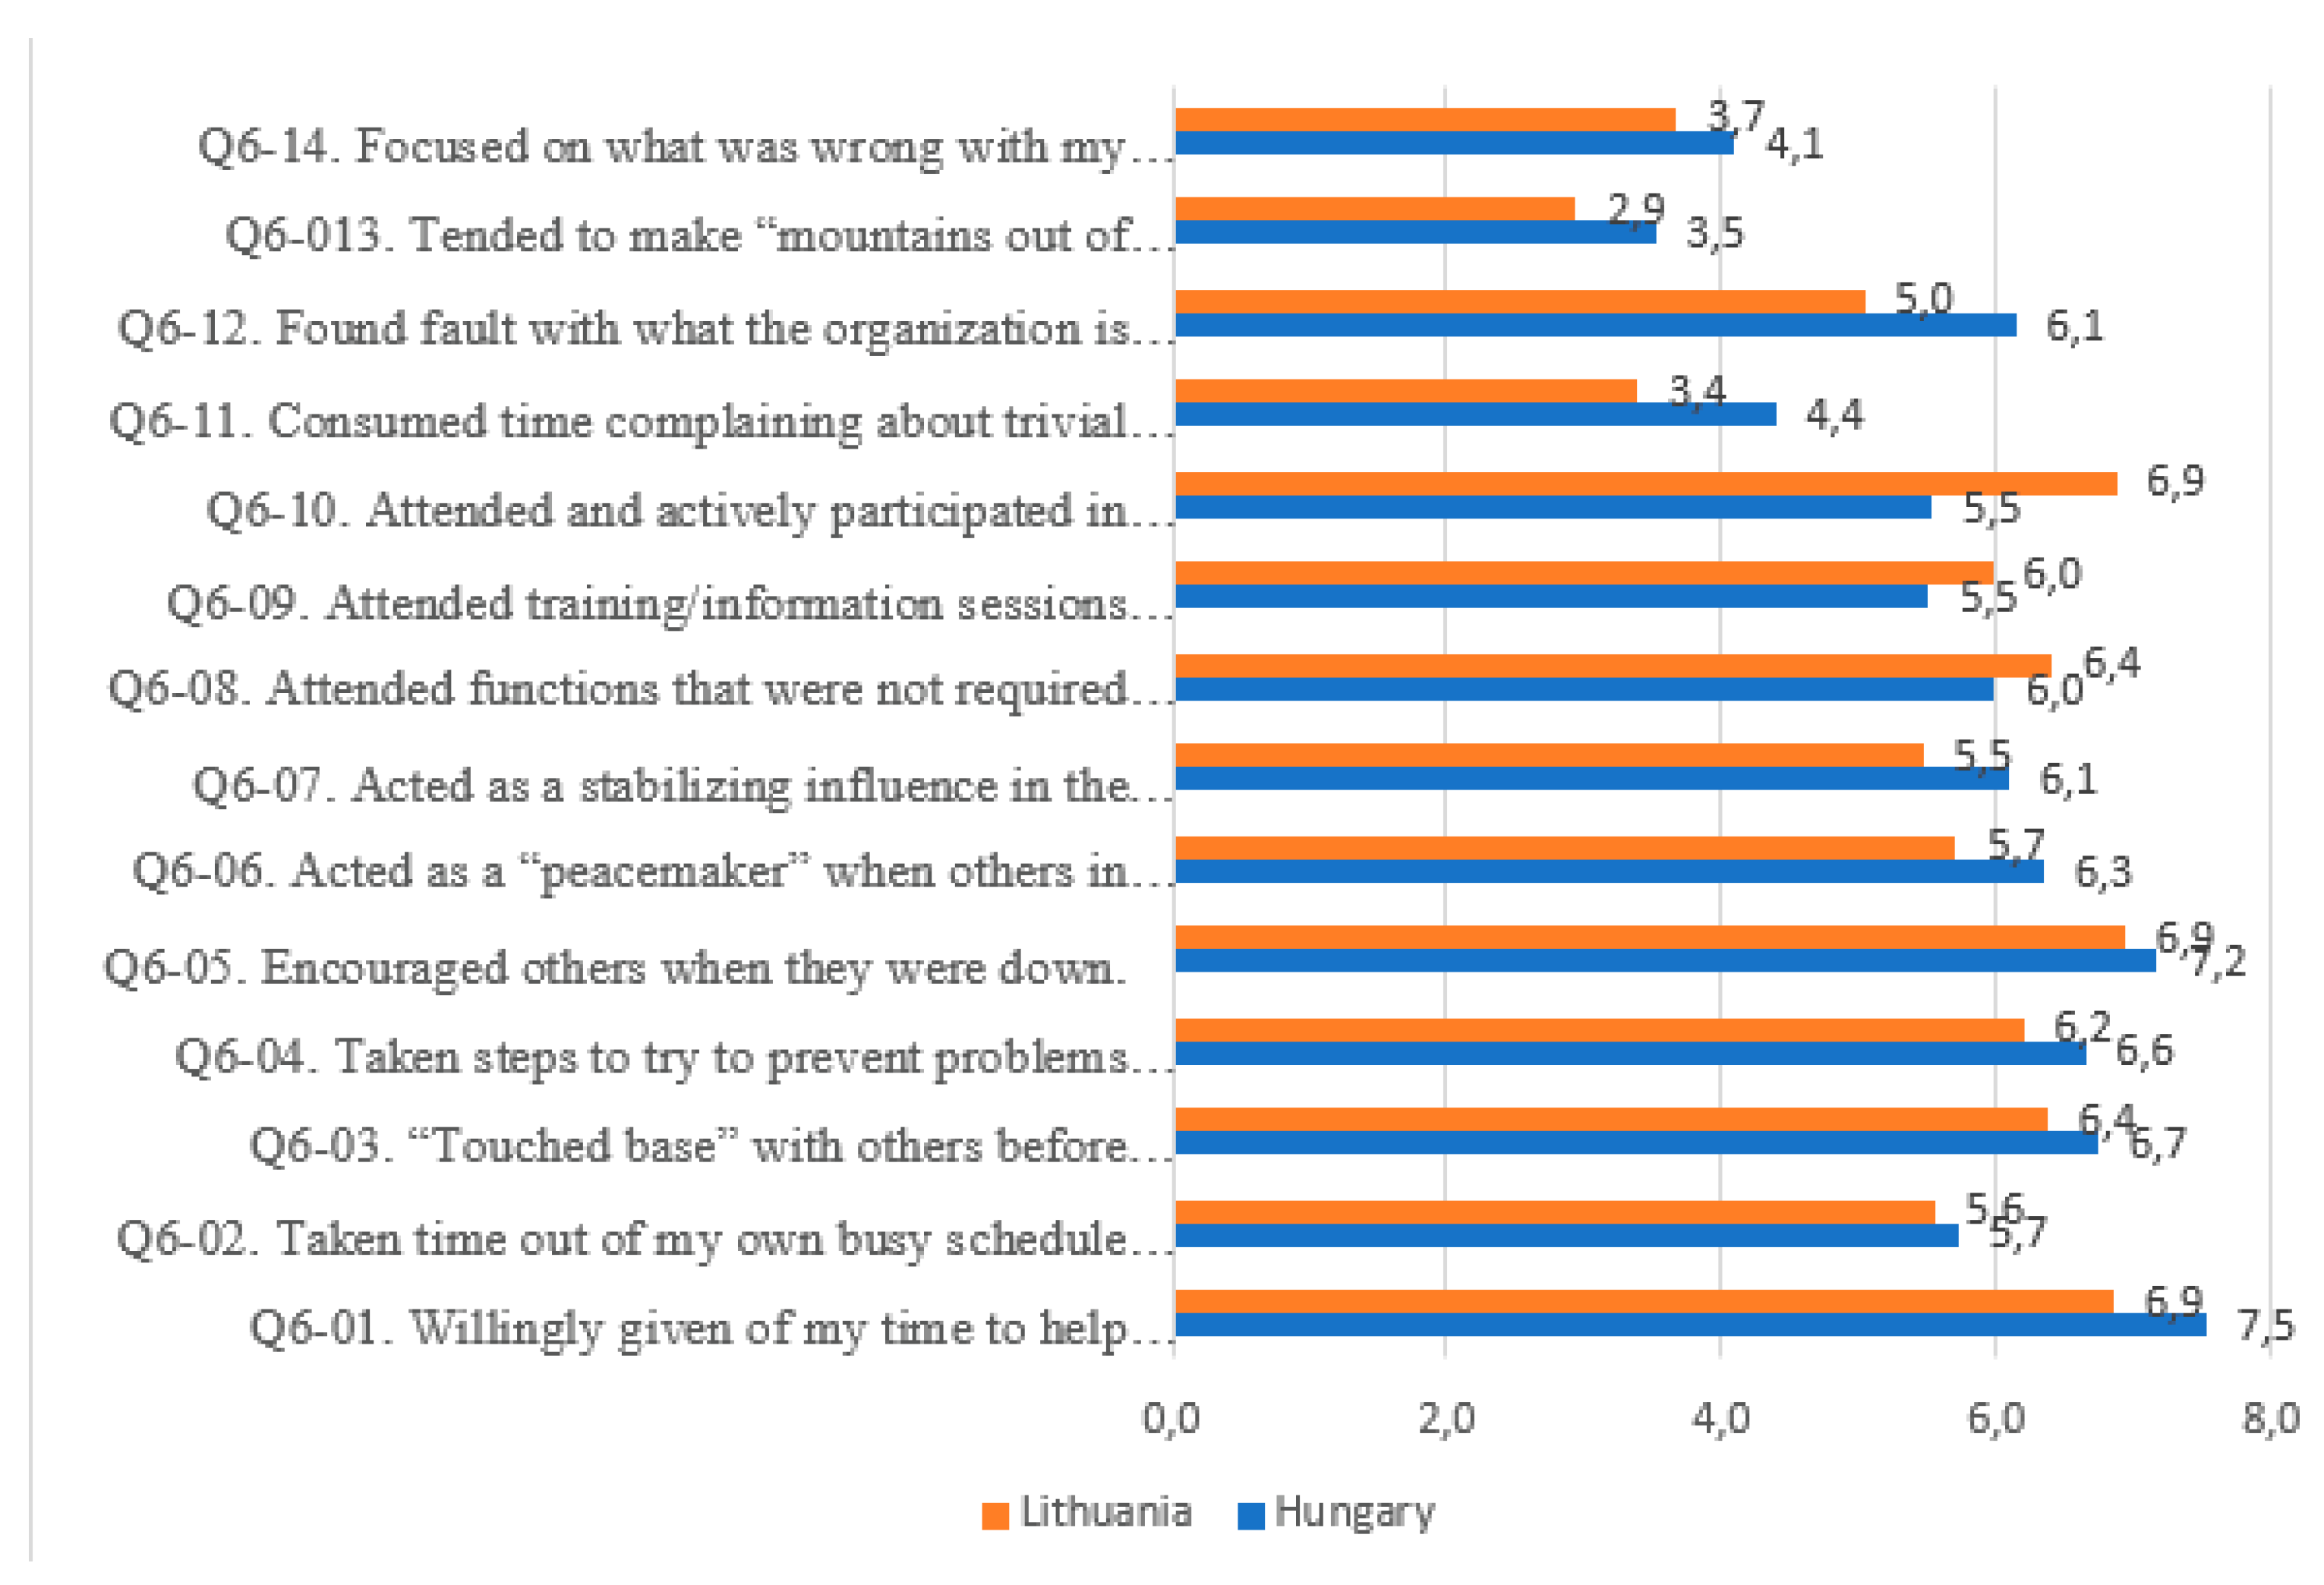
4.3. The Collected OCB vs. CWB Replies and Influential Factors

The following statements refer to the activities in which individuals may choose to engage at work. For the bars to the right of each statement, the average score of responses is given to indicate the degree to which each of the following statements is true about the respondents (see Figure 2).
It can be seen that in Hungary, all average scores of CWB (Q6-11 through Q6-14) are higher than in Lithuania. Moreover, OCB responses to the Q6-01 through Q6-07 in Hungary are higher, while Lithuanians responded with higher average scores to questions Q6-08 through Q6-10.

4.4. Clusters in the Responses

The basic purpose of cluster analysis is to group data, e.g., observation items, into relatively homogeneous groups based on the variables involved in the analysis. Here, the k-means method was used for grouping the respondents [31]. The k-means algorithm assigns each record to the cluster with the least distance from the cluster centre. (Thus, the number of clusters must be determined and specified before the algorithm starts, and this may be done based on expert domain knowledge or a trial-and-error search where the best fit is chosen. There exist some estimation algorithms as well that may be used for more complex data bases.) Each component of the cluster centre is equal to the mean of the corresponding component of the records within the given cluster. The number of clusters was estimated here based on the expert domain knowledge of the participants of the research and the information obtained from the literature cited earlier. For these investigation purposes, a three-cluster solution seemed to be optimal. Hence, we obtained the following clusters of both the Hungarian and Lithuanian data (Table 1).

4.4.1. Cluster 1

Respondents active and committed to the organization and to its staff: This group has the highest average response rates to corporate OCB attitudes. The group members also tend to have relatively low counterproductive features. This is the largest group in both countries.

4.4.2. Cluster 2

Members of this cluster are true corporate citizens who are active and committed to the organization and its staff and sensitive to the problems of others. In addition, however, those belonging to this cluster also showed higher CWB as compared with cluster 1.

4.4.3. Cluster 3

This is a group of medium-active Hungarian employees and passive Lithuanian employees who are not too committed to the organization and its staff. Although the counterproductive behaviours are rather rejected, they are passive, just focusing on the mandatory/expected tasks. This group contains 32% of respondents in Hungary and only 20% of respondents in Lithuania.
The cluster centre variables with scores equal to or higher than 5 in the clusters were:
  • Q6-01 (Willingly given of my time to help co-workers who have work-related problems);
  • Q6-05 (Encouraged others when they were down).

4.5. Correlation Analysis of the Responses

To investigate the relationship of the OCB and CWB attitudes vs. other above-mentioned questionnaire factors, we applied canonical correlation analysis (see Table 2). The canonical correlation method seeks coefficients ai, i = 1, 2, .. n and bj, j = 1, 2, .. m such that it maximizes the pairwise determination coefficient R2 between the linear combinations of
x = a1 x1 + a2 x2+ .. an xn
and
y = b1 y1 + b2 y2 + .. bm ym
of two sets of variables [32].
R = R 2 is called the canonical correlation coefficient between two sets of random variables xi, i = 1, 2, .. n and yj, j = 1, 2, .. m.
It can be seen from Table 2 that the communication styles, personal characteristics, and perception of top management have a medium impact (R ≥ 0.4) on OCB and CWB in both countries. Additionally, the relationship between CWB and communication styles is significantly greater in Lithuania than in Hungary.
The correlation between work experience and engagement (OCB and CWB) is weak in both countries.
Perception of the organization has a significant correlation with OCB, namely R = 0.49 in Lithuania, while in Hungary, the same correlation is weaker: R = 0.38.
The culture of organization does not have much influence on OCB (R = 0.36) and CWB (R = 0.35) in Hungary, while these correlations in Lithuania are quite stronger: R = 0.69 and R = 0.50, respectively.
Perception of career satisfaction has a weak influence on CWB in both countries (R ≤ 0.32), and only in Lithuania does this perception have a medium correlation (R = 0.59) with OCB.
It is worth noting that all above-mentioned factors have less influence on CWB than OCB in both countries except work experience in Hungary.
Finally, age has weak relationships with OCB and CWB in both countries.

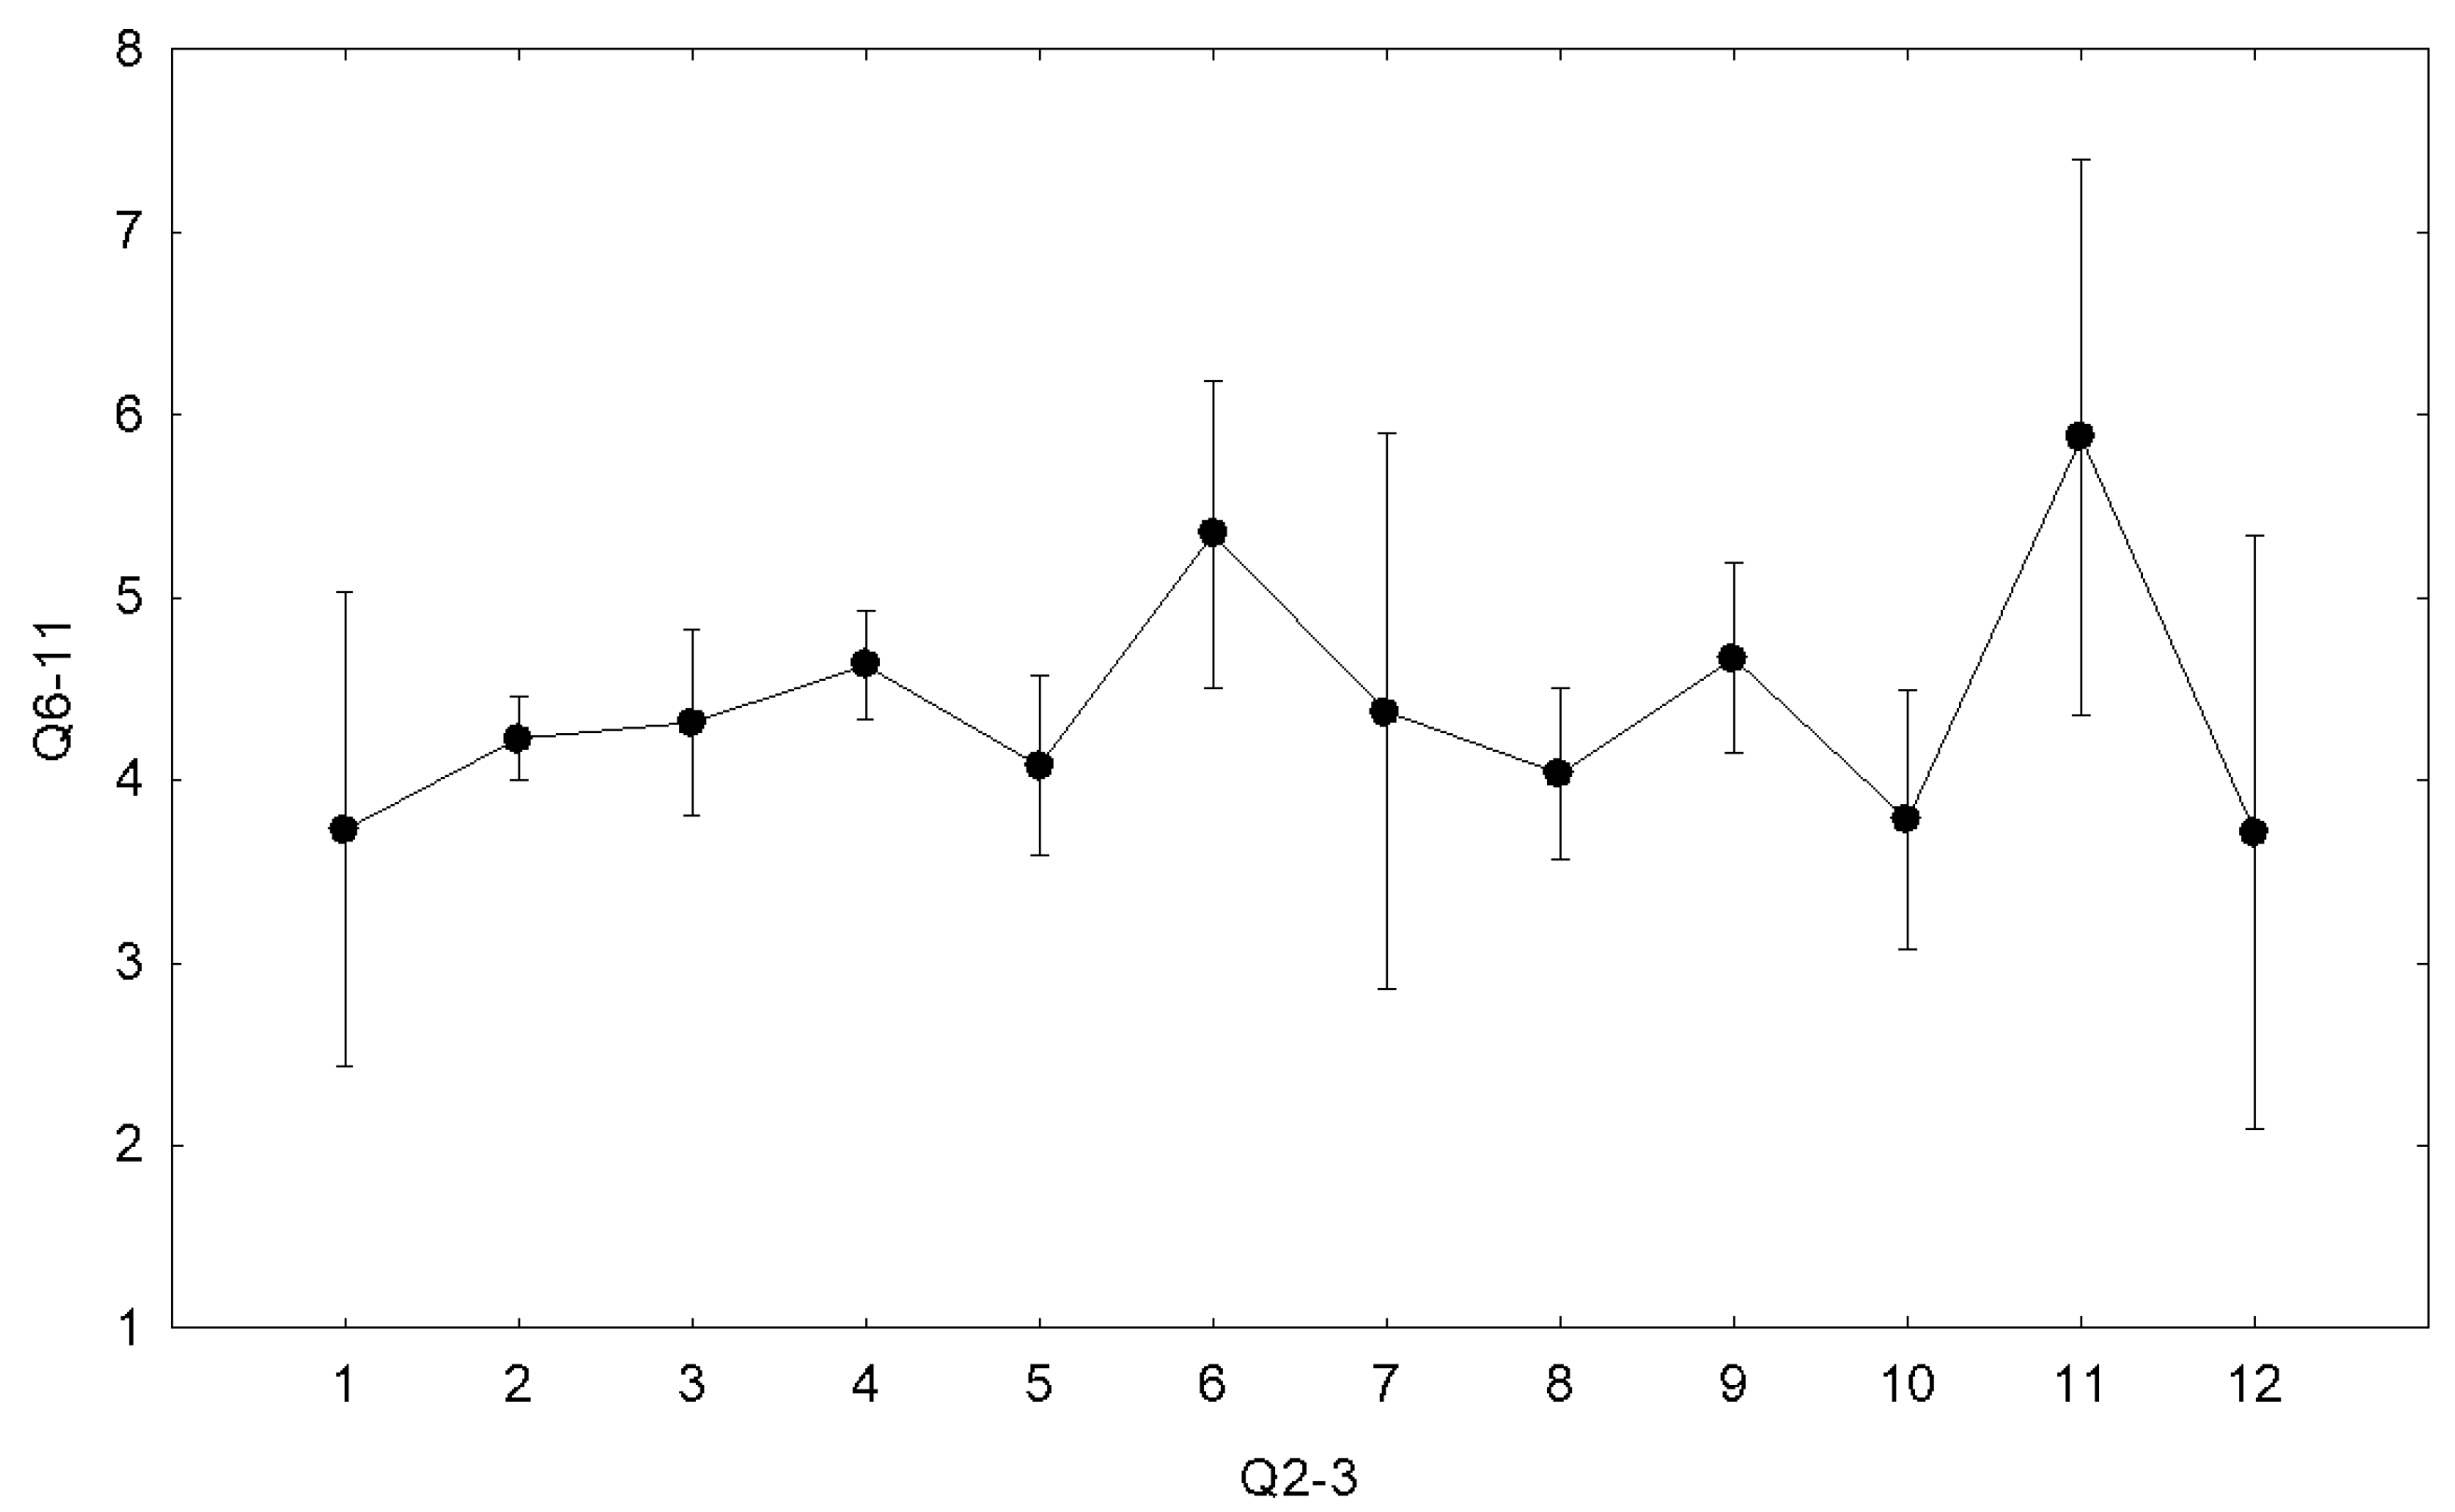
4.6. ANOVA Analysis of the Data

Using analysis of variance (ANOVA), we tested whether the categorical variables “category of the industry” (Q2-03), “size of the company” (Q2-04), “gender composition of the organization” (Q2 05), “gender composition at job level” (Q2-06), “gender composition of people one hierarchical level above” (Q2-07), “gender of the immediate supervisor” (Q2-08), “people more experienced than yourself who have positively influenced your career” (Q2-09), and “gender of the mentor” (Q2-10) had any influence on numerical variables OCB (Q6-01 through Q6-10) and CWB (Q6-11 through Q6-14).
The one-way ANOVA is based on testing the hypothesis
H0: µ1 = µ2 = … = µk
about the equality of the means µ1, µ2, …µk of the subgroups into which the categorical variable splits values of the numerical variables [33]. It should be noted that the alternative hypothesis H0 just states that at least one of these equalities is not satisfied (see Figure 3). This figure shows that the average response to question Q6-11 and its confidence interval are split into 12 subgroups by Q2-3. It can be seen that the 10th subgroup is lower than the average, while the confidence interval in the 11th subgroup is higher. Therefore, H0 does not hold.
For accepting or rejecting the null hypothesis H0, the so-called p-value was used. The lower the p-value, the greater the statistical significance of the difference between subgroups (see Table 3).
It can be seen from the Table that all categorical factors Q2-03 through Q2-10 had an impact on at least one of the OCB and CWB components (Q6-01 through Q6-14) at level p < 0.05 in Hungary.
The Lithuanian case is different from the Hungarian one. Only Q2-05, Q2-06, Q2-07, and Q2-09 had impact on the OCB components, while Q2-03 and Q2-09 had an impact on at least one of the CWB components at level p < 0.05.
Similarly, it was found that the gender influence on OCB (Q6-01 through Q6-10) and CWB (Q6-11 through Q6-14) had an impact at level p < 0.05 on Q6-05 (“Encouraged others when they were down”), Q6-06 (“Acted as a “peacemaker” when others in the organization had disagreements”), Q6-12 (“Found fault with what the organization is doing”), and Q6-14 (“Focused on what was wrong with my situation rather than the positive side of it”) in Hungary. In contrary, in Lithuania, gender had an impact only on Q6-10 (“Attended and actively participated in organizational meetings”) at level p < 0.05.
Based on the results, the structure of the FSigs can be determined, assigning to the same sub-graph the questions showing higher correlation with each other.

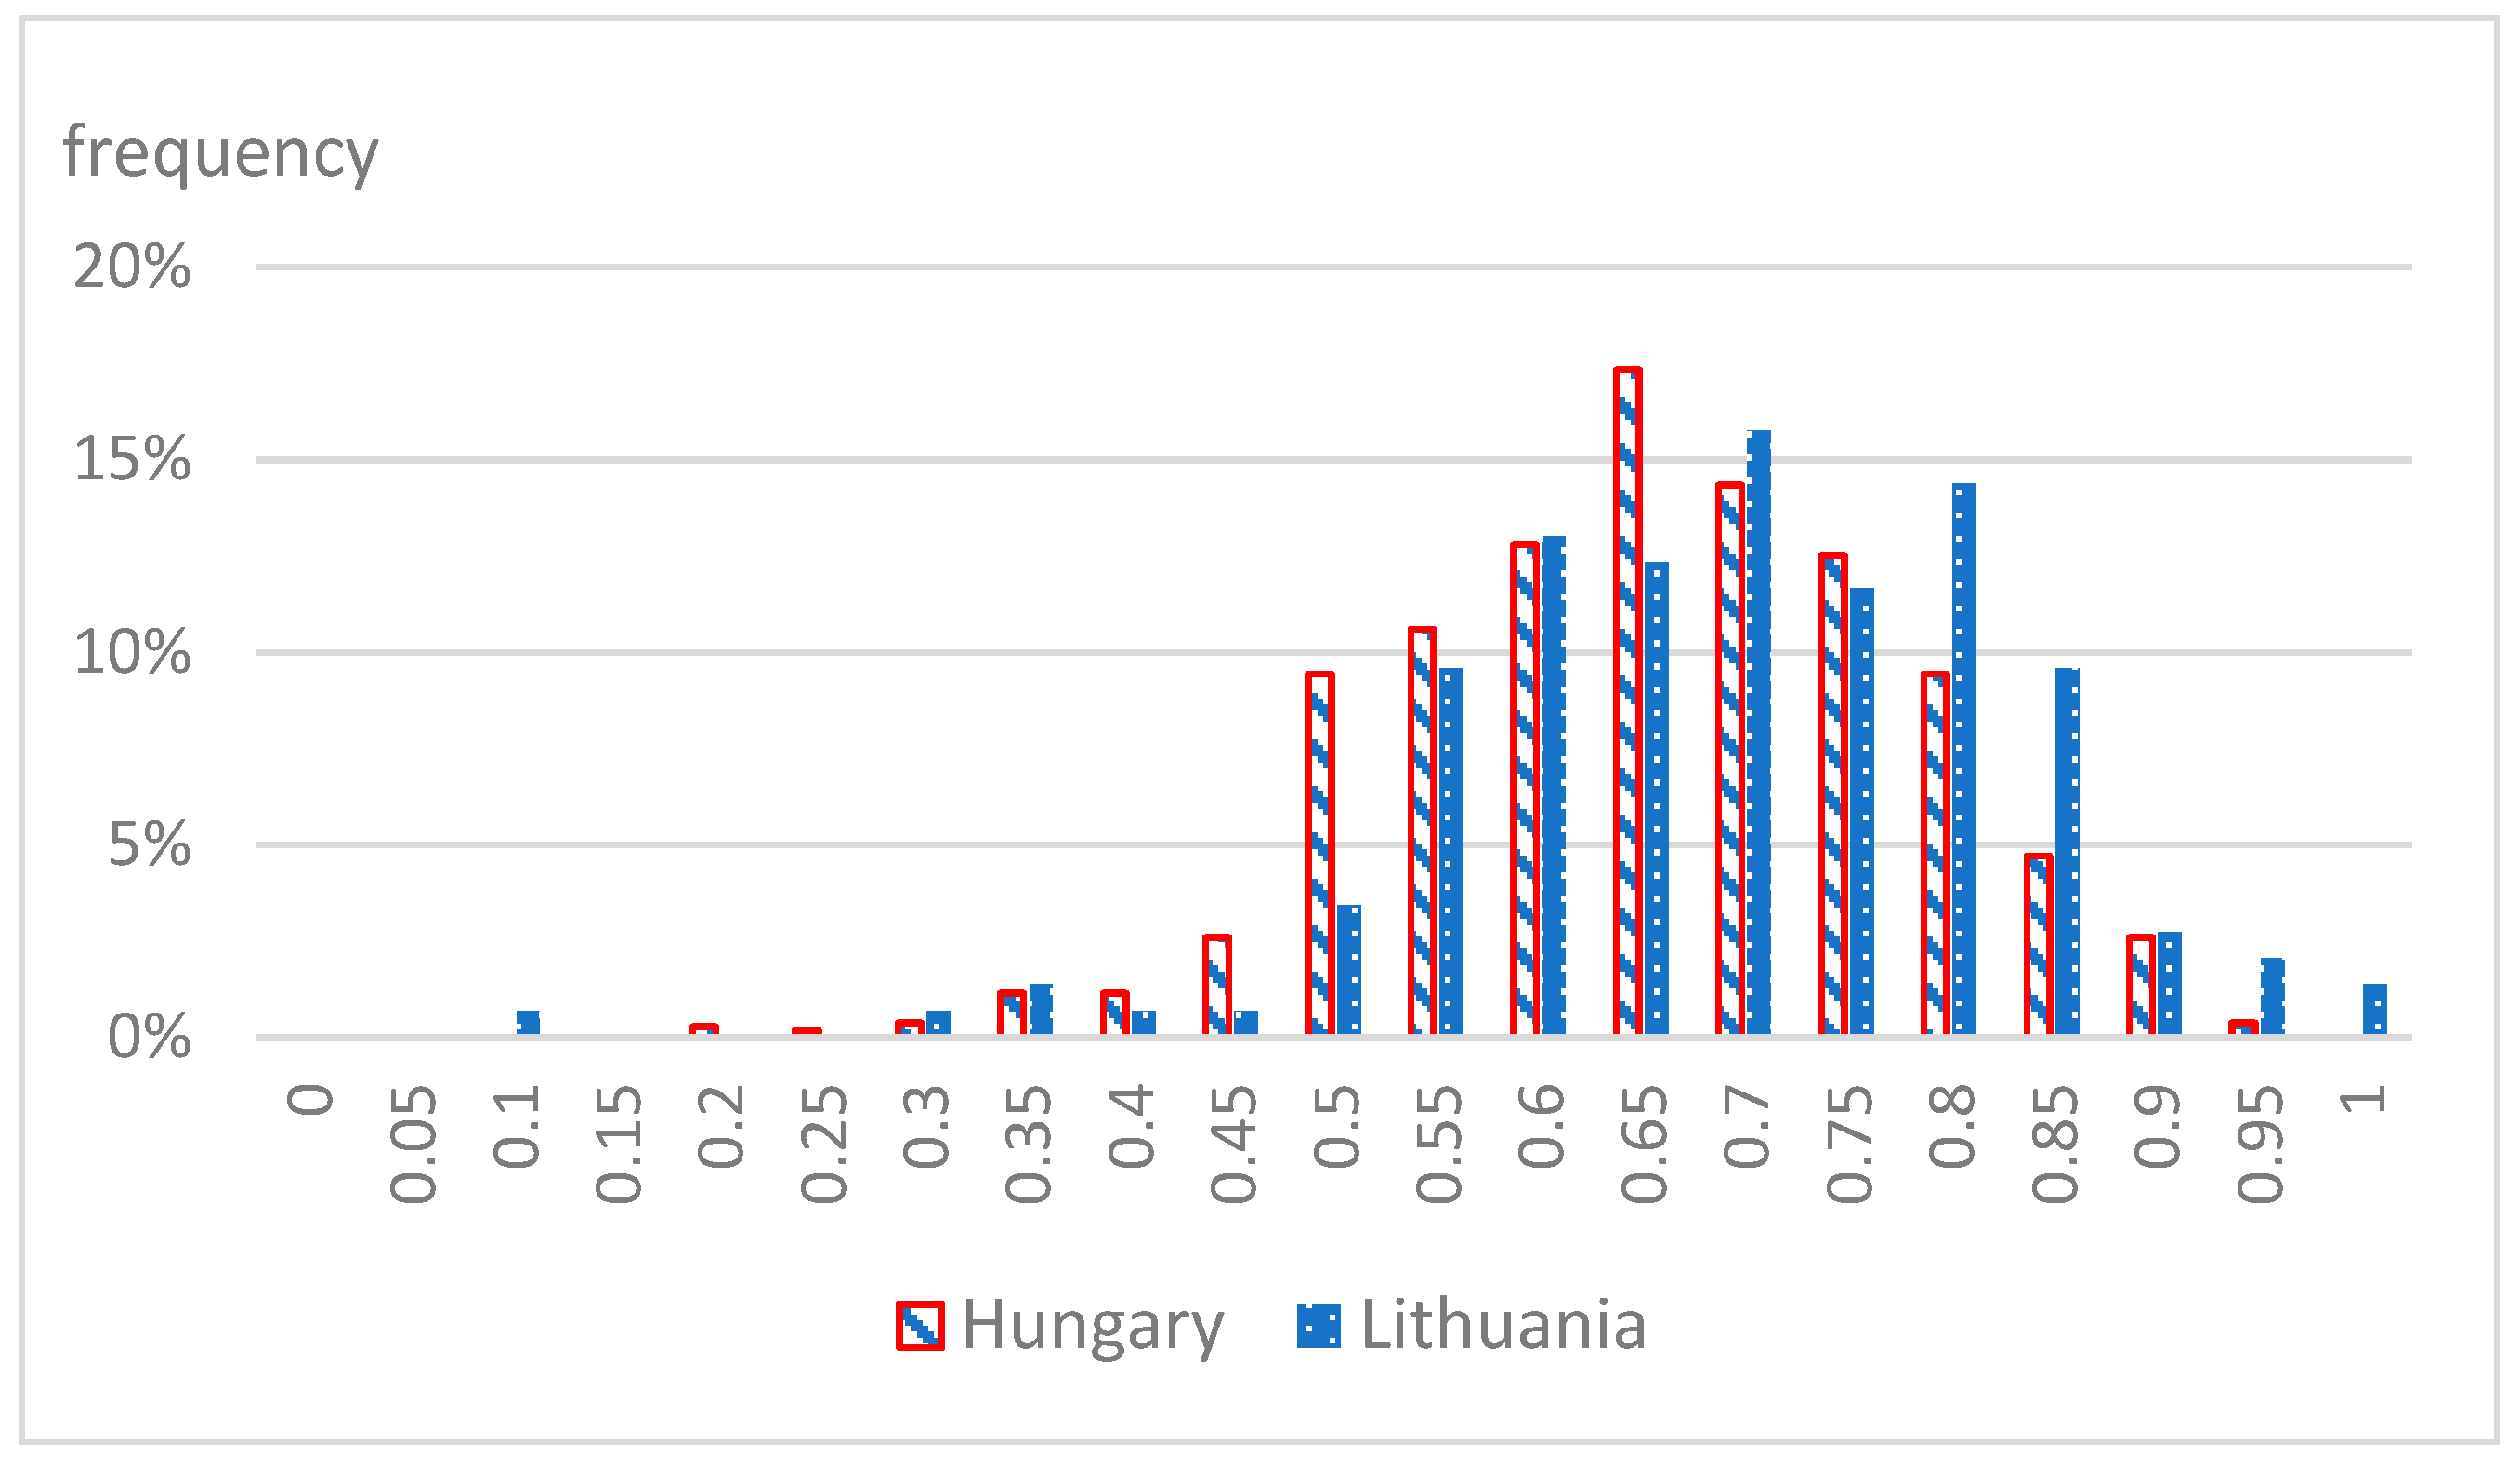
5. Comparison of the Fuzzy Signatures

5.1. Calcuations on the Data

As mentioned before, answers to questions with Likert scores are never precise, as they depend on many subjective factors. In addition, the same question may be understood differently by different people. Therefore, answers are imprecise or, in other words, fuzzy. As mentioned above, Likert scale values must be normalised and transformed into fuzzy membership degrees in the unit interval [0, 1] [9].
As mentioned above, answers Q6-11 through Q6-14, indicating counterproductive behaviour, were transformed into complementary membership degrees of “virtual positive attitudes” using the formulae for calculating f and f′ in Section 4.1 and Section 4.2.
The aim of this section was to develop the fuzzy signatures (see Figure 4) for the Hungarian and Lithuanian responses and to compare the two.
Figure 4 shows the structure that is in accordance both with management theory in general (cf. [34]) and our earlier results in [9]. From the statistics viewpoint, the nodes above Q6-01 through Q6-14 (denoted by Q01 through Q14 in Figure 4) are latent or unobserved variables.
For instance, the node altruism can be considered as a latent factor, which is related to or composed of the factors Q01 and Q02. Thus, Q6-01 and Q6-02 should contain some common feature and should be thus correlated through this common feature.
To analyse correlations between all membership degrees, cross-correlations were calculated for all variables (Table 4 and Table 5).
The correlation coefficients do not contradict the structure given in Figure 4. For instance, the correlation coefficient between Q6-1 and Q6-2 equals 0.4 in the Hungarian and 0.5 in the Lithuanian case, while no other OCB correlation exceeds these values. This indicates that combining Q6-1 and Q6-2 into a single subtree representing a latent factor (called altruism in the literature) is reasonable. Actually, Q6-1 has the same correlation coefficient with Q6-3 and Q6-5 as well in the Hungarian case. This can be explained by the fact that Q6-1 through Q6-10 have a stronger connection or closer relationship indicated by the common features of citizenship behaviour. The same explanation applies to other cross-correlations. A similar potential sub-grouping emerges for the Lithuanian answers.
In the next section, formal factor analysis will be used for identifying the sub-groups in the Q6 series questions. The term factor analysis is used both for exploratory and confirmatory factor analysis, both being tools that enable the identification and evaluation of latent factors based on the correlations between a group of the observed variables. Factor analysis employs various algorithms that give similar but not always identical results.
We used confirmatory factor analysis, as it is recommended when the structure is pre-specified in [35] and confirmed by the results in [9]. At first, the confirmatory factor analysis was applied to variables Q6-01 and Q6 02.
The given parameter estimates mean that
Q6-01 = 0.18 Altruism + δ1
Q6-02 = 0.10 Altruism + δ2
where the two estimation errors are denoted by δ1 and δ2 (cf. [32]).
To find the membership degrees of altruism, we applied the following approach.
Let the membership degrees of two n-dimensional observed variables be denoted by vectors x and y. Furthermore, let us denote the latent factor with factor loadings k1 and k2 by vector f. Then, the components of the above-mentioned vectors are linked by the relationship
xi = k1fi, + δ1, yi = k2fi, + δ2, i = 1, 2, .. n.
Omitting errors δ1 and δ2, we obtain the approximate estimates
x ˜ i = k 1   f i ,   y ˜ i = k 2   f i
To find the values (scores) fi of factor f, we have to find the minimum of the difference between the observed values and their estimates, i.e.,
d = i = 1 n ( x ˜ i x i ) 2 + i = 1 n ( y ˜ i y i ) 2 m i n
Substituting the expressions of x ˜ i and y ˜ i   into   d , we obtain
d = i = 1 n ( k 1 f i x i ) 2 + i = 1 n ( k 2 f i y i ) 2 m i n
Applying the conditions for the minimum of d, we obtain a system of n equations
d/(∂fi) = 0, I = 1, 2, .. n,
which has the solution
fi = p1 xi + p2 yi, I = 1, 2, .. n,
where
p 1   =   k 1 k 1 2 + k 2 2 ,   p 2 = k 2 k 1 2 + k 2 2 .
However, the factor scores fi found this way may not belong to the interval [0, 1] since the sum p1 + p2 is not equal to one.
Therefore, for normalisation, we used the weighted average to find the membership degrees mfi of the latent factor scores fi.
m f i = p 1 x i + p 2 y i p 1 + p 2 = p 1 p 1 + p 2 x i + p 2 p 1 + p 2 y i , i = 1 , 2 , . . n
Applying this algorithm, we obtain the membership degrees (weights) for the aggregation operation generating the membership degree in the root of the sub-group altruism:
Altruism = 0.64Q6-01 + 0.36Q6-02.
This relationship is presented graphically in Figure 5.
Similarly, weights of the weighted mean aggregations in the root nodes of the subtrees courtesy, sportsmanship, civic virtue, and compliance were found. The above-mentioned method was also applied to the complementary semantics questions and corresponding leaves Q11, Q12, Q13, and Q14. The subtree obtained this way is denoted as 1-Counterproductive behaviour in Figure 6 and Figure 7.
The research revealed that the fuzzy signatures obtained by analysing the Hungarian and the Lithuanian responses were more or less similar (cf. Figure 6 and Figure 7). However, there exist also some significant differences. The weight of question Q6-07 (“Acted as a stabilizing influence in the organization when dissension occurs”) equals 0.59 in the Hungarian case and equals only 0.30 in the Lithuanian case. On the other hand, the weight of question Q6-08 (“Attended functions that were not required but which helped the organization’s image”) equals 0.41 for Hungarian responses, while it is 0.70 for the Lithuanian answers. Hence, the structure of the consistence of the civic virtue factor is different in the two countries. Similarly, differences in the structure of compliance also occur between the two national groups of respondents.
Despite these differences, the distribution of the membership degrees for engagement is similar in both countries (see Figure 8). The largest difference here equals 6%.
The average of the engagement membership degrees in the Hungarian responses equals 0.63, and it equals 0.67 in the Lithuanian responses.
Therefore, there is no essential difference in the engagement in work between Hungary and Lithuania. The maximal difference between the frequencies is 6% (Hungary 9% and Lithuania 3%) in the membership degree interval from 0.45 to 0.50.
Additionally, to evaluate the similarities and differences between the typical (average) responses of the two countries, the calculation of the similarity measures leaf by leaf in the two fuzzy signature trees is possible. These similarities were obtained by averaging all replies and applying Formulas (1a) and (1b) of the fuzzy similarity given above in both its implementations, namely (2) and (3), while the variables are replaced by the leaf membership degrees:
Sim A l g m H U ,   m L T   = m H U m L T = m H U m L T + ( 1 m H U ) ( 1 m L T ) m H U m L T ( 1 m H U ) ( 1 m L T )     [ 0 ,   1 ]
and
Sim Z m H U ,   m L T   = max ( min ( m H U ,   m L T ) ,   min ( 1     m H U ,   1     m L T ) )     [ 0 ,   1 ]
where mHU is the average membership degree of the leaf containing the Hungarian answers, and mLT is the average of the Lithuanian answers.
For instance, the average membership degree of Hungarian answers to the question Q01 equals to 0.82, while the membership degree of the Lithuanian answers to Q01 is 0.73.
The application of the above formulas yields
Sim A l g m H U ,   m L T = 0.82 × 0.73 + ( 1 0.82 ) ( 1 0.73 ) 0.82 × 0.73 ( 1 0.82 ) ( 1 0.73 ) = 0.62 ,
SimZ m H U ,   m L T = max ( min ( 0.82 ,   0.73 ) ,   min ( 1 0.82 ,   1 0.73 ) ) = 0.73 .
The similarity SimZ = 0.73 is rather close to 1 and is quite significant. The other formula is based on strictly monotonic norms, and because of that, it cannot be compared with the result of the corresponding max–min formula. Indeed, the results obtained by the algebraic formulas are always closer to the degree of indifference (or full uncertainty), i.e., 0.5, and thus, algebraic similarity measures of partially similar degrees should be always less than in the other case; 0.62 > 0.5, and thus, it reflects the presence of similarity. This difference corresponds to the philosophical fact that uncertain values combined lead to even more uncertain results (a well-known principle in mechanical engineering tolerance calculations). Because of this, algebraic similarity degrees should be evaluated in comparison with each other.
On the other hand, if. for instance, we have very different membership degrees such as 0.1 and 0.8, both formulas would show clear dissimilarity:
Sim A l g 0.1 ,   0.8 = 0.1   ×   0.8 + ( 1 0.1 ) ( 1 0.8 ) 0.1   ×   0.8 ( 1 0.1 ) ( 1 0.8 ) = 0.25 ,
SimZ(0.1, 0.8) = max(min(0.1, 0.8), min(1 − 0.1, 1 − 0.8)) = 0.20.
Here, the rule mentioned above is illustrated again: two dissimilar degrees are evaluated by low membership; however, dissimilarity is just as uncertain as similarity, and thus, the algebraic version yields a higher value (closer to 0.5).
The similarity measures for each leaf of the signature tree were calculated, and the results are given in Figure 9.

5.2. Some Evaluation Remarks

Values where SimZ or SimAlg > 0.5 in Figure 9 indicate existing (maybe slight) similarity of the overall pool of answers belonging to the respective subtree (in extreme case, a single leaf) of the given node. In the results, application of the SimZ measure shows more values above 0.5, and for all questions Q01 through Q14, this value exceeds the neutral degree at the leaves. Q01 and Q05 show very good similarities, even being > 0.7. All aggregated (verbally labelled) subtrees also have greater than 0.5 but only the components of citizenship behaviour except compliance are above 0.6, while none exceeds 0.7, which is similar to the case of aggregated citizenship behaviour. The root overall value that describes the general attitude of the employees’ average is similarly less than 0.7 even in the weaker SimZ form. None of these are < 0.5, which means that the application of the SimZ measure did not reveal any direct dissimilarity between the Hungarian and the Lithuanian employees’ attitudes.
The SimAlg measure, on the other hand, shows a more interesting set of results. It approves this similarity of the two answer pools only for Q01, Q03, Q04, Q05, and Q13 and further for the sub-sets altruism, courtesy, sportsmanship. and citizenship behaviour. As it was mentioned above, values where SimZ < 0.5 indicate dissimilarity, and such is the case for Q11, Q12, Q14, Q02, Q06…Q10, counterproductive behaviour, civic virtue, and compliance and the overall root degree as well. For citizenship behaviour, the result is just 0.5, meaning in this case “No decision on similarity can be made”. However, all values around the neutral degree 0.5 have generally a similar interpretation. Using this measure, only Q01 and Q05 may be determined as really having a certain similarity when applying this measure. Q01 and Q05 show really interesting similarity in this measure; all the others are close to “No real decision is possible”. Comparison with expert evaluation and a more detailed mathematical comparison (see below) could reveal further facts.
As it could be seen, the less “drastic” min–max (Zadeh style) measure revealed much more similarity between the two populations. From the point of view of the similarity measures, it can be concluded that the two implementations may result in different semantic interpretations.
Of course, further implementations of (1b) may bring further recognitions in the future. It also seems a good direction to continue these investigations on the whole populations rather than on the averages only. If both histograms are compared value for value according to the transformed Likert scale values, the similarities of the two populations may be described in a more informative way, showing where within the answers the highest matches and the greatest differences occur. At present, the size of the available statistical populations is quite different, so this investigation did not seem reasonable. We hope to obtain more Lithuanian answers to more closely approach the number of the Hungarian ones, and then, the similarity measures between the two histograms will also be feasible and meaningful.
Comparing the influential factors of employee engagement from the two countries’ perspective, the study provides insights into understanding employee engagement factors relating them to the country’s specifics, in our case, national and organizational cultures. Therefore, the managerial implications are related to a better understanding of the importance of culture on employee engagement, which is critical in supporting the decision-making process, especially at international companies.
It should be stressed that these results represent a small contribution only to the management science aspects of the case study. However, they may be further investigated in a wider management context, e.g., when personnel mobility is analysed, which is definitely connected with the employee attitudes. (For this area, see, e.g., [36].)

6. Discussion and Conclusions

In this paper, twofold results have been presented, the main novelty being the introduction of a new fuzzy similarity measure that could be easily extended to similarity of fuzzy signatures as well and the analysis of employee attitude data, which were collected in two regions (Győr in Hungary and Panvezys in Lithuania).
The first and main result is the presentation of an inherently fuzzy similarity measure that differs from the earlier generally accepted fuzzy similarity measures with hidden crisp semantics (expressed by property (S3) in reference [10]). The new family of measures is based on the rather intuitive semantic assumption that no certain statements can be deducted from uncertain premises; i.e., two fuzzy degrees with equal value may express different realities, and thus, their similarity may be limited. We showed by two different implementations of this measure that, indeed, crisp results may be only obtained for crisp arguments and also that, depending on the chosen pair of t-norm and s-norm, the degree of similarity may be even less than the degree of uncertainty in the objects compared. (This also excludes transitivity in any sense.)
Further, we showed that the similarity measure family proposed could be easily extended to fuzzy signatures independently from the structure and the depth of the structure of the FSigs.
The new fuzzy similarity measure class thus proposed was based on the extension of the minimal form of the Boolean equivalence relationship in a rather straightforward and intuitive way. This class was then extended to fuzzy signatures (multicomponent hierarchical fuzzy descriptors). The two proposed implementations were based on the classical max–min norms originally proposed by Zadeh on one hand, while the other one was based on the algebraic norms, the most popular and simplest representations of the Hamacher norm. After having been defined, these two norms were implemented and tested for a real-life problem example. An infinite number of further members of this family can be similarly defined, and future research may show which of them is more suitable in what context.
To summarise the real-life example, first, a model recently proposed by the authors for fuzzifying questionnaires was presented, where the Likert scale responses to the questions in an internationally widely applied standard questionnaire were transformed linearly to fuzzy membership degrees. In this questionnaire, employee replies to various groups of questions concerning their attitudes towards their respective companies were collected in two regions of the two countries Hungary and Lithuania.
Some of these attitudes represent positive and some negative tendencies of behaviour. The Likert scale values were transformed directly in the case of positive factors (OCB), and in complemented form in the negative cases (CWB). By applying correlation calculation and factor analysis, sub-groups in the set of questions were identified, and based on them, the structure of the fuzzy signature representing the subset of the questions under investigation (Q6) was determined. In the next section, an analysis of the Q6 question sub-group in connection with replies to other subsets of questions was carried out.
By exploring the model using samples of data from both Hungarian and Lithuanian firms, we found that these correlations between the Q6 section and other section responses, represented by the average values, in Hungary and Lithuania were significantly different. Perception of the organization had a significant correlation with the OCB group, namely with correlation coefficient R = 0.49 in Lithuania, while in Hungary, the same correlation was only R = 0.38, i.e., slightly weaker. On the other hand, the culture of the organization greatly influenced neither the OCB (R = 0.36) nor the CWB (R = 0.35) value groups in the data coming from Hungary, while these correlations in Lithuania were somewhat stronger: R = 0.69 and R = 0.50. Perception of career satisfaction had a weak influence (R ≤ 0.35) on CWB in both countries, and only in Lithuania did this perception have a medium correlation (R = 0.59) with the OCB sub-group. The gender composition of the employees had an impact on several factors of engagement in Hungary, while it only had an impact on one single component of engagement in Lithuania.
The composition of the signatures revealed differences in the structure of the intermediate nodes between the two countries. Nevertheless, the final node engagement in work had no essential differences in the distribution of membership degrees in Hungary and Lithuania. It is worthwhile continuing this research towards revealing the effects of these differences on the employee culture, mobility, etc., and how they may be used for improving the management quality in companies.
In the next section, the average attitudes were calculated for each of the questions separately for the two populations, and then, the two versions of the novel similarity measures were both applied separately for comparison. It should be stressed that in this case, values further away from 0.5 indicate similarity or dissimilarity, namely S > 0.5 means similarity, with the closer S is to 1, the higher the former, while S < 0.5 means the higher dissimilarity occurs the closer S is to 0.
From the mathematical point of view, it was presented that the strictly monotonic (except in 0 and 1) algebraic measure showed a fast tendency of getting closer to 0.5. The conclusion can be drawn that the min–max-based similarity measure is easier to handle, while the algebraic one more intensively points out real, deep similarity or the lack of any articulated similarity/dissimilarity.
From the management point of view, based on the results of the analysis, it can be considered proven that the differences in the national company cultures are reflected in the employees’ engagement. All these differences have to be taken into consideration in managing diversity in the cultures in company organisations.

Author Contributions

Conceptualization, D.S. and M.K.S.; methodology, O.P. and L.T.K.; validation, O.P. and L.T.K.; formal analysis, O.P. and L.T.K.; resources, D.S. and M.K.S.; data curation, O.P.; writing—original draft preparation, D.S. and O.P.; writing—review and editing, M.K.S.; visualization, O.P.; final review and editing, supervision, L.T.K. The authors declare that they all have read and agreed to the published version of the manuscript. Authorship is limited to those who have contributed substantially to the work reported. All authors have read and agreed to the published version of the manuscript.

Funding

The first author acknowledges the support given by National Research, Development, and Innovation Office. (NKFIH), grant no. K108405.

Informed Consent Statement

Informed consent was obtained from all subjects involved in the study.

Data Availability Statement

Data supporting reported results can be found in the authors’ PCs; there are not publicly archived datasets.

Conflicts of Interest

The authors declare no conflict of interest.

Appendix A

(Questions 6.1–6.14) OCB—CWB
INSTRUCTIONS: The following statements refer to activities in which individuals may choose to engage at work. Please indicate the extent to which you have personally engaged in the following activities.
In the space before each statement, write the number (1, 2, 3, 4, 5, 6, 7, 8, or 9) to indicate the degree to which each of the following statements is true about you. When responding, please try to use the full range of numbers on this scale (1 to 9). There are no right or wrong answers to these questions.
  • Willingly given of my time to help co-workers who have work-related problems.
  • Taken time out of my own busy schedule to help with recruiting or training new employees.
  • “Touched base” with others before initiating actions that might affect them.
  • Taken steps to try to prevent problems with co-workers and any other personnel in the organization.
  • Encouraged others when they were down.
  • Acted as a “peacemaker” when others in the organization have disagreements.
  • Acted as a stabilizing influence in the organization when dissention occurs.
  • Attended functions that were not required but which helped the organization’s image.
  • Attended training/information sessions that employees were encouraged but not required to attend.
  • Attended and actively participated in organizational meetings.
  • Consumed time complaining about trivial matters.
  • Found fault with what the organization is doing.
  • Tended to make “mountains out of molehills” (make problems bigger than they are).
  • Focused on what was wrong with my situation rather than the positive side of it.

References

  1. Zadeh, L.A. Fuzzy sets. Inf. Control. 1965, 8, 338–353. [Google Scholar] [CrossRef]
  2. Kóczy, L.T.; Hajnal, M. Texture analysis by vector valued fuzzy sets. In BUSEFAL—Bulletin for Studies and Exchanges on Fuzziness and Its Applications; BUSEFAL: Toulouse, France, 1980; pp. 79–94. [Google Scholar]
  3. Vámos, T.; Bíró, G.; Kóczy, L.T. Fuzzy signatures. SIC-Eurofuse 1999, 99, 210–217. [Google Scholar]
  4. Wong, K.W.; Chong, A.; Gedeon, T.D.; Koczy, L.T.; Vamos, T. Hierarchical Fuzzy Signature Structure for Complex Structured Data. In Proceedings of the ISCIII 2003 International Symposium on Computational Intelligence and Intelligent Informatics; Institute of Electrical and Electronics Engineers (IEEE): New York, NY, USA, 2003; pp. 105–109. [Google Scholar]
  5. Pozna, C.; Minculete, N.; Precup, R.E.; Kóczy, L.T.; Ballagi, Á. Signatures: Definitions, operators and applications to fuzzy modelling. Fuzzy Sets Syst. 2012, 201, 86–104. [Google Scholar] [CrossRef]
  6. Mendis, B.S.U.; Gedeon, T.D.; Koczy, L.T. Flexibility and Robustness of Hierarchical Fuzzy Signature Structures with Perturbed Input Data. In Proceedings of the International Conference of Information Processing and Management of Uncertainty in Knowledge Based Systems (IPMU), Paris, France, 2–7 July 2006; pp. 2552–2559. [Google Scholar]
  7. Kóczy, L.T.; Cornejo, M.E.; Medina, J. Algebraic structure of fuzzy signatures. Fuzzy Sets Syst. 2021, 418, 25–50. [Google Scholar] [CrossRef]
  8. University Fellows International Research Consortium. Available online: https://www.fea.usp.br/en/ufirc-university-fellows-international-research-consortium (accessed on 4 July 2022).
  9. Kóczy, L.T.; Susniene, D.; Purvinis, O.; Zostautiene, D. Analyzing employee behavior related questionnaires by combined fuzzy signature model. Fuzzy Sets Syst. 2020, 395, 254–272. [Google Scholar] [CrossRef]
  10. Ali, M.I.; Feng, F.; Shabir, M. A note on (Î, Î Ú q)-fuzzy equivalence relations and indistinguishability operators. Hacet. J. Math. Stat. 2011, 40, 383–400. [Google Scholar]
  11. Peng, X. New similarity measure and distance measure for Pythagorean fuzzy set. Complex Intell. Syst. 2019, 5, 101–111. [Google Scholar] [CrossRef]
  12. Rödder, W. On “and” and “or” Connectives in Fuzzy Set Theory; Arbeitsbericht 75/07; Institut für Wirtschaftswissenschaften, RWTH Aachen: Aachen, Germany, 1975. [Google Scholar]
  13. Hamacher, H. Uber logische Verknunpfungenn unscharfer Aussagen und deren Zugenhorige Bewertungsfunktione. In Progress in Cybernatics and Sytems Research; Trappl, R., Klir, G.J., Riccardi, L., Eds.; Hemisphere: Washington, DC, USA, 1978; Volume 3, pp. 276–288. [Google Scholar]
  14. Donia, M.B.L.; Tetrault-Sirsly, C.A. Determinants and consequences of employee attributions of corporate social responsibility as substantive or symbolic. Eur. Manag. J. 2016, 34, 232–242. [Google Scholar] [CrossRef]
  15. Ariani, D.W. The Relationship between Employee Engagement, Organizational Citizenship Behavior, and Counterproductive Work Behavior. Int. J. Bus. Adm. 2013, 4, 46–56. [Google Scholar] [CrossRef]
  16. Podsakoff, N.P.; Blume, B.D.; Whiting, S.W.; Podsakoff, P.M. Individual- and organizational-level consequences of organizational citizenship behaviors: A meta-analysis. J. Appl. Psychol. 2009, 94, 22–141. [Google Scholar] [CrossRef]
  17. Podsakoff, N.P.; Whiting, S.; Podsakoff, P.M.; Mishra, P. Effects of organizational citizenship behaviors on selection decisions in employment interviews. J. Appl. Psychol. 2011, 96, 310–326. [Google Scholar] [CrossRef]
  18. Organ, D.W.; Podsakoff, P.M.; MacKenzie, S.P. Organizational Citizenship Behavior: Its Nature, Antecedents, and Consequences; Sage Publications: London, UK, 2006. [Google Scholar]
  19. Nielsen, T.M.; Hrivnak, G.A.; Shaw, M. Organizational citizenship behavior and performance: A meta-analysis of group-level research. Small Group Res. 2009, 40, 555–577. [Google Scholar] [CrossRef]
  20. Kahn, W.A. Psychological Conditions of Personal Engagement and Disengagement at Work. Acad. Manag. J. 1990, 33, 692–724. [Google Scholar]
  21. Konovsky, M.A.; Organ, D.W. Dispositional and contextual determinants of organizational citizenship behaviour. J. Organ. Behav. 1996, 17, 253–266. [Google Scholar] [CrossRef]
  22. Ellis, C.M.; Sorensen, A. Assessing Employee Engagement: The Key to Improving Productivity. Perspectives 2007, 15, 1–9. [Google Scholar]
  23. Bakker, A.B.; Demerouti, E. The Job Demands-Resources model: State of the art. J. Manag. Psychol. 2007, 22, 309–328. [Google Scholar] [CrossRef]
  24. Markos, S.; Sridevi, M.S. Employee engagement: The key to improving performance. Int. J. Bus. Manag. 2010, 5, 89–95. [Google Scholar] [CrossRef]
  25. Purvanova, R.K.; Bono, J.E.; Dzieweczynski, J. Transformational Leadership, Job Characteristics, and Organizational Citizenship Performance. Hum. Perform. 2006, 19, 1–22. [Google Scholar] [CrossRef]
  26. Piccolo, R.F.; Colquitt, J.A. Transformational Leadership and Job Behaviors: The Mediating Role of Core Job Characteristics. Acad. Manag. J. 2006, 49, 327–340. [Google Scholar] [CrossRef]
  27. Rich, B.L.; Lepine, J.A.; Crawford, E. Job Engagement: Antecedents and Effects on Job Performance. Acad. Manag. J. 2010, 53, 617–635. [Google Scholar] [CrossRef]
  28. Sackett, P.R.; Berry, C.M.; Wiemann, S.A.; Laczo, R.M. Citizenship and Counterproductive Behaviour: Clarifying Relations between the Two Domains. Hum. Perform. 2006, 19, 441–464. [Google Scholar] [CrossRef]
  29. Goguen, J.A. L-Fuzzy Sets. J. Math. Anal. Appl. 1967, 18, 145–174. [Google Scholar] [CrossRef]
  30. Birkhoff, G.D.; Bartee, T.C. Modern Applied Algebra. In Applied Multivariate Statistical Analysis, 5th ed.; Härdle, W.K., Simar, L., Eds.; McGraw-Hill: New York, NY, USA, 1970; Volume 431, p. 32. [Google Scholar]
  31. Chander, B. Clustering and Bayesian Networks. In Handbook on Research on Big Data Clustering and Machine Learning; IGI Global: Hershey, PA, USA, 2020; pp. 50–73. [Google Scholar]
  32. Härdle, W.K.; Simar, L. Applied Multivariate Statistical Analysis, 5th ed.; Springer: Upper Saddle River, NJ, USA, 2019. [Google Scholar]
  33. Paolella, M.S. Linear Models and Time-Series Analysis: Regression, ANOVA, ARMA and GARCH; John Wiley & Sons: Hoboken, NJ, USA, 2019. [Google Scholar]
  34. Loehlin, J.C.; Beaujean, A.A. Latent Variable Models. An Introduction to Factor, Path, and Structural Equation Analysis, 5th ed.; Routledge: London, UK, 2017. [Google Scholar]
  35. Brown, T.A. Confirmatory Factor Analysis for Applied Research, 2nd ed.; Guilford Press: New York, NY, USA, 2015. [Google Scholar]
  36. Aksyonov, K.; Bykov, E.; Dorosinskiy, L.; Smoliy, E.; Aksyonova, O.; Antonova, A.; Spitsina, I. Decision Support Systems Application to Business Pro cesses at Enterprises in Russia, Multidisciplinary Domains. In Efficient Decision Support Systems-Practice and Challenges in Multidisciplinary Domains; Jao, C., Ed.; IntechOpen: London, UK, 2011; pp. 83–108. [Google Scholar]
Figure 1. Conceptual model of interlinked factors.
Mathematics 10 02923 g001
Figure 2. Average responses to the section Q6 questions about OCB and CWB (see Appendix A).
Mathematics 10 02923 g002
Figure 3. The values belonging to Q6-11 are split into 12 subgroups by Q2-3. Means are denoted by points and confidence intervals by bars.
Mathematics 10 02923 g003
Figure 4. Fuzzy signature structure according to [9].
Mathematics 10 02923 g004
Figure 5. The subtree altruism.
Mathematics 10 02923 g005
Figure 6. Fuzzy signature of the Hungarian responses.
Mathematics 10 02923 g006
Figure 7. Fuzzy signature of the Lithuanian responses.
Mathematics 10 02923 g007
Figure 8. Histogram of the membership degrees assigned to engagement.
Mathematics 10 02923 g008
Figure 9. Complex fuzzy signature containing the calculated similarity measures of Hungarian and Lithuanian answers. Denotations: H is average of the Hungarian membership degrees, L is the average of the Lithuanian ones, z is the similarity measure calculated by SimZ, and a is the similarity measure obtained by SimAlg.
Mathematics 10 02923 g009
Table 1. Comparison of clusters.
QuestionsHungaryLithuania
Cluster-1
380-Records
Cluster 2 329-Records:Cluster 3 329-Records:Cluster 1 60-RecordsCluster 2 57-Records-Cluster 3 30-Records
Q6-017.97.86.87.86.95.0
Q6-026.56.44.26.46.22.7
Q6-037.27.15.87.26.74.0
Q6-047.27.05.67.06.63.8
Q6-057.97.66.07.67.15.2
Q6-06:7.36.75.06.66.13.1
Q6-076.96.54.76.26.12.9
Q6-086.97.14.07.36.34.8
Q6-096.56.33.67.06.13.8
Q6-106.36.63.57.76.95.0
Q6-114.06.03.22.15.61.8
Q6-125.37.16.15.06.42.6
Q6-132.25.33.21.84.71.9
Q6-142.45.94.22.65.32.8
Table 2. Canonical correlations among the responses.
Groups of FactorsHungaryLithuania
OCB
(Q6-01 through Q6-10)
CWB
(Q6-11 through Q6-14)
OCB
(Q6-01 through Q6-10)
CWB
(Q6-11 through Q6-14)
Communication styles
(Q1-01 through Q1-23)
0.640.400.690.59
Work experience
(Q2-01, Q2-02)
0.180.220.390.30
Personal characteristics
(Q3-01 through Q3-20)
0.640.340.670.59
Perception of the organization
(Q4a-01 through Q4a-7)
0.380.200.490.33
Perception of top management
(Q4b-01 through Q4b-23)
0.460.430.670.52
Culture of the organization
(Q5-01 through Q5-06)
0.360.350.690.50
Perception of career satisfaction
(Q7-01 through Q7-05)
0.350.190.590.32
Age (Q8-01)0.170.200.370.28
Table 3. p-values obtained by ANOVA.
Q2-03Q2-04Q2-05Q2-06Q2-07Q2-08Q2-09Q2-10
HULTHULTHULTHULTHULTHULTHULTHULT
Q6-010.010.730.340.580.230.750.080.050.080.670.580.240.010.750.010.65
Q6-020.010.470.060.770.040.010.280.050.280.120.270.260.010.040.010.71
Q6-030.330.470.180.120.190.110.380.160.380.911.000.390.000.020.000.50
Q6-040.750.860.220.920.020.010.060.010.060.350.040.840.430.310.430.33
Q6-050.000.700.270.640.000.710.000.470.000.010.010.110.170.300.170.59
Q6-060.220.90.310.8600.710.010.170.010.790.380.380.450.680.450.37
Q6-070.280.850.190.910.140.830.130.160.130.520.630.160.240.710.240.27
Q6-080.360.960.210.120.870.430.740.150.740.540.60.790.020.160.020.21
Q6-090.770.970.100.600.000.780.030.390.030..890.700.070.000.050.000.86
Q6-100.290.660.000.400.060.130.060.500.060.860.870.100.000.250.000.40
Q6-110.040.610.060.320.140.150.520.930.520.610.630.420.740.030.740.28
Q6-120.020.710.010.320.40.140.010.050.010.850.040.90.010.340.010.44
Q6-130.000.010.020.360.650.150.710.370.710.840.860.450.930.190.930.85
Q6-140.030.670.650.570.460.270.190.270.190.850.140.430.460.360.460.71
Table 4. Cross-correlation coefficients. Hungarian case.
1234567891011121314
Q6-011.00.40.40.30.40.30.30.20.20.2−0.1−0.10.10.1
Q6-020.41.00.30.30.30.30.30.30.40.3−0.20.00.00.1
Q6-030.40.31.00.40.40.40.30.20.20.2−0.2−0.10.00.0
Q6-040.30.30.41.00.50.40.30.30.20.2−0.10.00.00.0
Q6-050.40.30.40.51.00.60.50.30.30.3−0.20.00.00.1
Q6-060.30.30.40.40.61.00.70.30.30.2−0.20.10.00.1
Q6-070.30.30.30.30.50.71.00.40.40.3−0.20.00.00.1
Q6-080.20.30.20.30.30.30.41.00.40.4−0.2−0.1−0.10.0
Q6-090.20.40.20.20.30.30.40.41.00.5−0.30.00.00.1
Q6-100.20.30.20.20.30.20.30.40.51.0−0.3−0.10.00.0
Q6-11−0.1−0.2−0.2−0.1−0.2−0.2−0.2−0.2−0.3−0.31.00.20.40.2
Q6-12−0.10.0−0.10.00.00.10.0−0.10.0−0.10.21.00.30.3
Q6-130.10.00.00.00.00.00.0−0.10.00.00.40.31.00.5
Q6-140.10.10.00.00.10.10.10.00.10.00.20.30.51.0
Table 5. Cross-correlation coefficients. Lithuanian case.
1234567891011121314
Q6-011.00.50.50.50.50.40.40.40.20.30.0−0.20.00.0
Q6-020.51.00.50.50.30.40.30.20.20.2−0.2−0.3−0.2−0.2
Q6-030.50.51.00.60.50.40.30.30.30.2−0.1−0.2−0.10.0
Q6-040.50.50.61.00.60.70.40.40.30.2−0.1−0.2−0.1−0.1
Q6-050.50.30.50.61.00.60.40.40.40.3−0.1−0.2−0.10.0
Q6-060.40.40.40.70.61.00.70.30.30.2−0.1−0.3−0.2−0.1
Q6-070.40.30.30.40.40.71.00.40.40.3−0.2−0.4−0.2−0.2
Q6-080.40.20.30.40.40.30.41.00.30.40.0−0.20.00.1
Q6-090.20.20.30.30.40.30.40.31.00.6−0.1−0.1−0.10.1
Q6-100.30.20.20.20.30.20.30.40.61.0−0.1−0.30.00.1
Q6-110.0−0.2−0.1−0.1−0.1−0.1−0.20.0−0.1−0.11.00.30.60.5
Q6-12−0.2−0.3−0.2−0.2−0.2−0.3−0.4−0.2−0.1−0.30.31.00.30.3
Q6-130.0−0.2−0.1−0.1−0.1−0.2−0.20.0−0.10.00.60.31.00.7
Q6-14−0.0−0.2−0.0−0.1−0.0−0.1−0.20.10.10.10.50.30.71.0
Publisher’s Note: MDPI stays neutral with regard to jurisdictional claims in published maps and institutional affiliations.

