
Identifying Key Risk Factors in Product Development Projects


1
Department of Business Administration, Chung Yuan Christian University, Chung Li District, Taoyuan City 32023, Taiwan
2
Department of Industrial Engineering and Enterprise Information, Tunghai University, Taichung 407, Taiwan
*
Authors to whom correspondence should be addressed.
Mathematics 2022, 10(8), 1295; https://doi.org/10.3390/math10081295
Submission received: 12 January 2022
/
Revised: 28 March 2022
/
Accepted: 8 April 2022
/
Published: 13 April 2022
(This article belongs to the Special Issue Decision Making and Its Applications)
Abstract
:In a rapidly changing world, most operational processes of enterprises are conducted in the form of development projects. The development of new products is an important organizational strategy to meet consumer needs. During this process, enterprises often encounter many bottlenecks and risks that can cause delays in, and even the failure of, development projects. In this study, we developed a research framework based on relevant literature and expert interviews and then used the decision making trial and evaluation laboratory (DEMATEL) and the analytic network process (ANP) to determine the relationships among and the importance of risks in the development of new products. The results of a case study show that the six key risks of product development projects include project completion time, mastery of key technical capabilities, controlling the progress of the project, uniqueness and complexity of the project, ability to control the market, and functional integrity of the product. According to the results of importance performance analysis, six key factors were classified in the concentrate quadrant. The optoelectronic manufacturing industry should focus on reducing risks to the project. A cause-and-effect diagram shows that if an enterprise wants to improve performance in terms of these key factors, it should first improve the project completion time or the mastery of key technical capabilities. Therefore, it is appropriate to start by improving the project completion time. In this study, we developed a practical and simple decision support system that allows managers of research and development to examine the risk of projects and assess the relevant risks. A case study was also conducted to test the accuracy of the proposed risk-management method.
1. Introduction
New product development (NPD) is the driving force of business growth. Enterprises ensure sustainable development and avoid becoming irrelevant by continually developing new products. Given the rapid technological growth and pace of changes in consumer needs in recent years, the definition and implementation of NPD projects are among the best ways for companies to survive in a competitive environment.
The company cultivates intellectual property that can generate a competitive advantage by allowing it to launch new products quickly. The economic model of the consulting firm McKinsey & Company shows that if high-tech companies delay the launch of new products for six months, they lose 33% of their profits compared with the rewards if the new products are made available to the consumer on time. However, a company loses only 4% if it launches new products on time, even if research and development (R&D) expenses exceed half the budget allocated to the development of a new product [1]. Thus, the rapid launch of new products is an important and even survival-related competitive factor for manufacturers [2].
Enterprise development is related to the success or failure of NPD. According to a recent survey by the Product Development and Management Association (PDMA) in the United States, profit constitutes 38% of the revenue of 20% of the top companies in the country, and 42% of this comes from the sale of new products. The survey also noted that the success rate of NPD for top companies was as high as 73%, whereas that for laggard companies was only 27%. Companies invest a large amount of resources in new products because they can provide solutions to the problems they face.
Research on and projects for the development of new products often encounter bottlenecks and risks that lead to frequent changes in plans, which affect the scheduling of labor, materials, and equipment. In severe cases, this requires work being redone, impacts R&D schedules, increases costs, and reduces product quality. Innovative manufacturing firms strive to sustain and enhance their competitive advantages by consistently having a range of NPD projects. Over the years, the funding and time required to execute an NPD program has increased substantially [3].
In general, effective risk management improves the performance of NPD projects. It comprises managing organizational, technical, commercialization, and marketing risks. However, analyzing every risk-related factor requires significant time and investment, and it often instigates managers of R&D to focus only on identifying and calculating the most influential factors. Thus, it is important to analyze the causal relationship among risk-related factors in NPD projects in the early stages of development. In addition, this complex management problem is a classic case of multiple-criterion decision making (MCDM), and these indicators have interdependent effects.
Delphi, decision making trial and evaluation laboratory (DEMATEL), and analytic network process (ANP) are commonly used multiple attribute decision making (MADM) methods that must be performed to effectively determine key factors and identify causal relationships [4]. Because of the troublesome pairwise comparisons appearing in the ANP questionnaire, the DEMATEL-based ANP (DANP) was further developed to simplify the process of operating ANP using the total influence matrix derived by DEMATEL [5]. Many studies, such as Liou et al. [6], Hu et al. [7], Chiu and Chiu [8], Jiang et al. [9,10], Hu et al. [11], Chen et al. [12], and Zhang et al. [13], have applied a combination of Delphi and DANP to real-world problems. Additionally, the MADM methods that we used demonstrated their strong applicability in decision making. According to the literature on NPD risk, no study has used DANP and importance performance analysis (IPA). In this study, we used a combination of DEMATEL and ANP to consider the interdependence among risks and determine key factors.
Here, we determine the key factors relevant to NPD risk and identify the interrelationships between risks by considering the industrial environment, partners, and internal governance differences in dynamic situations. Additionally, we employed the DANP method to design an NPD risk assessment model and improve the efficiency of the research by providing final factor weights. This work assists researchers in clarifying and simplifying NPD risk dimensions to formulate strategies for avoiding NPD risk. The empirical results demonstrate that individual risk assessments should also consider the risk value and individual value-at-risk, as well as the total risk value, to determine their strengths and weaknesses.
With regard to management implications, we built an NPD risk evaluation model to apply limited resources to avoid risk in NPD. This leads to easier communication of complex technical information across various departments in an organization. Thus, a consensus on the projects for individual risk items can be easily achieved, and policies for decreasing the impact of risks can be formulated. Generally, we focused on the evaluation of the factors leading to the risks that may be faced before NPD, which is a common problem faced by many enterprises. Enterprises can refer to the evaluation model constructed in this study and then adapt it to the risk analysis model of NPD that can be applied by individual enterprises, showing its specific practicality and value.
The rest of the paper is structured as follows. Section 2 reviews the literature to identify the risks of NPD. The proposed framework is described in Section 3. Its effectiveness is verified by considering an empirical case in Taiwan, as described in Section 4. The conclusions of this study and suggestions for future work in this area are presented in Section 5.
2. Risks in NPD Projects
Cooper [14] identified the key dimensions of risk, including two dimensions of synergy, four dimensions characterizing the venture (complexity, customization, certainty, and novelty to the firm), and market dynamism. Three of the seven dimensions are strong predictors of risk: technical complexity and size of the product, novelty to the company, and marketing and managerial synergy. The other four factors are less important: market dynamism, product certainty, product customization, technology and production synergy, and proficiency. Cooper [14] stated that risk can never be completely eliminated in the new product area. The first step to mitigating risk is to learn more about why. Research has helped us structure a multidimensional field that creates risk for the managers of new products.
Keizer et al. [15] described the applicability and development of a risk reference framework (RRF) for diagnosing risks in projects that lead to technological breakthroughs. They formulated 12 main categories of risk and 142 crucial innovation-related subjects. The main risk classification includes risks related to commercial viability, risks posed by the competitor, risks of consumer acceptance and marketing, risks of public acceptance, intellectual property risks, manufacturing technology risks, organizational and project management-related risks, risks of product family and brand positioning, risks of product technology, screening and appraisal risks, supply chain and sourcing risks, and risks of trade with the customer.
Ozer [16] identified factors that influence decision making when assessing new products. These include task-, decision maker-, elicitation-, and aggregation-related factors. Task-related risks include task complexity and importance, information scarcity, and task instructions. Decision maker-related factors include the expertise and diversity of the people involved in assessing new products. Elicitation-related factors include eliciting the discrete value and probability distribution of the decision maker’s opinion. Finally, aggregation-related factors involve the way different opinions are aggregated in assessing new products, including mathematical, behavioral, mixed, and electronic ones.
Chin et al. [17] presented the root nodes of a risk network for an NPD project. They consist of complexity of product design, similarity to existing products, R&D capability, similarity to existing supply, supplier performance, complexity of the production process, similarity of the production process to prevalent ones, and production capability.
Ayala-Cruz [18] proposed a modified framework for managing risks in a project to improve the effectiveness of high-tech NPD projects. This framework contains four categories and 11 risks. These categories are administration-, technical-, developmental-, and commercialization-related. The administration category includes changing market conditions, inadequate collection of metric measures, inadequate documentation, and a lack of single-point accountability. The technical category includes issues in which the product is not fit for purpose, inadequate third-party performance, and inadequate testing procedures. The developmental category includes a lack of consensus on criteria to gauge user acceptance and poor performance of the production system. Commercialization includes the technical limitations of the solution reached or exceeded and unreasonable scheduling and budget for the project. We consider a high-tech company in our case study to verify our framework.
Moenaert et al. [19] claimed that reducing uncertainty throughout an NPD project increases the likelihood of success in commercializing a new product. Kim and Vonortas [20] adapted the four main domains typically used in NPD—market, technology, operation, and finance—to examine how enterprises mitigate and manage risk. They chose the domain developed by [21] to manage risk when developing new products. Technological risk includes a company’s inability to understand or predict the facets of the technical environment related to NPD projects [22]. Market risk refers to the uncertainty of whether a technology or a developed product can meet customer needs. Numerous studies have shown that NPD can fail due to poor marketing. Market risk is the least controllable factor in NPD because it is external to the company [23]. Moreover, to reduce organizational risk, companies can learn the best practices and share knowledge and capabilities [24]. Financial risk is often critical for smaller companies that are willing to innovate but have limited access to financial resources [25].
Sun and Lee [26] focused on key risks in R&D projects. They identified seven aspects and 28 related factors. These aspects are organizational, cost-related, temporal, risk related to R&D technology, risk related to product quality, human resource risk, and risk posed by the market environment. Organizational risk comprises three factors: uncertainty in organizational adjustment, uncertainty in the product portfolio, and insufficient recognition and commitment from senior executives. Cost-related risk consists of four factors: changes in design that increase costs; changes in the costs of raw material/exchange rate/price fluctuation; the cost of key technology and components; and insufficient bargaining power. Temporal risk consists of factors such as poor progress control in a project, incomplete planning of each step of the process, and insufficient ability to control the market situation. The risk posed by R&D technology comprises five factors: insufficient critical technical capabilities, project uniqueness and complexity, insufficient integration of collaborative R&D design, insufficient patent layout, and difficulty in obtaining key materials. The risk related to product quality consists of four factors: high cost of quality, inability to meet customer quality-related requirements, high rate of product failure, and insufficient capacity for production. The risks posed by human resources include insufficient education and training, poor human resource management, high turnover rates, and poor staff efficiency. The risk posed by the market environment consists of highly competitive prices, insufficient market maturity, counterfeiting in the early market, incorrect estimation of market opportunities, and uncertainty in overall market resources.
Shishodia et al. [27] analyzed the risk profiles of projects based on their characteristics using 37 cases from different fields. One type of risk profile concerns NPD, and they created the risks of NPD projects based on seven key studies.
Oehmen et al. [28] proposed three fundamental sources of uncertainty that contribute to the risk of NPD projects: technology (e.g., risks arising from technological maturity), markets (e.g., risks come from changing customer expectations), and management (e.g., the resulting risk from the organization and its processes).
We merged some of the above aspects and criteria that affect new NPD projects and constructed a framework with six aspects and 22 evaluation criteria. The preliminary framework and definitions of each criterion are listed in Table 1.
3. Methodology
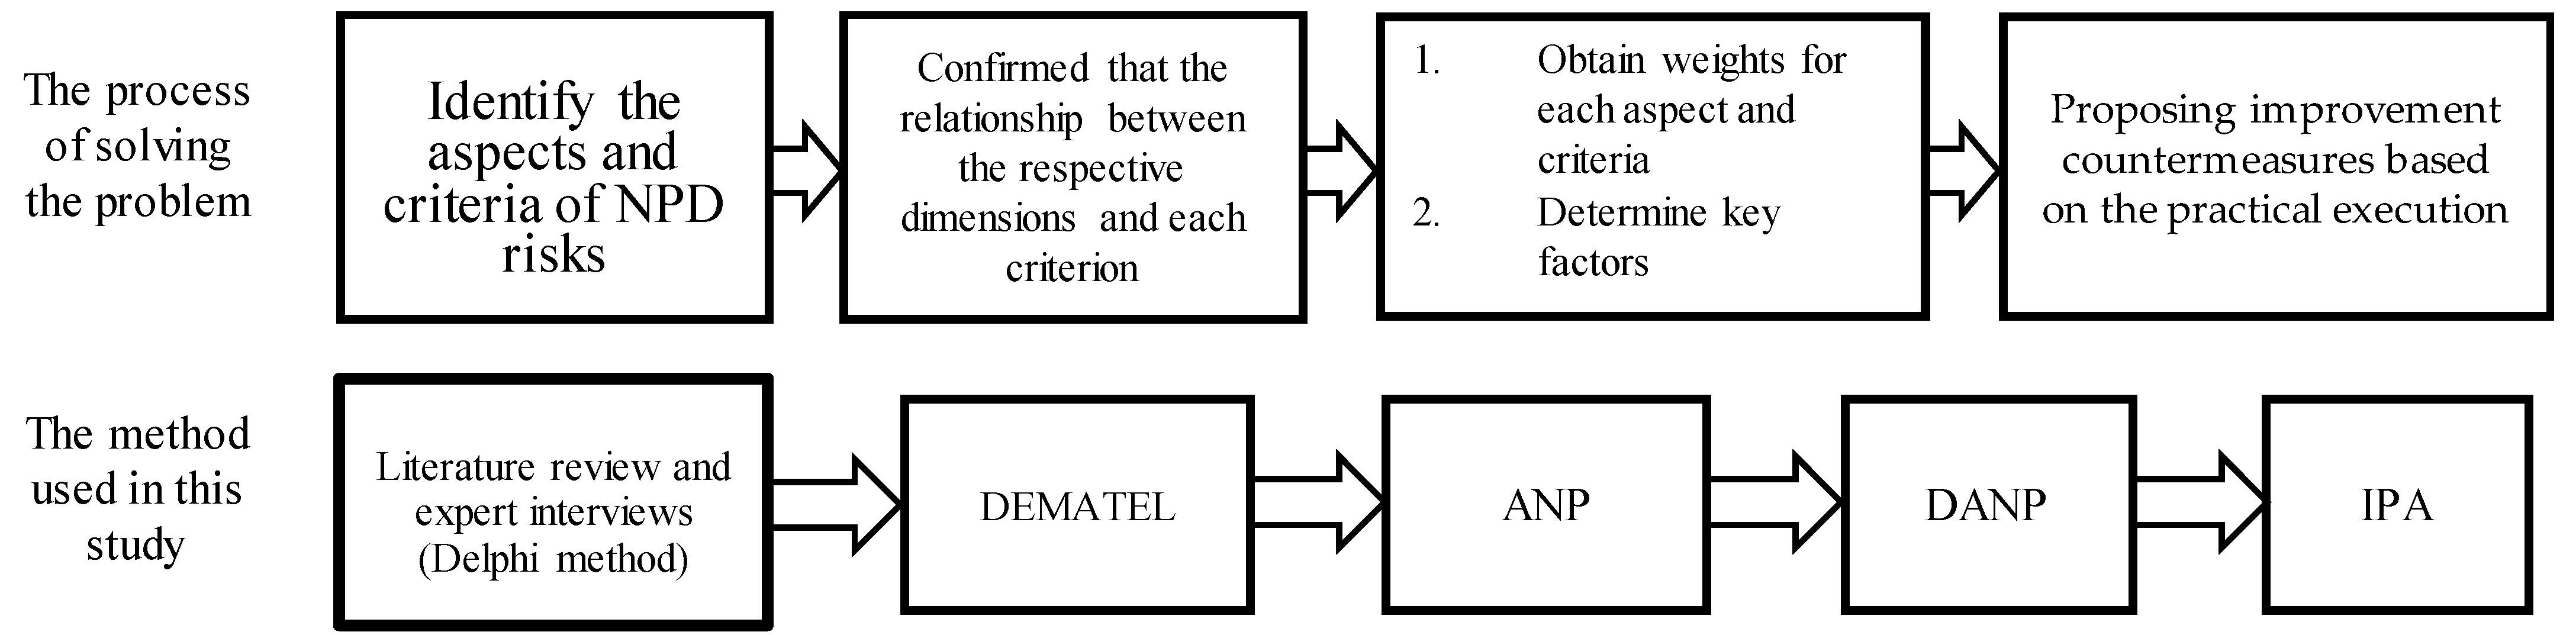
The conceptual framework of this research was created through literature review and interviews with experts. After expert interviews and using the Delphi method, we confirmed the research framework. The decision making trial and evaluation laboratory-based analytic network process method (DANP) played an important role in this study. The two methods DEMATEL and ANP were combined to solve multiple-criteria decision-making problems in different fields and to determine the level of interdependence and significance of the indicators relevant to our objective. As a result, we present corresponding improvement countermeasures along with IPA. The flowchart is illustrated in Figure 1.
3.1. Delphi Method
The Delphi method is a forecasting and information-gathering process [29]. The relevant stages of the Delphi method are briefly introduced as follows. First, we invited a number of professionals to participate in the review process. Next, the round one questionnaire was sent to the panel members. They were requested to check the appropriateness of the research structure by answering the questions we provided. Then, after the panel members returned their responses, the round two questionnaire was designed according to the responses, and we requested each panel member to rate each item. Because the goal of a Delphi study is to reach a consensus of opinions, we used the consensus deviation index to determine consensus in this study. Finally, when each item reached a consensus, the process was terminated; otherwise, the round three questionnaire was designed to reflect the mean and the deviation of an item that did not reach a consensus, and requested each panel member to rate these items again.
3.2. DEMATEL-Based ANP (DANP)
Traditionally, ANP requires a network relationship diagram (NRM), which must be obtained using auxiliary tools. DEMATEL is a suitable choice for building NRMs [30], which visually represent interdependencies in the form of networks consisting of interpretable nodes and directed arcs [29]. However, an extreme problem with ANP is that if too many criteria are involved in pairwise comparisons, the time required for such comparisons increases considerably. Moreover, due to the limitations of human cognition and the shortcomings of scales one to nine, it is not easy to achieve consistency, especially for higher-order matrices. To solve these problems, the total influence matrix generated by DEMATEL is used as an unweighted supermatrix of ANP to avoid troublesome pairwise comparisons [31].
Compared to the DANP introduced in [4,7], we made several revisions to highlight the distinct features. First, we simultaneously consider the prominences generated by DEMATEL and the relative weights generated by DANP to determine key factors, instead of using the relative importance by using DANP alone. That is, as represented by the dashed lines in Figure 1, DEMATEL and DANP have the power to determine key factors. Second, we focused on the causal diagram of key factors. Moreover, an arc is directed from one factor to another if the former has greater influence on the latter. This can significantly simplify the representation of a causal diagram and facilitate the analysis of interdependence among key factors. The causal diagram is independent of the relationship between each factor. A variant of conventional DANP is shown in Figure 2.
3.2.1. Determining the Total Influence Matrix
The performance values used [7,9] to represent the degree of influence of one element on another are 0 (no effect), 1 (little effect), and 2 (strong effect). The direct influence matrix Z was then constructed using the extent of the effect within each pair of elements, as obtained by the questionnaire. zij represents the extent to which criterion i affects criterion j. All diagonal elements were set to zero.
The direct influence matrix Z is subsequently normalized to yield a normalized direct influence matrix X after calculating
X = λ ⋅ Z
The formula (T = X(I − X)−1) represents the total influence matrix T after normalizing the direct influence matrix. In this step, O is the zero matrix, and I is the identity matrix.
The total influence matrix T is an unweighted supermatrix used to normalize the total influence matrix to obtain the weighted matrix W for the ANP. Finally, W is multiplied by itself several times until convergence to obtain the limiting supermatrix W* and the global weights of all elements. An example is used below to illustrate the above-mentioned operations with respect to Aspects A, B, C, D, and E in our real case study. Let the direct influence matrix Z be obtained as follows:
This matrix was normalized to obtain the normalized relation matrix X. Thereafter, the total influence matrix T was calculated according to X(I − X)−1.
Each row of the total influence matrix is summed to obtain the value of d, and each column is summed to obtain the value of r. Hence, the sum of every row plus the sum of every column (i.e., d + r), called the prominence, shows the relational intensity of the element in question. The greater the prominence, the greater the degree of importance among the factors. The sum of every row minus the sum of every column (d − r) is the relation. If the relation is positive, the element affects the other elements, which is referred to as the cause. If the relation is negative, the element is affected by other elements, which is referred to as an effect. That is, a positive relationship means that the degree to which a given factor affects others is inclined to be stronger than the degree to which it is affected [32]. The details of the above data are shown in Table 2.
The total influence matrix is then normalized to obtain the weighted supermatrix W.
Finally, W is multiplied by itself several times until convergence to obtain the limiting supermatrix W*. Aspects A, B, C, and E can be categorized into the class of “effects”. Aspect D can be categorized into a class of “causes”.
3.2.2. Identifying Key Factors
Following the case study example in the previous subsection, the comparative weights of elements A, B, C, D, and E were determined to be 0.1928, 0.2010, 0.2197, 0.2166, and 0.1699, respectively. However, the rankings of the importance of the aspects resulting from the prominences generated by DEMATEL and the relative weights obtained by DANP are inconsistent (in Table 3). Because both DEMATEL and DANP provide partial information regarding the selection of key factors, decisions on these aspects should not be based solely on the prominences generated by DEMATEL or the relative weights obtained by DANP. Therefore, we used the combined order of DEMATEL and DANP to determine the final rankings of the aspects. Their overall rankings are shown below by arranging the sum of the rankings of each aspect in ascending order (the Borda score). We used Aspects A, C, and D as key aspects.
3.2.3. Depicting the Causal Diagram of Key Factors
We used a causal diagram to depict the key factors. For instance, because aspects A, C, and D are critical, the total influence matrix is used to draw a causal diagram. The matrix indicates that the aspects that most strongly affect A, C, and D are A, C, and D.
Thereafter, a causal diagram of A (organizational level), C (time risk), and D (R&D technology) can be depicted as follows:
![Mathematics 10 01295 i001]()

As shown in the diagram, aspects C and D influence one another. Moreover, it is reasonable for managers to attempt to improve the performance of C or D to reduce the risks of NPD. Improving the performance of C can facilitate improvements in A and D. However, because C is categorized into a class of “effect”, the performance of D is improved first to promote the performance of other key aspects. Whether C can be considered the starting point depends on the situation at hand. That is, “cause” or “effect” is just for reference.
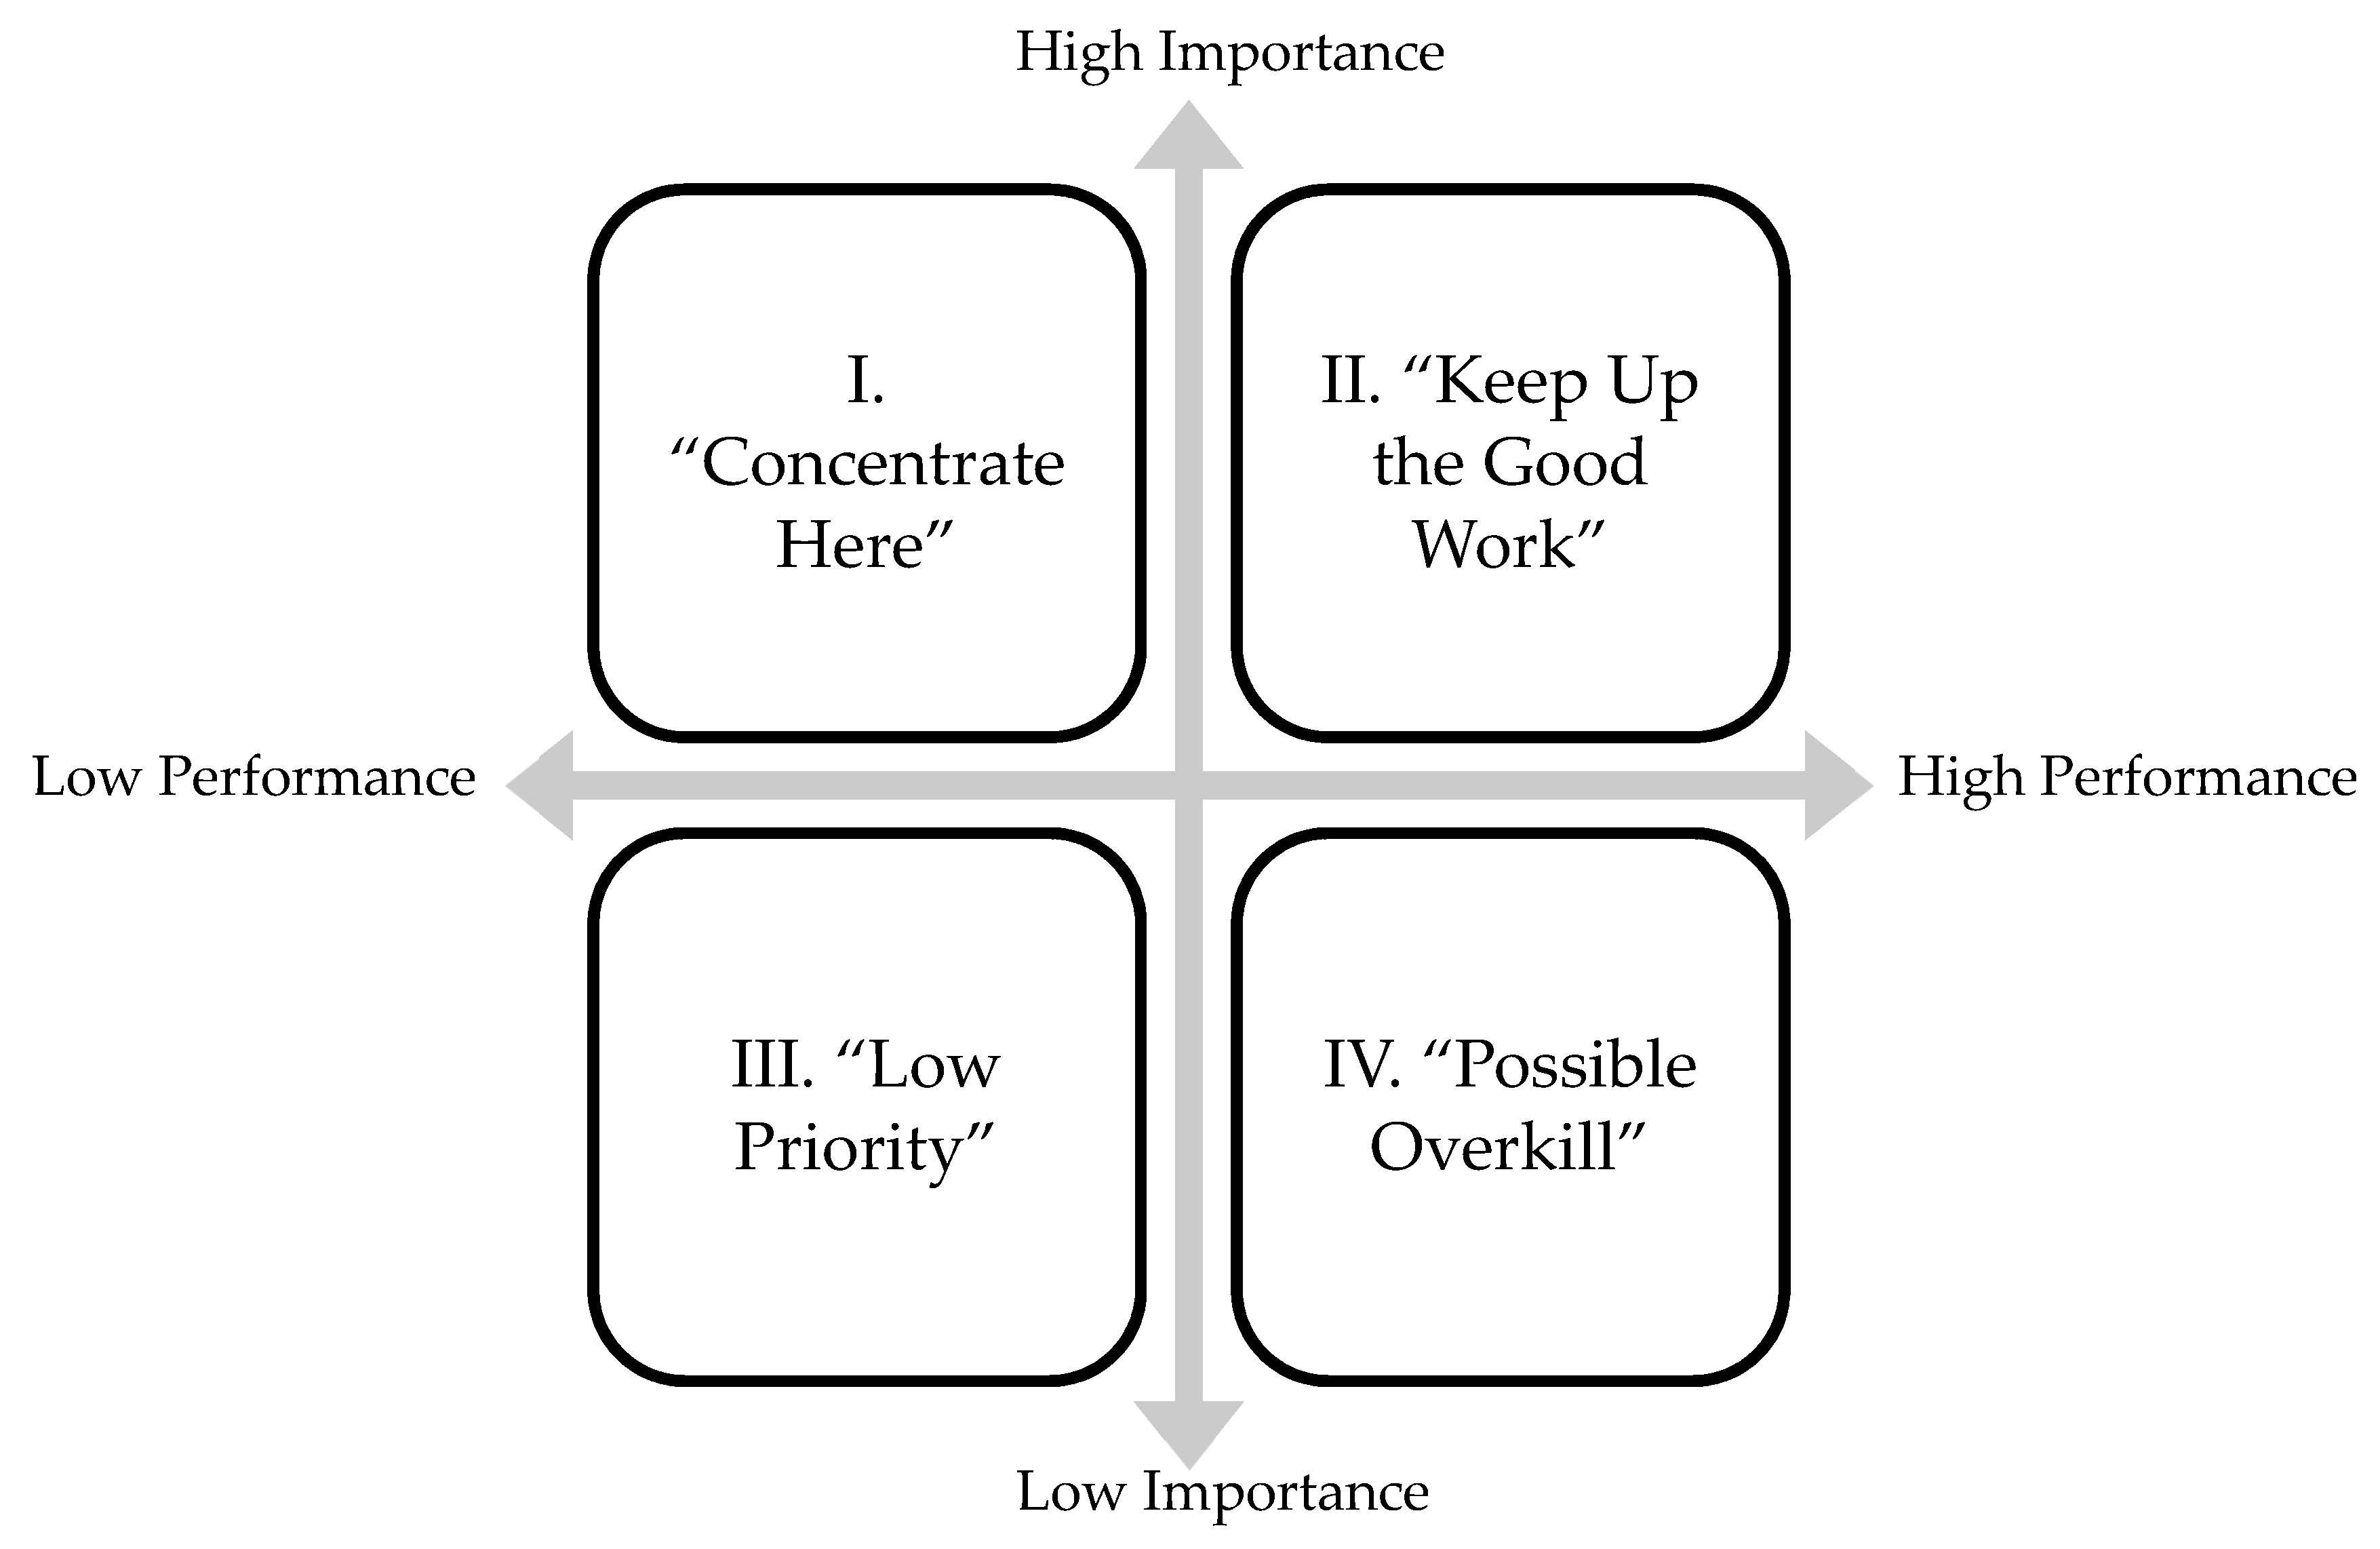
3.3. Importance Performance Analysis (IPA)
IPA, formulated by [33], is an appropriate tool for helping users examine key factors that need to be improved. IPA is a low-cost and easy-to-understand method that provides businesses with an intuitive, attractive strategy for prioritizing potential changes [34]. Figure 3 shows the four quadrants of IPA and it can help a company to achieve the best level of performance [34]. The quadrants suggest that the performance should be enhanced for some attributes (“I. Concentrate Here”), reduced for others (“IV. Possible Overkill”), and maintained for the remainder (“II. Keep Up the Good Work” and “III. Low Priority”) [33].
4. Empirical Study
4.1. Case Introduction
The photovoltaic materials manufacturing industry is a branch of industry that manufactures electronic components. This is a high-tech and capital-intensive industry. Photoelectric materials and components have been extensively manufactured for use in LEDs, LCD displays, touch panels, solar cells, television screens, smart devices, and energy-saving lighting devices. With rapid technological development, various emerging technologies, such as AMOLED, micro-LEDs, and mini-LEDs, have emerged.
Compared with other manufacturing industries, the optoelectronic materials and components manufacturing industry is focused on the production of innovative products. Owing to the pressure of market competition, professionals in the photovoltaic materials manufacturing industry often need to work overtime to achieve the objectives of the project to surpass competitors. This area emphasizes that brand-oriented companies attend to the speed of product launches and invest resources in product development. A quick response to market demand in the industry is particularly important; therefore, professional R&D staff must enhance production efficiency continuously. Reducing the cost of R&D for new products is a crucial issue for the growth of a company’s market. Because profit margins are falling, creating higher added value in products is a challenge and can be met by developing new technologies, products, and patents.
The case study company (Company E) has experienced three failures in the development of new product projects. The first is the development of a lithium battery separator. Company E took several years to develop and purchase various raw materials and testing equipment and introduced professional labor. Although it was successfully developed, there were safety concerns regarding batteries, and the price was not comparable to that of many competitors in China. Company E sold the non-mass-production machine for a lithium battery separator at a low price. In 2013, it invested NTD 2 billion to establish a high-tech optical-grade thin-film factory. They hired professionals with high wages and cooperated with Japanese technology companies. The project was disbanded in 2019 because of organizational problems and market-related factors. Currently, it costs NTD 150,000 per month to maintain the equipment. In addition, Company E ventured into the field of solar materials (EVA film, thin-film materials for solar cell packaging backsheets) to attain new growth-related momentum, and it bought Japanese machines for NTD 400 million. The costs and time spent during this period were not calculated. Ultimately, because the market and key technologies were not mastered, the project was not complete when the market demand was the highest, and the equipment was sold at a low price of approximately NTD 200 million.
4.2. Determining the Formal Decision Framework
This study confirmed the formal research framework through a preliminary framework using the Delphi method. We recruited 10 R&D personnel (all of whom were experts in Company E) engaged in the optoelectronics manufacturing industry, each with more than five years of experience, to form a group to participate in the revision of the research framework, and they were asked to fill in a follow-up questionnaire to provide professional advice. The experts’ knowledge and experience are presented in Table 4.
We conducted the first set of interviews with the experts using a questionnaire in March 2020, with the aim of adding to and deleting the proposed prototype framework. After compiling a list of opinions given by the experts, the dimensions of the prototype framework were revised accordingly. In April 2020, a second set of expert interviews was conducted, and expert opinions were gathered. After the two rounds of interviews, a formal research structure with four dimensions and nine criteria was formulated, and the formal levels of evaluation and definitions were sorted, as summarized in Table 5.
4.3. Analysis of Results
4.3.1. Determination of Causal Relationship
We used the DEMATEL method to clarify the causal relationships among the key factors affecting the risk of NPD projects. We first used the questionnaire to form a relationship matrix X of direct influence and then normalized and used it in the formula T = X (1 − X)−1. The total influence relationship matrix T (total influence matrix) was established according to the criteria listed in Table 6.
We added each column of the matrix in Table 6 to obtain the value of d and added each row to obtain the value of r. The rank sum (d + r) of each element is called “importance”, which indicates the degree of relevance of the given element in the problem. The differences in the rank (d − r) between elements are called the “causal degree”. If the difference is positive, the element is biased toward “active influence” and classified as the cause; if the difference in rank is negative, the element is considered biased toward “being the impacted”, and it is classified as an effect. The importance and relevance are calculated according to the total influence relationship matrix in Table 6, as summarized in Table 7.
4.3.2. Identifying Key Factors
We used the operational structure of the DANP, as shown in Figure 1. As suggested by Hu et al. [3], we used the total influence relationship matrix of DEMATEL as the unweighted supermatrix in the ANP operation, normalized it, multiplied the normalized results by themselves until the fourth convergence, and obtained the limit supermatrix, as summarized in Table 8. The relative weight of each criterion is determined using a supermatrix.
According to Hu et al. [3], the importance ranking of DEMATEL and weight ranking of DANP were used to determine the final overall rankings of the criteria. The ranking sum in Table 9 is also called the Borda score; the smaller the score of a criterion, the more important it is.
The results in Table 9 indicate that project completion time (C1), mastery of key technical abilities (D1), controlling the progress of the project (C2), uniqueness and complexity of the project (D2), ability to control market conditions (C3), and the functional integrity of the project (D4) were the key criteria influencing the risks posed by NPD projects.
4.3.3. Depicting the Causal Diagram of Key Factors
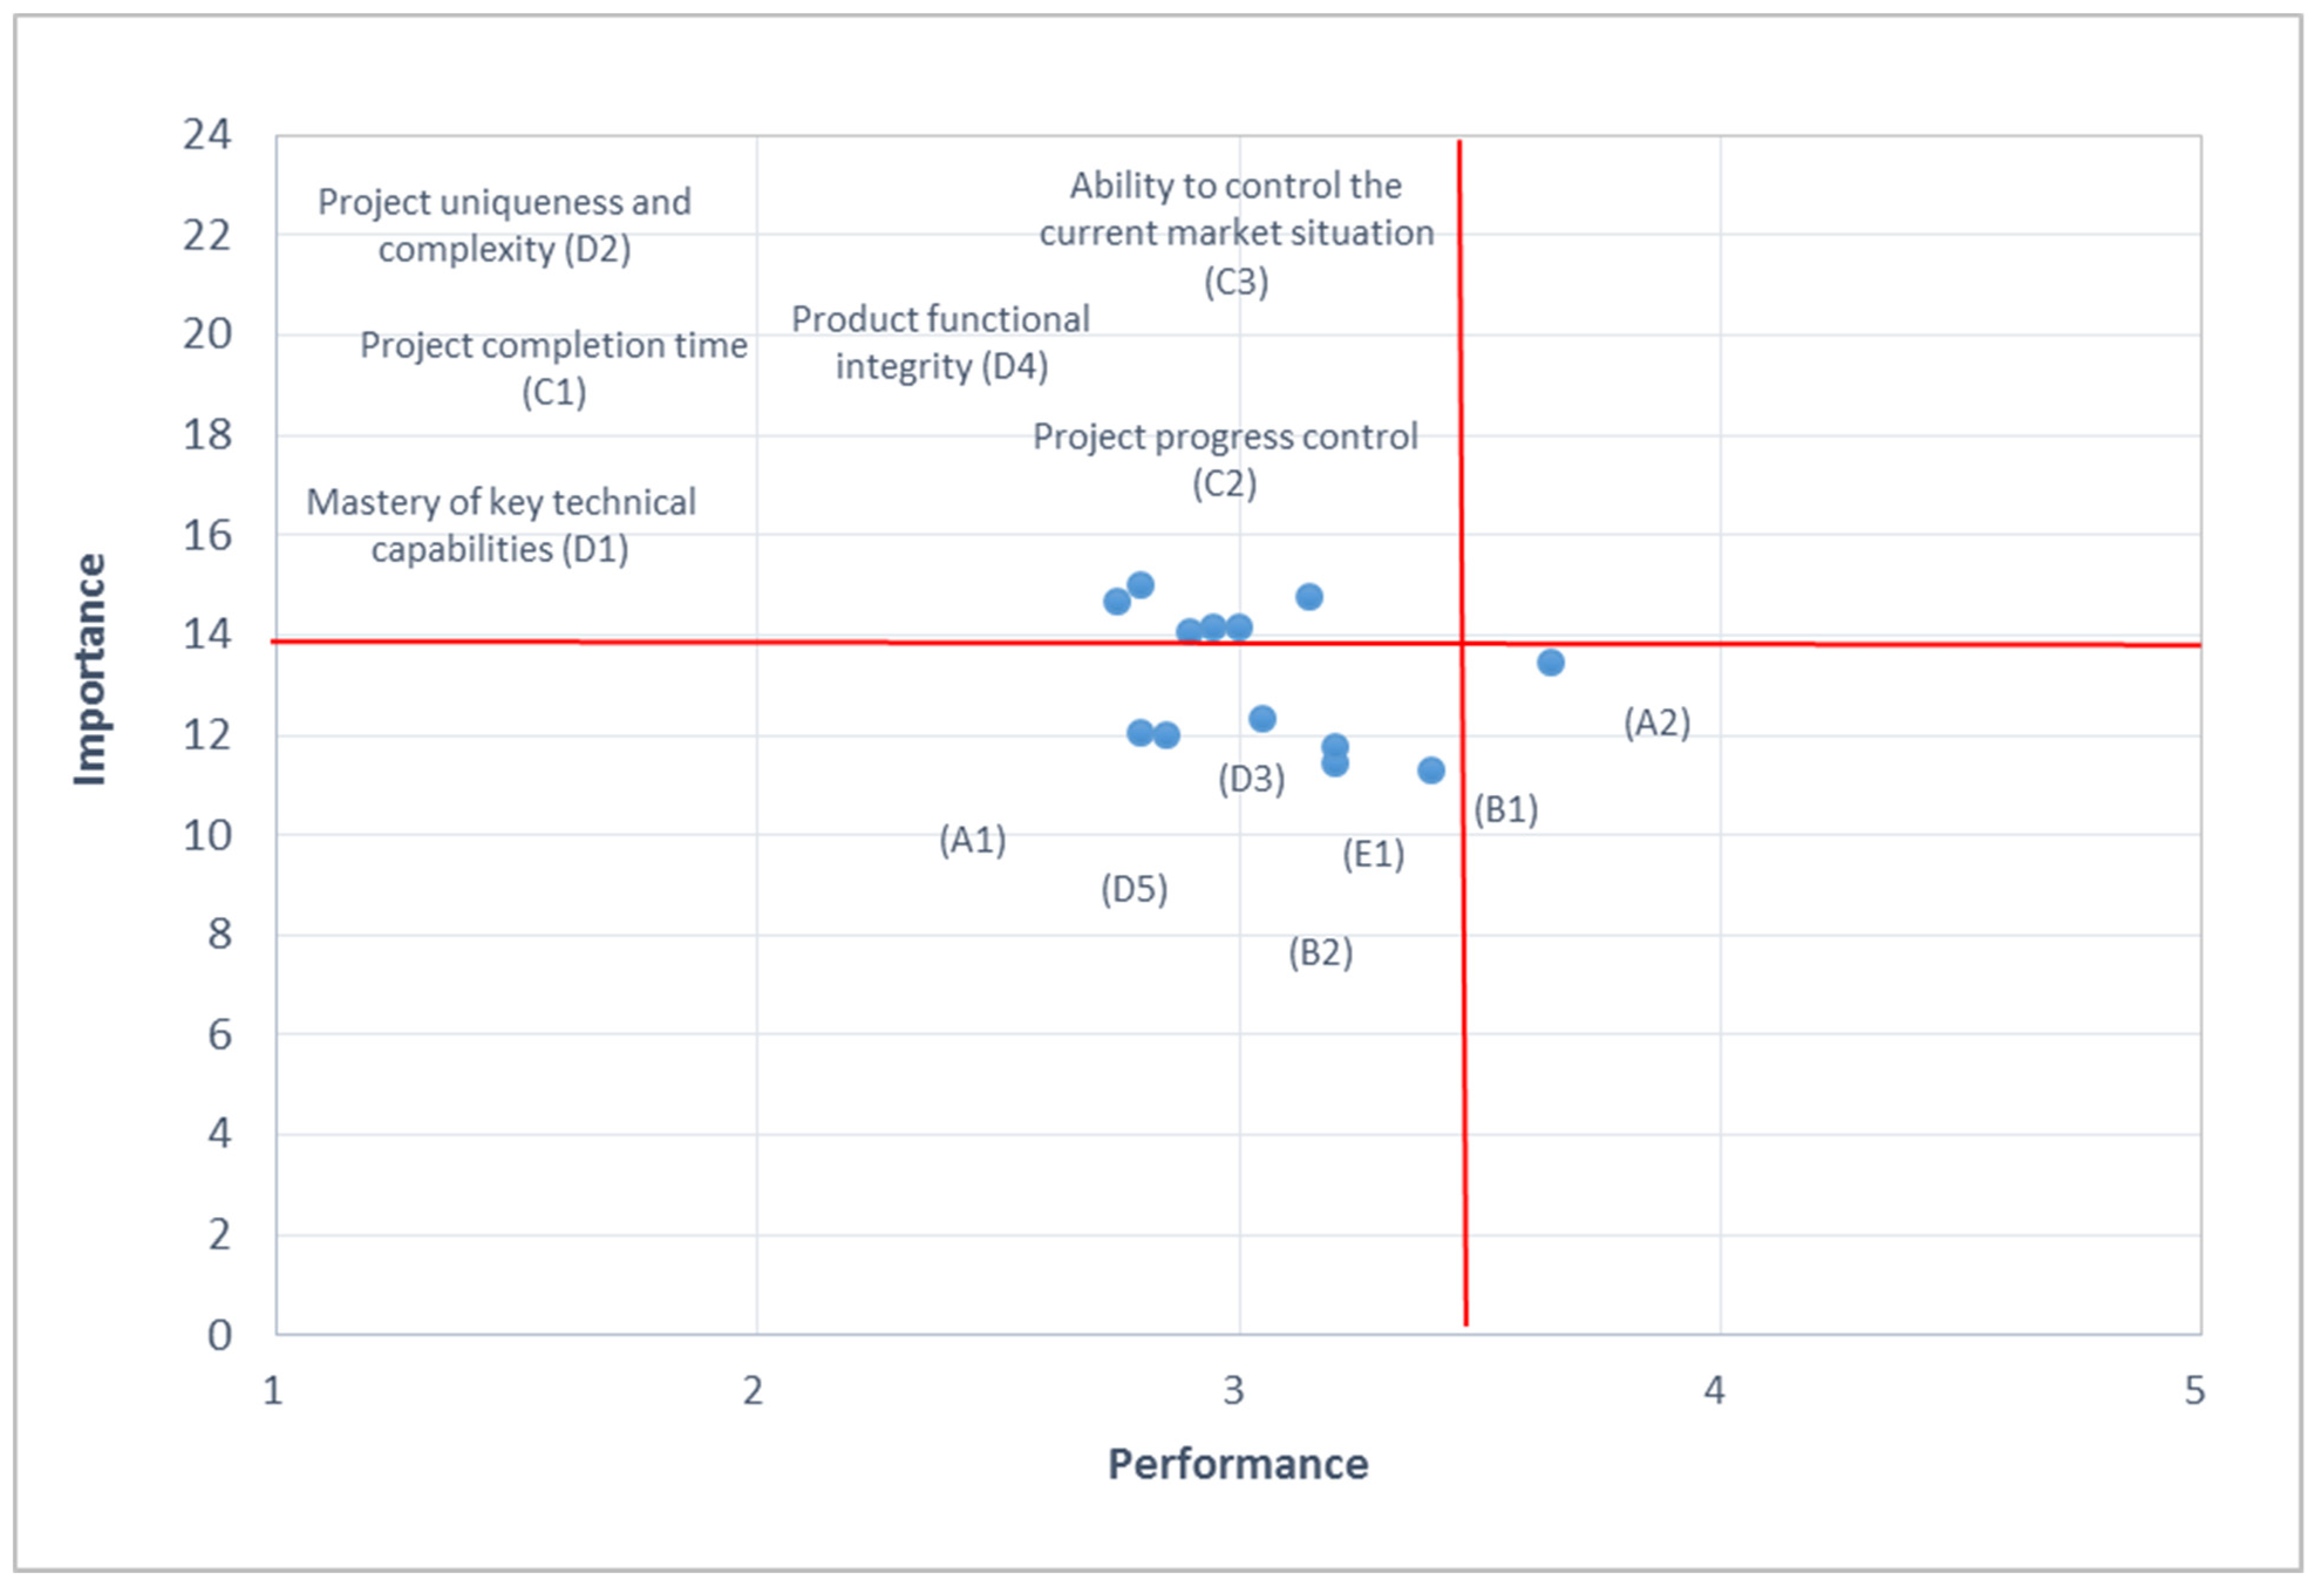
4.3.4. The Results of IPA
IPA [4] can be used to identify the criteria that must be improved. As shown in Figure 5, it can be divided into four quadrants. The area of the graph where the standard performance was lower than 3.5 and the importance value was higher than 14 was classified as the “concentrate here” quadrant. Six criteria—project completion time (C1), controlling the progress of the project (C2), ability to control market conditions (C3), mastery of key technical capabilities (D1), uniqueness and complexity of the project (D2), and completeness of product functions (D4)—are in this quadrant.
5. Conclusions and Suggestions
The main advantages of this study are the use of DANP methods to systematically identify key risks in NPD, and strategic planning and recommendations for key factors that need to be improved are presented through the IPA. Currently, this study only considers the optoelectronic industry and is not comprehensively applicable to other industries, which is a limitation.
The key criteria that affected the risk to NPD projects were project completion time, mastery of key technical capabilities, controlling the progress of the project, uniqueness and complexity of the project, ability to control the market, and functional integrity of the product. The causal diagram of the key criteria in Figure 2 shows that project completion time and mastery of key technical capabilities were influenced by each other. The project completion time was the most important criterion that affected the progress of the project, ability to control the market, uniqueness and complexity of the project, and functional integrity of the product. The project completion time and mastery of key technical capabilities are important factors for NPD projects because each product has a certain limited development time, and temporal control is the most important part of product development. If time is not managed well, the product may lose its relevance or other competitors may capture the market. According to the IPA results, the six key factors were classified into the concentrate quadrant. The management-related implications and strategic suggestions for the six key factors are detailed below.
- Project Completion Time
New products that are not completed within the expected time may require additional labor, materials, and equipment, which can lead to the failure of the company to meet market demand. By the time the final project is completed, the number of competitors has increased, causing the product to not yield the best outcomes related to demand or R&D effort. The lack of appropriate mechanisms or standards of judgment for resources leads to the inappropriate mobilization of project members, resulting in the ineffective use of resources and affecting the progress and quality of R&D. Three strategies were proposed to mitigate this situation. (1) Enterprises should make repeated arrangements and adjustments to their time and resources. In the implementation and monitoring phases, they must make good use of resource scheduling or compression of time history. (2) To shorten the project completion time, the optoelectronic manufacturing industry is conducting new tests to verify the reliability of product materials. The test conditions should involve testing the product for 1000 h at room temperature or according to the needs of different customers. The reliability of different wavelengths and energies should be introduced to accelerate R&D and achieve the same results. The simulation of aging machines and equipment should be accelerated to reduce project completion time by more than half. (3) The company can cooperate with other companies, manufacturers, or related research centers to increase its R&D capabilities and shorten project completion time. For instance, the Institute of Optoelectronics of the Industrial Technology Research Institute cooperated with Telcordia of the United States to establish Asia’s first optical communication test and verification center in Taiwan, saving Taiwanese manufacturers the cost and time needed for verifying and accelerating product launches.
- 2.
- Key Technical Capabilities
Critical technical capabilities form an important foundation of an enterprise’s competitiveness. Conscious training and development of an enterprise’s core technical capabilities are critical to a company’s successful technological innovation and the establishment and maintenance of its competitive advantage. Enterprises should master key technologies, formulae, and characteristics to introduce new product strategies as important activities for their survival and growth. Two strategies have been proposed to achieve this. (1) Companies should master one or two important key R&D technologies and deploy technology patents in various countries such that competitors cannot replace them. For instance, formulae for materials, processing methods, optical structural design, extrusion processing technology, and the layout of a patent application can provide a significant competitive advantage in the market, which can reduce the risk of research on new products and their development. (2) Companies should integrate their key technical capabilities. For example, the Hon Hai Technology Group (Foxconn) (New Taipei City, Taiwan), provided key panel components for Apple by integrating Japan’s excellent panel technology into its processes, eliminating the original role of the low-end assembly foundry.
- 3.
- Project Progress Control
If there is no proper planning before R&D and the related operations and labor requirements are properly considered, this can lead to a large gap between the implementation and the forecast. This affects the R&D schedule and progress of other projects. Two strategies have been proposed to address this situation. (1) A project department should be established within an enterprise consisting of project managers, team members, and team leaders who can continually track records; analyze and evaluate; review and process; and control progress, communication, and relevant documents. For instance, Taiwan Fertilizer Co. Ltd. (Taipei, Taiwan), successfully set up such a task force. (2) The work communication software TP Office Communication must be installed and tested, the project management interface should be clear, and the visual enterprise/project dashboard should help supervisors quickly grasp the progress of the project and respond in time. When combined with project management, progress should be clear at first glance.
- 4.
- Project Uniqueness and Complexity
R&D-based innovation is highly uncertain. Owing to the uniqueness and complexity of certain projects, R&D is time-consuming and time-sensitive; thus, it is difficult to control. The optoelectronic manufacturing industry often uses the extension of available technology and investment in the scale of innovation to maintain its advantages in terms of growth and competition, thereby substantially increasing its market value. Two strategies are proposed in this context. (1) The unique needs of individual projects should be managed, and the organizational structure and workflow of the project should be carefully considered to ensure that they meet the given needs. (2) A combination of technological excellence and longevity increases a product’s competitive advantage. For instance, the Optoelectronics Institute of the Industrial Technology Research Institute has combined optoelectronics with art, which is called digital art. Digital technology can be used to represent artistic value and a humanistic spirit. Kung Fu’s beauty can be presented using 3D animation. Another example is the development of 3D scanning technology that can be used for medical purposes. It can also help manufacture tailor-made clothing or customized seats in vehicles.
- 5.
- Ability to Control the Market
In an era of fierce global competition, corporate R&D should have the ability to foresee market trends, that is, be able to see changes in consumer demand; thus, technical strategies for an adequate response can be formulated as soon as possible. Two strategies are proposed. (1) Quantitative data should be collected and used to help companies understand the market conditions. (2) Companies should participate in exhibitions on advanced technology, product development, and industrial conditions in the optoelectronic industry to exchange information and technological innovations.
- 6.
- Function Integrity of Products
For Taiwan’s optoelectronic industry to sustainably maintain its competitive advantage, it must be committed to innovation, integration, and R&D to increase the added value of products. For example, diffusers can be used as lighting panels to improve the functional integrity of products. Customers buying a product actually buy the functions and performance of the product. For instance, cars have the function of transportation, refrigerators have the function of keeping food fresh, and air conditioners have the function of regulating atmospheric temperature. Two strategies are proposed in this regard. (1) Companies should increase the functional integrity of their products, and they should use a comparative analysis of products to highlight the functional integrity of their products, instead of simply emphasizing value. Consumers prefer products with good functional integrity. (2) Different manufacturers can collaborate to develop a product with complete functions to satisfy consumers and achieve a win-win outcome for producers.
Author Contributions
Y.-J.C., Y.-C.H. and C.-Y.Y. conceived of the presented idea. Y.-C.H. developed the theory and performed the computations. C.-Y.Y. and C.-H.Y. processed the experimental data, performed the analysis, drafted the manuscript and designed the figures. Y.-J.C. and Y.-C.H. verified the analytical methods. Y.-J.C., Y.-C.H. and C.-H.Y. were involved in planning and supervised the work. Y.-J.C., Y.-C.H. and C.-H.Y. aided in interpreting the results and worked on the manuscript. All authors have read and agreed to the published version of the manuscript.
Funding
Ministry of Science and Technology, Taiwan (MOST 110-2221-E-029-023).
Data Availability Statement
Not applicable.
Conflicts of Interest
The authors declare no conflict of interest.
References
- Millson, M.R.; Raj, S.P.; Wilemon, D. A survey of major approaches for accelerating new product development. J. Prod. Innov. Manag. 1992, 9, 53–69. [Google Scholar] [CrossRef]
- Stalk, G. Time the next source of competitive advantage. Harv. Bus. Rev. 1988, 66, 41–51. [Google Scholar]
- Mousavi, S.A.; Seiti, H.; Hafezalkotob, A.; Asian, S.; Mobarra, R. Application of risk-based fuzzy decision support systems in new product development: An R-VIKOR approach. Appl. Soft Comput. 2021, 109, 107456. [Google Scholar] [CrossRef]
- Tzeng, G.H.; Shen, K.Y. New Concepts and Trends of Hybrid Multiple Criteria Decision Making; CRC Press: New York, NY, USA, 2017. [Google Scholar] [CrossRef]
- Chiu, W.Y.; Tzeng, G.H.; Li, H.L. A new hybrid MCDM model combining DANP with VIKOR to improve e-store business. Knowl. Based Syst. 2013, 37, 48–61. [Google Scholar] [CrossRef]
- Liou, J.J.H.; Chuang, Y.C.; Tzeng, G.H. A fuzzy integral-based model for supplier evaluation and improvement. Inf. Sci. 2014, 266, 199–217. [Google Scholar] [CrossRef]
- Hu, Y.C.; Chiu, Y.J.; Hsu, C.S.; Chang, Y.Y. Identifying key factors for introducing GPS-based fleet management systems to the logistics industry. Math. Probl. Eng. 2015, 2015, 413203. [Google Scholar] [CrossRef] [Green Version]
- Chiu, Y.J.; Chiu, S.H. Key factors of supply chain risk for the procurement of automobile manufacturer from China. NTU Manag. Rev. 2015, 28, 61–96. [Google Scholar]
- Jiang, P.; Hu, Y.C.; Yen, G.F.; Tsao, S.J. Green supplier selection for sustainable development of the automotive industry using grey decision-making. Sustain. Dev. 2018, 26, 890–903. [Google Scholar] [CrossRef]
- Jiang, P.; Wang, W.B.; Hu, Y.C.; Chiu, Y.J.; Tsao, S.R. Pattern classification using tolerance rough sets based on non-additive grey relational analysis and DEMATEL. Grey Syst. Theory Appl. 2020, 11, 166–182. [Google Scholar] [CrossRef]
- Hu, Y.C.; Chiu, Y.J.; Yen, G.F.; Ken, Y.W. Incorporation of the DEMATEL into evaluations of CSR performance in BOT projects. Syst. Res. Behav. Sci. 2022. [Google Scholar] [CrossRef]
- Chen, J.H.Y.; Chang, H.F.; Hung, H.C.; Lin, Y.S. Integrating the MCDM method to explore the business model innovation in Taiwan: A case study in affiliated restaurants. Math. Probl. Eng. 2022, 2022, 9527219. [Google Scholar] [CrossRef]
- Zhang, W.; Jiang, H.; Shao, Q.; Shao, T. Construction of the evaluation model of open government data platform: From the perspective of citizens’ sustainable use. Sustainability 2022, 14, 1415. [Google Scholar] [CrossRef]
- Cooper, R.G. The components of risk in new product development: Project New Prod. R D Manag. 1981, 11, 47–54. [Google Scholar] [CrossRef]
- Keizer, J.A.; Vos, J.P.; Halman, J.I.M. Risks in new product development: Devising a reference tool. R D Manag. 2005, 35, 297–309. [Google Scholar] [CrossRef]
- Ozer, M. Factors which influence decision making in new product evaluation. Eur. J. Oper. Res. 2005, 163, 784–801. [Google Scholar] [CrossRef]
- Chin, K.S.; Tang, D.W.; Yang, J.B.; Wong, S.Y.; Wang, H. Assessing new product development project risk by Bayesian network with a systematic probability generation methodology. Expert Syst. Appl. 2009, 36, 9879–9890. [Google Scholar] [CrossRef]
- Ayala-Cruz, J. Project risk planning in high-tech new product development. Acad. Rev. Latinoam. Adm. 2016, 29, 110–124. [Google Scholar] [CrossRef]
- Moenaert, R.K.; De Meyer, A.; Souder, W.E.; Deschoolmeester, D.R. R&D/marketing communication during the fuzzy front-end. IEEE Trans. Eng. Manag. 1995, 42, 243–258. [Google Scholar] [CrossRef]
- Kim, Y.J.; Vonortas, N.S. Managing risk in the formative years: Evidence from Young Enterprises in Europe. Technovation 2014, 34, 454–465. [Google Scholar] [CrossRef]
- Keizera, J.A.; Halman, J.I.M.; Song, M. From experience: Applying the risk diagnosing methodology. J. Prod. Innov. Manag. 2002, 19, 213–232. [Google Scholar] [CrossRef]
- Milliken, F.J. Three types of perceived uncertainty about the environment: State, effect, and response uncertainty. Acad. Manag. Rev. 1987, 12, 133–143. [Google Scholar] [CrossRef]
- Park, Y.H. A study of risk management and performance measures on new product development. Asian J. Qual. 2010, 11, 39–48. [Google Scholar] [CrossRef]
- Ahuja, G. Collaboration networks, structural holes, and innovation: A longitudinal study. Adm. Sci. Q. 2000, 45, 425–455. [Google Scholar] [CrossRef] [Green Version]
- Jerrard, R.; Hands, D. (Eds.) Design Management: Exploring Fieldwork and Applications, 1st ed.; Routledge: New York, NY, USA, 2007. [Google Scholar]
- Sun, W.Y.; Lee, J.Y. The Study of Key Risk Factors for Research and Development Project. In Proceedings of the Interdisciplinary Integrated Management Seminar 2011, Taipei, Taiwan, 25 June 2011; pp. 238–252. [Google Scholar]
- Shishodia, A.; Dixit, V.; Verma, P. Project risk analysis based on project characteristics. Benchmarking 2018, 25, 893–918. [Google Scholar] [CrossRef]
- Oehmen, J.; Guenther, A.; Herrmann, J.W.; Schulte, J.; Willumsen, P. Risk management in product development: Risk identification, assessment, and mitigation—A literature review. Proc. Des. Soc. Des. Conf. 2020, 1, 657–666. [Google Scholar] [CrossRef]
- Hu, Y.C.; Tsai, J.F. Backpropagation multi-layer perceptron for incomplete pairwise comparison matrices in analytic hierarchy process. Appl. Math. Comput. 2006, 180, 53–62. [Google Scholar] [CrossRef]
- Huang, S.M.; Chang, S.I.; Su, K.H. Critical success factors for implementing BS7799 information security management system-based on petrochemical industry. J. Inf. Manag. 2006, 13, 171–192. [Google Scholar]
- Schulze-González, E.; Pastor-Ferrando, J.P.; Aragonés-Beltrán, P. Testing a recent DEMATEL-based proposal to simplify the use of ANP. Mathematics 2021, 9, 1605. [Google Scholar] [CrossRef]
- Lin, C.L.; Hsieh, M.S.; Tzeng, G.H. Evaluating Vehicle Telematics System by using a novel MCDM techniques with dependence and feedback. Expert Syst. Appl. 2010, 37, 6723–6736. [Google Scholar] [CrossRef]
- Martilla, J.A.; James, J.C. Importance-performance analysis. J. Mark. 1977, 41, 77–79. [Google Scholar] [CrossRef]
- Tyrrell, T.J.; Okrant, M.J. Importance-performance analysis: Some recommendations from an economic planning perspective. Tour. Anal. 2004, 9, 63–76. [Google Scholar] [CrossRef]
Figure 1.
Research flowchart.

Figure 2.
The DANP framework of this study.

Figure 3.
Four quadrants of IPA.

Figure 4.
Causal diagram for evaluation criteria.

Figure 5.
Schematic diagram of the importance of criteria and performance values. Note: (1) The vertical red line represents the threshold value of performance, the left side of the red line represents low performance, and the right side of the red line represents high performance. (2) The horizontal red line represents the threshold value of importance, the upper part of the red line represents high importance, and the lower part of the red line represents low importance. (3) The area of the graph where the standard performance was lower than 3.5 and the importance value was higher than 14 was classified as the “concentrate here” quadrant. (4) The blue dots represent all the criteria.


Table 1.
Aspects and criteria of the preliminary framework.
| Aspect/Criterion | Definition of Criterion | References |
|---|---|---|
| A. Organizational level | [15]; [18]; [20]; [24]; [26,27,28] | |
| A1. Organizational change adjustment | Changes in the organization or scale of the R&D project have an impact on its effectiveness. | [16]; [18]; [20]; [24]; [26,27] |
| A2. Support from senior executives | The supervisor in the team makes promises to their team members, from top to bottom. | [16]; [18]; [20]; [24]; [26,27] |
| A3. Product portfolio uncertainty | Marketing and project managers’ mastery of future market demand and risk assessment. | [16]; [18]; [20]; [24]; [26,27] |
| A4. Inter-departmental communication | Communication between different departments within the same organization. Every organization works like an organic body, and every department communicates and collaborates with other departments. In the process of completing work, cross-department interaction is involved. | [16]; [18]; [20]; [24]; [26,27] |
| B. Cost risk | [20]; [25,26,27] | |
| B1. Production procedure | For different products, different models of manufacturing services are used to provide customers with high-quality products with detailed and complete production schedules or manufacturing processes. | [15]; [17,18]; [26,27] |
| B2. Design change cost | During the project, the cost of the product increases owing to functional changes and changes in implementation of the design. | [17,18]; [26,27] |
| B3. Raw material/exchange rate/price fluctuation | The need to understand raw material/exchange rate/price fluctuations to reduce the rise in R&D costs. | [15]; [17,18]; [26,27] |
| B4. Customer demand uncertainty cost | The cost incurred in project development owing to the uncertainty of the client. | [17,18]; [20]; [23]; [26,27,28] |
| B5. Bargaining power | It is difficult to obtain raw materials and have bargaining power, which can curb costs. | [18]; [20]; [26,27] |
| C. Time risk | [26,27] | |
| C1. Project completion time | This includes the impacts of the risk of development/timeliness of evaluation, time of changes in design, and human resources on the project schedule. | [17,18]; [26,27] |
| C2. Project progress control | This involves controlling the completeness and adaptability of process planning in each stage of the project. | [16,17,18]; [26,27] |
| C3. Ability to control the current market situation | Owing to significant changes in the market, it is necessary to understand the competitive situation in the market in real time. Companies have begun providing different products for different consumer groups in response to market needs; thus, it is important to understand the needs and sources of customers in the entire market accurately. | [15,16,17,18]; [20]; [23]; [26,27,28] |
| D. R&D technology | [15]; [18]; [20]; [22]; [26,27,28] | |
| D1. Mastery of key technical capabilities | The technical capabilities of core R&D, as well as understanding the requirements of the customer/industry, have an impact on the quality of the project. | [15]; [17,18]; [20]; [26,27] |
| D2. Project uniqueness and complexity | R&D projects feature innovations and changes, which can increase the competitive advantages of the product and increase the success rate of the project. | [15,16,17,18]; [20]; [26,27] |
| D3. Patent layout | When entering the market, the scale of patents can affect product competitiveness. | [15]; [20]; [26,27] |
| D4. Product functional integrity | This is the impact of risk on quality owing to the inability of the product to meet customer specifications. | [15]; [17]; [20]; [26,27] |
| D5. Product usage | Feedback on the use of client products can be used as a basis for subsequent NPD and improvement, improving product quality. | [17]; [20]; [26]; [27] |
| E. Supplier risk | [15]; [17]; [26,27] | |
| E1. Supplier Evaluation | This involves evaluating the supplier’s supply quality and service, rental price, punctuality, and creditworthiness to lay the foundation for supplier selection. | [15]; [17]; [26,27] |
| E2. Supplier’s production equipment and capacity | If the supplier’s production equipment is good and its production capacity meets the given requirements, the risk in product development decreases. | [15]; [17]; [26,27] |
| E3. Supplier’s technical capabilities | The supplier’s capabilities must be mature and stable to cooperate with NPD. If the supplier has excellent technical capabilities, the risk of product development decreases. | [15]; [17]; [26,27] |
| F. Human Resources | [15,16]; [18]; [20]; [26,27,28] | |
| F1. Educational training | The company plans to assist employees in acquiring work-related knowledge, skills, and behavioral patterns for the employees to apply the aforementioned learning outcomes as their goal in their work. | [16]; [18]; [20]; [26,27] |
| F2. Human resource management | This is the management work performed by completing the tasks involving people or personnel. A high rate of personnel transfer or turnover complicates the project. Arrange the right people in the appropriate positions at the right time so that they can efficiently help the organization achieve its overall goals. | [15,16]; [18]; [20]; [26,27] |
Table 2.
The details of column (d), row (r), d + r, d − r, and ranking.
| Aspect | Column Sum (d) | Row Sum (r) | Row and Column Sum (d + r) | Row and Column Difference (d − r) | Rank |
|---|---|---|---|---|---|
| A | 6.092 | 6.815 | 12.908 | −0.723 | 2 |
| B | 6.358 | 6.363 | 12.720 | −0.005 | 4 |
| C | 6.958 | 7.101 | 14.060 | −0.143 | 1 |
| D | 6.896 | 5.857 | 12.753 | 1.040 | 3 |
| E | 5.404 | 5.572 | 10.976 | −0.169 | 5 |
Table 3.
The rankings of DEMATEL and DANP.
| Aspect | DEMATEL | DANP | Borda Score | Overall Rankings |
|---|---|---|---|---|
| A | 2 | 4 | 6 | 3 |
| B | 4 | 3 | 7 | 4 |
| C | 1 | 1 | 2 | 1 |
| D | 3 | 2 | 5 | 2 |
| E | 5 | 5 | 10 | 5 |
Table 4.
Expert personnel’s study and experience statistics.
| Basic Information | |||
|---|---|---|---|
| Expert | Age | Education | Work Experience/R&D Related Work |
| A | 48 | Master’s | 23 years/20 years |
| B | 36 | Master’s | 15 years/12 years |
| C | 36 | Master’s | 19 years/8 years |
| D | 42 | Bachelor’s | 16 years/14 years |
| E | 37 | Bachelor’s | 20 years/10 years |
| F | 30 | Bachelor’s | 8 years/7 years |
| G | 31 | Master’s | 5 years/5 years |
| H | 45 | Bachelor’s | 23 years/9 years |
| I | 50 | Master’s | 26 years/20 years |
| J | 55 | Master’s | 18 years/15 years |
Table 5.
Aspects and criteria of the formal framework.
| Aspect | Criteria | Description |
|---|---|---|
| Organizational level (A) | Organizational adjustment (A1) | Changes in the organization and scale of the R&D project, or the overall prosperity of the environment, have an impact on its effectiveness. |
| Inter-departmental communication (A2) | This involves communication between departments within the same organization. Every organization works like an organic body, and every department communicates and collaborates with other departments. In the process of completing the work, cross-departmental interactions are involved. | |
| Incremental cost risk (B) | Raw material/exchange rate/price fluctuation (B1) | There is a need to understand raw material/exchange rate/price fluctuations to reduce the R&D costs. |
| Customer demand uncertainty cost (B2) | This is the cost incurred in project development owing to the uncertainty of the client. | |
| Time risk (C) | Project completion time (C1) | This includes the impacts of risk owing to the time required for development/evaluation, changes in design, and human resource-related tasks on the project schedule. |
| Project progress control (C2) | This involves controlling the completeness and adaptability of planning for the work in each stage of the project. | |
| Ability to control the market situation (C3) | Owing to frequent changes in the market, it is necessary to understand the competitive situation in real time. Companies have begun providing different products for different consumer groups in response to market needs. Thus, it is important to sufficiently understand the needs of different customer groups in the market. | |
| R&D technology (D) | Mastery of key technical capabilities (D1) | The technical capabilities of core R&D, as well as the process requirements of the customer/industry, have a risk-related impact on the quality of project development. |
| Project uniqueness and complexity (D2) | R&D projects feature innovations and changes that can increase the competitive advantages of products and increase the success rate of projects. | |
| Patent layout (D3) | When entering the market, the scale of patents can affect product competitiveness. | |
| Product functional integrity (D4) | This is the impact of risk on quality owing to the inability of the product to meet customer specifications. | |
| Product usage (D5) | Feedback on client products can be used as a basis for subsequent product development and improvement, improving product quality. | |
| Supplier risk (E) | Supplier capability and evaluation (E1) | The technical capabilities of the supplier must be mature and stable, and their supply quality and service level, rental price, punctuality, and creditworthiness must be evaluated to lay the foundation for the selection of the supplier. |
Table 6.
Total influence relationship matrix established according to the criteria.
| Criteria | A1 | A2 | B1 | B2 | C1 | C2 | C3 | D1 | D2 | D3 | D4 | D5 | E1 | d |
|---|---|---|---|---|---|---|---|---|---|---|---|---|---|---|
| A1 | 0.3720 | 0.5259 | 0.4107 | 0.3651 | 0.5618 | 0.5698 | 0.5263 | 0.5294 | 0.5101 | 0.4421 | 0.5203 | 0.4376 | 0.4411 | 6.2122 |
| A2 | 0.4644 | 0.4675 | 0.4467 | 0.4023 | 0.6090 | 0.6175 | 0.5618 | 0.6020 | 0.5572 | 0.4667 | 0.5361 | 0.4709 | 0.4785 | 6.6807 |
| B1 | 0.3289 | 0.3780 | 0.3285 | 0.3451 | 0.4705 | 0.4947 | 0.4551 | 0.4612 | 0.4276 | 0.3931 | 0.4661 | 0.3980 | 0.4415 | 5.3883 |
| B2 | 0.4088 | 0.4752 | 0.4317 | 0.3322 | 0.5314 | 0.5397 | 0.5312 | 0.5566 | 0.5225 | 0.4531 | 0.5335 | 0.4390 | 0.4654 | 6.2204 |
| C1 | 0.5275 | 0.6194 | 0.5252 | 0.4513 | 0.5791 | 0.6783 | 0.6444 | 0.6672 | 0.6261 | 0.5452 | 0.6336 | 0.5410 | 0.5551 | 7.5934 |
| C2 | 0.5187 | 0.5955 | 0.4977 | 0.4410 | 0.6368 | 0.5582 | 0.6181 | 0.6179 | 0.5748 | 0.5120 | 0.5863 | 0.5027 | 0.5257 | 7.1853 |
| C3 | 0.4533 | 0.5300 | 0.4823 | 0.4419 | 0.5903 | 0.6207 | 0.5142 | 0.5914 | 0.5475 | 0.5189 | 0.5917 | 0.5312 | 0.5385 | 6.9519 |
| D1 | 0.5193 | 0.5929 | 0.4948 | 0.4440 | 0.6479 | 0.6599 | 0.6294 | 0.5540 | 0.6056 | 0.5286 | 0.6035 | 0.5124 | 0.5351 | 7.3273 |
| D2 | 0.5185 | 0.5990 | 0.4975 | 0.4415 | 0.6475 | 0.6371 | 0.6247 | 0.6470 | 0.5140 | 0.5257 | 0.6008 | 0.5402 | 0.5349 | 7.3283 |
| D3 | 0.4312 | 0.5170 | 0.4181 | 0.3823 | 0.5419 | 0.5410 | 0.5258 | 0.5544 | 0.4998 | 0.3901 | 0.5109 | 0.4463 | 0.4555 | 6.2143 |
| D4 | 0.4658 | 0.5391 | 0.4890 | 0.4293 | 0.6039 | 0.6180 | 0.5975 | 0.6023 | 0.5668 | 0.5328 | 0.5059 | 0.5360 | 0.5453 | 7.0317 |
| D5 | 0.4024 | 0.4682 | 0.4345 | 0.3668 | 0.5118 | 0.5211 | 0.5163 | 0.5033 | 0.4639 | 0.4199 | 0.4847 | 0.3713 | 0.4426 | 5.9068 |
| E1 | 0.3599 | 0.4395 | 0.4195 | 0.3502 | 0.4740 | 0.4855 | 0.4581 | 0.4614 | 0.3966 | 0.3836 | 0.4467 | 0.3881 | 0.3523 | 5.4157 |
| r | 5.7708 | 6.7473 | 5.8762 | 5.1929 | 7.4059 | 7.5415 | 7.2029 | 7.3482 | 6.8124 | 6.1119 | 7.0200 | 6.1145 | 6.3116 | 85.4562 |
Table 7.
Importance and relevance of corresponding criteria.
| Criteria | Column Sum (d) | Row Sum (r) | Row and Column Sum (d + r) | Row and Column Difference (d − r) | Rank |
|---|---|---|---|---|---|
| Organizational adjustment (A1) | 6.2122 | 5.7708 | 11.9830 | 0.4414 | 10 |
| Inter-departmental communication (A2) | 6.6807 | 6.7473 | 13.4280 | −0.0667 | 7 |
| Raw material/exchange rate/price fluctuation (B1) | 5.3883 | 5.8762 | 11.2645 | −0.4879 | 13 |
| Customer demand uncertainty cost (B2) | 6.2204 | 5.1929 | 11.4133 | 1.0275 | 12 |
| Project completion time (C1) | 7.5934 | 7.4059 | 14.9993 | 0.1874 | 1 |
| Project progress control (C2) | 7.1853 | 7.5415 | 14.7268 | −0.3562 | 2 |
| Ability to control the current market situation (C3) | 6.9519 | 7.2029 | 14.1547 | −0.2510 | 4 |
| Mastery of key technical capabilities (D1) | 7.3273 | 7.3482 | 14.6755 | −0.0209 | 3 |
| Project uniqueness and complexity (D2) | 7.3283 | 6.8124 | 14.1407 | 0.5159 | 5 |
| Patent layout (D3) | 6.2143 | 6.1119 | 12.3262 | 0.1024 | 8 |
| Product functional integrity (D4) | 7.0317 | 7.0200 | 14.0517 | 0.0116 | 6 |
| Product usage status (D5) | 5.9068 | 6.1145 | 12.0213 | −0.2076 | 9 |
| Supplier ability and evaluation (E1) | 5.4157 | 6.3116 | 11.7273 | −0.8959 | 11 |
Table 8.
Ultimate super matrix established according to the criteria.
| Criteria | A1 | A2 | B1 | B2 | C1 | C2 | C3 | D1 | D2 | D3 | D4 | D5 | E1 |
|---|---|---|---|---|---|---|---|---|---|---|---|---|---|
| A1 | 0.0727 | 0.0727 | 0.0727 | 0.0727 | 0.0727 | 0.0727 | 0.0727 | 0.0727 | 0.0727 | 0.0727 | 0.0727 | 0.0727 | 0.0727 |
| A2 | 0.0782 | 0.0782 | 0.0782 | 0.0782 | 0.0782 | 0.0782 | 0.0782 | 0.0782 | 0.0782 | 0.0782 | 0.0782 | 0.0782 | 0.0782 |
| B1 | 0.0630 | 0.0630 | 0.0630 | 0.0630 | 0.0630 | 0.0630 | 0.0630 | 0.0630 | 0.0630 | 0.0630 | 0.0630 | 0.0630 | 0.0630 |
| B2 | 0.0727 | 0.0727 | 0.0727 | 0.0727 | 0.0727 | 0.0727 | 0.0727 | 0.0727 | 0.0727 | 0.0727 | 0.0727 | 0.0727 | 0.0727 |
| C1 | 0.0888 | 0.0888 | 0.0888 | 0.0888 | 0.0888 | 0.0888 | 0.0888 | 0.0888 | 0.0888 | 0.0888 | 0.0888 | 0.0888 | 0.0888 |
| C2 | 0.0842 | 0.0842 | 0.0842 | 0.0842 | 0.0842 | 0.0842 | 0.0842 | 0.0842 | 0.0842 | 0.0842 | 0.0842 | 0.0842 | 0.0842 |
| C3 | 0.0813 | 0.0813 | 0.0813 | 0.0813 | 0.0813 | 0.0813 | 0.0813 | 0.0813 | 0.0813 | 0.0813 | 0.0813 | 0.0813 | 0.0813 |
| D1 | 0.0858 | 0.0858 | 0.0858 | 0.0858 | 0.0858 | 0.0858 | 0.0858 | 0.0858 | 0.0858 | 0.0858 | 0.0858 | 0.0858 | 0.0858 |
| D2 | 0.0857 | 0.0857 | 0.0857 | 0.0857 | 0.0857 | 0.0857 | 0.0857 | 0.0857 | 0.0857 | 0.0857 | 0.0857 | 0.0857 | 0.0857 |
| D3 | 0.0727 | 0.0727 | 0.0727 | 0.0727 | 0.0727 | 0.0727 | 0.0727 | 0.0727 | 0.0727 | 0.0727 | 0.0727 | 0.0727 | 0.0727 |
| D4 | 0.0822 | 0.0822 | 0.0822 | 0.0822 | 0.0822 | 0.0822 | 0.0822 | 0.0822 | 0.0822 | 0.0822 | 0.0822 | 0.0822 | 0.0822 |
| D5 | 0.0691 | 0.0691 | 0.0691 | 0.0691 | 0.0691 | 0.0691 | 0.0691 | 0.0691 | 0.0691 | 0.0691 | 0.0691 | 0.0691 | 0.0691 |
| E1 | 0.0634 | 0.0634 | 0.0634 | 0.0634 | 0.0634 | 0.0634 | 0.0634 | 0.0634 | 0.0634 | 0.0634 | 0.0634 | 0.0634 | 0.0634 |
Table 9.
Sorting summary of criterion weight.
| Criteria | DEMATEL Importance Ranking | DANP Weight Ranking | Borda Score | Overall Ranking |
|---|---|---|---|---|
| Organizational adjustment (A1) | 10 | 10 | 20 | 9 |
| Inter-departmental communication (A2) | 7 | 7 | 14 | 7 |
| Raw material/exchange rate/price fluctuation (B1) | 13 | 13 | 26 | 13 |
| Customer demand uncertainty cost (B2) | 12 | 9 | 21 | 11 |
| Project completion time (C1) | 1 | 1 | 2 | 1 |
| Project progress control (C2) | 2 | 4 | 6 | 3 |
| Ability to control the current market situation (C3) | 4 | 6 | 10 | 5 |
| Mastery of key technical capabilities (D1) | 3 | 2 | 5 | 2 |
| Project uniqueness and complexity (D2) | 5 | 3 | 8 | 4 |
| Patent layout (D3) | 8 | 8 | 16 | 8 |
| Product functional integrity (D4) | 6 | 5 | 11 | 6 |
| Product usage status (D5) | 9 | 11 | 20 | 9 |
| Supplier ability and evaluation (E1) | 11 | 12 | 23 | 12 |
Table 10.
Total influence matrix that determines the mutual influence relationship among key influence criteria.
Table 10.
Total influence matrix that determines the mutual influence relationship among key influence criteria.
| Criteria | A1 | A2 | B1 | B2 | C1 | C2 | C3 | D1 | D2 | D3 | D4 | D5 | E1 |
|---|---|---|---|---|---|---|---|---|---|---|---|---|---|
| A1 | 0.3720 | 0.5259 | 0.4107 | 0.3651 | 0.5618 | 0.5698 | 0.5263 | 0.5294 | 0.5101 | 0.4421 | 0.5203 | 0.4376 | 0.4411 |
| A2 | 0.4644 | 0.4675 | 0.4467 | 0.4023 | 0.6090 | 0.6175 | 0.5618 | 0.6020 | 0.5572 | 0.4667 | 0.5361 | 0.4709 | 0.4785 |
| B1 | 0.3289 | 0.3780 | 0.3285 | 0.3451 | 0.4705 | 0.4947 | 0.4551 | 0.4612 | 0.4276 | 0.3931 | 0.4661 | 0.3980 | 0.4415 |
| B2 | 0.4088 | 0.4752 | 0.4317 | 0.3322 | 0.5314 | 0.5397 | 0.5312 | 0.5566 | 0.5225 | 0.4531 | 0.5335 | 0.4390 | 0.4654 |
| C1 | 0.5275 | 0.6194 | 0.5252 | 0.4513 | 0.5791 | 0.6783 | 0.6444 | 0.6672 | 0.6261 | 0.5452 | 0.6336 | 0.5410 | 0.5551 |
| C2 | 0.5187 | 0.5955 | 0.4977 | 0.4410 | 0.6368 | 0.5582 | 0.6181 | 0.6179 | 0.5748 | 0.5120 | 0.5863 | 0.5027 | 0.5257 |
| C3 | 0.4533 | 0.5300 | 0.4823 | 0.4419 | 0.5903 | 0.6207 | 0.5142 | 0.5914 | 0.5475 | 0.5189 | 0.5917 | 0.5312 | 0.5385 |
| D1 | 0.5193 | 0.5929 | 0.4948 | 0.4440 | 0.6479 | 0.6599 | 0.6294 | 0.5540 | 0.6056 | 0.5286 | 0.6035 | 0.5124 | 0.5351 |
| D2 | 0.5185 | 0.5990 | 0.4975 | 0.4415 | 0.6475 | 0.6371 | 0.6247 | 0.6470 | 0.5140 | 0.5257 | 0.6008 | 0.5402 | 0.5349 |
| D3 | 0.4312 | 0.5170 | 0.4181 | 0.3823 | 0.5419 | 0.5410 | 0.5258 | 0.5544 | 0.4998 | 0.3901 | 0.5109 | 0.4463 | 0.4555 |
| D4 | 0.4658 | 0.5391 | 0.4890 | 0.4293 | 0.6039 | 0.6180 | 0.5975 | 0.6023 | 0.5668 | 0.5328 | 0.5059 | 0.5360 | 0.5453 |
| D5 | 0.4024 | 0.4682 | 0.4345 | 0.3668 | 0.5118 | 0.5211 | 0.5163 | 0.5033 | 0.4639 | 0.4199 | 0.4847 | 0.3713 | 0.4426 |
| E1 | 0.3599 | 0.4395 | 0.4195 | 0.3502 | 0.4740 | 0.4855 | 0.4581 | 0.4614 | 0.3966 | 0.3836 | 0.4467 | 0.3881 | 0.3523 |
Publisher’s Note: MDPI stays neutral with regard to jurisdictional claims in published maps and institutional affiliations. |
© 2022 by the authors. Licensee MDPI, Basel, Switzerland. This article is an open access article distributed under the terms and conditions of the Creative Commons Attribution (CC BY) license (https://creativecommons.org/licenses/by/4.0/).
Share and Cite
MDPI and ACS Style
Chiu, Y.-J.; Hu, Y.-C.; Yao, C.-Y.; Yeh, C.-H. Identifying Key Risk Factors in Product Development Projects. Mathematics 2022, 10, 1295. https://doi.org/10.3390/math10081295
AMA Style
Chiu Y-J, Hu Y-C, Yao C-Y, Yeh C-H. Identifying Key Risk Factors in Product Development Projects. Mathematics. 2022; 10(8):1295. https://doi.org/10.3390/math10081295
Chicago/Turabian StyleChiu, Yu-Jing, Yi-Chung Hu, Chia-Yin Yao, and Chia-Hung Yeh. 2022. "Identifying Key Risk Factors in Product Development Projects" Mathematics 10, no. 8: 1295. https://doi.org/10.3390/math10081295
Note that from the first issue of 2016, this journal uses article numbers instead of page numbers. See further details here.