Article

Forecasting the Passage Time of the Queue of Highly Automated Vehicles Based on Neural Networks in the Services of Cooperative Intelligent Transport Systems

1
Department of Automobile Transportation, South Ural State University (National Research University), 454080 Chelyabinsk, Russia
2
Department of Road Traffic Management and Safety, Moscow Automobile and Road Construction State Technical University, 125319 Moscow, Russia
3
Department of Aeronautical Engineering, South Ural State University (National Research University), 454080 Chelyabinsk, Russia
4
Department of Transportation of the Academy of Engineering, Peoples’ Friendship University of Russia, 117198 Moscow, Russia
5
Department of Machine-Tractor Fleet Operation, South Ural State Agrarian University, 457100 Troitsk, Russia
*
Author to whom correspondence should be addressed.
Mathematics 2022, 10(2), 282; https://doi.org/10.3390/math10020282
Submission received: 11 November 2021 / Revised: 9 January 2022 / Accepted: 13 January 2022 / Published: 17 January 2022
(This article belongs to the Special Issue Intelligent Computing in Industry Applications)

Abstract

:
This study addresses the problem of non-stop passage by vehicles at intersections based on special processing of data from a road camera or video detector. The basic task in this article is formulated as a forecast for the release time of a controlled intersection by non-group vehicles, taking into account their classification and determining their number in the queue. To solve the problem posed, the YOLOv3 neural network and the modified SORT object tracker were used. The work uses a heuristic region-based algorithm in classifying and measuring the parameters of the queue of vehicles. On the basis of fuzzy logic methods, a model for predicting the passage time of a queue of vehicles at controlled intersections was developed and refined. The elaborated technique allows one to reduce the forced number of stops at controlled intersections of connected vehicles by choosing the optimal speed mode. The transmission of information on the predicted delay time at a controlled intersection is locally possible due to the V2X communication of the road controller equipment, and in the horizontally scaled mode due to the interaction of HAV—the Digital Road Model.

1. Introduction

There is a continuous and uncontrolled increase in the number of cars in many major cities around the world. This phenomenon gives rise to many issues in the management of the transport system, such as traffic jams, environmental degradation, and the growth of traffic accidents [1,2,3,4,5,6,7]. Current solutions and technologies for traffic movement regulation, such as the “green wave”, “Smart traffic light”, and an increase in the number of lanes, have nearly reached their limit [8,9,10,11,12,13,14]. In order to organize the non-stop passage of intersections, various groups of scientists are developing applications that provide communication between vehicles and infrastructure Vehicle to Vehicle (V2V) and Vehicle to Infrastructure (V2I). The combination of V2V and V2I, known as the Vehicle to Everything (V2X) link, provides an estimate of traffic density [15,16,17,18,19,20,21,22,23]. This ensures calculation of the optimal speed of the vehicle to minimize the engine idling when stopping at intersections [24,25,26,27,28,29,30]. There are already lots of prototypes of such solutions to date, some of which have already passed a number of tests and are used as commercial and non-commercial products. Moreover, the features provided by such assistants may be quite different from each other. Lack of timely and accurate data from drivers on the operation mode of traffic lights and the presence of a transport queue at the intersection do not allow them to choose a speed that ensures non-stop travel.
Modern car navigators can plot a route taking into account the traffic organization and support address search. They can have an extensive infrastructure base. Some models can receive and take into account information on the traffic situation while planning a route, and, if possible, avoiding serious traffic congestion.
In recent years, researchers and major car manufacturers have been developing and implementing driver assistance systems (Connected Assistants) that will dictate how fast the vehicle needs to move and when the traffic light at the nearest intersection will change. In 2016, Audi, in cooperation with Traffic Technology Services, started testing the Audi Traffic Light Information (TLI) “assistant” [22]. This system displays a panel (or display) countdown until the green traffic light signal of the traffic light turns on (if the red signal is active); the countdown until the stop traffic light signal turns on simultaneously with the recommended speed (if the green signal is active). BMW has an app called Traffic Light Assistant (TLA), which requires a connected smartphone. The difference between TLA and TLI lies in providing information on traffic signals with variable phase times. In the future, adaptive cruise control may be added to these assistants, which allows the car to slow down and then stop, burning even less fuel [27]. The characteristic feature of such assistants is that they take into account traffic lights located in front at a distance of up to 180 m. They also take into account some of the cars located nearby, but only those in which the same systems are installed. The advantages of using V2V and V2I are obvious, yet there are problems related to their use. The communication between infrastructure and vehicles is enabled by the use of wireless data transmission technologies [28,30].
To ensure the safety and sustainable movement of traffic flows, continuous access to the network and secure communication are required regardless of the mobility of the vehicle [23]. The disadvantages of these systems are also represented by the delay in data transmission and the lack of accurate information on the parameters of road traffic at the following intersection. However, these solutions have a common drawback—they do not take into account the fact that queues are formed in front of the intersections, waiting for a traffic light to continue driving.
The active development of information technology (IT) solutions (the use of modern achievements in the field of computer technology, high technologies, the latest means of communication, and software) for recognition and classification of transport, with the interpretation of big data from outdoor video surveillance cameras as the classic equipment of intelligent transport systems, provides ample opportunities in tackling the challenges of ensuring the stable road traffic, as well as serves as a good addition to V2X communications [31,32,33,34,35,36,37].
Therefore, due to the means of digital road infrastructure, road users, including highly automated vehicles, receive additional situational awareness of the traffic conditions on the route. One of the services implemented by this system is the provision of the non-stop passage of highly automated vehicles at controlled intersections.
The results obtained in this paper are essential from a practical standpoint. The recommended speed for vehicles approaching a signalized intersection is calculated by a new predictive system that solves the problem of reducing the number of stops at regulated intersections of connected vehicles. The paper describes the problem of determining the possibility of crossing an intersection according to the set characteristics and calculates the required travel speed. It gives a possible solution to this problem. To solve the problem, the following parameters are taken into account: the distance between the car and the intersection, the regulation phase, the time until the end of the current phase, and the queue of vehicles at the intersection. Using these characteristics, the traffic situation is simulated and the vehicle speed needed to cross the intersection without stopping is calculated.
The experimental results demonstrate that the proposed system can predict the time of passing controlled intersections by a queue of vehicles and reduce the forced number of stops to 14% by optimizing the speed rate. The paper also proposes a conceptual scheme for implementing the service of cooperative intelligent transport systems, as well as the transfer of information to the digital road model and onboard the car to inform the driver and/or to develop control actions in highly automated vehicles.
The rest of the paper is arranged as follows: Section 2 provides an overview of research on the considered subject; Section 3 describes a methodology for recognizing and classifying vehicles using neural networks and presents a model of a predictive system. Section 4 presents the use of fuzzy logic methods to simulate vehicle movement; Section 5 introduces simulation using the Python programming language; Section 6 discusses the obtained results and further areas of research.

2. Related Works

Many scientific papers have dealt with the problem of reducing delays at controlled intersections in the conditions of congestions. Liu and Chang [38] conditionally divided the approaches to studying this issue into mathematical programming and modeling. The approach based on mathematical programming [39,40,41] is aimed at increasing the traffic capacity with minimal delays at intersections and has several substantial drawbacks. This approach does not take into account the length of the vehicle queue at the intersection formed during the stop traffic light signal or those vehicles that did not manage to pass during the green traffic light signal.
The modeling-based approach allows one to take into account the interaction of traffic flows. The developed models allow one to take into account the complex interaction of the parameters of the traffic flow state and its unstable nature to optimize the traffic light signal time and increase the traffic capacity at controlled intersections [42,43]. There is a wide variety of models used for traffic management: the split, cycle, and offset optimization technique (SCOOT) [44,45,46]; optimization policies for adaptive control (OPAC) [47]; real-time hierarchical optimizing distributed effective system (RHODES) [48]; store-and-forward modeling [49,50,51]; meta networks (METANET) [52,53], etc.
Shelby [54] compared adaptive traffic signal management systems, such as OPAC, PRODYN (programmation dynamique), COP (controlled optimization of phases).
ALLONS-D (adaptive limited lookahead optimization of network signals—decentralized version), SCOOT, and outlined the main drawbacks of adaptive control, of which to overcome, a multiple computational load on modern controllers is needed. Notably, the PRODYN approach is computationally complex in oversaturated situations. The use of the depth first search (DFS) method in ALLONS-D results in major computational savings and delays are significantly reduced through the use of the planning horizon. The computational efficiency of COP (version 97) is superior to all other considered algorithms without the unduly worsening of delays.
Connected and autonomous vehicle (CAV) technology has been actively used to organize the coordinated movement of vehicles crossing intersections. An approach based on space–time intervals is applied for the operational control of CAV [55], using the double-loop spatial position associating time series (SPATS) and the acceleration dynamically adjusting based on predicted trajectory (ADAPT) methods. The proposed approach effectively regulates the traffic flow with an input flow of 650 vehicles per hour; when this threshold is exceeded, the vehicles’ delay continues to increase. The approach is based on a single vehicle type and does not take into account unconnected vehicles as traffic participants.
Driving autonomous vehicles at an intersection with minimal travel times and avoiding accidents is suggested in [56]. The research presents a form of the problem of limited nonlinear optimization, which is approximated using neural networks. The effectiveness of the proposed method is demonstrated using the CarSim modeling environment. This approach (similarly to the previous one [55]) does not take into account the scenario when there are human-controlled vehicles in the traffic flow.
VANET (vehicular adhoc network) has been widely used to improve traffic management in urban conditions. It uses wireless communication between vehicles and roadside units (RSU). It is assumed that each vehicle is equipped with a wireless communication system transmitting information on the vehicle (type, speed, and travel direction) to special units located near the traffic lights at the intersection. The obtained information allows one to reconfigure the vehicle route to less busy directions, improving safety and preventing congestions, but it does not solve the problem of congestion at the intersection itself [57,58,59,60].
Mathematical models can correctly reflect the current traffic situation but they cannot predict its changes and the behavior of individual drivers. Such models cannot cope with ambiguities and uncertainties in road traffic. In such situations, we need a different approach using fuzzy logic systems [61].
Modeling an intelligent traffic light controller through the use of fuzzy logic for adaptive changes in traffic light cycles is presented in [62]. The duration of the traffic light signal can be adjusted depending on the queue of vehicles. The implementation of the system is expensive but promises to significantly reduce the average delay as compared to a conventional fixed-time controller.
Many researchers estimated the length of the queue at the intersection in real time. They proposed several methods, e.g., using probing devices [63,64,65,66] and mobile sensors [67], based on video image processing [68]. The information on the length of the vehicle queue at the intersection is very valuable for making decisions on how to control the duration of the traffic light signal.
Traffic management is a complex system, which provides for the integration of advanced information, communication technologies, automation equipment, vehicles, and their users, i.e., the introduction of intelligent transport systems (ITS), to improve its efficiency. One of the ITS aspects is traffic forecasting, which allows one to control the parameters of the traffic flow and reduces delays, emissions, and fuel consumption, as well as increases safety.
Traffic forecasting is currently a rapidly developing area in the scientific literature due to the advances in computational technologies for the high-speed processing of big data. There are two main approaches to traffic forecasting: parametric and nonparametric [69]. The parametric approach represents autoregressive integrated moving average (ARIMA) models. The nonparametric approach uses models, such as neural networks (NNs), support vector machines (or support vector regression for a forecasting problem), and K-nearest neighbors regression. NNs-based models have gained popularity.
The division into the main types of neural networks is given in [69]. The authors distinguish and describe the following types of neural networks used for forecasting: multilayered feedforward neural networks (MLFNN), time delay neural networks (TDNN), recurrent neural networks (RNN), convolutional neural networks (CNN), deep belief networks (DBN), radial basis function neural network (RBFNN), wavelet neural networks (WNN), and fuzzy neural networks (FNN). Hybrid systems with different types of NNs are also discussed. The authors note that the development of NN learning methods and the use of new approaches make NN-based forecasting more flexible, efficient, and precise.
A learning system for real-time traffic signal management based on the Bayesian network is proposed in [70]. Not only real-time traffic data but also historical data were used to forecast the passage of the vehicle queue at the intersection. The results demonstrate that the system calculates the optimal traffic light signal time for the vehicle to pass on the priority road without compromising the delay time for the vehicle on the secondary road.
To forecast traffic flows, [71] used a spatio-temporal forecasting method combined with the K-nearest neighbor (KNN) and the long short-term memory network (LSTM). The performance results of the developed model as compared to the real traffic data and other models demonstrated the superiority of the proposed model. However, the work on the improvement of forecasting taking into account such factors as weather, traffic accidents, etc., will be continued.
Fuzzy logic methods were used to control traffic lights in real time according to the current traffic status in the model developed in [72,73]. The simulation was carried out at various scenarios of vehicle traffic conditions on the intersection lanes; the results show that the use of a fuzzy system allows one to unload the intersection over a minimum time under different traffic conditions and uneven speed of entering the intersection. The developed system is also simple and can be easily incorporated into the existing infrastructure.
Conflicting demands arise simultaneously at a controlled intersection in the existing strategies for the priority passage of buses due to the increase in their number in the traffic flow. As a result, modeling based on fuzzy logic methods [74] demonstrated that the method proposed by the authors works better than other methods in terms of the average delay of the buses themselves and the average delay of other vehicles. The proposed model does not take into account pedestrians and non-motorized vehicles in the traffic flow.
In the conditions of changing traffic at the intersection, the developed models are no longer able to work with the previous performance; therefore, [75] proposed a system using a neural network and fuzzy logic. The system is capable of self-learning and reasoning, thus decisions are made taking into account the two-lane movement. It is planned to further expand the proposed system to cover several intersections in order to reduce congestions throughout the city.
Unlike previous works, this paper describes a predictive model allowing one to calculate the speed at which the probability of passing controlled intersections without stopping increases by using the transport section (intersection) data. The solutions for improving traffic management systems proposed in the previous works have a common drawback—their work does not take into account the fact that queues are formed at intersections waiting for the green traffic light signal to continue driving. This research proposes to use information from closed-circuit television (CCTV) cameras at urban controlled intersections. If we know how many cars wait for the green traffic light signal at the nearest controlled intersection, we can calculate the speed at which a car should approach this queue to cross the intersection in a single flow.

3. Materials and Methods

The main hypothesis of the study is the idea that an increase in traffic density can have a positive impact on the capacity of intersections. This is evidenced by the fact that reducing differences in vehicle speed will (i) reduce the need to change lanes, (ii) increase the capacity of intersections, and (iii) increase road safety. Following the recommendations of the linked assistant for optimal travel speed will help achieve an increase in traffic density. Even if a small number of cars are equipped with assistants, they will still act as flow-rate regulators, because they will be the leading vehicles [29]. For this purpose, the authors propose to use information from surveillance cameras for the situations at regulated intersections of cities. Data on the number of cars at regulated intersections that are waiting for green traffic light signal will help calculate the speed at which it is necessary to reach the queue in order to cross the intersection in a single stream.
Calculation of the recommended speed should be performed by a predictive system that solves a number of local problems. This paper describes a local problem and a variant of its solution: determining the possibility of crossing an intersection according to the given characteristics and calculating the required speed of movement. To solve the problem, the following parameters are required:
  • Distance between the car and the intersection, m;
  • Time until the end of the current phase, s;
  • The number of vehicles in the queue before the intersection, units.
Using these characteristics, the traffic situation is modeled and the vehicle speed required to cross the intersection without stopping is calculated.

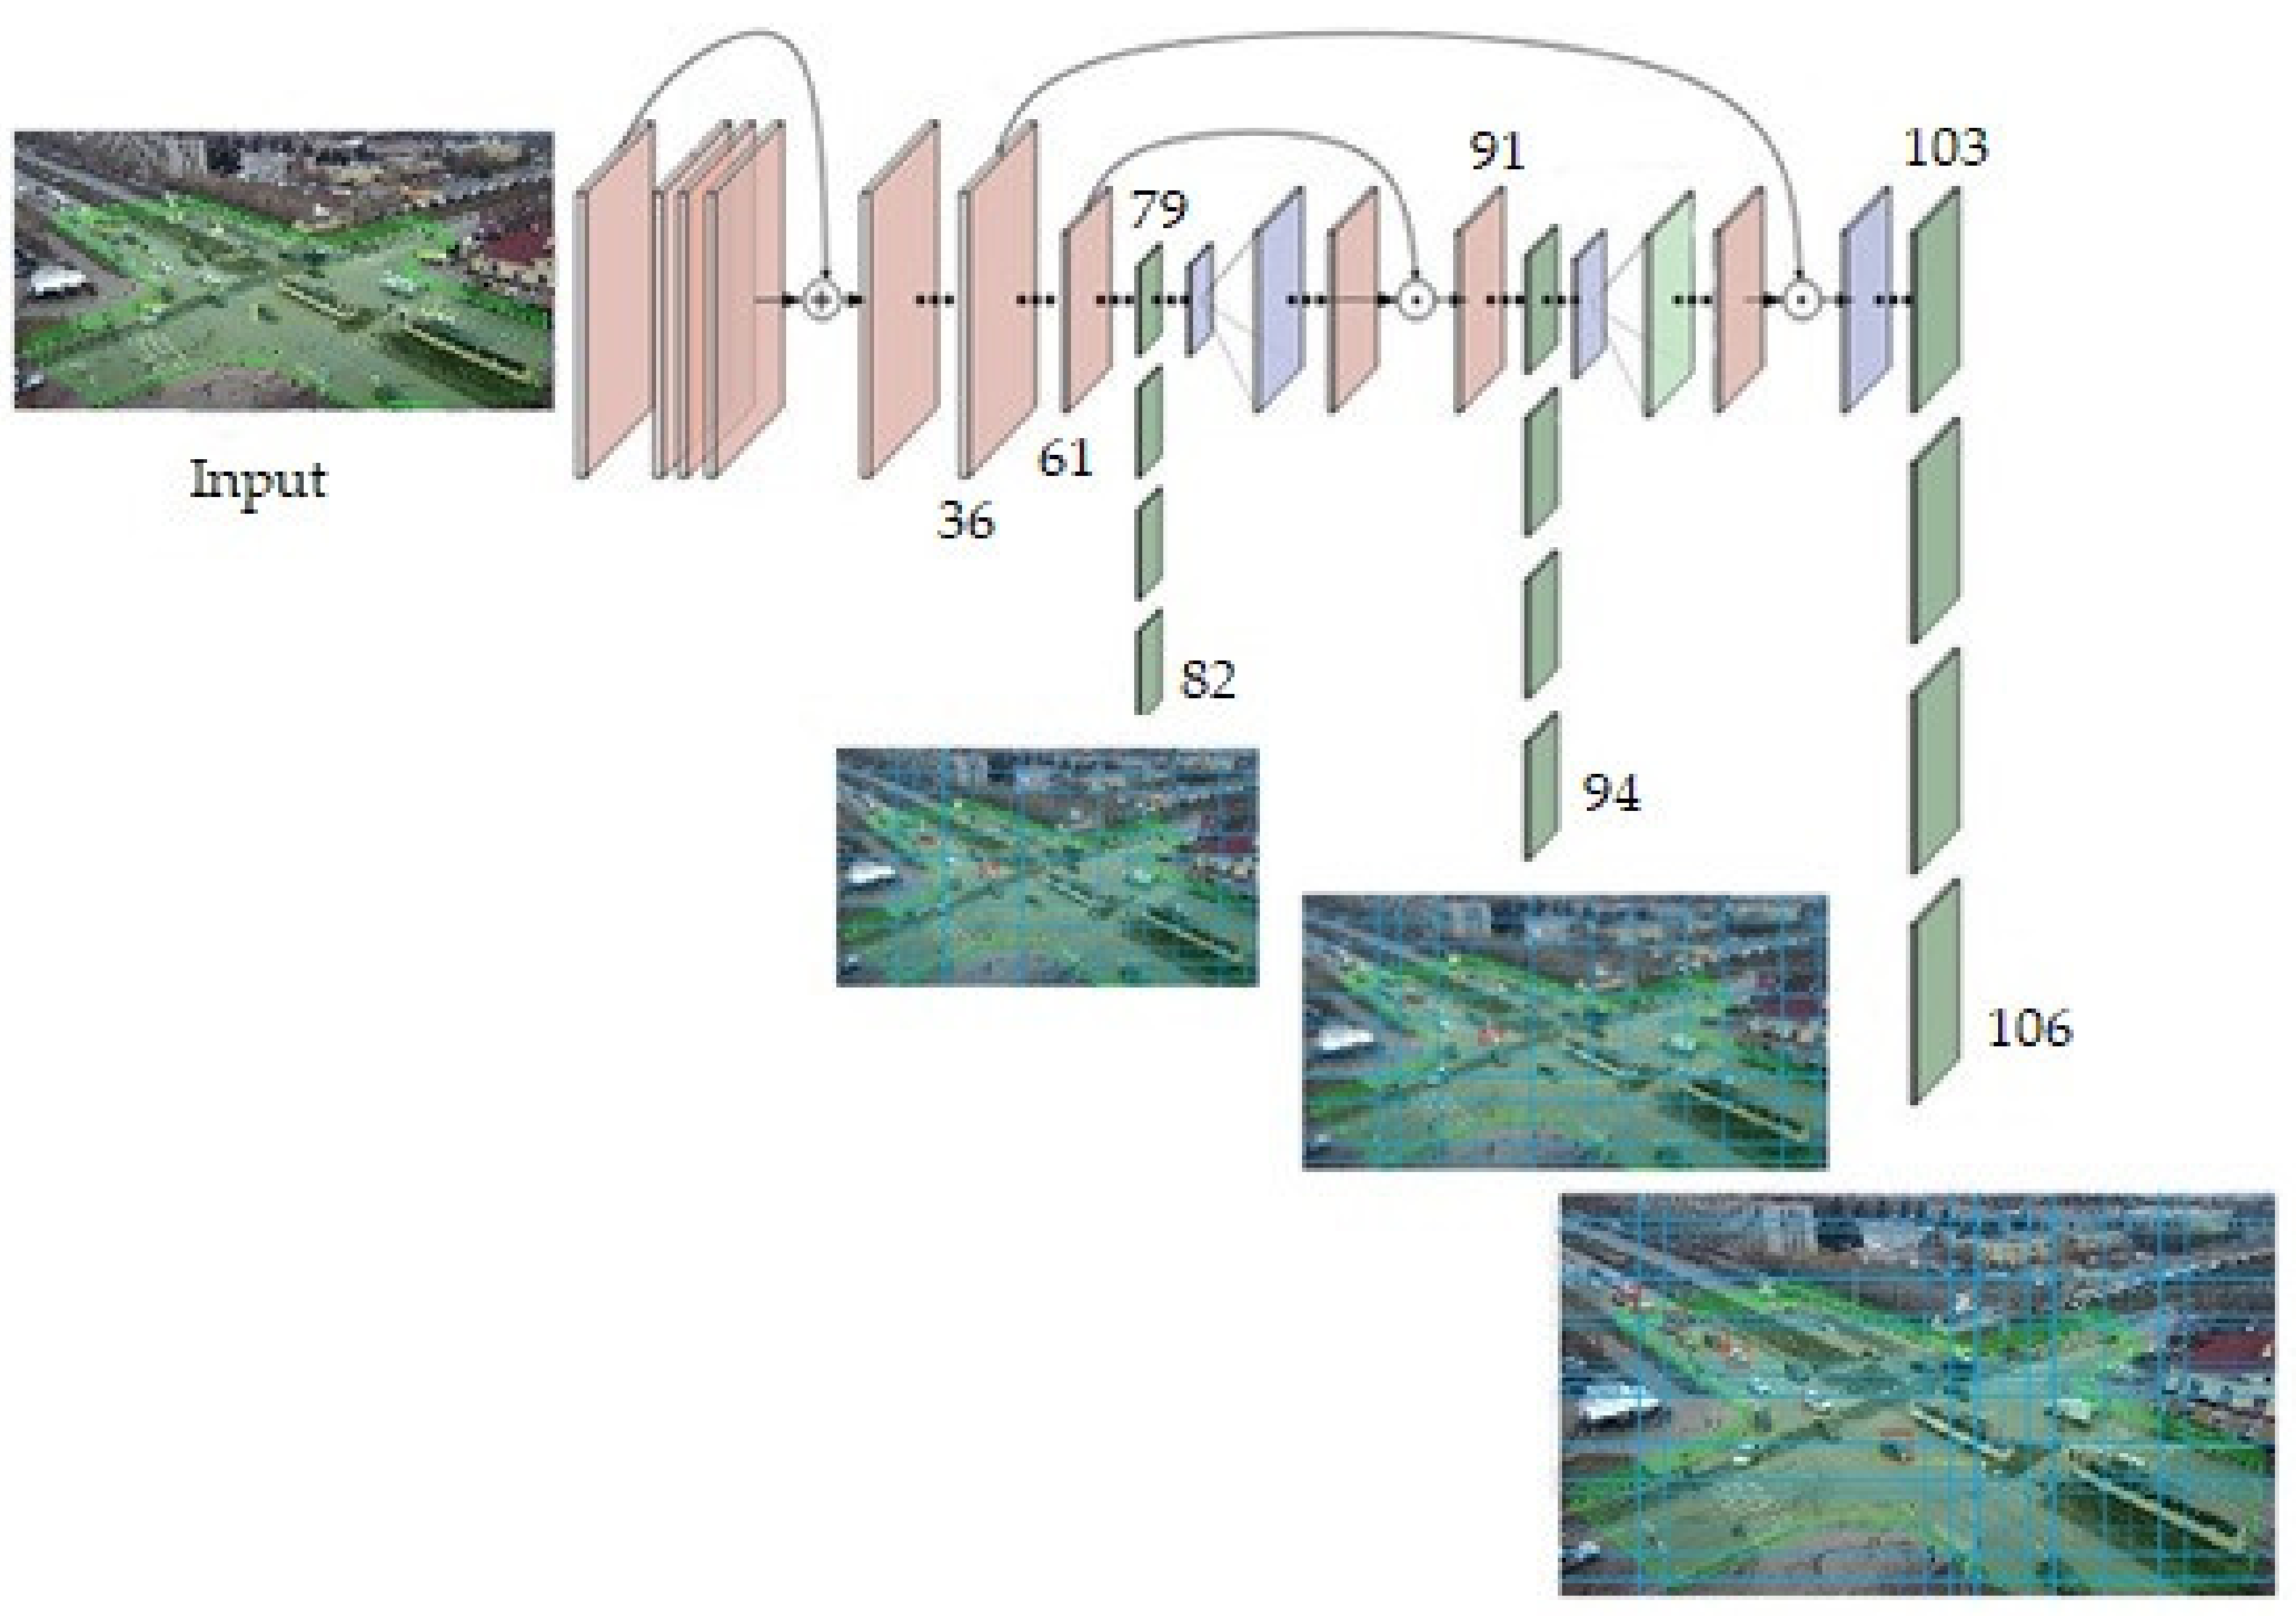
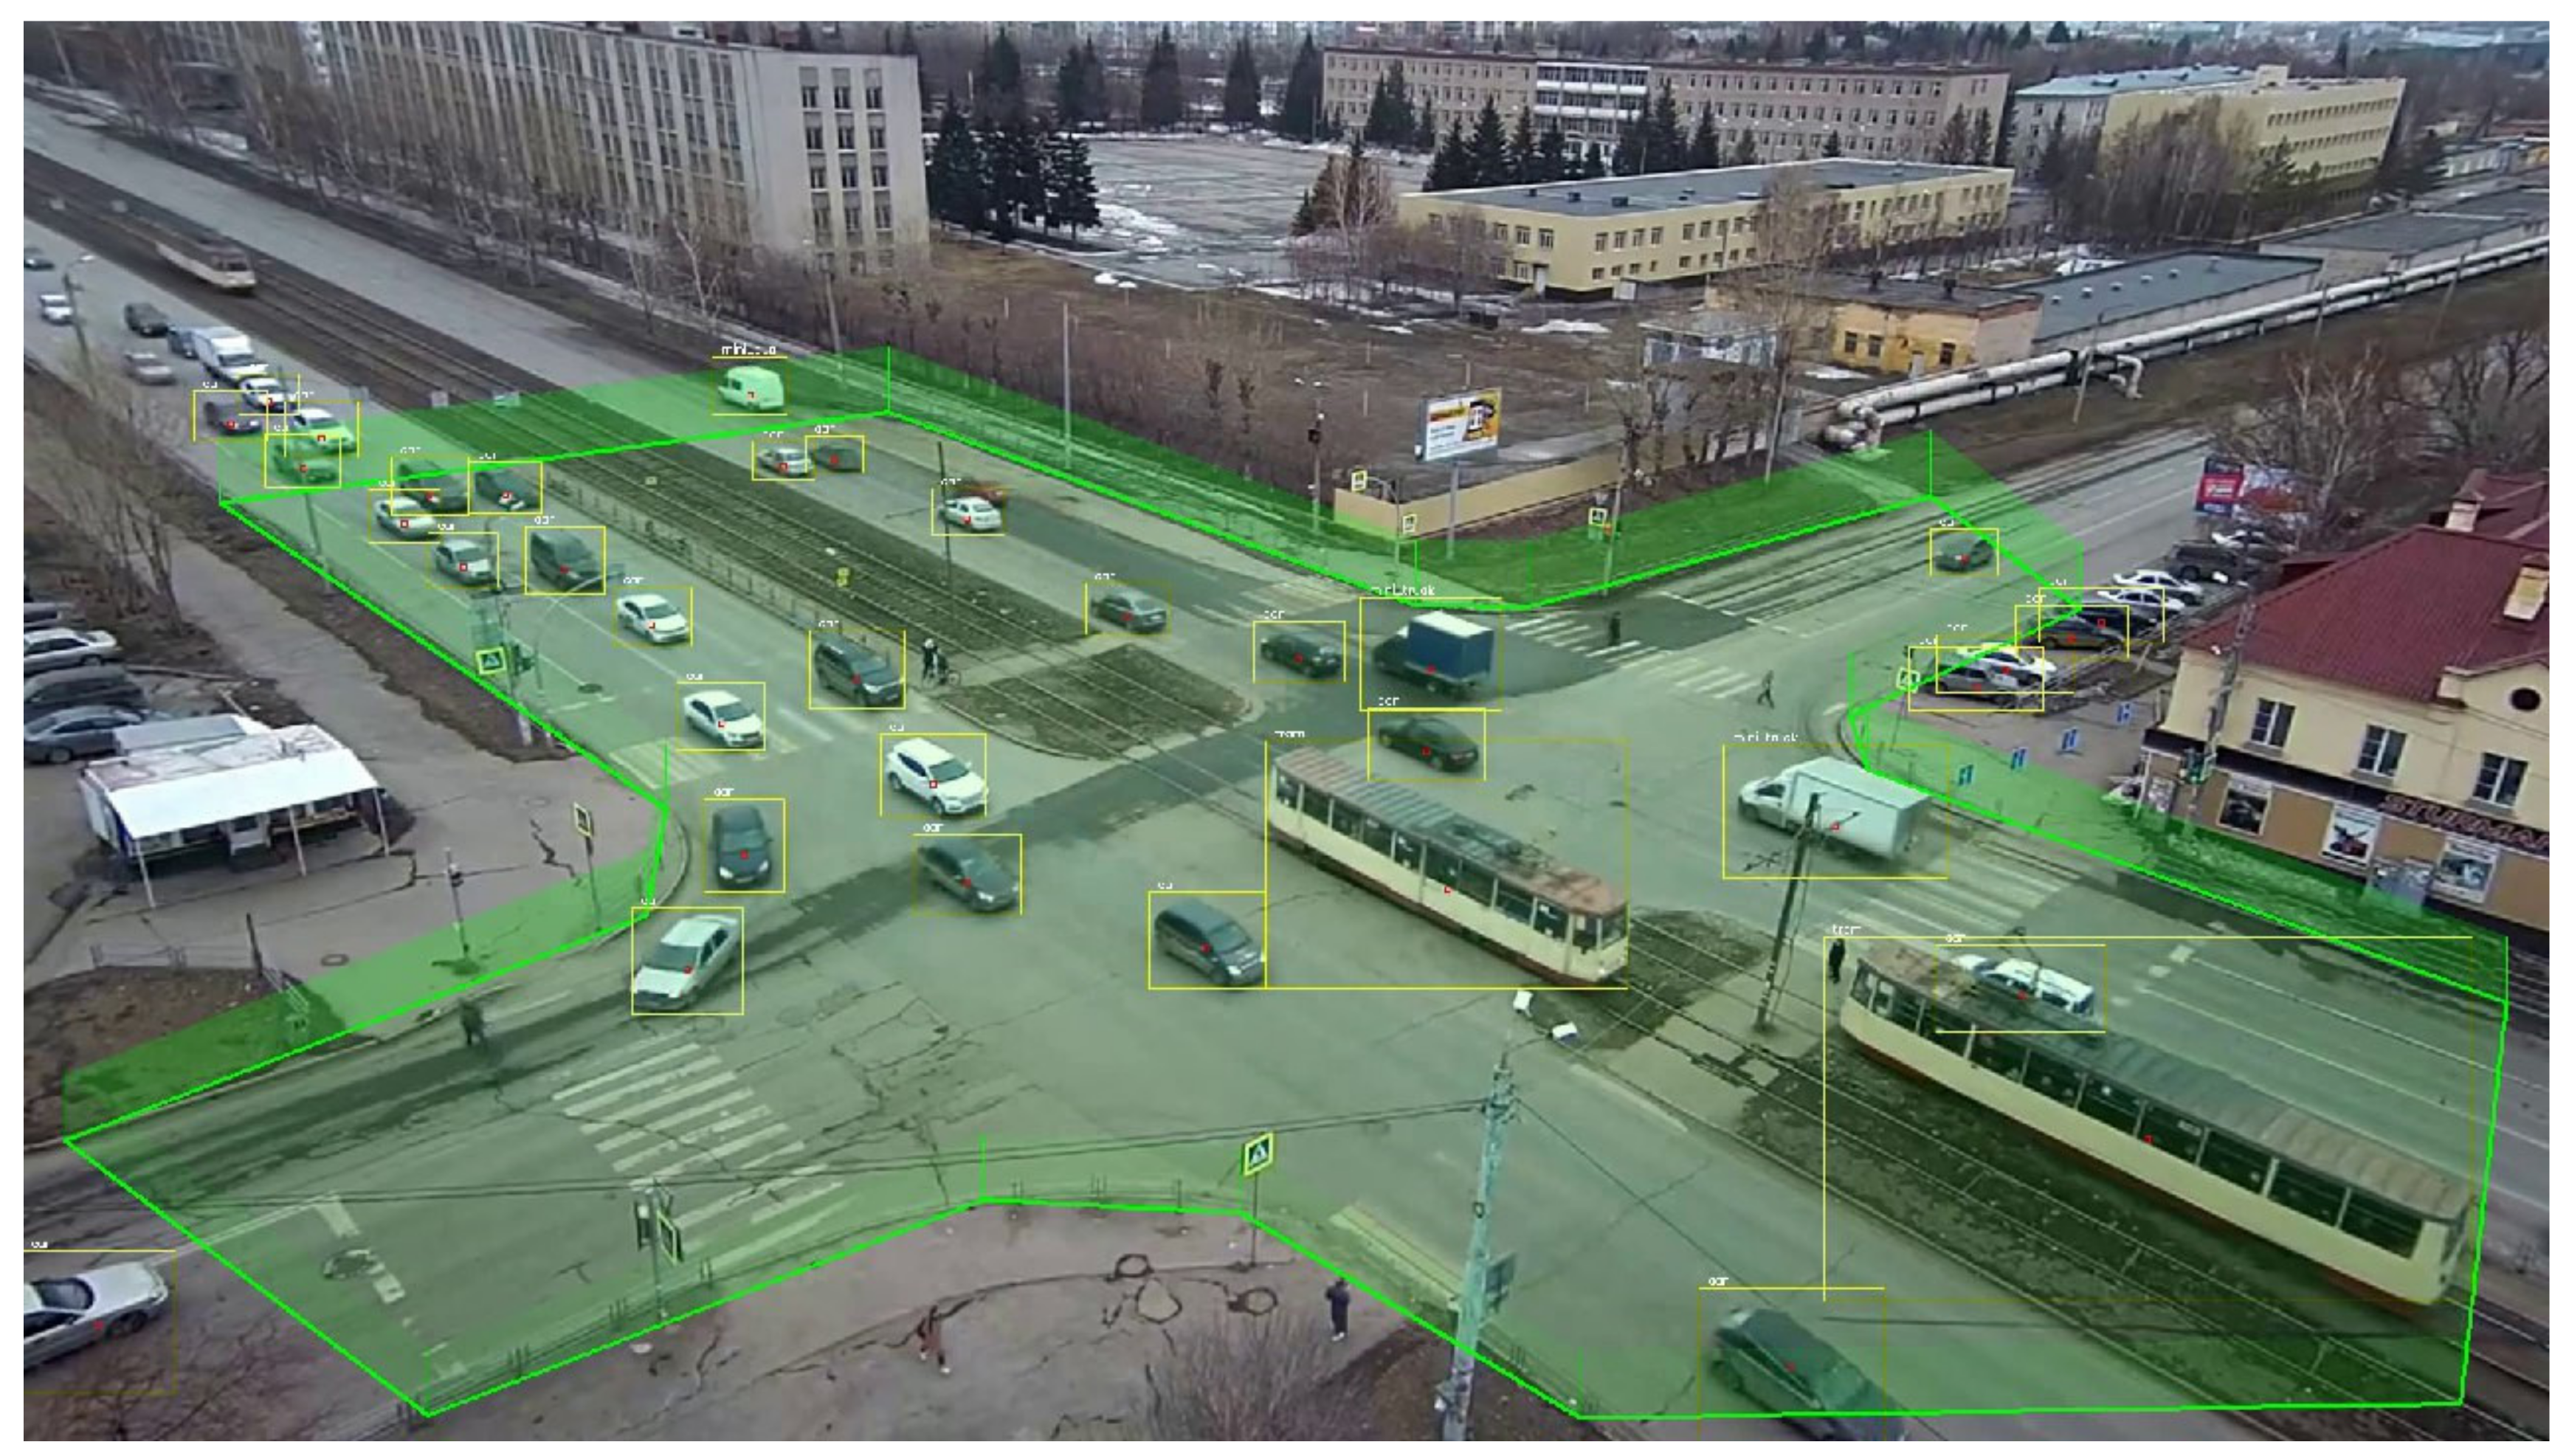
3.1. Recognition and Classification of the Queue of Vehicles Using Neural Networks

As a basis for collecting information about road traffic, we used existing city video surveillance systems, which include video cameras with different resolutions and fixed frame rates [76]. Such systems operate 24 h a day, 7 days a week and generate massive amounts of video streams. Some researchers use data from low-resolution video surveillance systems and deep neural networks to monitor traffic flows and estimate traffic density [33,34]. In contrast to the described analytical approaches, this work offers a new practical approach to collecting and analyzing data on the time it takes to pass a controlled intersection by a queue of cars. The system should collect, process, and transmit data in real time to generate control actions in highly automated vehicles (HAV is a standard vehicle equipped with up to four levels of automation (according to the Society of Automotive Engineers (SAE)) based on HYUNDAI SOLARIS). As part of the testing, it is assumed that V2X communication is implemented on the basis of 4G (long-term evolution (LTE)) mobile cellular communication and a partially implemented European Telecommunications Standards Institute (ETSI) ITS G5 protocol stack on top of LTE. A HAV transmits its high-precision geoposition to the infrastructure, with an accuracy of at least 10 cm and a frequency of 10 Hz. Based on the current HAV location, the server determines the distance to the intersection and, based on its current load, determines the recommended speed to the nearest intersection and transmits it to HAV with a frequency of 2 Hz. The driverless driving program takes into account this recommended speed and tries to adhere to it taking into account the current road situation.
In the process of training the neural network, such unfavorable conditions for traffic analysis as changeable weather and heavy traffic congestion were laid down; these factors create problems for computer processing of a video stream in real time. Situations where some vehicles overlap others, which poses significant difficulties in detection and tracking, were also taken into account.
The architecture of the neural network You Only Look Once (YOLO v3) and the open source Simple Online and Realtime Tracking (SORT tracker) were chosen as the technology for the vehicle detection and classification system [77]. The SORT tracker provides the functionality needed to track objects across multiple frames. At the next stage, taking into account the complete or incomplete trajectory of the vehicle, we need to classify its general direction of movement. To do this, you can train a shallow classifier, similar to [78,79]. The heuristic approach was found to work quite well for us during the learning process [80]. For improving the detection and classification accuracy we used multi-scale prediction with an increased number of anchors. To train the neural network, more than 9500 images were marked up and augmented, which allowed the tenfold increase of the dataset.
The trained neural network comprises 106 layers. In addition to using convolutional layers, its architecture also contains residuals [81], upsampling layers, and skipped connections (Figure 1).
To determine the time of movement of vehicles on a section of the road network, a matrix of perspective transformation of the original image to geographic coordinates was applied. The area in front of the place where the “stop line” marking is applied is divided into several non-overlapping regions. As we track the entire video sequence, we approximate the vehicle position in each frame to the center of the bottom edge of the bounding box. Given the trajectory of each vehicle in image coordinates, it is possible to assign each waypoint to one of the intersection sections. As a result, the trajectory is transformed into a sequence of visited regions, which provides for determining the time and direction of movement of vehicles.
Figure 2 shows a fragment of a neural network with a mask at one of the intersections in Chelyabinsk, Russia.
Therefore, the use of a neural network to recognize and classify the traffic flows makes it possible to obtain data on the travel time of a stop line by a queue of vehicles. A detailed description of the traffic flow detection and classification model based on neural network algorithms is presented in our previous research [36]. These are the raw data to model the system ensuring the non-stop passage by highly automated vehicles.

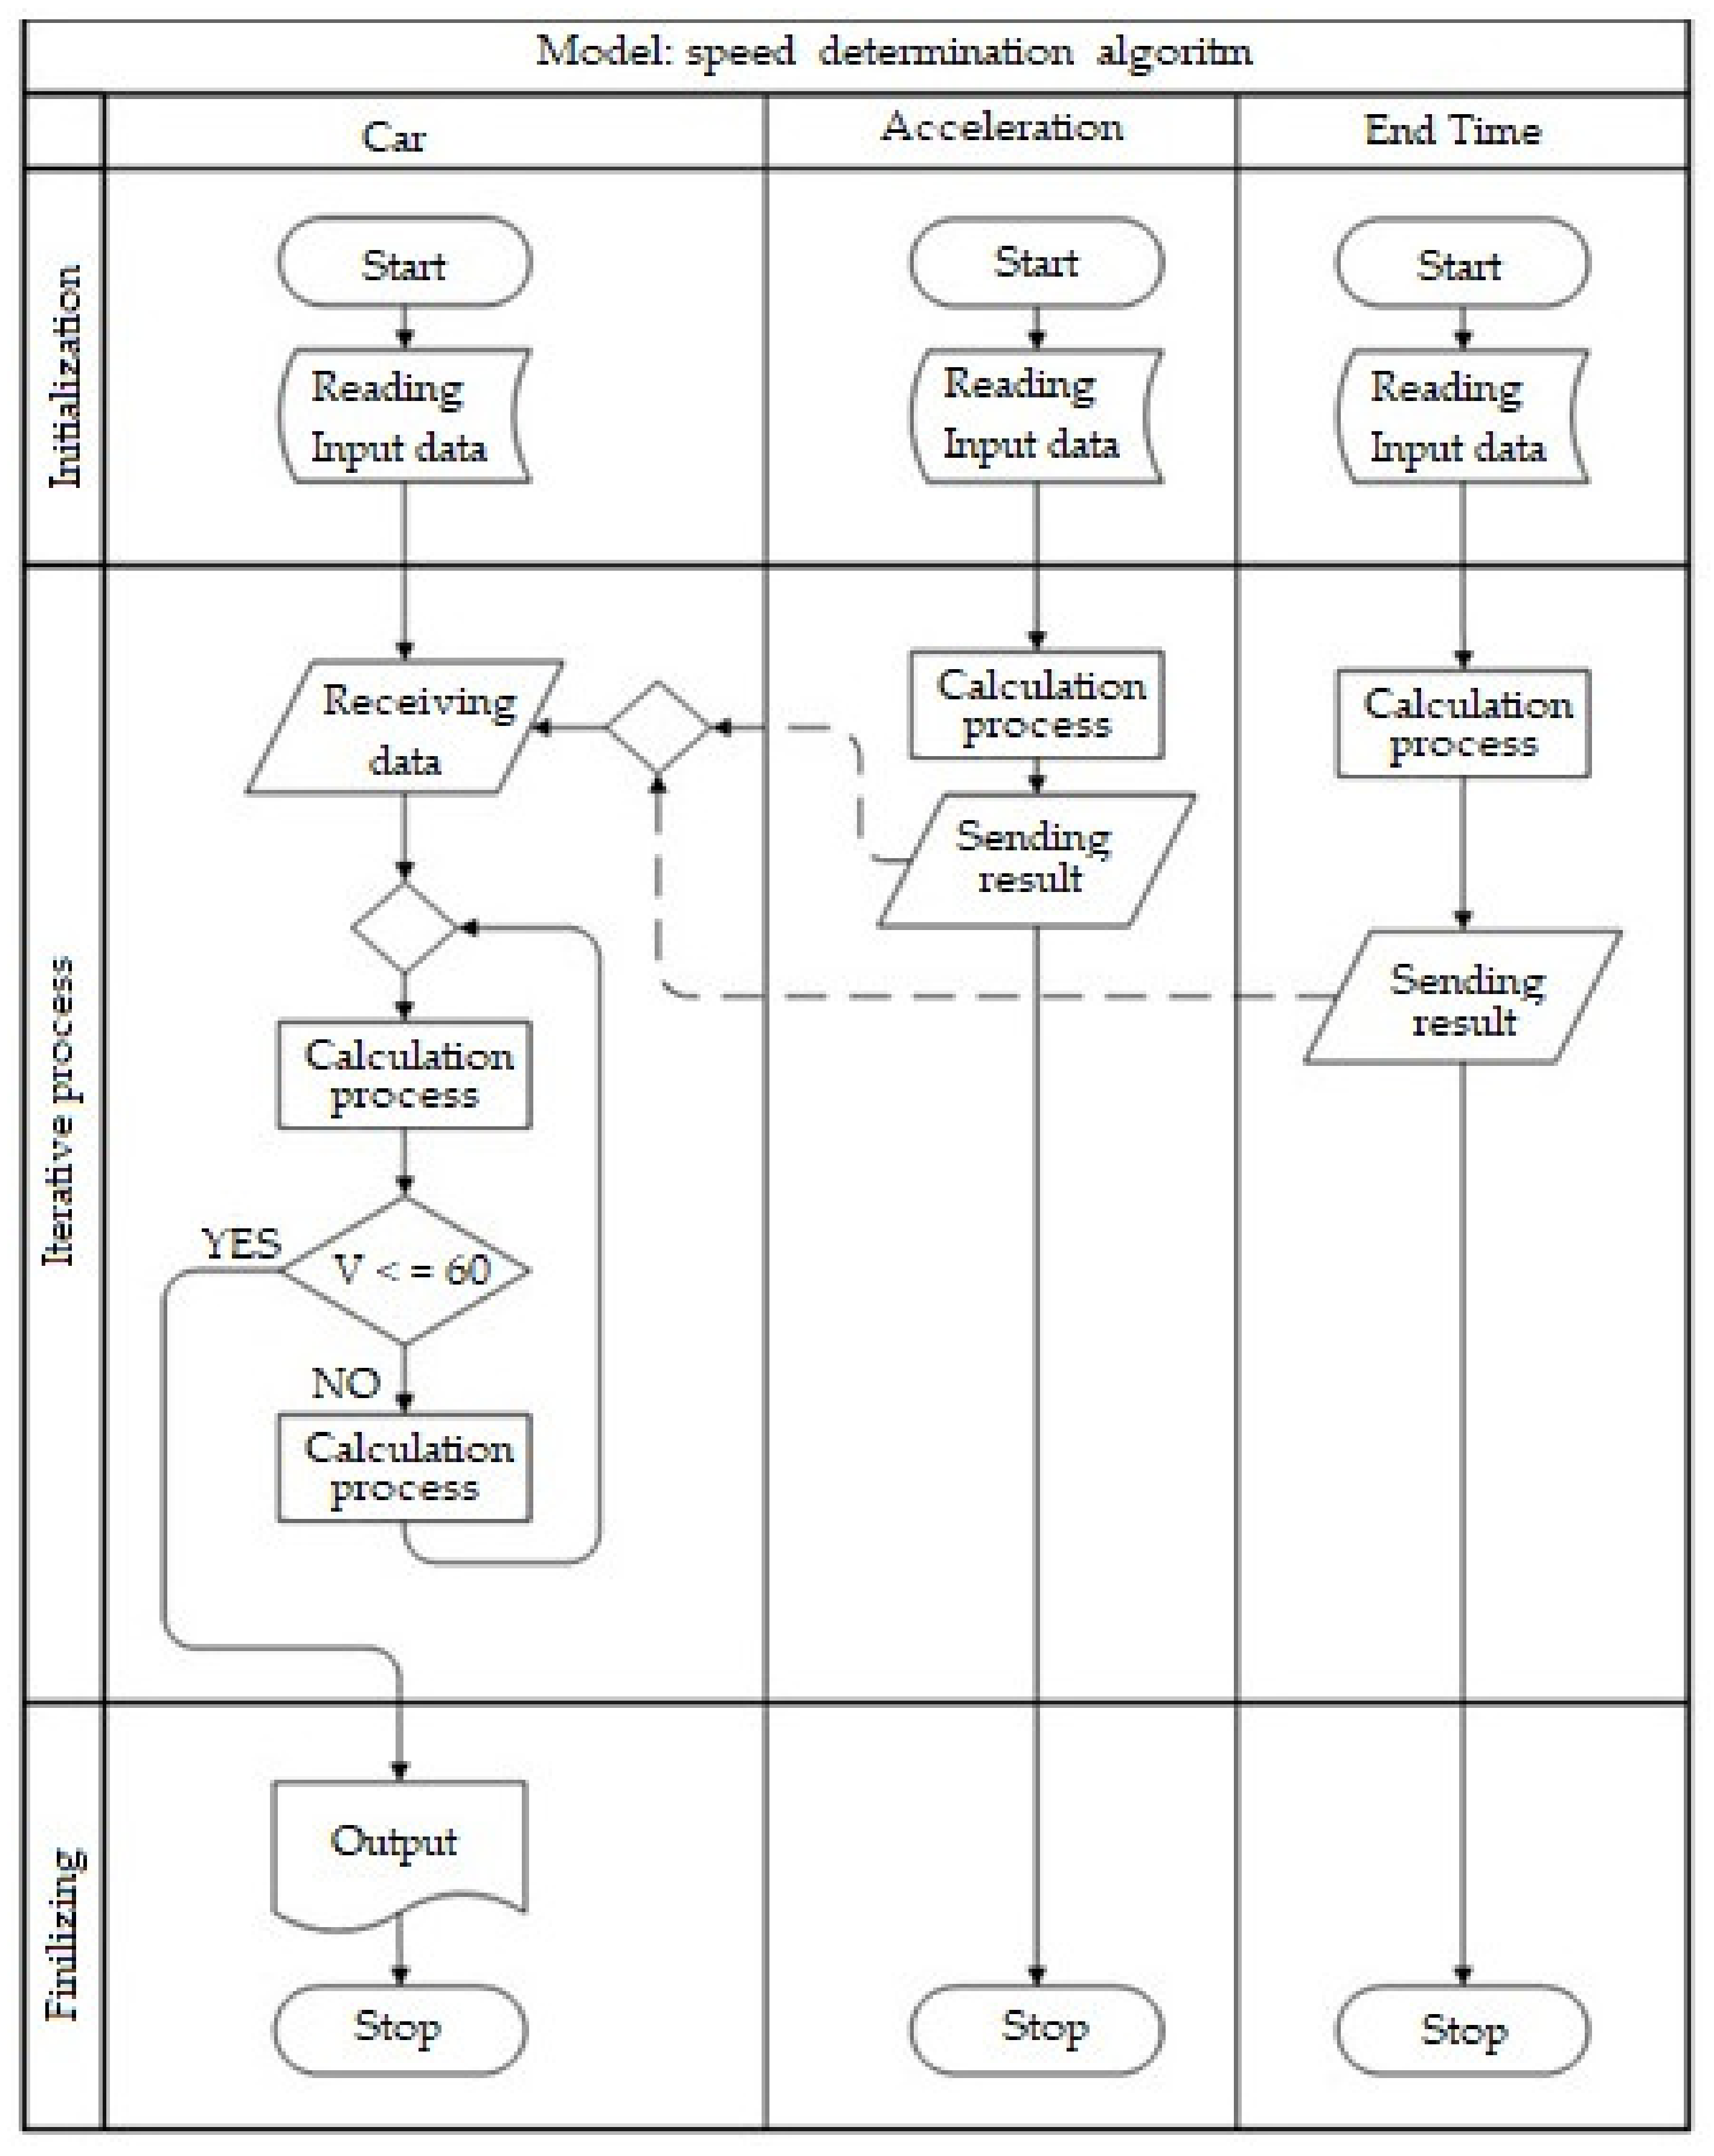
3.2. The Model of the Predictive System and the Algorithm of Its Operation

This section presents a model of a predictive system calculating the required travel speed when the vehicle is moving straight ahead to cross the nearest controlled intersection in the travel direction without stopping.
Vehicle speed (Vcar) is determined by the Equation (1) [81]. In this case, the parameter is determined from the equation for calculating the distance traveled by the car (2)–(4) [81]:
V c a r = t s t a r t t a c c e l e r a t i o n a · d t ,
where tacceleration is the time during which the car is moving with acceleration; tstart is the moment the car starts moving; a is acceleration of the car.
L = L a c c e l e r a t i o n + L s t e a d y _ m o t i o n ,
where L is the path to be traveled by the car; Lacceleration is the distance traveled by a car with non-zero acceleration; Lsteady_motion is the distance traveled by a car at a constant speed.
L a c c e l e r a t i o n = t s t a r t t a c c e l e r a t i o n a · d t 2
L s t e a d y _ m o t i o n = t a c c e l e r a t i o n t t e n d V s t e a d y _ m o t i o n · d t = t a c c e l e r a t i o n t t e n d t s t a r t t a c c e l e r a t i o n a · d t 2 ,
where tend is the time it takes a car to cover a given distance; Vsteady_motion is the speed reached by the car while accelerating.
Expressing parameter tacceleration from these Equations (2)–(4), we obtain Equation (5):
t a c c e l e r a t i o n 2 2 t e n d t s t a r t + V 0 a · t a c c e l e r a t i o n + 2 V 0 · t s t a r t a + 2 L a = 0 ,
where V0 is initial car speed. This equation can have two solutions; however, only the one shown in Equation (6) is suitable for modeling:
t a c c e l e r a t i o n = 2 t e n d t s t a r t + V 0 a 2 2 t e n d t s t a r t + V 0 a 2 4 2 V 0 · t s t a r t a + 2 L a 2 .
Parameter tend depends on the number of cars (CarMeter) waiting to pass at the intersection; the time until the end of the current regulation phase (PhaseTimer); the number of this phase (PhaseNumber); and the maximum duration of each phase T1 and T2 (for one signal cycle).
Parameter L depends on the distance from the current position of the car to the stop line of the intersection (L0) and the distance between this stop line and the line of the beginning of the conflicting directions of the intersection (to the nearest border crossing of roads) (Lcross) (7).
L = L 0 + L c r o s s
The acceleration parameter a is determined by the Equation (8) [80]. In Equation (8), D is the dynamic factor of the vehicle (the parameter characterizing the traction-speed properties of the vehicle; the maximum value for vehicles with a limited passing ability is 0.3…0.45 and for vehicles with a high passing ability it is 0.6…0.8); ψ is the coefficient of the total resistance of the road (a set parameter determining the maximum vehicle speed for a road with an even hard surface); δ is the coefficient accounting for the influence of rotating masses (the coefficient depends on the transmission ratio; it shows how many times force is needed to speed up the oscillating and rotating wheels of the car with a given acceleration, a, which is higher than the force needed to speed up only the oscillating masses); g ≈ 9.81 m/s2 is the gravity acceleration:
a = D ψ δ g
The algorithm of the model operation consists of several sections (shown in Figure 3): car, acceleration, and end time. In the end time section, parameter tend is calculated. The calculation is performed based on the following input parameters: T1, T2, PhaseNumber, PhaseTimer, and CarMeter. The calculation result is passed to the car section.
In the acceleration section, the vehicle acceleration is calculated based on Equation (8). The input data are parameters D, ψ, and δ. The calculation result is passed to the car section.
The car section calculates the speed required for a car to cross the intersection without stopping. The input data are parameters L0, Lcross, and V0. If the calculated speed exceeds the permitted speed, the recalculation takes place based on parameters T1 and T2.

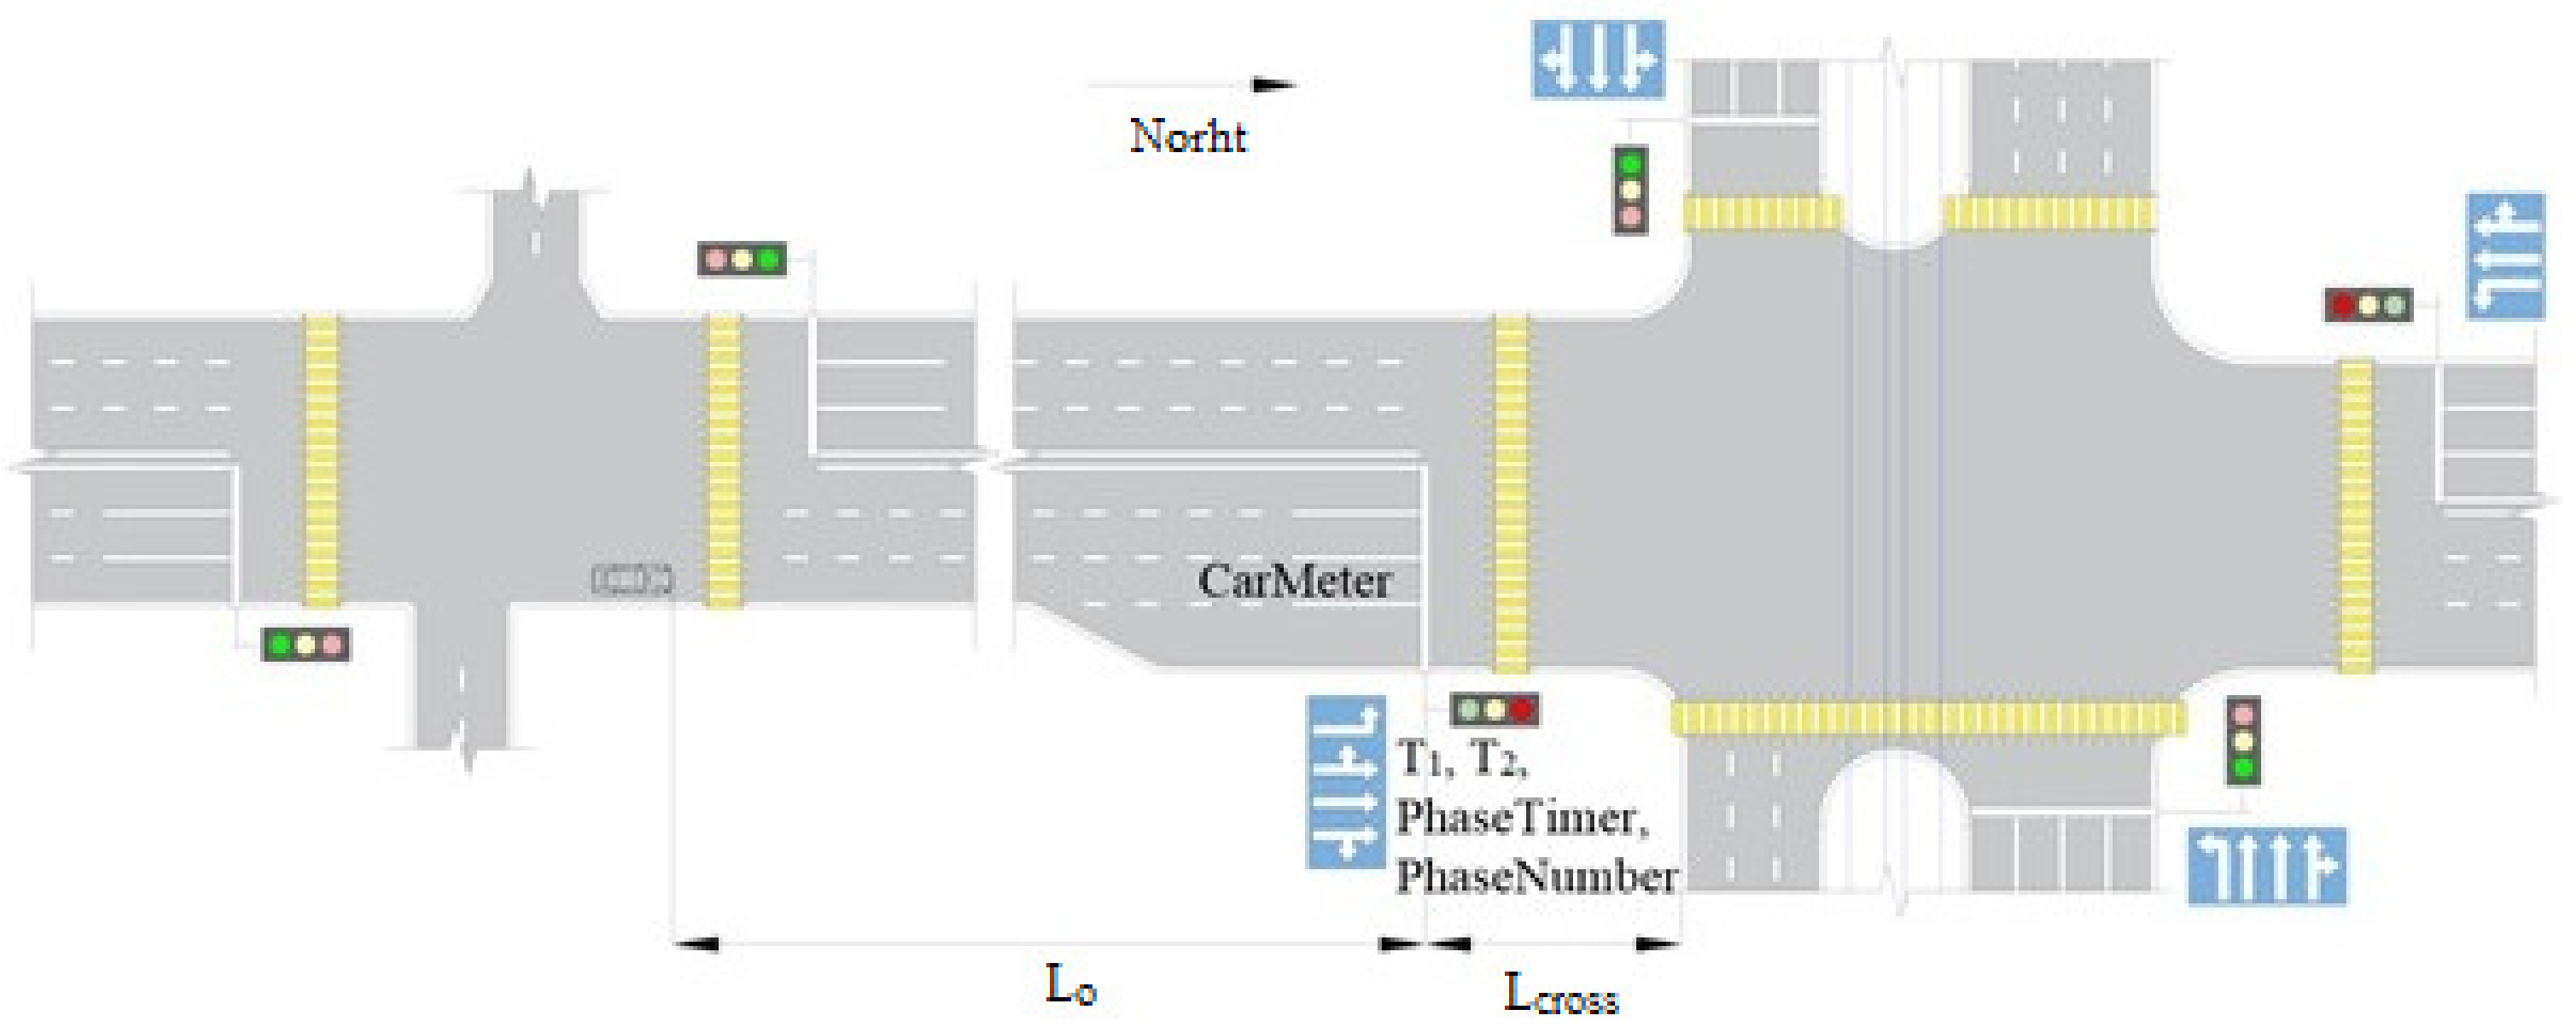
3.3. Experiment Design

One of the crossroads of the city of Chelyabinsk was chosen for experimental modeling. The intersection diagram is shown in Figure 4. The experiment accepts the conditions that the car starts at a distance L0 to the stop line of the intersection and moves straight in the north direction.
The following parameter values were used for testing the model:
  • T1 = 24 s;
  • T2 = 48 s;
  • PhaseNumber = 2;
  • PhaseTimer = 48 s;
  • CarMeter is selected from the range [0; 10];
  • tstart = 0 s;
  • Lcross = 24 m;
  • L0 is selected from the range [276; 496] meters with a step of 20 m;
  • a = 1.5 m/s2.
The parameter tend is required for the modeling and depends on the number of cars waiting for the green traffic light signal to permit passage at the intersection. For modeling purposes, statistics were collected for the intersection concerned, as shown in Table 1. In Table 1, the timing starts at the moment when the traffic light becomes active. At the same time, an average of 9 cars manage to drive through one traffic signal cycle in the considered lane. If there are more than nine cars at the intersection, the value T1 + T2 is added to the Tend parameter for modeling—vehicles will cross the intersection only during the next traffic light cycle.
When analyzing video from an intersection surveillance camera, it was determined that the traffic capacity of an intersection in the examined direction of traffic becomes higher in a situation where cars pass the intersection one after another, and not at a random distance between them. Therefore, it was suggested that if the car with the speed to be determined followed the last car from the queue at the intersection, this would positively impact the increasing traffic capacity of the intersection.
Figure 5 shows the result of the calculations: the dependence of the vehicle speed on the number of cars waiting at the intersection and statistical data from Table 1. Table 2 shows the speeds calculated as a function of the distance L and the number of cars waiting at the intersection. The calculations were carried out in the MATLAB software package.
For instance, if the car concerned (model object) is at a distance of L = 420 m from the beginning of the intersection, while 3 cars are waiting for the go traffic light signal, then it needs to move at a speed of 25–30 km/h.
The presented model of the predictive system requires clarification, as the travel time of the queue of cars has some deviations caused by the presence of large-sized vehicles [79]. Mathematical modeling using fuzzy logic methods for this purpose is presented in the Section 5.

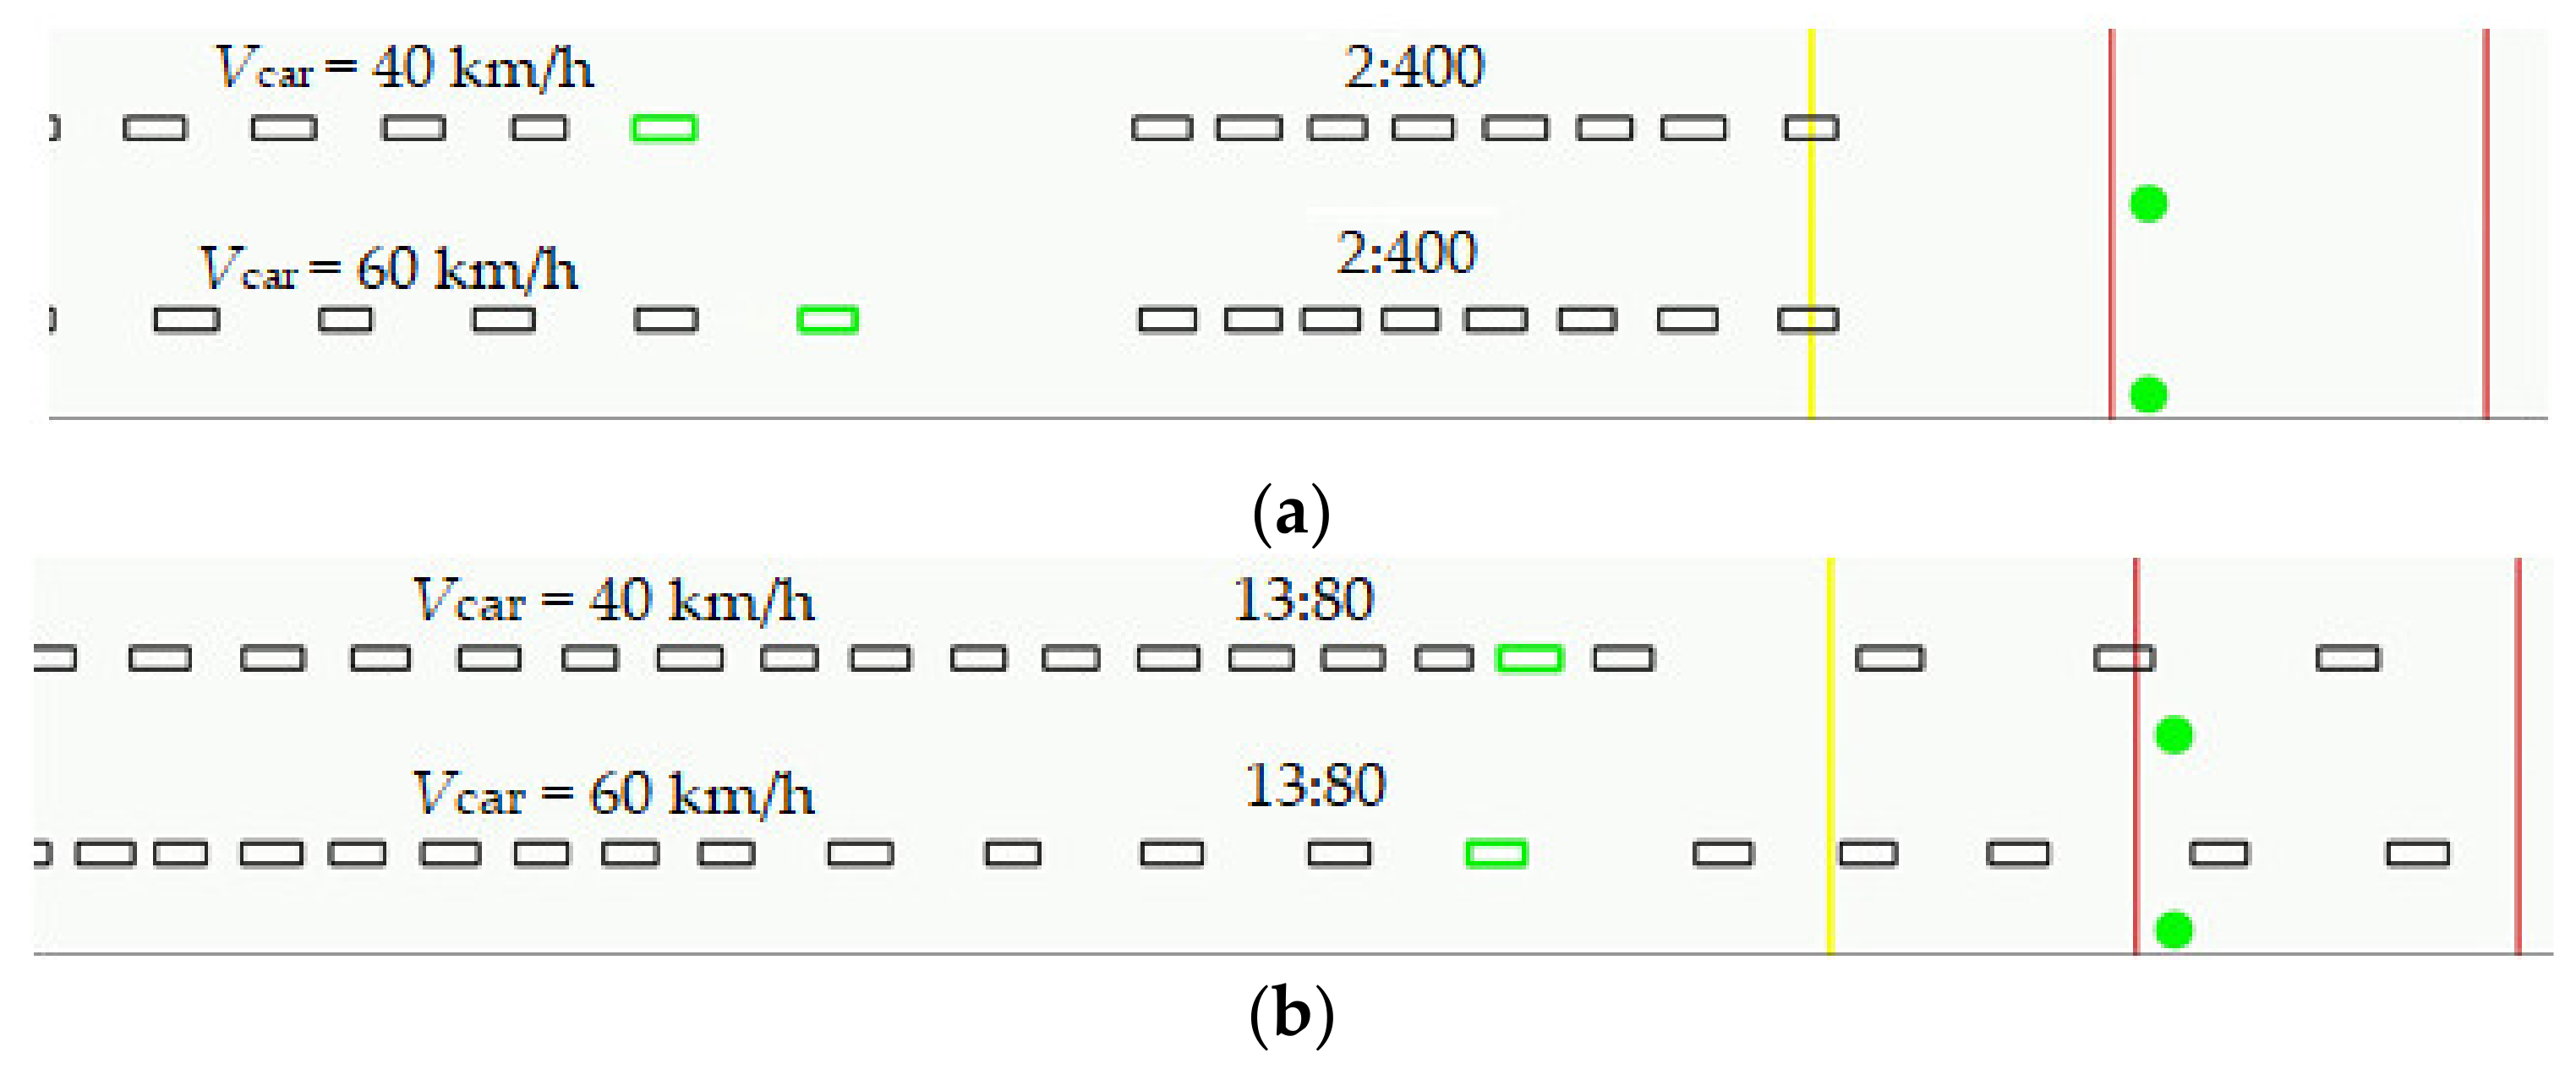
4. Microscopic Simulation of Intersection Traffic Control

We used Python programming language to build the simulation program. Visualization was made using the OpenCV library.
The simulation starts with the following initial parameters:
  • The number of vehicles before the stop line (CarMeter);
  • The distance from the start line of crossing the conflicting directions to the first approaching vehicle, meter (S1);
  • The speed of the vehicles approaching the intersection (Vcar);
The following characteristics are set for the intersection:
  • The distance from the stop line to the start line of crossing the conflicting directions (Lcross)—24 m;
  • The distance from the start line to the end line of crossing the conflicting directions—(Lintersec) 30 m;
  • The duration of the green traffic light signal (T1)—24 s.
The following limitations are set for the vehicles:
  • Vehicle length (lcar = 4.5 ± 0.5 m);
  • Minimum distance between the vehicles in the queue (lmin = 1.5–3 m);
  • Safe distance between the moving vehicles lsaf = Vcar/2, m.
  • Maximum acceleration (amax = 1.5 ± 0.1 m/s2);
  • Acceleration during braking (abrak = −5 ± 1 m/s2);
  • Delay at the start (d = 800 ± 300 ms);
  • Current vehicle speed (Vcar = 30–60 km/h);
  • Speed of the vehicles in the queue (Vcar_q = 0);
  • Current coordinate of the vehicle in the queue (nn, m); n1 = lmin.
  • Current coordinate of the vehicle approaching the intersection (nn_int, m); n1_int = S1.
nn = nn−1 + lcar + lmin
nn_int = nn_int−1 + lcar + lsaf.
The calculations are made 25 times per second. Each time, starting from the first vehicle, the acceleration, the speed, and the coordinate are calculated. For the first vehicle, the acceleration is taken as the maximum. After the end of the go traffic light signal, the distance needed to stop with the minimum acceleration is calculated for each vehicle. If the sum of the current coordinate of the vehicle and the calculated distance is farther than the coordinates of the stop line, this vehicle is taken into account in the list of the vehicles that passed the intersection. The calculations are made until all vehicles from this list cross the end line of crossing the conflicting directions. Then, the average speed is calculated for all of them.
A small number of vehicles in the queue (CarMeter = 0.3) and a sufficiently long distance to the approaching vehicles (S1 > 100 m) almost do not affect the traffic capacity of the intersection. If the queue is longer, the speed of the approaching vehicles begins to be affected in some cases. For example, at CarMeter = 7, S1 = 100 m and Vcar = 60 km/h, nine vehicles can pass the intersection, and at Vcar = 50 km/h, their number is twelve. At CarMeter = 8, S1 = 140 m and Vcar = 60 km/h, eleven vehicles can pass the intersection, and at Vcar = 40 km/h, the number is fifteen. This happens because a long queue at the stop line drives very slowly, and vehicles moving towards the intersection at high speed (60–50 km/h) quickly approach it and have to stop completely. At a speed of less than 40 km/h, the vehicle approaching an intersection first slows down a little and then accelerates again (Figure 6a,b). At the same time, there may be situations when only vehicles moving ahead drop the speed. However, if they quickly accelerate again, subsequent vehicles move at almost the same speed. At CarMeter = 8 and S1 = 100 m, the traffic capacity almost does not change because all the approaching vehicles have to stop due to the short distance.
The recommended speed for the approaching vehicles (Vrec) is calculated as follows:
Vrec = (S1nnlsaf)/tcur
where tcur is the time from the moment when the green traffic light signal turns on. As a result, we obtain the speed at which the approaching vehicles will catch up with the queue by this moment. During the simulation, this speed will be initially higher than the current speed of the last vehicle, but at some point it will become lower. This speed is considered to be calculated. The approaching vehicles will currently catch up with the queue at this speed, not being forced to slow down.
As the initial parameters of the vehicle are set in the form of a range, we made 100 measurements to obtain the recommended speed and took the average result. Then, we made 100 measurements for each recommended speed and the vehicle flow speed at 60 km/h. Figure 7 demonstrates the simulation results for estimating the average traffic capacity of the intersection depending on the number of vehicles in the queue. The microscopic simulation demonstrated the effectiveness of the approach to adaptive control of the vehicle flow speed. Therefore, when the vehicle moves at the recommended speed (S1 = 120 m), there is an increase in the traffic capacity of the selected intersection.
Thus, speed control in a connected vehicle environment can significantly improve the traffic capacity of controlled intersections. In addition, joint speed control of several vehicles is more efficient than speed control of a single vehicle.

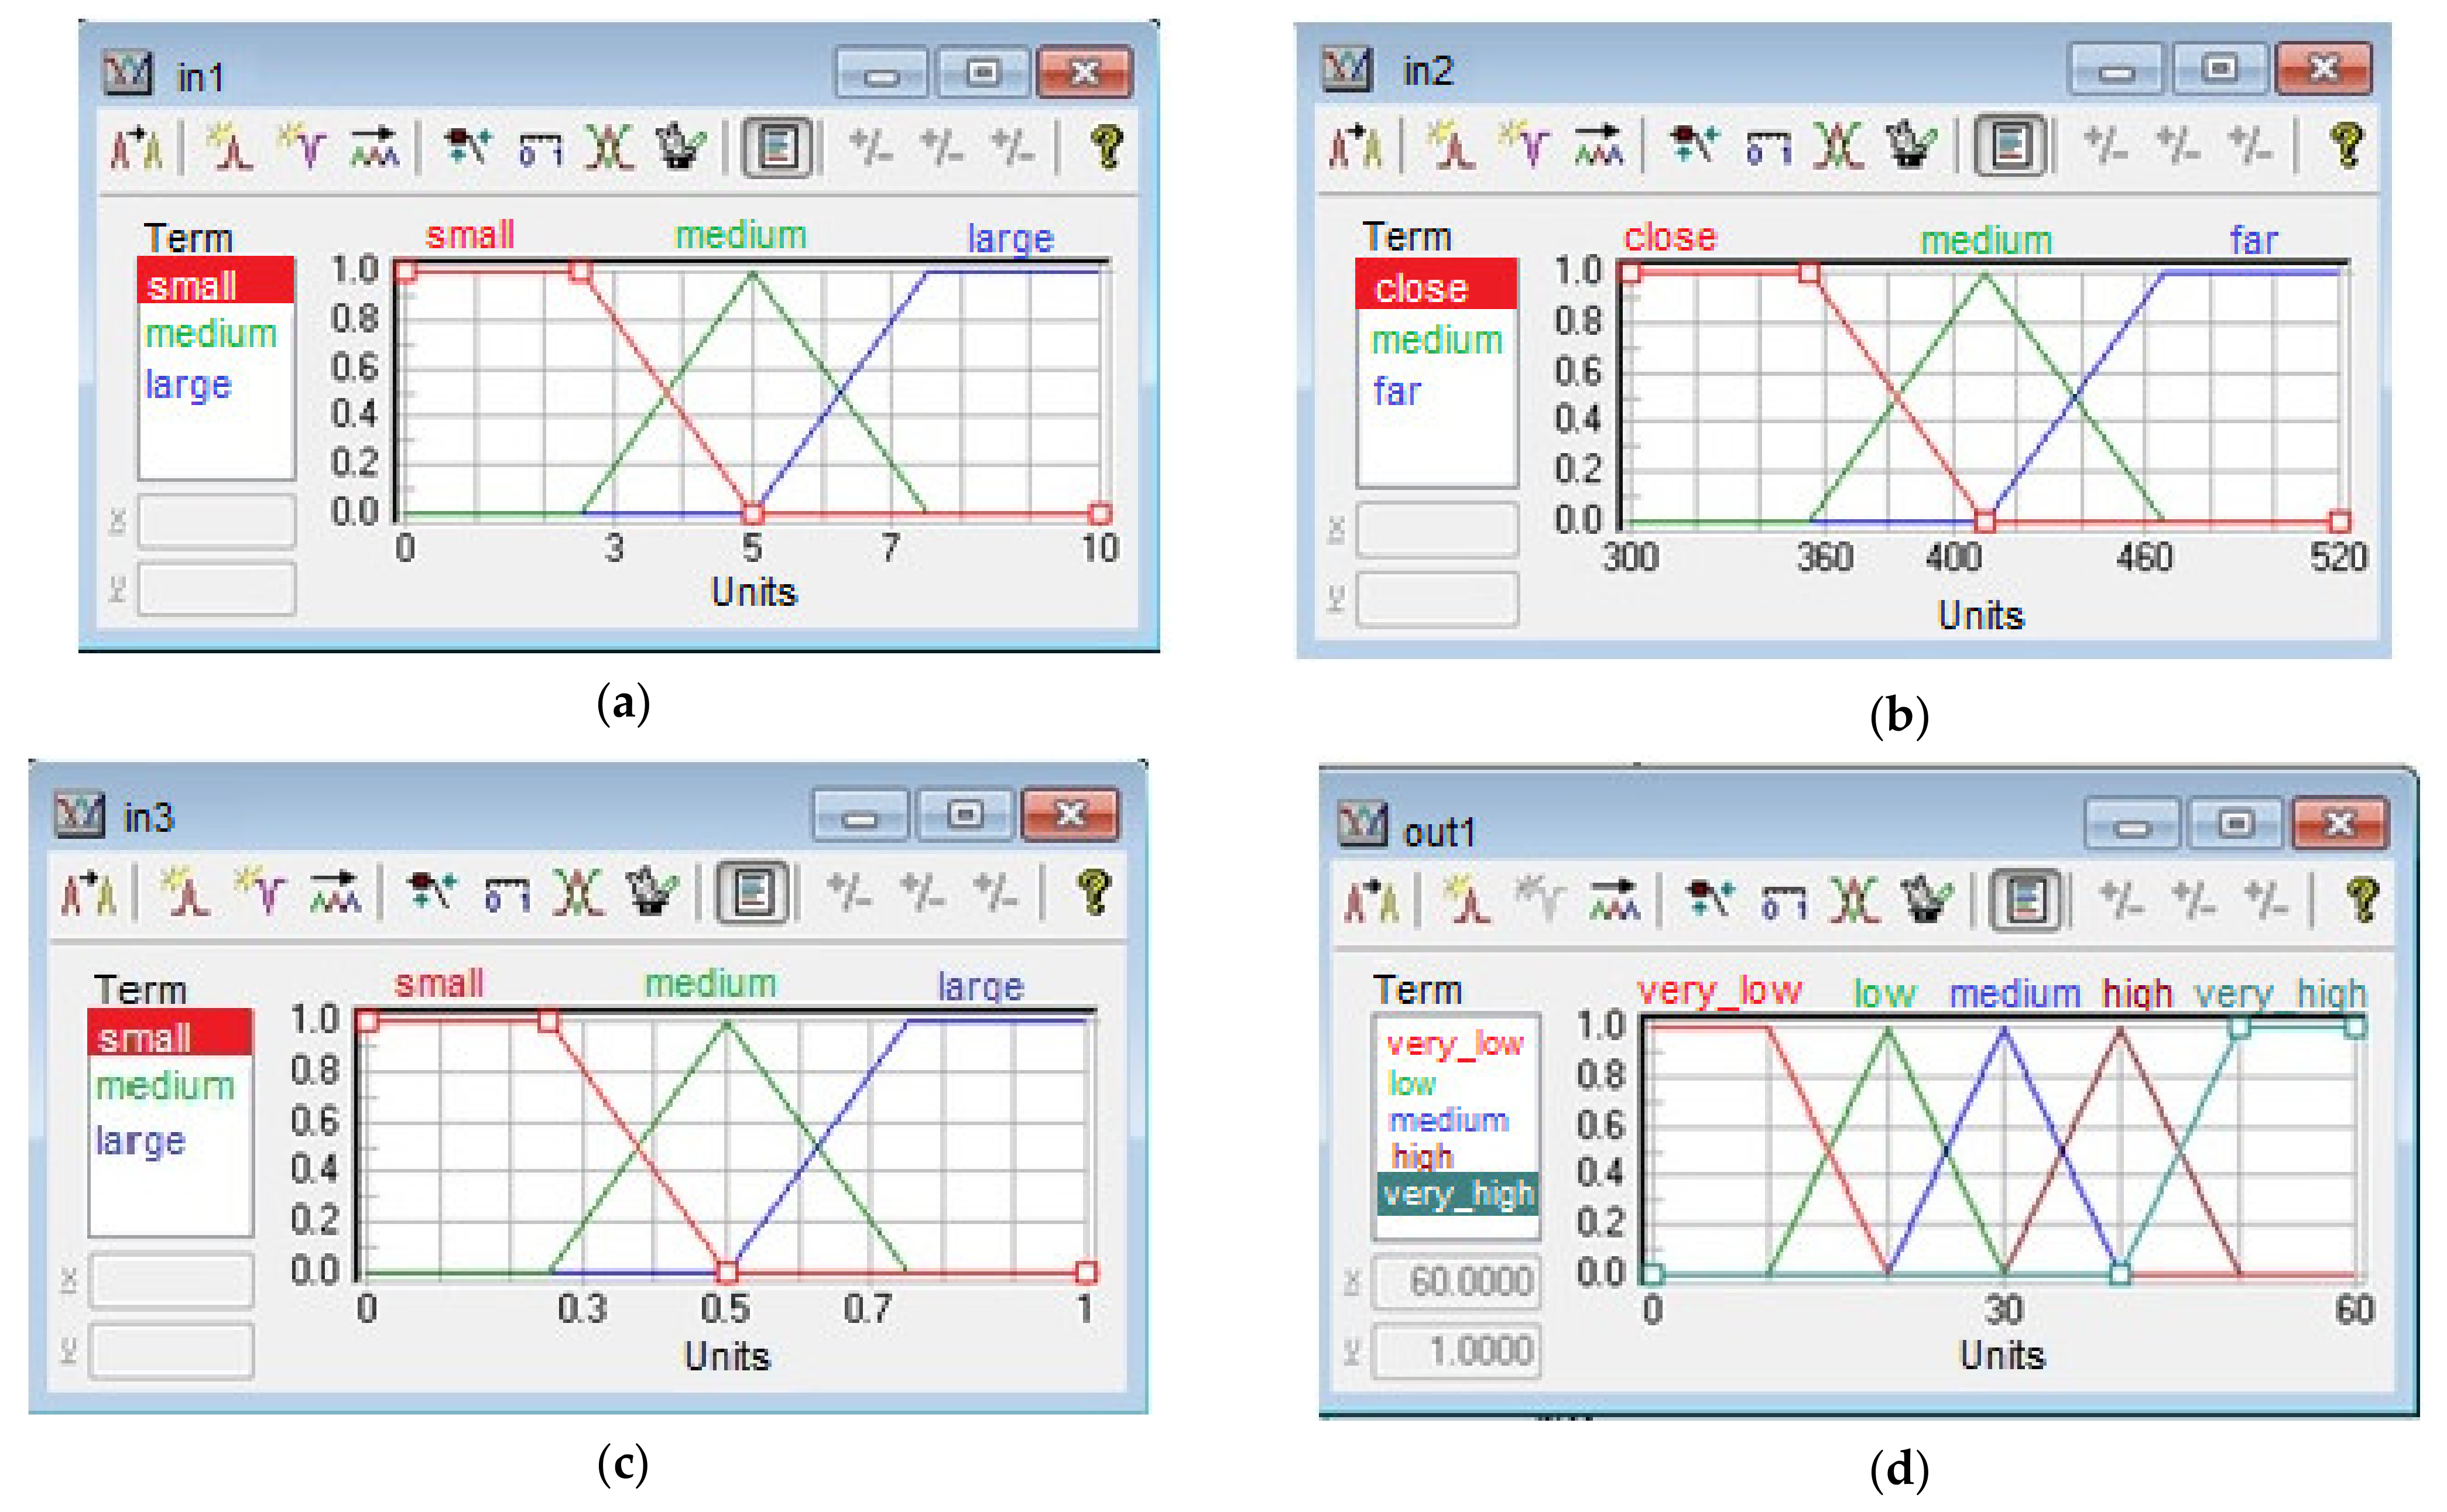
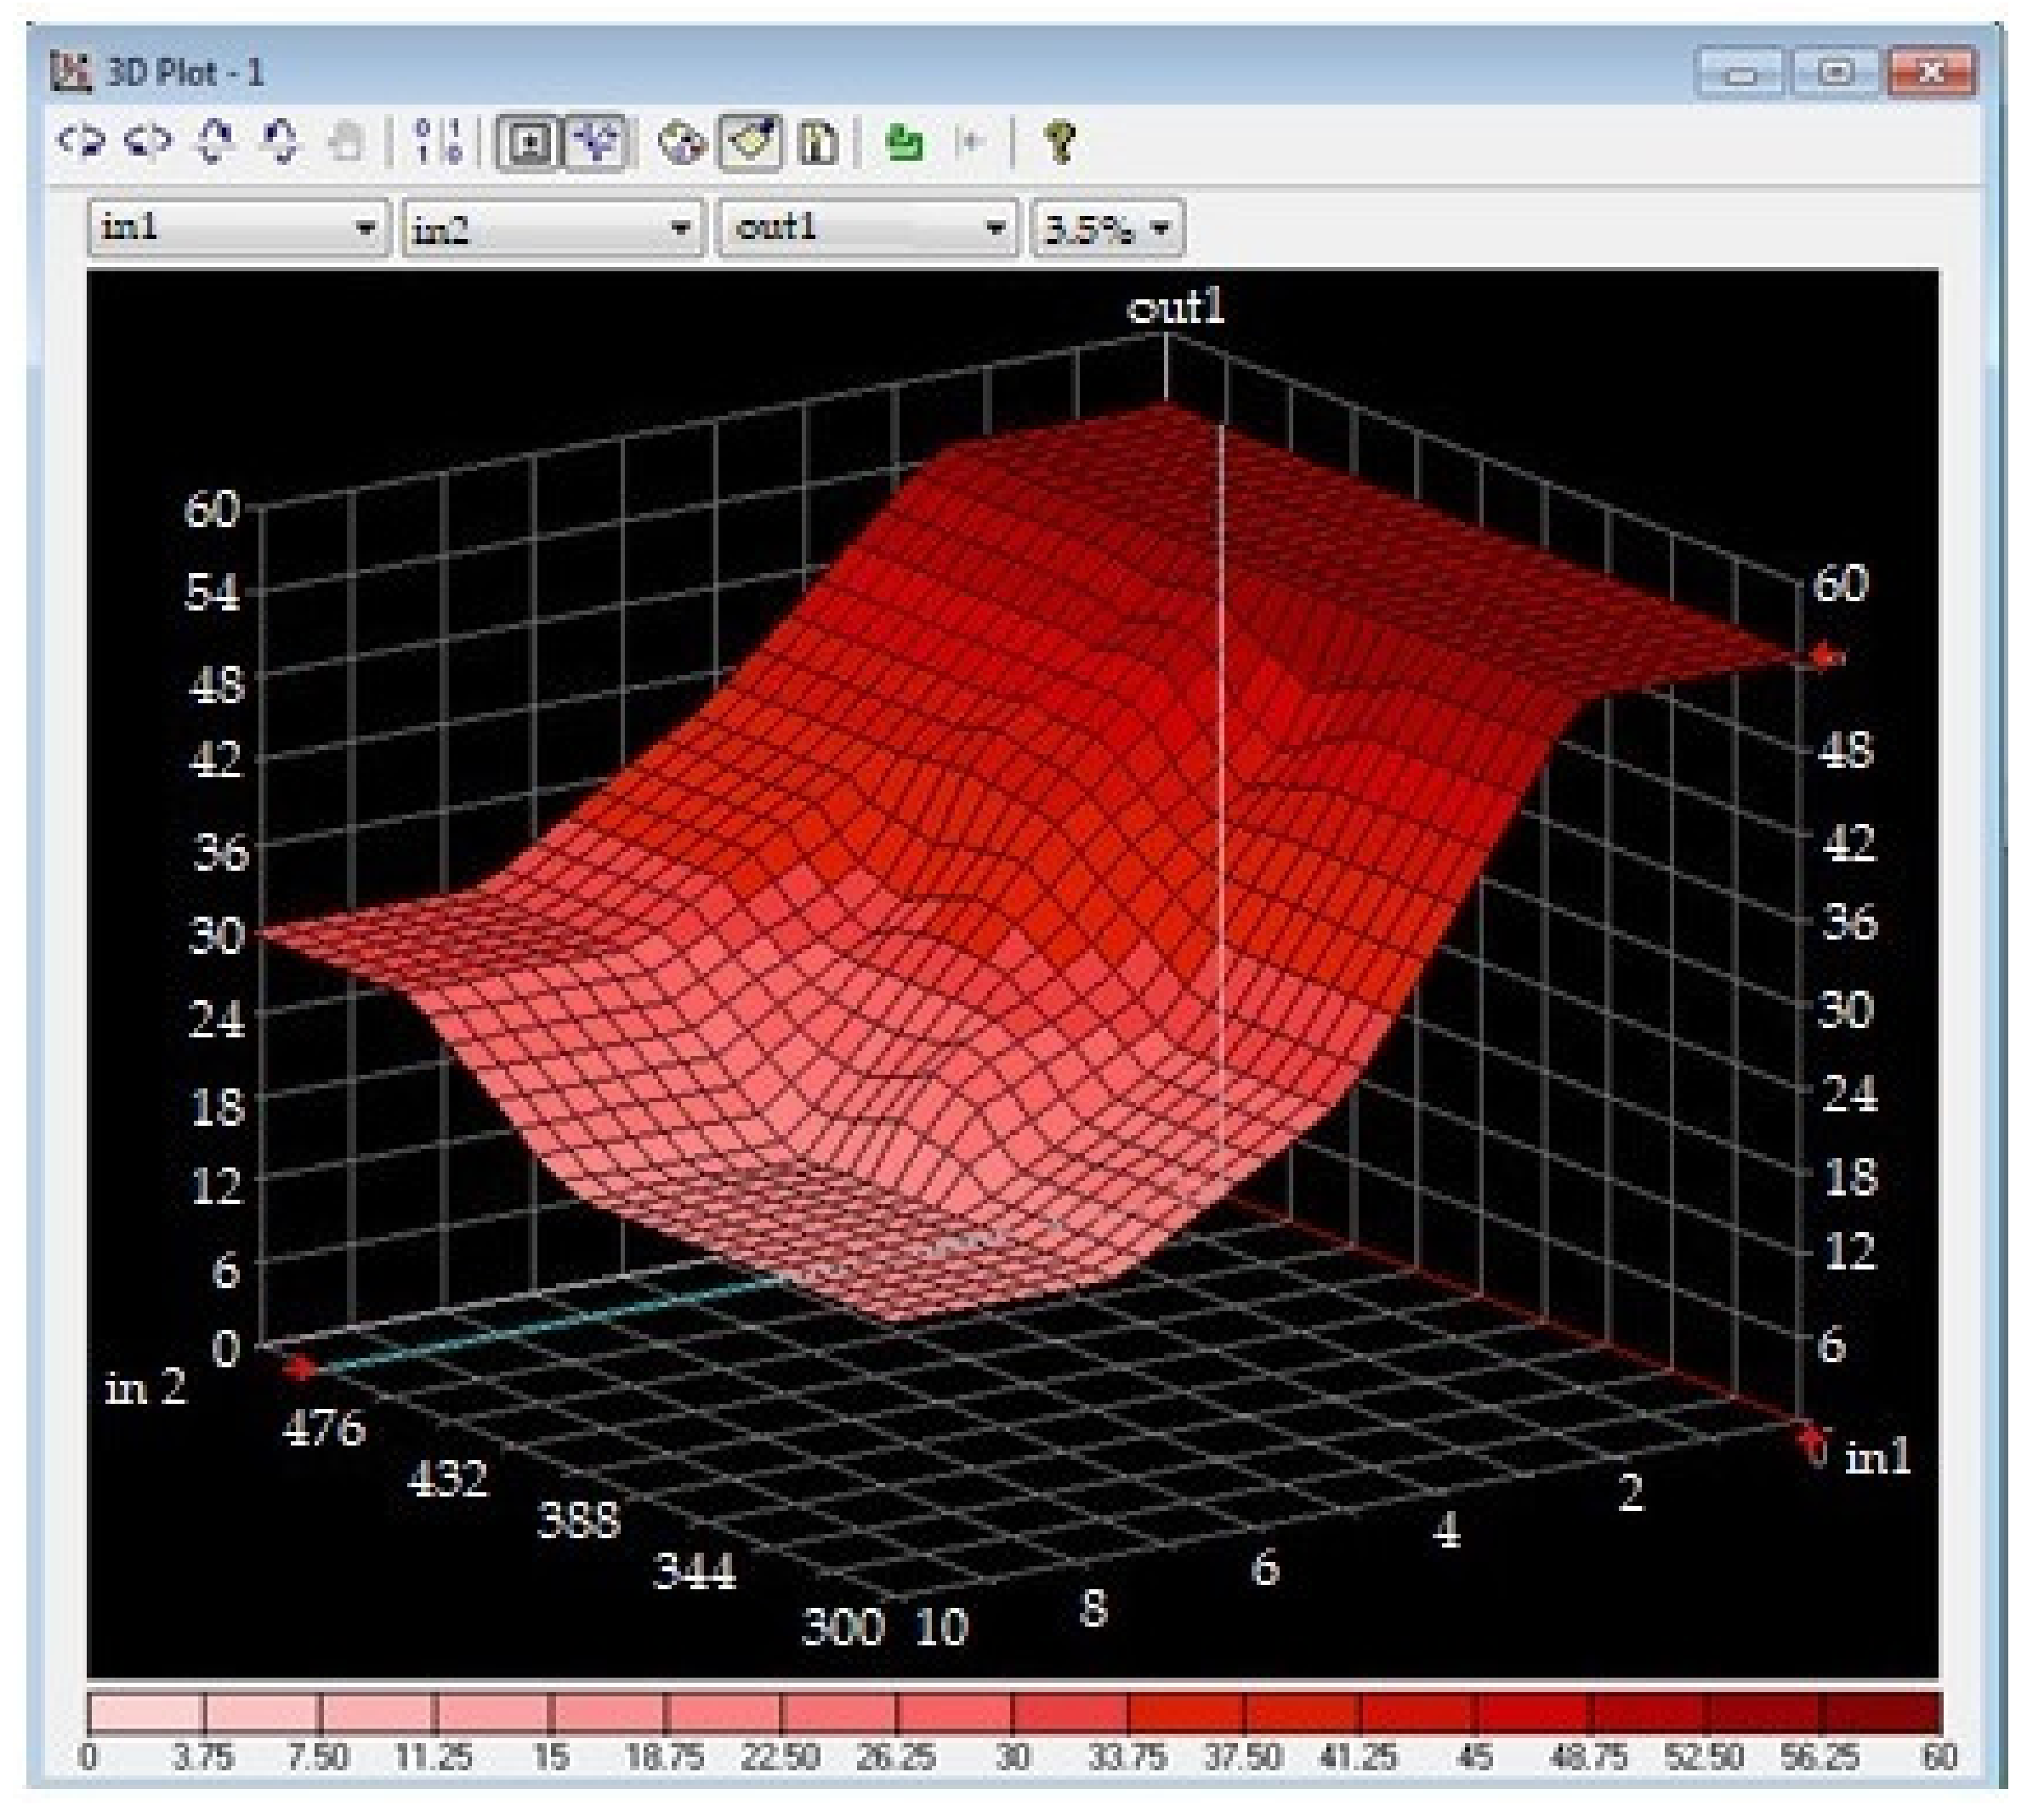
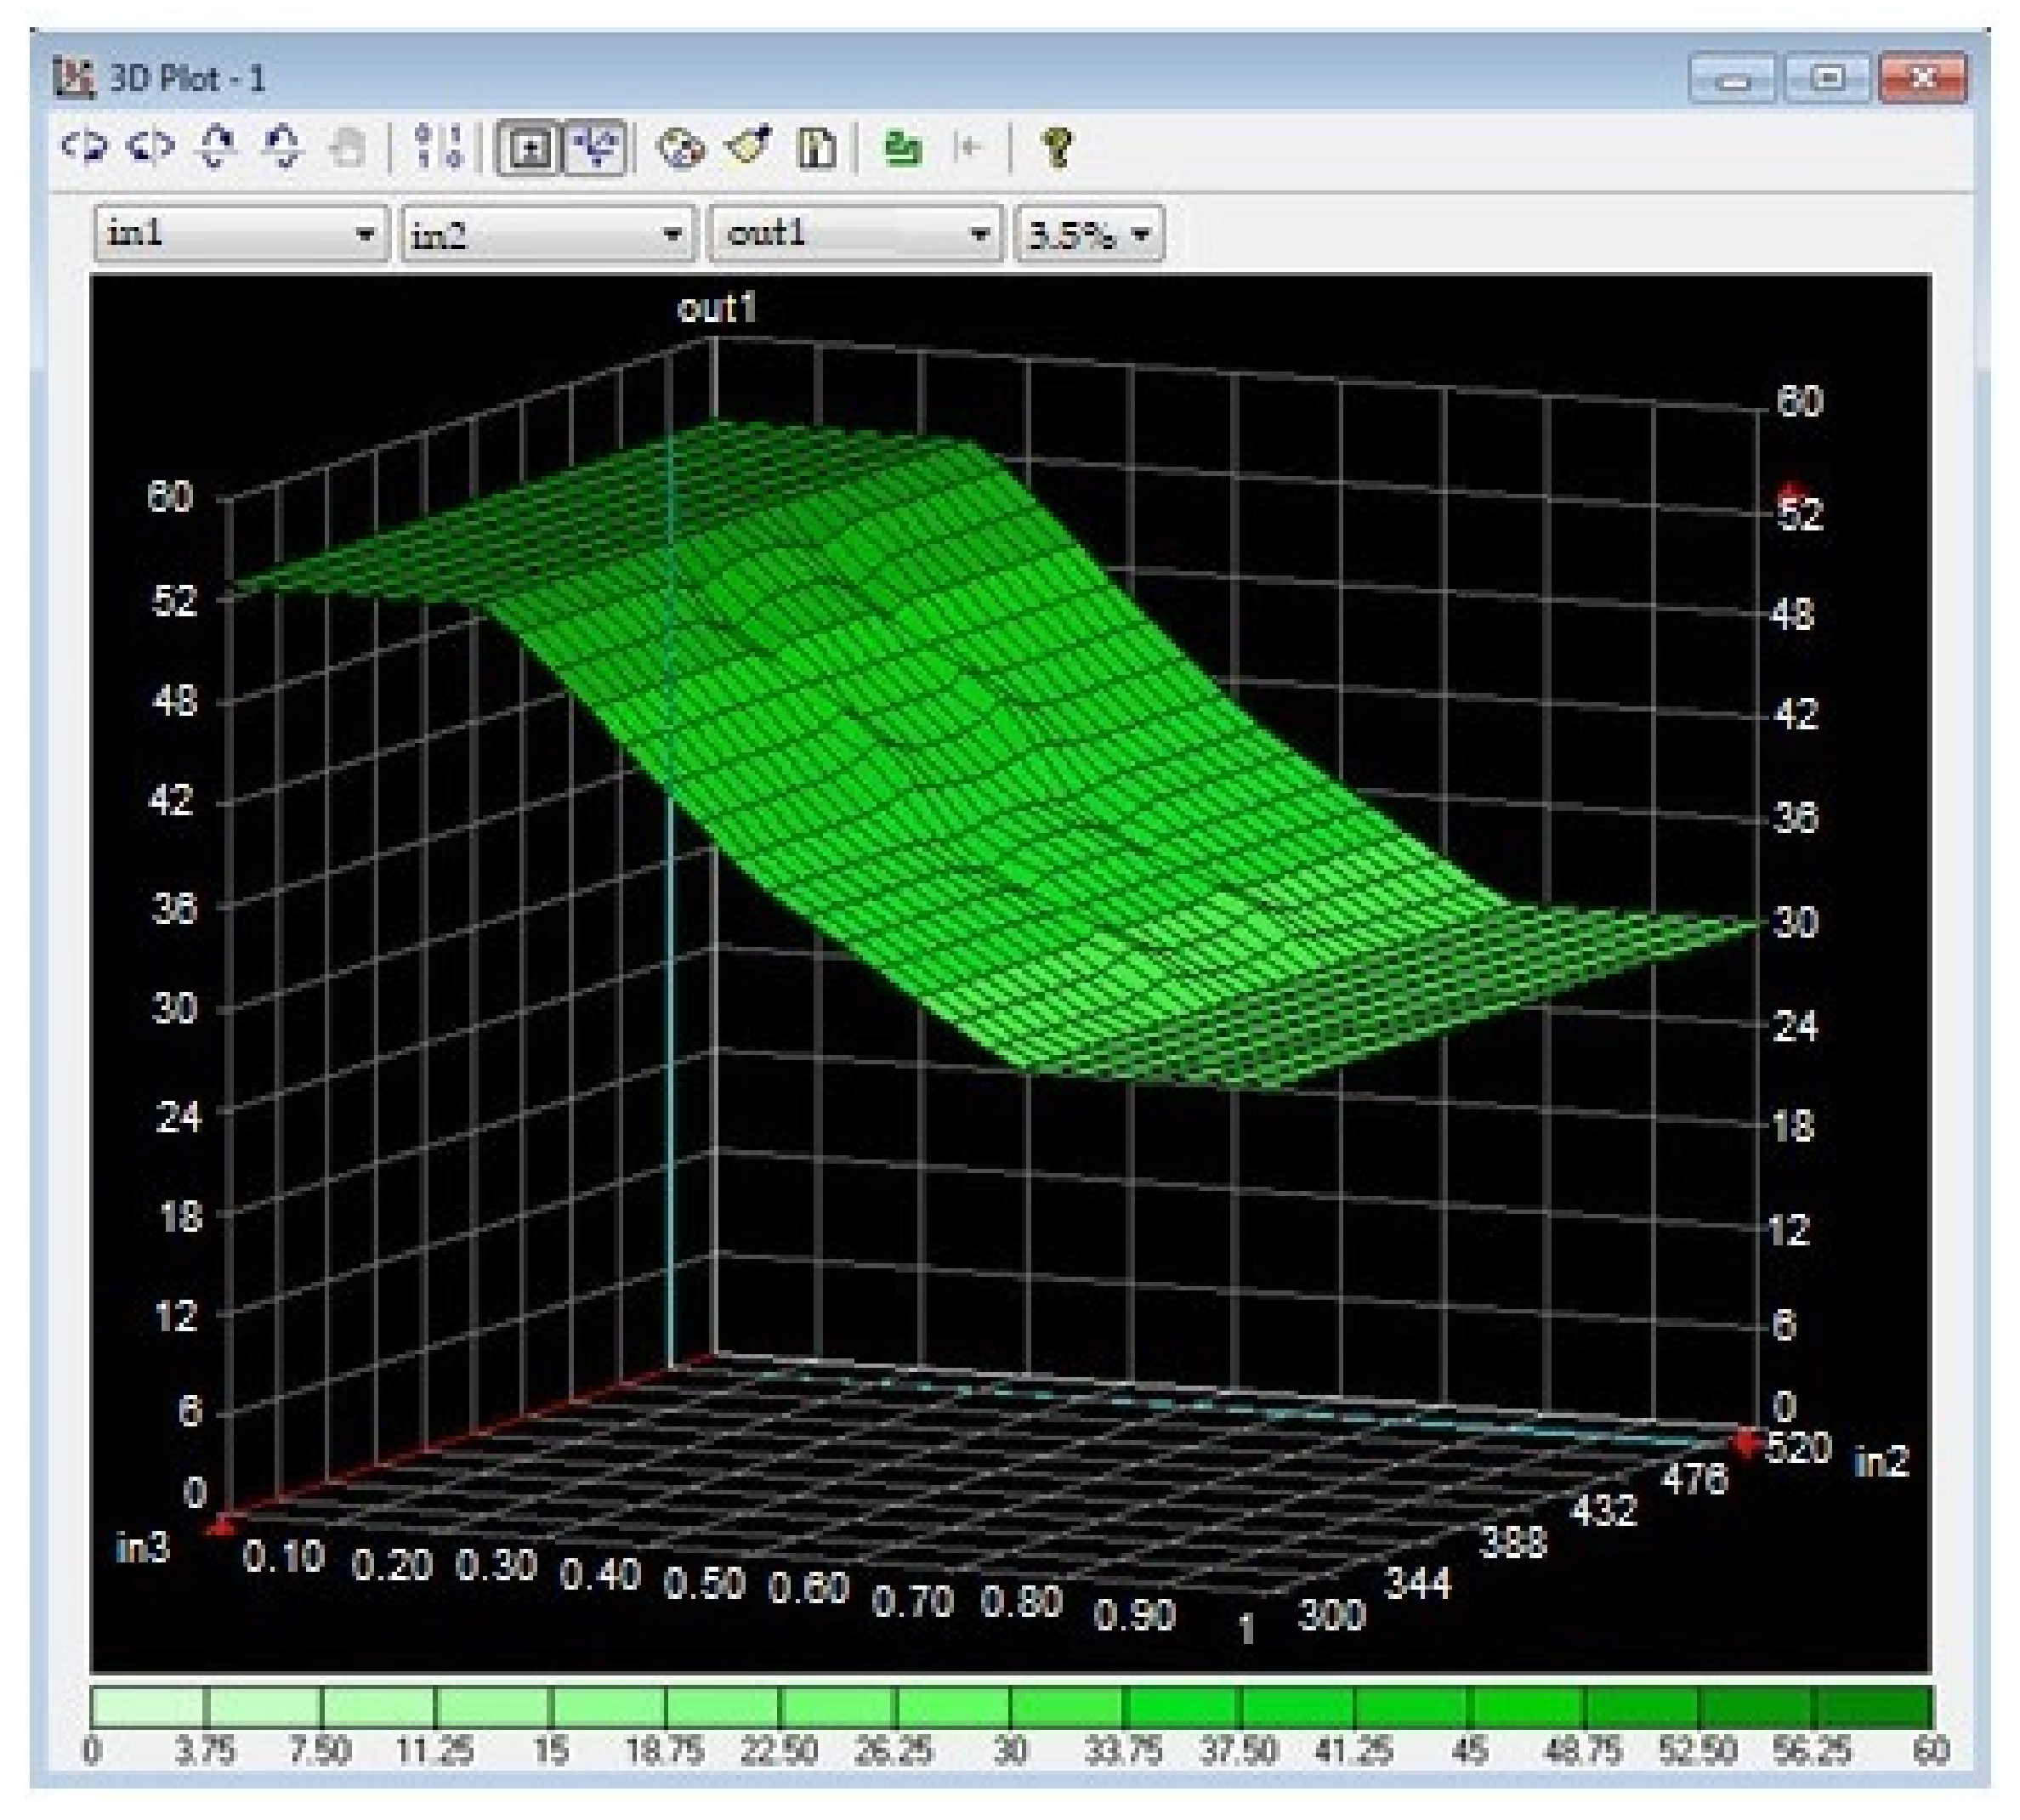
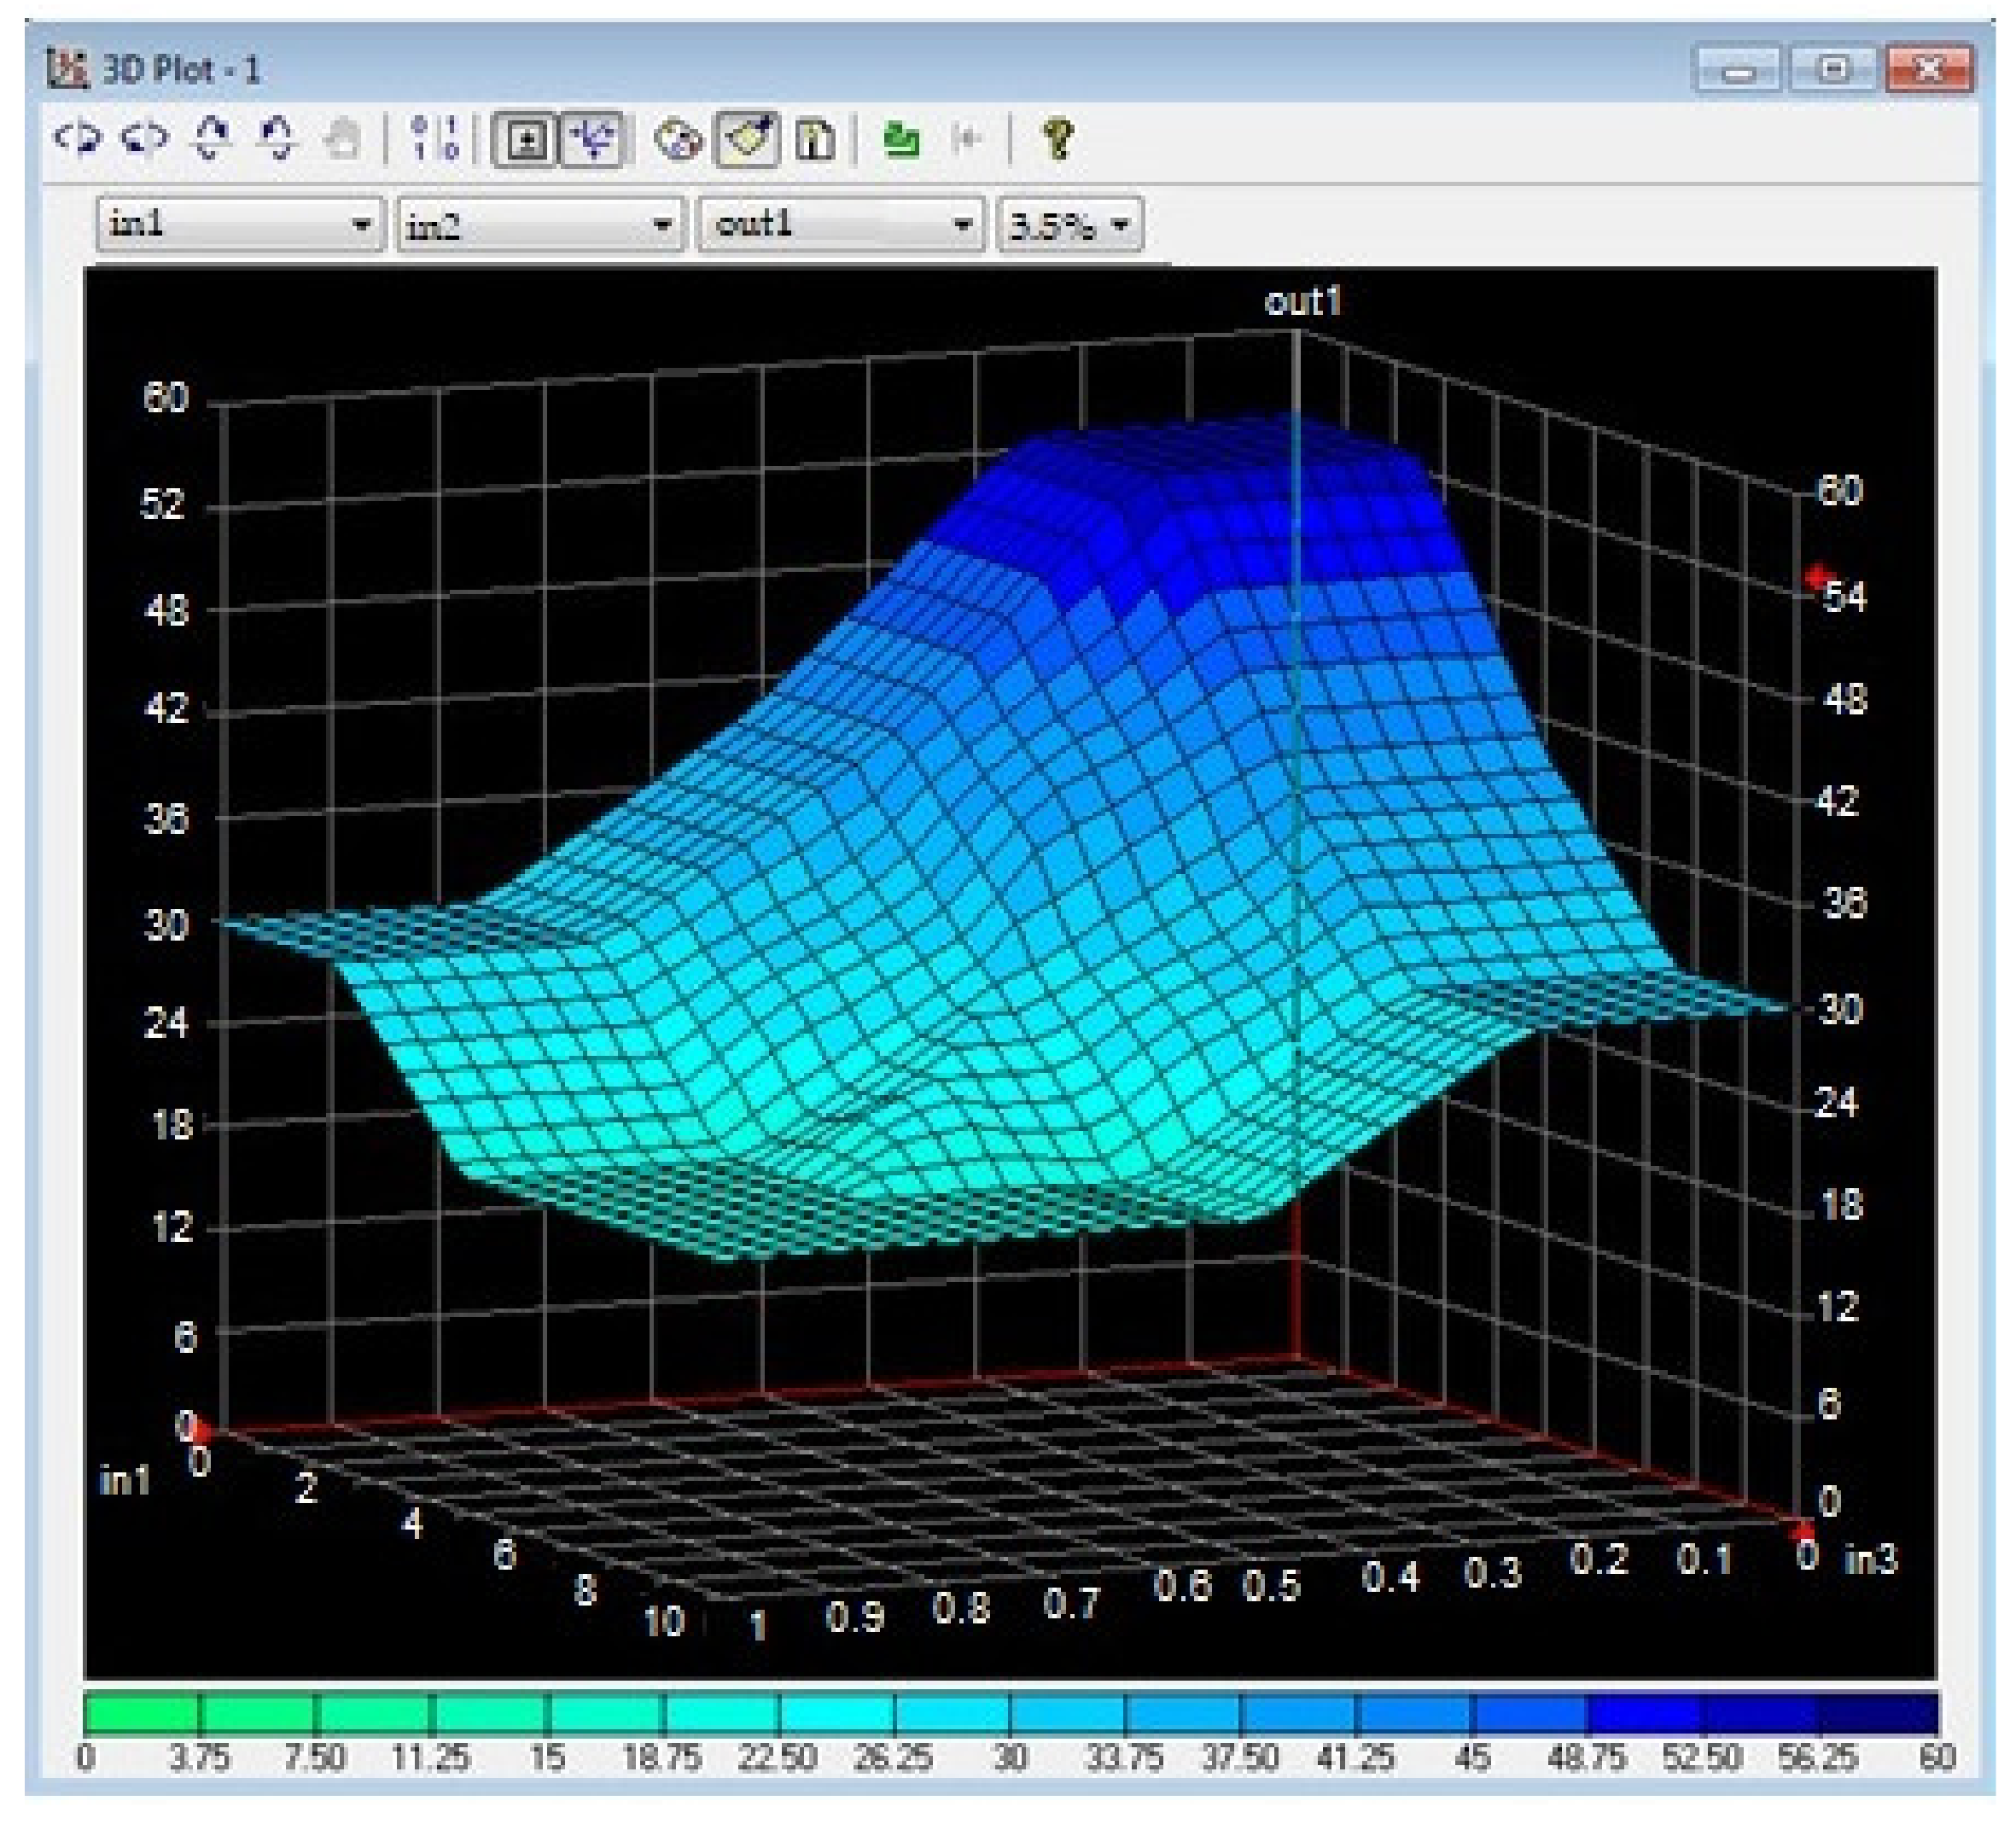
5. Mathematical Modeling of the Movement of Vehicles Based on Methods of Fuzzy Logic

As road traffic is stochastic and difficult to control, soft computing methods should be used. Such methods are based on uncertainty, ambiguity, and partial truth. Neural networks and fuzzy logic underlie the use of soft computing, as neural networks are capable of self-learning, and fuzzy logic effectively copes with the uncertainty and imprecision of real systems. The used E. Mamdani’s algorithm, based on fuzzy inference, allows us to avoid an excessive volume of computations [82].
The data given in Table 1 and Table 2 allow for estimating the limits of variation of the initial variables and elaborate a mathematical model of traffic flows using fuzzy modeling methods.
As an output variable (output) we shall choose the optimal speed of the car approaching the intersection. The speed should be such that, with a high enough probability, the car will drive up to the intersection with the ability to drive through the intersection without stopping. Indeed, the need to stop poses negative consequences related to the loss of time to start the car, taking into account the delay due to the correction for the driver’s reaction. We shall notice that the output variable has values in the range from 0 to 60 km/h in accordance with the traffic rules in populated areas.
We will choose the following as input variables (inputs):
(1)
The number of cars waiting in front of the intersection;
(2)
The distance of the car to the beginning of the intersection;
(3)
The share of large-sized vehicles among those waiting at the intersection.
Further research can help in adjusting the list of input variables.
The model based on the methods of fuzzy mathematics will be compiled using the Fuzzy TECH 5.81 d Professional computer program.
The input variable in1 represents the number of cars waiting at the intersection. The range of this variable is selected from 0 to 10 to match the values in Table 2. This range can be expanded in further studies. This variable has three grades (small, medium, and large) with the distribution of values shown in Figure 8a.
The input variable in2 is the vehicle’s distance to the start of the intersection. The variation range of this variable is selected in the range from 300 to 520 m, again, to be consistent with the values in Table 2. This range can also be changed as appropriate. This variable has three grades (close, medium, and far) with the distribution of values shown in Figure 8b.
The input variable in3 is the proportion of large vehicles waiting at the intersection. The values of this variable range from 0 to 1.0 and correspond to the complete absence of such vehicles in the queue before the intersection. The number 1 means that all vehicles at the intersection are large. It is clear that a large proportion of large-sized vehicles will cause a delay in clearing the intersection; therefore, the speed of the vehicle under study should be reduced when approaching the intersection. This variable also has three grades (small, medium, and large) with the distribution of values shown in Figure 8c. We shall notice that in order to refine the simulation results in the future, one can take into account specific types of vehicles located at the intersection.
As noted, the output variable out1 is the optimal speed of the vehicle approaching the intersection. It has five grades (very low, low, medium, high, and very high). Distribution of the values of this variable is shown in Figure 8d.
Coordination of the grades of the output and input variables is shown in Table 3.
A graphical representation of the developed model based on fuzzy logic in the form of surfaces out1 (in1, in2), out1 (in2, in3), and out1 (in1, in3) is shown in Figure 9, Figure 10 and Figure 11, respectively.
Comparison of the values of the optimal speeds obtained on the basis of fuzzy modeling and the data in Table 2 shows good convergence of the results, which verifies the adequacy of the models. For example, with the values in1 = 5, in2 = 380 m, in3 = 0.54 according to the model with fuzzy logic, we get the value of the optimal speed out1 = 21.85. With the values in1 = 8, in2 = 480 m, in3 = 0.36, we have out1 = 25.599. The corresponding values from Table 2 are 21.79 km/h and 25.48 km/h. As can be observed, the results are very close. At the same time, the model based on fuzzy mathematics is more realistic due to the consideration of the share of large vehicles.
The fact that there is no need to reduce the speed in the absence of vehicles at the intersection and at a sufficiently large distance from it is also a confirmation of the higher degree of realism of the model with fuzzy logic. Thus, with the values in1 = 0, in2 = 500 m, and in3 = 0, the model with fuzzy logic gives the value of the optimal speed at 55 km/h, while Table 2 shows only 40.7 km/h.

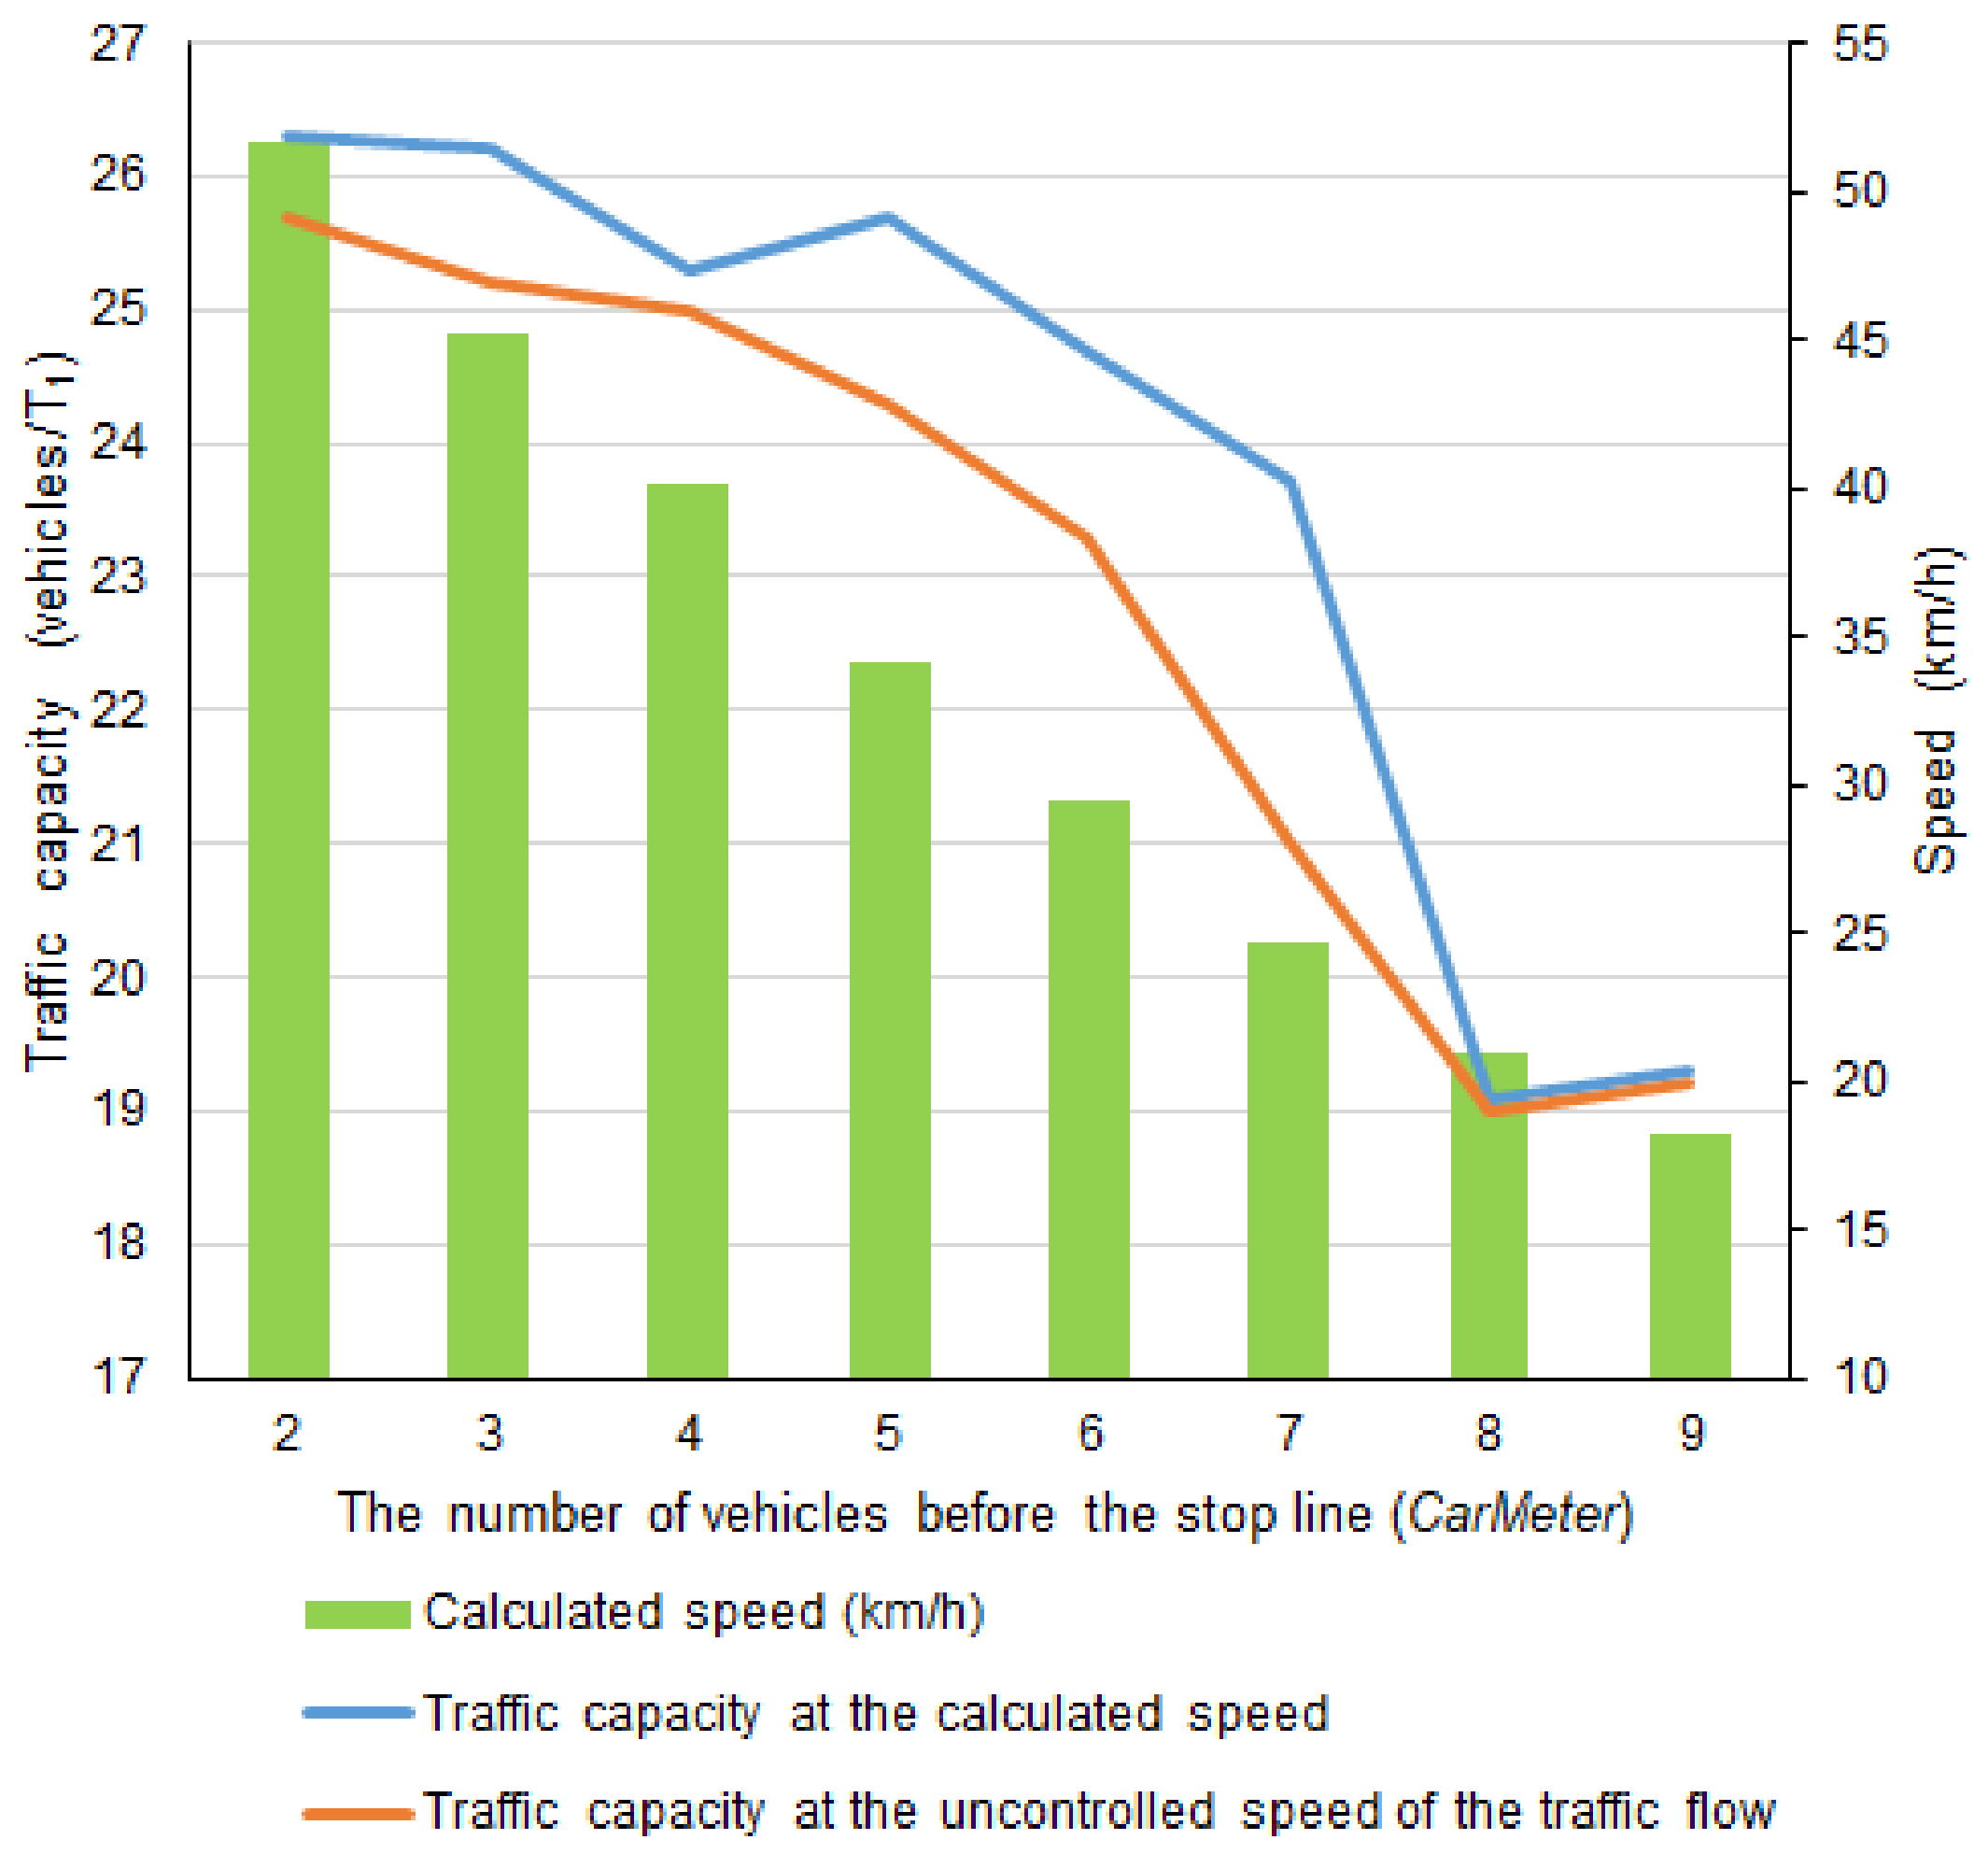
6. Discussion of Modeling Results

In the integral-mathematical model (Formulas (1)–(8)), as well as the block diagram of the corresponding algorithm (Figure 3), the distance of the car from the controlled intersection and the parameters of the vehicle queue before the stop traffic light signal are used as a basis. The model allows us to calculate the recommended vehicle speed for passing an intersection without deceleration. An example of calculation with a wide variation of input parameters (Table 1) is shown by the distribution field in Figure 5 and also reflected in Table 2. However, the widest field of random and unpredictable disturbing factors of both the traffic flow itself, as well as the environment, is not taken into account here. Therefore, we used the second model approach based on fuzzy inference (E. Mamdani’s algorithm and fuzzyTECH software product), which allows us to avoid an excessive amount of computations when simulating random disturbing factors. In this practical research, which is the initial stage of assessing the transport situation at an intersection under the conditions of several uncertainties, we used the simplest types of fuzzy membership functions–linear (not Gaussian due to the lack of information on the normal distribution parameters). We also considered the complete system of rules (Table 3) without checking its inconsistency, although in the future, with more detailed application of the fuzzy logic methods, we plan to study these issues as well. The modeling results are presented by volumetric distribution fields for the recommended speed of a car approaching the intersection, depending on the combination of various input parameters (Figure 9, Figure 10 and Figure 11). Numerical values of any parameters can be obtained in the fuzzyTECH program. A comparison of the recommended speed values obtained on the basis of fuzzy modeling and the calculated data using the mathematical model demonstrates good convergence of the results, which verifies the adequacy of the two considered models.
The developed models calculate close predicted values for the recommended vehicle speed. This, on the one hand, characterizes the high stability of the solution of the original problem. However, on the other hand, the models are approximate, as they do not take into account many unpredictable and disturbing factors of both the traffic flow itself and the environment. Therefore, the mathematical model takes into account only the main input quantities, ignoring the influence of random and unpredictable effects. This results in rigidly defined deterministic outcomes. In the second model, which uses the fuzzy logic methods, the entire set of external disturbances (ignoring their physical nature) is taken into account a priori—by the assumption of their presence. This is specified both by the number of levels—terms of fuzzy functions and their type (linear, Gaussian, etc.)—Although, in this problem statement, all the main disturbing effects can be manifested and evaluated by the level of their influence using the method of expert assessments. This certainly refers to the areas of our future research.
Taking into account the thorough investigation of the features of urban traffic flows, as well as possible errors in the neural network’s recognition of the vehicle itself and its categories, we believe it is expedient to show the most significant disturbing effects in this problem statement in our future research and to supplement further models with these disturbing factors, after preliminary development of their statistical characteristics or by experimental research, or after their average expert assessment. In this approach, it is advisable to use computer simulation modeling (MATLAB suite, Simulink application), which provides for Q-circuit continuous-stochastic models.

7. Conclusions

In this work we have focused on the problem of non-stop passage by highly automated vehicles at controlled intersections and increasing their situational awareness using data obtained from outdoor surveillance cameras. This subject area is popular, yet still in its early stages of development. There are only a few works to date, as they are aimed at tackling the challenge of ensuring the non-stop passage of motor transport through regulated intersections.
To solve this problem, we used the YOLOv3 neural network and the SORT tracker in order to receive and transmit data in real time to the onboard HAV system. The elaborated system can count and classify vehicles in line by travel time with an average percentage error of less than 7%.
The analysis based on fuzzy logic methods made it possible to confirm the calculated predictions for various scenarios of forming a queue at an intersection in the tasks of ensuring non-stop passage of HAV, subject to the implementation of queue segmentation by initial characteristics and visualization of the results obtained.
The transmission of information on the predicted delay time at a controlled intersection in the local mode is possible due to the V2X communication of the road controller equipment, and in the horizontally scaled mode due to the interaction of HAV—the digital road model. With that, horizontal scaling would make possible even more productive optimization of traffic flows throughout the city.
At the same time, even if not all vehicles are equipped with assistants, a positive effect will still be attained, which is also due to V2V.
The introduction of the proposed model will undoubtedly contribute to the optimization of traffic, travel speed, the time needed to deliver goods and passengers, fuel consumption, and environmental improvement.

Author Contributions

All of the authors contributed to publishing this article. Conceptualization, V.S. and S.A.; methodology, V.V.; validation, S.Z. and A.M. (Aleksandr Marusin); investigation, A.M. (Alexey Marusin); writing—original draft preparation, V.S.; writing—review and editing, S.A.; visualization, A.M. (Aleksandr Marusin) and A.G.; supervision, V.V. All authors have read and agreed to the published version of the manuscript.

Funding

This paper has been supported by by the Strategic Academic Leadership program “Priority 2030” of the SUSU (NRU) and the RUDN.

Institutional Review Board Statement

Not applicable.

Informed Consent Statement

Not applicable.

Data Availability Statement

This repository contains source codes for the program, which implements methods for calculating traffic parameters described in the research work at https://github.com/Readix/TrafficMonitoring (accessed on 9 October 2021). This program counts vehicles in each of the four directions of movement and calculates the speed of vehicles by the method of prospective conversion.

Conflicts of Interest

The authors declare no conflict of interest.

Abbreviations

LThe path to be traveled by the car.
L0Distance from the start line to the stop line of the next intersection.
LaccelerationDistance traveled by a car with non-zero acceleration.
LcrossDistance between the stop line and the line where the conflictingdirections intersect the intersection traffic.
Lsteady_motionDistance traveled by a car at a constant speed.
PhaseNumberThe number of the traffic light regulation phase currently active.
PhaseTimerCountdown to the end of the current traffic light regulation phase.
T1,T2Total duration of the first and second phases of regulation of one cycle of traffic light.
taccelerationThe time during which the car is moving with acceleration.
tendThe time it takes a car to cover a given distance.
tstartThe moment the car starts moving.
V0Initial car speed.
VcarCar speed.
Vsteady_motionThe speed reached by the car while accelerating.

References

  1. Novikov, A.N.; Eremin, S.V.; Shevtsova, A.G. Development of a methodology for optimizing the urban route in the metropolitan area. In Proceedings of the International Conference on Digital Solutions for Automotive Industry, Roadway Maintenance and Traffic Control, Cholpon-Ata, Kyrgyzstan, 1 November 2019; Institute of Physics Publishing: Bristol, UK, 2020; Volume 832, p. 012096. [Google Scholar]
  2. Marusin, A.; Marusin, A.; Danilov, I. A method for assessing the influence of automated traffic enforcement system parameters on traffic safety. Transp. Res. Procedia 2018, 36, 500–506. [Google Scholar] [CrossRef]
  3. Boryaev, A.; Malygin, I.; Marusin, A. Areas of focus in ensuring the environmental safety of motor transport. Transp. Res. Procedia 2020, 50, 68–76. [Google Scholar] [CrossRef]
  4. Mavrin, V.; Magdin, K.; Shepelev, V.; Danilov, I. Reduction of environmental impact from road transport using analysis and simulation methods. Transp. Res. Procedia 2020, 50, 451–457. [Google Scholar] [CrossRef]
  5. Kerimov, M.; Evtiukov, S.; Marusin, A. Model of multi-level system managing automated traffic enforcement facilities recording traffic violations. Transp. Res. Procedia 2020, 50, 242–252. [Google Scholar] [CrossRef]
  6. Zakharov, D.; Fadyushin, A. The efficiency of some activities for the development of urban infrastructure for public transport, cyclists and pedestrians. Int. J. Transp. Dev. Integr. 2021, 5, 136–149. [Google Scholar] [CrossRef]
  7. Makarova, I.; Shubenkova, K.; Pashkevich, A. Efficiency assessment of measures to increase sustainability of the transport system. Transport 2021, 36, 123–133. [Google Scholar] [CrossRef]
  8. Gorodokin, V.; Almetova, Z.; Shepelev, V. Algorithm of signalized crossroads passage within the range of permissive-to-restrictive signals exchange. Transp. Res. Procedia 2017, 20, 225–230. [Google Scholar] [CrossRef]
  9. Shepelev, V.; Glushkov, A.; Almetova, Z.; Mavrin, V. A Study of the Travel Time of Intersections by Vehicles using Computer Vision. In Proceedings of the 6th International Conference on Vehicle Technology and Intelligent Transport Systems, Virtual, Online, 2–4 May 2020; pp. 653–658. [Google Scholar]
  10. Makarova, I.; Mavrin, V.; Buyvol, P.; Boyko, A. Digitalization and New Opportunities of Urban Mobility. In Proceedings of the 20th International Conference on Reliability and Statistics in Transportation and Communication, Riga, Latvia, 14–17 October 2020; Volume 195, pp. 559–569. [Google Scholar]
  11. Phan, C.T.; Pham, D.D.; Tran, H.V.; Tran, T.V.; Huu, P.N. Applying the IoT platform and green wave theory to control intelligent traffic lights system for urban areas in Vietnam. KSII Trans. Internet Inf. Syst. 2019, 13, 34–52. [Google Scholar]
  12. Kurihara, S.; Ogawa, R.; Shinoda, K.; Suwa, H. Proposed traffic light control mechanism based on multi-agent coordination. J. Adv. Comput. Intell. Intell. Inform. 2016, 20, 803–812. [Google Scholar] [CrossRef]
  13. Yusuf, A.N.A.; Arifin, A.S.; Zulkifli, F.Y. Recent development of smart traffic lights. IAES Int. J. Artif. Intell. 2021, 10, 224–233. [Google Scholar]
  14. De Oliveira, L.F.P.; Manera, L.T.; Luz, P.D.G.D. Development of a Smart Traffic Light Control System with Real-Time Monitoring. IEEE Internet Things J. 2021, 8, 3384–3393. [Google Scholar] [CrossRef]
  15. Sanguesa, J.A.; Barrachina, J.; Fogue, M.; Garrido, P.; Martinez, F.J.; Cano, J.-C.; Calafate, C.T.; Manzoni, P. Sensing Traffic Density Combining V2V and V2I Wireless Communications. Sensors 2015, 15, 31794–31810. [Google Scholar] [CrossRef] [Green Version]
  16. Suzuki, H.; Marumo, Y. A New Approach to Green Light Optimal Speed Advisory (GLOSA) Systems for High-Density Traffic Flow. In Proceedings of the 21st International Conference on Intelligent Transportation Systems, Maui, HI, USA, 4–7 November 2018. [Google Scholar]
  17. Benzaman, B.; Sharma, D. Discrete event simulation of a road intersection integrating V2V and V2I features to improve traffic flow. In Proceedings of the Winter Simulation Conference, Las Vegas, NV, USA, 3–6 December 2017. [Google Scholar]
  18. Li, L.-H.; Gan, J.; Li, W.-Q. A Separation Strategy for Connected and Automated Vehicles: Utilizing Traffic Light Information for Reducing Idling at Red Lights and Improving Fuel Economy. J. Adv. Transp. 2018, 2018, 5679064. [Google Scholar] [CrossRef]
  19. Coelho, M.C.; Rouphail, N. Assessing the impact of V2V/V2I communication systems on traffic congestion and emissions. In Proceedings of the European Conference on Human Centred Design for Intelligent Transport Systems, Berlin, Germany, 29–30 April 2010. [Google Scholar]
  20. Lourenco, M.; Souza, F.S.H.; Silva, C.M.; Meneguette, R.I.; Guidoni, D.L. A hybrid V2I and V2V approach for urban traffic management in vehicular networks. In Proceedings of the Latin-American Conference on Communications, Salvador, Brazil, 11–13 November 2019. [Google Scholar]
  21. Husain, A.A.; Maity, T.; Yadav, R.K. Vehicle detection in intelligent transport system under a hazy environment: A survey. IET Image Proc. 2020, 14, 1–10. [Google Scholar] [CrossRef]
  22. Howard, B. Hands on with Audi’s Exciting (No, Really) Traffic Light Countdown Timer. 2016. Available online: https://www.extremetech.com/extreme/240264-hands-audis-exciting-no-really-traffic-light-countdown-timer (accessed on 16 August 2021).
  23. Jeong, H.-J.; Kafle, V.P.; Yoo, H.; Kim, D. HIMALIS-VI: Fast and Secure Mobility Management Scheme Based on HIMALIS for V2I Services in Future Networks. Wireless Pers. Commun. 2014, 78, 2009–2023. [Google Scholar] [CrossRef]
  24. He, X.; Liu, H.X.; Liu, X. Optimal vehicle speed trajectory on a signalized arterial with consideration of queue. Transp. Res. Part C Emerg. Technol. 2015, 61, 106–120. [Google Scholar] [CrossRef]
  25. Kerimov, M.; Marusin, A.; Marusin, A.; Danilov, I. Methodological aspects of building mathematical model to evaluate efficiency of automated vehicle traffic control systems. Transp. Res. Procedia 2020, 50, 253–261. [Google Scholar] [CrossRef]
  26. Safiullin, R.; Fedotov, V.; Marusin, A. Method to evaluate performance of measurement equipment in automated vehicle traffic control systems. Transp. Res. Procedia 2020, 50, 20–27. [Google Scholar] [CrossRef]
  27. Lu, C.; Aakre, A. A new adaptive cruise control strategy and its stabilization effect on traffic flow. Eur. Transp. Res. Rev. 2018, 10, 49. [Google Scholar] [CrossRef]
  28. Granda, F.; Azpilicueta, L.; Vargas-Rosales, C.; Lopez-Iturri, P.; Aguirre, E.; Falcone, F. Integration of Wireless Sensor Networks in Intelligent Transportation Systems within Smart City Context. In Proceedings of the IEEE Antennas and Propagation Society International Symposium and USNC/URSI National Radio Science Meeting, Boston, MA, USA, 8–13 July 2018. [Google Scholar]
  29. Grumert, E.F.; Tapani, A.; Ma, X. Characteristics of variable speed limit systems. Eur. Transp. Res. Rev. 2018, 10, 21. [Google Scholar] [CrossRef]
  30. Sjöberg, K.; Andres, P.; Buburuzan, T.; Brakemeier, A. Cooperative Intelligent Transport Systems in Europe: Current Deployment Status and Outlook. IEEE Veh. Technol. Mag. 2017, 12, 89–97. [Google Scholar] [CrossRef]
  31. Glushkov, A.; Shepelev, V. Development of Reliable Models of Signal-Controlled Intersections. Transp. Telecommun. J. 2021, 22, 417–424. [Google Scholar] [CrossRef]
  32. Zhang, S.; Wu, G.; Costeira, J.P.; Moura, J.M. Table of contents. In Proceedings of the Conference on Computer Vision and Pattern Recognition, Honolulu, HI, USA, 21–26 July 2017. [Google Scholar]
  33. Peppa, M.V.; Bell, D.; Komar, T.; Xiao, W. Urban traffic flow analysis based on deep learning car detection from CCTV image series. In Proceedings of the ISPRS TC IV Mid-Term Symposium on 3D Spatial Information Science, Delft, The Netherlands, 1–5 October 2018. [Google Scholar]
  34. Zhang, S.; Wu, G.; Costeira, J.P.; Moura, J.M. FCN-rLSTM: Deep spatio-temporal neural networks for vehicle counting in city cameras. In Proceedings of the IEEE International Conference on Computer Vision, Venice, Italy, 22–29 October 2017; Institute of Electrical and Electronics Engineers Inc: Piscataway, NJ, USA, 2017. [Google Scholar]
  35. Bewley, A.; Ge, Z.; Ott, L.; Ramos, F.; Upcroft, B. Simple online and realtime tracking. In Proceedings of the IEEE International Conference on Image Processing, Phoenix, AZ, USA, 25–28 September 2016; IEEE Computer Society: Piscataway, NJ, USA, 2016. [Google Scholar]
  36. Khazukov, K.; Shepelev, V.; Karpeta, T.; Shabiev, S.; Slobodin, I.; Charbadze, I.; Alferova, I. Real-time monitoring of traffic parameters. J. Big Data 2020, 7, 84. [Google Scholar] [CrossRef]
  37. Shepelev, V.; Aliukov, S.; Nikolskaya, K.; Shabiev, S. The capacity of the road network: Data collection and statistical analysis of traffic characteristics. Energies 2020, 13, 1765. [Google Scholar] [CrossRef] [Green Version]
  38. Liu, Y.; Chang, G.L. An arterial signal optimization model for intersections experiencing queue spillback and lane blockage. Transp. Res. Part C Emerg. Technol. 2011, 19, 30–144. [Google Scholar] [CrossRef]
  39. Cohen, S.L.; Liu, C.C. Bandwidth-constrained transyt signal-optimization program. Transp. Res. Rec. 1986, 1057, 1–7. [Google Scholar]
  40. Gartner, N.H.; Assman, S.F.; Lasaga, F.; Hou, D.L. A multi-band approach to arterial traffic signal optimization. Transp. Res. Part B Methodol. 1991, 25, 55–74. [Google Scholar] [CrossRef]
  41. Chaudhary, N.A.; Messer, C.J. PASSER IV: A program for optimizing signal timing in grid networks. Transp. Res. Rec. 1993, 1421, 82–93. [Google Scholar]
  42. Wallace, C.E.; Courage, K.G.; Reaves, D.P.; Shoene, G.W.; Euler, G.W.; Wilbur, A. TRANSYT-7F User’s Manual: Technical Report; University of Florida: Gainesville, FL, USA, 1988. [Google Scholar]
  43. Wong, S.C. Group-based optimisation of signal timings using the TRANSYT traffic model. Transp. Res. Part B 1996, 30, 217–244. [Google Scholar] [CrossRef]
  44. Robertson, D.I.; Bretherton, R.D. Optimizing networks of traffic signals in real-time: The SCOOT method. IEEE Trans. Veh. Technol. 1991, 40, 11–15. [Google Scholar] [CrossRef]
  45. Zhen, Q.; Qian, Z.; Huapu, L.; Zhiheng, L. Intersection design and timing optimization based on SCOOT information platform. In Proceedings of the Intelligent Transportation Society of America—12th World Congress on Intelligent Transport Systems, San Francisco, CA, USA, 6–10 November 2005; Institute of Transportation Engineering, Tsinghua University: Beijing, China, 2009. [Google Scholar]
  46. Yu, Q.; Jun, H.J.; Li, W.; Jian, R.; Shi, J.-J. SCOOT improvement project and measures of effect in Beijing. In Proceedings of the Intelligent Transportation Society of America—12th World Congress on Intelligent Transport Systems, San Francisco, CA, USA, 6–10 November 2005; Institute of Transportation Engineering, Tsinghua University: Beijing, China, 2009. [Google Scholar]
  47. Gartner, N. OPAC: A demand-responsive strategy for traffic signal control. Transp. Res. Rec. 1983, 906, 75–81. [Google Scholar]
  48. Mirchandani, P.; Wang, F.Y. RHODES to intelligent transportation systems. IEEE Intell. Syst. 2005, 20, 10–15. [Google Scholar] [CrossRef]
  49. Pedroso, L.; Batista, P. Decentralized store-and-forward based strategies for the signal control problem in large-scale congested urban road networks. Transp. Res. Part C Emerg. Technol. 2021, 132, 103412. [Google Scholar] [CrossRef]
  50. Xu, Y.; Li, D.; Xi, Y.; Lin, S. Path-based adaptive traffic signal control with a mixed backpressure index. In Proceedings of the IEEE Conference on Intelligent Transportation Systems, Indianapolis, IN, USA, 19–22 September 2021. [Google Scholar]
  51. Aboudolas, K.; Papageorgiou, M.; Kosmatopoulos, E. Store-and-forward based methods for the signal control problem in large-scale congested urban road networks. Transp. Res. Part C Emerg. Technol. 2009, 17, 163–174. [Google Scholar] [CrossRef] [Green Version]
  52. Messmer, A.; Papageorgiou, M. METANET: A macroscopic simulation program for motorway networks. Traffic Eng. Control 1990, 31, 466–470. [Google Scholar]
  53. Papamichail, I.; Messmer, A.; Wang, Y. Traffic Simulation with METANET; International Series in Operations Research & Management Science; Springer: New York, NY, USA, 2010; pp. 399–430. [Google Scholar]
  54. Shelby, S.G. Single-intersection evaluation of real-time adaptive traffic signal control algorithms. Transp. Res. Rec. 2004, 1867, 183–192. [Google Scholar] [CrossRef]
  55. Chai, L.; Cai, B.; ShangGuan, W.; Wang, J.; Wang, H. Connected and autonomous vehicles coordinating approach at intersection based on space–time slot. Transportmetr. A Transport Sci. 2018, 14, 929–951. [Google Scholar] [CrossRef]
  56. Németh, B.; Gáspár, P.; Szőcs, D.; Mihály, A. Design of the optimal motions of autonomous vehicles in intersections through neural networks. IFAC-PapersOnLine 2018, 51, 19–24. [Google Scholar] [CrossRef]
  57. Reyes, A.; Barrado, C.; López, M.; Excelente, C. Vehicle density in VANET applications. J. Ambient Intell. Smart Environ. 2014, 6, 469–481. [Google Scholar] [CrossRef] [Green Version]
  58. Kandali, K.; Bennis, H. Performance assessment of AODV, DSR and DSDV in an urban VANET scenario. Adv. Intell. Sys. Comput. 2019, 915, 98–109. [Google Scholar]
  59. Jayapal, C.; Roy, S.S. Road traffic congestion management using VANET. In Proceedings of the International Conference on Advances in Human Machine Interaction, Kodigehalli, India, 3–5 March 2016. [Google Scholar]
  60. Kwatirayo, S.; Almhana, J.; Liu, Z. Optimizing intersection traffic flow using VANET. In Proceedings of the IEEE International Conference on Sensing, Communications and Networking, New Orleans, LA, USA, 24–27 June 2013. [Google Scholar]
  61. Kalinic, M.; Krisp, J.M. Fuzzy inference approach in traffic congestion detection. Ann. GIS 2019, 25, 329–336. [Google Scholar] [CrossRef]
  62. Lin, H.; Aye, K.M.; Tun, H.M.; Theingi Naing, Z.M. Design and construction of intelligent traffic light control system using fuzzy logic. AIP Conf. Proc. 2008, 1052, 237–239. [Google Scholar]
  63. Comert, G. Effect of stop line detection in queue length estimation at traffic signals from probe vehicles data. Eur. J. Oper. Res. 2013, 226, 67–76. [Google Scholar] [CrossRef]
  64. Ramezani, M.; Geroliminis, N. Queue profile estimation in congested urban networks with probe data. Comput. Aided Civ. Infrastruct. Eng. 2015, 30, 414–432. [Google Scholar] [CrossRef]
  65. Li, F.; Tang, K.; Yao, J.; Li, K. Real-time queue length estimation for signalized intersections using vehicle trajectory data. Transp. Res. Rec. 2017, 2623, 49–59. [Google Scholar] [CrossRef]
  66. Tan, C.; Yao, J.; Tang, K.; Sun, J. Cycle-based queue length estimation for signalized intersections using sparse vehicle trajectory data. IEEE Intell. Syst. 2021, 22, 91–106. [Google Scholar] [CrossRef]
  67. Jeff Ban, X.; Hao, P.; Sun, Z. Real time queue length estimation for signalized intersections using travel times from mobile sensors. Transp. Res. Part C Emerg. Technol. 2011, 19, 1133–1156. [Google Scholar] [CrossRef]
  68. Qi, Z.; Li, M.; Liu, C.; Zhao, M.; Long, M. A measurement method for vehicle queue length of intersection based on image processing. In Proceedings of the Eighth International Conference on Image Processing Theory, Tools and Applications, Xi’an, China, 7–10 November 2018; IEEE: Piscataway, NJ, USA, 2019. [Google Scholar]
  69. Do, L.N.N.; Taherifar, N.; Vu, H.L. Survey of neural network-based models for short-term traffic state prediction. Wiley Interdiscip. Rev. Data Min. Knowl. Discov. 2019, 9, e1285. [Google Scholar] [CrossRef] [Green Version]
  70. Cui, C.; Shin, J.; Lee, H. Real-time traffic signal learning control using BPNN based on predictions of the probabilistic distribution of standing vehicles. Artif. Life Rob. 2010, 15, 58–61. [Google Scholar] [CrossRef]
  71. Luo, X.; Li, D.; Yang, Y.; Zhang, S. Spatiotemporal traffic flow prediction with KNN and LSTM. J. Adv. Transp. 2019, 2019, 4145353. [Google Scholar] [CrossRef] [Green Version]
  72. Niittymäki, J.; Nevala, R. Fuzzy adaptive traffic signal control—Principles and results. In Proceedings of the Joint 9th IFSA World Congress and 20th NAFIPS International Conference, Vancouver, BC, Canada, 25–28 July 2001; IEEE: Piscataway, NJ, USA, 2002. [Google Scholar]
  73. Agrawal, A.; Paulus, R. Improving traffic and emergency vehicle clearance at congested intersections using fuzzy inference engine. Int. J. Electr. Comput. Eng. 2021, 11, 3176–3185. [Google Scholar]
  74. Xu, M.; Chai, J.; Yan, Y.; Qu, X. Multi-agent fuzzy-based transit signal priority control for traffic network considering conflicting priority requests. IEEE Trans. Intell. Transp. Syst. 2021. [Google Scholar] [CrossRef]
  75. Mittal, U.; Chawla, P. Neuro-fuzzy based adaptive traffic light management system. In Proceedings of the 8th International Conference on Reliability, Infocom Technologies and Optimization (Trends and Future Directions), Noida, India, 4–5 June 2020; IEEE: Piscataway, NJ, USA, 2020. [Google Scholar]
  76. Fedorov, A.; Nikolskaia, K.; Ivanov, S.; Shepelev, V.; Minbaleev, A. Traffic flow estimation with data from a video surveillance camera. J. Big Data 2019, 6, 73. [Google Scholar] [CrossRef]
  77. Redmon, J.; Farhadi, A. YOLOv3: An Incremental Improvement. arXiv 2018, arXiv:1804.02767. [Google Scholar]
  78. Menshov, S.; Wang, Y.; Zhdanov, A.; Varlamov, E.; Zhdanov, D. Simple online and realtime tracking people with new “soft-iou” metric. In Proceedings of the SPIE—The International Society for Optical Engineering, Beijing, China, 7–9 July 2019. [Google Scholar]
  79. Maher, A.; Taha, H.; Zhang, B. Realtime multi-aircraft tracking in aerial scene with deep orientation network. J. Real-Time Image Process. 2018, 15, 495–507. [Google Scholar] [CrossRef]
  80. Wei, Y.; Song, N.; Ke, L.; Chang, M.; Lyu, S. Street object detection/tracking for AI city traffic analysis. In Proceedings of the IEEE SmartWorld Ubiquitous Intelligence and Computing, Advanced and Trusted Computed, Scalable Computing and Communications, Cloud and Big Data Computing, Internet of People and Smart City Innovation, San Francisco, CA, USA, 4–8 April 2017. [Google Scholar]
  81. He, K.; Zhang, X.; Ren, S.; Sun, J. Deep residual learning for image recognition. In Proceedings of the 29th IEEE Conference on Computer Vision and Pattern Recognition, Las Vegas, NV, USA, 26 June–1 July 2016. [Google Scholar]
  82. Kacimi, M.A.; Guenounou, O.; Brikh, L.; Yahiaoui, F.; Hadid, N. New mixed-coding PSO algorithm for a self-adaptive and automatic learning of Mamdani fuzzy rules. Eng. Appl. Artif. Intell. 2020, 89, 103417. [Google Scholar] [CrossRef]
Figure 1. YOLOv3 neural network architecture.
Mathematics 10 00282 g001
Figure 2. Video frame of the neural network at the intersection of Lenin av.-Engels str. (Chelyabinsk, Russia).
Mathematics 10 00282 g002
Figure 3. Operation algorithm.
Mathematics 10 00282 g003
Figure 4. Traffic plan.
Mathematics 10 00282 g004
Figure 5. Calculated driving speed.
Mathematics 10 00282 g005
Figure 6. Simulation visualization of vehicles movement at an intersection (a,b) (CarMeter = 8, S1 = 140 m).
Mathematics 10 00282 g006
Figure 7. The number of vehicles that passed the intersection at the calculated and uncontrolled speed (S1 = 120 m).
Mathematics 10 00282 g007
Figure 8. Distribution of values of input variables: (ac) and output variable (d).
Mathematics 10 00282 g008
Figure 9. Surface plot out1 (optimal speed of the vehicle approaching the intersection) (in1 (the number of cars waiting at the intersection), and in2 (the vehicle’s distance to the start of the intersection)).
Mathematics 10 00282 g009
Figure 10. Surface plot out1 (optimal speed of the vehicle approaching the intersection) (in2 (the vehicle’s distance to the start of the intersection), and in3 (the proportion of large vehicles waiting at the intersection)).
Mathematics 10 00282 g010
Figure 11. Surface plot out1 (optimal speed of the vehicle approaching the intersection) (in1 (the number of cars waiting at the intersection), and in3 (the proportion of large vehicles waiting at the intersection)).
Mathematics 10 00282 g011
Table 1. Car parameters at the intersection.
Car No.Tstart (sec)L (m)Tend (s)
10.324.16.1
21.928.78.6
33.233.311.1
44.638.213.6
56.242.815.8
68.047.618.6
79.852.320.5
810.657.021.2
912.561.723.2
Table 2. Vehicle speed (km/h).
L (m)Number of CarMeter Vehicles
012345678910
30023.5820.3019.3618.5017.7217.0916.3515.8815.719.079.07
32025.2321.7020.6919.7718.9418.2617.4616.9616.799.689.68
34026.9023.1222.0321.0520.1619.4318.5818.0517.8610.2910.29
36028.5824.5423.3822.3421.3820.6119.7119.1418.9410.9010.90
38030.2725.9624.7423.6322.6121.7920.8420.2320.0211.5111.51
40031.9827.4026.1024.9223.8522.9821.9721.3321.1012.1212.12
42033.6928.8427.4726.2225.0924.1723.1022.4322.1912.7312.73
44035.4230.2928.8427.5326.3325.3724.2423.5323.2813.3413.34
46037.1731.7530.2228.8427.5826.5725.3824.6424.3813.9513.95
48038.9333.2231.6130.1628.8427.7726.5325.7525.4814.5714.57
50040.7034.6933.0031.4830.1028.9827.6826.8626.5815.1815.18
52042.4936.1834.4132.8131.3630.2028.8327.9827.6815.8015.80
Table 3. Matching the grades of the output and input variables.
No.IFTHEN
in1in2in3DoSOut1
1SmallCloseSmall1.00Very high
2SmallCloseMedium1.00High
3SmallCloseLarge1.00Medium
4SmallMediumSmall1.00Very high
5SmallMediumMedium1.00High
6SmallMediumLarge1.00Medium
7SmallFarSmall1.00Very high
8SmallFarMedium1.00High
9SmallFarLarge1.00Medium
10MediumCloseSmall1.00Medium
11MediumCloseMedium1.00Low
12MediumCloseLarge1.00Very low
13MediumMediumSmall1.00High
14MediumMediumMedium1.00Medium
15MediumMediumLarge1.00Low
16MediumFarSmall1.00High
17MediumFarMedium1.00Medium
18MediumFarLarge1.00Low
19LargeCloseSmall1.00Low
20LargeCloseMedium1.00Very low
21LargeCloseLarge1.00Very low
22LargeMediumSmall1.00Low
23LargeMediumMedium1.00Low
24LargeMediumLarge1.00Very low
25LargeFarSmall1.00Medium
26LargeFarMedium1.00Low
27LargeFarLarge1.00Low
Publisher’s Note: MDPI stays neutral with regard to jurisdictional claims in published maps and institutional affiliations.

