Article

Influence of Rotation Speed on Flow Field and Hydraulic Noise in the Conduit of a Vertical Axial-Flow Pump under Low Flow Rate Condition

1
College of Hydraulic Science and Engineering, Yangzhou University, Yangzhou 225009, China
2
Jiangxi Research Center on Hydraulic Structures, Nanchang 330029, China
3
Water Resources Research Institute of Jiangsu Province, Nanjing 210017, China
4
Shanghai Kaiquan Pump (GROUP) Co., Ltd., Nanjing 210000, China
*
Author to whom correspondence should be addressed.
Machines 2022, 10(8), 691; https://doi.org/10.3390/machines10080691
Submission received: 10 July 2022 / Revised: 7 August 2022 / Accepted: 11 August 2022 / Published: 14 August 2022
(This article belongs to the Section Turbomachinery)

Abstract

:
The complex flow inside the axial-flow pump device will cause the problem of hydraulic noise; in order to explore the influence of the law of rotation speed on the internal flow characteristics and hydraulic noise of the axial-flow pump conduit, a combination of Computational Fluid Dynamics (CFD) and Computational Acoustics (CA) was used to numerically solve the flow field and internal sound field in the pump device. The results showed that the flow in the elbow inlet conduit was smooth at different rotation speeds, and there was no obvious unstable flow. The higher the rotation speed, the more disordered the flow pattern in the left half of the elbow, which intensifies the unstable flow in the straight outlet conduit. The impeller is the main sound source of the internal hydrodynamic noise of the vertical axial-flow pump device. When the sound source propagates upstream and downstream along the conduit, the Total Sound Source Intensity (TSSI) gradually decays with the increase of distance; the greater the rotation speed is, the faster the Total Sound Source Intensity (TSSI) decays. When the rotation speed was increased from 1450 r/min to 2200 r/min, the TSSI in the straight outlet conduit was attenuated by 8.9 dB, 13.9 dB, and 16.0 dB respectively, and the TSSI in the elbow inlet conduit was attenuated by 11.0 dB, 13.5 dB, and 25.9 dB respectively. The vortex structure in the conduit induces flow noise and delays the attenuation of TSSI in the propagation process; with the increase of rotation speed, this delay will be more obvious.

1. Introduction

Nowadays, extreme weather is occurring more and more frequently, Asia, North America, and Europe have been disturbed by rainstorms and floods. For example, on 21 August 2021, Tennessee suffered floods caused by heavy rain, resulting in the death of at least 21 local people. On 15 July 2021, Germany and Belgium suffered severe floods, which caused the rivers in western Germany and neighboring Belgium to burst. From 17 July to 28 July 2021, Henan Province, China was affected by floods, resulting in direct economic losses of 88.534 billion yuan. More and more countries are investing a lot of material and financial resources to establish a flood control and drainage system every year, and the pump station is one of the most effective engineering measures to solve the flood disasters and regional water resources dispatching, the average annual discharge of large-scale drainage stations in China alone is above 40 billion cubic meters [1]. The axial-flow pump is a high-specific-speed pump, and it is more suitable for occasions with low heads and large flows. Vertical axial-flow pumps have good anti-cavitation performance, convenient start-up, convenient automatic operation, small machine room areas, and can save investment, therefore, more and more large pump stations adopt vertical axial-flow pumps, such as Jumukechi Drainage Station in Japan, Buheramara Pumping Station in Bangladesh, and Romania Water Lifting Irrigation Area, the largest automatic irrigation area in Europe.
The unstable flow inside the pump has always been the focus of domestic and foreign scholars. Mao, ZB et al. [2,3] studied the asymmetric flow of the electrohydrodynamic pump in two directions, and optimized the structure of the pump to reduce the pressure difference. Bueker, J and Murovec, J et al. [4,5] studied the flow characteristics and cavitation inside the centrifugal pump. The pump device is often accompanied by noise in the process of unstable operation [6], especially for the unit of the large pumping station, because the unit of the large pumping station is relatively large, its noise pollution cannot be ignored, so more and more studies have been carried out on the acoustic properties of pump devices [7,8]. Some scholars have conducted a lot of work on the radiated noise of the sound field outside the pump device. Choi, JS et al. [9] took the centrifugal pump as the research object and clarified the correlation between the measured values of unsteady flow field and radiated noise characteristics in the impeller coordinate system and laboratory coordinate system through experiments. Guo, C et al. [10] discussed the mechanism of sound field distribution characteristics of a centrifugal pump with different blade outlet angles by using a numerical simulation method based on Powell Vortex Acoustic Theory. In order to study the structural vibration and radiated noise caused by the internal flow of an axial-flow pump, Chen, EY et al. [11] used sound vibration coupling to solve the vibration and sound field of the pump, and proposed a hybrid numerical method to successfully predict the vibration and radiated noise generated in the axial-flow pump. Huang XC et al. [12] studied the distributed excitation on the surface of the pump jet thruster by using the Finite Element Method, it was found that the contribution of the distributed excitation on the rotor surface to the radiated noise is much greater than that of the pressure pulsation on the duct and stator surface, and the distribution characteristics of the fluid excitation load have an important impact on the structural noise radiation of the pump jet thruster. In most cases, the internal sound field and external sound field cannot be strictly distinguished, but for the pump device, the internal sound field caused by the noise induced by the internal flow or the noise radiated by the surrounding structural vibration to the fluid space is more important for the optimal design of the pump device.
Aiming at the problem of the internal sound field of the pump device, scholars in this field agree that the noise source of internal sound field during the operation of pump devices is mainly divided into two types: hydrodynamic noise and mechanical noise [13,14], with the progress of industrial technology, the mechanical noise can be reduced by taking existing measures [15,16,17], and the hydrodynamic noise is transmitted by the fluid in a complex three-dimensional motion. Therefore, the research on the hydrodynamic noise inside the pump device has high academic value and practical significance. Hydrodynamic noise theory mainly includes Lighthill sound analogy theory and vortex sound theory. At present, Lighthill sound analogy theory is mainly used in the field of pump devices, in 1952, James Lighthill established the acoustic simulation theory of Lighthill equation, which laid the foundation of aeroacoustics. Over time, the theory has been continuously improved, with Curle’s formula solving the problem of the Lighthill equation being unable to meet the sound generation of stationary objects in turbulence, additionally, the FW-H equation solves the problem that the Lighthill equation does not consider the sound produced by the moving boundary [15]. So far, the research theory of aeroacoustics has gradually matured. In physics, the sound sources of moving objects are divided into three types: monopole sound sources that generate sound waves due to the periodic addition or weakening of fluid mass, dipole sound sources that generate sound waves due to the periodic lifting force on the surface of moving objects, and quadrupole sound sources that generate sound waves due to the interaction between fluids. Because the flow medium in the axial-flow pump is incompressible fluid, and the fluid velocity is far lower than the sound velocity, the fluid dynamic noise in the axial-flow pump mainly takes the dipole sound source as the noise source. Hydrodynamic noise can be divided into hydrodynamic noise of stationary parts and rotating parts. Fu J et al. [18] took a pump jet propeller as the research object, analyzed the noise of stationary parts and rotating parts respectively, and found that the broadband total sound band of stationary parts is the highest in the radial direction, while the broadband total sound pressure level of rotating parts is the highest in the axial direction, and the radial noise is mainly generated by the conduit of the pump device. Subsequently, more and more studies have pointed out that due to the strong pulsation area between the impeller and the flow conduit connected to the pump device [19], the flow conduit has become the main contributor to the noise at the radial measuring point, therefore, the shell or flow conduit connected to the pump device has become the focus of the study of the radial noise of the pump device. Si, QR et al. [20,21] arranged sound pressure-level monitoring points on the surface of the volute of the centrifugal pump to study the characteristics of flow-induced noise in the high-speed centrifugal pump, and compared and analyzed the advantages and disadvantages of Acoustic Boundary Element Method and Acoustic Finite Element Method in application, the results showed that the Acoustic Finite Element Method has more advantages in predicting discrete noise, so it is more suitable for the study of broadband noise in the internal flow field. The sound pressure level near the volute tongue is the highest, the rotor stator interaction between the impeller and the volute is the main cause of flow induced noise, and the unstable flow intensifies the broadband component in the noise spectrum. In order to study the causes of vibration and noise caused by rotating stall of the axial-flow pump under low-flow-rate conditions, Kan, K et al. [22] used Computational Fluid Dynamics (CFD) technology to study the steady-state and unsteady three-dimensional fluid motion of the axial-flow pump, and analyzed the steady flow characteristics of velocity, pressure, and turbulent kinetic energy, as well as the pulsation characteristics of pressure monitoring points in unsteady flow, and the mechanism of low-frequency pressure pulsation of the pump device under stall conditions was revealed. Yang, F et al. [23,24,25,26,27]. took the outlet conduit of the vertical axial-flow pump as the research subject, and analyzed the pulsation characteristics and noise characteristics of the outlet conduit of the axial-flow pump through experimental and numerical calculation methods respectively, the results showed that the rotation speed had an obvious impact on the sound pressure level of flow noise in the outlet conduit, and the main pulsation frequencies of each monitoring point were at low frequencies at different rotation speeds. Zhang JF et al. [28] and Tan MG et al. [29] all studied the noise characteristics of the sound field in the centrifugal pump and found that the frequency characteristics of the noise are similar to the pressure pulsation due to the dynamic and static interference between the impeller and the volute, the sound pressure distribution is mainly concentrated at the axial frequency, blade frequency, and its frequency multiplication, and the sound pressure level is the largest at the blade frequency.
It can be seen from the above that the unstable flow inside the pump device has a direct impact on the internal flow characteristics and hydraulic noise of the pump device. It is found in references [22,30] that when the axial-flow pump operates under the condition of low flow rate, there will be rotating stall and other phenomena, resulting in the imbalance of hydraulic stability inside the pump device. References [14,28] show that the pressure fluctuation amplitude is the largest under low flow rate conditions, in addition, compared with the design flow condition and large flow rate condition, the sound pressure level under the low-flow-rate condition not only has a peak at blade frequency and frequency doubling, but also has alternating peaks at low frequencies such as shaft frequency and frequency doubling. At present, most of the research on the hydraulic noise of hydraulic machinery focuses on centrifugal pumps and water-jet propulsion pumps, and there are few studies on the hydraulic noise of axial-flow pump devices. In previous studies, the authors mainly analyzed the law of pressure pulsation and hydraulic noise in the conduit [23,25], however, there is still a lack of understanding of internal flow characteristics of the conduit and the change law of hydraulic noise under low-flow-rate conditions. In the existing research results, there is no quantitative analysis conclusion for the distribution characteristics of hydraulic noise in the conduit of the axial-flow pump device, since variable speed adjustment is often used in the actual operation of the pumping station, it is of great theoretical significance and practical significance to clarify the influence mechanism of the rotation speed on the flow characteristics and hydraulic noise of the pump device, which can provide a theoretical basis for widening the stable operation range of the axial-flow pump device. In summary, this paper studied the vertical axial-flow pump device under the condition of 0.6Qbep flow rate at different rotation speeds, and drew on the research ideas of references [31,32,33,34]. We used Computational Fluid Dynamics (CFD) combined with Acoustic Finite Element Method (FEM) to analyze the internal flow field and hydraulic noise of the conduit, and the analysis flow chart is shown in Figure 1.

2. Numerical Simulation Method

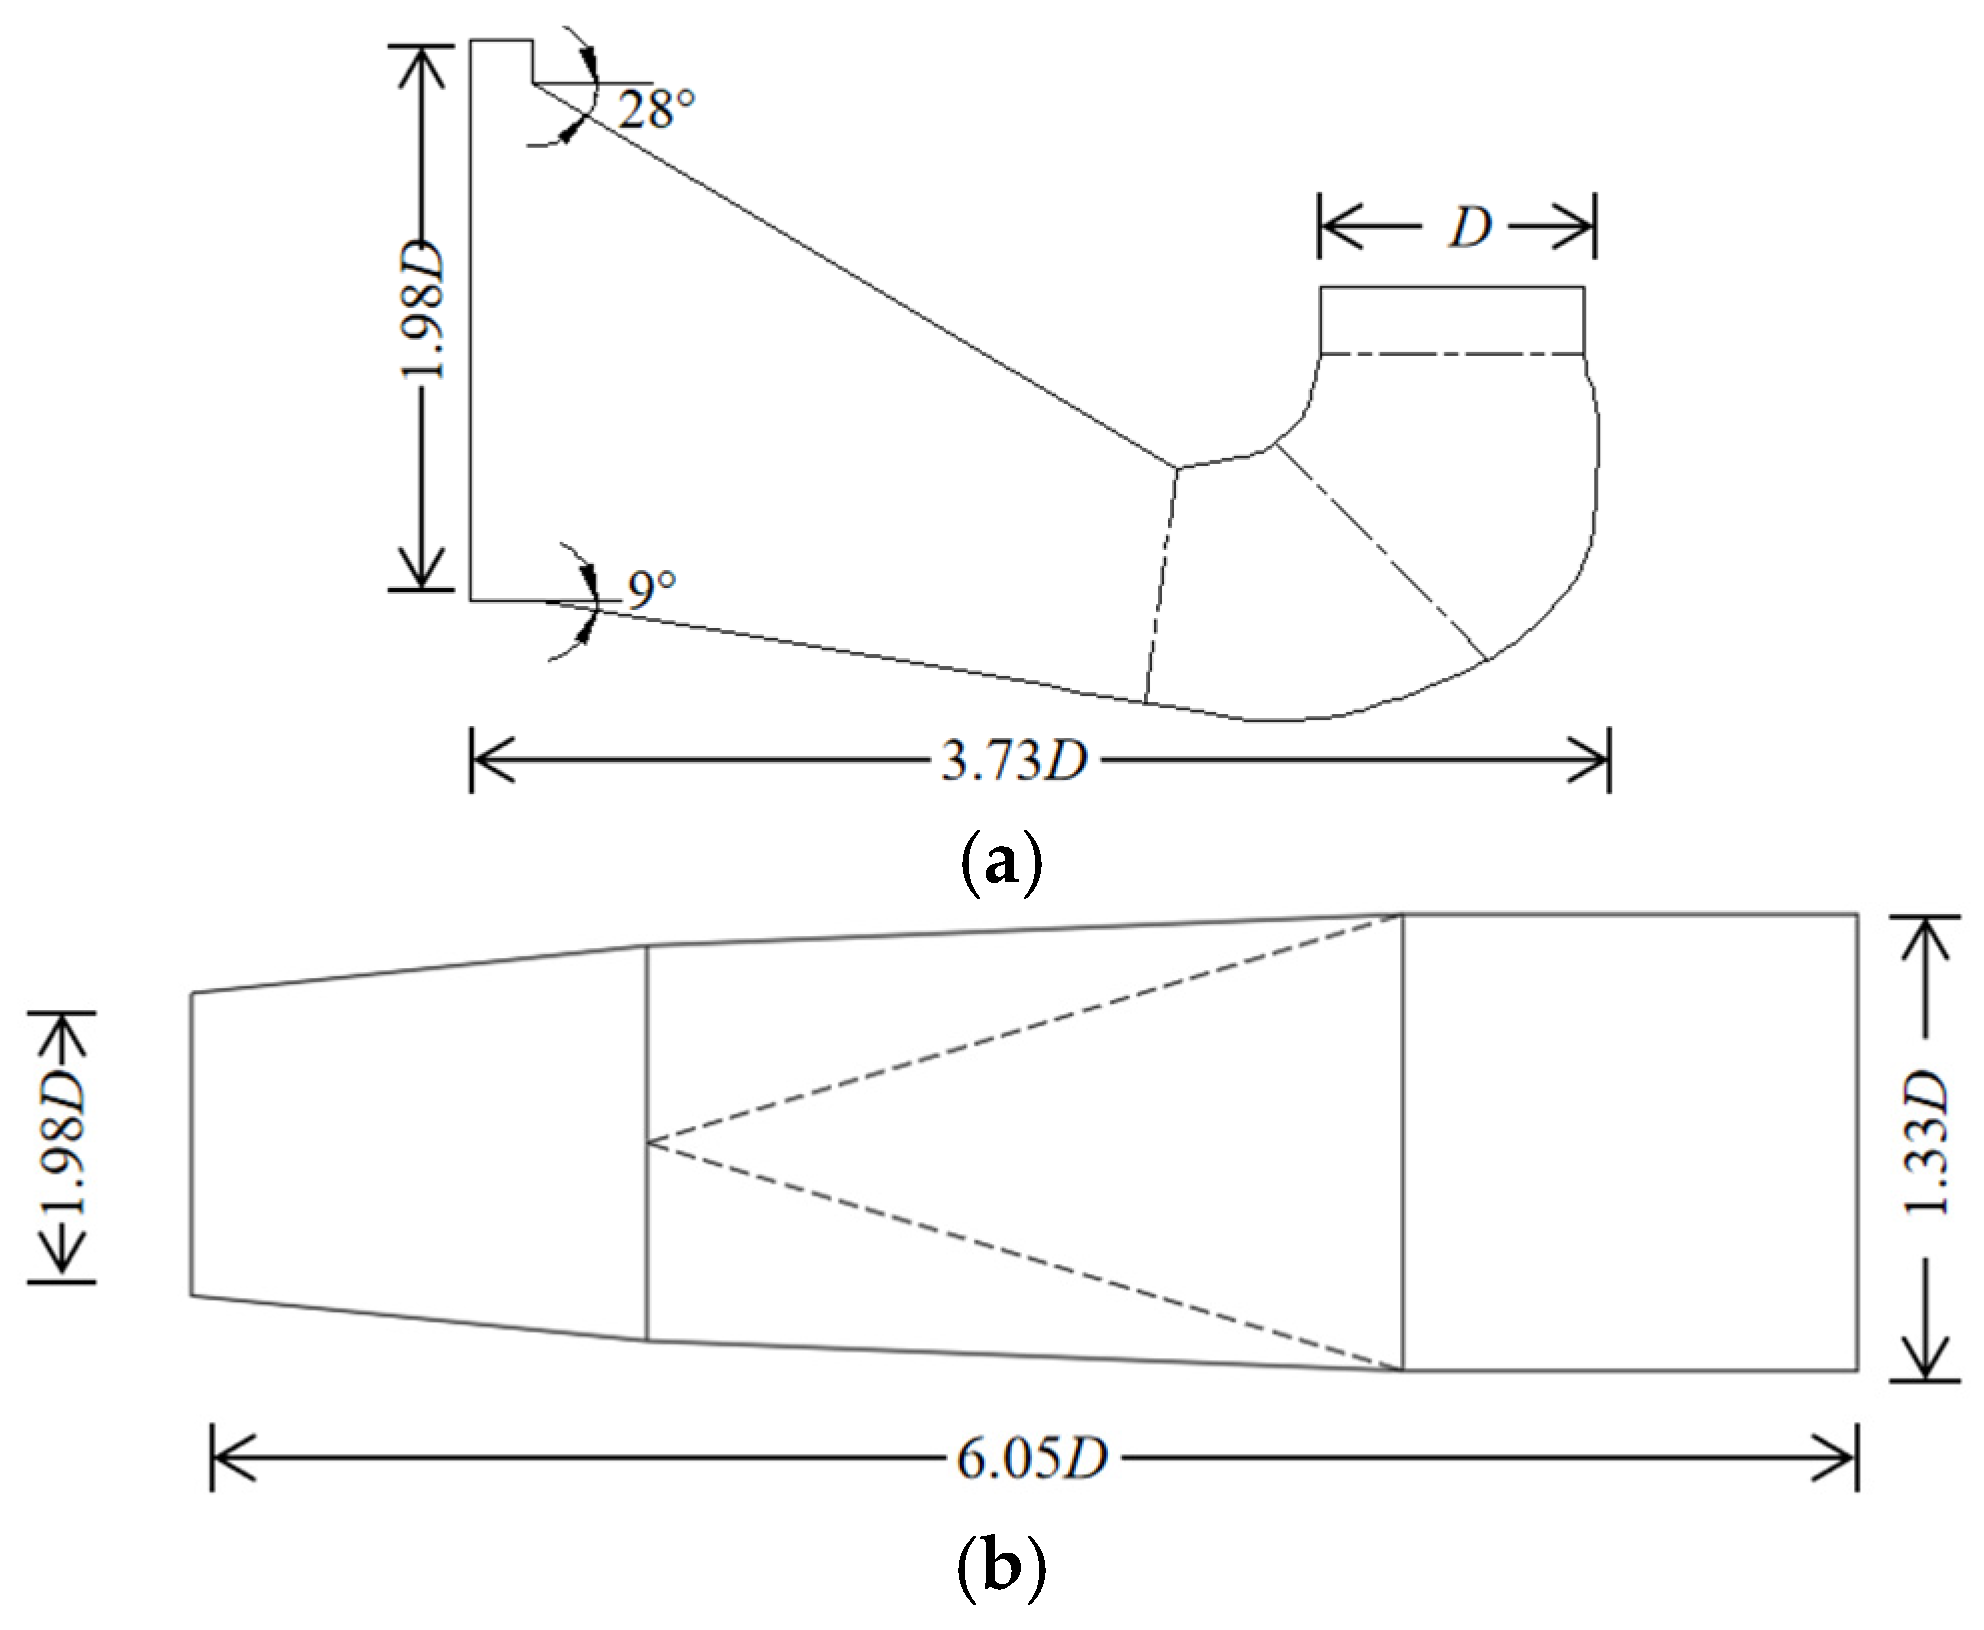
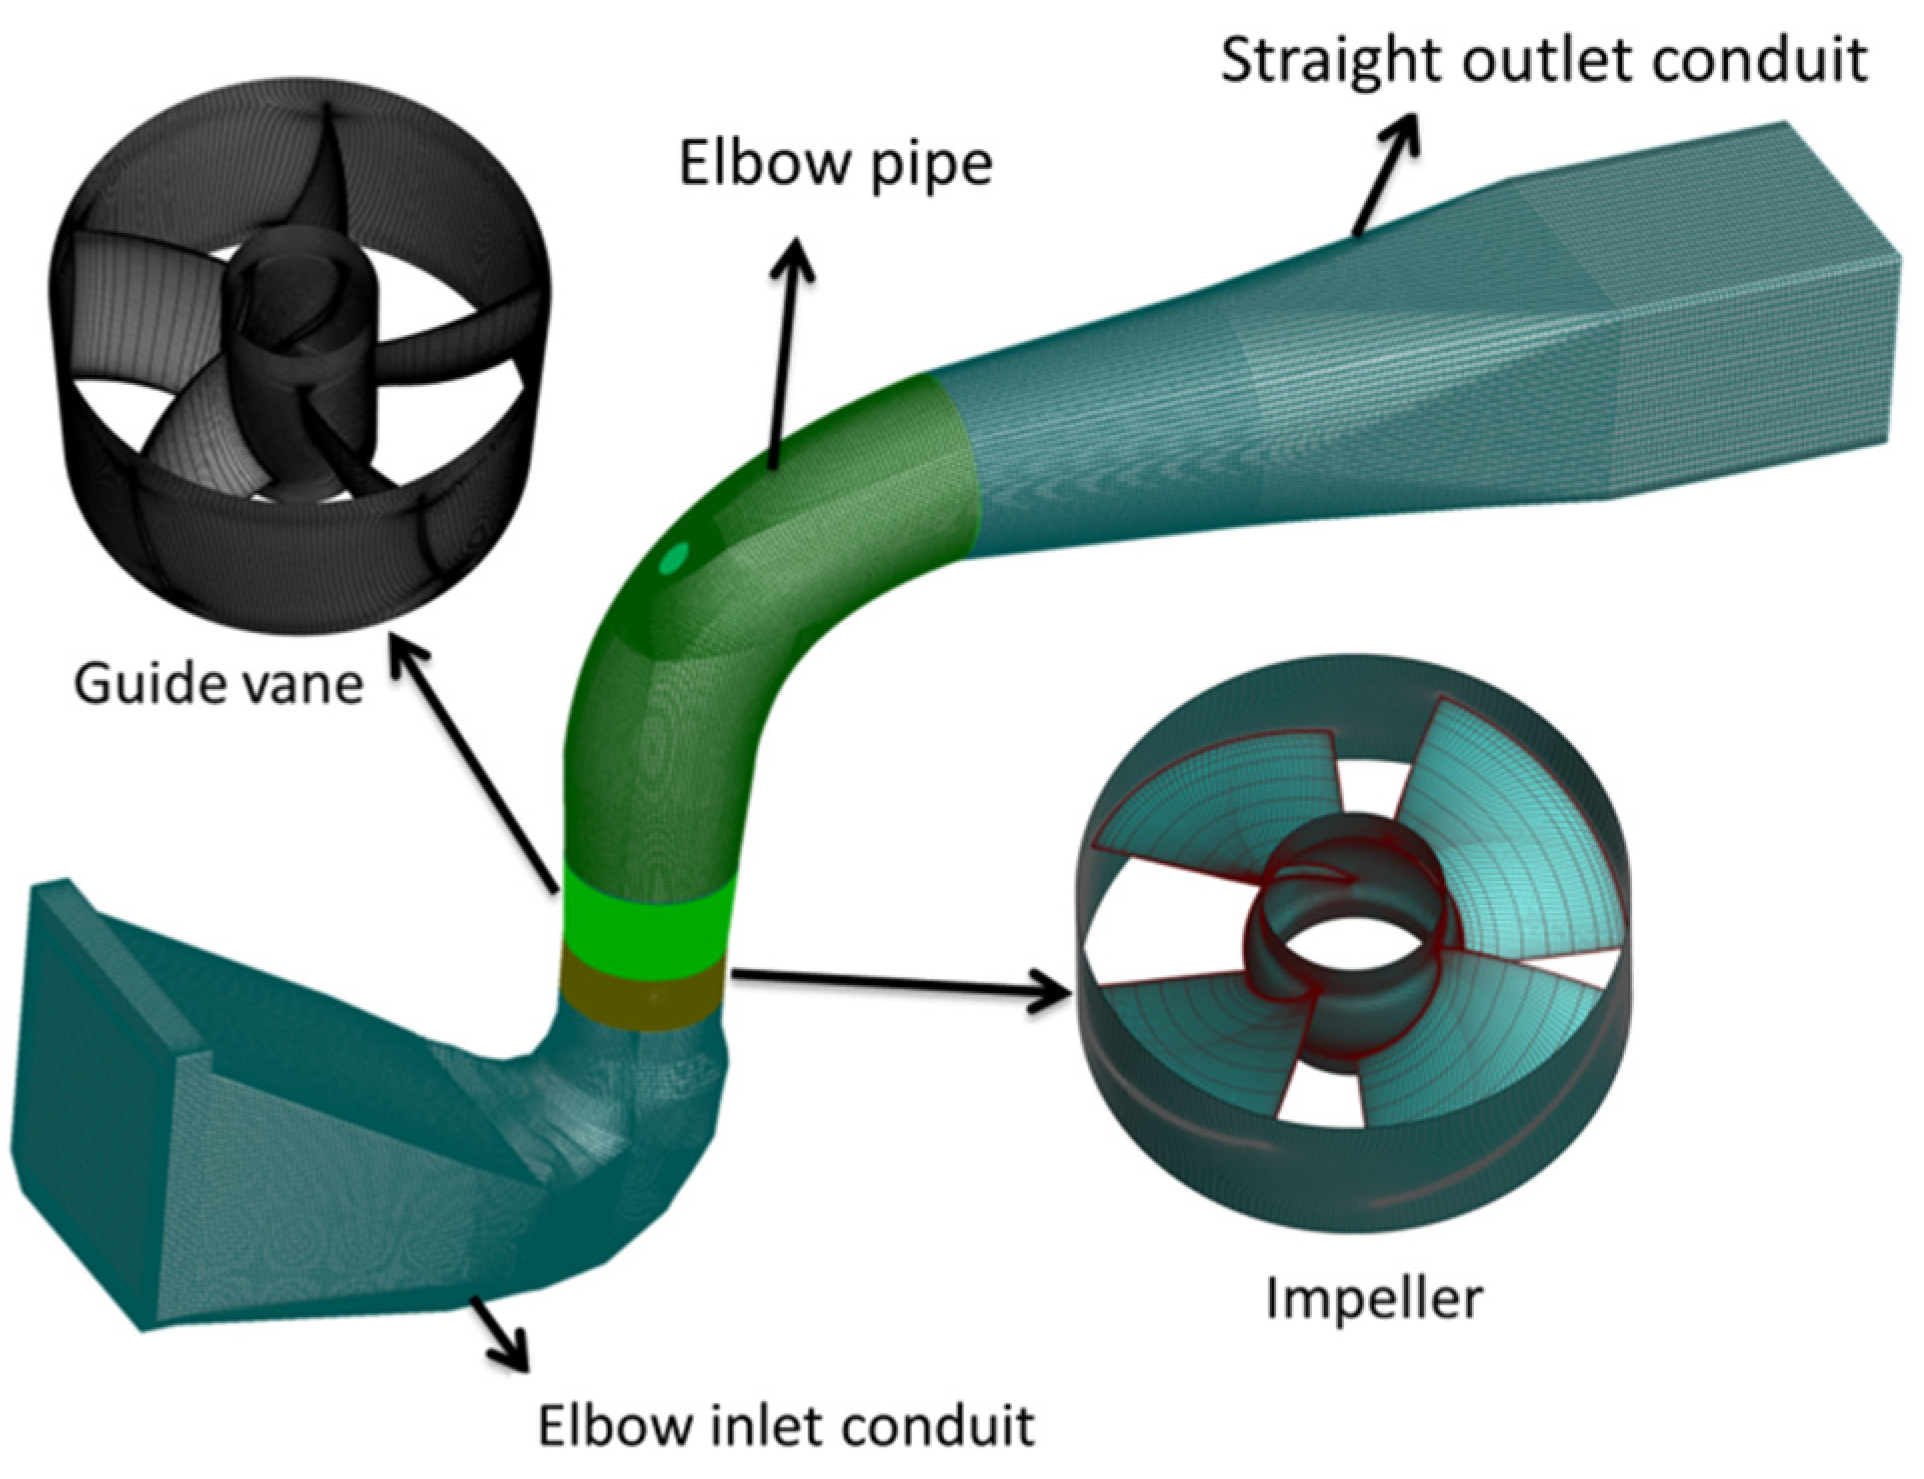
2.1. Model Parameter

Taking the vertical axial-flow pump as the research object, the calculation domain includes elbow inlet conduit, impeller, guide vane, and straight outlet conduit. The three-dimensional model of the vertical axial-flow pump device is shown in Figure 2, the impeller model is ZM55, the impeller’s nominal diameter is 120 mm, the hub ratio is 0.40, the blade number is 4, and the blade placement angle is 0°. The three-dimensional geometry of the blade was determined according to the design parameters of the axial-flow pump impeller, as shown in the schematic diagram in Figure 2. When the horizontal length x of the blade is 0.54D and the height difference r between the outer edge of the blade outlet and the outer edge of the inlet edge is 0.17D, it is defined that the position of the blade at the hub center at this time is 0°. The average clearance of the tip is 0.2 mm, and the guide vane blade number is 5. The outlet conduit is a straight pipe structure, the equivalent diffusion angle is 2.41°, the inlet is circular, the outlet is rectangular, and the conduit profile changes evenly. The cross-sectional area at the outlet of elbow inlet conduit is 113 cm2, and the cross-sectional area at the inlet of straight outlet conduit is 154 cm2. Figure 3a shows the geometric dimension of the elbow inlet conduit, Figure 3b shows the geometric dimension of the straight outlet conduit, and D in the figure is the nominal diameter of the impeller.

2.2. Turbulence Model and Governing Equations

The numerical calculation of the flow field of the vertical axial-flow pump device relies on the commercial platform ANSYS CFX, the numerical simulation of the three-dimensional incompressible turbulence inside the pump device adopts the Navier–Stokes (RANS) control equation with Reynolds time averaged equation, considering the large amount of high Reynolds number turbulence in the mainstream area of the axial-flow pump, the SST k-ω turbulence model was used in this paper, which considers the propagation of turbulent shear stress. Using the mixed-function method, the model in the standard case was compared with k-ε and k-ω, which can accurately predict complex flow conditions such as flow separation under adverse pressure gradients, and is suitable for numerical simulation with high accuracy. The turbulence model is adopted in references [24,30], and ideal numerical results are obtained.

2.3. Grid Generation

Turbogrid was used for structural grid division of the impeller and guide vane, and ICEM software was used for structural grid division of the elbow inlet conduit, elbow, and straight outlet conduit, as shown in Figure 4. After the grid division process was completed, the grid around the blade was densified. Because the precision of the grid plays a decisive role in the accuracy and efficiency of numerical calculation, especially the grid quality of boundary layer near the wall, in order to describe the boundary layer flow in the near wall region, the dimensionless parameter y+ was introduced to represent the distance from the nearest grid node to the wall. It is necessary to consider a reasonable value of y+ to meet the requirement of the SST k-ω turbulence model on the quality of near wall grid, the y+ value in most areas of the impeller blade and guide vane were within 30, the specific definitions of y+ are as follows [34]:
y + = Δ y u τ σ ,
where, ∆y is the distance from the grid node of the first layer to the wall, u τ is the wall friction velocity, and σ is kinematic viscosity.
The independence of grid numbers was analyzed for the axial-flow pump device, and the influence of different grid numbers on the efficiency of the axial-flow pump device under the optimal working conditions was summarized and sorted as shown in Table 1. It is obvious that the efficiency of the axial-flow pump increased with the increase of the number of grids, when the number of grids increased from 3.9 million to 5.1 million, the efficiency of the pump tended to be stable, and the change in efficiency was obviously less than 1%. Therefore, the axial-flow pump device model with 5.4 million grids was selected as the final numerical calculation model.

2.4. Solver Control

The transient simulation was carried out based on the steady-state results, and the Transient Rotor–Stator method was used to deal with the interface. The convergence accuracy of the steady-state calculation was set to 1.0 × 10⁻⁵. The inlet boundary condition adopts the total pressure, which was set at the inlet surface of the inlet extension section of the elbow inlet conduit, and the total pressure was set at 1 atm. The numerical simulation results of the flow field in the axial-flow pump device are not sensitive to the selection of the inlet turbulent kinetic energy parameters, so the medium turbulence intensity Tu = 5% was adopted at the inlet surface of the inlet extension section. The outlet boundary condition adopts mass flow and was set on the outlet surface of the outlet extension of the straight outlet conduit. According to references [14,24,30], the impeller remains stable after 6~8 rotation cycles. We set the total calculation time to be 8 times of the impeller rotation cycle at different rotation speeds, the time step as the time required for the impeller to rotate 3°, and the maximum number of steps as 10. At the same time, we set the impeller to output 120 fixed dipole data in each rotation cycle. In order to ensure the stability of the calculation results, the fixed dipole data of the last four periods were used as the sound source for sound field calculation.

2.5. Sound Numerical Method

The sound field is divided into an internal sound field and external sound field. The internal sound field refers to the sound radiated to the basin space by the noise induced by fluid flow or the noise generated by the vibration of surrounding structures in a closed fluid space. For the Φ120 mm hydraulic machinery closed cycle test-bed, the internal basin will automatically produce a complete internal sound field, while the area outside the closed cycle test-bed belongs to the external sound field problem. This paper mainly studied the internal sound field. Acoustic Boundary Element Method (BEM) and Acoustic Finite Element Method (FEM) are usually used to solve the internal sound field, the Acoustic Boundary Element Method can quickly and effectively calculate the magnitude of leaf frequency and frequency doubling noise. Although the Acoustic Finite Element Method has more complex modeling and a longer calculation time than the Acoustic Boundary Element Method, the Acoustic Finite Element Method overcomes the disadvantage that the integral method cannot solve the complex boundary Green’s function when calculating the far-field flow noise, and its calculation results are more consistent with reality [21]. Therefore, in order to accurately predict the broadband noise problem inside the pump device, the Acoustic Finite Element Method was used in this paper.
The Acoustic Finite Element Method is transformed from the Classical Acoustic Equation. The equation needs to be integrated to obtain the following form:
Ω ( 2 t 2 ( ρ ρ 0 ) δ ρ + c 0 2 x i ( ρ ρ 0 ) δ ρ x i + T i j x j δ ρ x i ) d x = 0 ,
where, T i j is the stress tensor, ρ is the liquid density, ρ 0 is the liquid density without disturbance, c 0 is the sound velocity, t is the time, x is the spatial coordinate, Ω is the propagation area of sound field, is the sign of partial derivative, δ is a micro variable symbol, i is the index, and j represents the direction component of the coordinate axis, following the summation convention in the tensor.
To ensure accurate calculation, it is necessary to ensure that the maximum unit length of the sound grid is less than 1/6 of the sound wave wavelength at the maximum frequency, that is, L < c/(6fmax), where L represents the unit length and c represents the propagation speed of sound in water, 1500 m/s is taken, and fmax represents the maximum calculation frequency. After calculation, when the sound grid length in this paper is 10 mm, the predicted maximum frequency is 25 kHz, which meets the requirements of sound calculation [7,35].

3. Physical Model of the Axial-Flow Pump Device

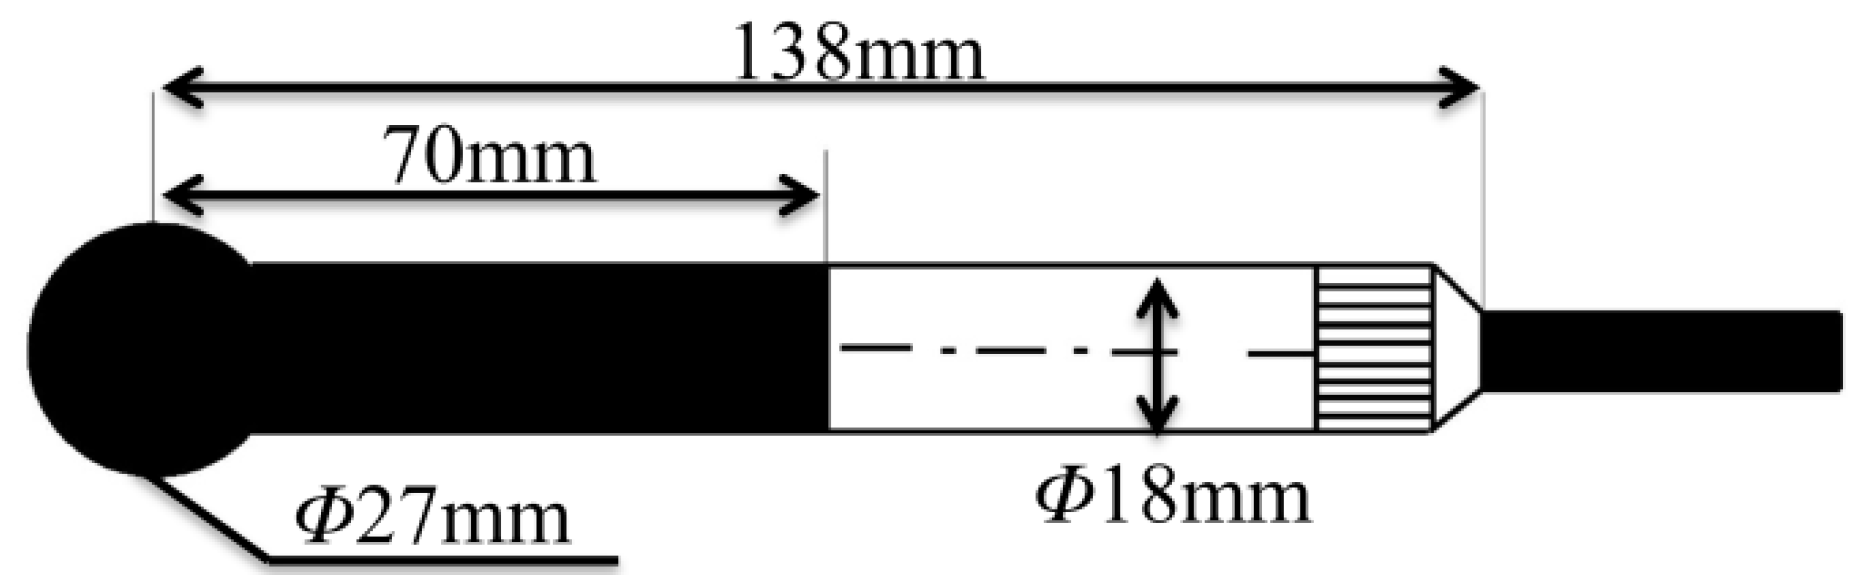
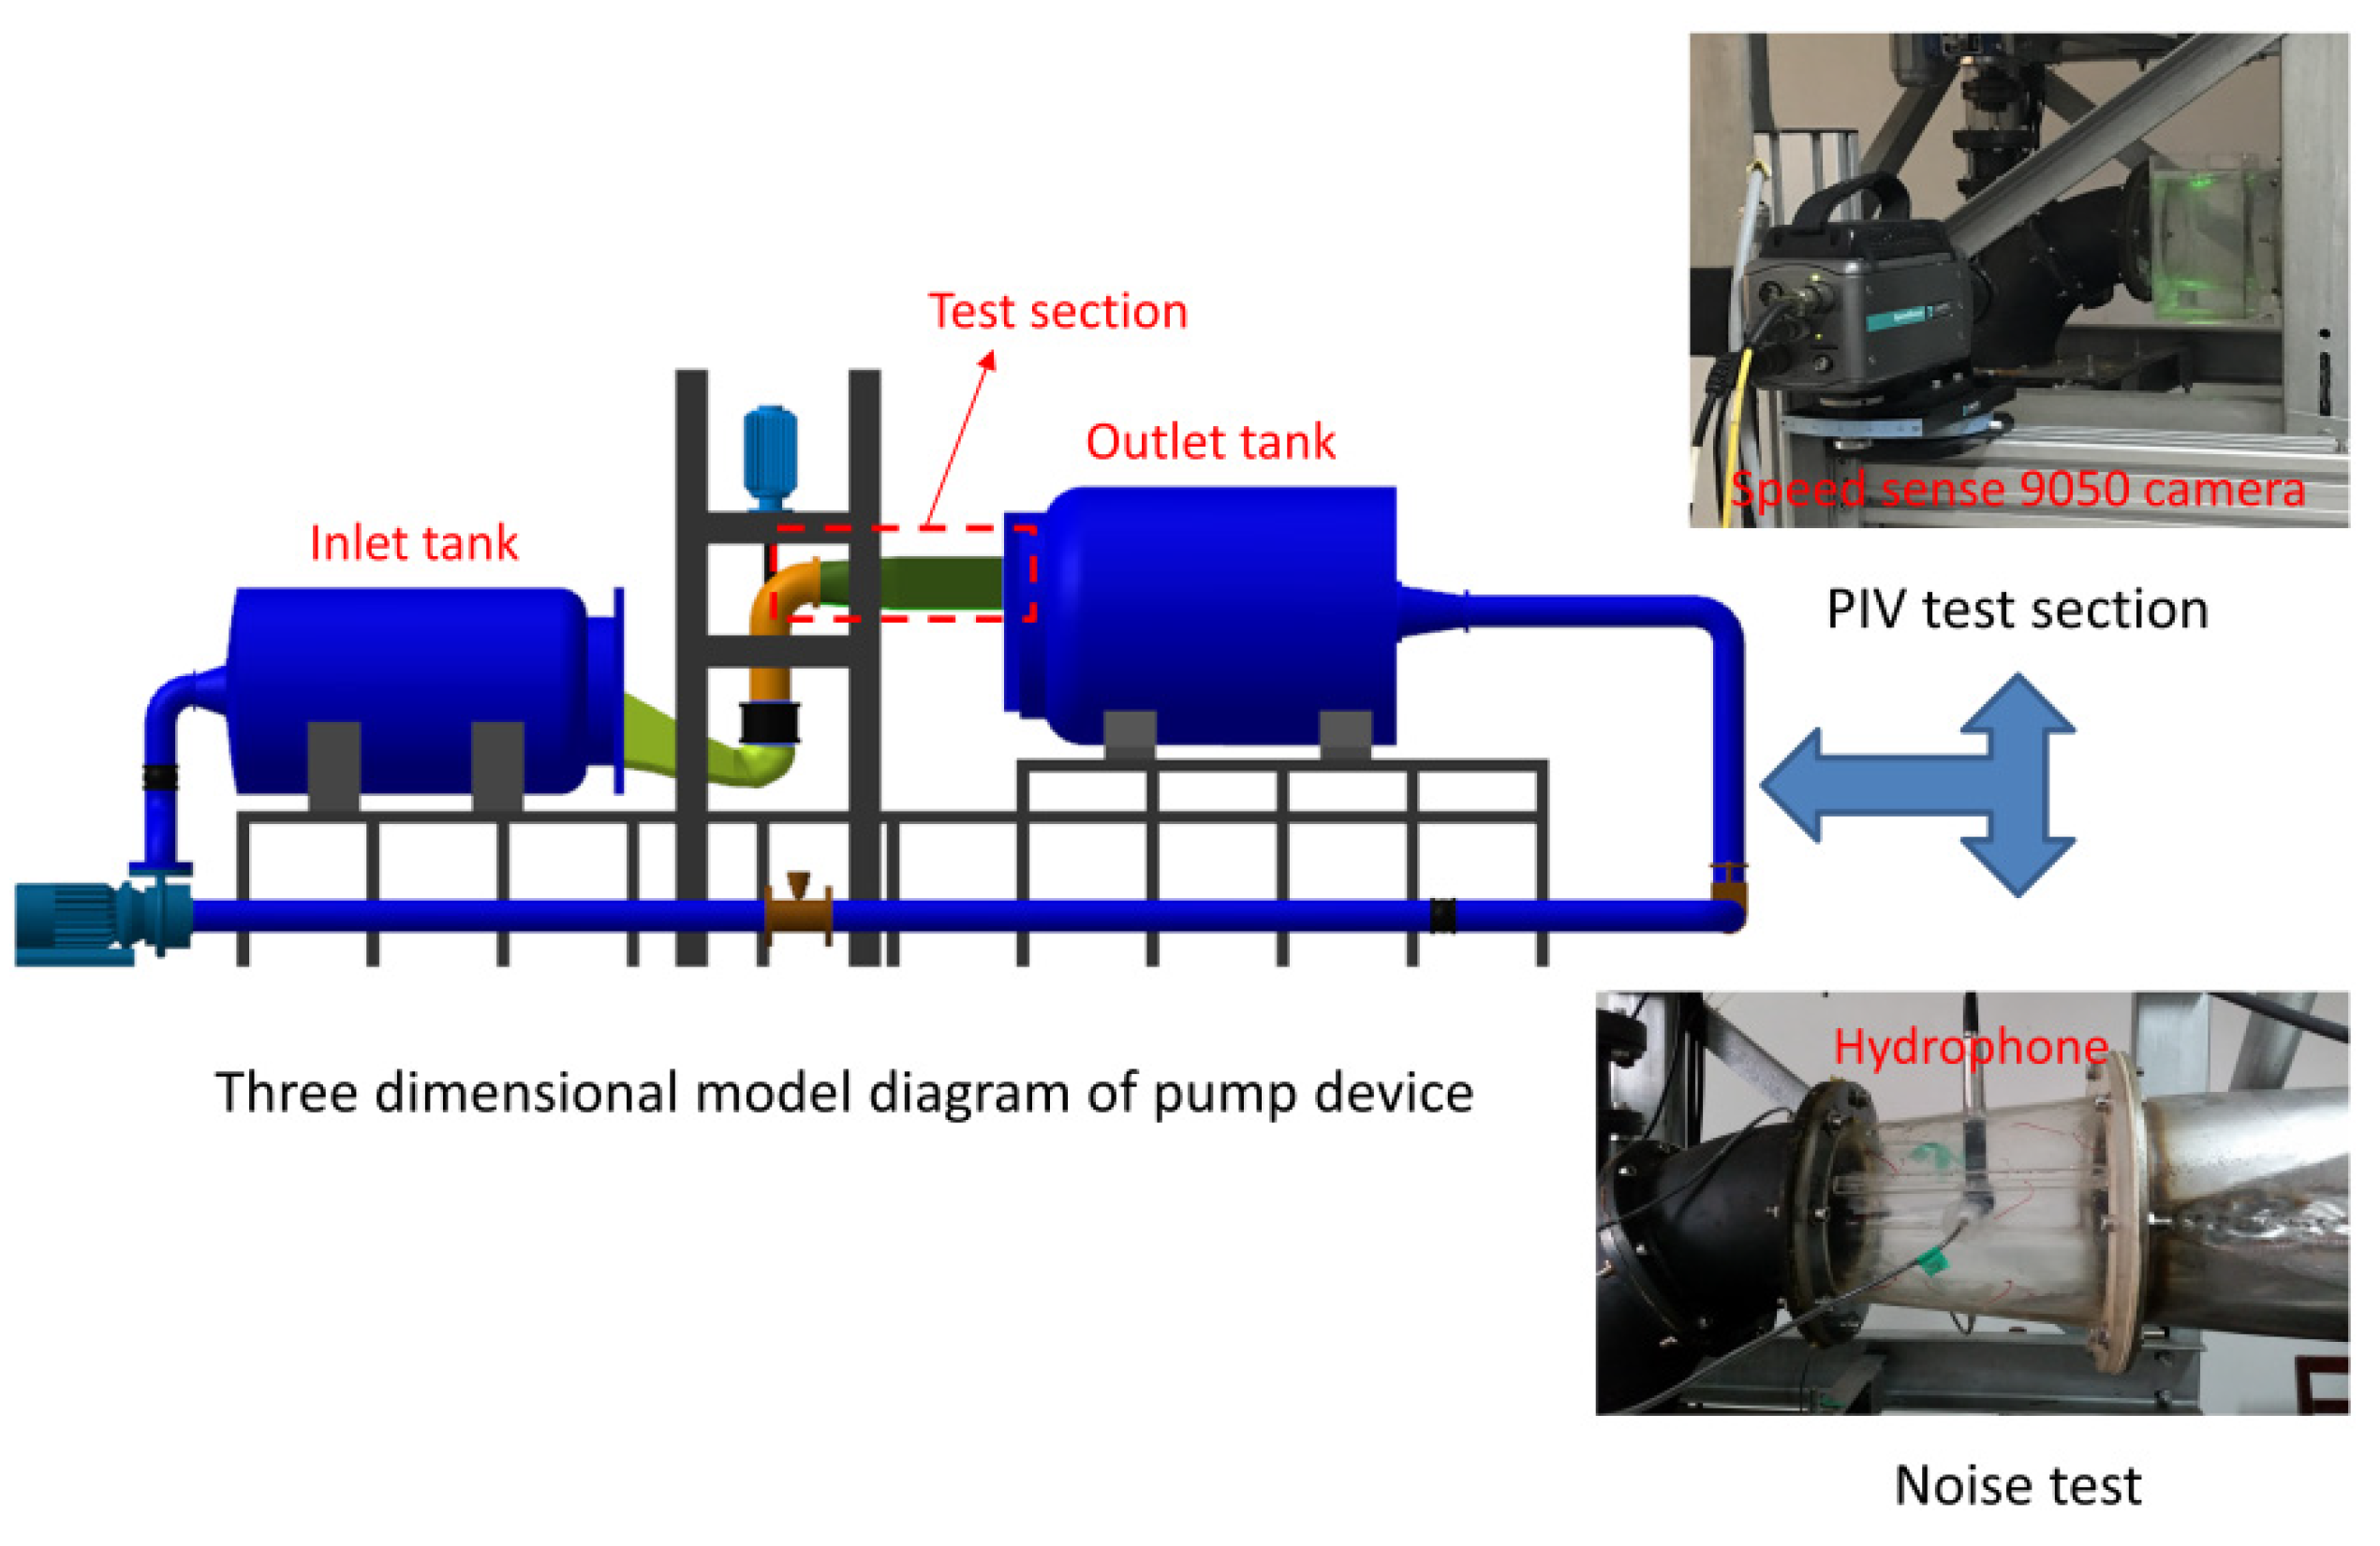
3.1. Test Device and Test Method

The noise test of the vertical axial-flow pump device was tested on the Φ120 mm hydraulic mechanical closed cycle test bed of the Jiangsu Provincial Key Laboratory of Water Conservancy and Power Engineering. The impeller is made of brass material, the guide vane is made of stainless steel metal material, and the elbow inlet conduit and the straight outlet conduit are all made of transparent plexiglass. The LDG-125S-92 electromagnetic flowmeter was used for flow measurement, the EJA intelligent differential pressure transmitter was used for lift measurement, and the JCO type 0.1 rotational speed torque sensor was used for torque and rotation speed measurement. Because the accuracy of the noise measurement results is closely related to the installation position of the hydrophone, in order to ensure the measurement accuracy, the transmitting transducer should face the test direction of the receiving hydrophone, and the transducer and the center of the hydrophone should be kept at the same depth, the hydrophone was arranged vertically at the midpoint of the middle part of the straight outlet conduit, the hydrophone in the noise test adopted the RHS-20 standard hydrophone, and the signal adopted the TST6200 dynamic signal acquisition system. The RHS-20 standard hydrophone has no directivity in the horizontal plane and no directivity in the range of 240° in the vertical plane, its frequency range can cover most of the underwater acoustic measurement frequency bands. In the frequency range of 20 Hz to 80 kHz, the receiving sensitivity response is flat, and it is suitable for long-distance signal transmission, the appearance size of the hydrophone is shown in Figure 5. Using the 2D3C-PIV test system, the instantaneous flow field of the vertical axial-flow pump device in the structural change section of the straight outlet conduit was measured, and the numerical calculation results of the flow field in the pump device were verified. Wait for the pump device to run stably for 5 min, after that, start the PIV laser test, inject clean water into the transparent rectangular water tank outside the straight outlet conduit test section as shown in Figure 6, and keep no obvious air bubbles and large stains. Because the test area is small, the 2D2C test accuracy is sufficient to meet the test requirements [36]. The 2D3C-PIV test system mainly includes a dual-cavity Nd: Yag laser with a maximum output energy of 600 mJ, a wavelength of 532 nm, a maximum frequency of 100 Hz, and a pulse duration of 6 ns. The resolution of the Speed sense 9050 camera is 2400 × 1800 pixels, and the acquisition speed is 480 frames/s. The tracer particles are made of polystyrene, with a density close to that of water, good follow-up to fluid movement, and uniform distribution in water. By comparing the displacement changes of the tracer particles in the two images with time interval, the Vx and Vz of the water flow can be obtained, that is, the instantaneous velocity of the water flow velocity in the lateral and axial directions. The PIV test and the noise test of the straight outlet conduit are shown in Figure 6.

3.2. Comprehensive Uncertainty Analysis

The comprehensive uncertainty of the vertical axial-flow pump device was analyzed, and the calculation is as follows. The calculation result was above the standard for the comprehensive uncertainty of the test in the water conservancy industry standard of the People’s Republic of China code for Acceptance Test of Pump Model and Device Model (SL140-2006):
  E η , s = ± E Q 2 + E H 2 + E N 2 + E M 2 = ± 0.173 % ,
E η = ± E η , s 2 + E η , r 2 = ± ( 0.173 % ) ² + ( 0.148 % ) ² = ± 0.228 % ,
where, E η is the comprehensive uncertainty of the test-bed, E η , s is the system uncertainty of the test-bed, E η , r is the random uncertainty of the test-bed, E Q is the systematic error of the flow test, and the whole process measurement error is ±0.1%. E H is the systematic error of the head test, and the whole process measurement error is ±0.01%. E M is the systematic error of the torque test, and the whole process measurement error is ±0.1%. E N is the system error of the speed test, and the whole process measurement error is ±0.1%.

4. Results and Analysis

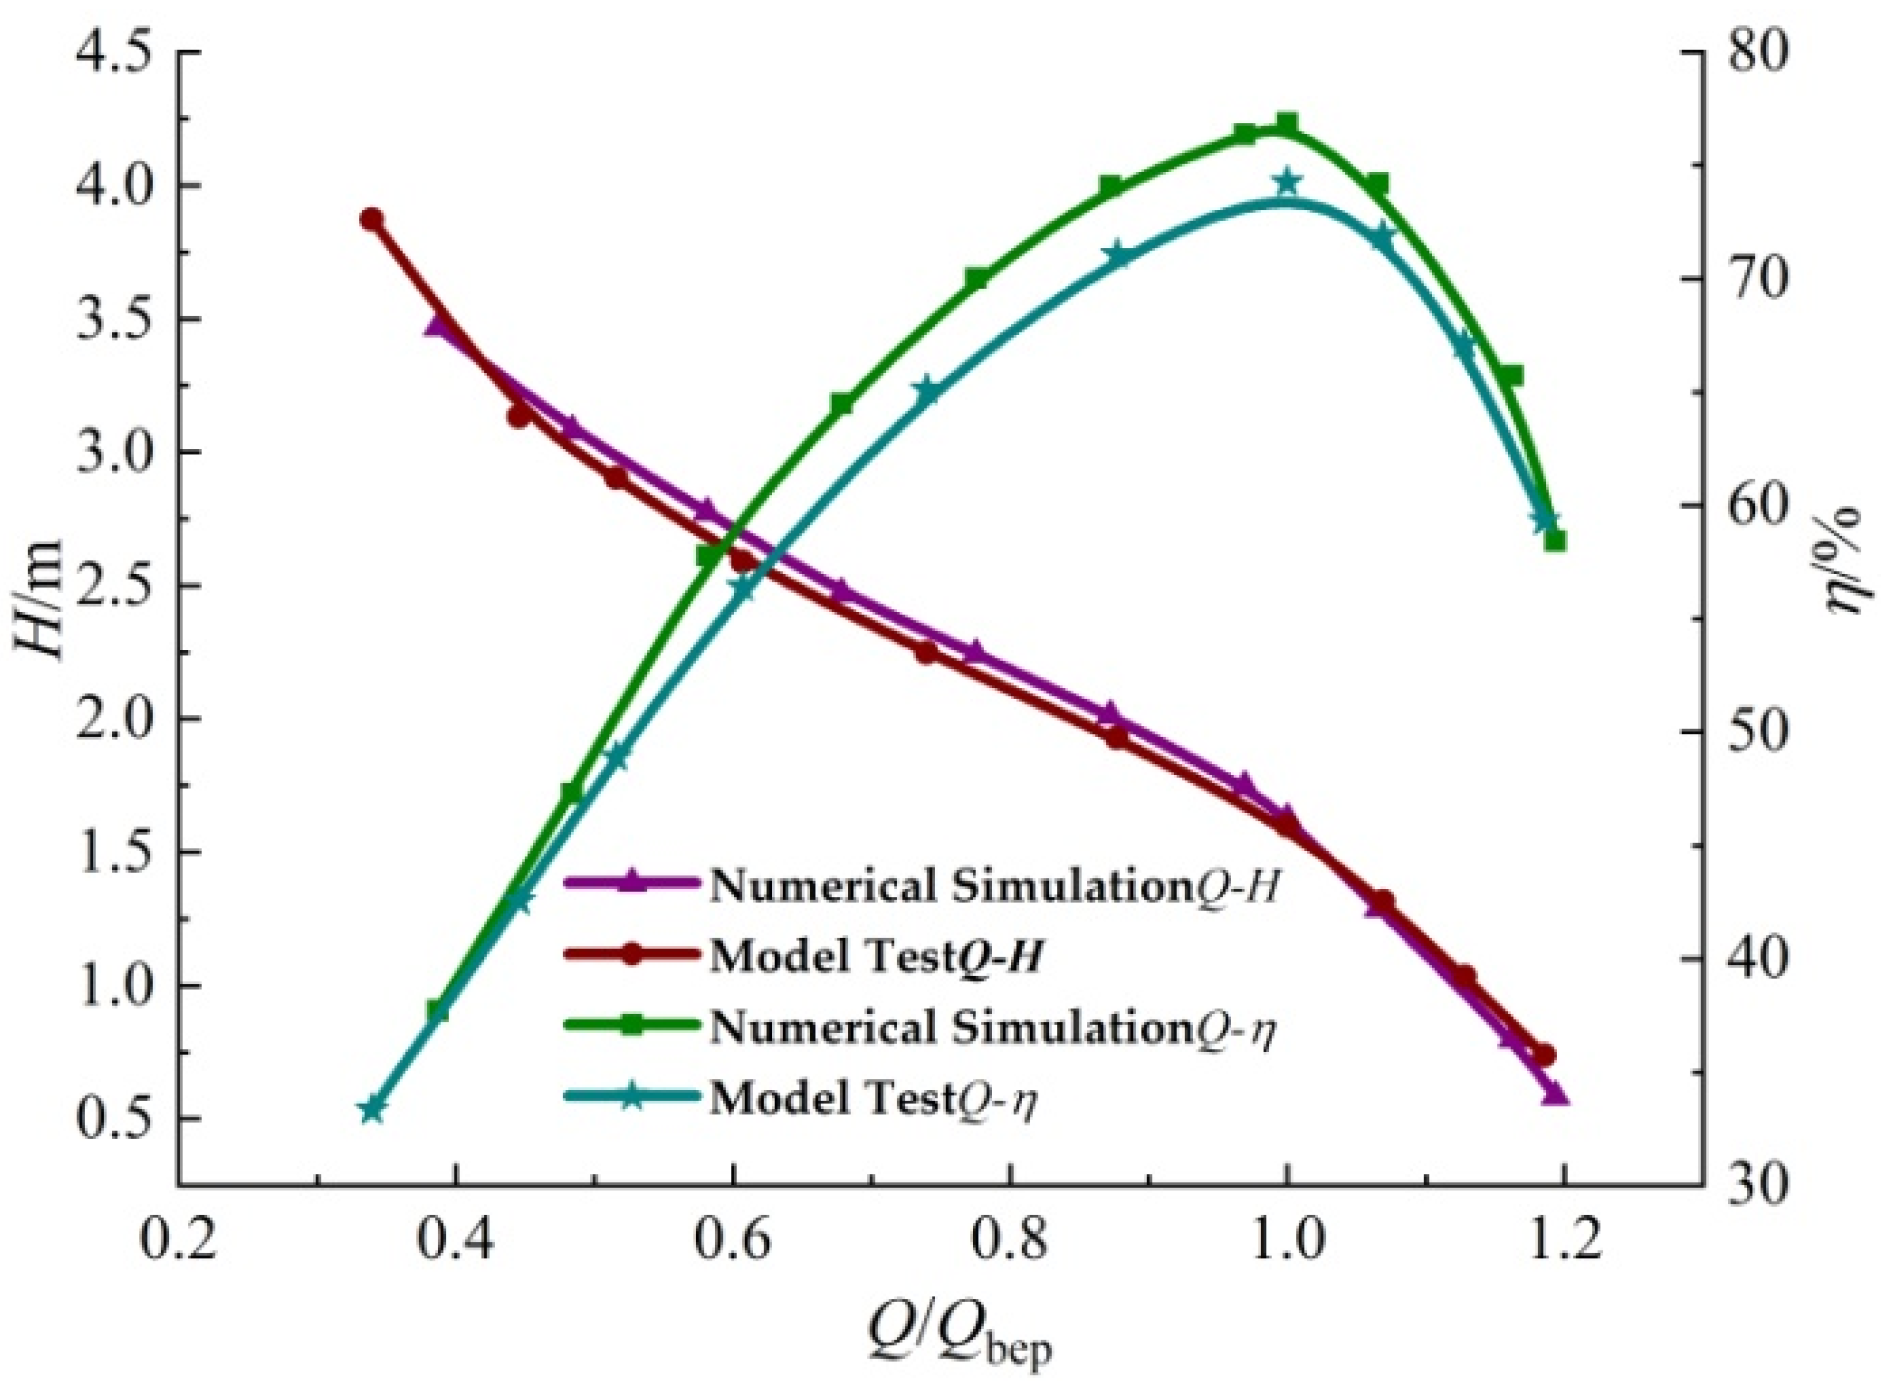
4.1. Numerical Calculation Verification

In hydrodynamics, the Reynolds number is usually used to describe the turbulence in the flow field, the Reynolds number of the inlet and outlet conduit is mainly calculated by the following formula, and the calculation results are shown in Table 2. From the calculation results, it can be seen that the flow of the inlet and outlet conduit of the pump device is three-dimensional turbulent flow.
R e = v D ζ ,
where, R e is the Reynolds number of the inlet and outlet conduit, v is the average velocity of the outlet section of the elbow inlet conduit and the average velocity of the inlet section of the straight outlet conduit, and D is the diameter of the outlet section of the elbow inlet conduit and the diameter of the inlet section of the straight outlet conduit, ζ is the kinematic viscosity of water.

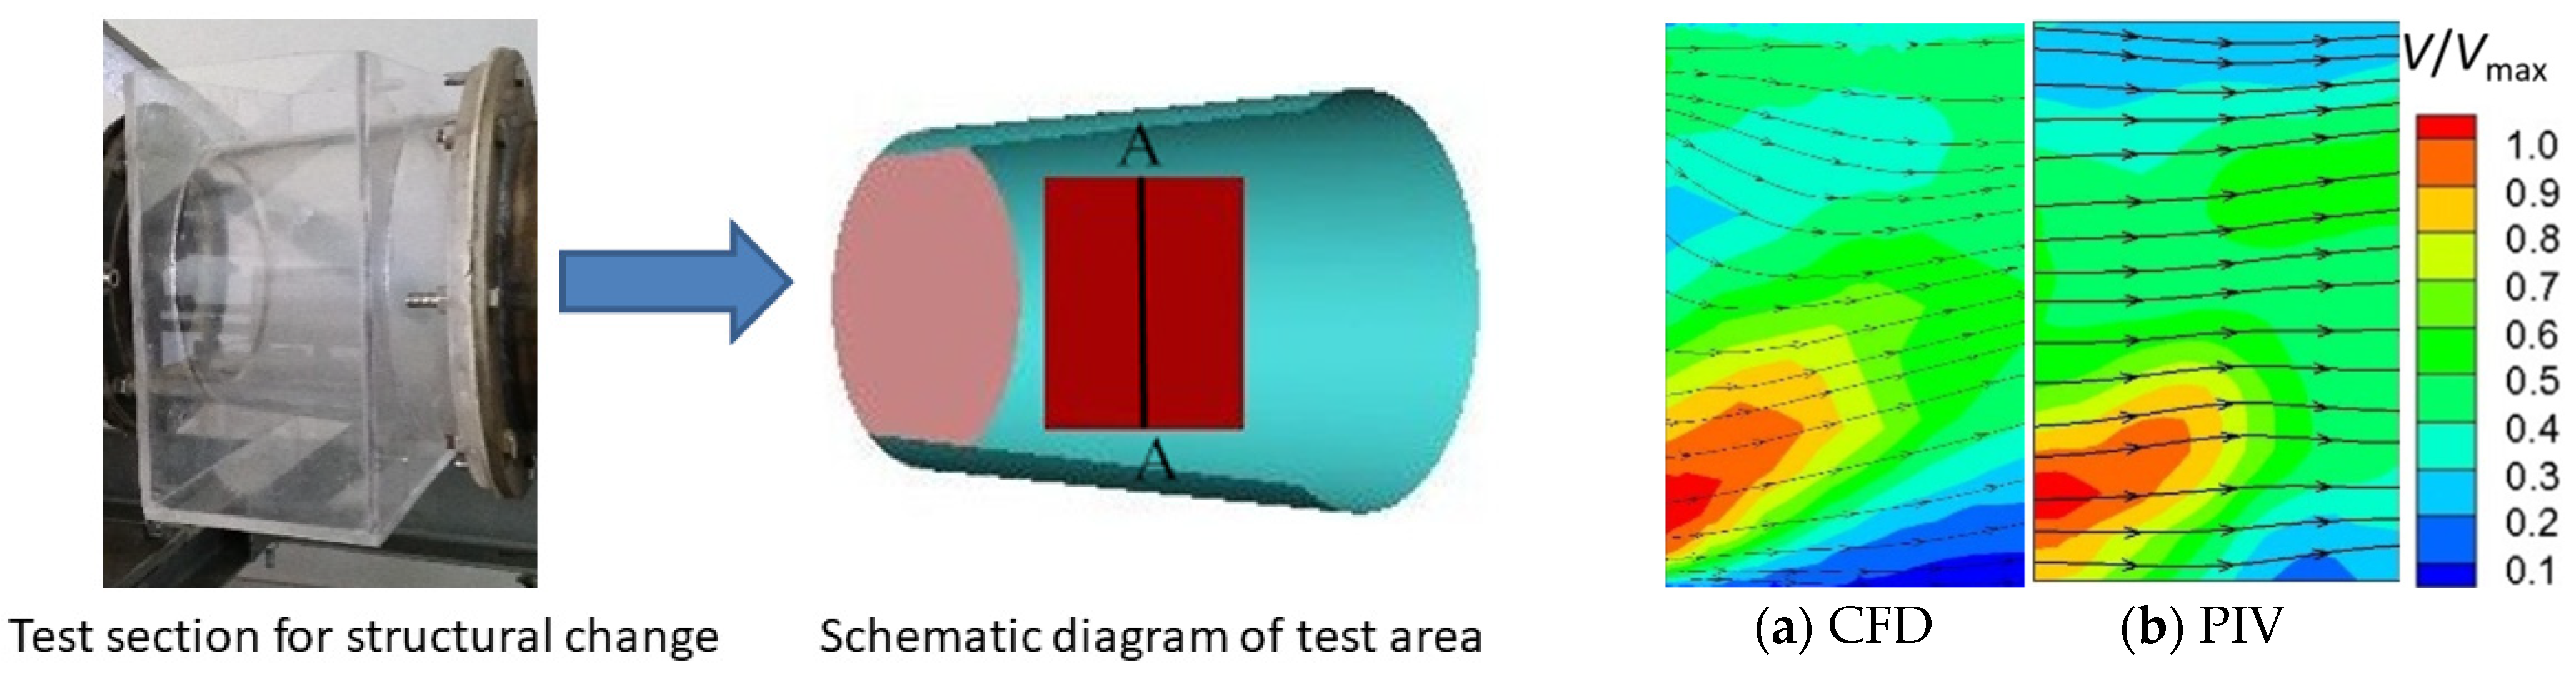
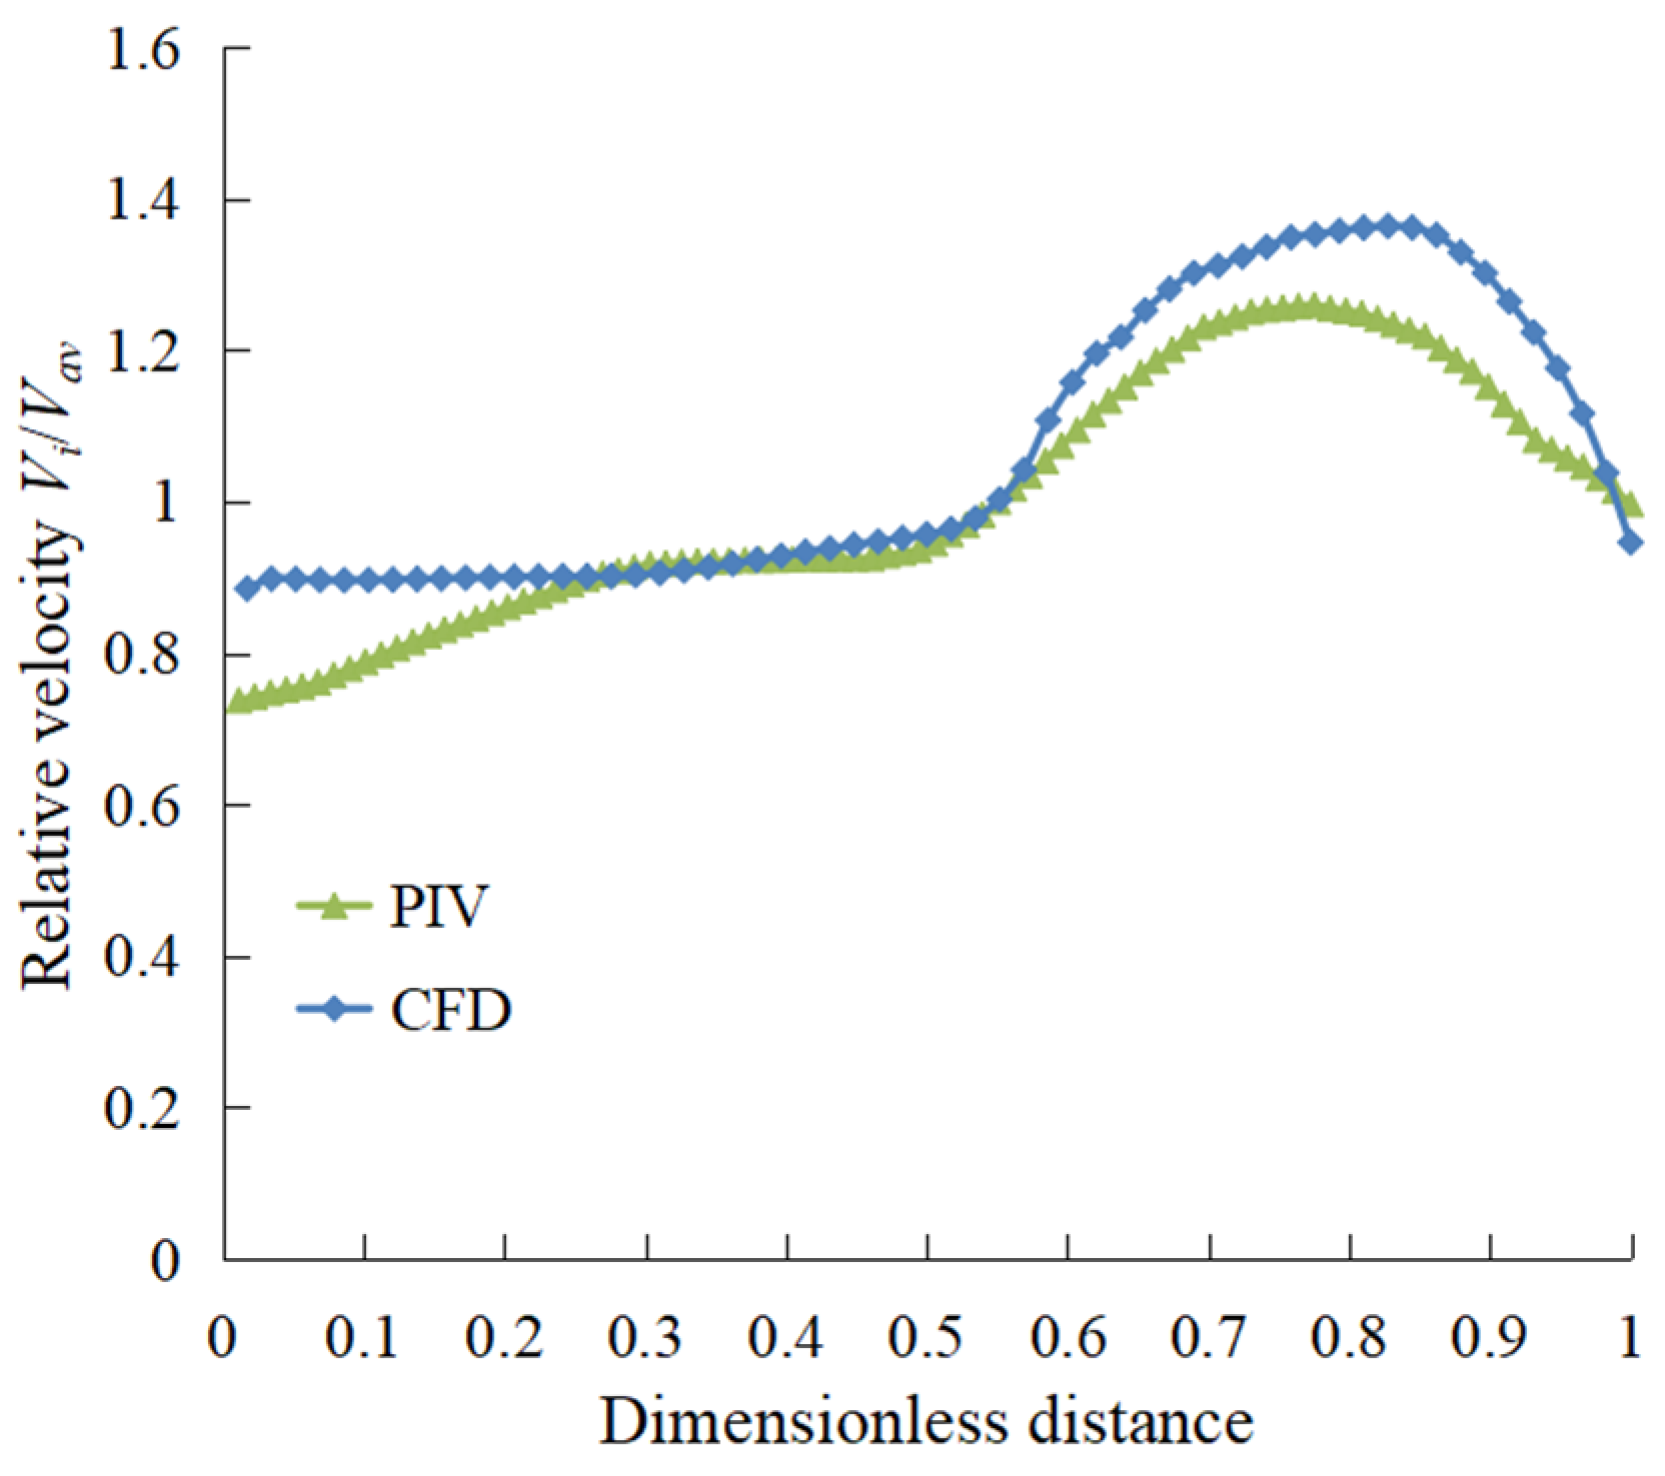
4.1.1. Comparison between Numerical Calculation Results and PIV Test

The external characteristic data of the vertical axial-flow pump device at 2200 r/min under different flow rate conditions were obtained through steady-state calculation. At the same time, the energy performance test of the pump device was completed in Jiangsu Key Laboratory of Hydraulic and Power Engineering. In order to better compare and analyze the numerical prediction and model test results, the flow rate Qbep at the optimal operating point was taken as the benchmark, and the ratio of the flow rate Q at the non-optimal operating point to the flow rate Qbep at the optimal operating point was taken as the coefficient, i.e., Q/Qbep. As shown in Figure 7, the Q-H curve fitted by the numerical calculation results was compared with the test data, the change trend of the predicted performance curve of the pump device was basically consistent with the test curve, and the curve was in good agreement. When less than 0.6Qbep, the Q-H curve of numerical calculation was slightly higher than that of the physical model test. Near 1.0Qbep, the Q-H curve of numerical calculation basically coincided with the Q-H curve of the physical model test. When it was greater than 0.5Qbep, the Q-η curve of numerical calculation was higher than that of the physical model test. At 1.0Qbep, the absolute error of efficiency between numerical calculation and the model test was 2.6%, and the absolute error of each point was less than 3%. The numerical calculation was in good agreement with the model test. In this paper, the flow corresponding to 0.6 times the optimal working condition at each speed (0.6Qbep) was used to analyze the influence of rotation speed on the internal flow field and hydraulic noise in the conduit.
At 2200 r/min, PIV test results under three characteristic working conditions were obtained and compared with CFD calculation results, as shown in Figure 8a,b. The overall trend of the streamline diagram obtained by CFD numerical calculation under different working conditions was the same as that of the test results obtained by the characteristic section, but there was a slight difference in the velocity distribution cloud diagram, which verifies that the reliability of CFD numerical calculation is high.
The structure change test section and test area of the straight outlet conduit are shown in Figure 8, a measuring line A-A of the section of the test area was intercepted, the relative velocity was compared, and the comparison results are shown in Figure 9. The relative velocity in Figure 9 is the ratio of the velocity of each point on the measuring line to the average velocity vi/vav, where vav = Q/S, Q is the flow in the test area, and S is the area of the test area, and the dimensionless distance l* = (lli)/l, where, l is the total length of the survey line, and li is the distance between each point and the bottom of the survey line. It can be seen from Figure 8 that the CFD calculation results under the three characteristic working conditions were the same as the corresponding velocity distribution trend obtained from the PIV test, and the velocity distribution at the top of the test area was quite different. It can be seen from the overall velocity distribution that the CFD numerical calculation was basically the same as the PIV test results, and the PIV test analysis verifies the effectiveness and reliability of the CFD numerical calculation results.

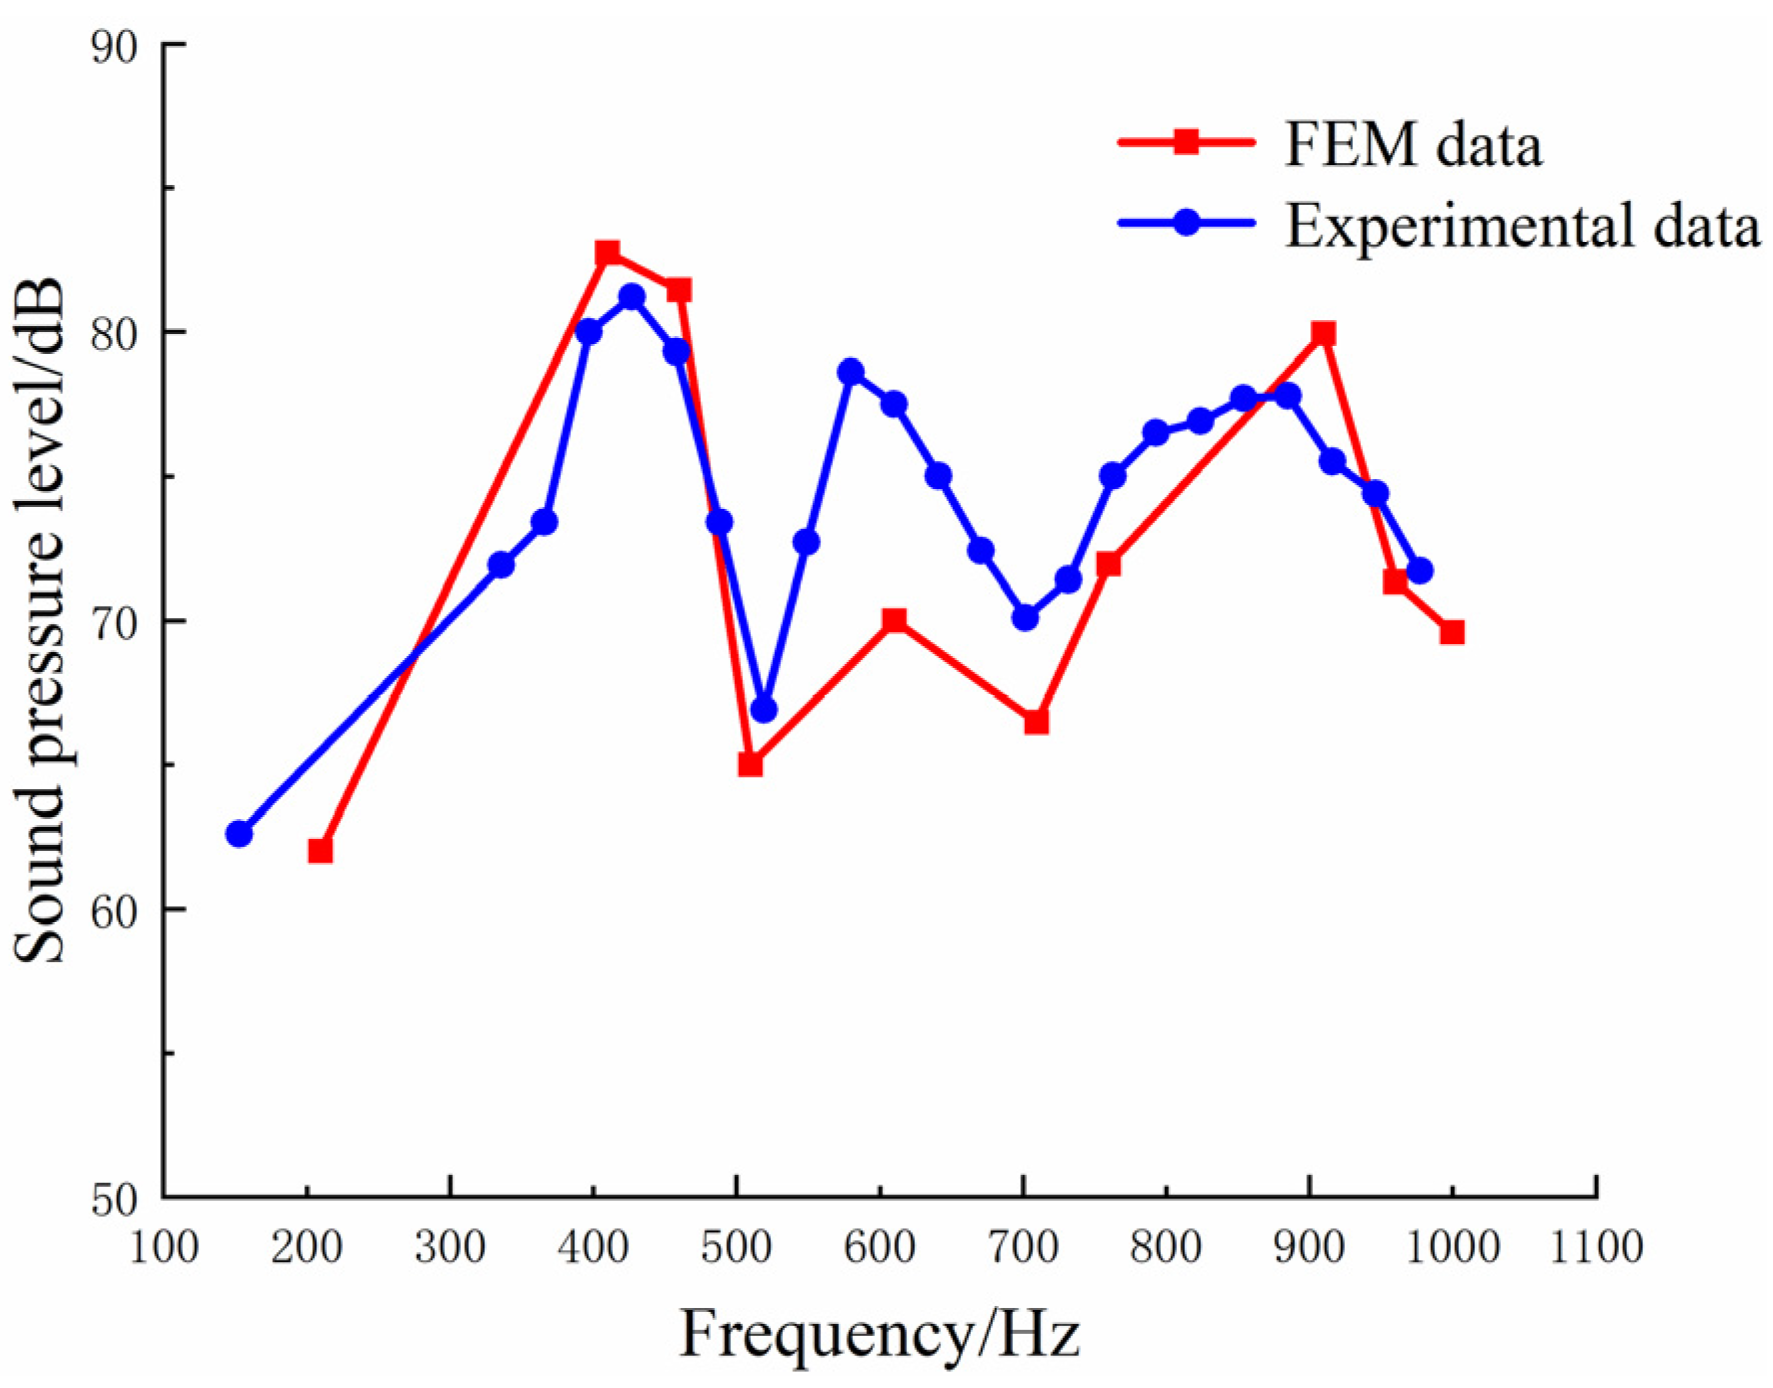
4.1.2. Comparison between Sound Field Simulation Results and Tests

To reduce the interference of external structural vibration on the noise test system, the noise data of the straight outlet conduit of the vertical axial-flow pump device were collected at the speed of 2200 r/min. The sound pressure level at the inlet point of the straight outlet conduit calculated by FEM was compared with the test data, and the results are shown in Figure 10. The overall rising and falling trend of the sound pressure level at the inlet of the straight outlet conduit calculated by FEM was basically consistent with the data obtained from the test. The maximum difference between the sound pressure level calculated by FEM and the sound pressure level obtained from the test data was 8.2 dB, and the overall trend of the sound pressure level was basically consistent with the test data, therefore, FEM can provide a more accurate sound prediction for the inlet and outlet conduit of the pump device in this paper.

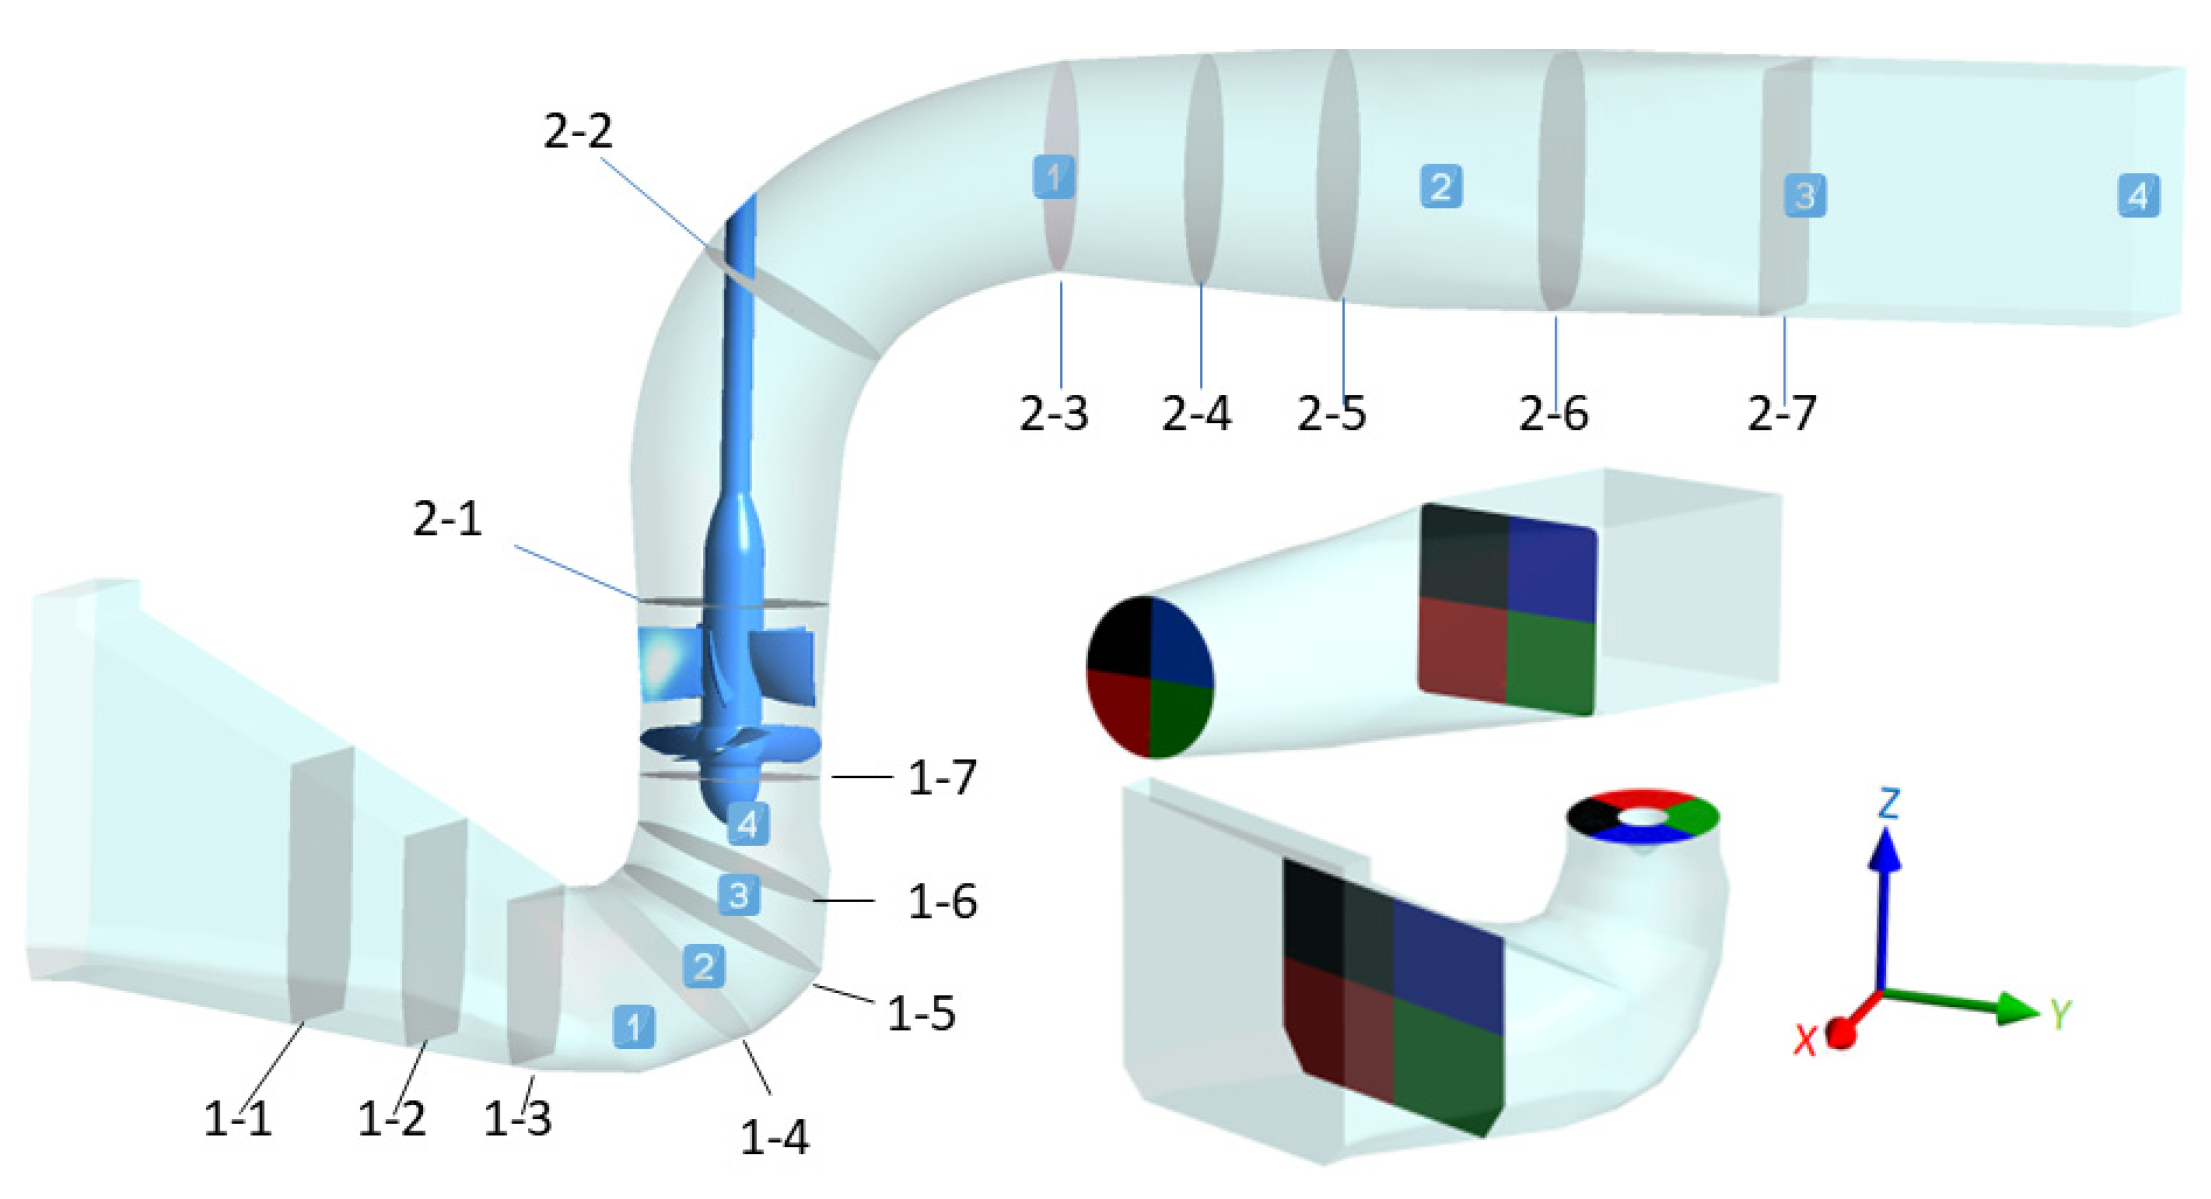
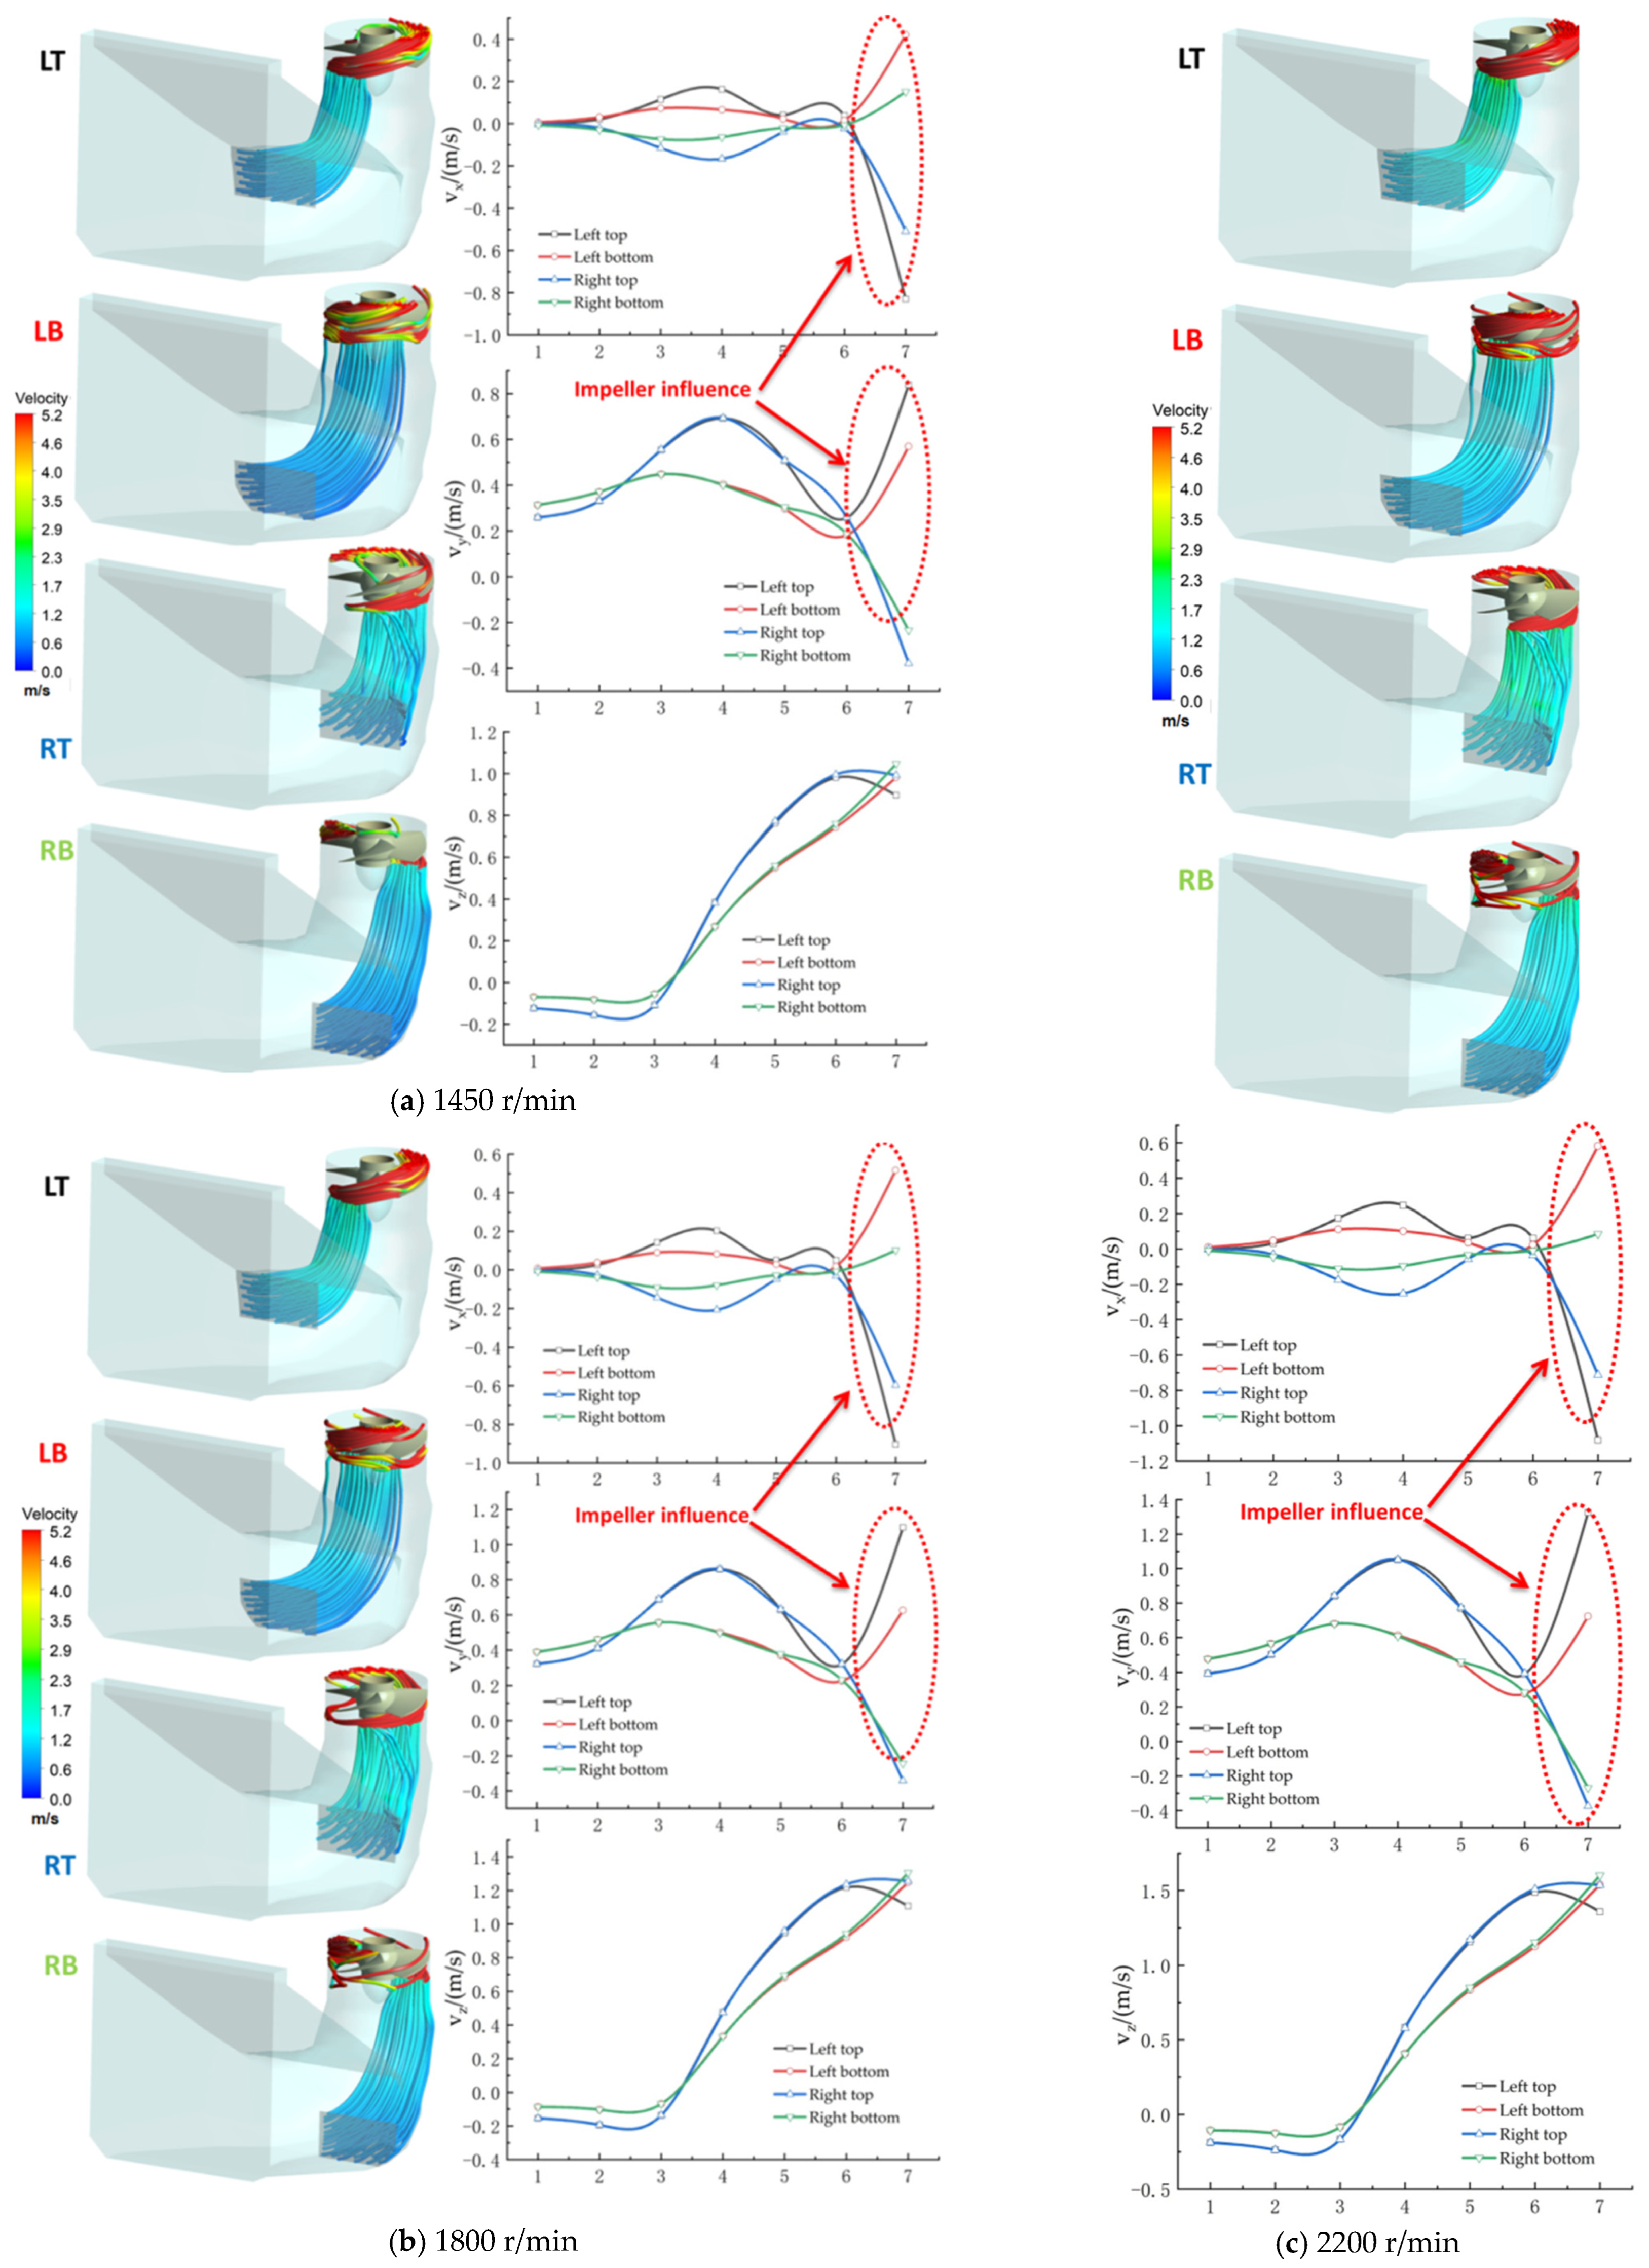
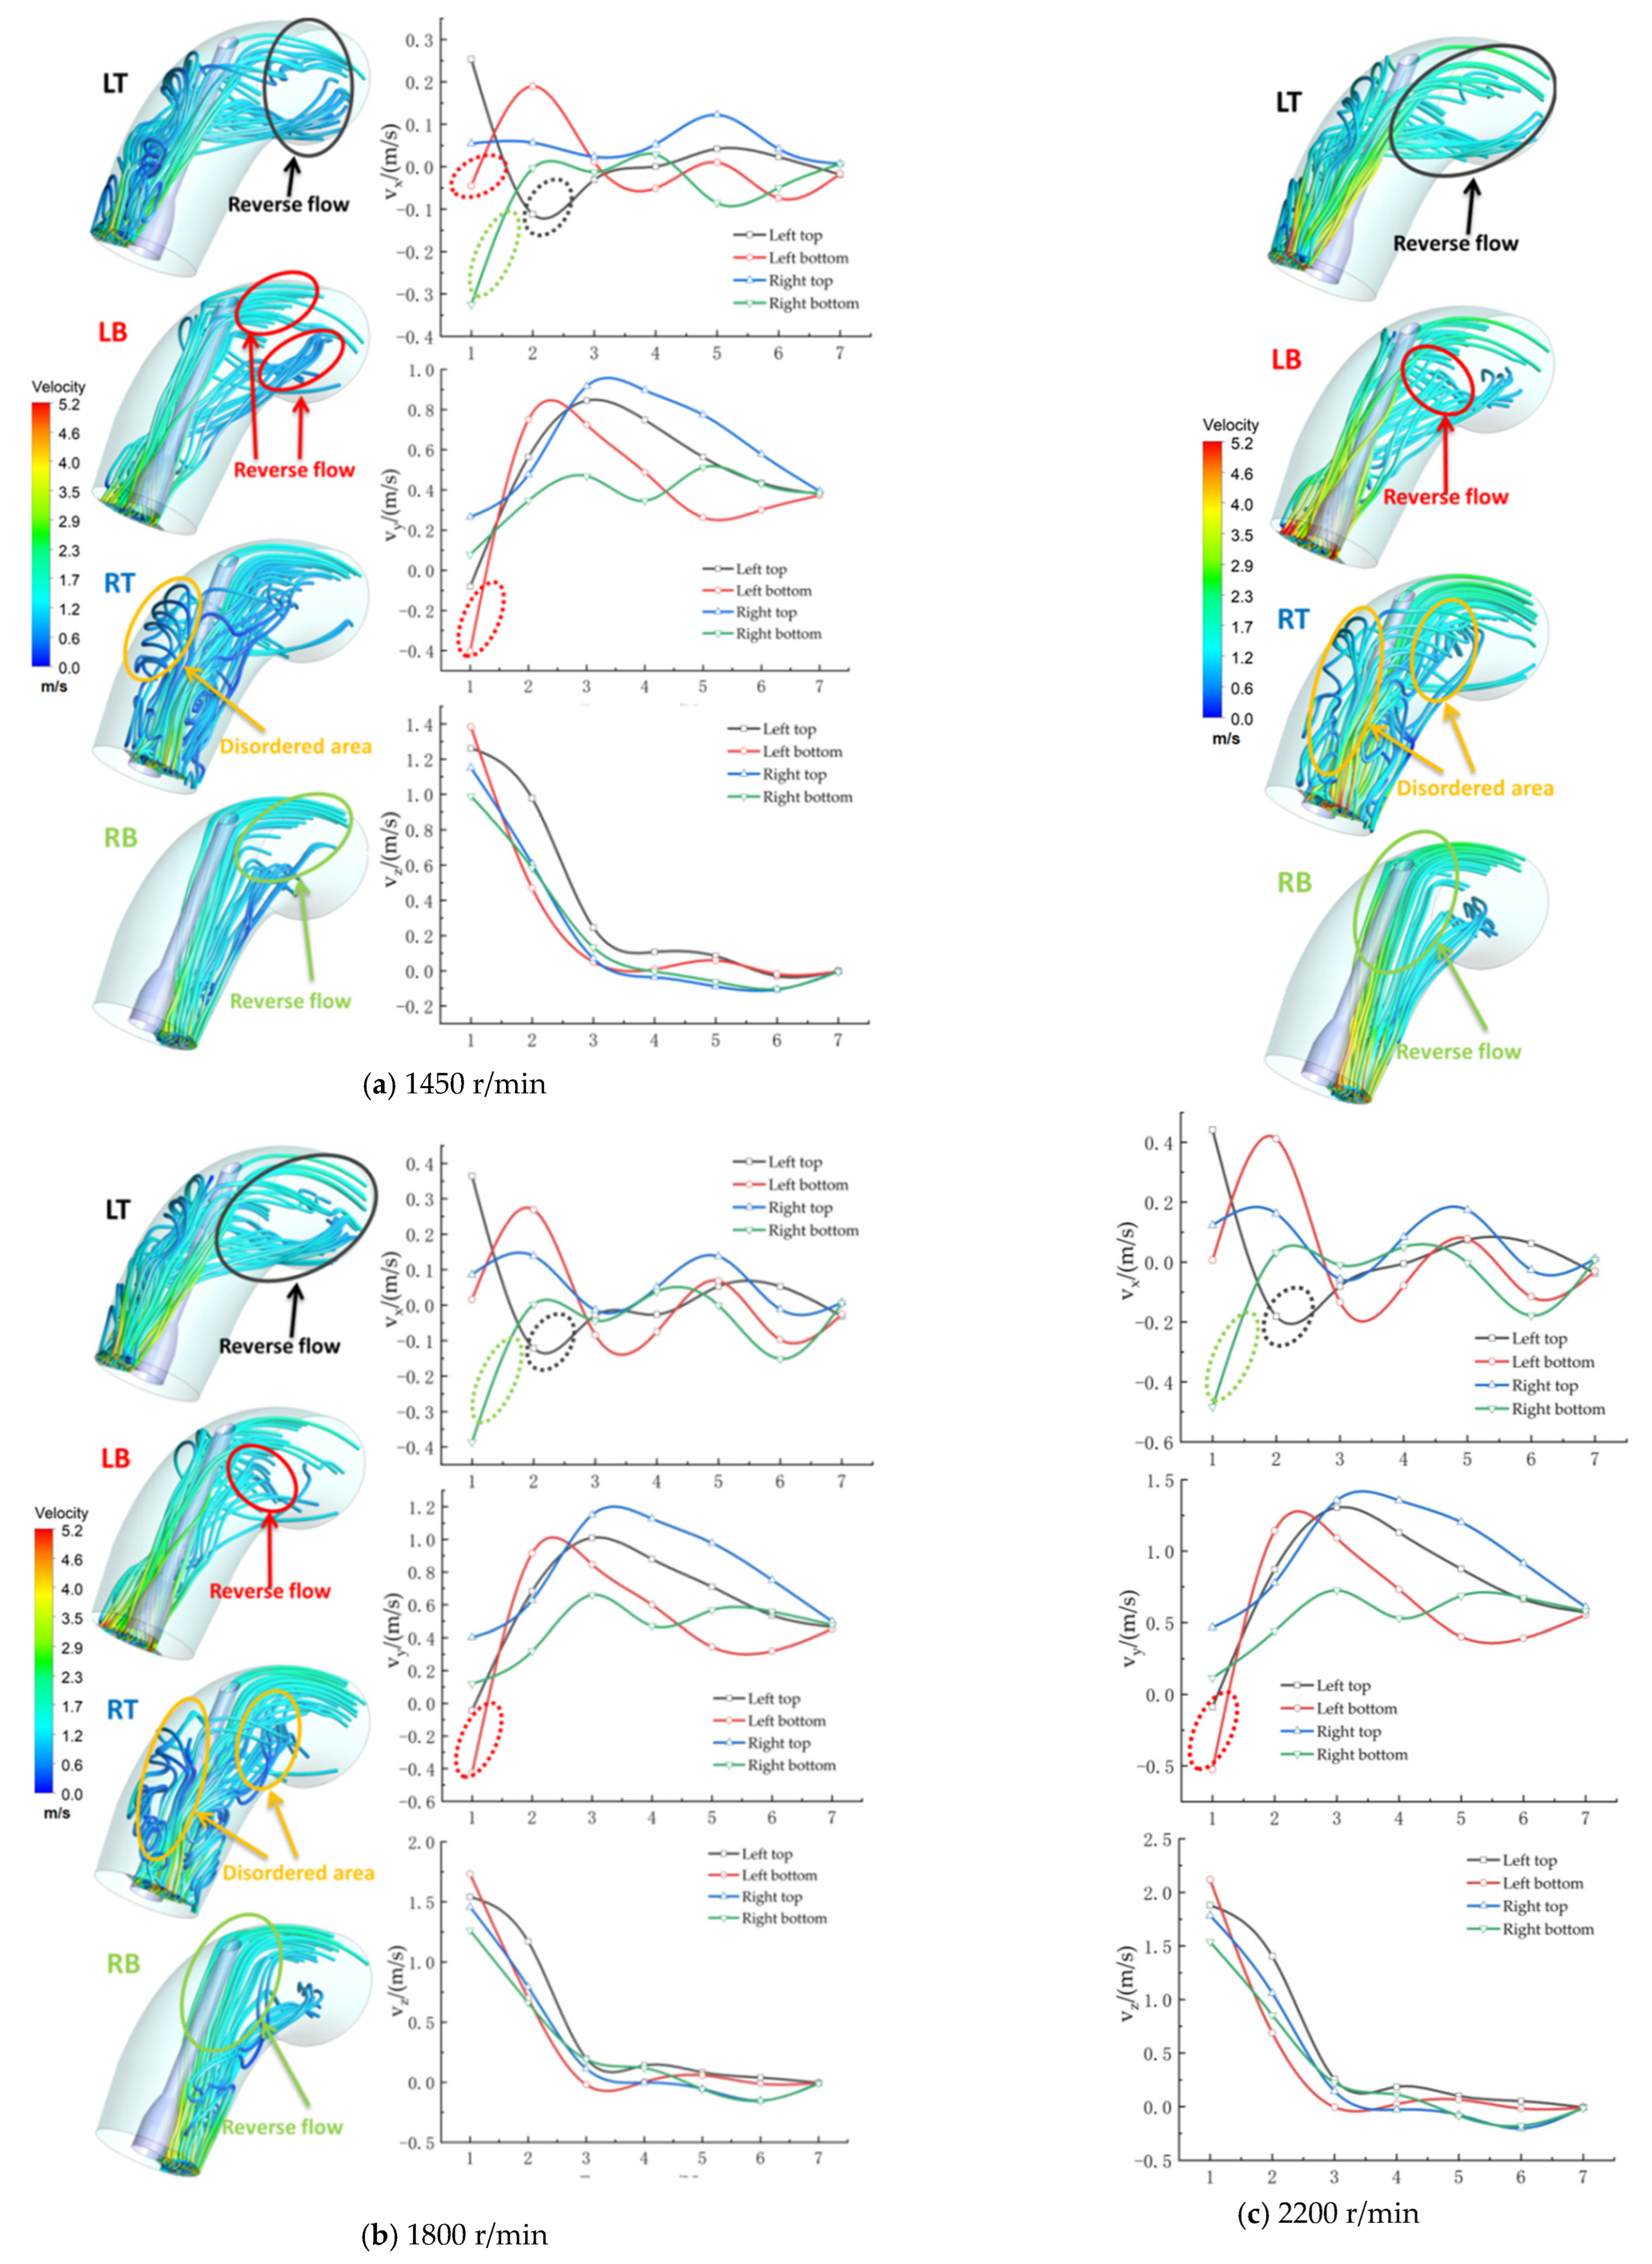
4.2. Analysis of Internal Flow Characteristics in Conduit

We divided the elbow inlet conduit along the flow direction, corresponding to 7 sections from 1-1 to 1-7 in Figure 11, the straight outlet conduit was divided along the flow direction from the elbow section, corresponding to 7 sections from 2-1 to 2-7 in Figure 11. At the same time, in order to facilitate the comparison of partial velocity changes in the flow conduit, each section was divided into four flow areas: top left, bottom left, top right, and bottom right according to the liquid flow direction in the pump device. To study the sound field characteristics in the conduit, refer to the research ideas in references [12,18]. Four monitoring points were arranged in the elbow inlet conduit and the straight outlet conduit respectively to collect the noise signals, and the positions of each monitoring point are shown in Figure 11, the positive direction of XYZ coordinate axis is shown in the coordinate system in Figure 11.
Considering that large velocity gradient is a necessary condition for the generation of vortex structure [22], it is necessary to analyze the velocity distribution in the conduit at different rotation speeds. As it is easy to ignore some details in the flow process when making an overall analysis of the internal flow velocity in the conduit, an idea of region division is proposed, the entire flow conduit was subdivided to explore the flow velocity distribution in the conduit. Along the internal flow direction of the pump device, different characteristic sections of the conduit were divided into four regions, as shown in Figure 11. According to the analysis of the velocity fluctuation along the different areas of each section in the inlet and outlet conduit of the pump device, the velocity component fluctuation curves along the three directions of the coordinate axis were obtained. Figure 12 is the velocity component fluctuation curve in three directions in the same flow area of each section of elbow inlet conduit at each speed, and Figure 13 is the velocity component fluctuation curve in three directions in the same flow area of each section of straight outlet conduit at each speed. When the velocity direction of the water flow along the three directions was inconsistent, it was disordered, when the velocity direction of the water flow along the three directions was opposite, it was reverse flow. Because the flow pattern in the straight outlet conduit is developed from the elbow pipe section, only the streamline changes in the elbow pipe were drawn. It can be seen from Figure 12 and Figure 13 that at different rotation speeds, the changes of velocity component fluctuation in the same area of each section in the inlet and outlet conduit had high similarity, with the increase of rotation speed, the work of the impeller increased significantly, so that the fluid velocity in the inlet and outlet conduit increased significantly. In Figure 12 and Figure 13, LT represents top left, LB represents bottom left, RT represents top right, and RB represents bottom right.
Based on the coordinates in Figure 11, the X-axis direction is defined as the horizontal positive direction, the Y-axis direction as the longitudinal positive direction, and the Z-axis direction as the axial positive direction. At different rotation speeds, the distribution of flow lines in the elbow inlet conduit in the four areas was relatively smooth, and there was no obvious unstable flow. At the same time, the increase and decrease of flow velocities in different directions in the four areas were relatively consistent, so the flow pattern in the elbow inlet conduit is good. With the increase of rotation speed, the water flow in the elbow inlet conduit increased in different directions, but the increase of rotation speed did not affect the flow pattern. Under the action of impeller rotation, the water flow in the LT region bent upward along the side wall of the elbow section of the elbow inlet conduit. It can be seen from Figure 13 that the increase and decrease in the transverse velocity of the water flow in the four areas of the straight outlet conduit were not consistent, the change range of the transverse velocity of the water flow in the left half region exceeded that in the right half region. When the rotation speed increased from 1450 r/min to 2200 r/min, the transverse velocity of the water flow in the LT region of the straight outlet conduit increased from 0.267 m/s to −0.146 m/s, 0.379 m/s to −0.156 m/s, and 0.442 m/s to −0.22 m/s respectively. The horizontal velocity of the water flow in the LB region rose from −0.40 m/s to 0.86 m/s, −0.42 m/s to 1.08 m/s, and −0.62 m/s to 1.31 m/s, respectively, indicating that the inconsistent growth of the horizontal velocity of the water flow in the left half of the straight outlet conduit is an important cause of the flow pattern disorder, and the increase of the rotation speed will aggravate the flow pattern disorder.

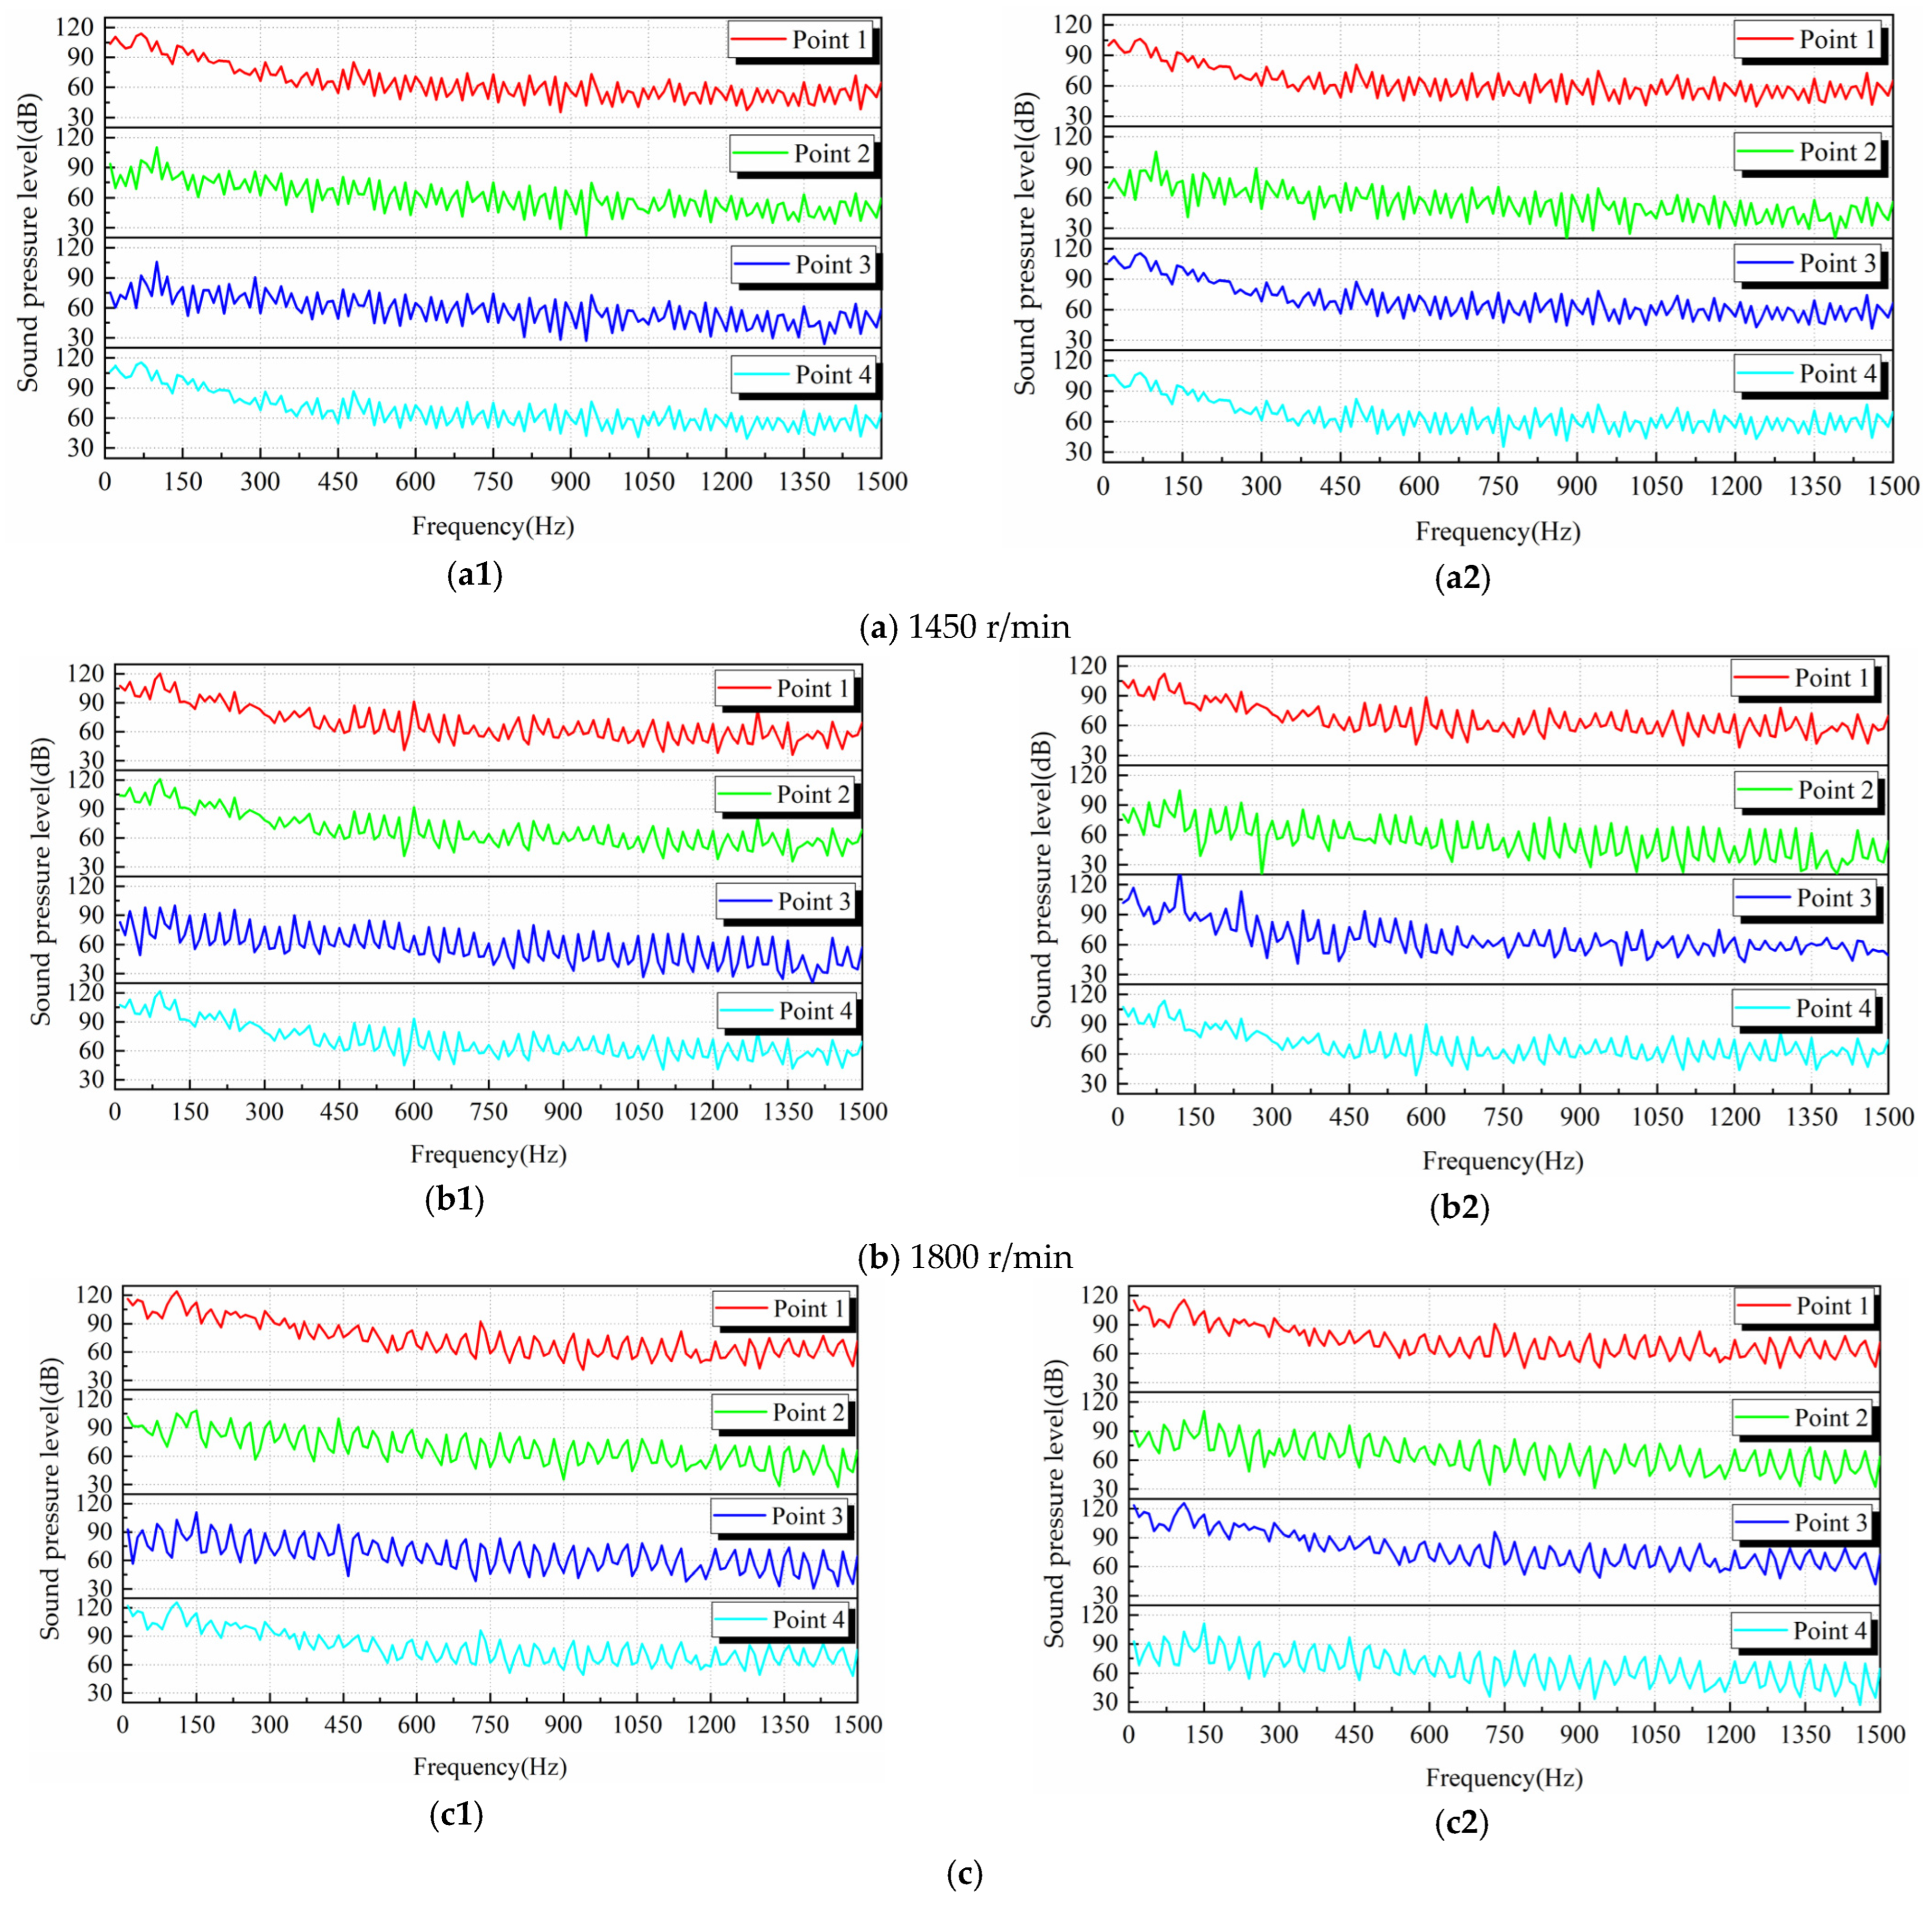
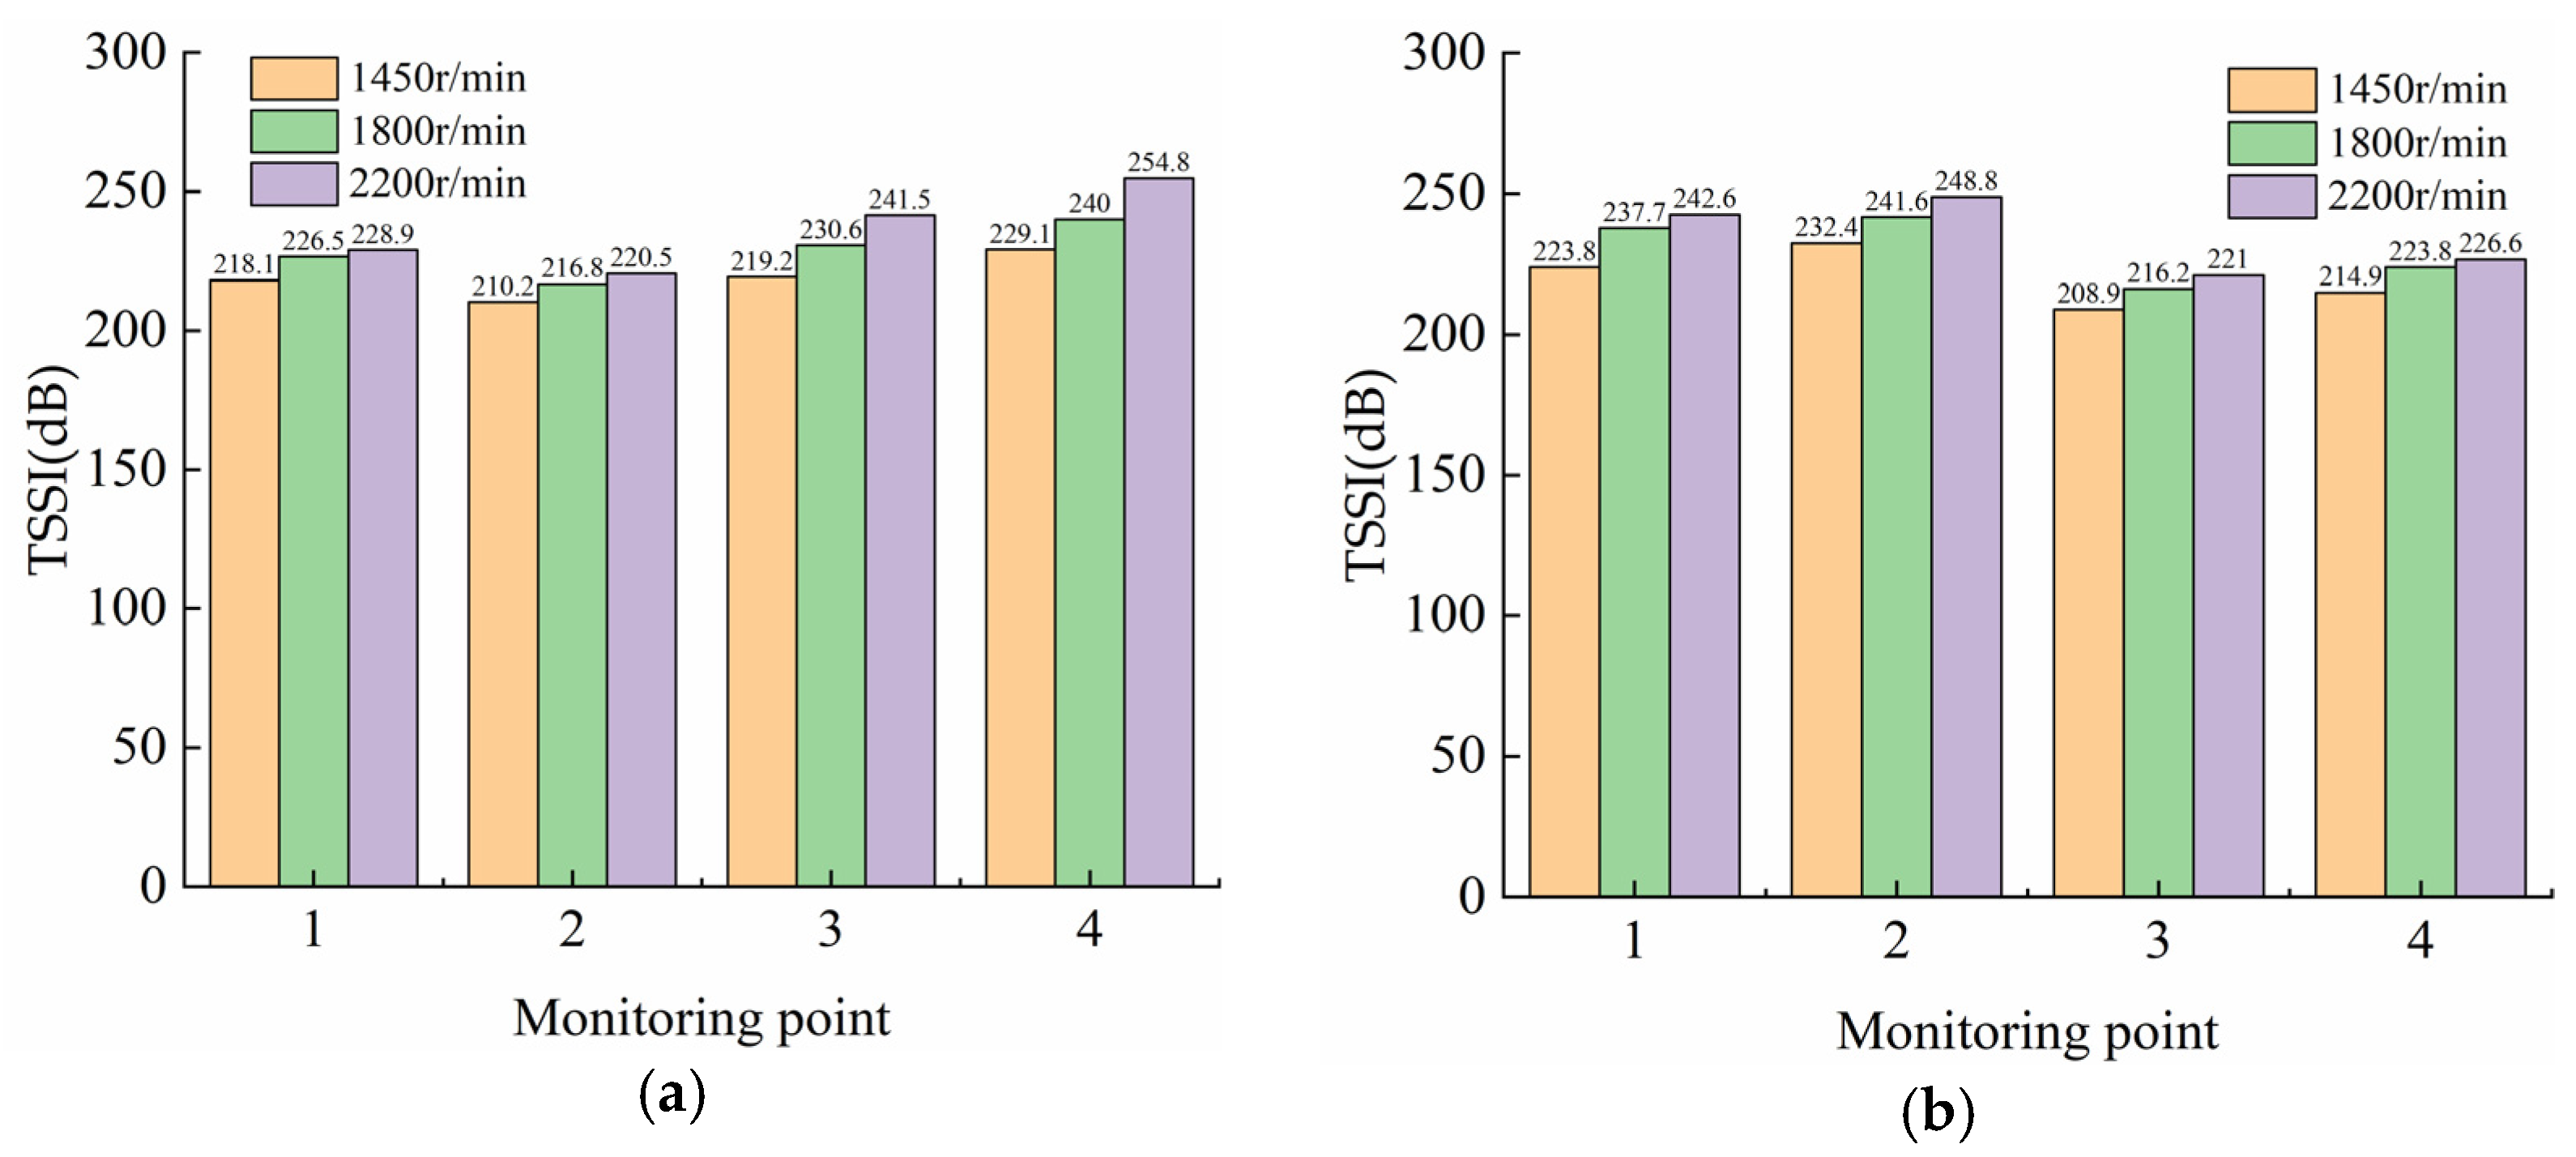
4.3. Hydraulic Noise Analysis of Conduit

The location distribution of acoustic monitoring points in the inlet and outlet conduit is shown in Figure 11, each acoustic monitoring point is located at the center line of the basin. Through the combination of Computational Fluid Dynamics (CFD) and Computational Acoustics (CA), the frequency response curves of hydraulic noise sound pressure level of the inlet and outlet conduits of the vertical axial-flow pump at different rotation speeds under the 0.6Qbep working condition were obtained, as shown in Figure 14. It can be seen from Figure 14 that the hydraulic noise in the inlet and outlet conduits of the vertical axial-flow pump were mainly composed of broadband noise and discrete noise, and the peak value of the hydraulic noise sound pressure level appeared at the blade frequency and its frequency doubling, showing strong dispersion, this indirectly shows that the dynamic and static interference between the impeller and the guide vane is the main reason for inducing the internal noise in the inlet and outlet conduits of the vertical axial-flow pump. At the same rotation speed, the sound pressure level in the straight outlet conduit is generally greater than that in the elbow inlet conduit. With the monitoring point close to the impeller area, the sound pressure level from monitoring point 1 to monitoring point 4 in the elbow inlet conduit gradually increased, and the sound pressure level from monitoring point 1 to monitoring point 4 in the straight outlet conduit generally decreased. This result is consistent with the previous research conclusions [9,10], but at different rotation speeds, the sound pressure level curve of monitoring point 2 showed an increasing trend compared with that of monitoring point 1. This is because the water flow in the area where monitoring point 2 is located in the straight outlet conduit has different velocities in different directions in the four regions, as shown in Figure 13. The water flow in the left half region was in the opposite direction along the transverse velocity direction, and the water flow in the right half region is in the positive direction along the transverse velocity direction, at this time, the water flow moved in a spiral shape, and then formed a vortex, showing a disordered quality. The impact and friction of the water flow on the conduit wall induce hydraulic noise, so the sound pressure level of monitoring point 2 increased.
Since the calculation of sound absorption characteristics of acoustic materials starts from the perspective of energy, the sound pressure level cannot fully describe the sound source and sound field, having certain limitations, when the sound source propagates in the conduit, it will radiate energy, so the description of the sound source from the perspective of energy will be more accurate [10]. In order to better evaluate the impact of rotation speed on the sound field in the conduit of the vertical axial-low pump device under low flow rate conditions, the Sound Source Intensity (SSI) and Total Sound Source Intensity (TSSI) were introduced to characterize the frequency domain information of the internal sound field. Through the calculation of the sound source intensity, the distribution characteristics and change rules of the internal sound field can be accurately reflected [10]. Based on the collected time domain sound source, the following formula was used to calculate the Sound Source Intensity (SSI) and Total Sound Source Intensity (TSSI) of each monitoring point at different rotation speeds:
SSI = 20 lg S e f S r e f ,
TSSI = 10 lg l n m 10 S S I l / 10 ,
where, S e f represents the time domain sound source value, and S r e f is the reference sound source, in this paper, 10−6 kg·m−1·s−2 is taken, and nm represents the number of frequencies.
Through the analysis of TSSI at different monitoring points in the inlet and outlet conduits at different rotation speeds, as shown in Figure 15, it can be seen that the TSSI in the inlet and outlet conduits of the vertical axial-flow pump at different rotation speeds did not meet the change law of the pump’s similarity law, that is, the sound field in the conduit did not meet the change law of the pump’s similarity law. In this paper, the flow condition of the axial-flow pump device was the low flow rate condition (0.6Qbep), and the velocity distribution at the outlet of the inlet conduit were affected by the impeller rotation under the low flow rate condition [25], and the outlet flow field of the elbow inlet conduit was different. The internal flow field of the outlet conduit was not similar under the influence of the impellers at different rotation speeds, there were obvious differences in the residual velocity circulation at the outlet of the guide vane of the axial-flow pump at different rotation speeds. The internal flow field of the outlet conduit presented a spiral flow pattern with different rotational strengths [26]. This paper analyzed the TSSI of different monitoring points in the inlet and outlet conduits at different rotation speeds, as shown in Figure 15, the TSSI in the inlet and outlet conduit of the vertical axial-flow pump at different rotation speed did not meet the change law of the pump’s similarity law, that is, the sound field in the conduit did not meet the change law of the pump’s similarity law. Although the sound field in the conduit is mainly affected by the rotation of the impeller, other factors also have certain effects on the hydraulic noise, the vortex of different scales will also affect the velocity field, so the velocity field of the conduit at different rotation speeds was not similar. By comparing Figure 15a,b, it can be seen that, as the main noise source, the sound source of the impeller propagated upstream and downstream along the conduit. With the increase of distance, TSSI showed a trend of attenuation, when the rotation speed increased from 1450 r/min to 2200 r/min, the TSSI attenuation from monitoring point 4 to monitoring point 1 in the elbow inlet conduit was 11.0 dB, 13.5 dB, and 25.9 dB respectively, and the TSSI attenuation from monitoring point 1 to monitoring point 4 in the straight outlet conduit was 8.9 dB, 13.9 dB, and 16.0 dB respectively, indicating that the higher the rotation speed, the faster the noise attenuation in the process of internal propagation in the inlet and outlet conduit. The impeller is the main hydraulic noise source inside the axial-flow pump device, the distance between different monitoring points and the impeller in the conduit is different, and the hydraulic noise at different monitoring points is also affected by the impeller. As shown in Figure 15, the farther the monitoring point is from the impeller, the smaller the difference between the TSSI values at different rotation speeds, and the closer the monitoring point is to the impeller, the greater the impact of the impeller. The difference between the TSSI values of the monitoring points closest to the impeller in the conduit at different rotation speeds will increase with the increase of the speed, therefore, the greater the rotation speed, the faster the noise source attenuates in the inlet and outlet conduits. The attenuation of noise in the elbow inlet conduit was greater than that in the straight outlet conduit, and there was a large number of vortex junctions in the straight outlet conduit, which induced flow noise and promoted the propagation of noise. At the same time, since the monitoring point 2 in the straight outlet conduit was located in the structural transition section, the velocity change amplitude of water flow in the structural transition section increased fast along the three directions, and the impact and friction of the water flow on the conduit wall induced the flow noise, therefore, the TSSI of the straight outlet conduit at monitoring point 2 increased significantly, and then decreased twice.

5. Conclusions

Taking the vertical axial-flow pump device as the research object, this paper analyzed the flow characteristics and hydraulic noise in the conduit at different rotation speeds under the condition of 0.6Qbep by using a combination of CFD numerical simulation and Computational Acoustics. The accuracy of the CFD numerical calculation of the internal flow field was verified by PIV technology, at the same time, the noise of the straight outlet conduit was collected by hydrophone, the accuracy of Computational Acoustics on the hydraulic noise of the inlet and outlet conduits was verified, and, finally, the following conclusions were drawn:
(1) At different rotation speeds, the flow pattern in the elbow inlet conduit was relatively smooth, and there was no obvious unstable flow. Affected by the residual circulation, the horizontal velocity of water flow in the four areas of the straight outlet conduit increased or decreased inconsistently, the higher the rotation speed, the more disordered the water flow in the left half of the elbow, which intensifies the unstable flow in the straight outlet conduit.
(2) The rotation of the impeller is the main reason for inducing the internal hydrodynamic noise of the vertical axial-flow pump device, the higher the rotation speed, the greater the sound pressure level in the conduit. When the sound source of the impeller propagated upstream and downstream along the conduit, the TSSI gradually decayed with the increase of distance, when the rotation speed was higher, the TSSI decayed faster in the conduit.
(3) The flow state in the straight outlet conduit was poor. With the increase of the rotation speed, the residual circulation of the water flow increased, the hydraulic noise induced by the impact and friction on the conduit wall increased, and the attenuation of the noise source in the straight outlet conduit was delayed, therefore, the attenuation of the noise source in the straight outlet conduit is slower than that in the elbow inlet conduit. When the rotation speed was increased from 1450 r/min to 2200 r/min, the TSSI in the straight outlet conduit was attenuated by 8.9 dB, 13.9 dB, and 16.0 dB respectively, and the TSSI in the elbow inlet conduit was attenuated by 11.0 dB, 13.5 dB, and 25.9 dB respectively.

Author Contributions

Methodology, F.Y. Experiment, Y.Y. and H.G. Analyzed the data, D.J., Y.L. and F.Y. Writing and editing, D.J. and H.J. Funding acquisition and validation, F.Y. All authors have read and agreed to the published version of the manuscript.

Funding

This research was funded by the National Natural Science Foundation of China (Grant No. 51609210, 51779214), Major Projects of the Natural Science Foundation of the Jiangsu Higher Education Institutions of China (Grant No.20KJA570001), the Open Project of Jiangxi Research Center on Hydraulic Strucutres (Grant No.2021SKSG06), the Technology Project of the Water Resources Department of the Jiangsu Province (Grant No.2020029), the Scientific Research Program of Jiangsu Hydraulic Research Institute (Grant No.2021), the Priority Academic Program Development of the Jiangsu Higher Education Institutions (PAPD) and Postgraduate Research & Practice Innovation Program of Jiangsu Province (Grant No.KYCX21_3226).

Institutional Review Board Statement

Not applicable.

Informed Consent Statement

Not applicable.

Data Availability Statement

Not applicable.

Conflicts of Interest

No potential conflict of interest was reported by the authors.

Nomenclature

QbepFlow rate of best efficiency point (m3/s)
CFDComputational Fluid Dynamics
CAComputational Acoustics
FEMAcoustic Finite Element Method
BEMAcoustic Boundary Element Method
TSSITotal Sound Source Intensity
SSISound Source Intensity
dBDecibel
TRotation period
DDiameter of impeller (m)
atmStandard atmospheric pressure
nRotational speed (r/min)
PIVParticle Image Velocimetry
y+Dimensionless wall distance
ρDensity of water (kg/m3)
tTime (s)
uVelocity (m/s)
xCoordinate (m)
pPressure (Pa)
μDynamic viscosity (Pa·s)
i, jCoordinate axis directions
c0Sound velocity
EQSystem uncertainty of flow measurement
EHSystem uncertainty of static head measurement
EMSystem uncertainty of torque measurement
ENSystem uncertainty of speed measurement
SηStandard deviation of the average efficiency
E η Total uncertainty of efficiency (%)
E η , s Systematic uncertainty of the experimental system (%)
E η , r Random uncertainty of the experimental system (%)
SefEffective value of sound source in time domain
SrefReference sound source
nmNumber of frequencies

References

  1. Liu, C. Researches and Developments of Axial-flow Pump System. Trans. Chin. Soc. Agric. Mach. 2015, 46, 49–59. [Google Scholar] [CrossRef]
  2. Mao, Z.B.; Lizuka, T.; Maeda, S. Bidirectional electrohydrodynamic pump with high symmetrical performance and its application to a tube actuator. Sens. Actuators A Phys. 2021, 332, 113168. [Google Scholar] [CrossRef]
  3. Mao, Z.B.; Nagaoka, T.; Yokata, S.; Kim, J. Soft fiber-reinforced bending finger with three chambers actuated by ECF (electro-conjugate fluid) pumps. Sens. Actuators B Chem. 2020, 310, 112034. [Google Scholar] [CrossRef]
  4. Bueker, J.; Lass, A.; Werner, P.; Wurm, F.-H. Active noise cancellation applied to a centrifugal pump in a closed loop piping system. Appl. Acoust. 2021, 178, 108003. [Google Scholar] [CrossRef]
  5. Murovec, J.; Curovic, L.; Novakovic, T.; Prezelj, J. Psychoacoustic approach for cavitation detection in centrifugal pumps. Appl. Acoust. 2020, 165, 107323. [Google Scholar] [CrossRef]
  6. Orhan, N.; Ozbek, O.; Seflek, A.Y. The Effect of Nominal Diameter and Water Inlet Cross-Sectional Area on Some Pump Parameters in Vertical Shaft Deep Well Pumps. Ksu Tarim Ve Doga Derg. -Ksu J. Agric. Nat. 2020, 23, 237–246. [Google Scholar] [CrossRef]
  7. Cernetic, J. The use of noise and vibration signals for detecting cavitation in kinetic pumps. Proc. Inst. Mech. Eng. Part C J. Mech. Eng. Sci. 2009, 223, 1645–1655. [Google Scholar] [CrossRef]
  8. Orhan, N.; Seflek, A.Y.; Ozbek, O. Effects of Submergence Change in Shaft Pumps on Some Pump Parameters. Ksu Tarim Ve Doga Derg. -Ksu J. Agric. Nat. 2021, 24, 747–756. [Google Scholar] [CrossRef]
  9. Choi, J.S.; McLaughlin, D.K.; Thompson, D.E. Experiments on the unsteady flow field and noise generation in a centrifugal pump impeller. J. Sound Vib. 2003, 263, 493–514. [Google Scholar] [CrossRef]
  10. Guo, C.; Gao, M.; Wang, J.; Shi, Y.; He, S. The effect of blade outlet angle on the acoustic field distribution characteristics of a centrifugal pump based on Powell vortex sound theory. Appl. Acoust. 2019, 155, 297–308. [Google Scholar] [CrossRef]
  11. Chen, E.Y.; Ma, Z.L.; Zhao, G.P.; Li, G.P.; Yang, A.L.; Nan, G.F. Numerical investigation on vibration and noise induced by unsteady flow in an axial-flow pump. J. Mech. Sci. Technol. 2016, 30, 5397–5404. [Google Scholar] [CrossRef]
  12. Huang, X.C.; Shi, S.K.; Su, Z.W.; Rao, Z.Q.; Hua, H.X. Vibro-acoustic responses of a pump-jet under distributed unsteady hydrodynamic forces. J. Vib. Shock. 2021, 40, 89–94+113. [Google Scholar] [CrossRef]
  13. Zhang, D.S.; Zhang, N.S.; Xu, B.; Zhao, R.J.; Gao, X.F.; Li, N. Numerical simulation of the flow-induced noise in a water-jet pump based on the Lighthill acoustic analogy theory. J. Vib. Shock. 2021, 40, 278–287. [Google Scholar] [CrossRef]
  14. Zheng, Y.; Chen, Y.J.; Mao, X.L.; Wang, H.Z.; Shi, W.; Kan, K.; Zhang, Y.Q. Pressure pulsation characteristics and its impact on flow-induced noise in mixed-flow pump. Trans. Chin. Soc. Agric. Eng. 2015, 31, 67–73. [Google Scholar] [CrossRef]
  15. Choi, J.; Seol, H.; Park, I.; Lee, S. Study on noise prediction of non-cavitating underwater propeller with hull-appendages effect. J. Acoust. Soc. Korea 2019, 38, 247–255. [Google Scholar] [CrossRef]
  16. Mao, X.; Pavesi, G.; Chen, D.; Xu, H.; Mao, G. Flow induced noise characterization of pump turbine in continuous and intermittent load rejection processes. Renew. Energy 2019, 139, 1029–1039. [Google Scholar] [CrossRef]
  17. Wu, D.; Liu, Y.; Li, D.; Zhao, X.; Li, C. Effect of materials on the noise of a water hydraulic pump used in submersible. Ocean. Eng. 2017, 131, 107–113. [Google Scholar] [CrossRef]
  18. Fu, J.; Song, Z.H.; Wang, Y.S.; Jin, S.B. Numerical predicting of hydroacoustic of pumpjet propulsor. J. Ship Mech. 2016, 20, 613–619. [Google Scholar] [CrossRef]
  19. Zhao, H.R.; Wang, F.J.; Wang, C.Y.; Chen, W.H.; Yao, Z.F.; Shi, X.Y.; Li, X.Q.; Zhong, Q. Study on the characteristics of horn-like vortices in an axial flow pump impeller under off-design conditions. Eng. Appl. Comput. Fluid Mech. 2021, 15, 1613–1628. [Google Scholar] [CrossRef]
  20. Si, Q.R.; Shen, C.H.; He, X.K.; Li, H.; Huang, K.L.; Yuan, J.P. Numerical and Experimental Study on the Flow-Induced Noise Characteristics of High-Speed Centrifugal Pumps. Appl. Sci. 2020, 10, 3105. [Google Scholar] [CrossRef]
  21. Si, Q.R.; Sheng, G.C.; Heng, Y.G.; Cui, Q.L.; Huang, K.L. Numerical simulation for flow-induced noise in a centrifugal pump based on Lighthill acoustic analogy theory. J. Vib. Shock. 2018, 37, 84–90+97. [Google Scholar] [CrossRef]
  22. Kan, K.; Zheng, Y.; Chen, Y.J.; Xie, Z.S.; Yang, G.; Yang, C.X. Numerical study on the internal flow characteristics of an axial-flow pump under stall conditions. J. Mech. Sci. Technol. 2018, 32, 4683–4695. [Google Scholar] [CrossRef]
  23. Yang, F.; Gao, H.; Liu, C.; Zhao, H.R.; Tang, F.P. Experiment Analysis on Flow-induced Pulsation and Noise in Outlet Conduit of Vertical Axial-flow Pumping System. Trans. Chin. Soc. Agric. Mach. 2018, 49, 144–149. [Google Scholar] [CrossRef]
  24. Yang, F.; Jiang, D.J.; Wang, T.L.; Chang, P.C.; Liu, C.; Liu, D.S. Investigation into the Influence of Division Pier on the Internal Flow and Pulsation in the Outlet Conduit of an Axial-Flow Pump. Appl. Sci. 2021, 11, 6774. [Google Scholar] [CrossRef]
  25. Yang, F.; Zhao, H.R.; Liu, C.; He, J.Y.; Tang, F.P. Experiment and Analysis on Outlet Flow Pattern and Pressure Fluctuation in Inlet Conduit of Vertical Axial-flow Pumping System. Trans. Chin. Soc. Agric. Mach. 2017, 48, 141–146. [Google Scholar] [CrossRef]
  26. Yang, F.; Liu, C.; Tang, F.P.; Zhou, J.R. Analysis of Hydraulic Performance of Outlet Passage Based on Simulation of Steady Flow in Whole Passage of Axial-flow Pumping System. Trans. Chin. Soc. Agric. Mach. 2017, 48, 83–89. [Google Scholar] [CrossRef]
  27. Yang, F.; Li, Z.B.; Fu, J.G.; Lv, Y.T.; Ji, Q.W.; Jian, H.F. Numerical and Experimental Analysis of Transient Flow Field and Pressure Pulsations of an Axial-Flow Pump Considering the Pump–Pipeline Interaction. J. Mar. Sci. Eng. 2022, 2, 258. [Google Scholar] [CrossRef]
  28. Zhang, J.F.; Jia, J.; Hu, R.X.; Wang, Y.; Cao, P.Y. Flow Noise of Pipeline Pump and Bionic Acoustic Optimization. Trans. Chin. Soc. Agric. Mach. 2018, 49, 138–145. [Google Scholar] [CrossRef]
  29. Tan, M.G.; Lu, Y.D.; Wu, Z.J.; Wu, X.F.; Liu, H.L. Effects of blade number on flow induced vibration and noise in centrifugal pump. Trans. Chin. Soc. Agric. Eng. 2019, 35, 73–79+320. [Google Scholar] [CrossRef]
  30. Kan, K.; Yang, Z.X.; Lyu, P.; Zheng, Y.; Shen, L. Numerical study of turbulent flow past a rotating axial-flow pump based on a level-set immersed boundary method. Renew. Energy 2021, 168, 960–971. [Google Scholar] [CrossRef]
  31. Dong, L.; Dai, C.; Lin, H.-B.; Chen, Y.-P. Noise comparison of centrifugal pump operating in pump and turbine mode. J. Cent. South Univ. 2018, 25, 2733–2753. [Google Scholar] [CrossRef]
  32. Predin, A.; Kastrevc, M.; Bilus, I. Radial pump operating noise and casing vibration analyses. Strojarstvo 2000, 42, 137–147. [Google Scholar]
  33. Liu, X.; Liu, J.; Jia, L.; He, J.; Zhang, J. Performance analysis of a centrifugal pump based on noise. Sci. Technol. Built Environ. 2021, 27, 1256–1268. [Google Scholar] [CrossRef]
  34. Zi, D.; Wang, F.J.; Tao, R.; Hou, Y.K. Research for impacts of boundary layer grid scale on flow field simulation results in pumping station. J. Hydraul. 2016, 47, 139–149. [Google Scholar] [CrossRef]
  35. Fiebig, W. Influence of the Inter Teeth Volumes on the Noise Generation in External Gear Pumps. Arch. Acoust. 2014, 39, 261–266. [Google Scholar] [CrossRef]
  36. Lang, T.; Shi, W.D.; Chen, K.; Li, W.; Ji, L. Flow field in forward-extended double blades centrifugal pump at different specific speeds. Trans. Chin. Soc. Agric. Mach. 2015, 46, 89–95. [Google Scholar] [CrossRef]
Figure 1. Analysis flow chart.
Machines 10 00691 g001
Figure 2. Three dimensional model of the vertical axial-flow pump device.
Machines 10 00691 g002
Figure 3. Geometric dimension of the flow conduit. (a) Geometric dimension drawing of the elbow inlet conduit. (b) Geometric dimension drawing of the straight outlet conduit.
Machines 10 00691 g003
Figure 4. Grid diagram of flow passage components of the vertical axial-flow pump device.
Machines 10 00691 g004
Figure 5. Outline dimension drawing of the hydrophone.
Machines 10 00691 g005
Figure 6. Vertical axial-flow pump test device.
Machines 10 00691 g006
Figure 7. Comparison between numerical simulation and model test.
Machines 10 00691 g007
Figure 8. Comparison of velocity nephogram between CFD and 2D2C-PIV test.
Machines 10 00691 g008
Figure 9. Comparison between PIV test value and CFD calculated value(0.6Qbep).
Machines 10 00691 g009
Figure 10. Comparison of sound pressure level test and FEM results (2200 r/min).
Machines 10 00691 g010
Figure 11. Schematic diagram of the cross section of the inlet and outlet conduits and the layout of monitoring points.
Machines 10 00691 g011
Figure 12. Fluctuation of velocity component distribution along the elbow inlet conduit.
Machines 10 00691 g012
Figure 13. Fluctuation of velocity component distribution along straight outlet conduit.
Machines 10 00691 g013
Figure 14. Frequency response curve of sound-pressure level in the inlet and outlet conduits at different rotation speeds. (a) 1450 r/min. (b) 1800 r/min. (c) 2200 r/min. (a1) Sound pressure level of the inlet conduit. (a2) Sound pressure level of outlet conduit. (b1) Sound pressure level of the inlet conduit. (b2) Sound pressure level of outlet conduit. (c1) Sound pressure level of the inlet conduit. (c2) Sound pressure level of outlet conduit.
Machines 10 00691 g014
Figure 15. Frequency domain response characteristic curve of TSSI of the inlet and outlet conduits at different rotation speeds. (a) TSSI of the inlet conduit. (b) TSSI of the outlet conduit.
Machines 10 00691 g015
Table 1. Effect of grid number on pump device efficiency.
Number of Grids (104)215260310388510540600700
Efficiency (%)76.0376.1676.5076.7676.8676.8576.8576.85
Table 2. Reynolds number of the flow in the inlet and outlet conduits at different rotation speeds.
Inlet conduitRotation speed1450 r/min1800 r/min2200 r/min
R e 2.31 × 1052.30 × 1053.32 × 105
Outlet conduitRotation speed1450 r/min1800 r/min2200 r/min
R e 2.07 × 1051.96 × 1051.92 × 105
Publisher’s Note: MDPI stays neutral with regard to jurisdictional claims in published maps and institutional affiliations.

