To understand the effect of the control type of the fatigue experiment on the fatigue behavior of specimens, as well as on the FBG sensor, two different experimental procedures were applied, such that in first and third experiments, the strain amplitude was kept constant during the cyclic loading through using an extensometer as a control sensor, while in the second one, the displacement amplitude was retained as constant by employing LVDT as a control sensor. During the experiments, the peak and valley of axial strain, displacement and force for each sinusoidal fatigue cycle were acquired by the MTS system. Meanwhile, axial and lateral strains of the mid-plane of the composite specimens were also obtained by FBG sensors. Temperature compensation is applied (i.e., approximately 25
/°C) to the entire FBG data of all three experiments using the thermocouple data. In
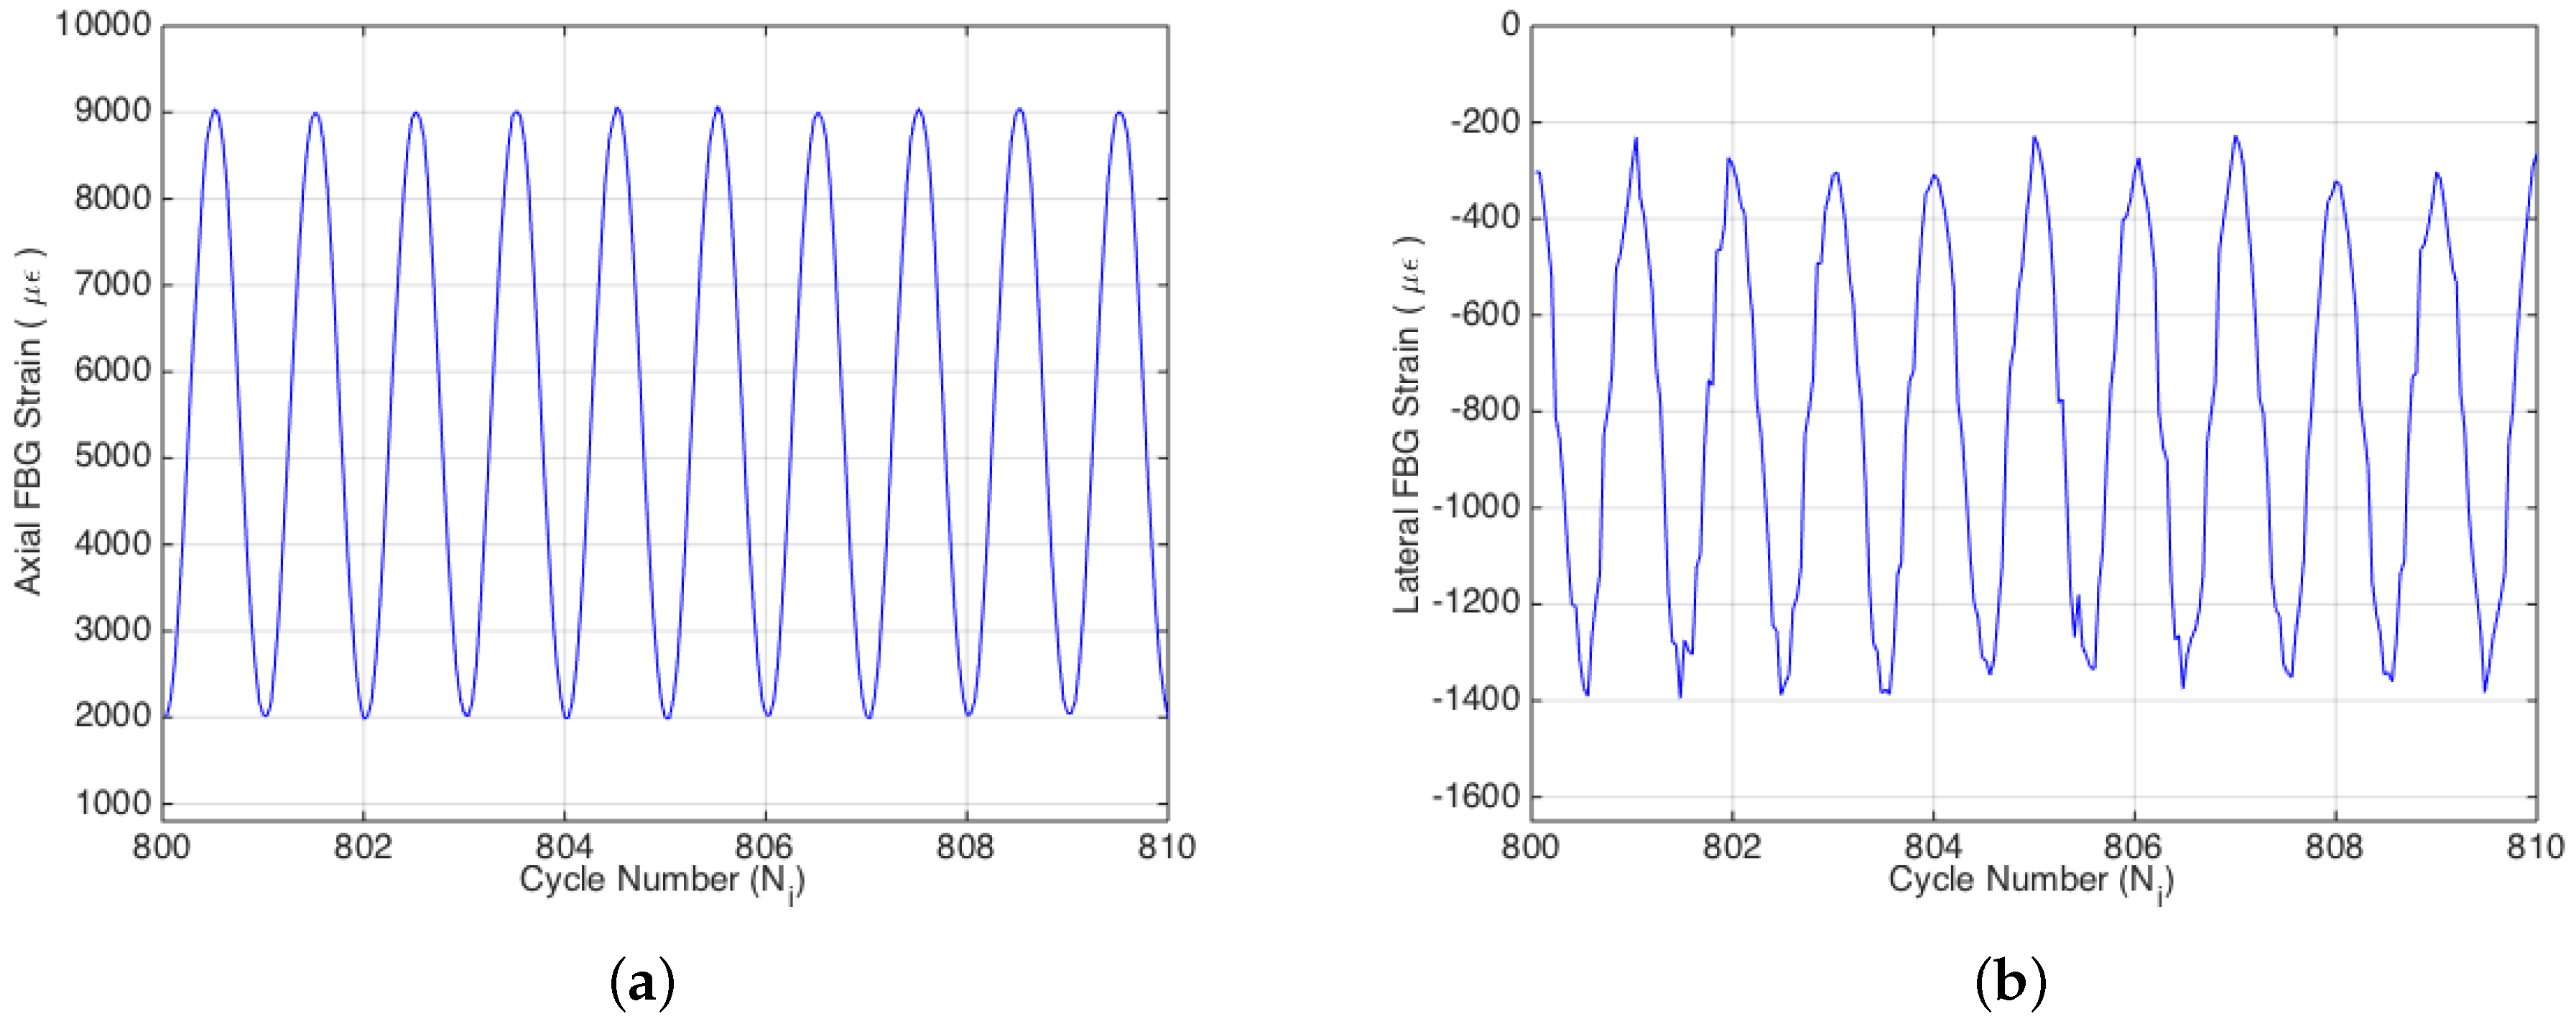
Figure 3 is given the sinusoidal variation of the strain acquired by both the axial and transversal FBG sensors during the fatigue experiment. Poisson’s ratios of the specimens were calculated for each cycle using biaxial strain data obtained by the FBG sensors. The reduction of Poisson’s ratio with respect to the cycle number was monitored, which is an important parameter for the evaluation of the fatigue damage.
3.1. Strain Controlled Fatigue Test
Fatigue in fiber-reinforced polymer matrix composites is characterized by three distinct phases. Namely, in the first phase, comprising the first 10%–20% of fatigue life, the rapid formation and interconnection of matrix cracking due to residual curing stresses and discontinuities within the composite causes a sharp, non-linear decrease in stiffness. The second phase corresponds to between 10%–20% and 90%–95% of the fatigue life, where there is a gradual and linear decrease in stiffness, which is attributed to matrix crack propagations, fiber debonding and delamination. The final phase is characterized by a sharp nonlinear decrease in stiffness due to the plurality of fiber breakages [
6].
Specimen 1 was subjected to an extensometer-controlled tension-tension constant strain amplitude fatigue at a strain ratio (i.e., test strain/ultimate strain) of 0.55.
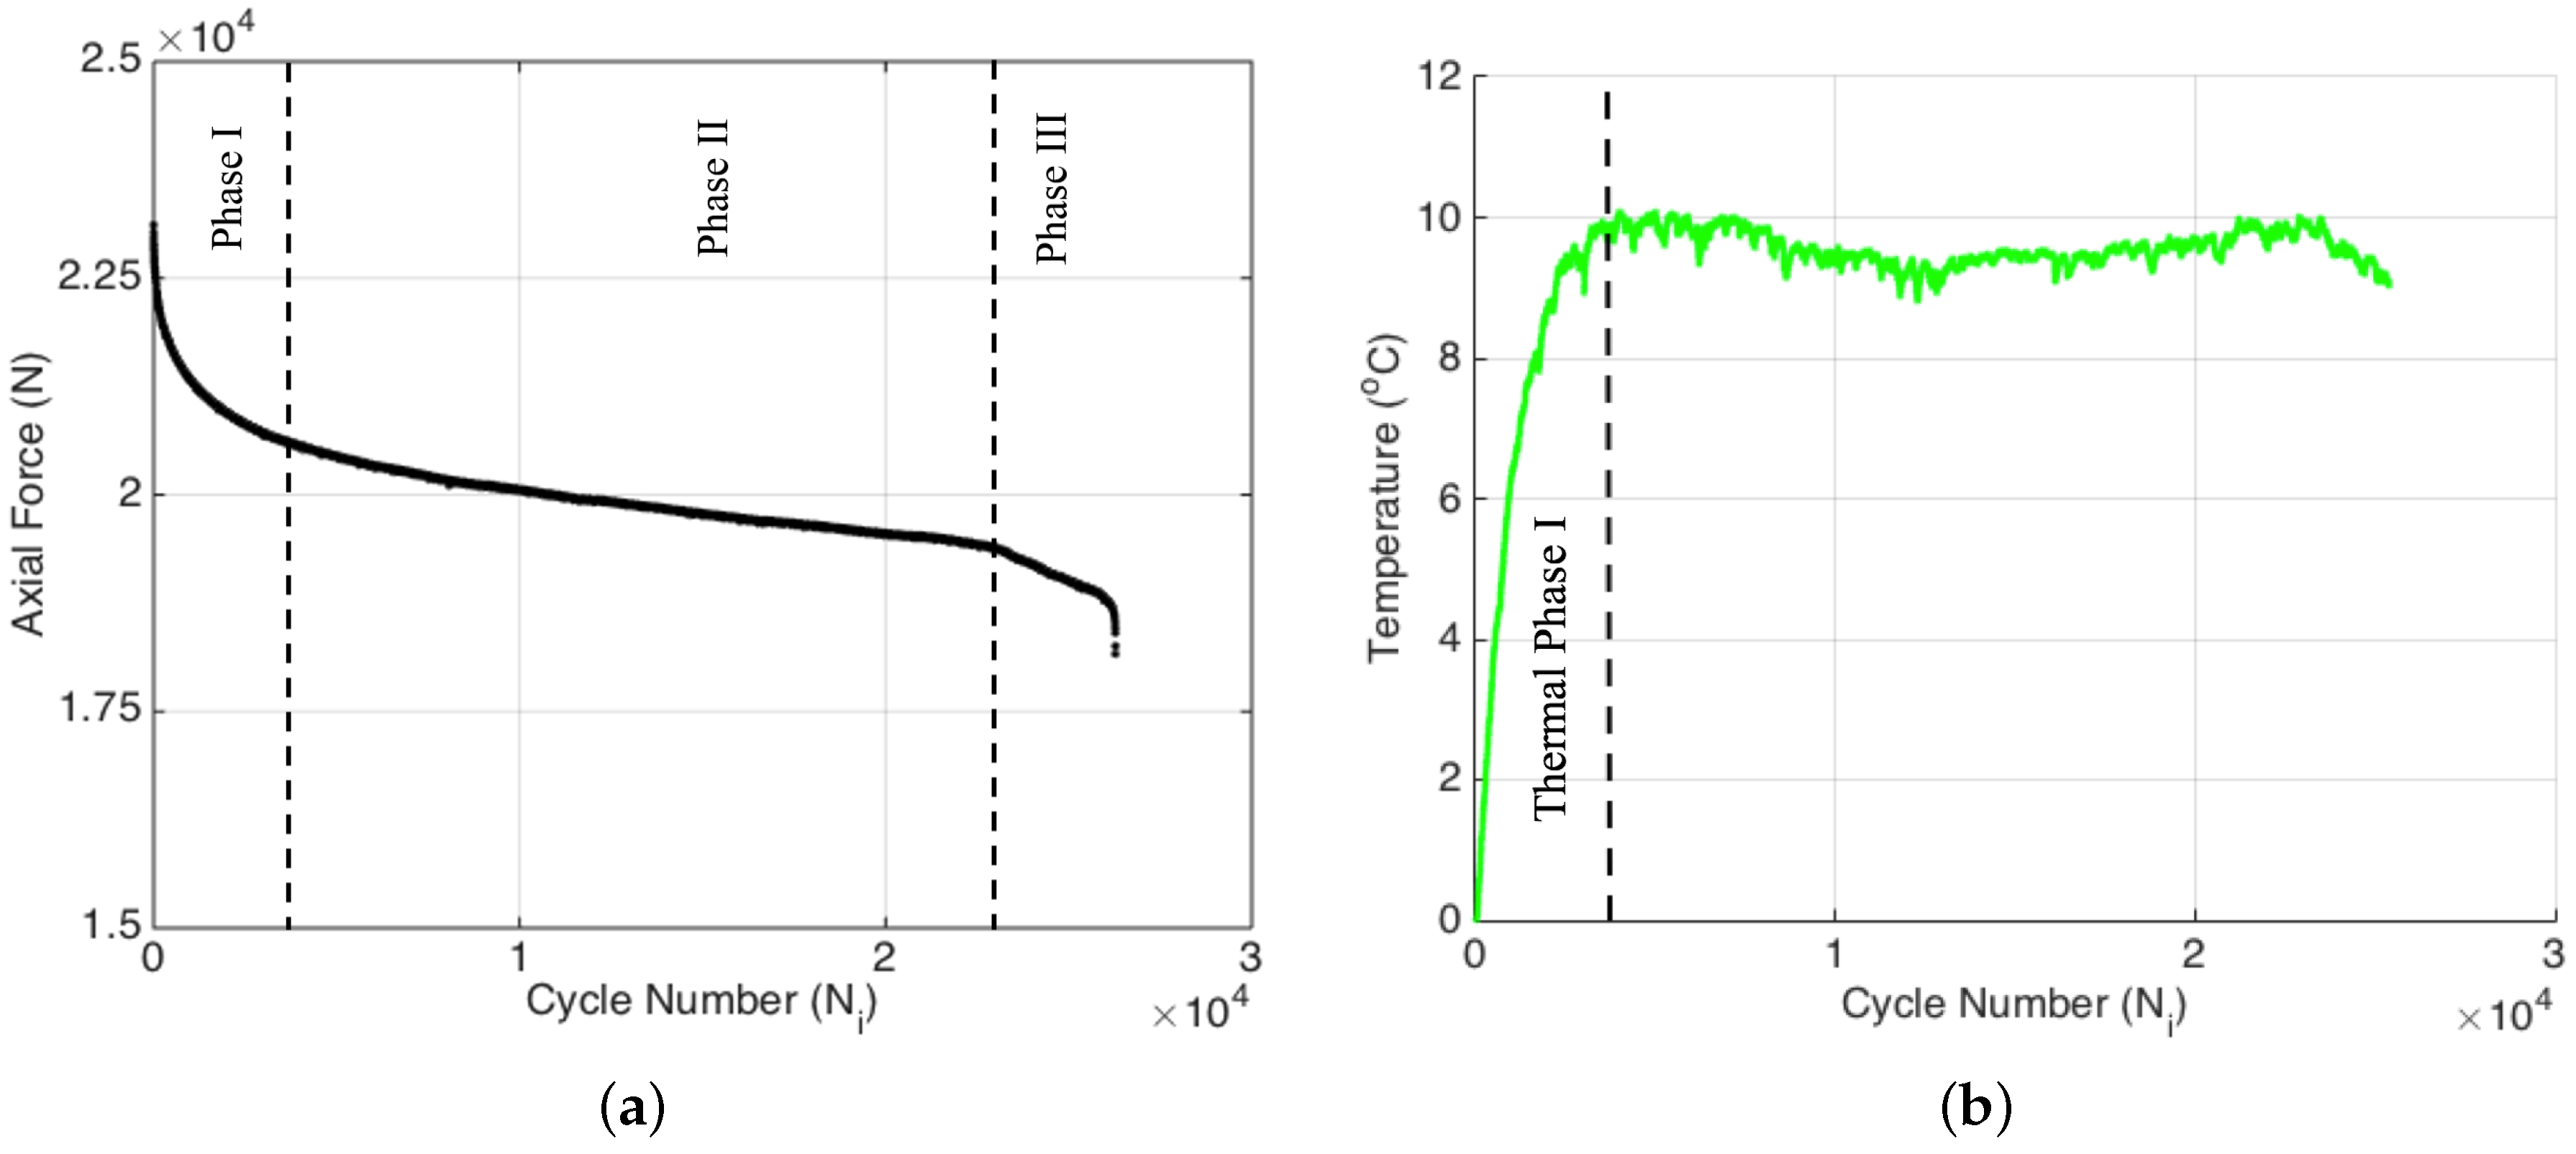
Figure 4a indicates that the evolution of the applied fatigue force as a function of cycle number also possesses three distinct fatigue phases as expected, since the stiffness reduction and decrease in the applied force are equivalently related one another for the fatigue experiment conducted at a constant strain amplitude, as is the case for the current study. In this experiment, the first fatigue phase spans over about 4000 cycles (corresponding to nearly 10% of the failure cycle) in which the force on the test specimen continuously decreases as expected since the fatigue experiment is performed under constant strain, and as a result of fatigue damage, in each cycle, less and less force is required to reach the initially preset strain value. Recall that the cause of such a noticeably sharp decline has been associated with the matrix cracking, where in this particular loading configuration, the damage is likely to be dominated by transverse cracks. After 4000 cycles, the descent in the force continues, albeit with a smaller rate compared to the first region, and almost follows a linear trend up to the last 2000 cycles where this phase is referred to as the second phase of the fatigue. Then, rather close to the failure, which generally corresponds to 5%–10% of the overall fatigue life, the third phase is entered, which is characterized by a drastic drop in the applied force.
Previous studies stated that matrix cracks were one of the most dominant damage mechanisms for FRP composites [
14,
15,
16,
17]. Transverse matrix cracks take place in 90° plies and cause degradation in material properties as fatigue cycles continue. In
Figure 4b, numerous transverse cracks within the specimen are shown in a high-resolution camera image with a black background. Owing to the transparent characteristic of the glass fiber/epoxy composite, the embedded fiber optic cable can be seen in yellow color on the very left of the figure. On the right side of the figure, tows of 90° glass fibers are indicated. The stitches of the biaxial fabric are also visible as wavy white lines. The transverse matrix cracks perpendicular to the tensile direction are visibly spread out across the entire surface.
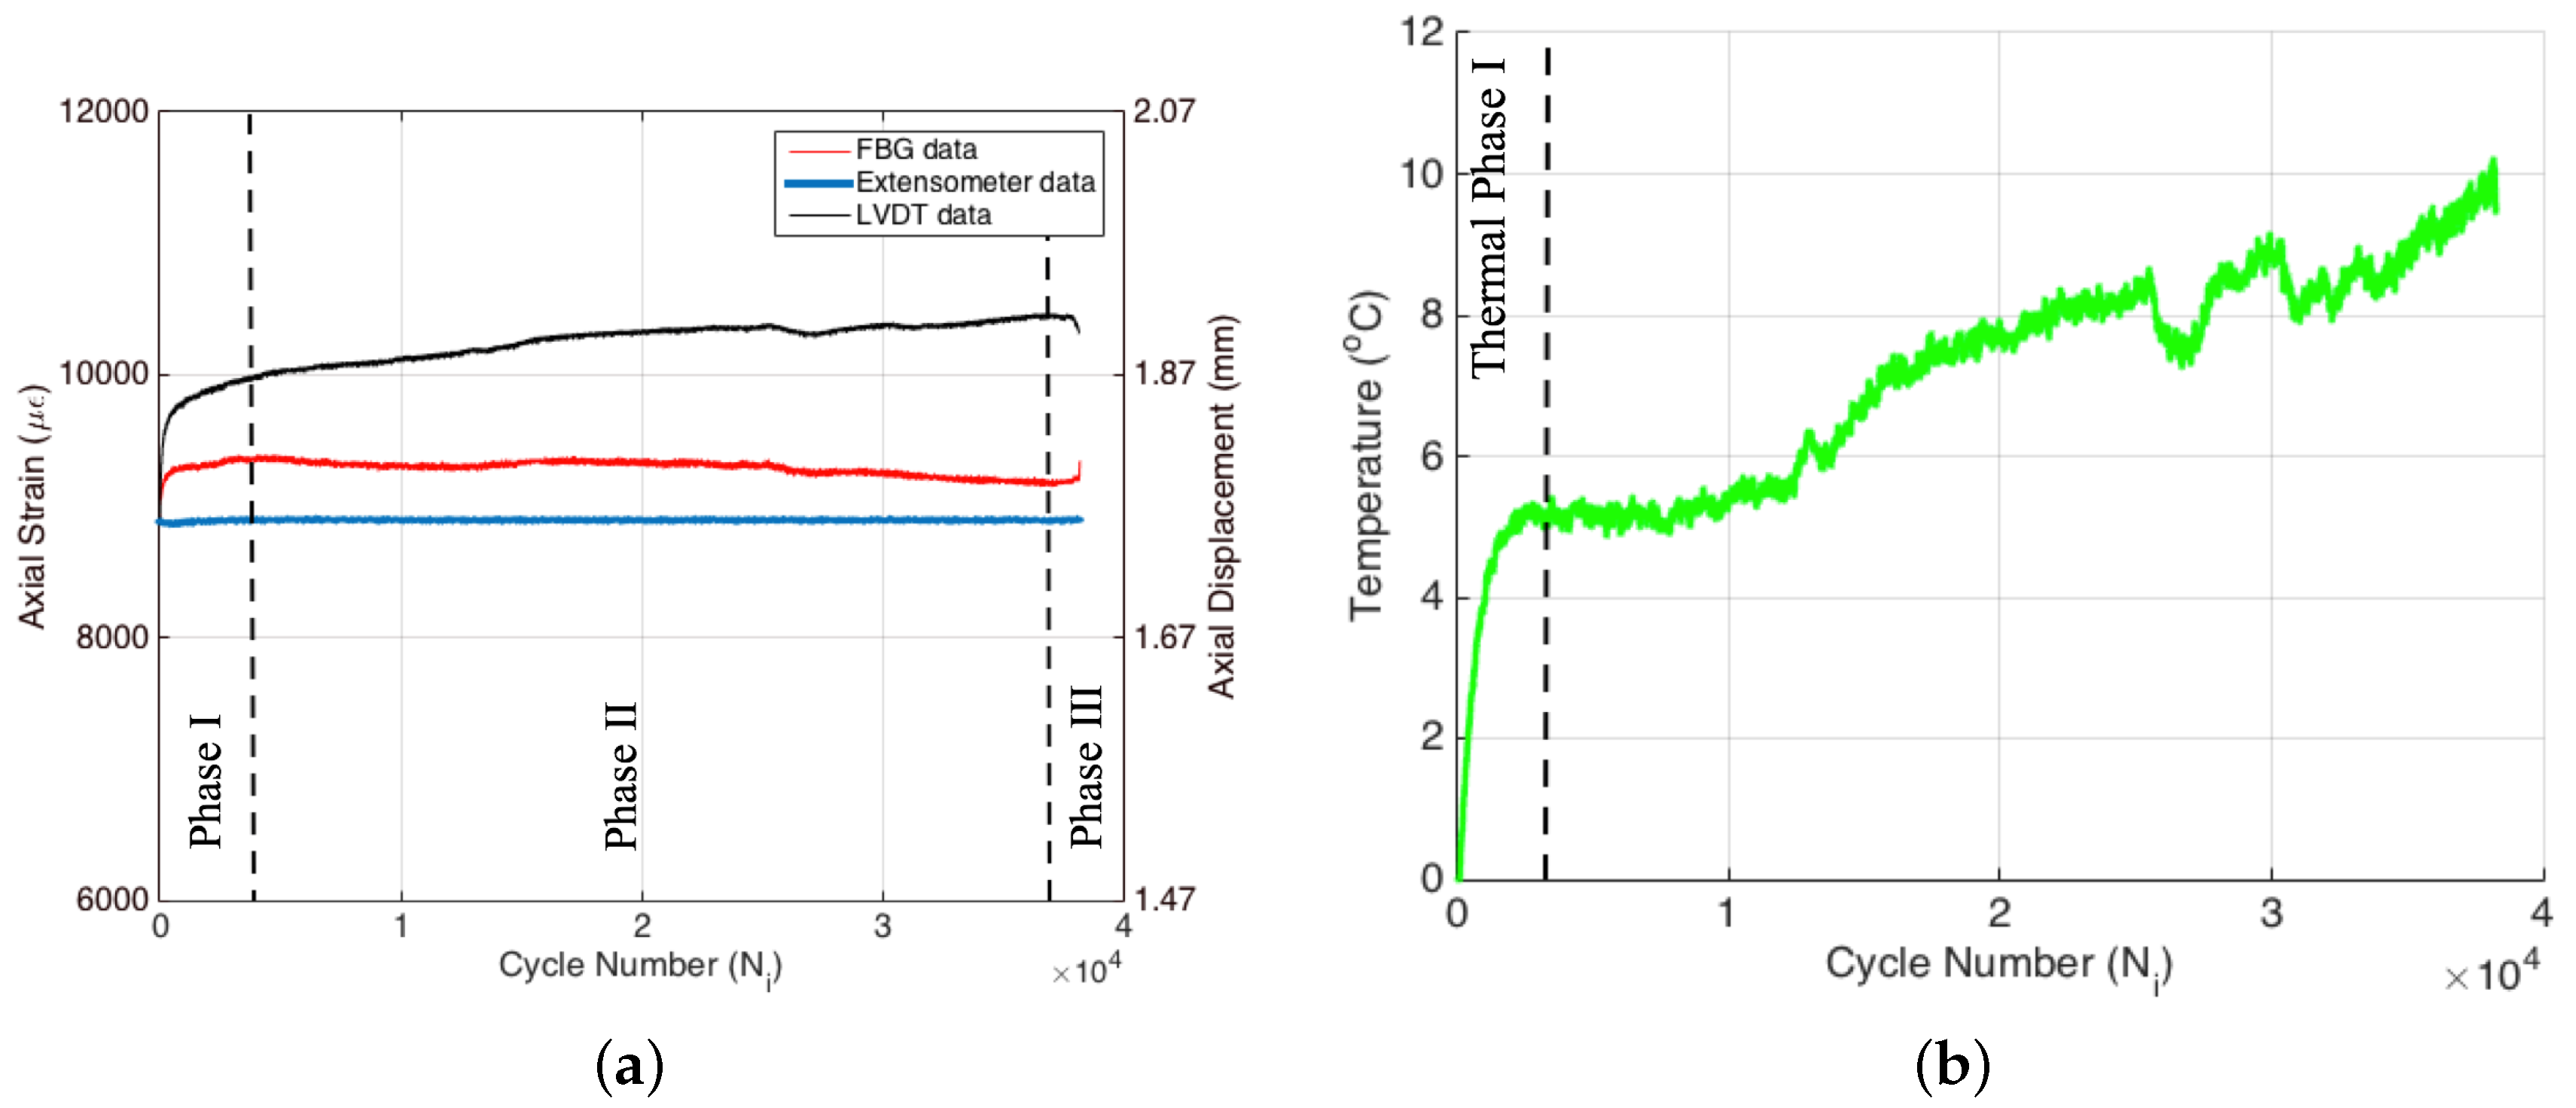
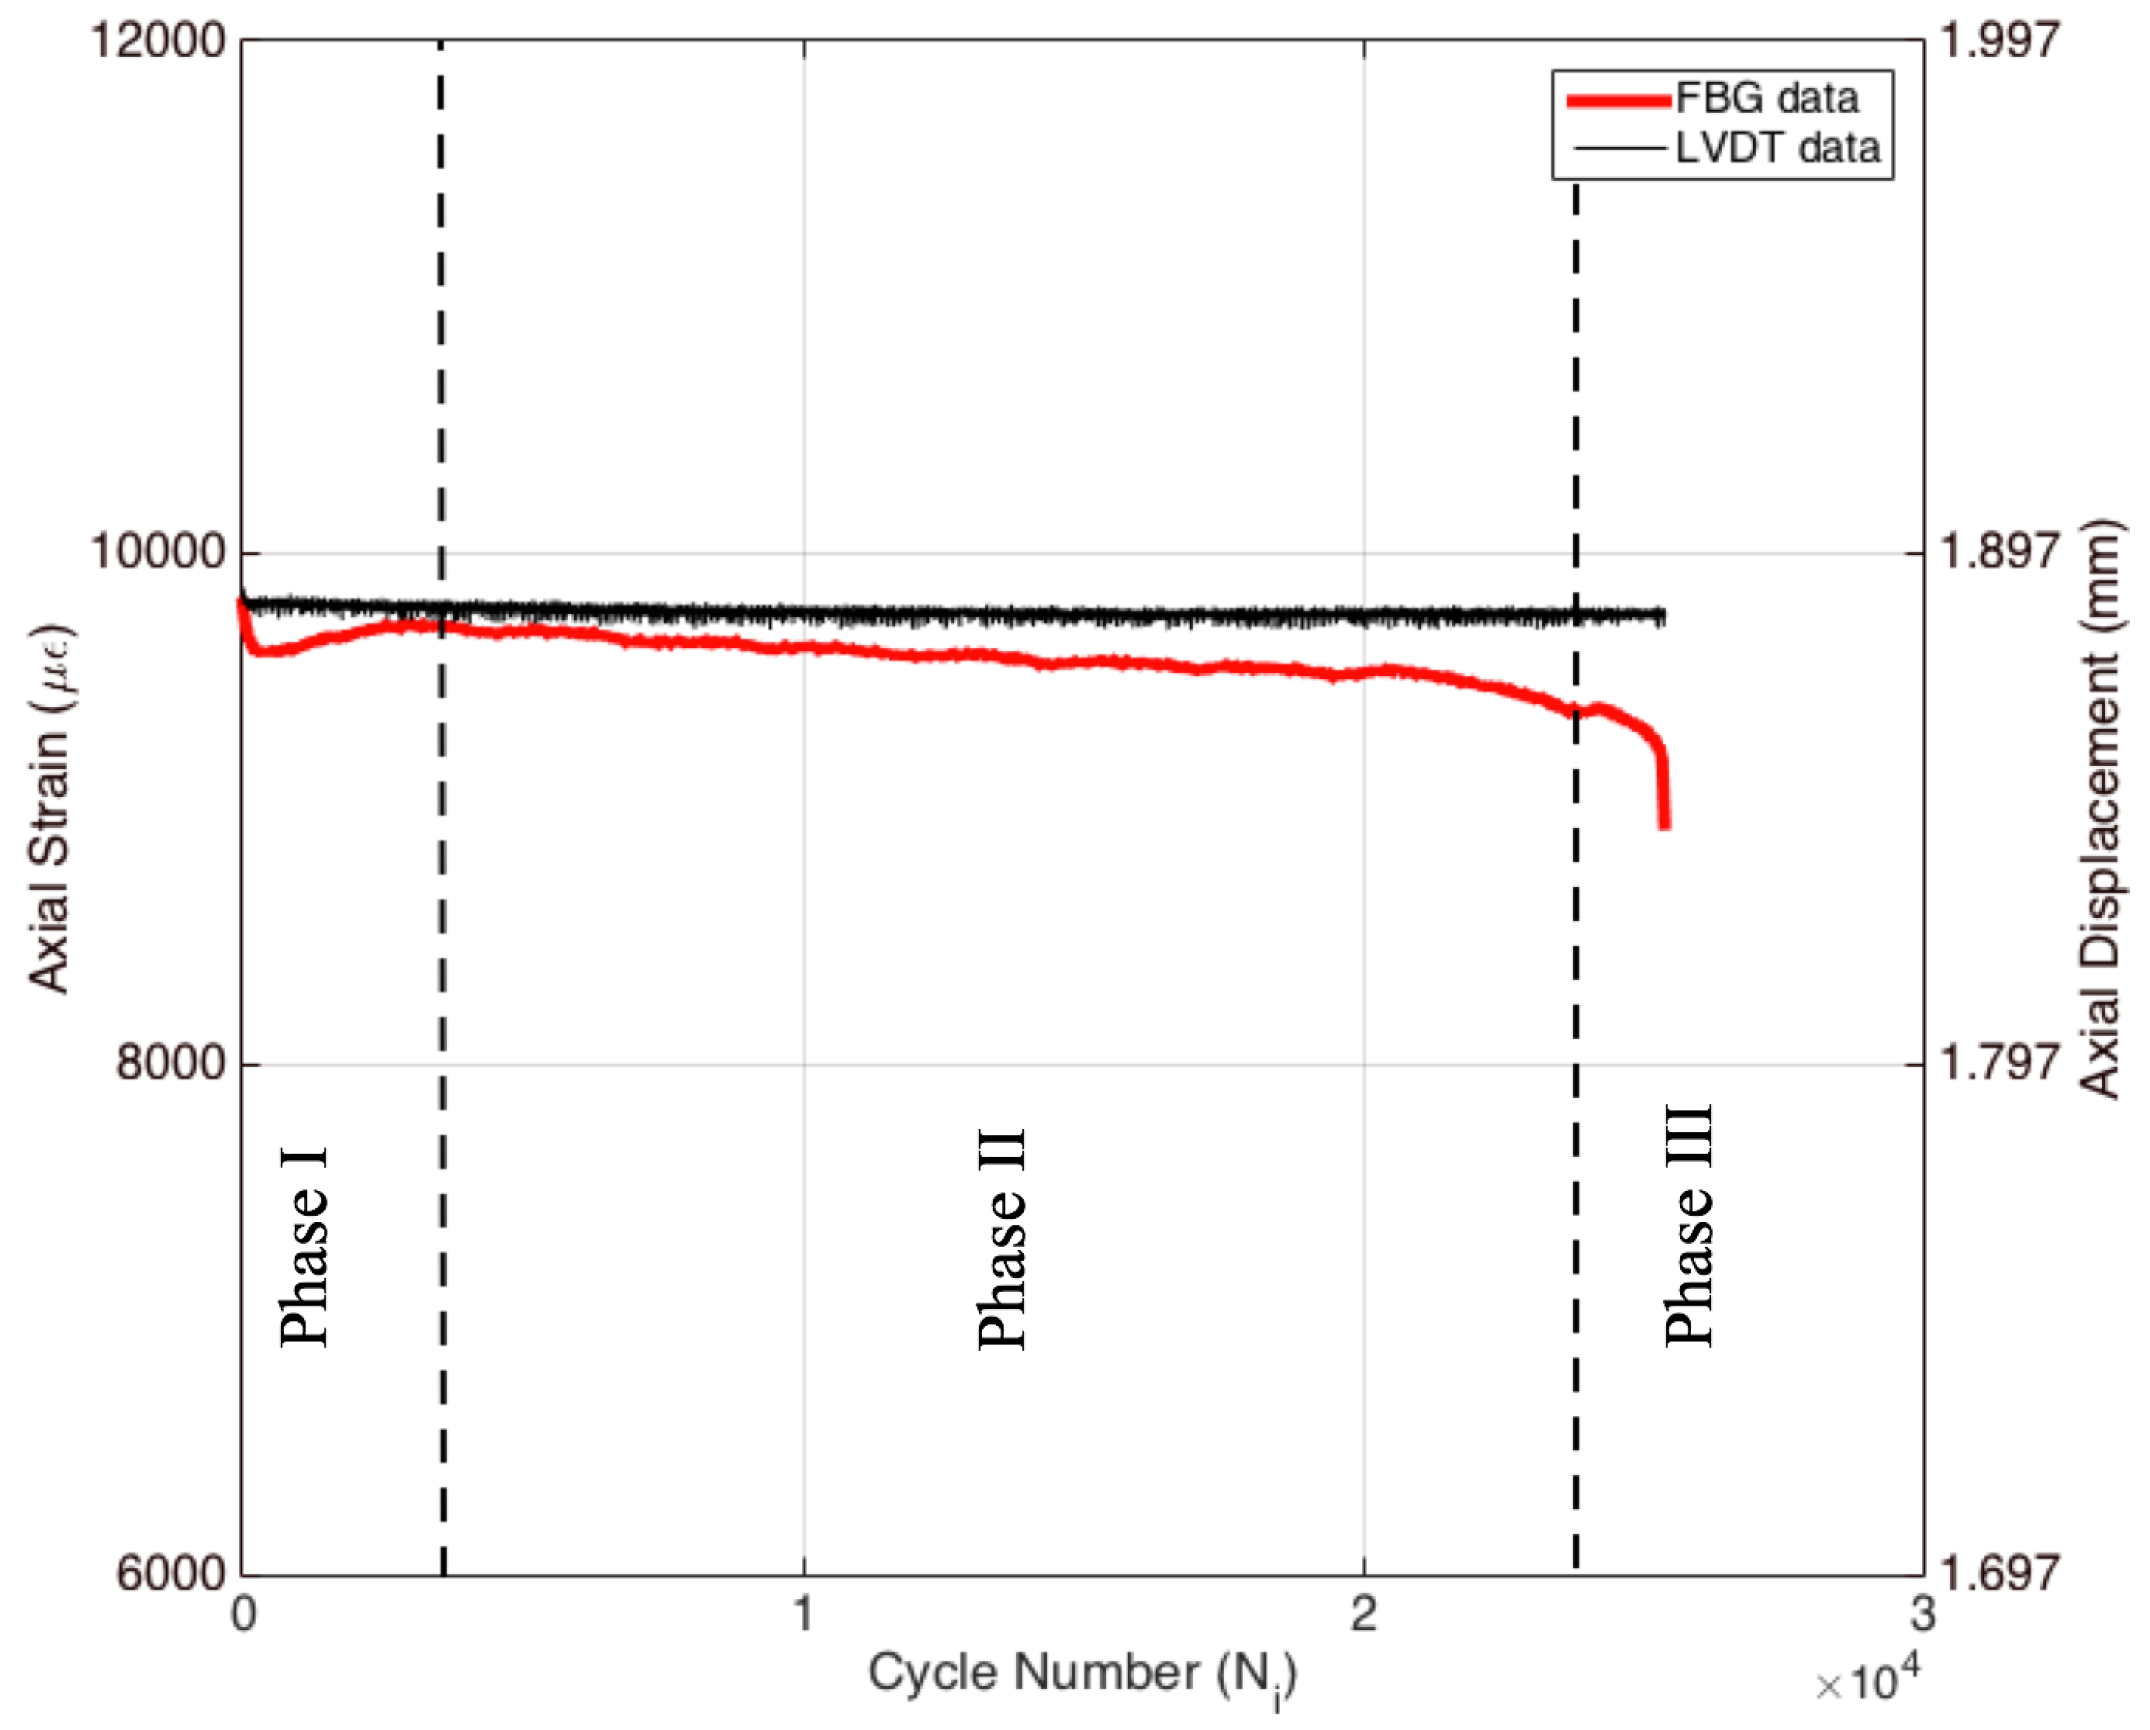
Figure 5a shows the evolution of maximum strain (i.e., peak strains in the sinusoidal strain form) and displacement as a function of cycle number, which were recorded by extensometer, FBG and LVDT sensors where the left axis belongs to the extensometer and the FBG sensor, while the right axis is for LVDT. Since the test was performed under extensometer control, the gauge length within the area of extensometer blades was exposed to a peak strain of 8900
(i.e., corresponding to the strain ratio of 0.55) for each cyclic load. The strain data of the extensometer in
Figure 5a are perfectly flat throughout the test as expected. The failure of Specimen 1 took place around 38,000 cycles.
Displacement data collected by LVDT yield a different behavior when compared to the strain data of the extensometer, such that the overall applied displacement gradually increases during the test, as seen in the right axis of
Figure 5a, even though the applied strain is constant in the extensometer gauge-length. This phenomenon, thoroughly investigated in another study [
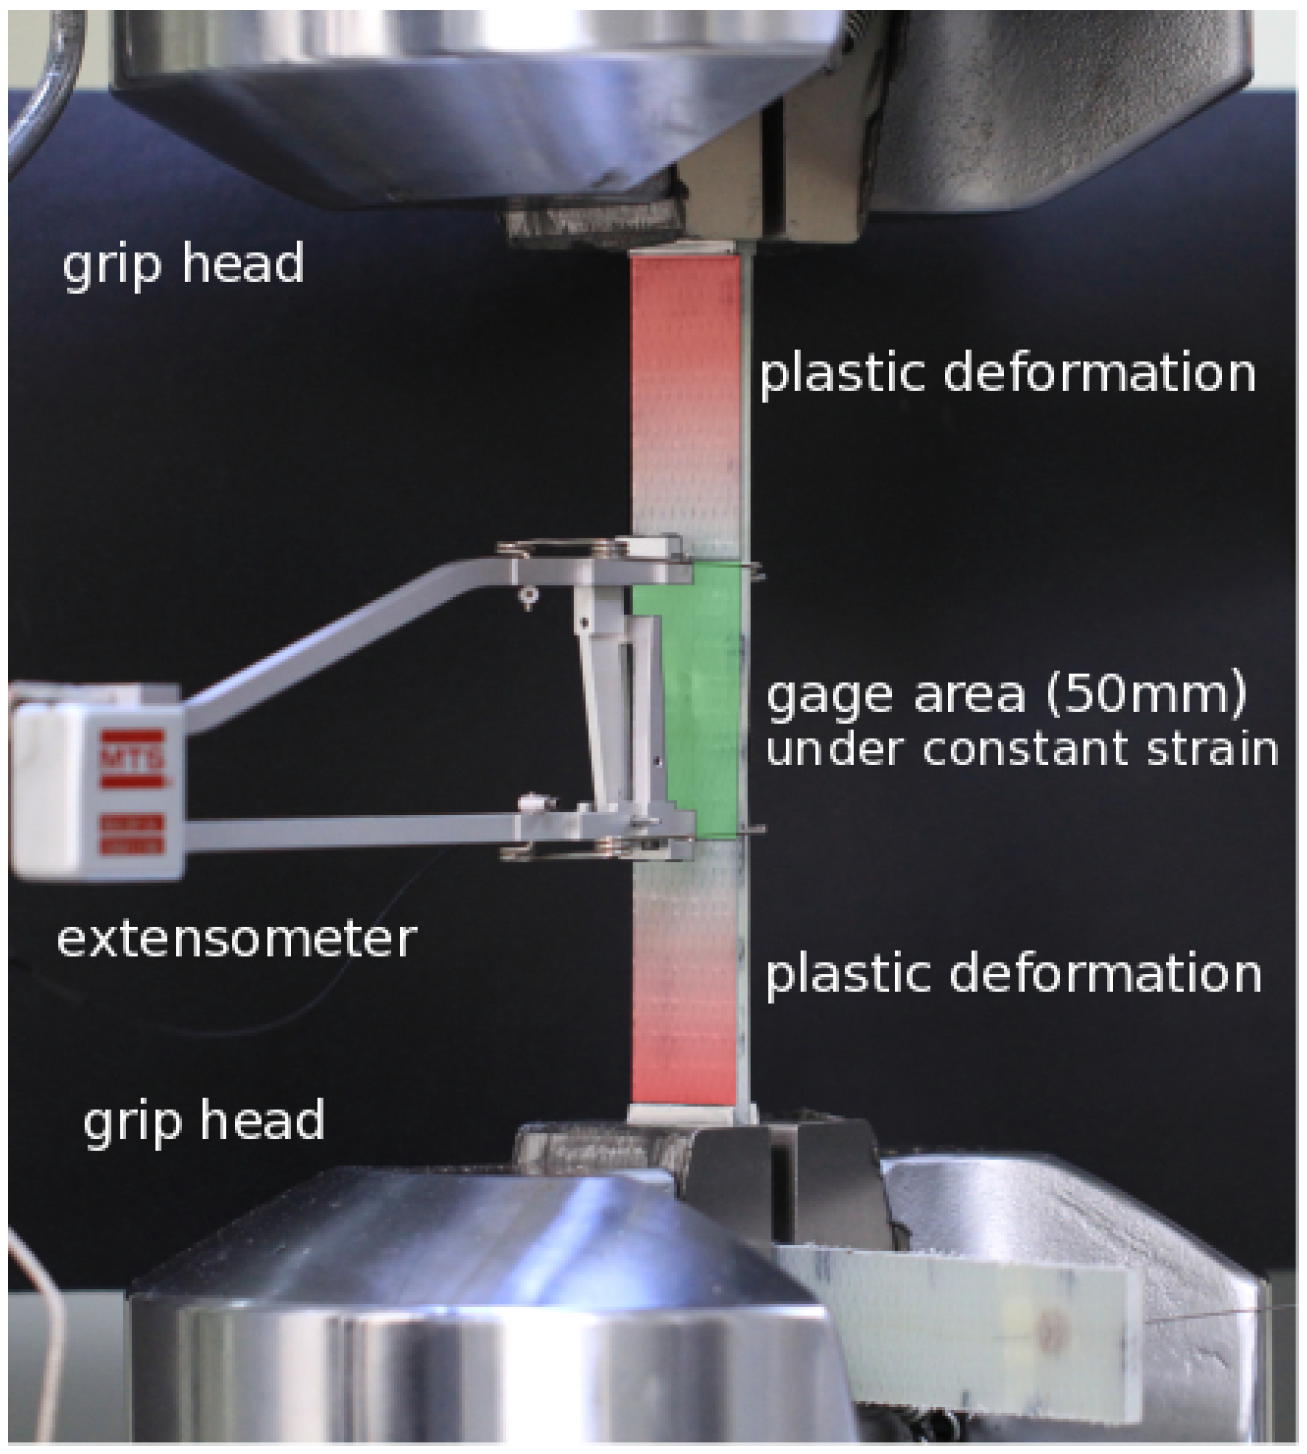
18], is essentially caused by the cracks and damage accumulated within the entire length of the specimen. During the extensometer-controlled fatigue experiment, the gauge area (i.e., green area in
Figure 6) is subjected to constant strain amplitude, thereby leading to constant average displacement within the gauge length of the extensometer. On the other hand, due to the permanent deformation out of the gauge area of the specimen, the grip head of the universal testing machine should move further to impose a predefined strain level on the gauge length of the extensometer. The crack density of the specimen directly affects the progression of this permanent deformation. Thus, the permanent deformation results in an increased displacement at each cyclic load. The small amount of fluctuations in the slope of the displacement curve is most probably related to the transverse matrix cracks, delamination and fiber breakages induced by fatigue loading at particular periods of fatigue life. Interestingly, there are three distinct phases in the variation of displacement during the entire fatigue test, namely the sharp and non-linear increase in the displacement followed by the nearly linear increase and final sudden drop. These phases are well correlated with the force versus cycle number plot presented in
Figure 4a.
It should be noted that the raw FBG data are in the form of wavelength and therefore need to be calibrated with respect to sensors whose outputs are strain (i.e., extensometer and strain-gauges). To this end, before fatigue tests, specimens with FBG sensors were loaded in a quasi-static cyclic manner four times until reaching the desired strain ratio to calibrate the FBG sensor, as well as eliminate any slippage of the sample from the grips during fatigue testing. FBG sensors were calibrated with respect to both the extensometer and strain-gauge using the data in the fourth loading cycle. The FBG calibration coefficients calculated based on the extensometer and strain-gauge data might be slightly different due to the dissimilar gauge length between the strain-gauge and extensometer. In this study, the extensometer-based calibration coefficient is utilized, namely 1.25 pm/
. Recalling that the fatigue test on this specimen was conducted under constant strain using the extensometer, one may at first sight expect that FBG sensors should also give constant strain values since they are flanked by the two pins of the extensometer. However, maximum strains gathered from the FBGs can be significantly distinct from the global strain of the specimen. As the fatigue experiment progresses, the local strains measured by the FBG sensor vary such that the trend has three different regions, that is to say, an initial increase superseded by a gradual decline, followed by a final sharp rise after which failure occurs. These three phases are in agreement with the fatigue phases observed in both the force and LVDT plots as a function of cycle number in
Figure 4a and
Figure 5a, respectively. This finding indicates that by means of internal and local strain monitoring with discrete embedded FBG sensors, one can conclude the fatigue phases of the composite specimens.
The drop in the FBG recorded strain during Phase II (i.e., about 200
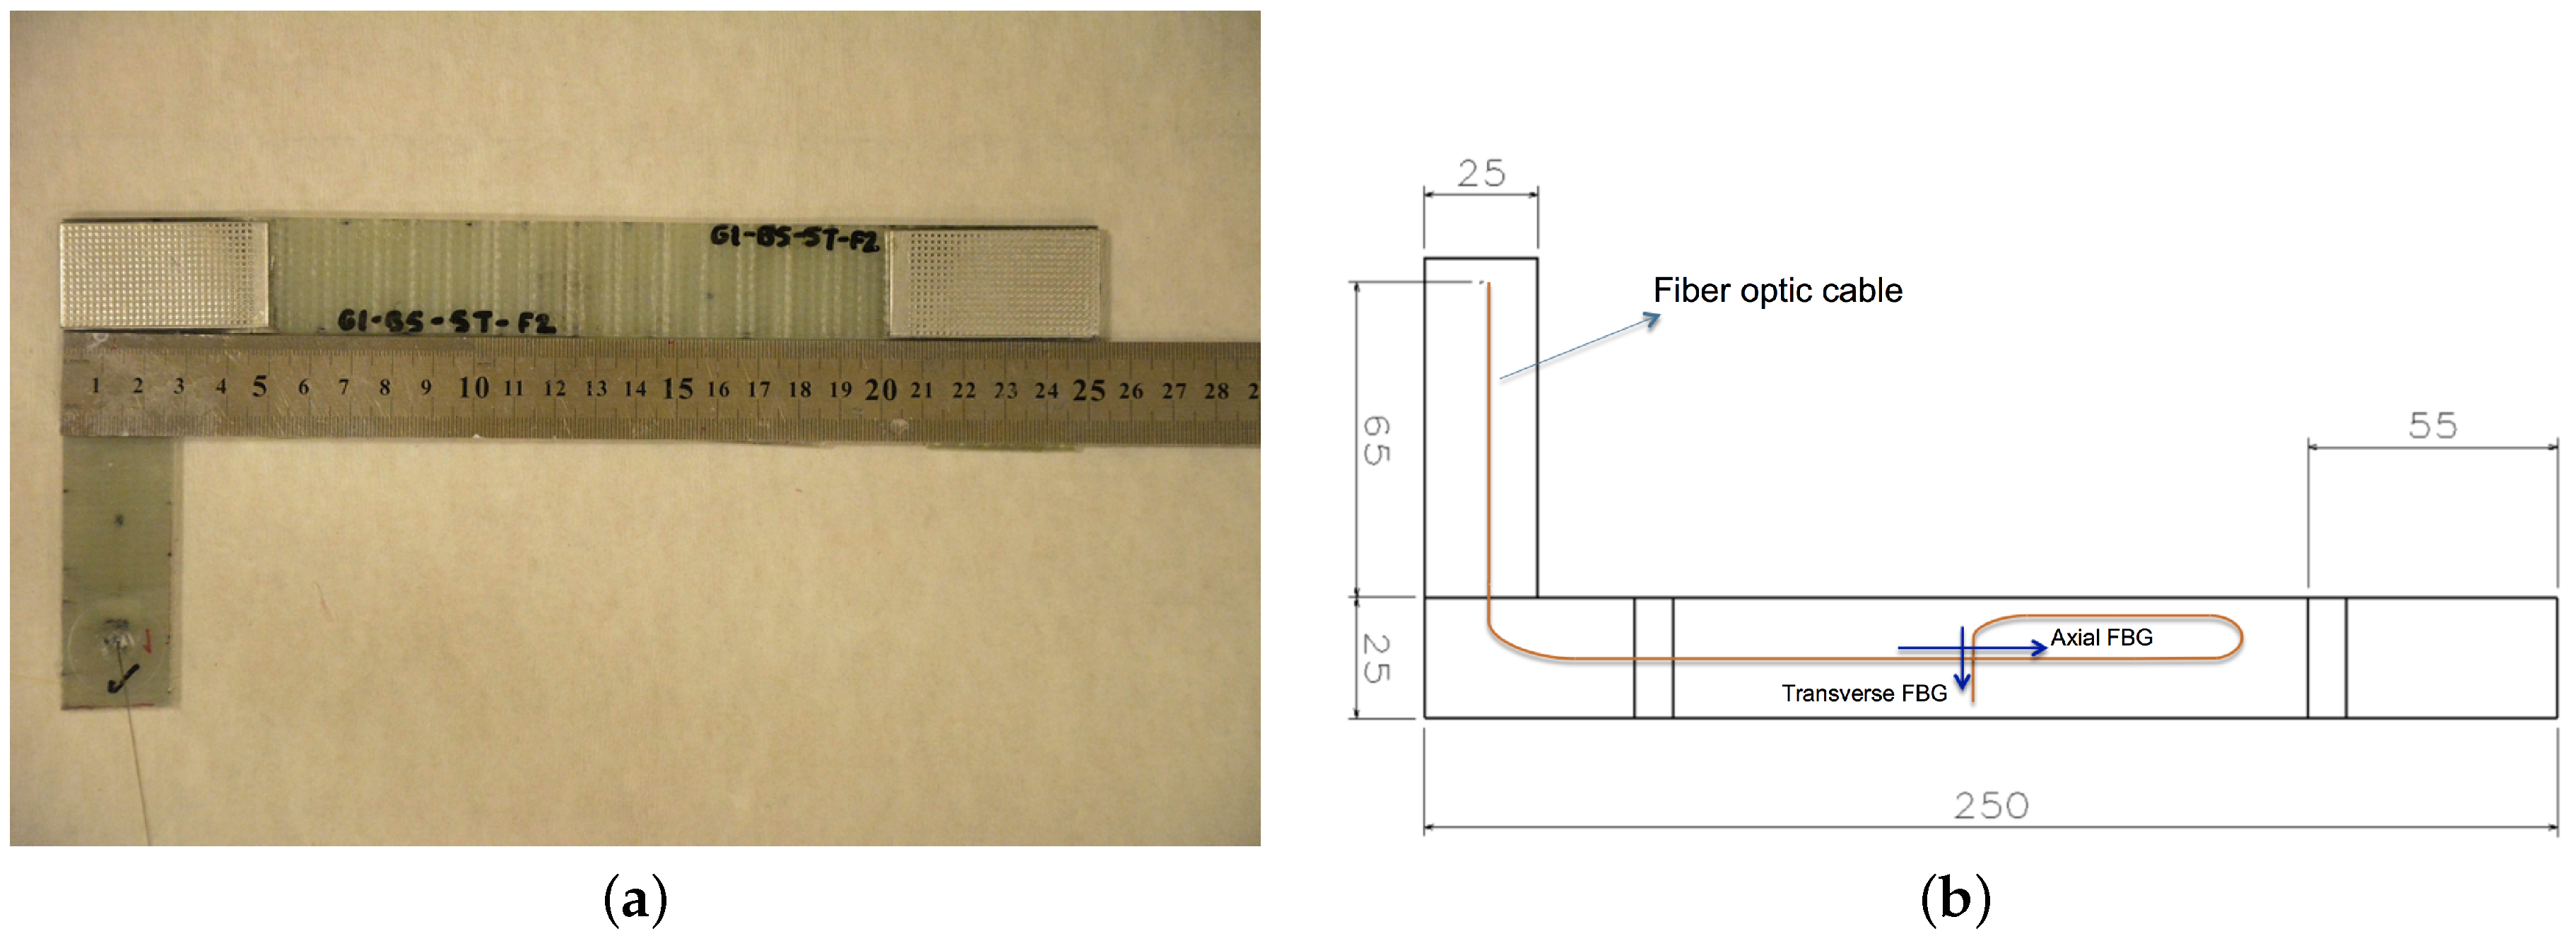
), albeit with the increase in the displacement, is related to transverse cracks and damages formed within the specimen. FBG sensors are located at the mid-point of the specimen gauge area (see
Figure 2b), which is under constant strain (in the gauge length of the extensometer) during the entire test. The applied strain is an average value over the gauge length of the extensometer (i.e., the green area in
Figure 6). On the other hand, FBG sensors are only 1 mm long and record the strain data at the mid-point of the gauge length within the symmetry axis of the specimen. Even though the entire 50 mm of the gauge length is under constant strain at each cyclic load, there is still a considerable amount of damage inside this area that causes a non-uniform strain distribution. Thus, the FBG sensor at the center of the extensometer gauge length experiences less and less strain with respect to the FBG recorded strain at the beginning of Phase II as the damage increases [
18].
It is well documented in the literature that when a specimen is subjected to cyclic loading, a portion of the mechanical energy is dissipated as heat (also referred to as autogenous heating), causing a rise in the temperature of the specimen [
19,
20,
21]. For metals and fiber-reinforced composites that are exposed to cyclic loads, the variation of temperature as a function of cycle number (thermal curve) can undergo three different thermal phases, namely an initial, rapid increase in the first phase, followed by a linear change in the second phase and a final non-linear increase near the failure in the third phase [
17,
19,
21]. Such a heat generation in response to the fatigue loading can be the result of several different mechanisms as substantiated in the literature, namely heating owing to viscoelasticity/material damping, heating due to the plastic deformation at the end of the crack tips that are formed due to the repeated loading and, finally, the friction between the internal surfaces of the cracks and deformations [
22,
23]. Performing a simple energy balance calculation, one can show that the frictional heat generation is a dominating factor in the autogenous heating. The effective thermal conductivity of the composite specimen decreases with the increase in damage density since the discontinuities (cracks and damages) in the composite act as insulating media. Expectedly, the heat generation rate due to damage accumulation or crack formation should be higher than the heat removal rate by the ambient environment in accordance with the
where
and
and
are the temperatures of the specimen’s surface and the ambient environment;
k is the thermal conductivity;
h is the heat transfer coefficient; and
is the spatial derivative along the normal direction. As one can immediately conclude, the smaller the crack density, the smaller the heat generation and the larger the thermal conductivity and the conductive heat flux (
) to the boundary that can be removed from the surface through convection (
). As
increases, convective heat flux in the direction perpendicular to the surface of the specimen augments. In
Figure 5b, the variation of the temperature of the specimen as a function of fatigue cycle is provided for the entire test, where the temperature data correspond to the difference between the actual temperature (i.e., the temperature during the fatigue cycle) and the initial temperature (i.e., the stabilized temperature before the experiment) of the specimen surface. It can be clearly seen that the temperature of the specimen under fatigue loading increases by around 5 °C in a rather short cycle number, which is roughly 10%–15% of the total cycle number for failure. The length of this first thermal phase is in agreement with that of the first fatigue phase. Recall that in the first fatigue phase, the number of transverse matrix cracks increases with the fatigue cycles. Hence, newly-generated internal surfaces due to the damages are to be exposed to the mechanical load of the fatigue experiment at each cycle. In addition to heat generation because of viscoelastic damping and plasticity, the friction between these newly-generated internal surfaces significantly contributes to the rapid increase in temperature of the specimen during the first fatigue phase. As the experiment continues, the temperature keeps rising, albeit at a smaller rate than the first phase, since the rise in
increases convective heat flux from the surface of the specimen. The nearly linear rise in temperature of the specimen at the second thermal phase indicates that the deformations and damages formed in the course of the second fatigue phase are able to generate heat due to the above-stated mechanisms at a rate higher than the heat removal rate to the surroundings through convection. This kind of behavior in temperature data reveals that the overall damage progressively grows during the fatigue experiment [
12]. It is worthy to note that the temperature regimes we observe in our study correlate well with the first, second and third fatigue phases in
Figure 4a and
Figure 5a.
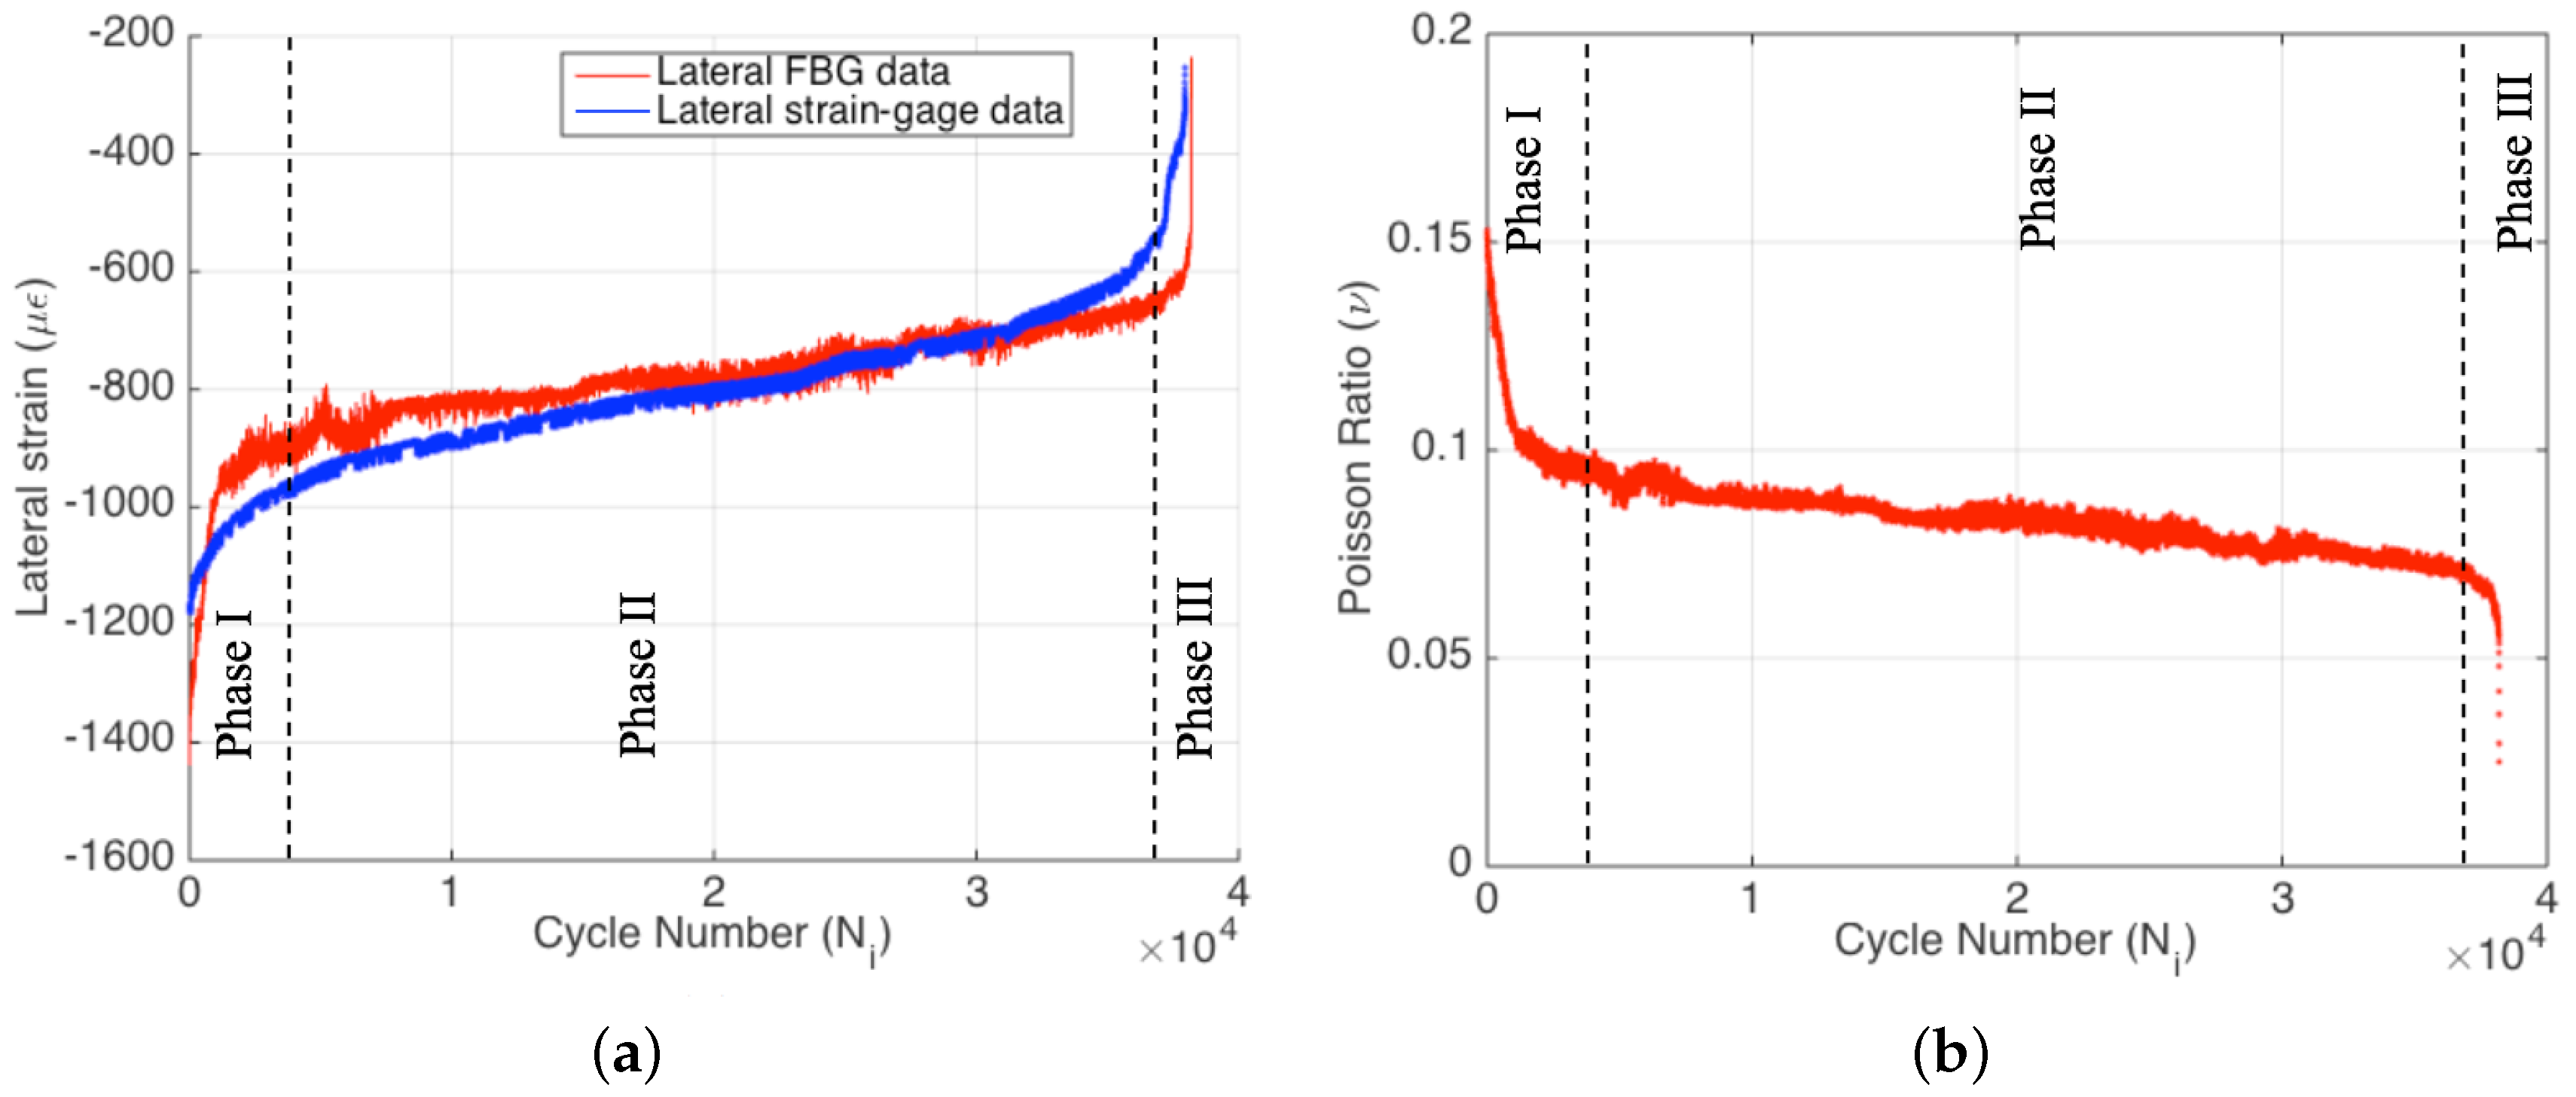
The axial part of the biaxial strain-gauge attached to the specimen surface failed at the very beginning of the experiment (i.e., around 180 cycles). This is directly caused by the high cyclic strain applied to the specimen, which clearly states that conventional strain-gauges are not suitable for such applications. On the other hand, the lateral part of the axial strain-gauge survived until the end of the experiment, since the absolute lateral strain decreased from the 1200–1400
interval to lower absolute values, as seen in
Figure 7a. The survival of the lateral part of the strain-gauge during the entire test also confirms that the strain-gauge attachment to the surface was good enough and that the failure of the axial part of the strain-gauge is not related to any kind of experimental error. One can see from
Figure 7a that the FBG and strain-gauge strains are in agreement with each other during the entire test. However, there is a slight difference in the slope between the two dataset. Additionally, the FBG data have more fluctuations in comparison to the strain-gauge data, since the interior of the composite is more sensitive to the crack formations during the fatigue loading. Strain-gauge data are more like a smoothened version of the FBG data, since the surface is possibly less sensitive to the damage and degradation within the specimen. This result indicates that the internally-measured strain differs from the strain acquired on the surface, and the interior sensors are more sensitive to fatigue damage in composites.
It is obvious that the damage accumulation in the course of the fatigue test has a significant effect on the measured parameters, such as force, displacement, axial FBG strain and temperature. Poisson’s ratio is an important engineering constant, and its variation with respect to cycle number can reveal further information on the fatigue behavior of composite structures.
Figure 7b presents the variation of the FBG sensor-based Poisson’s ratio
as a function of cycle number for Specimen 1 where
,
and
are transverse and axial strains and Poisson’s ratio at cycle i, respectively.
Figure 7b shows that the FBG-based Poisson’s ratio of the composite specimen significantly decreases throughout the test. The cycle-by-cycle basis monitoring of the Poisson’s ratio is well suited to construct the three phases of the fatigue process. Being similar to the other fatigue parameters, Poisson’s ratio also indicates a rapid and nonlinear variation in the first phase of the fatigue test, which is followed by a linear variation characteristic of the second fatigue phase and the final drastic variation corresponding to the third phase of the fatigue. It is clear that biaxially-located FBG sensors can be properly used for fatigue monitoring even for high strain ratios. This gives new opportunities for structural health monitoring systems and fatigue life prediction, since the simultaneous monitoring of the Poisson’s ratio reduction can be a useful tool for this purpose.
3.2. Displacement-Controlled Fatigue Test
Specimen 2 was subjected to displacement-controlled tension-tension strain cycles during the entire test. The strain ratio (i.e., applied strain/ultimate strain) of 0.6 was applied during the experiment. The displacement data obtained by the LVDT and the strain data acquired by the axial FBG sensor (i.e., calibrated with extensometer) with respect to cycle number are shown in
Figure 8. For comparison, LVDT data in the figure were converted from displacement to strain. Since the LVDT system controls the movement of the grip heads, the overall applied displacement is constant throughout this experiment. Thus, the resultant strain values converted from the displacement data are also constant during the entire test. On the other hand, the interior strain obtained by the FBG sensor shows a decreasing trend as in the case of the previous experiment. As explained earlier, due to the transverse cracks and other damage mechanisms, permanent deformations are accumulated in the composite material, which results in non-uniform strain/displacement fields on the entire specimen. Therefore, local strains at the center area of the specimen may vary significantly in comparison to the global behavior. The overall decrease of axial FBG strain in displacement-controlled fatigue test (which is about 800
) is more noticeable when compared to the extensometer-controlled one. The displacement-controlled fatigue experiment leads to a larger drop in strain because the entire specimen length between the grip heads is taken into consideration as the gauge length. Therefore, the longer gauge length means that the applied strain is averaged over a larger length, thereby causing a more variable strain distribution on the entire specimen. The variation between the average strain and the strain at the exact FBG location (i.e., 1 mm long) is therefore more noticeable in the displacement-controlled fatigue experiment. The FBG strain has also three distinct phases, which correlate quite well with those observed in
Figure 9a,b.
The force data in
Figure 9a indicate very similar behavior in comparison to the previous experiment. Three distinct phases in the force versus cycle number plot are clearly visible. The Phase I behavior is particularly pronounced for this experiment, which means that the accumulated damage is considerably higher than the previous experiment. This situation is most likely related to the higher strain rate (i.e., 0.55 vs. 0.6) employed in this experiment.
Figure 9b yields the variation of temperature for the specimen under fatigue loading. Here, the temperature of the specimen increases sharply due to the autogenous heating. The temperature attained at the end of the first thermal phase is noticeably higher than that for Specimen 1 due to the higher strain rate utilized in this specimen. The length of the first thermal phase complies with the first fatigue phase given in
Figure 9a. Afterwards, the temperature declines and gradually levels off. This region is called the second thermal phase, which is in agreement with the second fatigue phase in
Figure 9a. The decrease in temperature unlike Specimen 1 is owed to the rate of heat generation being smaller than the rate of heat removal to the environment given that the convective heat flux from the surface of the specimen increases with the rise in
. At a later phase, there is a noticeable deviation in temperature from the linear region, such that the temperature drop is augmented, indicating the onset of the third thermal phase.
In the previous experiment, it has been pointed out that the strain-gauges may not work properly for high strain ratio experiments. The displacement-controlled test also indicated that the cyclic axial strain is not measurable with strain-gauges for high strain ratios. On the other hand, the lateral strain data were recorded by the lateral part of the biaxial strain-gauge. However, as seen in
Figure 10a, the lateral strain data deviate from the lateral FBG data around 13,000 cycles. After this point, the strain-gauge reads incorrect strain values, while the lateral FBG still works properly. Moreover, the lateral strain-gauge signal was lost sooner than the failure of the specimen. This also supports that the strain-gauges are unreliable and may show abnormal behavior during the cyclic fatigue experiments of high strain ratios. Meanwhile, the lateral FBG signal holds on very well until the failure. In this experiment, the Phase III behavior of the lateral strain is only slightly noticeable. Hence, the related segment is magnified and given as the inset in
Figure 10a.
The calculated Poisson’s ratio reduction is given in
Figure 10b. The initial value of Poisson’s ratio is identical to that of the first experiment since Poisson’s ratio is a material property and, hence, is independent of the control type of the experiment. However, the reduction trend is different from the first experiment. The Phase I and Phase II segments of reduction are perfectly visible in
Figure 10b. Phase III behavior starts around 19,000 cycles and is weakly observable in lateral FBG strain data. Nevertheless, the reduction of Poisson’s ratio is again successfully monitored using biaxially-located FBG sensors during the entire fatigue life of Specimen 2. Accordingly, the application of biaxially-embedded FBG sensors in FRP composites is proven to be an excellent candidate for structural health monitoring purposes.
3.3. Low Strain Ratio Fatigue Test
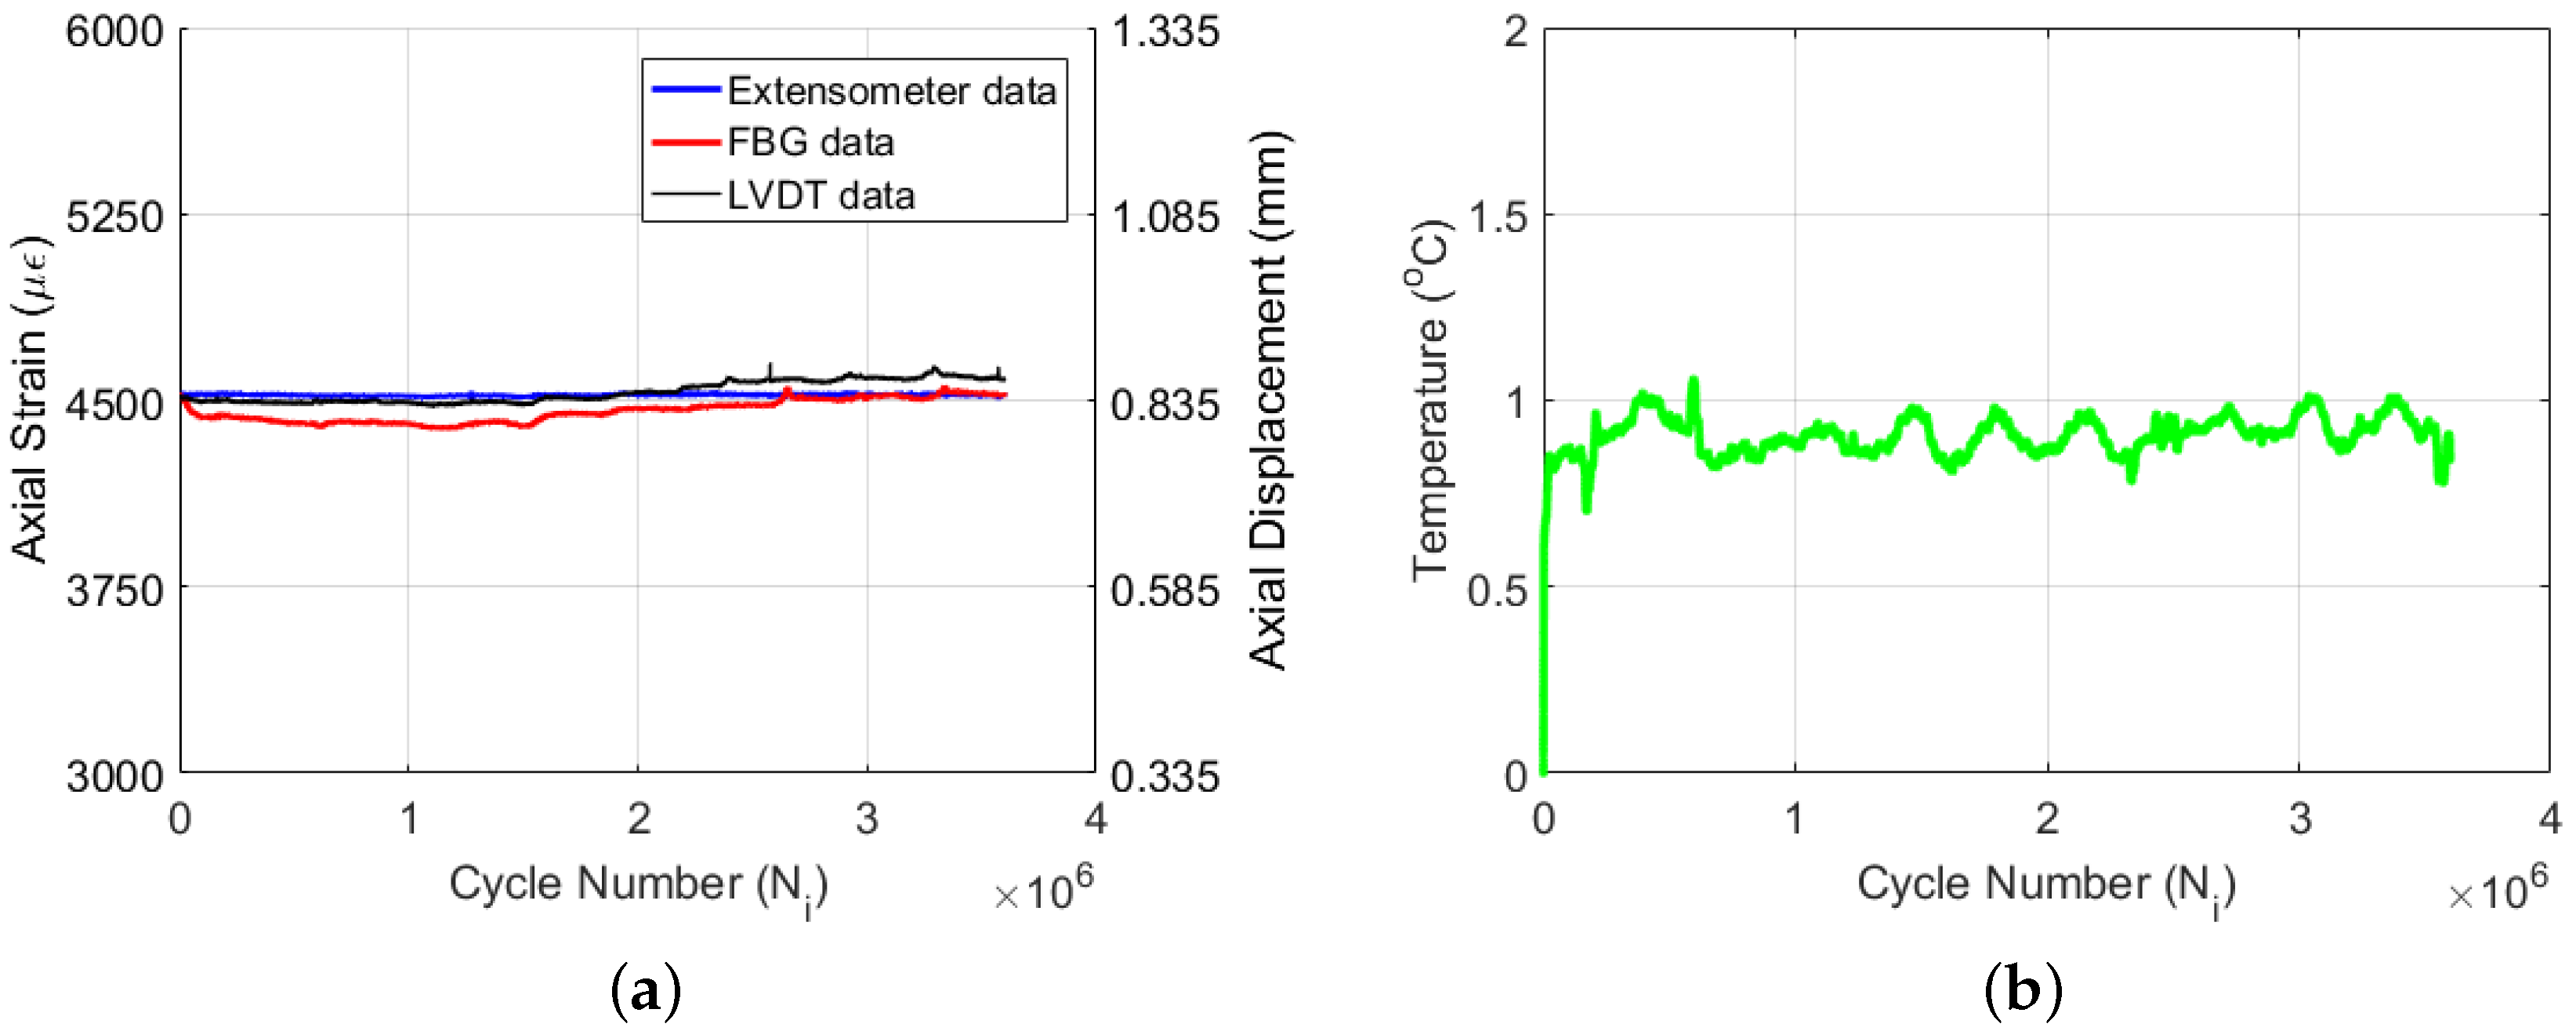
To be able to illustrate the efficacy of the embedded biaxial FBG sensor for monitoring Poisson’s ratio reduction under a low amplitude high cycle fatigue test condition, we have conducted an extensometer-controlled constant tension-tension strain fatigue test on Specimen 3 at a strain ratio of (i.e., applied strain/ultimate strain) 0.27. More than 3.5 million cycles of fatigue data are collected, and the specimen did not fail under this test condition. Therefore, the data presented here do not indicate the full fatigue life of the tested material.
Figure 11a yields the axial strain data acquired by the extensometer, FBG and LVDT sensors as a function of cycle number. Unlike the previous two experiments, the strain values of the extensometer, FBG and LVDT sensors do not deviate too much from each other, implying that damage in the composite specimen under such a small strain ratio is more limited. The overall decrease of axial FBG strain with respect to the extensometer strain is about 100
. The recorded temperature variation data (i.e.,
) of Specimen 3 during the fatigue experiment are given in
Figure 11b. The autogenous heating causes a sharp temperature increase at the beginning of the experiment; however, the amount of the increase is very limited (i.e., 0.8 °C) due to the low strain ratio of the experiment when compared to the previous ones. Following the initial increase, the temperature rises as high as 1 °C and then oscillates between 0.8 and 1.0 °C. The slow damage accumulation within the material keeps the rate of heat generation relatively small, which can be well balanced by the heat removal rate, whereby the temperature of the specimen does not change significantly and is almost constant throughout the experiment.
The lateral strain data of both the FBG and strain-gauge sensors are given in
Figure 12a. One can note that as the fatigue-induced damage accumulates within the specimen, the lateral FBG strain starts deviating from the strain of the lateral strain-gauge, since the damage affects the strain field around the embedded FBG sensor more so than the lateral strain values of the surface-mounted strain-gauge. The Poisson’s ratio reduction for Specimen 3 is given in
Figure 12b. The starting value of Poisson’s ratio is in conformity with the previous experiment data. Since under a small strain ratio, the damage accumulation is expected to be a rather slow process, until 1.5 million cycles, Poisson’s ratio does not show significant reduction and, thereafter, declines in a nearly linear manner with a small amplitude and frequency oscillation during the whole experiment. Given that the collected data do not cover the entire fatigue life of the specimen,
Figure 12b does not include the Phase III region of the fatigue experiment. However, this experiment renders the generality of the proposed methodology, the reliability of the biaxial FBG sensor for high cycle fatigue monitoring and the validity of the results, such that the Poisson’s ratio reduction can be effectively monitored by using a biaxially-embedded FBG sensor irrespective of the magnitude of the strain ratio.


