
Improving the Fracture Toughness and Ductility of Liquid-Phase Sintered WNiFe Tungsten Heavy Alloys by High-Temperature Annealing

Materials Department, University of California, Santa Barbara, CA 93106, USA
*
Author to whom correspondence should be addressed.
Materials 2023, 16(3), 916; https://doi.org/10.3390/ma16030916
Submission received: 21 November 2022
/
Revised: 24 December 2022
/
Accepted: 16 January 2023
/
Published: 18 January 2023
(This article belongs to the Section Manufacturing Processes and Systems)
Abstract
:Tungsten heavy alloys (WHAs) are candidates for use in fusion reactor divertors. Here, we characterize liquid-phase sintered WHAs with 90, 92.5, 95, and 97 (wt.%) tungsten (W), with a balance of a 0.7Ni–0.3Fe ductile phase. These WHAs show remarkable room temperature (RT) fracture toughness at the maximum load, KJm, ranging from ≈ 38 to 107 MPa√m, compared to a monolithic W toughness of ≈ 8 MPa√m. In most cases, the fracture of WHAs occurs through stable crack tearing. However, the 97W WHA has the lowest toughness and fracture elastically in all but the smallest specimens. As lower Ni contents are desirable for fusion application, we explore the potential for improving the ductility and KJm of WHAs using vacuum annealing at 1300 °C for 24 h. The microstructural observations reveal negligible changes in the WHA microstructure and constituent compositions. While annealing reduces the Vickers microhardness (HV), it does not significantly change the RT yield (σy) and ultimate (σu) strengths but results in beneficial increases in total elongation in the 95 and 97W WHAs by a factor of 2. RT tests on the precracked three-point-bend (3PB) bars show that annealing increases the KJm of these WHAs, and in the case of the 97W WHA, the increase is from 42 to 92%, depending on the size of the specimen. Toughening is due to enhanced crack tip process zone microcracking and dilatation.
1. Introduction
Tungsten heavy alloys (WHAs) are a class of bi-phasic metallic composites composed of tungsten (W) powders consolidated by liquid-phase sintering (LPS) with lower melting point ductile phase (DP) metals or alloys consisting of Ni, Fe, Cu, and Co constituents. WHAs are known for their good room- to high-temperature tensile strength and ductility [1,2,3,4]. In addition, for use in very high temperatures environments, such as rocket nozzles, the applications of WHAs include ordnance, such as kinetic energy penetrators, counterbalances, and flywheels, where high mass densities are needed [1,3,5]. WHAs are now considered one of the most promising plasma-facing structural materials for fusion reactor divertor and armor applications [6,7,8,9,10,11,12,13]. For example, Neu et al. [8,9] found that 97W-2Ni-1Fe WHAs divertor tiles in the mid-size tokamak ASDEX upgrade facility that experienced up to a 20 MW/m2 cyclic plasma heat flux and up to 2200 °C surface temperatures, showed a lower cracking tendency compared to monolithic W. The advantages and open questions about WHAs related to fusion service are described elsewhere [7,9,11,12,13,14,15], and the WHA fabrication routes and basic properties are the subjects of extensive literature [1,2,3,4,5,15,16]. For various reasons, such as W recrystallization and fuzz formation, the maximum service temperatures for W divertors are likely to be ≈1300 °C [8,9,17,18,19,20,21,22].
Sufficient fracture toughness is critical to qualify a structural material for fusion divertor applications. Our literature search shows no studies on the use of high-temperature annealing heat treatments to improve the fracture toughness of as-sintered WHAs. Indeed, fracture toughness evaluations on the precracked WHA specimens for any compositions or conditions following ASTM standards is very rare. Note, others work on the heat treatment on WHAs mostly involves the impurity phase or tensile property characterization and can be found in [23,24,25,26]. Here, we characterize the microstructure, tensile properties, and most importantly, the elastic plastic fracture toughness of the WHAs. Our previous studies characterizing 90–97W WHAs showed that the maximum load fracture toughness (KJm) was similar in alloys with 90 to 95W but was lower at 97W [14]. As lower Ni contents and higher KJm are desirable, we explore the potential for improving the KJm of a series of WHAs, including a lower Ni content 95 and 97W, using vacuum annealing at 1300 °C for 24 h.
The detailed microstructural observations show annealing has little effect on the WHA microstructure—W particle size, contiguity, DP phase compositions, area fraction, and thickness. Note, unless otherwise stated, here, annealing (AN) indicates a 1300 °C/24 h condition. Vickers microhardness (HV) was used to probe individual W, the ductile phases, and the WHA composite. Annealing decreases HV in all cases, especially at higher W contents. The RT tensile 0.2% yield strength (σy) of all the WHAs and the total elongation (ε) of the 90 and 92.5W WHAs were only weakly dependent on annealing, with the most significant effect for the 97W. However, annealing the 95 and 97W alloys nearly doubles their respective tensile ductility.
The as-sintered (AS) RT fracture toughness of 3PB bars with nominal length/width/thickness dimensions of ≈ 16/3.3/1.65 mm (with a designated size of 1×) to 110/25.4/12.7 mm (8×) [27]. Note, there is a significant KJm decrease between the 1× and 3× specimens (up to 45% drop), with minimal KJm variations between the 3× and 8× specimens (less than 5%) [27]. Note, the ASTM E1921 standard was used to evaluate the maximum load elastic KIm and elastic–plastic KJm toughness [28]. Annealing was carried out on the 1× and 4× (60/12.7/6.35 mm) 90–97W specimens. Annealing improved the RT KJm of all WHAs, especially the 97W alloy, in this case by ≈42%. The enhanced toughening is primarily due to enhanced process zone microcracking and dilatation. Annealing results in an increased amount of more widely distributed microcracking. Annealing also reduced the high fraction of cleavage fracture peculiar to the 97W AS condition. Finally, a lower temperature and shorter time anneal of 1100 °C/1 h (labeled 111) and 1200 °C/1 h (labeled 121) did not affect KJm but slightly improved KIm compared to the AS 3× 97W condition.
2. Materials and Methods
Details of material acquisition, specimen fabrication, microstructural observation, precracking, and mechanical testing procedures can be found elsewhere [14,27]. Briefly, four commercially available 90, 92.5, 95, and 97 wt.% W, with a balance of DP (Ni/Fe = 7/3 ratio), are described as 90W, 92.5W, 95W, and 97W, respectively. Table 1 summarizes the compositions and densities of these WHAs. The WHAs were acquired from Mi-Tech Metals, Indianapolis, IN, USA, as liquid-phase sintered plates. The electrical discharge machining (EDM)-fabricated AS specimens were ground using 220 to 2000 grit silicon carbide sandpaper to remove any EDM damage, residual stress, and surface oxides, followed by 10 min ultrasonic vibration clean in acetone and testing for as-sintered (AS) condition. Acetone-cleaned molybdenum sheet (purity > 99.95%) on an alumina tray (purity > 99.8%) was used to house some of these cleaned AS specimens in a vacuum chamber during annealing in a vacuum resistance furnace. All the specimens were annealed (AN) at 1300 °C for 24 h, except two 4× 97W that were annealed at 1 h for 1100 and 1200 °C. A 5 °C/min heating and cooling rate was used.
Microstructural characterization, including optical, scanning electron microscopy (SEM), energy dispersive spectroscopy (EDS), and electron backscatter diffraction (EBSD) was carried out on the pre-and post-annealed conditions. The W-particle diameter (Dw), W-W contiguity, DP composition, DP area fraction, ligament thickness (t), ligament thickness to W-particle diameter ratio (t/DW), and local fracture modes were observed and analyzed using imageJ64 software. Vickers microhardness (HV) was probed on both individual W and ductile phases at low load (10gf) and the composites at 500gf load, both for the AS and AN conditions. Uniaxial tensile tests at RT were carried on EDM-fabricated flat dog-bone-shaped sub-sized SSJ2 specimens with a nominal gauge section length/width/thickness dimension of 5.0/1.2/0.5 mm [14,29]. A servo-hydraulic (model: MTS 810) universal testing machine was used to perform the tensile test at a strain rate of 10−3/s in accordance with the ASTM E8 standard [30].
The RT fracture toughness tests on the WHAs were conducted on fatigue precracked 3PB bars, with nominal dimensions (length/width/thickness) of 1× ≈ 16/3.3/1.65 mm, 3× ≈ 50/10/5 mm, and 4× ≈ 60/12.7/6.35 mm. All the specimens were fatigue-precracked to a/W ≈0.4 to 0.5 at 20 Hz at a maximum ∆KI ≈ 15 MPa√m and a load ratio R ≈ 0.1. The bend test load (P) and load-point displacements (d) were measured, and KJm was defined as the maximum load (Pm) based on the ASTM E1921 standard practice method of estimating the J-integral elastic–plastic fracture toughness: Jm = Je + Jp; KJm = √{EJm/(1−ν2)}; Je = KIm2(1−ν2)/E. Here, KIm is the elastic stress intensity factor at maximum load, Jp = 2AP/Bbo [28], B is specimen thickness, bo is the initial unbroken ligament dimension, and Ap is the plastic area under the load-displacement curve [28,31,32]. It is also of interest to compare normalized P/Po –d/S curves by dividing P by the plane strain limit load Po [27,31] and d by the bend bar span, S. It is important to note that most tests that were not interrupted shortly beyond the maximum load involved at least some ductile tearing. Further details of toughness characterization procedures are reported in [27]. At least four specimens were characterized for 1× AS and AN and 3× AS conditions, and two specimens for 4× AN conditions. Additionally, two of the 4× 97W specimens were annealed at 1100 and 1200 °C/1 h and were tested at RT.
3. Results
3.1. Microstructural Characterization
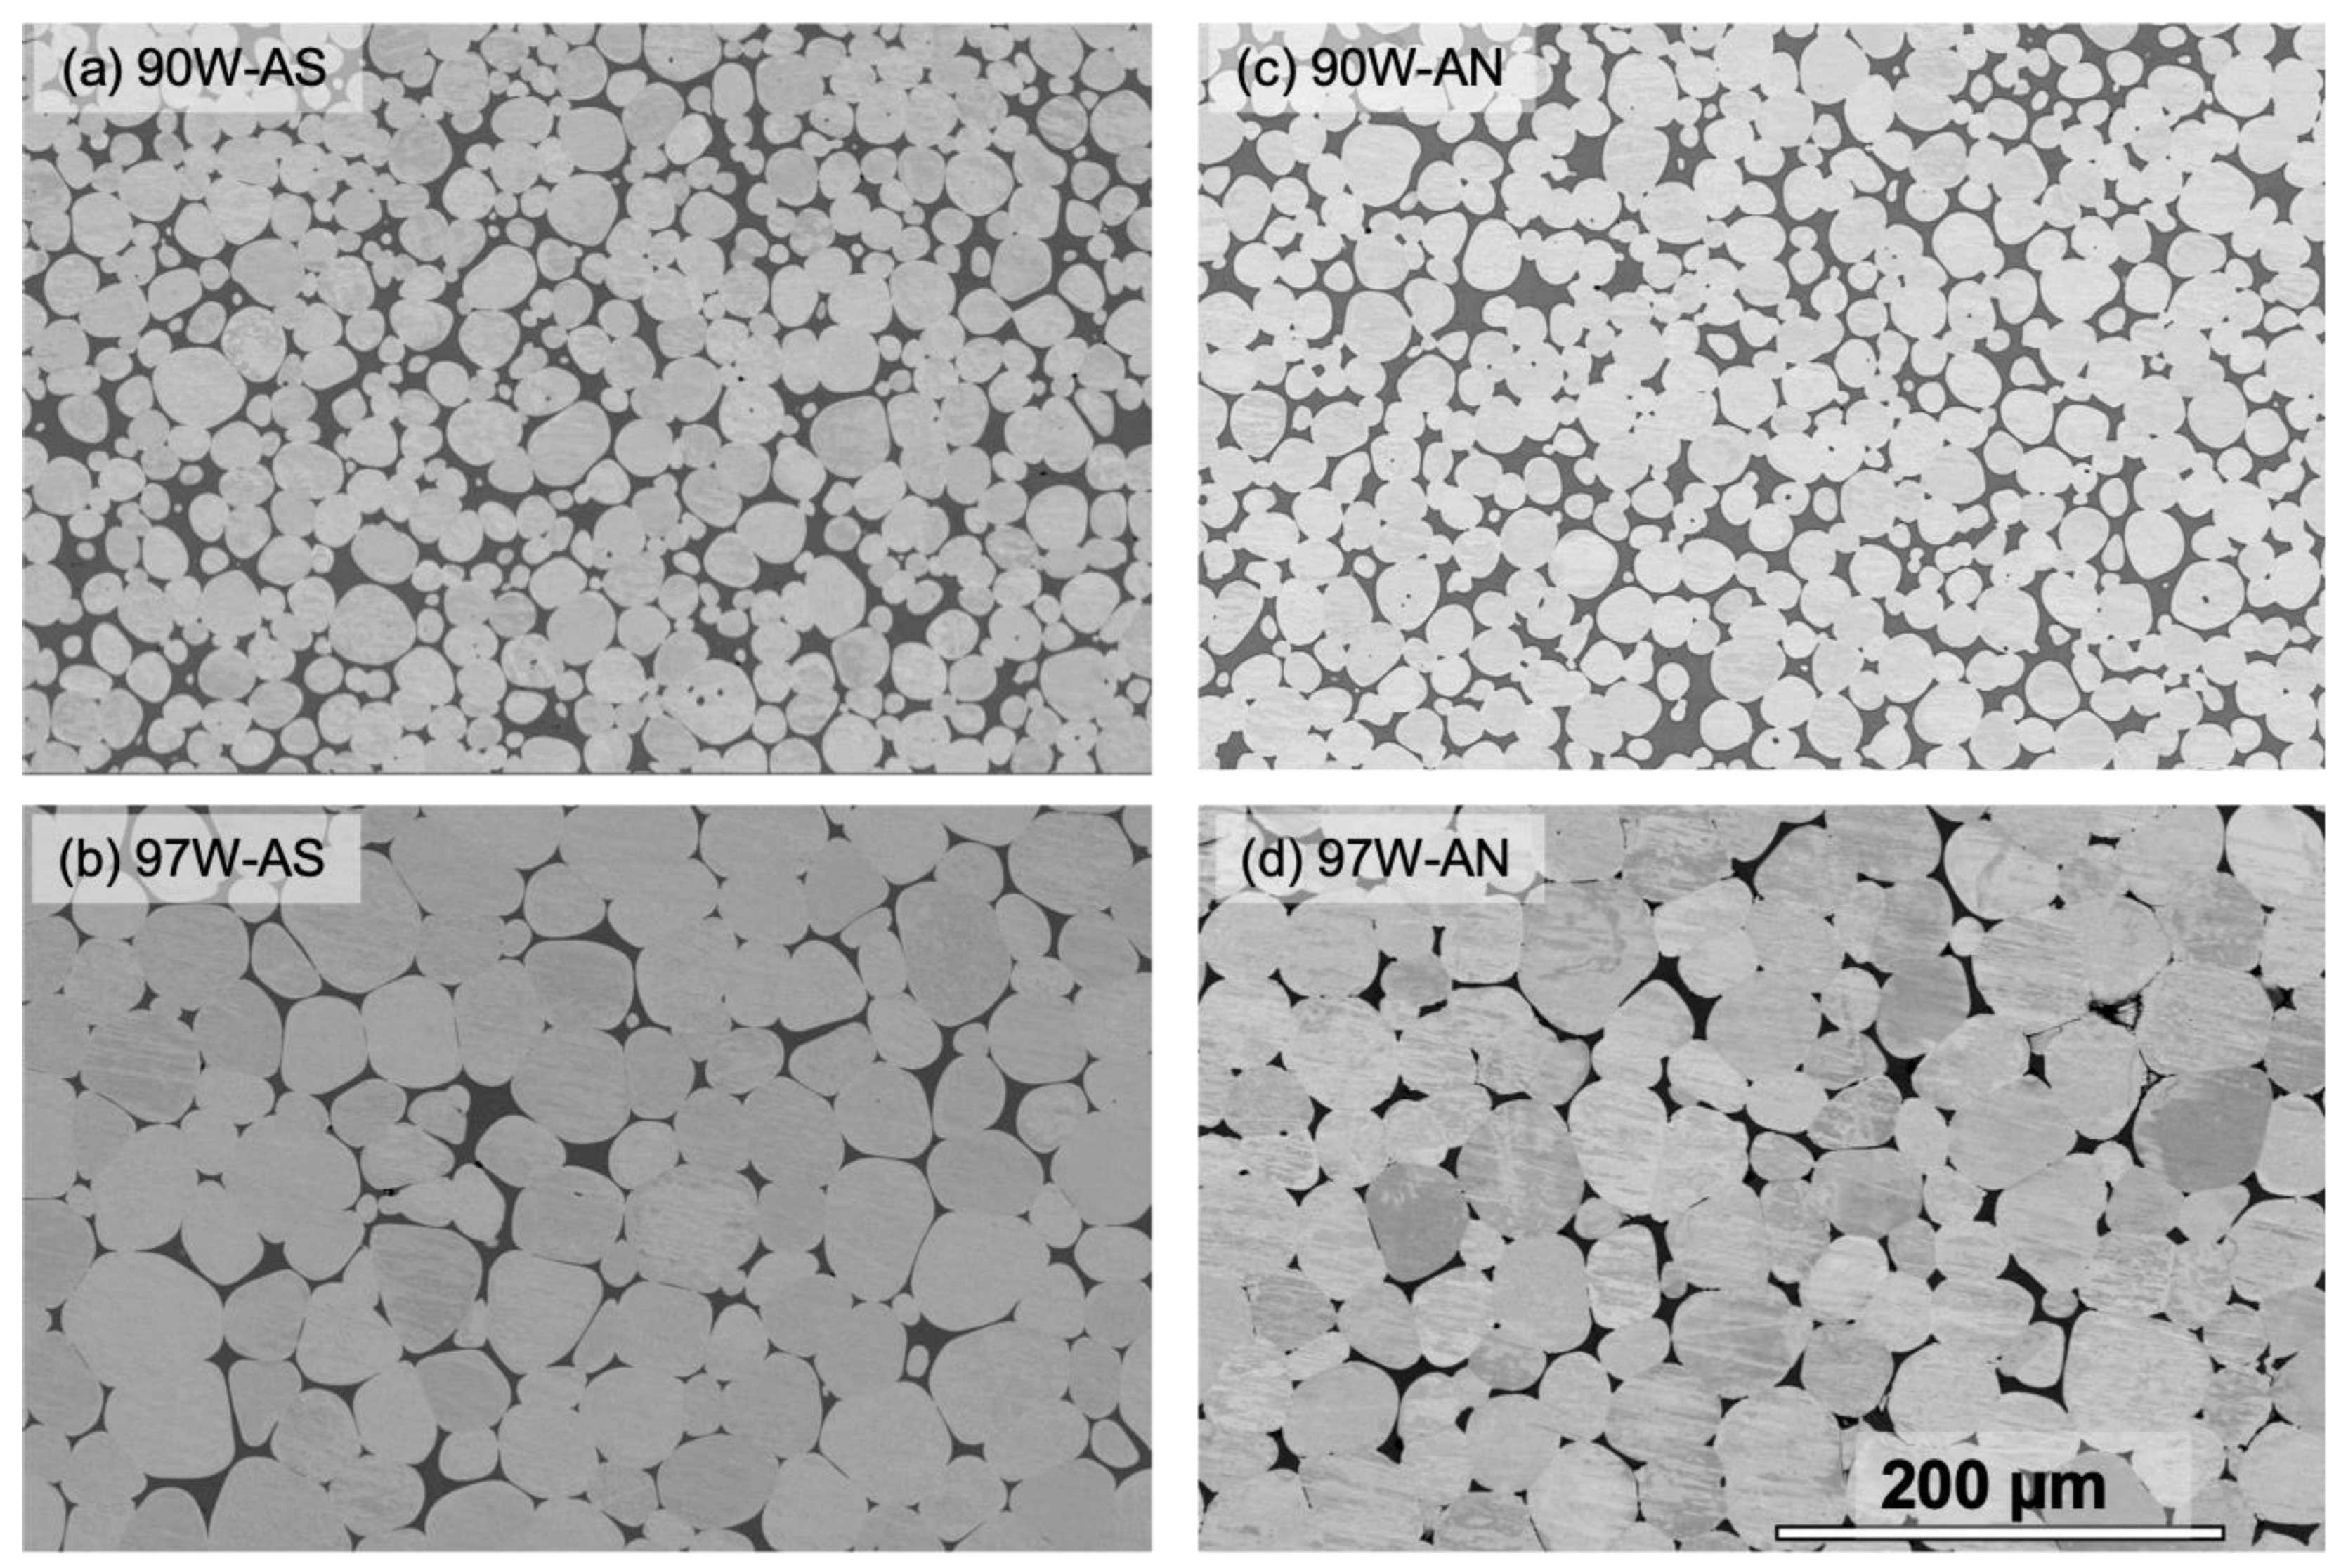
Figure 1 shows the SEM micrographs of the polished and etched 90 and 97W WHAs before (Figure 1a,b) and after (Figure 1c,d) annealing. The SEM micrographs of the W particles and DP morphology for all four alloys are shown in Supplementary Materials, Figure S1. The microstructural observation results are summarized in Table 2. In all cases, the W particles are roughly spheroidal, surrounded by an interconnected honeycomb web of DP. The multiple-point EDS scans reveal that the particles are nearly 100% W, irrespective of the alloy compositions or annealing conditions. The size of the W particles does not change before and after annealing but increases with the W content: ≈ 17 ± 7 µm for 90W to ≈ 38 ± 15 µm for 97W, as shown in Table 2 and Figure 1. The DP fraction (%) is also unaffected by annealing. The multiple-point EDS scans on the ductile phase show that the DP composition is also unaffected by annealing, averaging ≈ 52% Ni, 31% W, and 17% Fe (AN) versus 50% Ni, 32% W, and 18% W (AS) by wt., as shown in Supplementary Materials, Table S1 and Figure S2. The W–W contiguity increases with W but remains unchanged after annealing for the 90 to 95W; it appears to decrease slightly for the 97W from 0.58 to 0.48 (≈18%). The DP ligament thickness (t) is similar in all the WHAs and pre- and post-annealing conditions. However, these size ratios are unaffected by annealing.
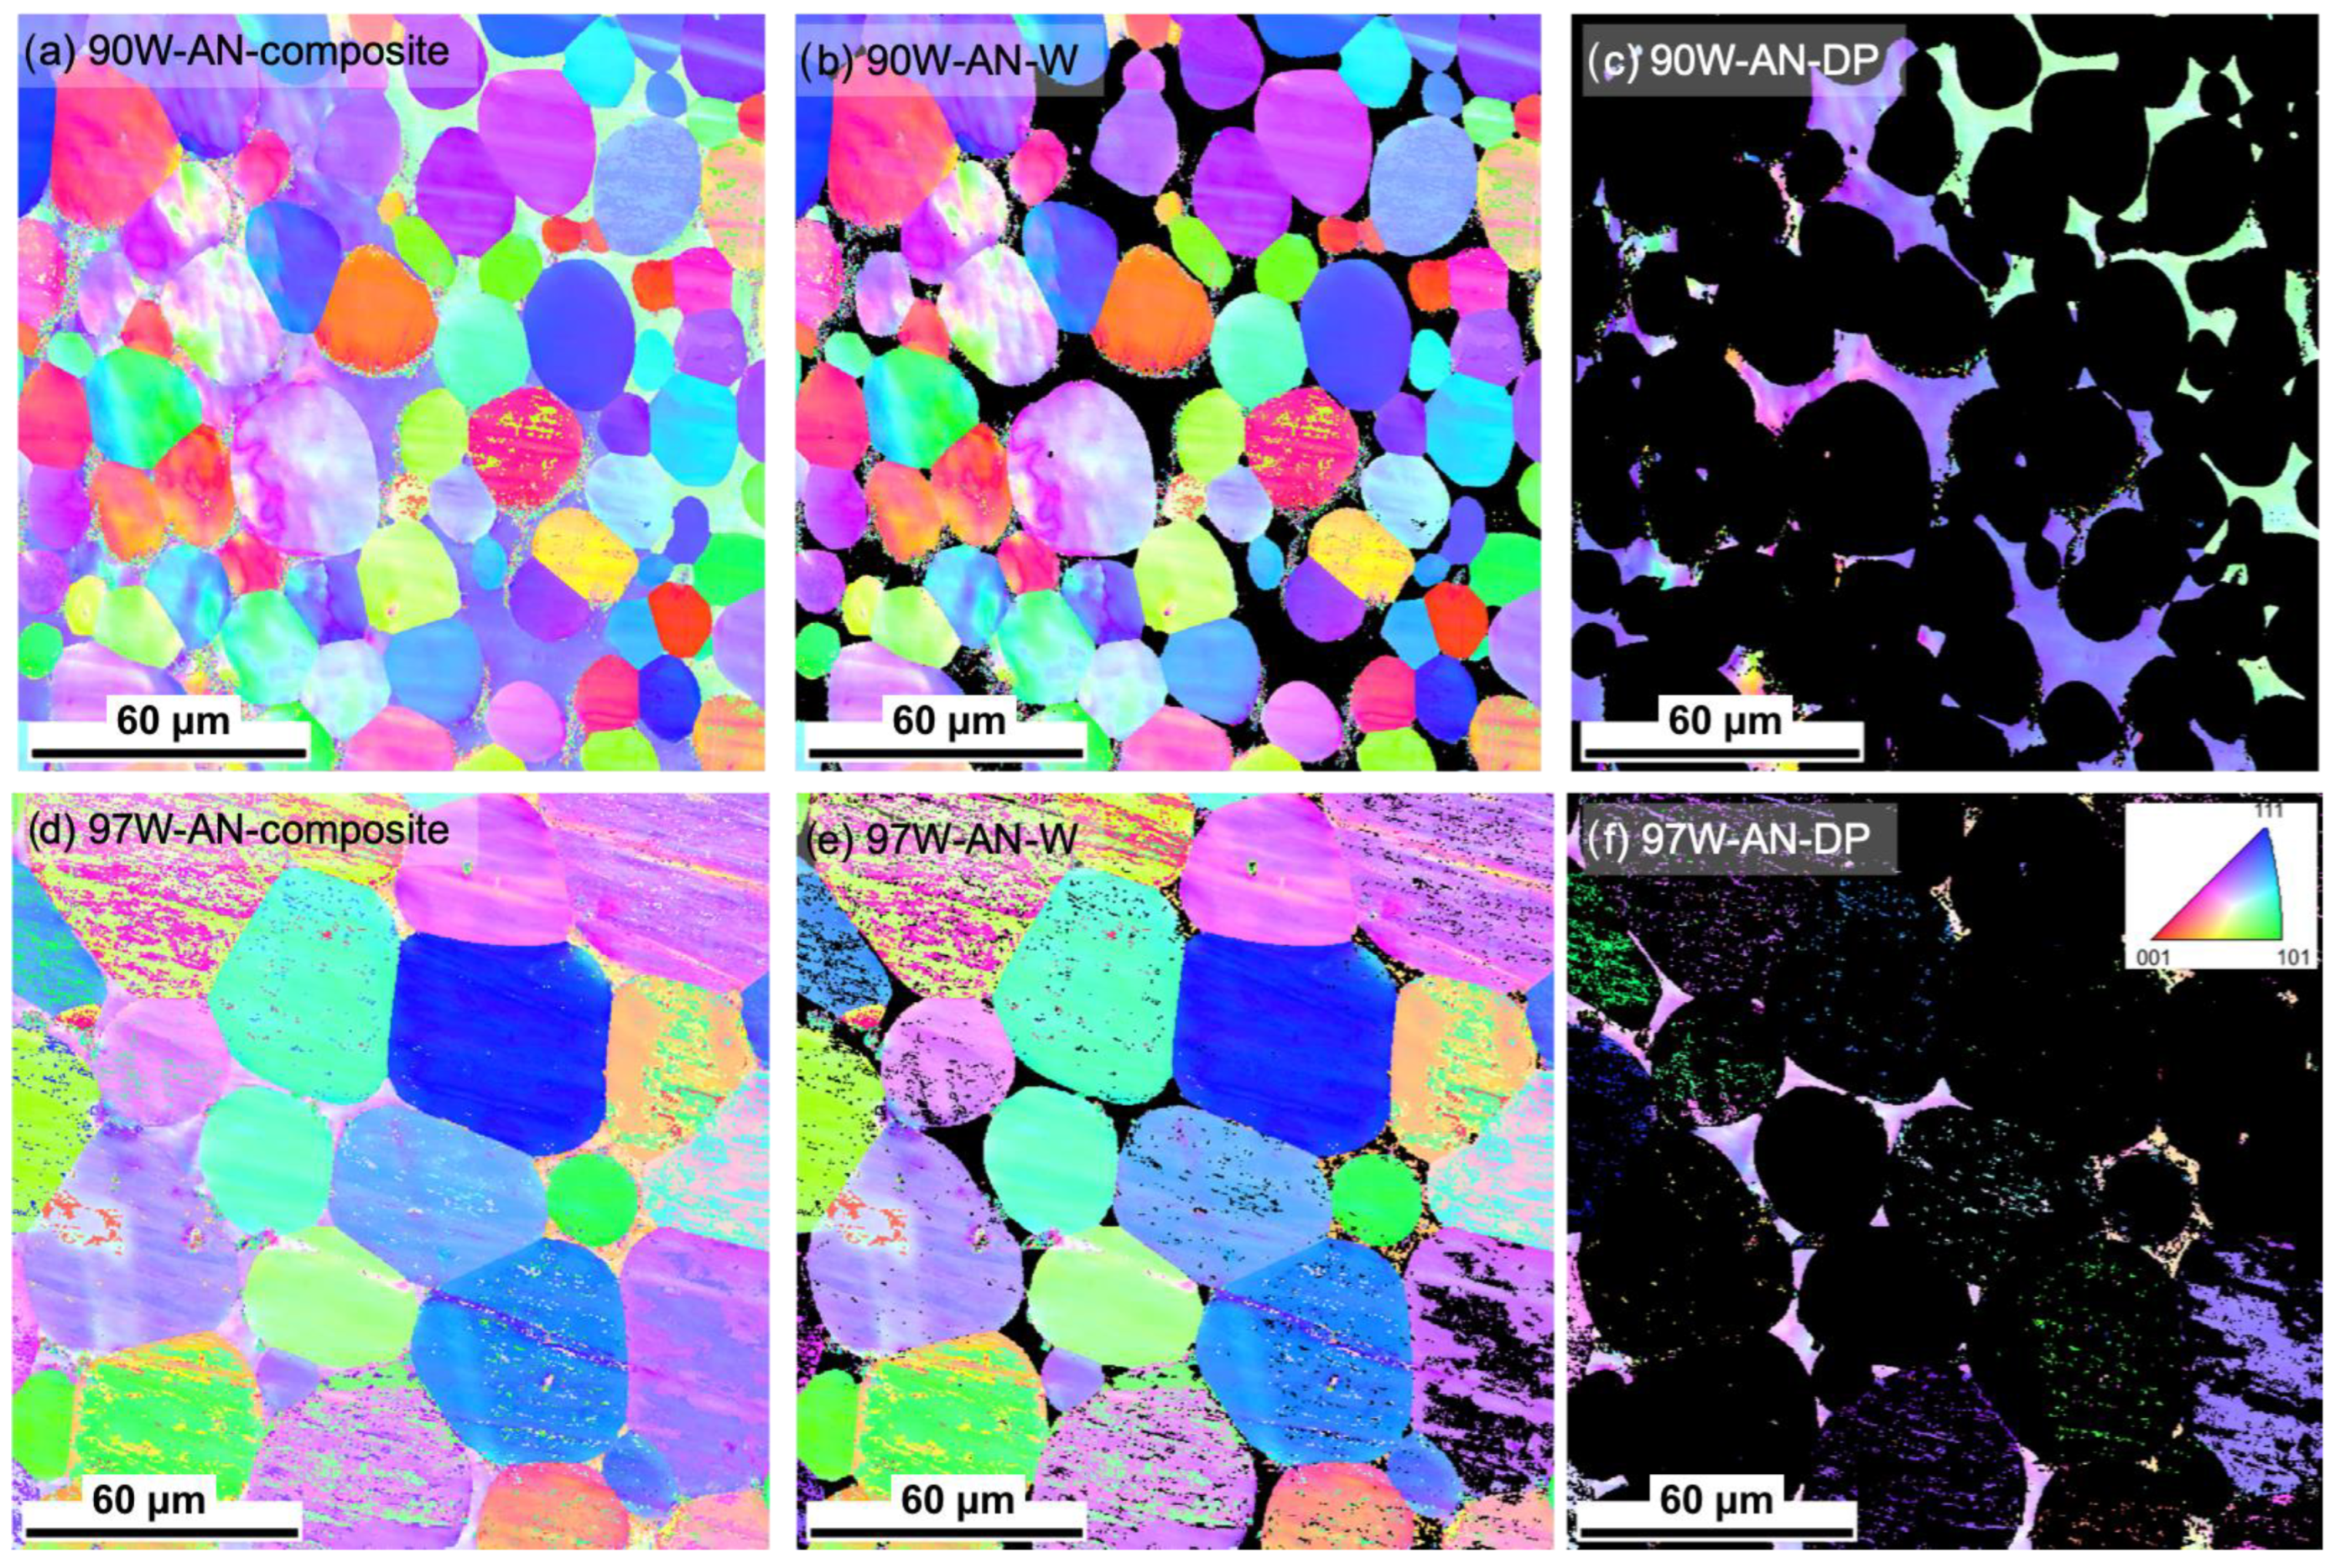
The selective EBSD on the 90 and 97W alloys was characterized to observe possible texture development after annealing. The inverse pole figure (IPF) maps shown in Figure 2 for the annealed 90 and 97W reveal that the W particles remain randomly oriented and the DP is coarse-grained. High misorientation angles (>15°) were not observed in the W particles. These results are similar to the observations on AS 90 and 97W WHAs, reported in [33]. In summary, 1300 °C/24 h annealing has little to no effect on the WHA microstructures examined using SEM, EDS, and EBSD.
3.2. Microhardness and Tensile Tests
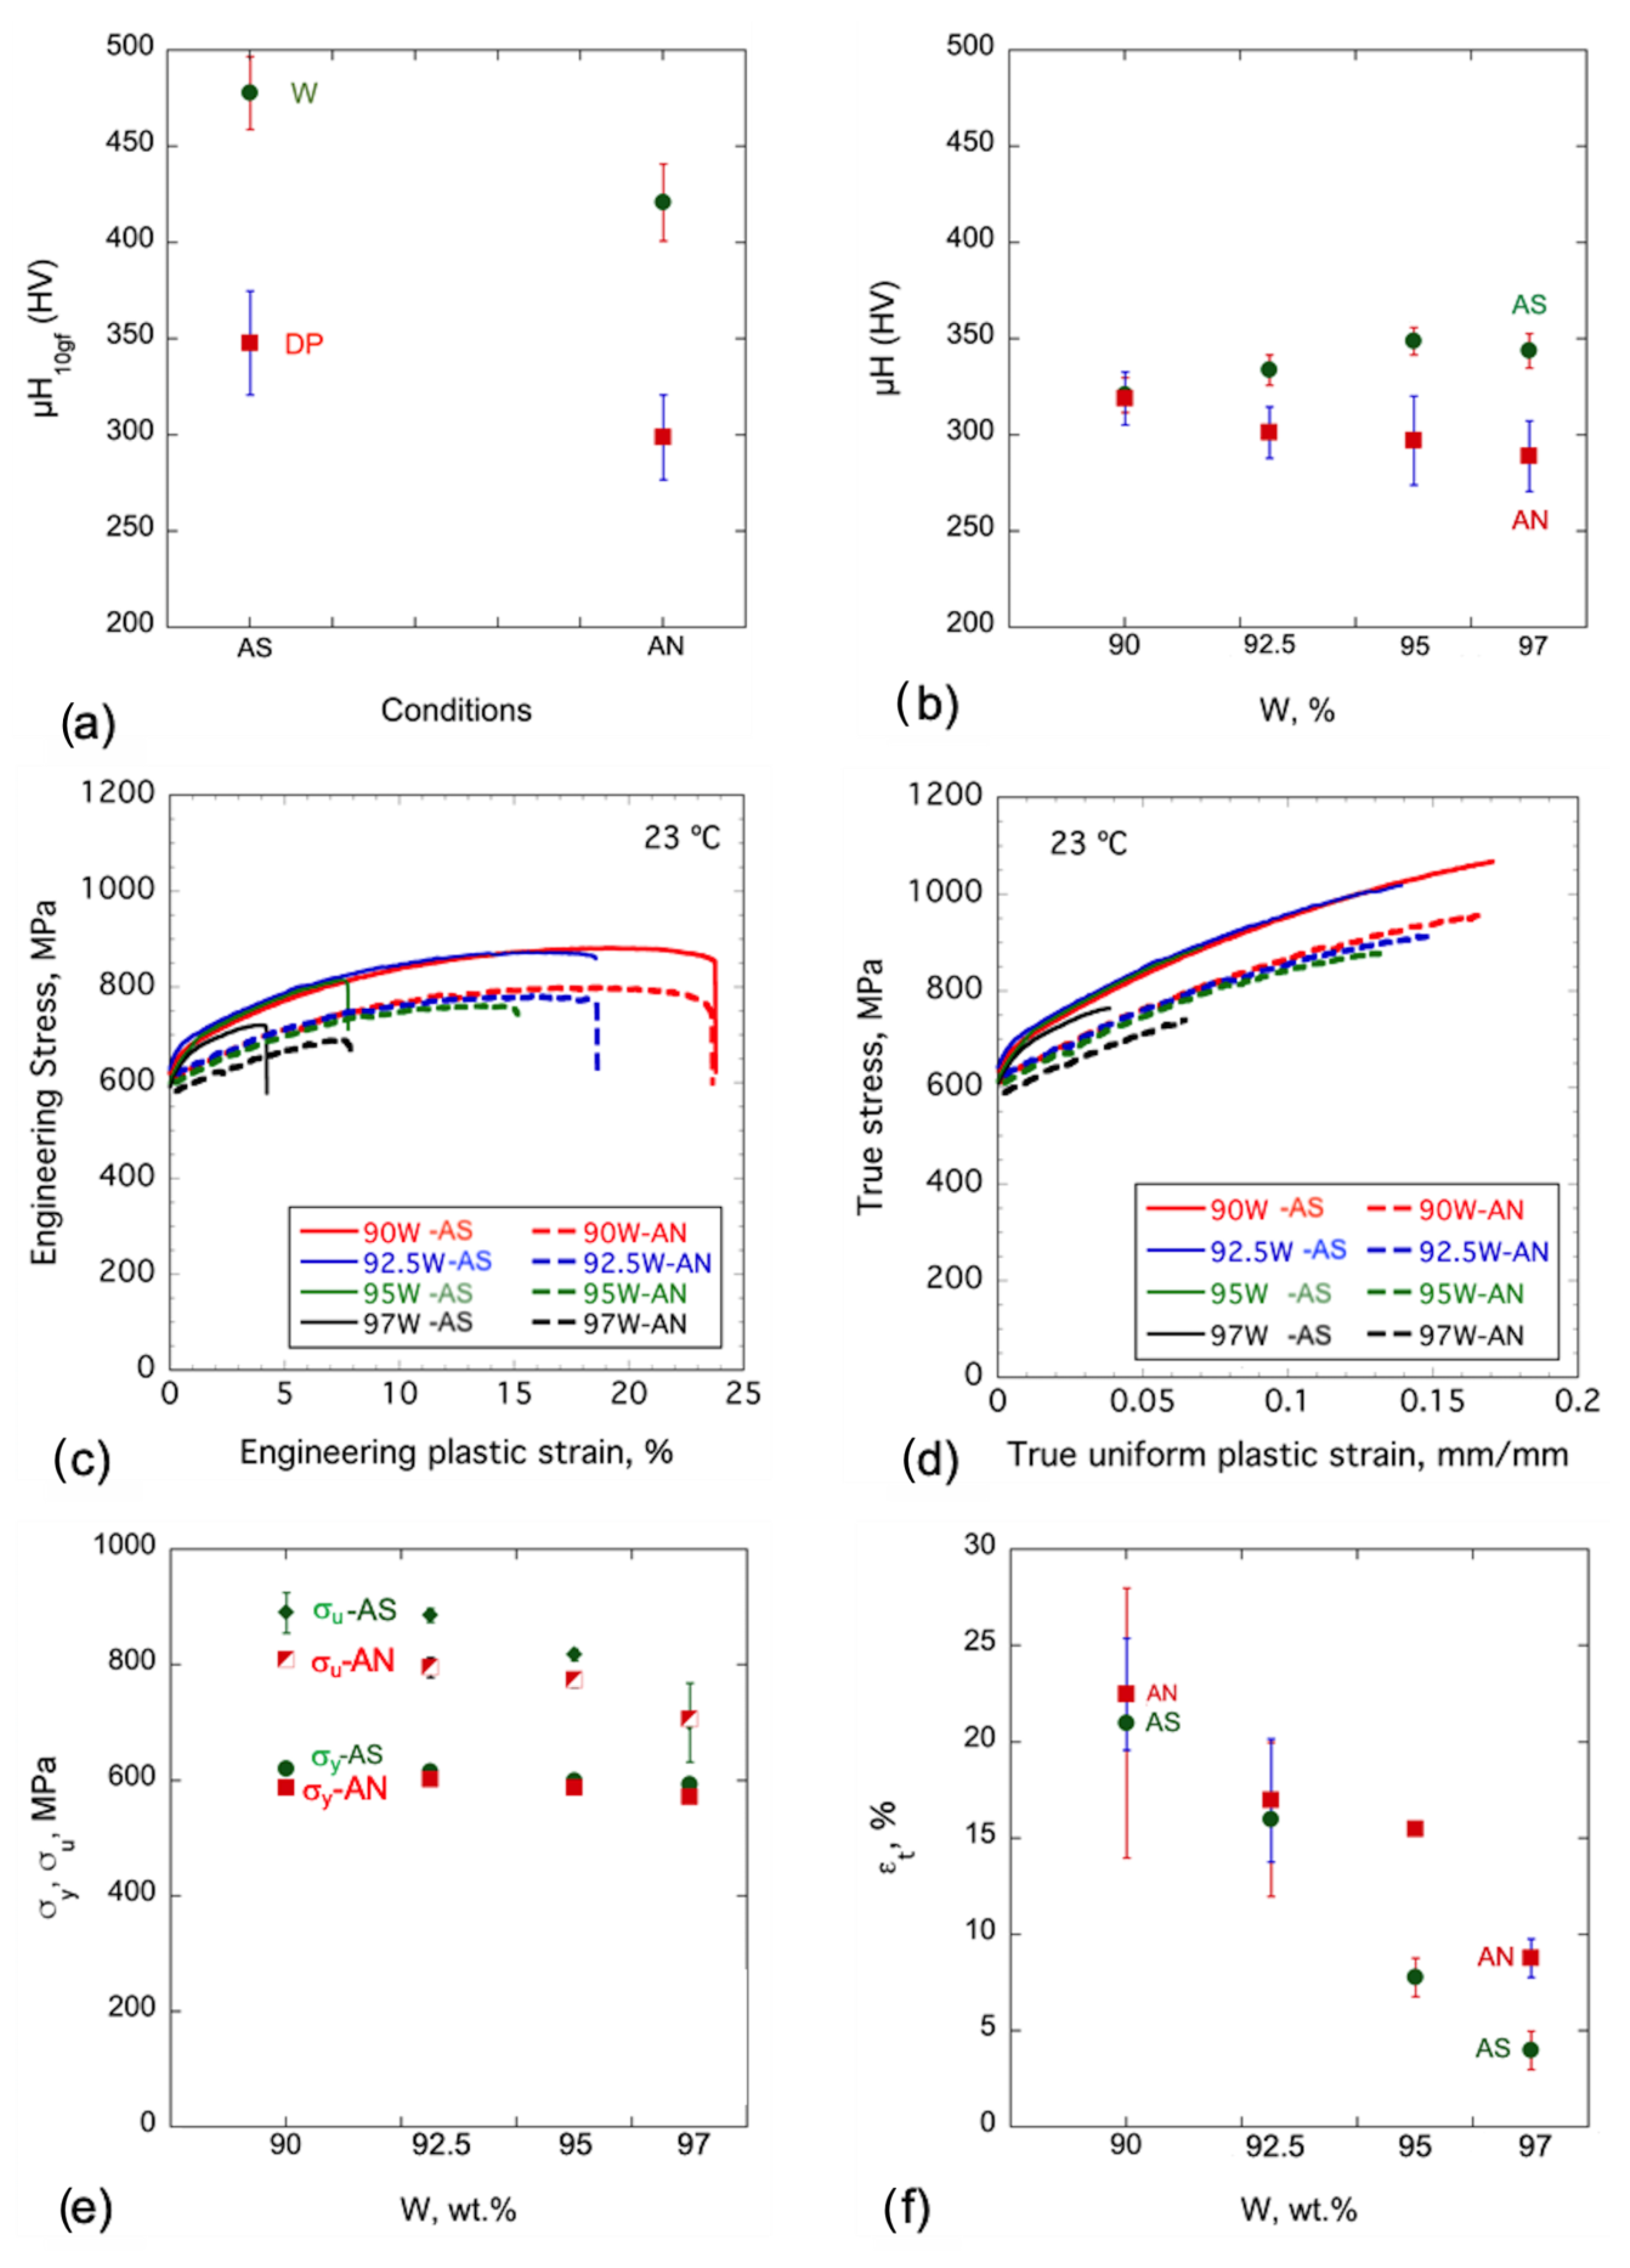
Room temperature Vickers microhardness (HV) measurements were performed on individual W particles, DP regions, and the composite in both the AS and AN conditions. A low 10gf load was used to probe the DP and W particles. Figure 3a shows the AS W and DP HV ≈ 478 ± 19 and 348 ± 27 kgf/mm2, respectively. After annealing, the HV decreases to 421 ± 20 kgf/mm2 (≈ 12%) and 299 ± 22 kgf/mm2 (≈ 14%) in the W particles and the DP, respectively. A 500 gf load was used to measure the WHA composite HV. While the average composite HV increases with W from 321 ± 8 kgf/mm2 for the 90W to 344 ± 9 kgf/mm2 for the 97W in the AS conditions, the opposite trend was observed for the AN conditions, decreasing from 319 ± 14 kgf/mm2 for the 90W to 289 ± 18 kgf/mm2 for the 97W alloy, as shown in Table 3 and Figure 3b.
Figure 3c shows the representative RT engineering tensile stress–plastic strain (σ−εp) curves, while Figure 3d shows the true stress–true plastic strain curves. Annealing slightly decreases σy but has a larger effect on σu due to lower initial strain hardening (Figure 3d). The corresponding σy and σu tensile properties are plotted in Figure 3e. The σy decreases slightly after annealing by <5%. The decrease in σu is larger up to 92.5W, with a drop of 11%, closes the gap thereafter, and equals 97W due to an increase in σt (see Table 3 and Figure 3e). Table 3 and Figure 3d also show the average flow stress (σfl) between 0 and 0.1 true plastic strain. Note that the flow stress (σfl) curves are linearly extrapolated for tests that fractured at less than 0.1 true fracture strain. The average σfl for all the WHAs decreases ≈ 6.4% following annealing. HV depends on, and can be correlated with, σfl, rationalizing the observed HV decreases, while σy is less affected by annealing.
The total elongation decreases systematically with increasing W in both AS and AN conditions. Annealing has little effect on εu between 90 and 92.5W but nearly doubles this measure of tensile ductility for the 95 and 97W alloys. Notably, in all cases, the tensile data in the AN condition have lower standard deviations, suggesting that annealing might help to homogenize the microstructure and heal processing damage, which is also an issue for the toughness properties of the as-sintered condition [27].
3.3. Room Temperature (RT) Fracture Toughness
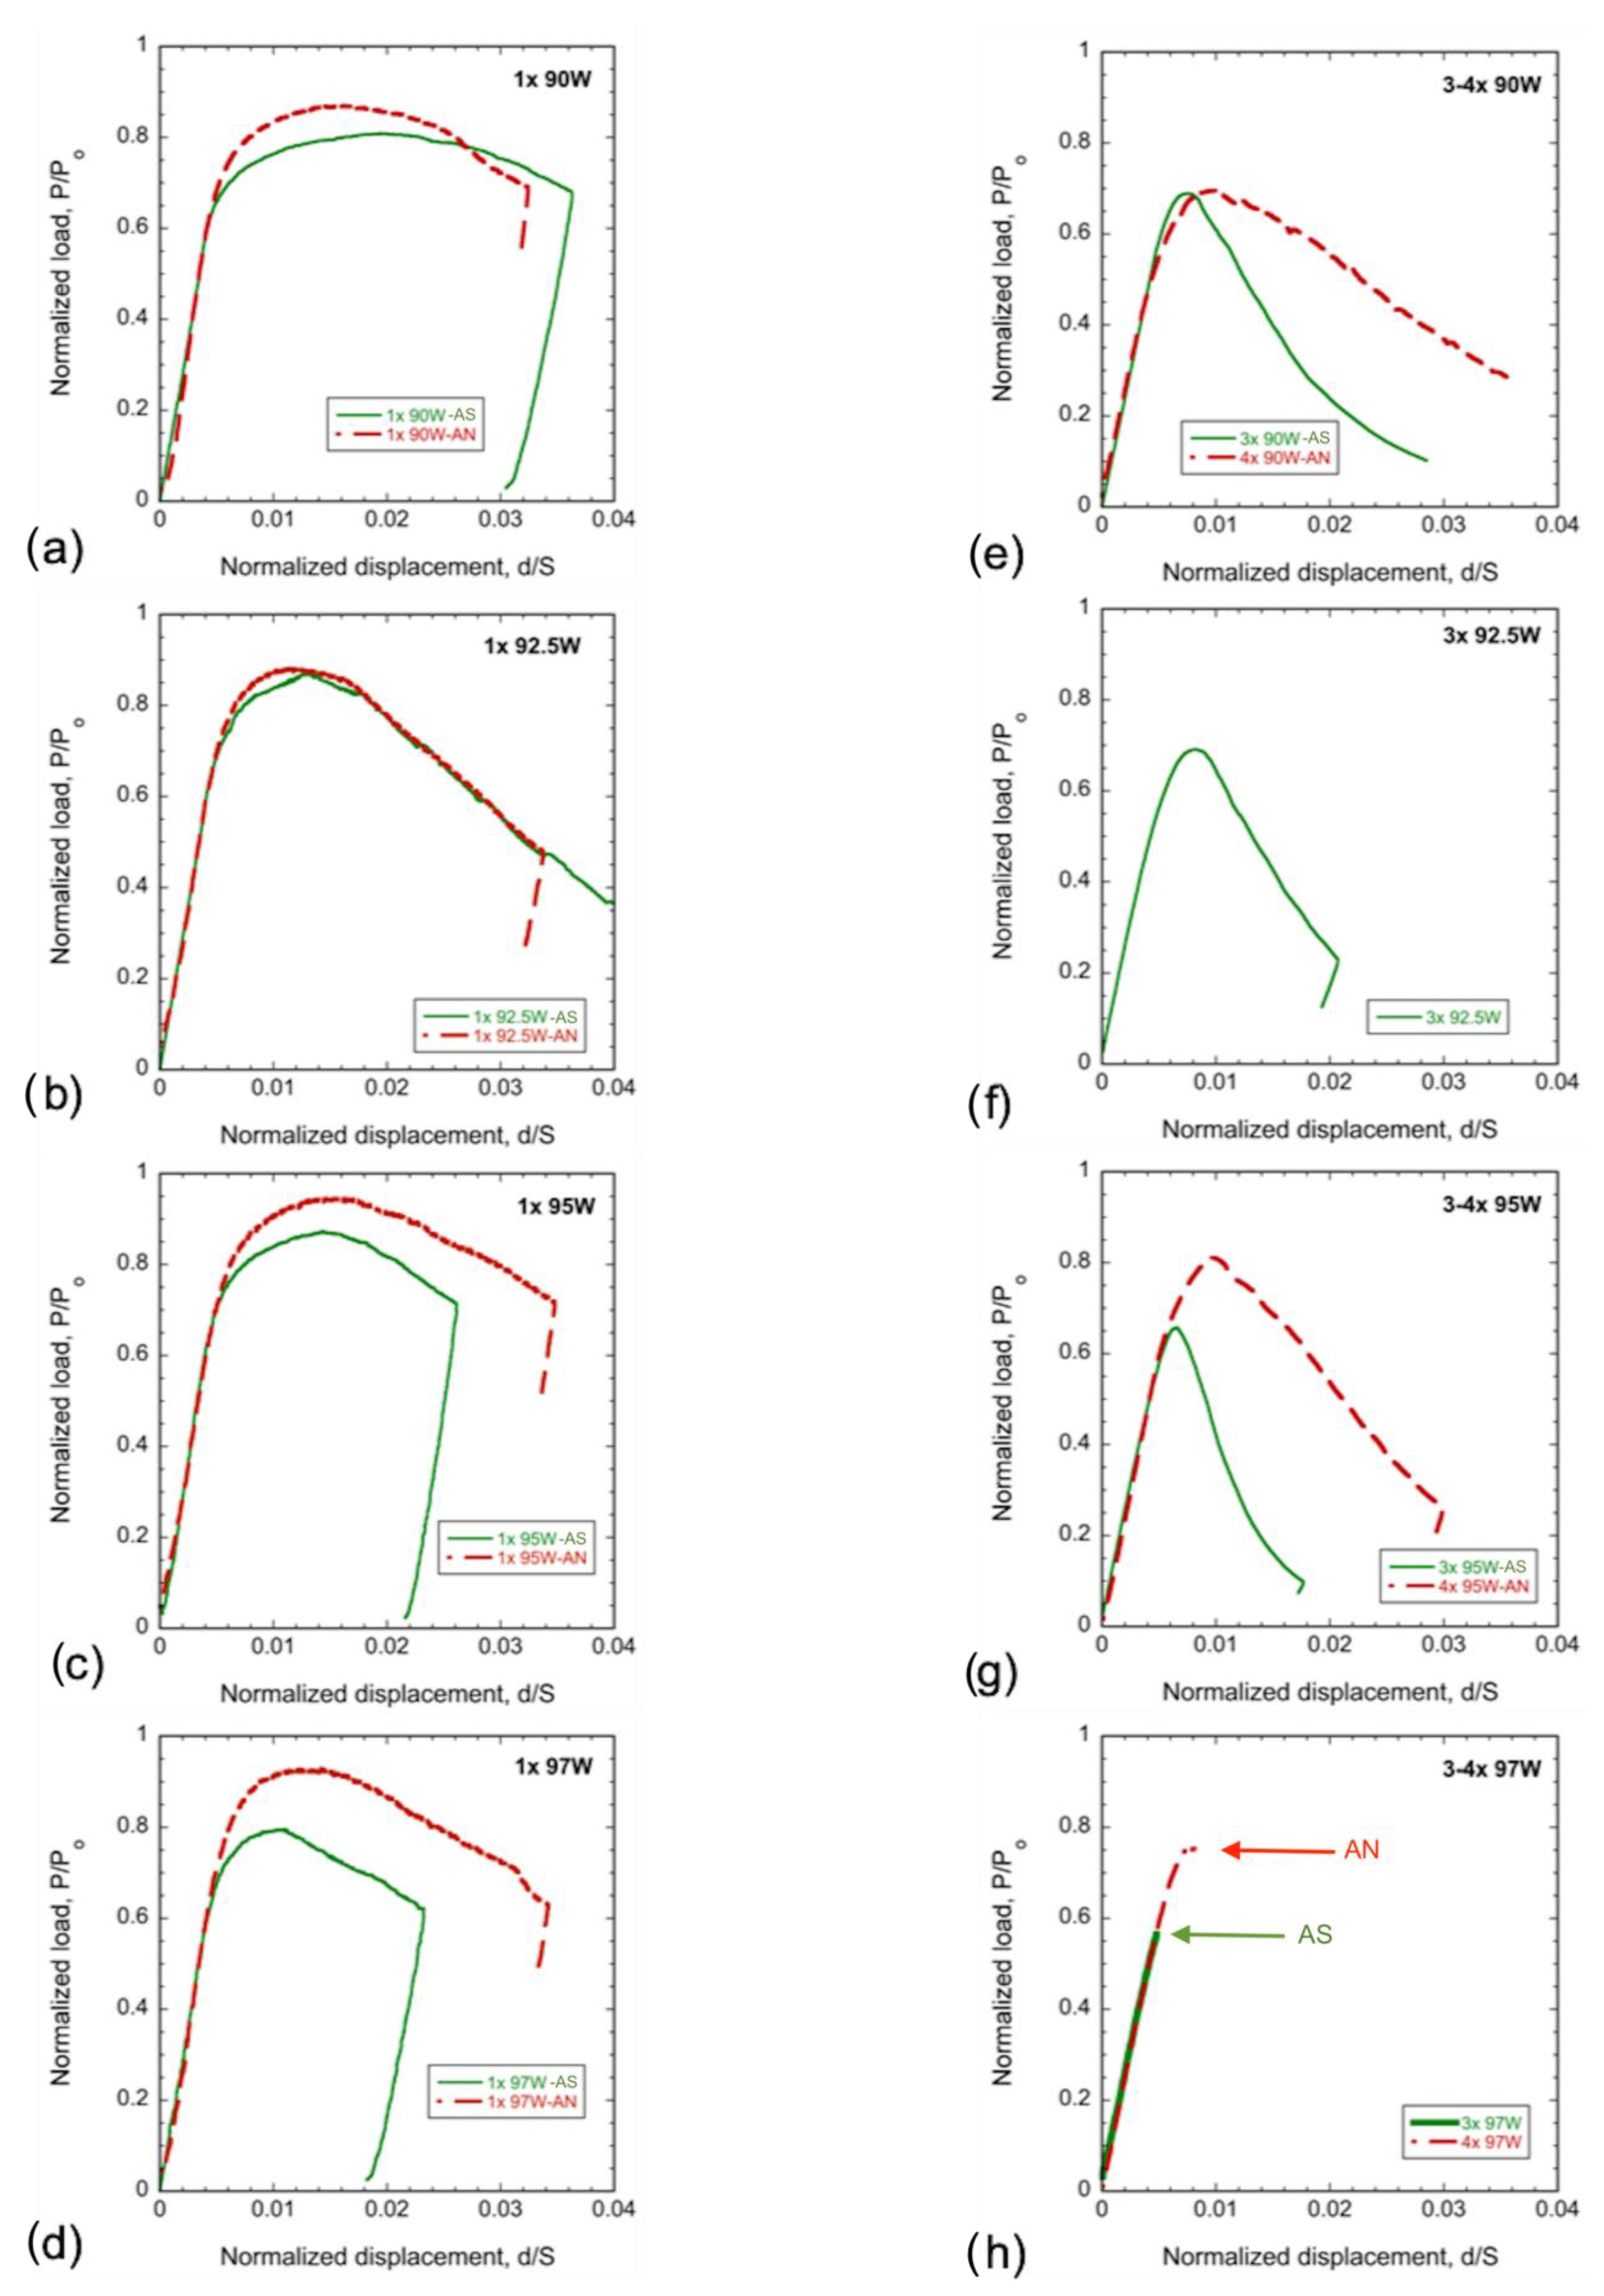
Representative normalized load displacement curves, P/Po–d/S, for the 3-point bend bar tests are plotted in Figure 4a–d (for 1×) and Figure 4e–h (for 3–4x). Here, P is the load, Po is the limit load, d is the displacement, and S is the bend bar span. As reported previously [14] and shown in Figure 4a–d, all of the AS WHAs 1× specimens show stable crack growth, signaled by gradual post-maximum load drops. The AN WHAs follow a similar P/Po–d/S trend with stable crack growth; however, the maximum P/Po is higher than for the AS condition. This is partly due to the decreased limit load (Po) for annealed specimens with lower flow stress, which, in this case, is taken as the average of σy and σu [27,31,34] (see Table 3). The d at maximum P/Po, dm, also slightly increased in the AN condition, except at 92.5W.
Figure 4e–h shows the corresponding normalized P/Po–d/S curves for the 3× AS and 4× AN WHAs. The 3× AS 90–95W specimens show stable crack growth, while the 3× 97W tests show unstable fracture [27]. The AN 4× specimens also show stable crack growth for the 90 and 95W alloys (note that the 4× 92.5W has not been annealed). In contrast, the 4× 97W AN condition shows only very limited, or no, yielding before fast, unstable fracture (Figure 4h). The 1100 and 1200 °C/1 h annealed 4× 97W specimens also elastically fracture at loads much less than Po (not shown here). As expected, the P/Po for larger specimens is lower than for the 1× specimens due to the larger crack length. Note that in all AN cases, the maximum P/Po is higher than their AS counterparts, and the d/S at maximum P/Po is also larger for cases with stable fracture.
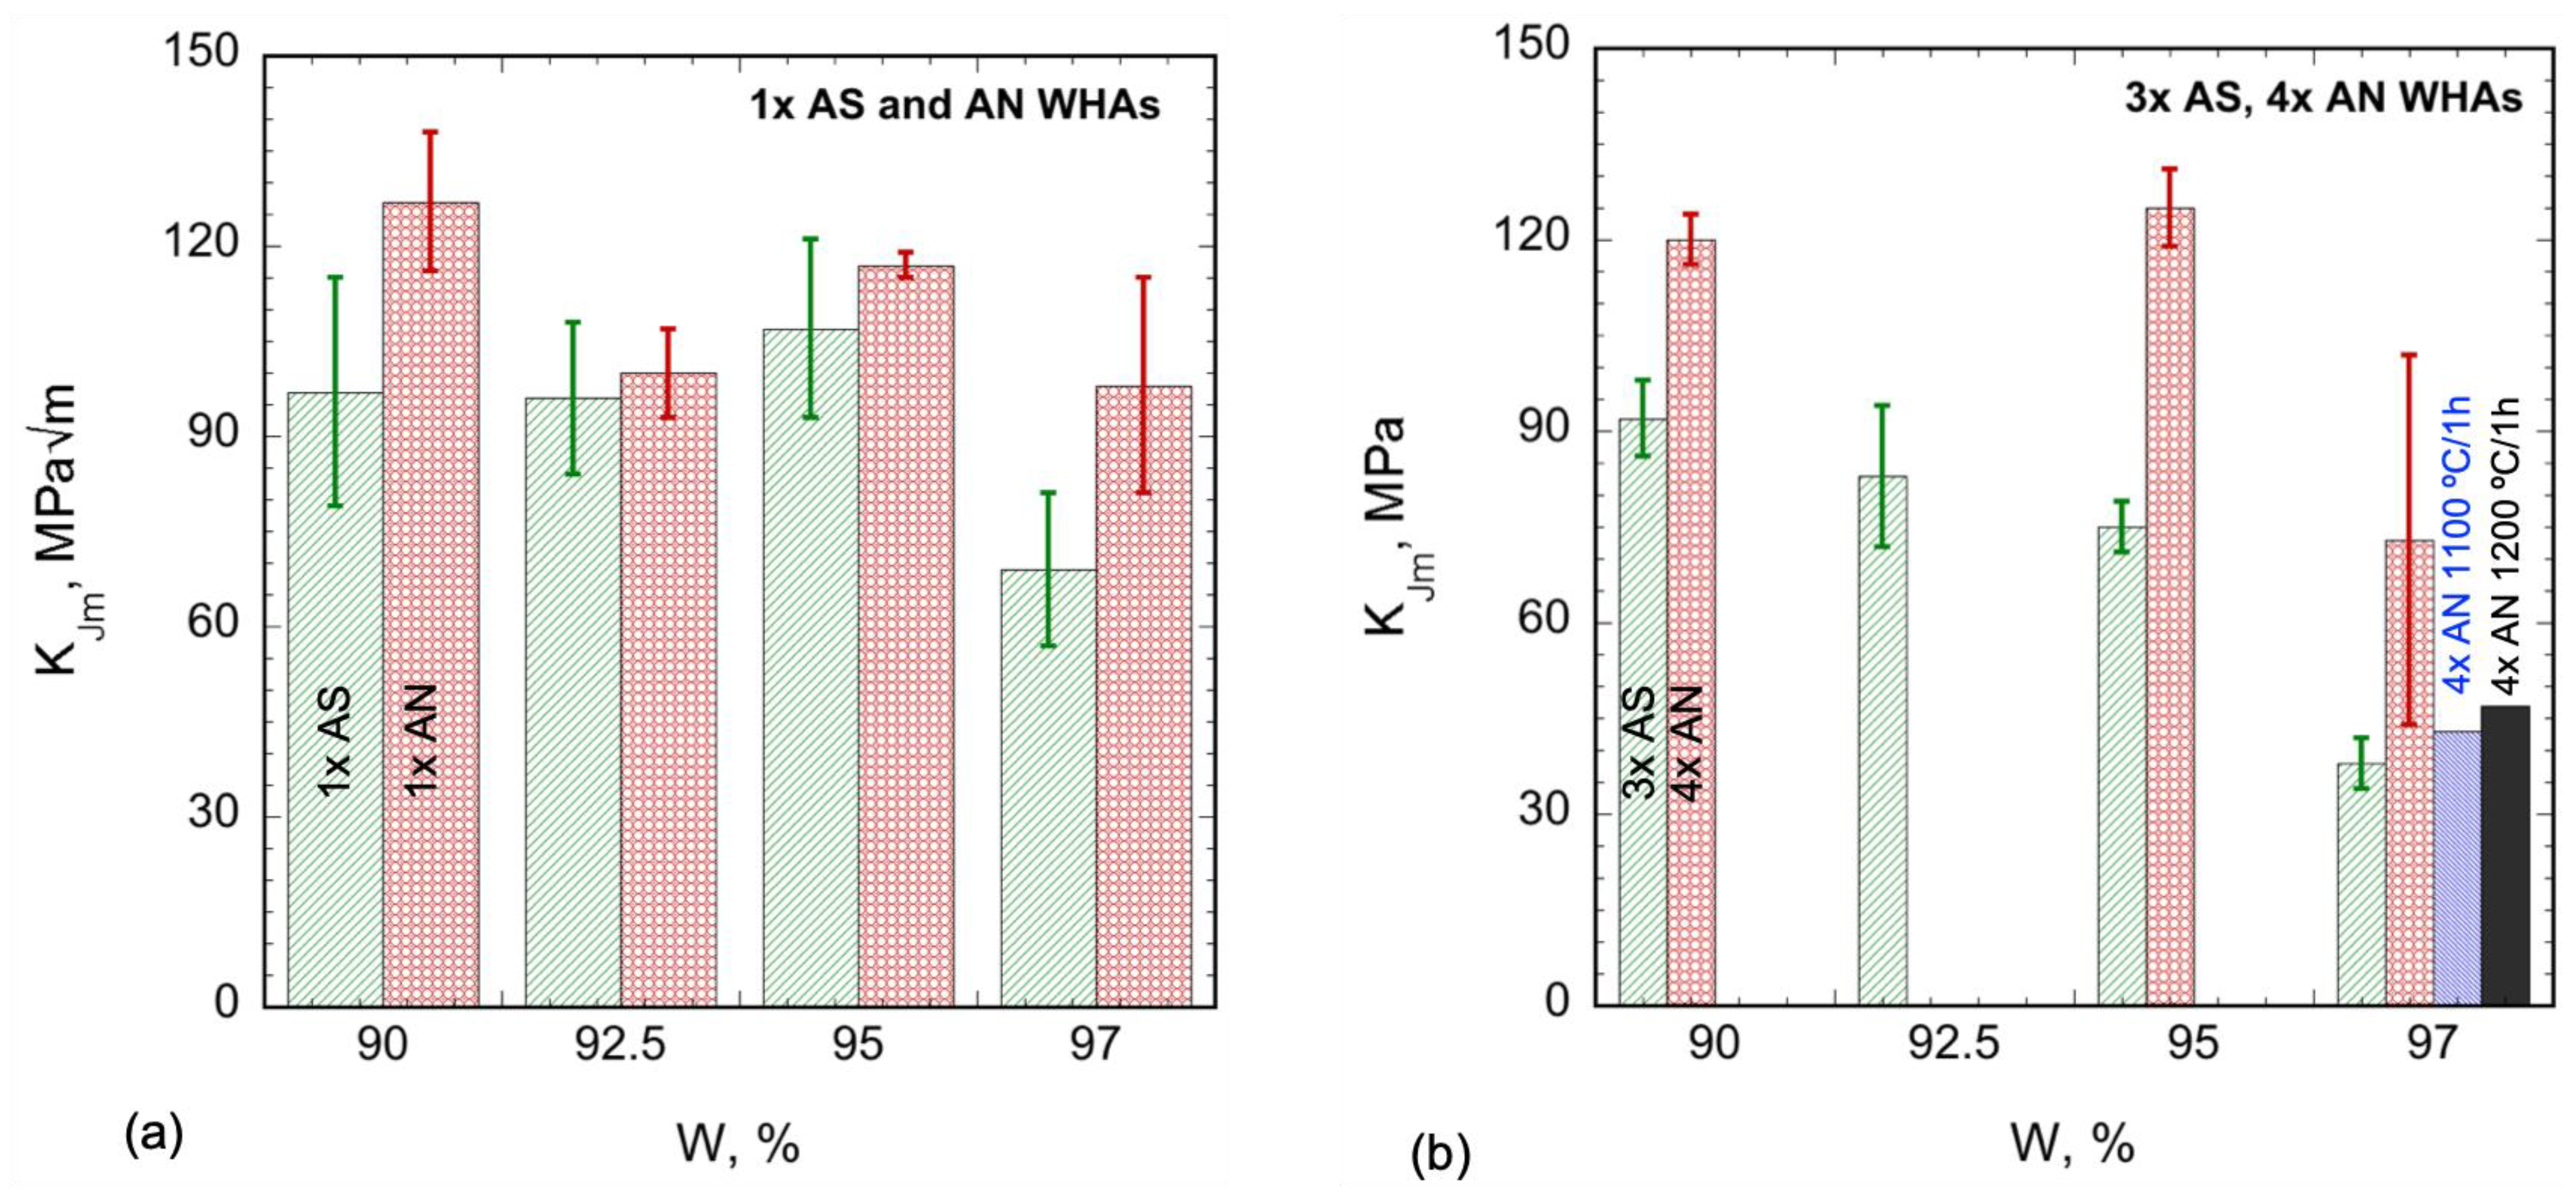
The KIm and KJm values are summarized in Table 4. Note, annealing has little effect on KIm in the 1× specimens (see Supplementary Materials, Figure S3a). However, as shown in Table 4 and plotted in Figure S3a, annealing increases KIm in the 3 and 4× tests at 95 and 97W. Figure 5a plots the 1× KJm data, showing that annealing increases the average KJm ≈ 18 MPa√m for all of the WHAs. The corresponding fractional increases are 30, 4, 9, and 42% for the 90, 92.5, 95, and 97W alloys, respectively. The significant effects of specimen size have been previously observed between the 1× and 3× specimens in the AS condition [27]. The size effects appear to be much smaller for the annealed WHAs. As shown in Table 4 and Figure 5b, annealing has a large effect on KJm, with an average increase of 38 MPa√m for the 90, 95, and 97W, representing increases in KJm of ≈32, 66, and 92%, respectively.
4. Discussion
4.1. Damage Mechanism for RT Tensile Tests
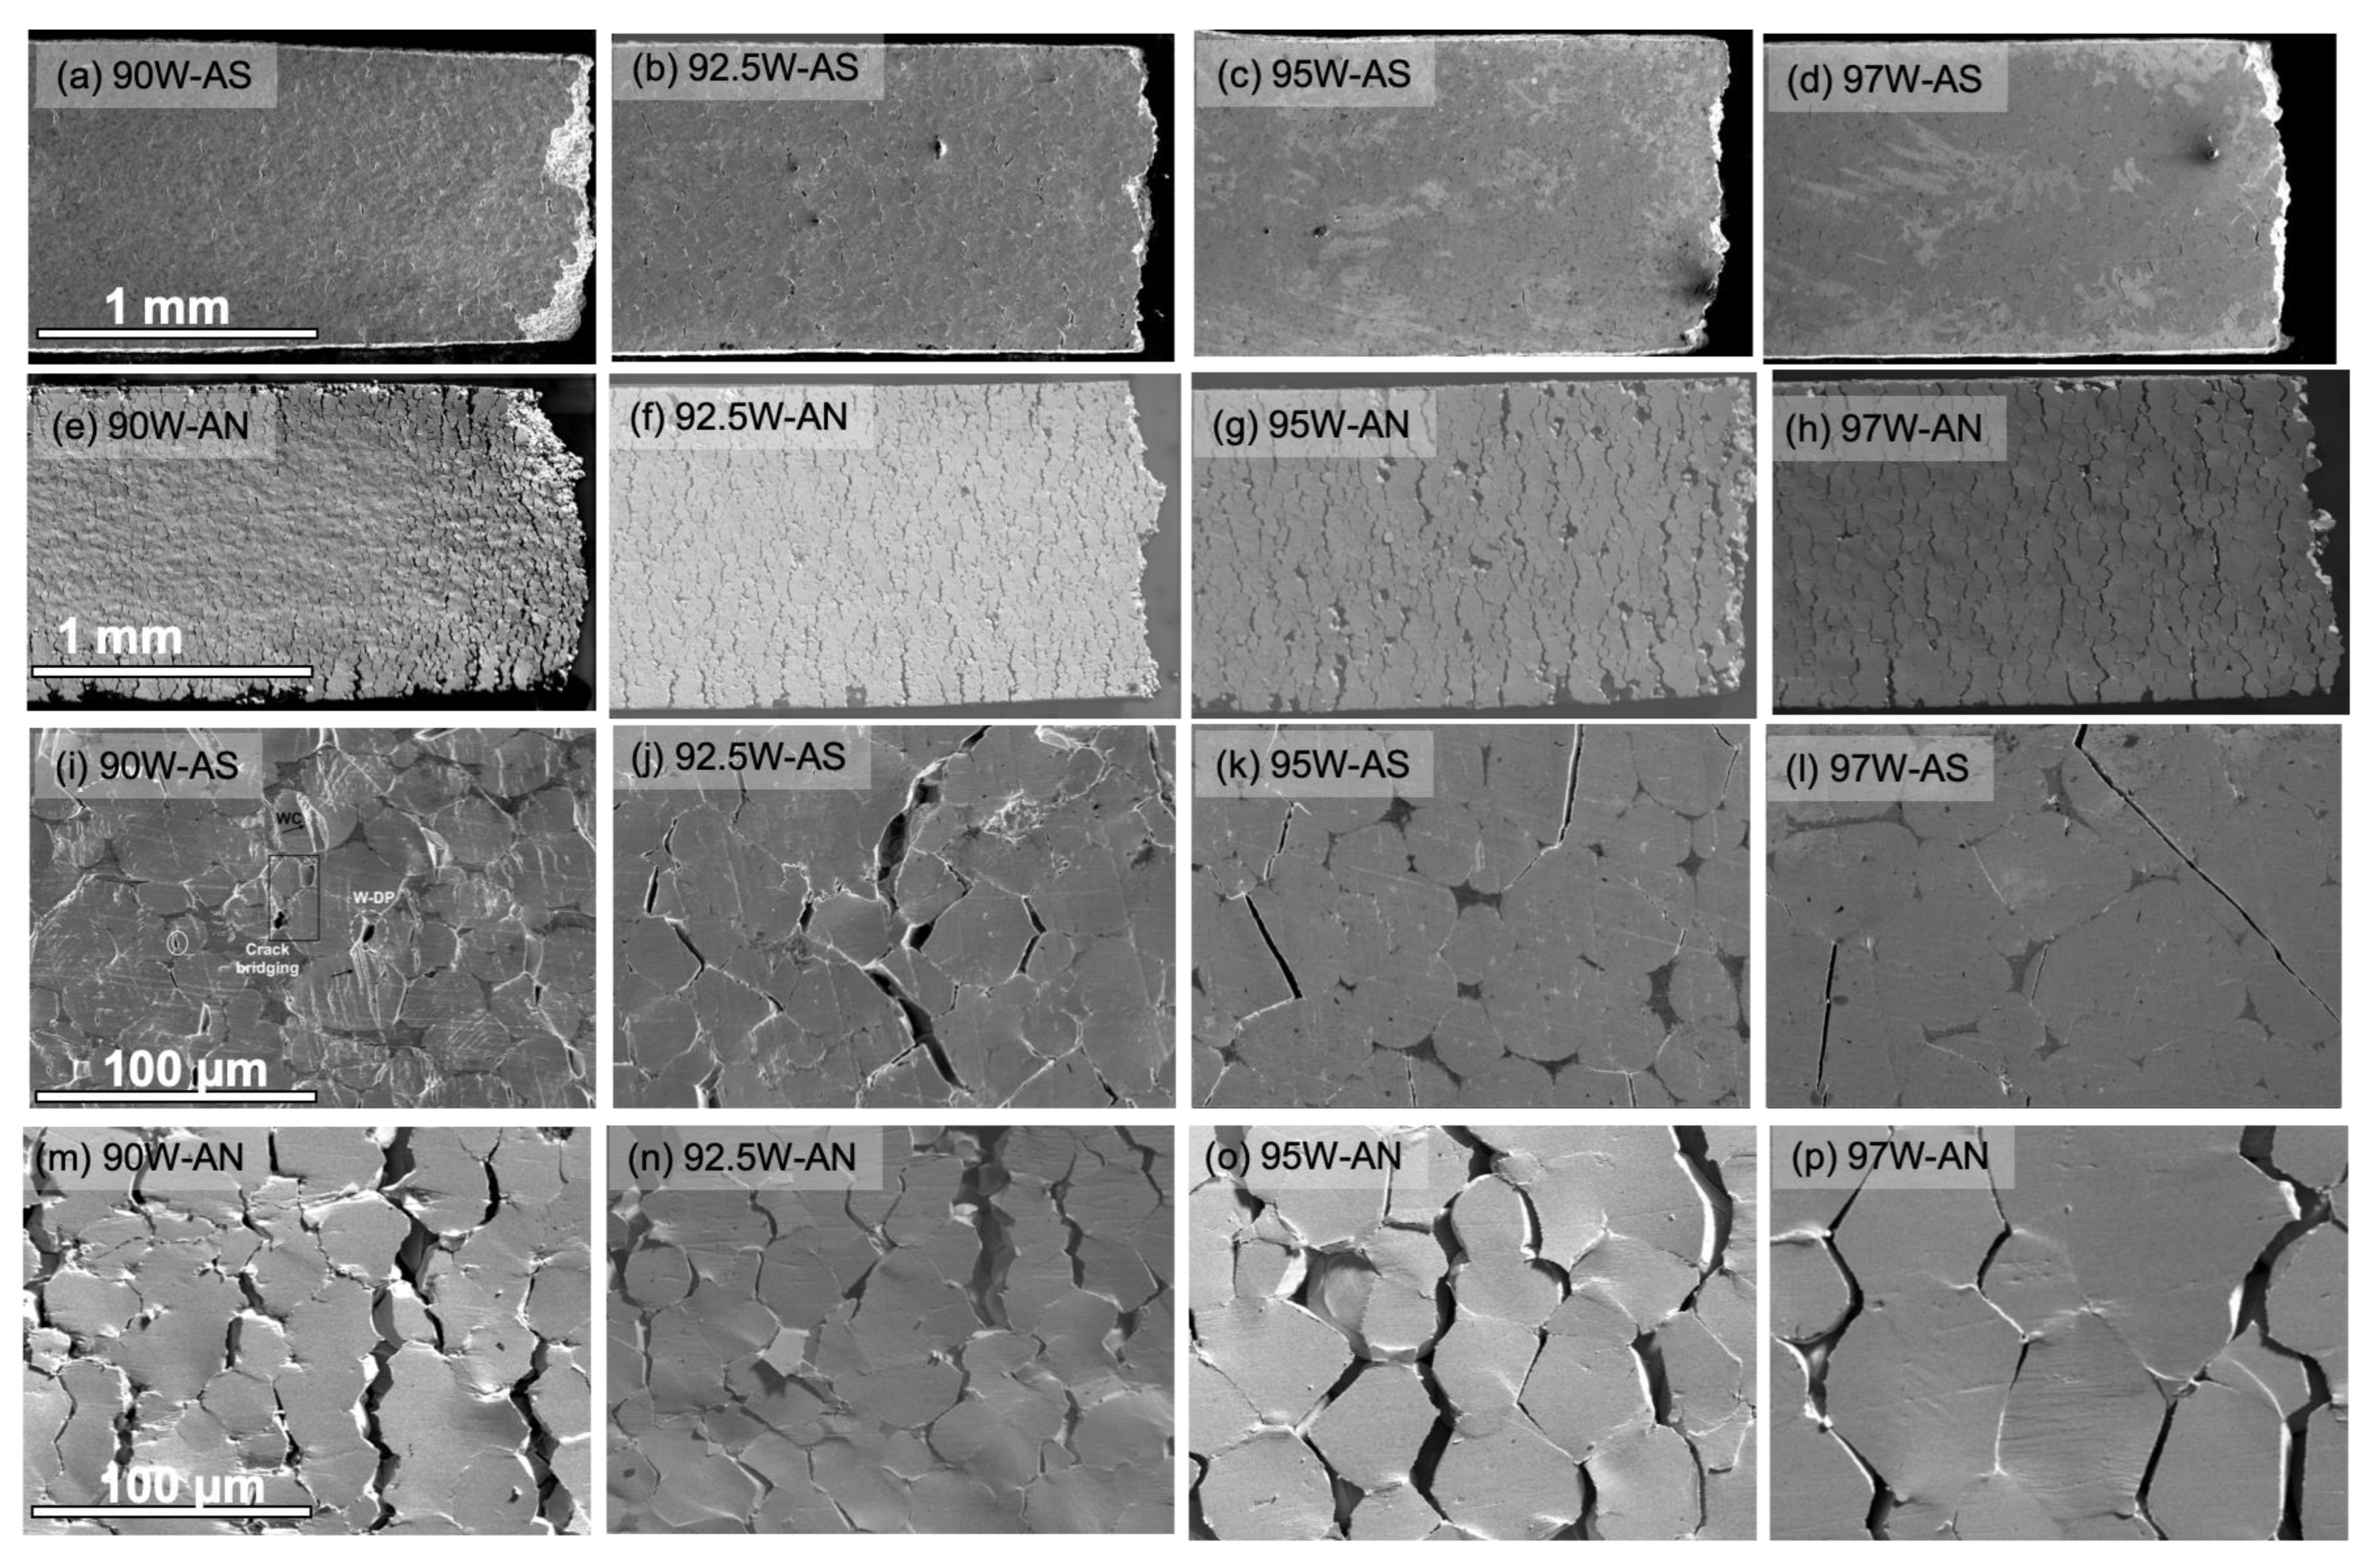
Figure 6a–h shows the low magnification SEM micrographs of the tensile gauge section side surface for WHAs in AS (Figure 6a–d) and AN (Figure 6e–h) conditions. Higher magnification SEM images for respective alloys are shown in Figure 6i–l for the AS and Figure 6m–p for the AN conditions. The microcrack damage development is very different in these two conditions. In the AS condition, the microcracks are confined to the region near the fracture surfaces and are largely absent in other parts of the gauge section. In contrast, in the AN condition, a series of arrested microcracks develop over a mm scale distances away from the final fracture surface and in combination span the entire width of the gauge section face.
Corresponding high magnification SEM images of the AS condition show that the W particles are deformed and cleaved, forming microcracks that are arrested and blunted by the DP, especially for the 90 and 92.5W alloys (see Figure 6i,j). The microcracks in the 95 and 97W alloys are sharper and interconnect to span several W particles before failure without affecting the neighboring particles (see Figure 6k,l) responsible for their lower ductility. In the AS conditions, the DP effectively carries and transfers the local microcracked W particle load to nearby intact W regions, which deform before failure. Further, details of tensile test damage development for AS WHAs can be found in Ref. [14].
In contrast, as noted above, the AN WHA condition shows well-distributed microcrack development throughout the gauge length (Figure 6e–h). The higher magnification micrographs for the AN condition reveal the distributed microcracking damage mechanism shifts from localized cleaved W-particle microcrack–microcrack arrest-blunting in the AS condition to more widely distributed W-W, W-DP decohesion, and a DR dominated mechanism in the AN condition (see Figure 6m–p).
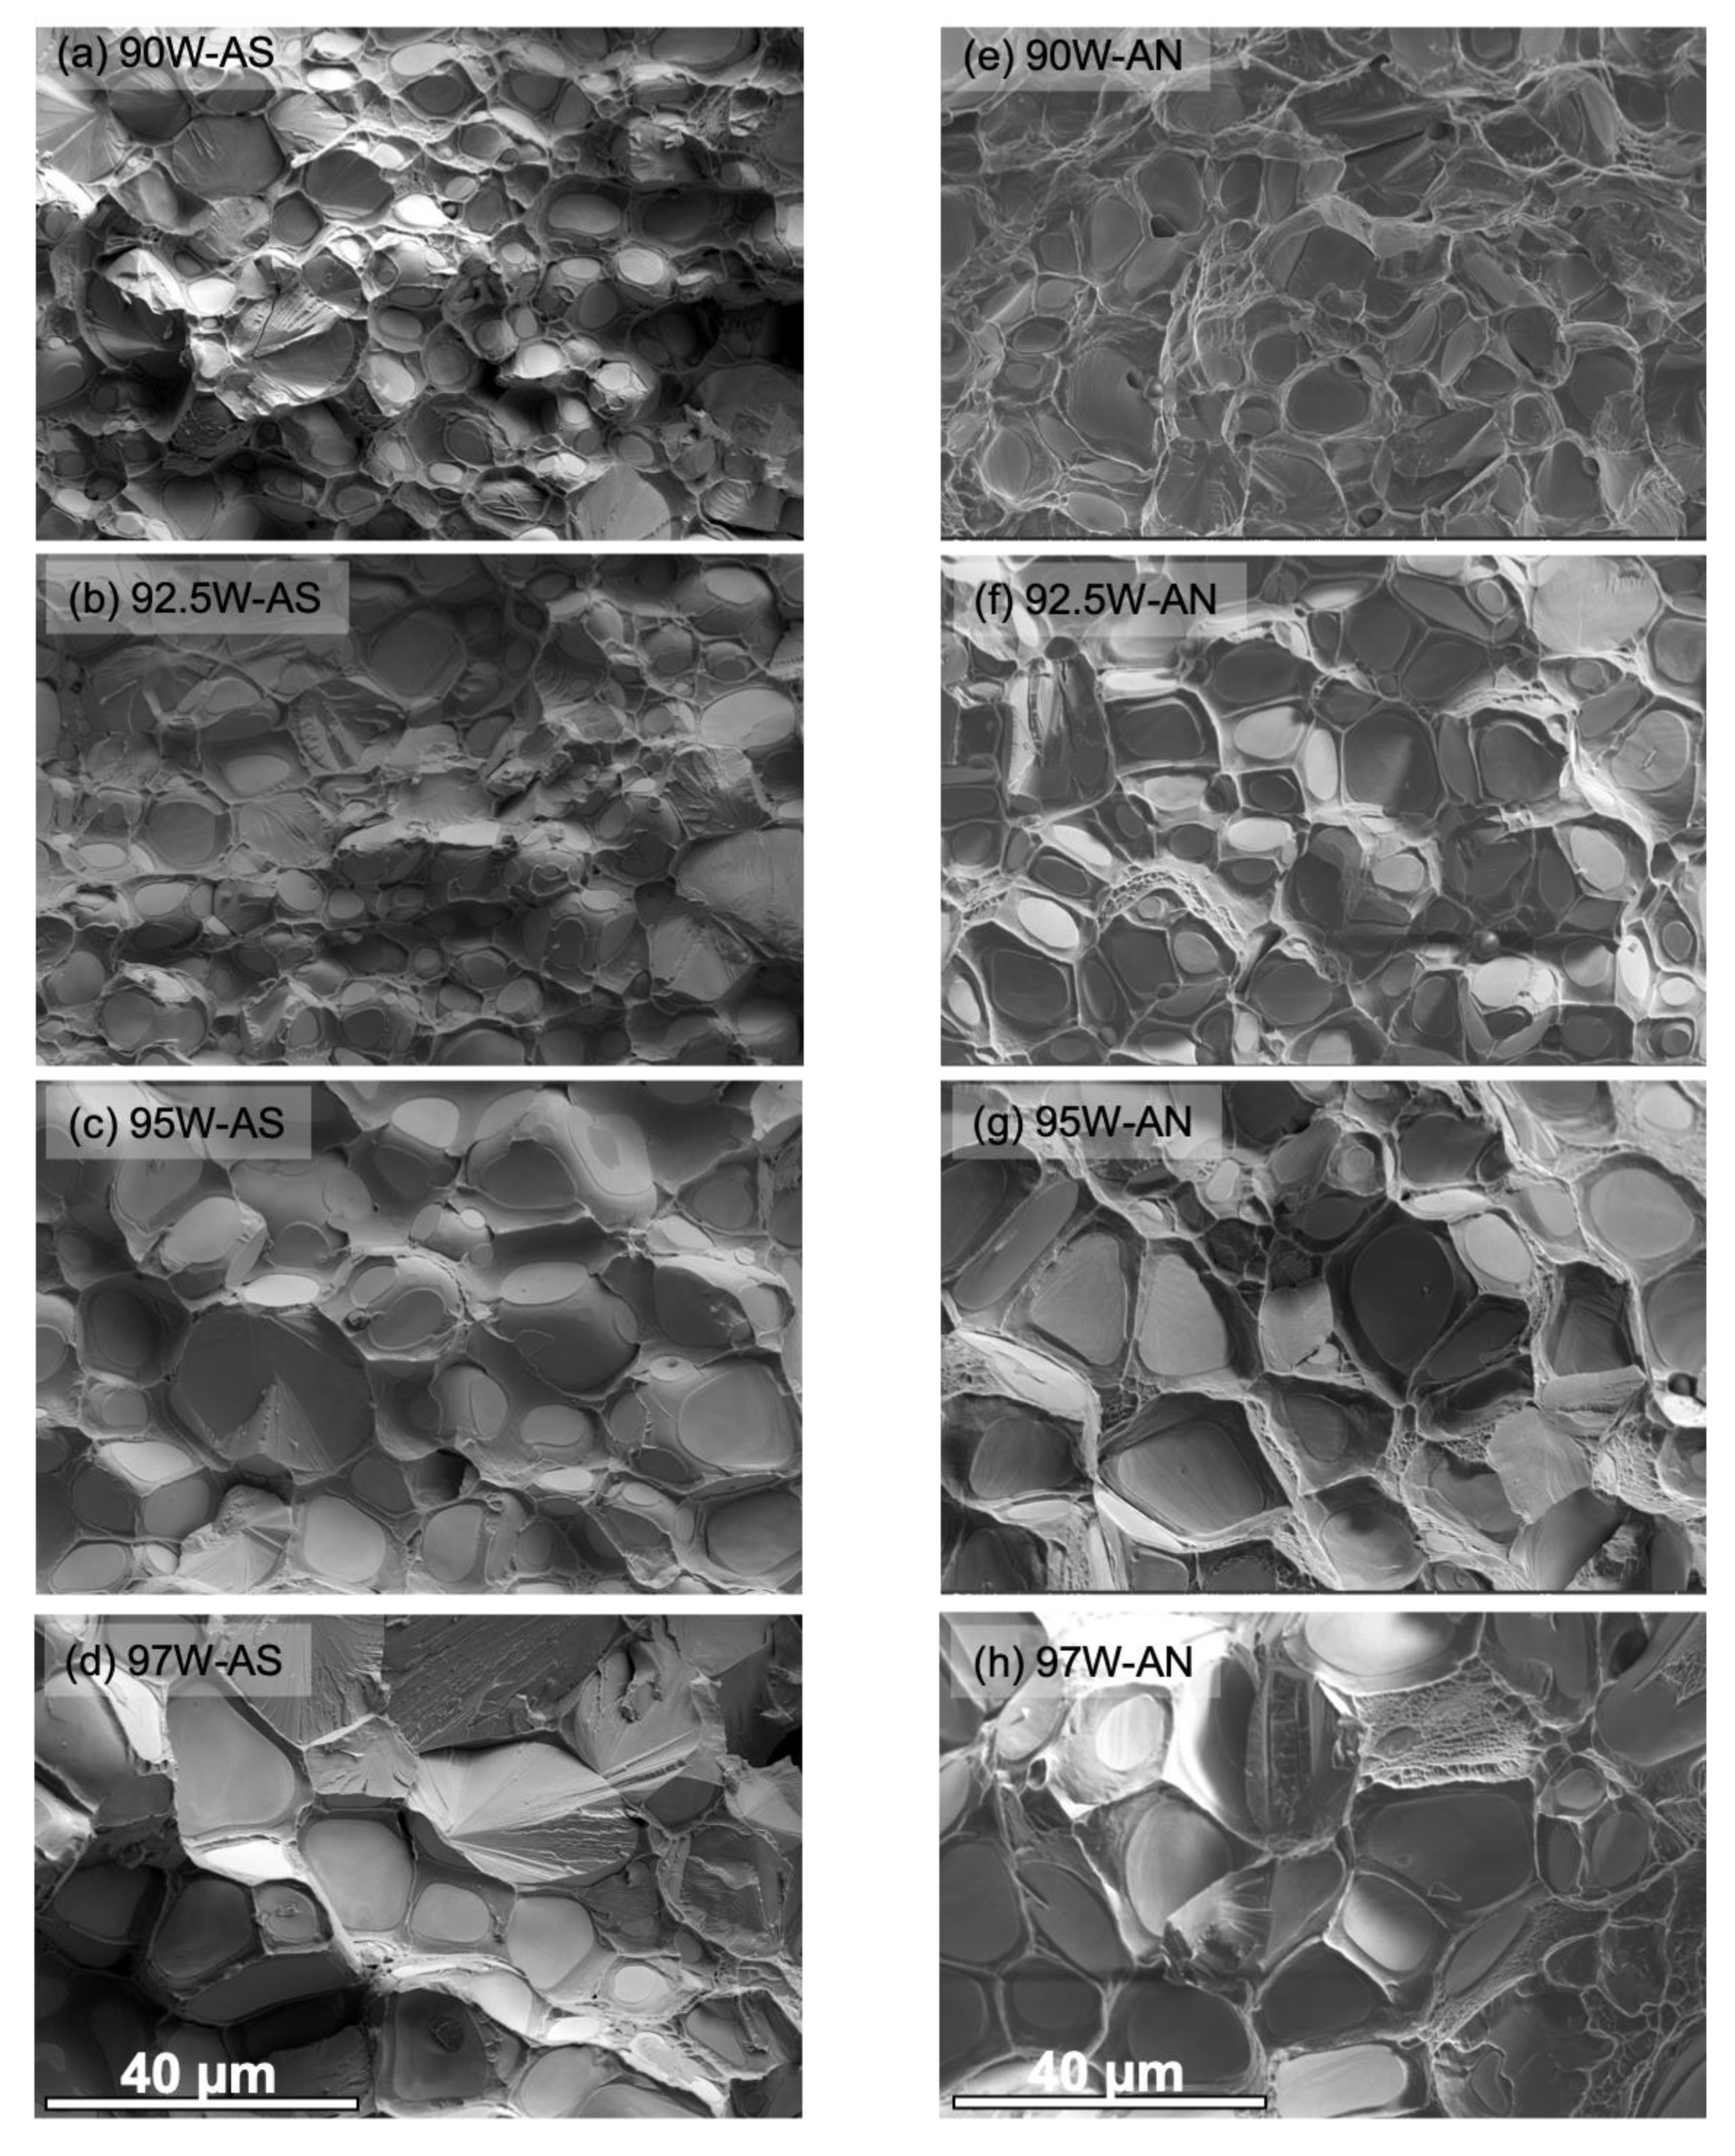
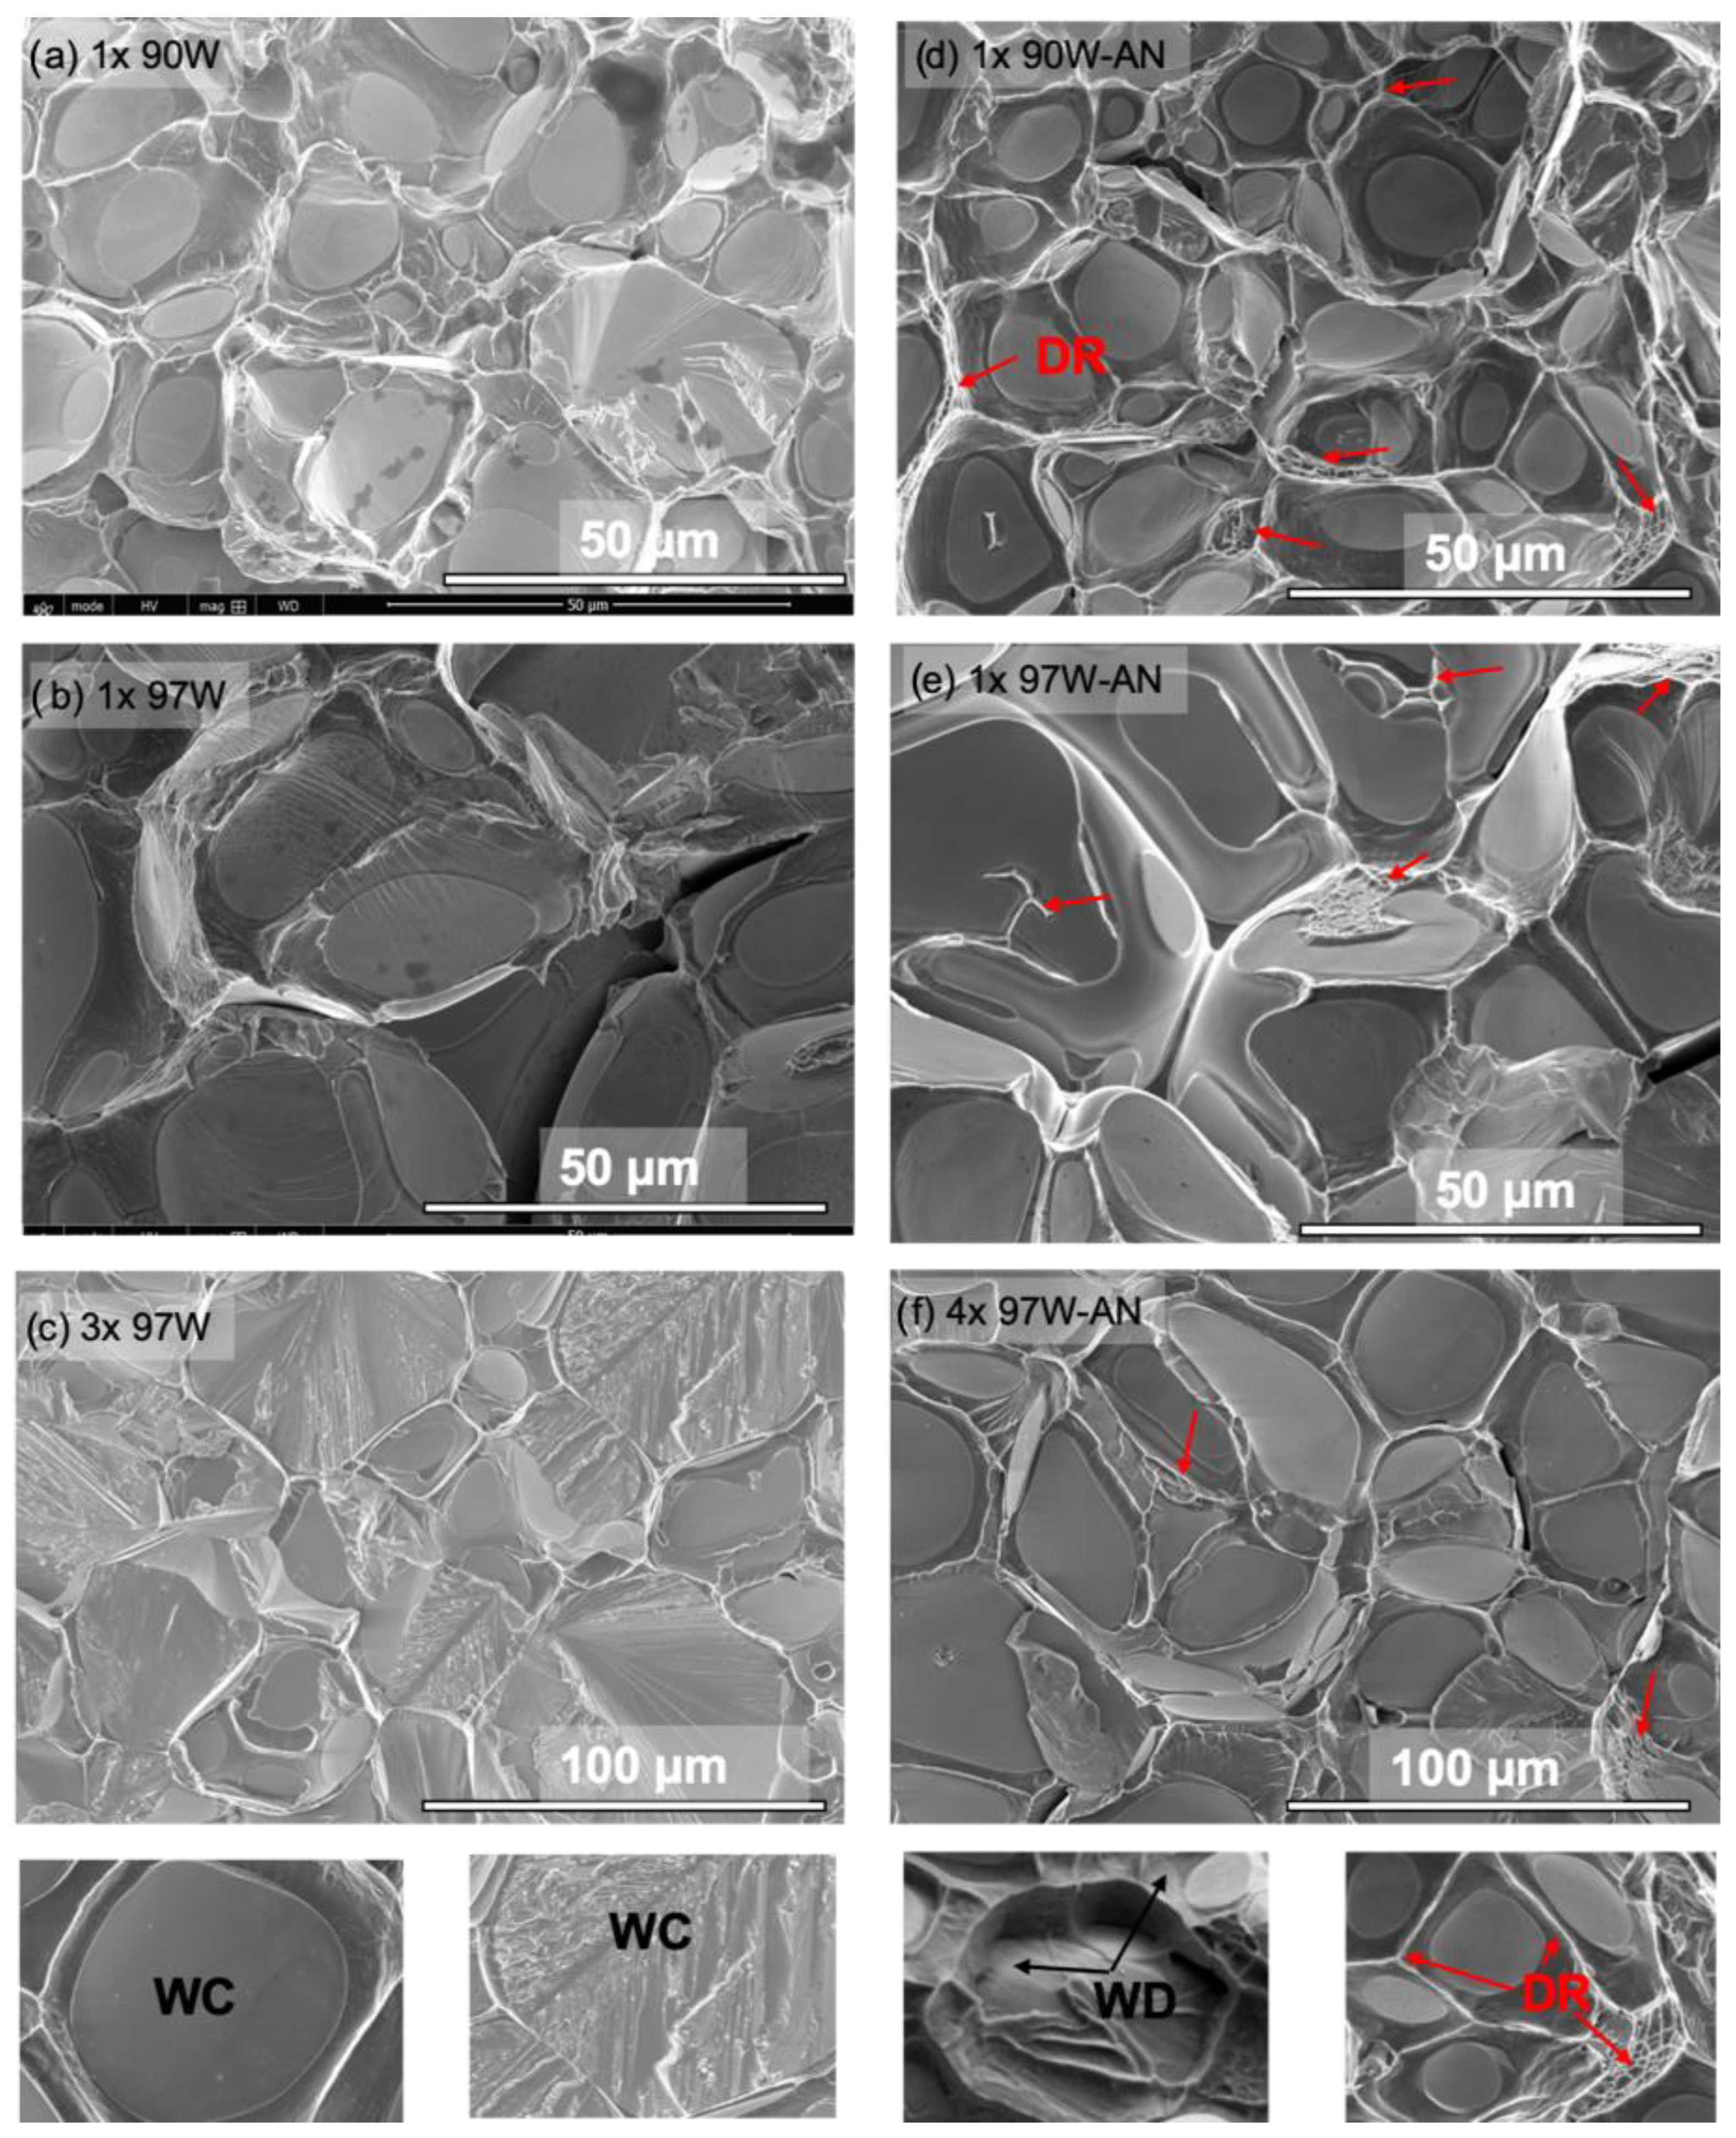
The SEM micrographs of the fracture surfaces of the AS and AN WHAs in Figure 7 show all four well-known local failure modes, namely, W–W interparticle fracture (WW), W cleavage (WC), W-NiWFe interfacial debonding (WD), and NiWFe ductile phase rupture (DR) [14]. At 97W, the AS condition shows a higher fraction of WC, whereas more WW and DR are observed in the AN condition.
4.2. Fracture Mechanisms in Bend Tests
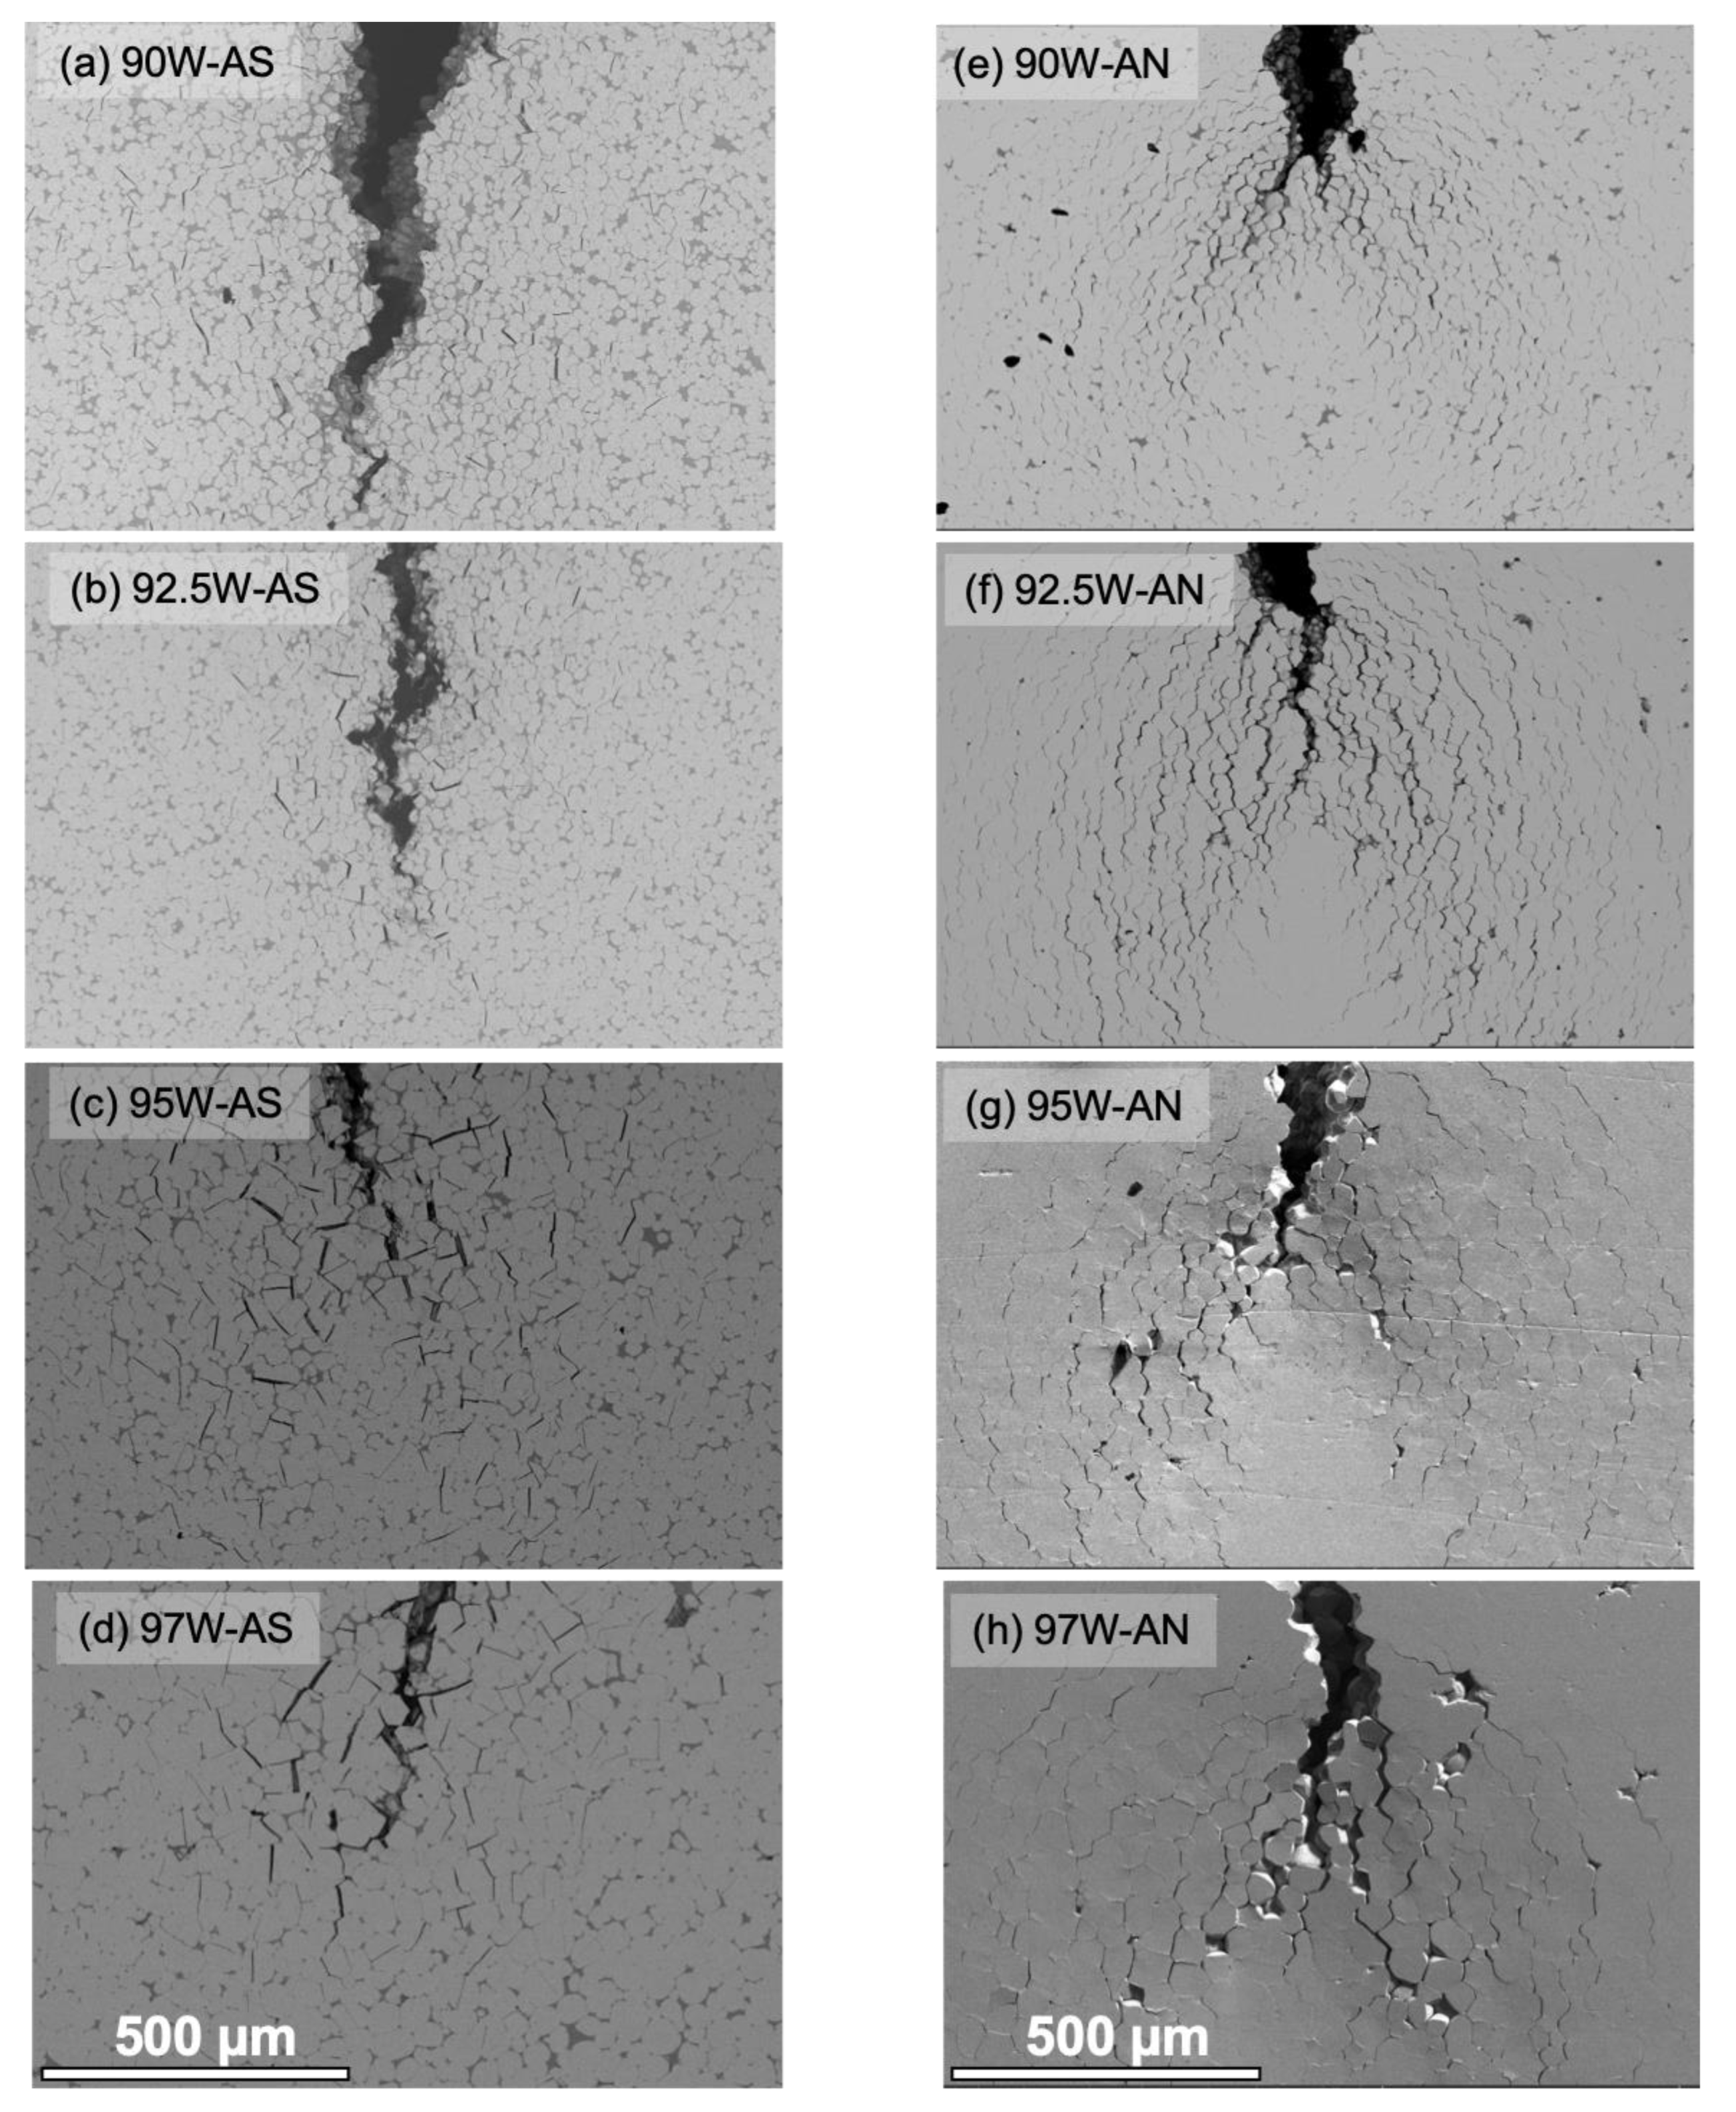
Annealing also leads to a major change in the microcracking pattern associated with macrocrack propagation, as illustrated in Figure 8. In contrast to more localized near-tip microcracking in the AS condition, annealing leads to much more and widely distributed microcracking well ahead of the macrocrack and results in crack branching. The shape of the AN condition microcracking pattern reflects the larger plastic zone formed by the loaded macrocrack, with two distinct lobes marking the highest principal normal stresses (see Figure 8e–h). The extensive microcracking following annealing results in enhanced crack tip shielding, leading to a higher toughness. Similar microcracking patterns are observed in the larger 3× and 4× specimens shown in Figure 9.
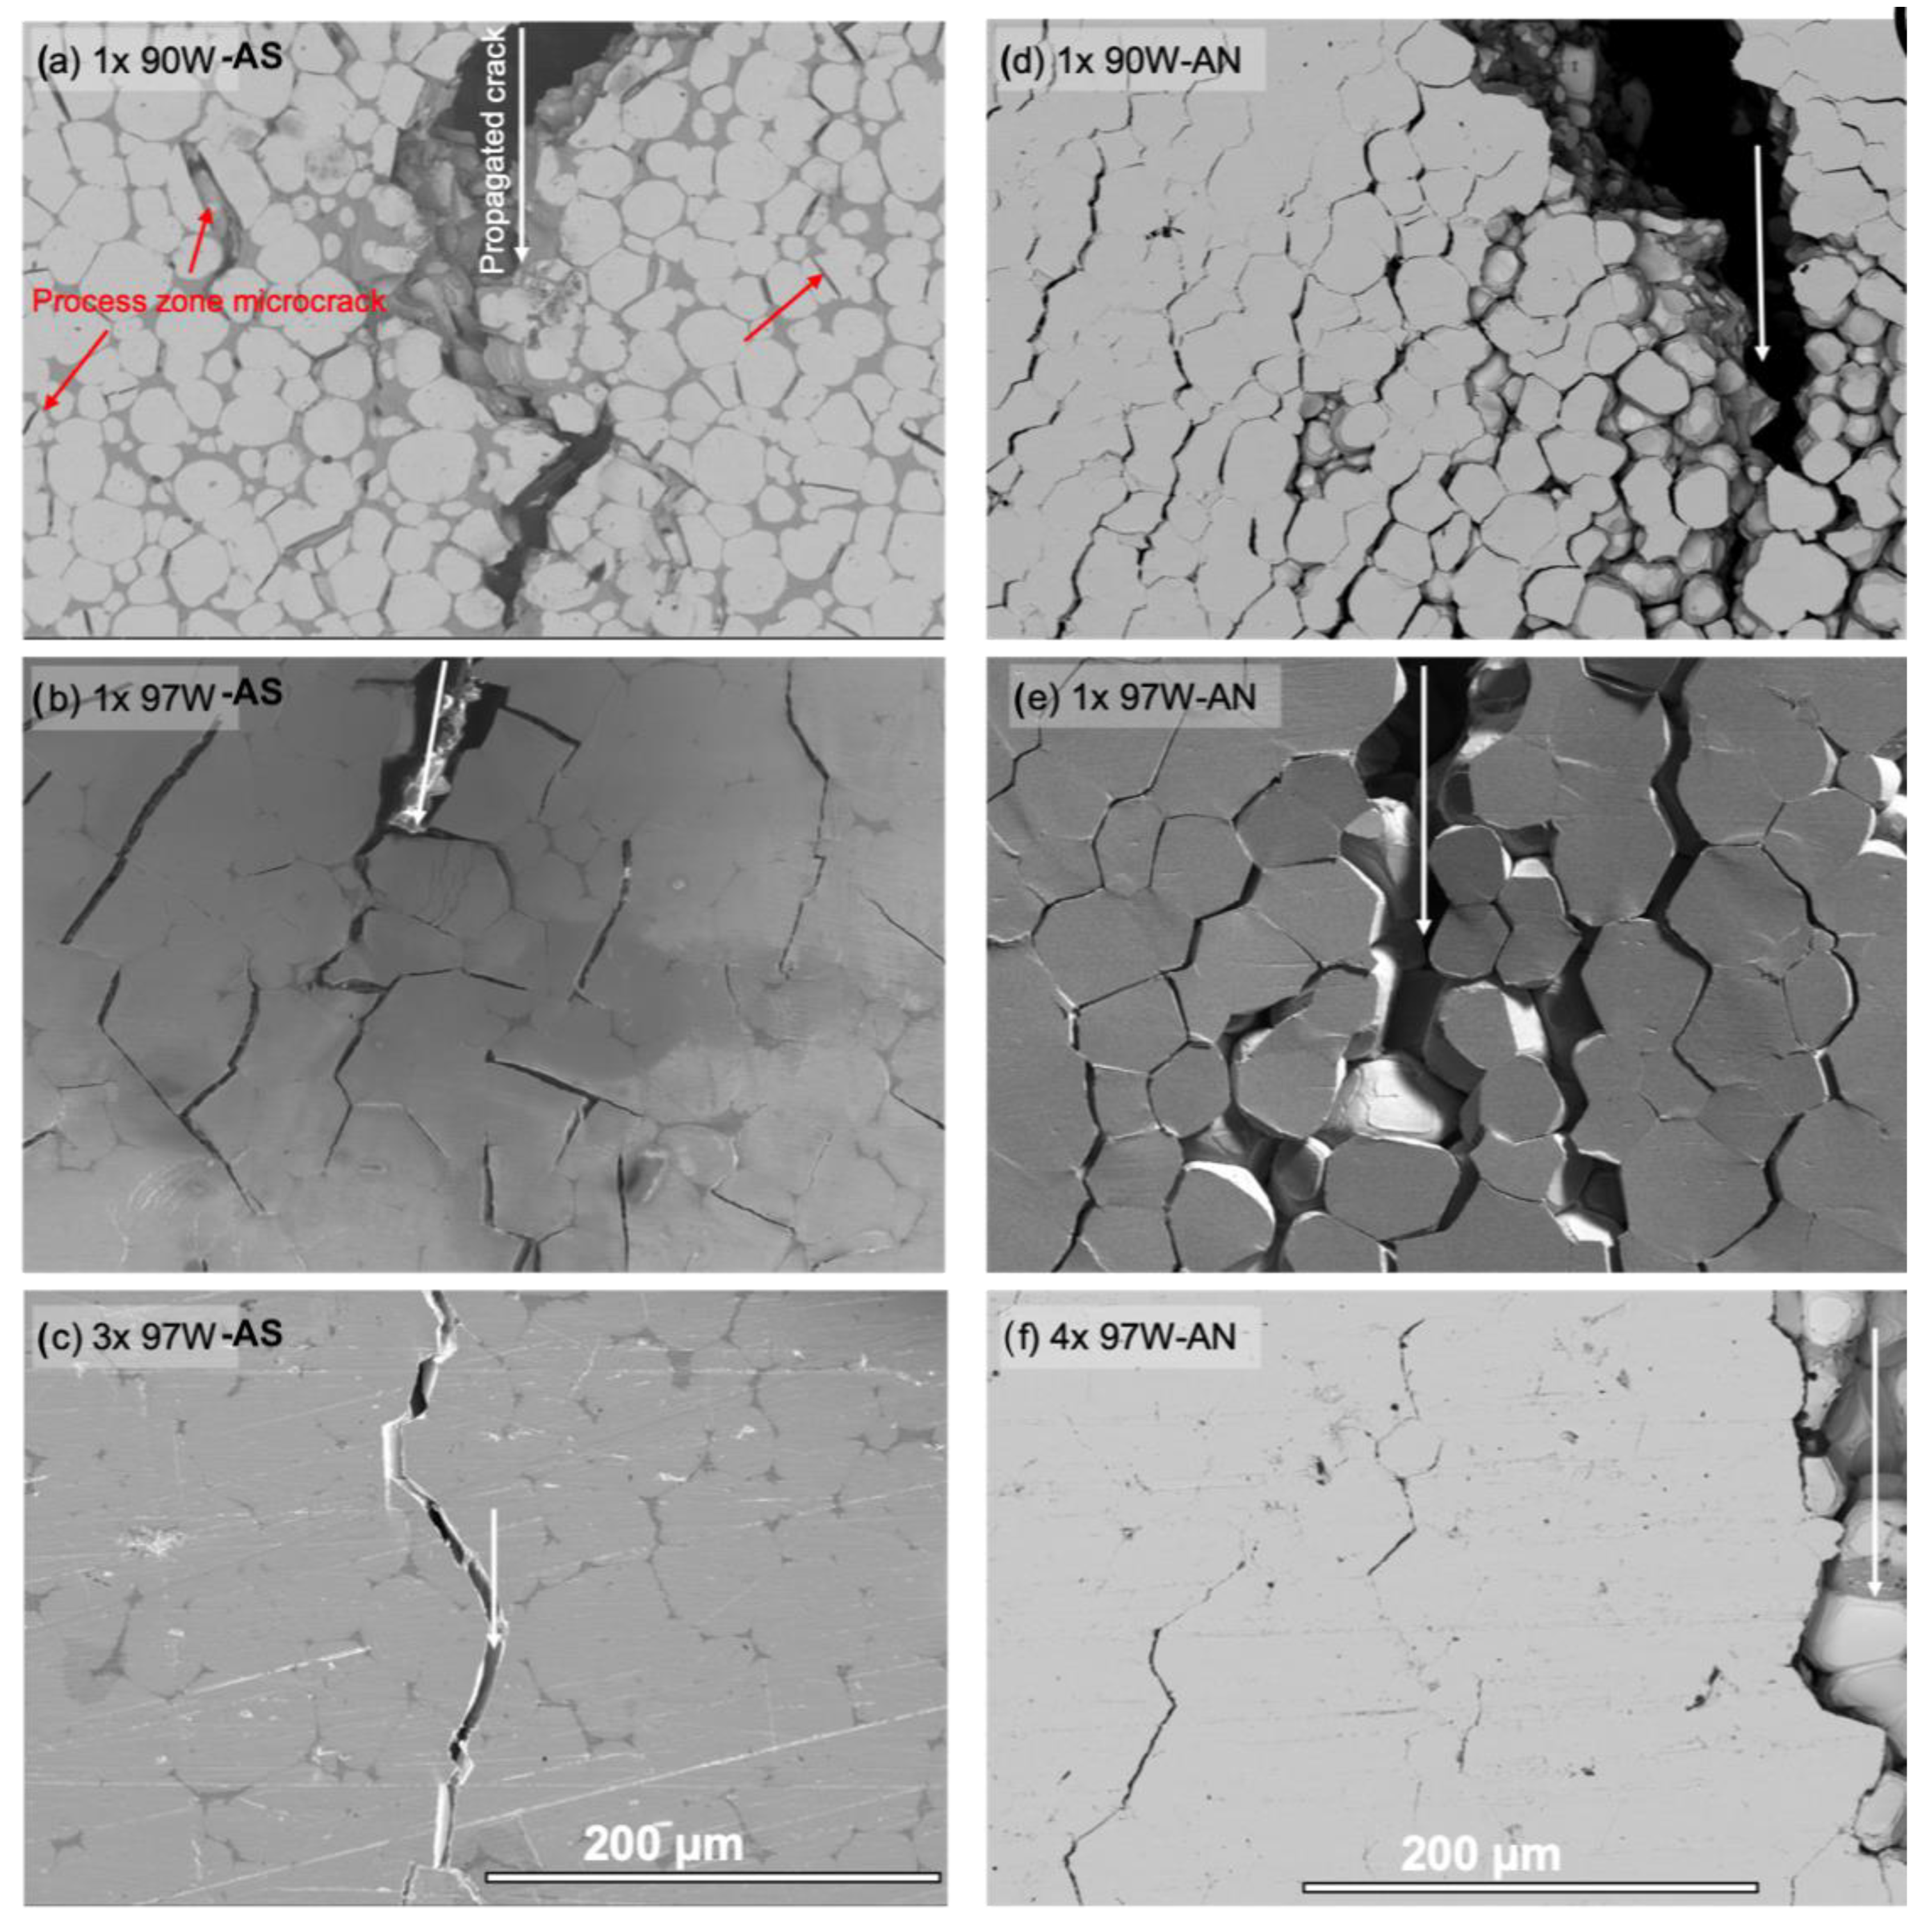
The local fracture modes are generally similar before and after annealing and for both the 1× and 3 or 4× specimens. One exception is the AS 97W alloy, which experiences a large increase in the W-particle cleavage (WC) from values of 17.6% for 1× to 57.1% for 3× 97W WHAs, as shown in Figure 9 and Figure 10, and Supplementary Materials, Figure S4 and Table S2. In this case, the increase in cleavage is likely due to a combination of higher constraint in the 3× versus the 1× bend bars and the low fraction of DP, allowing earlier linking of planar cleavage microcracks. Further details on the damage mechanism can be found in previous publications [14,27].
5. Conclusions
High-temperature 1300 °C/24 h annealing of 90 to 97W WHAs has a minimum effect on the as-sintered (AS) microstructure. The HV decreases in the annealed (AN) condition at higher W contents (HV ≈ 321 ± 8 for AS and ≈319 ± 14 kgf/mm2 for AN 90W, while for 97W, the HV are 344 ± 9 for AS and 289 ± 18 kgf/mm2 for AN 97W). However, while annealing has little effect on the corresponding yield strength (≈2 to 5% lower), the uniform and total elongation doubles in 95W (εt ≈ 8 ± 1% vs. 16 ± 0.3%) and 97W (εt ≈ 4 ± 1% vs. 8.8 ± 1.0%). With the exception of the 92.5W WHA, annealing increases the 97W elastic–plastic fracture toughness for the smaller WHA up to 42% (69 ± 12 MPa√m vs. 98 ± 17 MPa√m). Annealing also improves the KIm and KJm for the larger specimens, again especially at higher W contents (from 75 ± 4 MPa√m to 125 ± 6 MPa√m for 95W and 38 ± 4 MPa√m to 73 ± 29 MPa√m for 97W). The size effect between the 1× and 4× specimens is minimal in the AN condition. Given the lower allowable Ni contents with higher RT fracture toughness and tensile ductility, the 1300 °C/24 h annealed 95 and 97W WHAs would be more suitable for the nuclear fusion divertor application.
The microcracking pattern is very different in the AS versus the AN condition. The AS microcracking is more localized to the near-tip process zone of the macro-fatigue crack. In contrast, after annealing, the microcracking is much more widely distributed in the large plastic zone principal stress lobes formed by the loaded fatigue crack. The enhanced microcracking leads to additional dilatational toughening. The local fracture surface damage modes are similar in both the AS and AN conditions, except at 97W. However, the microcracking mechanisms in both the tensile and fracture specimens shift from WC to WW and WD mechanisms in the AN condition. Given the similarity in the AS and AN conditions’ microstructures and strength properties, it seems likely that the effects of annealing are due to increased ductility and a reduction in residual stresses. Thus, XRD studies will be pursued in the near future.
Supplementary Materials
The following supporting information can be downloaded at: https://www.mdpi.com/article/10.3390/ma16030916/s1, Figure S1: Low magnification SEM images of 90 to 97W WHAs before ((a–d), left column: AS) and after ((e–h), right column: AN) 1300 °C/24 h annealing. The scale is 200 µm for all cases; Figure S2: EDS-point scan showing DP constituents (i.e., Ni, W, and Fe wt.%) as a function of WHA alloy compositions and annealing conditions; Figure S3: KIm for (a) 1× and (b) 3-4× WHAs for as-sintered (AS) and annealed (AN) conditions; Figure S4: Local fracture modes for the as-sintered (AS) 3× and annealed (AN) 4× WHAs; Table S1: EDS-point scan results for DP composition variations as a function of WHA alloy contents and annealing conditions; Table S2: The percentage of local fracture features from the WHA toughness fractographs.
Author Contributions
Conceptualization, M.E.A. and G.R.O.; formal analysis, M.E.A. and G.R.O.; investigation, M.E.A.; data curation, M.E.A.; writing—original draft preparation, M.E.A.; writing—review and editing, M.E.A. and G.R.O.; supervision, G.R.O.; project administration, G.R.O.; funding acquisition, G.R.O. All authors have read and agreed to the published version of the manuscript.
Funding
This research was funded by the U.S. Department of Energy (DOE) Office of Fusion Energy Sciences (DE-FG03-94ER54275).
Institutional Review Board Statement
Not applicable.
Informed Consent Statement
Not applicable.
Data Availability Statement
Data will be available upon request.
Acknowledgments
The U.S. National Science Foundation (NSF) supported the California Nanoscience Institute (CNSI) which provided facilities critical to success of this research.
Conflicts of Interest
The authors declare no conflict of interest.
Nomenclature
| Ap | Plastic area under the load-displacement curve, N-m |
| a | Crack length, mm |
| B | Specimen thickness, mm |
| bo | Initial unbroken ligaments, mm |
| d | Load point displacement, mm |
| Dw | Diameter of tungsten particle, µm |
| E | Elastic modulus, GPa |
| Je | Elastic component of J, kJ/m2 |
| Jp | Plastic component of J, kJ/m2 |
| Jm | Measured total J = Je + Jp at maximum load, kJ/m2 |
| KIm | Measured elastic fracture toughness at maximum load = √[JeE/(1−ν2)], MPa√m |
| KJm | Measured elastic–plastic fracture toughness at maximum load, MPa√m |
| P | Load, N |
| Pm | Maximum load, N |
| Po | General yield limit load, N |
| S | Span, mm |
| σfl, σo | Flow stress, MPa |
| σu | Ultimate strength, MPa |
| σy | Yield stress, MPa |
| ε | Tensile elongation, % |
| ν | Poisson’s ratio |
| 3PB | Three-point bend specimen |
| AN | Annealed |
| AS | As-sintered |
| ASDEX | Axially symmetric divertor experiment |
| ASTM | American society for testing and materials |
| DP | Ductile phase |
| DR | Ductile rupture |
| EBSD | Electron backscatter diffraction |
| EDM | Electrical discharge machining |
| EDS | Energy dispersive spectroscopy |
| IPF | Inverse pole figure |
| LPS | Liquid-phase sintering |
| MW/m2 | Megawatt per meter square |
| RT | Room temperature |
| SEM | Scanning electron microscopy |
| W | Tungsten |
| WC | Tungsten particle cleavage |
| WD | Tungsten-DP decohesion |
| WW | Tungsten particle–particle fracture |
| WHA | Tungsten heavy alloy |
References
- Şahin, Y. Recent progress in processing of tungsten heavy alloys. J. Powder Technol. 2014, 2014, 1–22. [Google Scholar] [CrossRef]
- Hu, K.; Li, X.; Ai, X.; Qu, S.; Li, Y. Fabrication, characterization, and mechanical properties of 93W-4.9Ni-2.1Fe/95W-2.8Ni-1.2Fe/95W-2.8Ni-1.2Fe-1Al2O3 heavy alloy composites. Mater. Sci. Eng. A 2015, 636, 452–458. [Google Scholar] [CrossRef]
- Gong, X.; Fan, J.; Ding, F. Tensile mechanical properties and fracture behavior of tungsten heavy alloys at 25-1100 °C. Mater. Sci. Eng. A 2015, 646, 315–321. [Google Scholar] [CrossRef]
- Kiran, U.R.; Panchal, A.; Sankaranarayana, M.; Rao, G.V.S.N.; Nandy, T.K. Effect of alloying addition and microstructural parameters on mechanical properties of 93% tungsten heavy alloys. Mater. Sci. Eng. A 2015, 640, 82–90. [Google Scholar] [CrossRef]
- Cai, W.D.; Li, Y.; Dowding, R.J.; Mohamed, F.A.; Lavernia, E.J. A review of tungsten-based alloys as kinetic energy penetrator materials. Rev. Part. Mater. 1995, 3, 71–131. [Google Scholar]
- Henager, C.H., Jr.; Setyawan, W.; Roosendaal, T.; Overman, N.; Borlaug, B.; Stevens, E.; Wagner, K.; Kurtz, R.; Odette, G.R.; Nguyen, B.; et al. Ductile-phase toughened tungsten for plasma-facing materials in fusion reactors. Int. J. Powder Metall. 2017, 53, 53–69. [Google Scholar]
- Scapin, M. Mechanical characterization and modeling of the heavy tungsten alloy IT180. Int. J. Refract. Met. Hard Mater. 2015, 50, 258–268. [Google Scholar] [CrossRef] [Green Version]
- Neu, R.; Maier, H.; Balden, M.; Elgeti, S.; Gietl, H.; Greuner, H.; Herrmann, A.; Houben, A.; Rohde, V.; Sieglin, B.; et al. Investigations on tungsten heavy alloys for use as plasma facing material. Fusion Eng. Des. 2015, 124, 450–454. [Google Scholar] [CrossRef] [Green Version]
- Neu, R.; Maier, H.; Balden, M.; Dux, R.; Elgeti, S.; Gietl, H.; Greuner, H.; Herrmann, A.; Höschen, T.; Li, M.; et al. Results on the use of tungsten heavy alloys in the divertor of ASDEX Upgrade. J. Nucl. Mater. 2018, 511, 567–573. [Google Scholar] [CrossRef] [Green Version]
- Sattar, H.; Jielin, S.; Ran, H.; Imran, M.; Ding, W.; Gupta, P.D.; Ding, H. Impact of microstructural properties on hardness of tungsten heavy alloy evaluated by stand-off LIBS after PSI plasma irradiation. J. Nucl. Mater. 2020, 540, 152389. [Google Scholar] [CrossRef]
- An, Q.; Elshafiey, A.; Huang, L.; Hammer, D.A.H.; Hassani, M. Plasma and X-ray radiation-induced damage mechanisms in a tungsten heavy alloy. J. Nucl. Mater. 2020, 539, 152325. [Google Scholar] [CrossRef]
- Odette, G.R.; Alam, M.E.; Cunningham, K. Ductile-Phase Toughened Tungsten for Plasma Facing Materials; DOE-UCSB-ER54275; Department of Energy, USA. 2019. Available online: https://www.osti.gov/biblio/1562913 (accessed on 15 January 2023).
- Laas, T.; Laas, K.; Paju, J.; Priimets, J.; Tõkke, S.; Väli, B.; Shirokova, V.; Antonov, M.; Gribkov, V.A.; Demina, E.V.; et al. Behaviour of tungsten alloy with iron and nickel under repeated high temperature plasma pulses. Fusion Eng. Des. 2020, 151, 111408. [Google Scholar] [CrossRef]
- Alam, M.E.; Odette, G.R. On the remarkable fracture toughness of 90 to 97W-NiFe alloys revealing powerful new ductile phase toughening mechanisms. Acta Mater. 2020, 186, 324–340. [Google Scholar] [CrossRef] [Green Version]
- Alam, M.E.; Wang, J.; Henager, C.H.; Setyawan, W.; Odette, G.R. The effect of hot rolling on the strength and fracture toughness of 90W–7Ni3Fe tungsten heavy metal alloys. Mater. Sci. Eng. A 2021, 824, 141738. [Google Scholar] [CrossRef]
- Upadhyaya, A. Processing strategy for consolidating tungsten heavy alloys for ordnance applications. Mater. Chem. Phys. 2001, 67, 101–110. [Google Scholar] [CrossRef]
- Klopp, W.D.; Witzke, W.R. Mechanical Properties and Recrystallization Behavior of Electron-Beam-Melted Tungsten Compared with Arc-Melted Tungsten; National Aeronautics and Space Administration, Lewis Research Center: Cleveland, OH, USA, 1966. [Google Scholar]
- IV, J.V.H.; Edwards, D.J.; Henager, C.H.; Setyawan, W.; Wang, J.; Murayama, M. Characterization of Ductile Phase Toughening Mechanisms in a Hot-Rolled Tungsten Heavy Alloy. Acta Mater. 2020, 204, 116523. [Google Scholar] [CrossRef]
- Tsuchida, K.; Miyazawa, T.; Hasegawa, A.; Nogami, S.; Fukuda, M. Recrystallization behavior of hot-rolled pure tungsten and its alloy plates during high-temperature annealing. Nucl. Mater. Energy 2018, 15, 158–163. [Google Scholar] [CrossRef]
- Alfonso, A.; Jensen, D.J.; Luo, G.N.; Pantleon, W. Thermal stability of a highly-deformed warm-rolled tungsten plate in the temperature range 1100–1250 °C. Fusion Eng. Des 2015, 98, 1924–1928. [Google Scholar] [CrossRef] [Green Version]
- Wright, G.M.; Brunner, D.; Baldwin, M.J.; Bystrov, K.; Doerner, R.P.; Labombard, B.; Lipschultz, B.; Temmerman, G.D.; Terry, J.L.; Whyte, D.G.; et al. Comparison of tungsten nano-tendrils grown in Alcator C-Mod and linear plasma devices. J. Nucl. Mater. 2013, 438, S84–S89. [Google Scholar] [CrossRef] [Green Version]
- Dasgupta, D.; Maroudas, D.; Wirth, B.D. Prediction of temperature range for the onset of fuzz formation in helium-plasma-implanted tungsten. Surf. Sci. 2020, 698, 121614. [Google Scholar] [CrossRef]
- Li, M.; Ruprecht, D.; Kracker, G.; Höschen, T.; Neu, R. Impact of heat treatment on tensile properties of 97W–2Ni–1Fe heavy alloy. J. Nucl. Mater. 2018, 512, 1–7. [Google Scholar] [CrossRef] [Green Version]
- German, R.M. Tungsten Heavy Alloy Handbook; Metal Powder Industries Federation: East Princeton, NJ, USA, 2021. [Google Scholar]
- Yoon, H.K.; Lee, S.H.; Yoon, D.N. Effect of vacuum-treatment on mechanical properties of W-Ni-Fe heavy alloy. J. Mater. Sci. 1983, 18, 1374–1380. [Google Scholar] [CrossRef]
- Osama, R.; Abdallah, A.; Fayed, A.; Abdo, G.M.; Sallam, M.T. Effect of heat treatment on the Mechanical Properties and Fracture Behavior of Tungsten Heavy Alloys. Int. J. Res. Eng. Technol. 2017, 6, 140–144. [Google Scholar]
- Alam, M.E.; Odette, G.R. On the Influence of Specimen Size and Geometry on the Fracture Toughness of Tungsten Heavy Metal Alloys. J. Nucl. Mater. 2022, 571, 154025. [Google Scholar] [CrossRef]
- ASTM E1921-20; Standard Test Method for Determination of Reference Temperature, To, for Ferritic Steels in the Transition Range, in: Annu. B. ASTM Stand. ASTM International: West Conshohocken, PA, USA, 2020; pp. 1–25.
- Alam, M.E.; Pal, S.; Fields, K.; Maloy, S.A.; Hoelzer, D.T.; Odette, G.R. Tensile deformation and fracture properties of a 14YWT nanostructured ferritic alloy. Mater. Sci. Eng. A 2016, 675, 437–448. [Google Scholar] [CrossRef]
- ASTM E8M-15a; Standard Test Methods for Tension Testing of Metallic Materials, in: Annu. B. ASTM Stand. ASTM International: West Conshohocken, PA, USA, 2004; pp. 1–24.
- Anderson, T.L. Fracture Mechanics: Fundamentals and Applications, 3rd ed.; Taylor & Francis Group: Boca Raton, FL, USA, 2005. [Google Scholar]
- Davis, J.R. Properties and Selection: Nonferrous Alloys and Special-Purpose Materials, 10th ed.; ASM Handbook: Metal Park, OH, USA, 1993. [Google Scholar]
- Wang, J.; Collins, D.; Overman, N.R.; Setyawan, W. Tensile Testing and Microstructural characterization of Ductile Phase Toughened W-NiFe Alloys. In Fusion Reactor Materials Program Semiannual Progress Report; DOE0313/68; Oak Ridge National Laboratory: Oak Ridge, TN, USA, 2020; pp. 102–120. [Google Scholar]
- Kumar, V.; German, M.D.; Shih, C.F. Engineering Approach for Elastic-Plastic Fracture Analysis; EPRI-NP—1931; Electric Power Research Institute: Palo Alto, CA, USA, 1981. [Google Scholar]
Figure 1.
Low magnification SEM images of 90 and 97W WHAs: (a,b) before annealing; (c,d) after annealing. The scale bar is 200 µm for all cases.
Figure 1.
Low magnification SEM images of 90 and 97W WHAs: (a,b) before annealing; (c,d) after annealing. The scale bar is 200 µm for all cases.

Figure 2.
EBSD IPF map showing the random texture orientation for W and DP for 90W (a–c) and 97W (d–f) in the AN condition. Here, IPF maps are shown in the left column for the composites, the middle column for W, and the right column for DP for 90W (top row) and 97W (bottom row). The scale bars are all 60 µm. EBSD for the AS condition can be found in [33].

Figure 3.
Vickers microhardness HV for AS and AN WHAs for (a) individual W particles and DP probed at 10gf load; (b) the WHA composites at 500gf load; (c) representative RT engineering σ plastic εp curves; (d) true stress-true plastic strain curves; (e) 0.2% yield (σy) and ultimate tensile (σu) strengths; and (f) total elongations (εt) for AS (green circles) and AN (red squares) WHAs, respectively.

Figure 4.
Representative RT normalized load-displacement (P/Po-d/S) curves for (a–d) 1× and (e–h) 3× AS and 4× AN WHAs. Note, the 4× 92.5W was not annealed. Here, solid green and broken red lines represent the AS and AN conditions, respectively.
Figure 4.
Representative RT normalized load-displacement (P/Po-d/S) curves for (a–d) 1× and (e–h) 3× AS and 4× AN WHAs. Note, the 4× 92.5W was not annealed. Here, solid green and broken red lines represent the AS and AN conditions, respectively.

Figure 5.
Bar graphs showing the average maximum load toughness KJm for (a) 1× and (b) 3−4× WHA as-sintered (AS) and annealed (AN) specimens. Note, all the specimens were annealed at 1300 °C/24 h, except two of the 4× 97W that were annealed at 1100 and 1200 °C/1 h.
Figure 5.
Bar graphs showing the average maximum load toughness KJm for (a) 1× and (b) 3−4× WHA as-sintered (AS) and annealed (AN) specimens. Note, all the specimens were annealed at 1300 °C/24 h, except two of the 4× 97W that were annealed at 1100 and 1200 °C/1 h.

Figure 6.
SEM micrographs on the gauge section surface of the tensile specimens for (a–d) AS and (e–h) AN WHAs for 90, 92.5, 95, and 97W, respectively. Higher magnification SEM images for respective WHAs are shown in (i–l) AS and (m–p) AN conditions. The scale bars for the respective rows are shown in the first column.

Figure 7.
SEM micrographs probed on the fractured face for tensile specimens for (a–d) AS and (e–h) AN 90, 92.5, 95, and 97W WHAs, respectively.
Figure 7.
SEM micrographs probed on the fractured face for tensile specimens for (a–d) AS and (e–h) AN 90, 92.5, 95, and 97W WHAs, respectively.

Figure 8.
Low magnification SEM images of 1× 90 to 97W propagating cracks in the AS (a–d, left column) and AN (e–h, right column) conditions. The scale is 500 µm in all cases.
Figure 8.
Low magnification SEM images of 1× 90 to 97W propagating cracks in the AS (a–d, left column) and AN (e–h, right column) conditions. The scale is 500 µm in all cases.

Figure 9.
Higher magnification SEM images of 1× 90 to 97W propagating cracks in the AS (a–c, left column) and AN (d–f, right column) conditions. Note, (f) is for a fully fractured specimen. The white arrows show the crack propagation direction, and the red arrows show some WC microcracks. The scale is 200 µm in all cases.

Figure 10.
SEM micrographs of fracture surfaces: (a) AS 1× 90W; (b) AS 1× 97W; (c) AS 3× 97W; (d) AN 1× 90W; (e) AN 1× 97W; (f) AN 4× 97W. The bottom row illustrates the nature of local fracture modes.
Figure 10.
SEM micrographs of fracture surfaces: (a) AS 1× 90W; (b) AS 1× 97W; (c) AS 3× 97W; (d) AN 1× 90W; (e) AN 1× 97W; (f) AN 4× 97W. The bottom row illustrates the nature of local fracture modes.


Table 1.
The nominal compositions and density of the WHAs.
| WHAs | W (wt.%) | Ni (wt.%) | Fe (wt.%) | Density (g/cc) |
|---|---|---|---|---|
| 90W | 90.27 | 6.78 | 2.95 | 17.05 |
| 92.5W | 92.48 | 5.33 | 2.19 | 17.58 |
| 95W | 95.03 | 3.48 | 1.49 | 18.07 |
| 97W | 97.13 | 2.01 | 0.86 | 18.51 |
Table 2.
The W-particle diameter, DW, DP surface area %, W–W contiguity, DP thickness, and t/DW for the as-sintered (AS) and 1300 °C/24 h annealed (AN) WHAs.
Table 2.
The W-particle diameter, DW, DP surface area %, W–W contiguity, DP thickness, and t/DW for the as-sintered (AS) and 1300 °C/24 h annealed (AN) WHAs.
| WHAs | Condition | W particles, Dw, µm | DP area, % | W–W contiguity, Cw | DP thickness, t, µm | t/DW µm/µm |
|---|---|---|---|---|---|---|
| 90W | AS | 17 ± 7 | 16.1 ± 3.8 | 0.285 | 5.9 ± 5.4 | 0.35 |
| AN | 17 ± 6 | 18.6 ± 0.8 | 0.302 | 5.7 ± 4.7 | 0.33 | |
| 92.5W | AS | 18 ± 7 | 11.8 ± 2.2 | 0.402 | 4.0 ± 3.7 | 0.22 |
| AN | 19 ± 7 | 11.0 ± 0.8 | 0.408 | 5.7 ± 6.4 | 0.3 | |
| 95W | AS | 26 ± 11 | 10.7 ± 1.3 | 0.426 | 5.1 ± 4.1 | 0.20 |
| AN | 28 ± 11 | 9.3 ± 0.8 | 0.405 | 4.2 ± 3.3 | 0.15 | |
| 97W | AS | 38 ± 15 | 6.4 ± 1.5 | 0.582 | 4.5 ± 5.0 | 0.12 |
| AN | 38 ± 14 | 5.7 ± 0.1 | 0.477 | 5.3 ± 4.0 | 0.14 |
Table 3.
RT Vickers microhardness (HV) and tensile properties of 90–97W WHAs.
| WHAs | Condition | HV0.5 Kgf/mm2 | σy, MPa | σu, MPa | σfl, MPa | εu, % | εt, % |
|---|---|---|---|---|---|---|---|
| 90W | AS | 321 ± 8 | 621 ± 29 | 891 ± 35 | 786 | 18 ± 4 | 21 ± 7 |
| AN | 319 ± 14 | 588 ± 12 | 809 ± 11 | 730 | 17.3 ± 1.0 | 22.5 ± 2.9 | |
| 92.5W | AS | 334 ± 8 | 616 ± 44 | 886 ± 12 | 786 | 13.5 ± 2.2 | 16 ± 4 |
| AN | 302 ± 13 | 603 ± 4 | 796 ± 12 | 735 | 14.1 ± 2.2 | 17.0 ± 3.2 | |
| 95W | AS | 349 ± 7 | 600 ± 15 | 818 ± 10 | 779 | 7.3 ± 1 | 8 ± 1 |
| AN | 279 ± 23 | 588 ± 9 | 774 ± 10 | 718 | 13.1 ± 1.9 | 15.5 ± 0.3 | |
| 97W | AS | 344 ± 9 | 594 ± 27 | 701 ± 67 | 708 | 3.4 ± 1 | 4 ± 1 |
| AN | 289 ± 18 | 572 ± 14 | 707 ± 10 | 696 | 7.5 ± 0.9 | 8.8 ± 1.0 |
AS = as-sintered, AN = annealed, σy = 0.2% yield stress, σu = ultimate tensile strength, σfl = flow stress, εu = uniform elongation, εt = total elongation.
| Conditions | 90W | 92.5W | 95W | 97W | ||||
|---|---|---|---|---|---|---|---|---|
| KIm (MPa√m) | KJm (MPa√m) | KIm (MPa√m) | KJm (MPa√m) | KIm (MPa√m) | KJm (MPa√m) | KIm (MPa√m) | KJm (MPa√m) | |
| 1× AS | 36 ± 4 | 97 ± 18 | 39 ± 4 | 96 ± 12 | 42 ± 6 | 107± 14 | 36 ± 5 | 69 ± 12 |
| 1× AN-1324 a | 37 ± 1 | 127 ± 11 | 37 ± 1 | 100 ± 7 | 38 ± 1 | 117 ± 2 | 35 ± 1 | 98 ± 17 |
| 3× AS | 52 ± 2 | 92 ± 6 | 50 ± 3 | 83 ± 11 | 49 ± 1 | 75 ± 4 | 38 ± 4 | 38 ± 4 * |
| 4× AN-1324 a | 53 ± 4 | 120 ± 4 | - | - | 65 ± 2 | 125 ± 6 | 55 ± 3 | 73 ± 29 |
| 4× AN-111 b | - | - | - | - | - | - | 43 | 43 * |
| 4× AN-121 c | 47 | 47 * | ||||||
* Unstable fracture; 1324 a: 1300 °C/24 h; 111 b: 1100 °C/1 h; and 121 c: 1200 °C/1 h anneal.
Disclaimer/Publisher’s Note: The statements, opinions and data contained in all publications are solely those of the individual author(s) and contributor(s) and not of MDPI and/or the editor(s). MDPI and/or the editor(s) disclaim responsibility for any injury to people or property resulting from any ideas, methods, instructions or products referred to in the content. |
© 2023 by the authors. Licensee MDPI, Basel, Switzerland. This article is an open access article distributed under the terms and conditions of the Creative Commons Attribution (CC BY) license (https://creativecommons.org/licenses/by/4.0/).
Share and Cite
MDPI and ACS Style
Alam, M.E.; Odette, G.R. Improving the Fracture Toughness and Ductility of Liquid-Phase Sintered WNiFe Tungsten Heavy Alloys by High-Temperature Annealing. Materials 2023, 16, 916. https://doi.org/10.3390/ma16030916
AMA Style
Alam ME, Odette GR. Improving the Fracture Toughness and Ductility of Liquid-Phase Sintered WNiFe Tungsten Heavy Alloys by High-Temperature Annealing. Materials. 2023; 16(3):916. https://doi.org/10.3390/ma16030916
Chicago/Turabian StyleAlam, Md Ershadul, and G. Robert Odette. 2023. "Improving the Fracture Toughness and Ductility of Liquid-Phase Sintered WNiFe Tungsten Heavy Alloys by High-Temperature Annealing" Materials 16, no. 3: 916. https://doi.org/10.3390/ma16030916
Note that from the first issue of 2016, this journal uses article numbers instead of page numbers. See further details here.