
An Experimental Analysis of the High-Cycle Fatigue Fracture of H13 Hot Forging Tool Steels
 , , ,
, , ,
Abstract
:1. Introduction
2. Materials and Methods
2.1. Materials
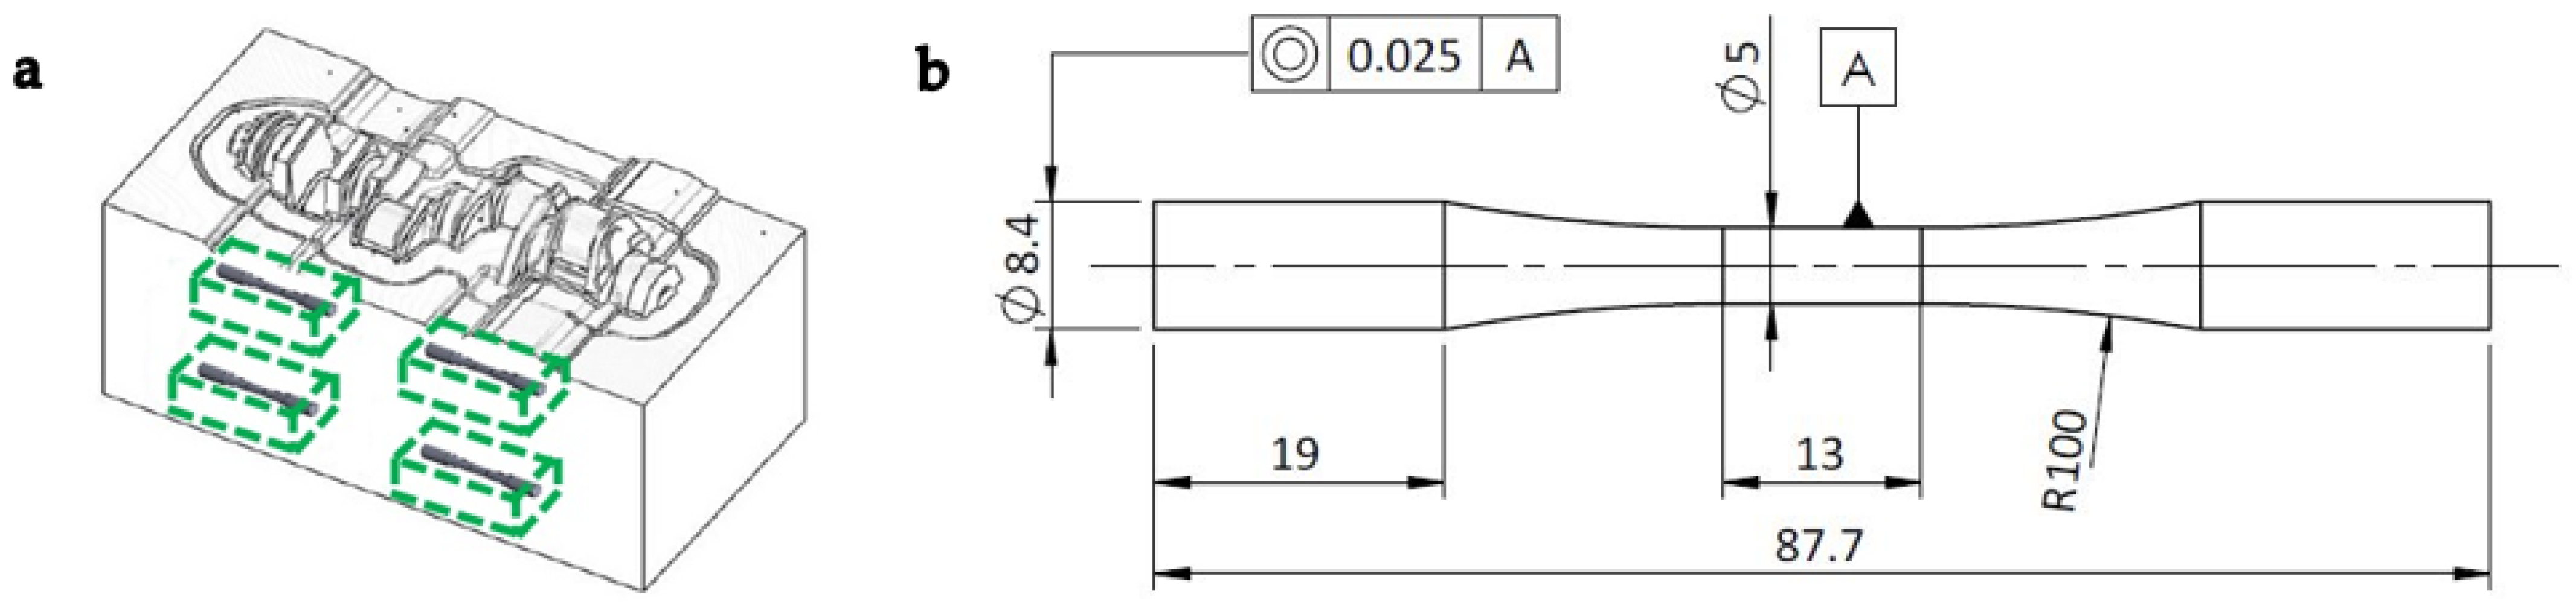
2.2. Specimen Dimensions
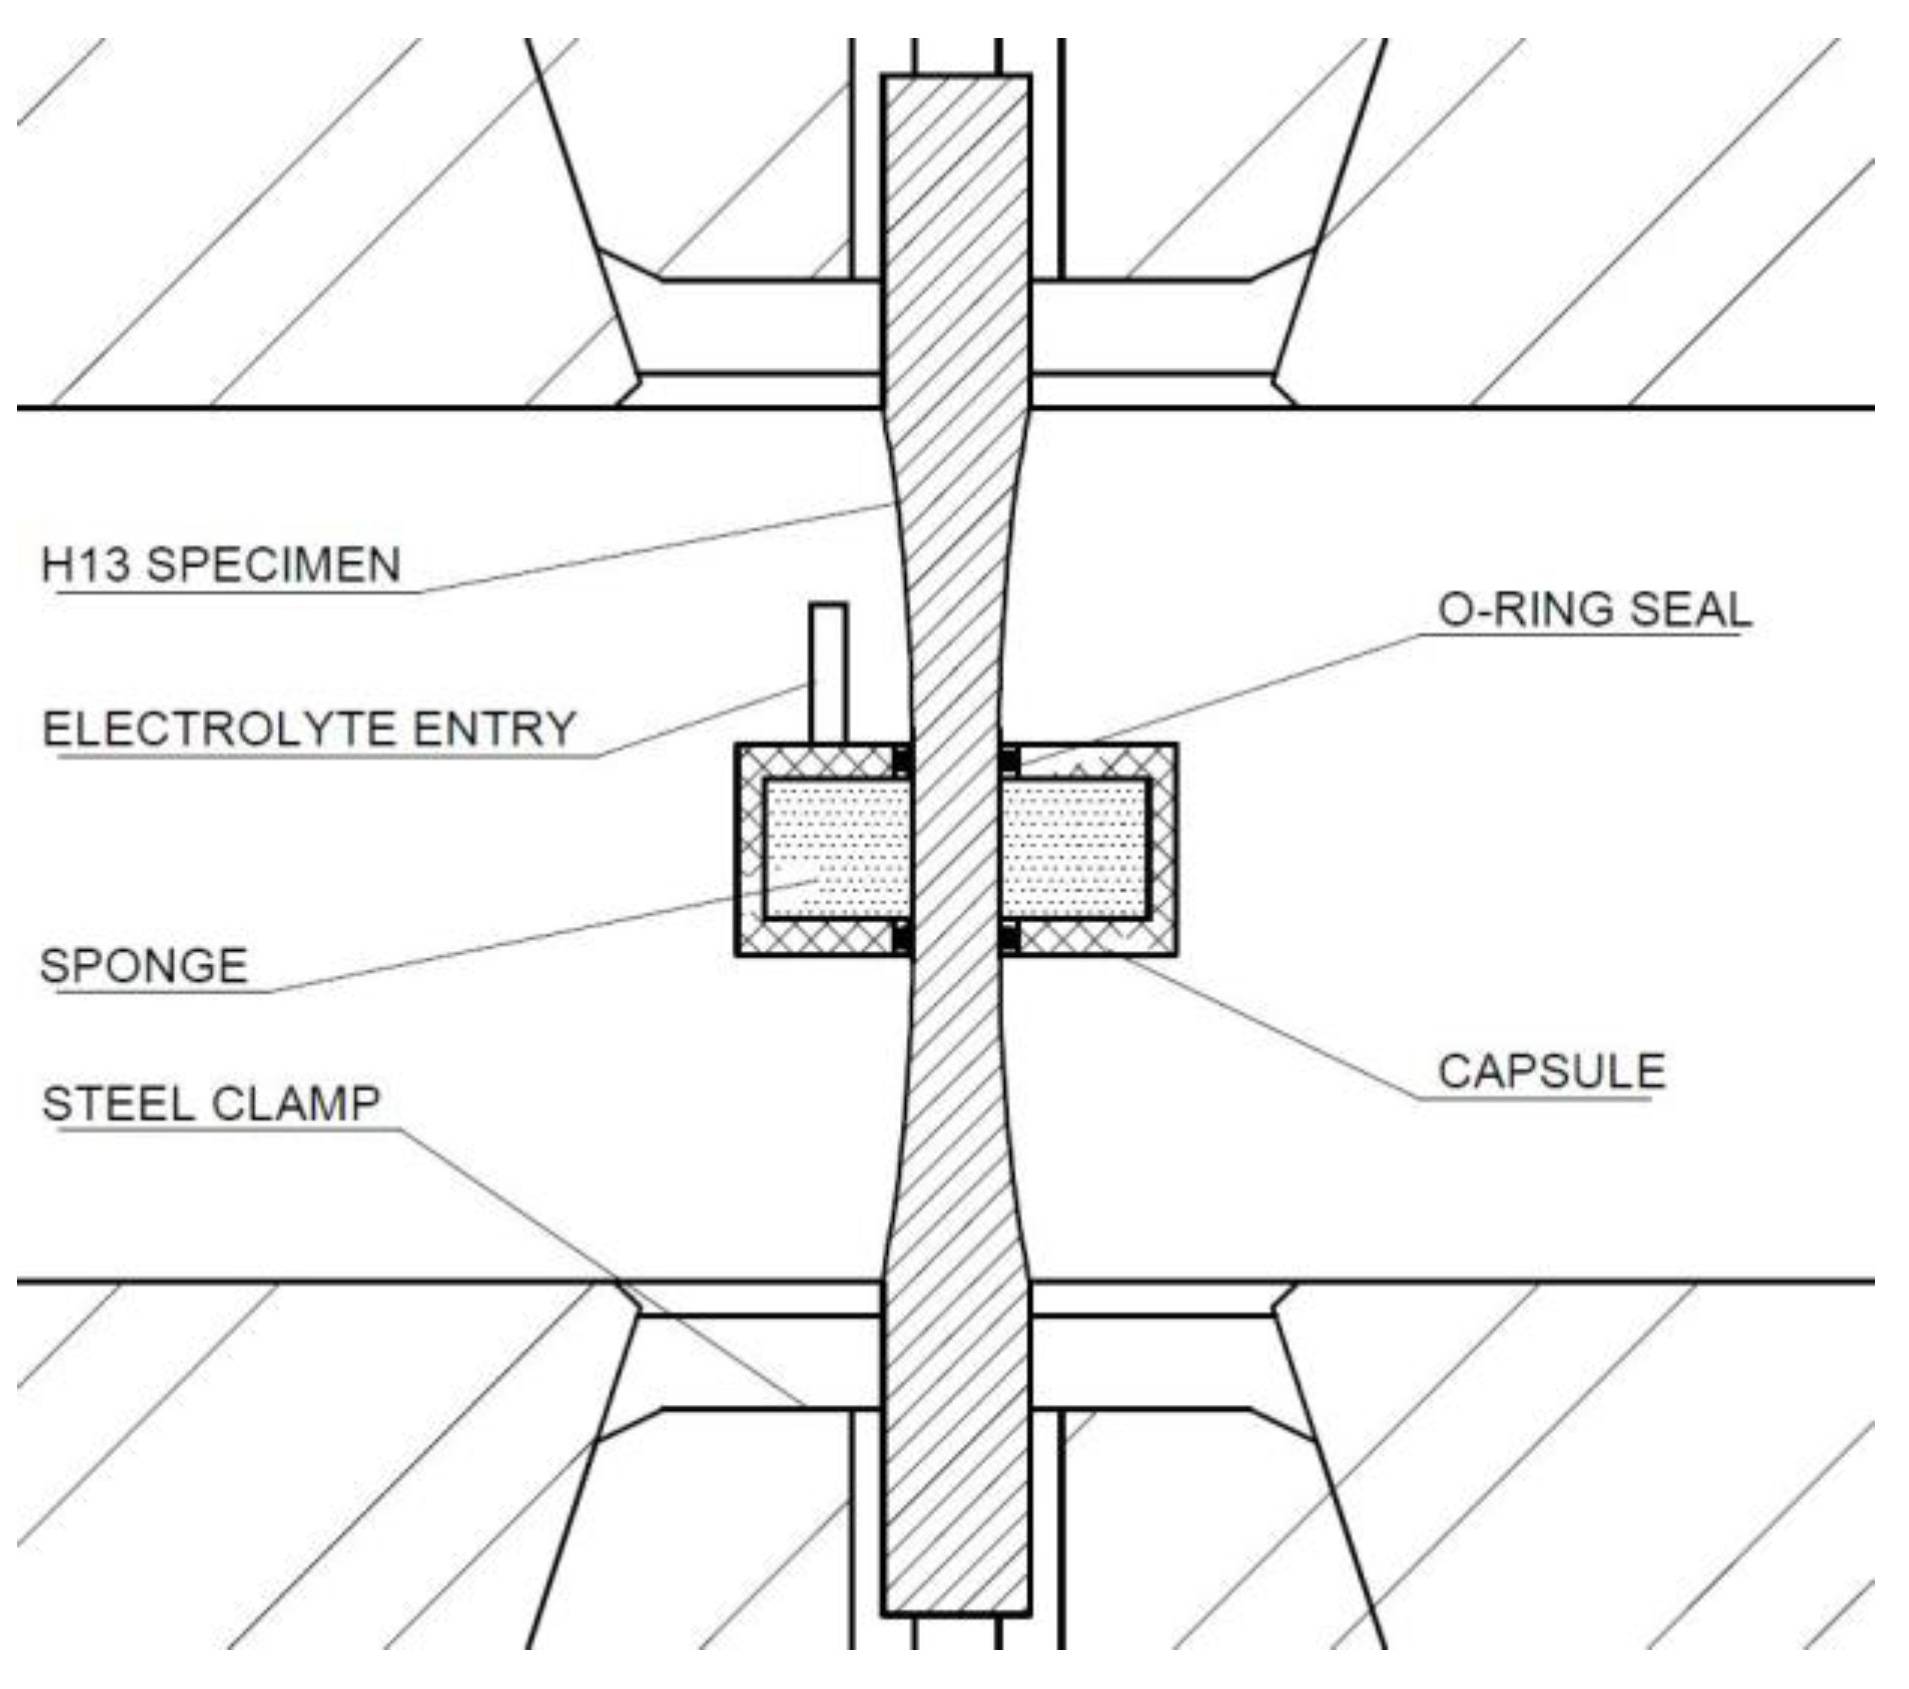
2.3. Characterisation Methods
3. Results
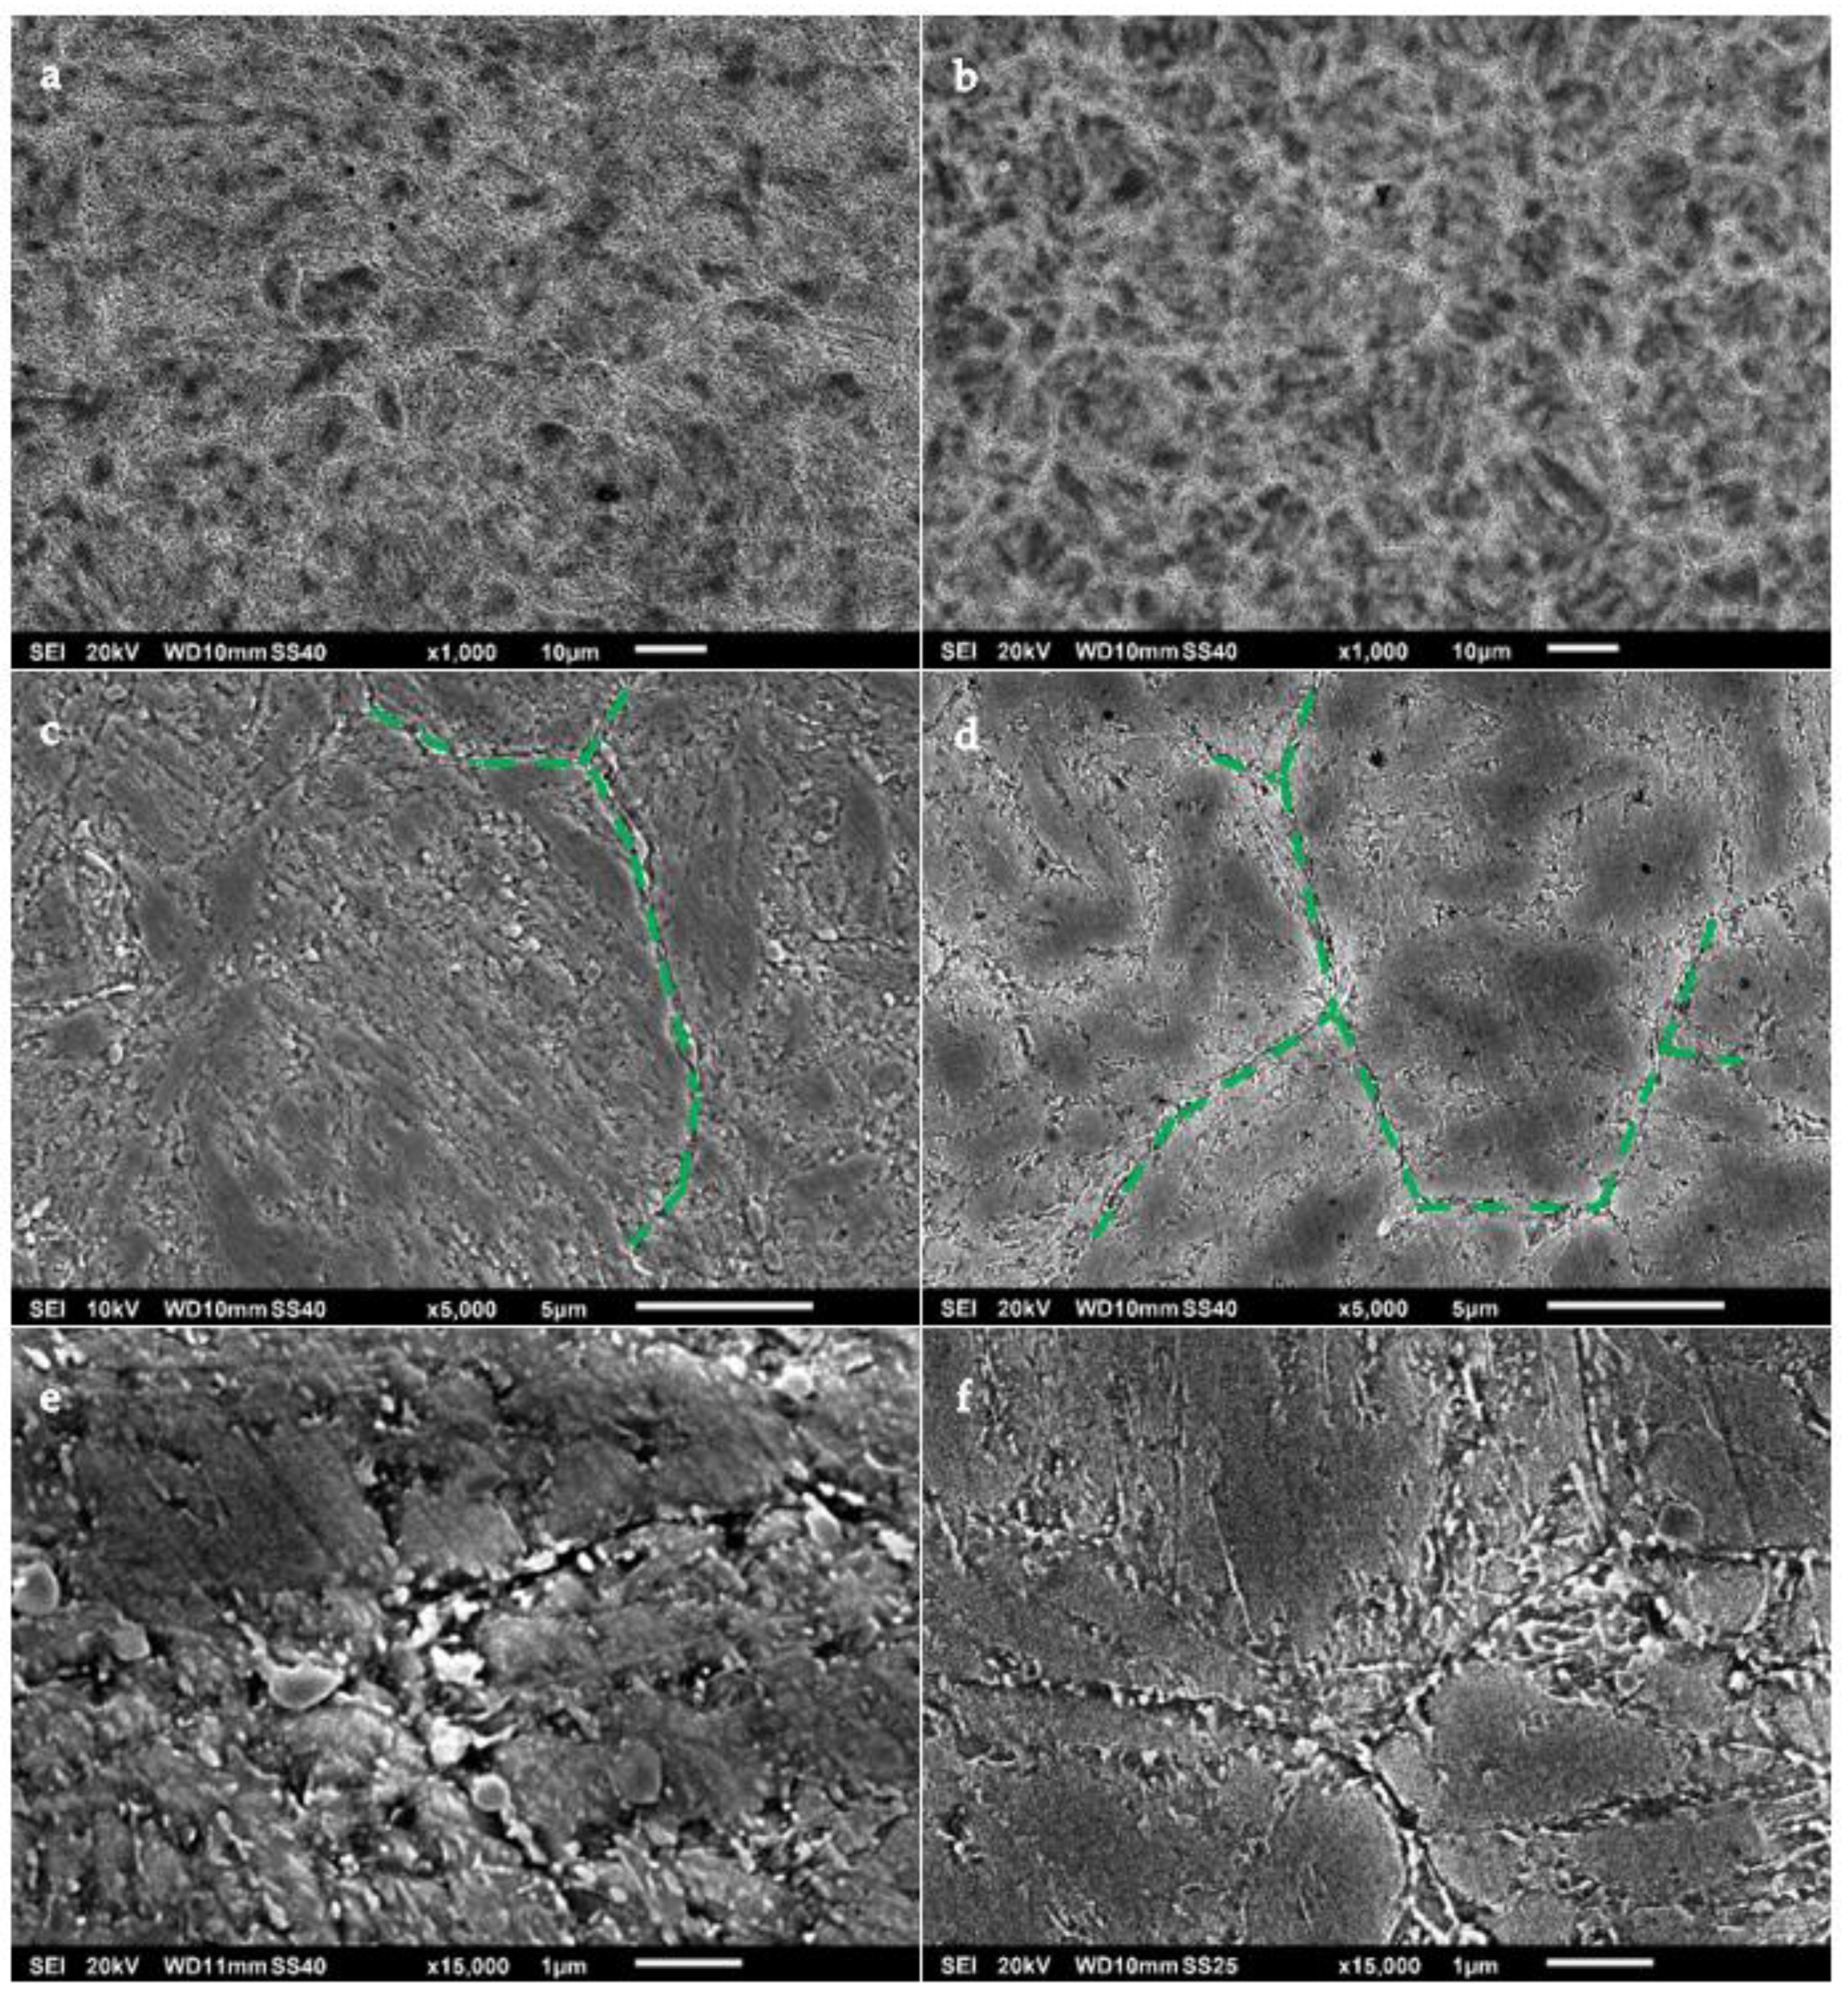
3.1. Microstructure
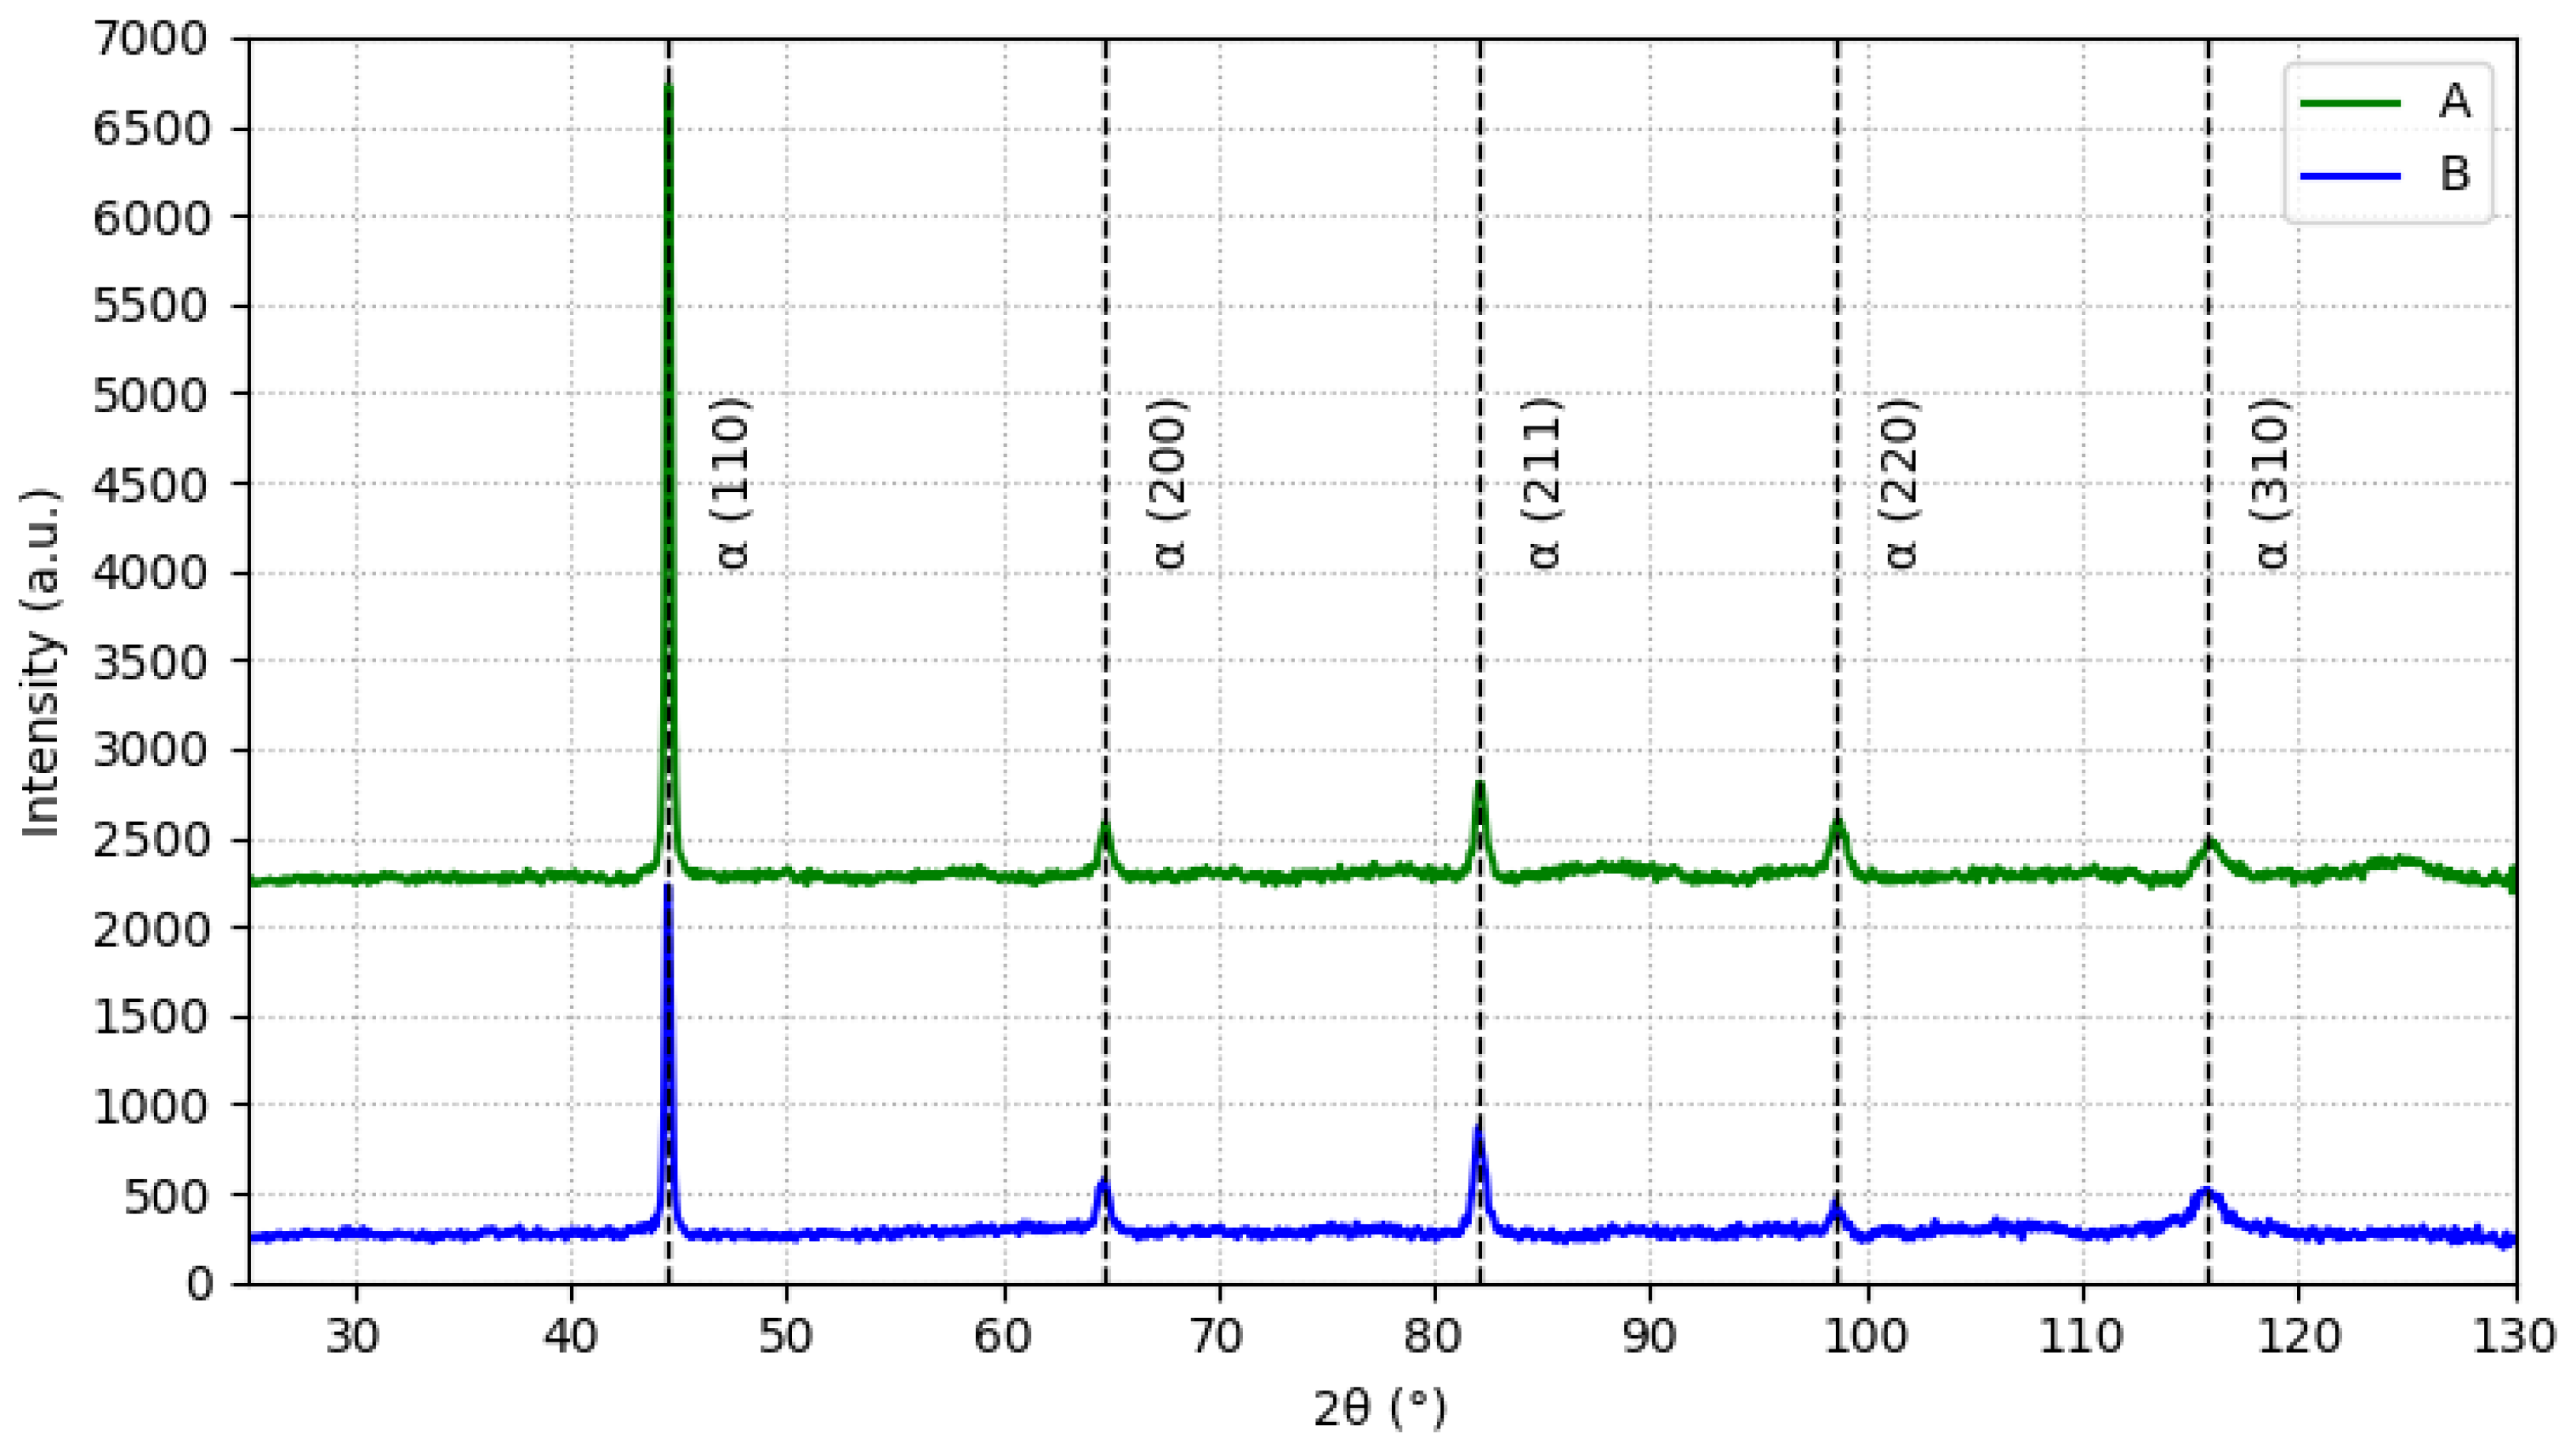
3.2. XRD
3.3. Hardness
3.4. Tensile Tests
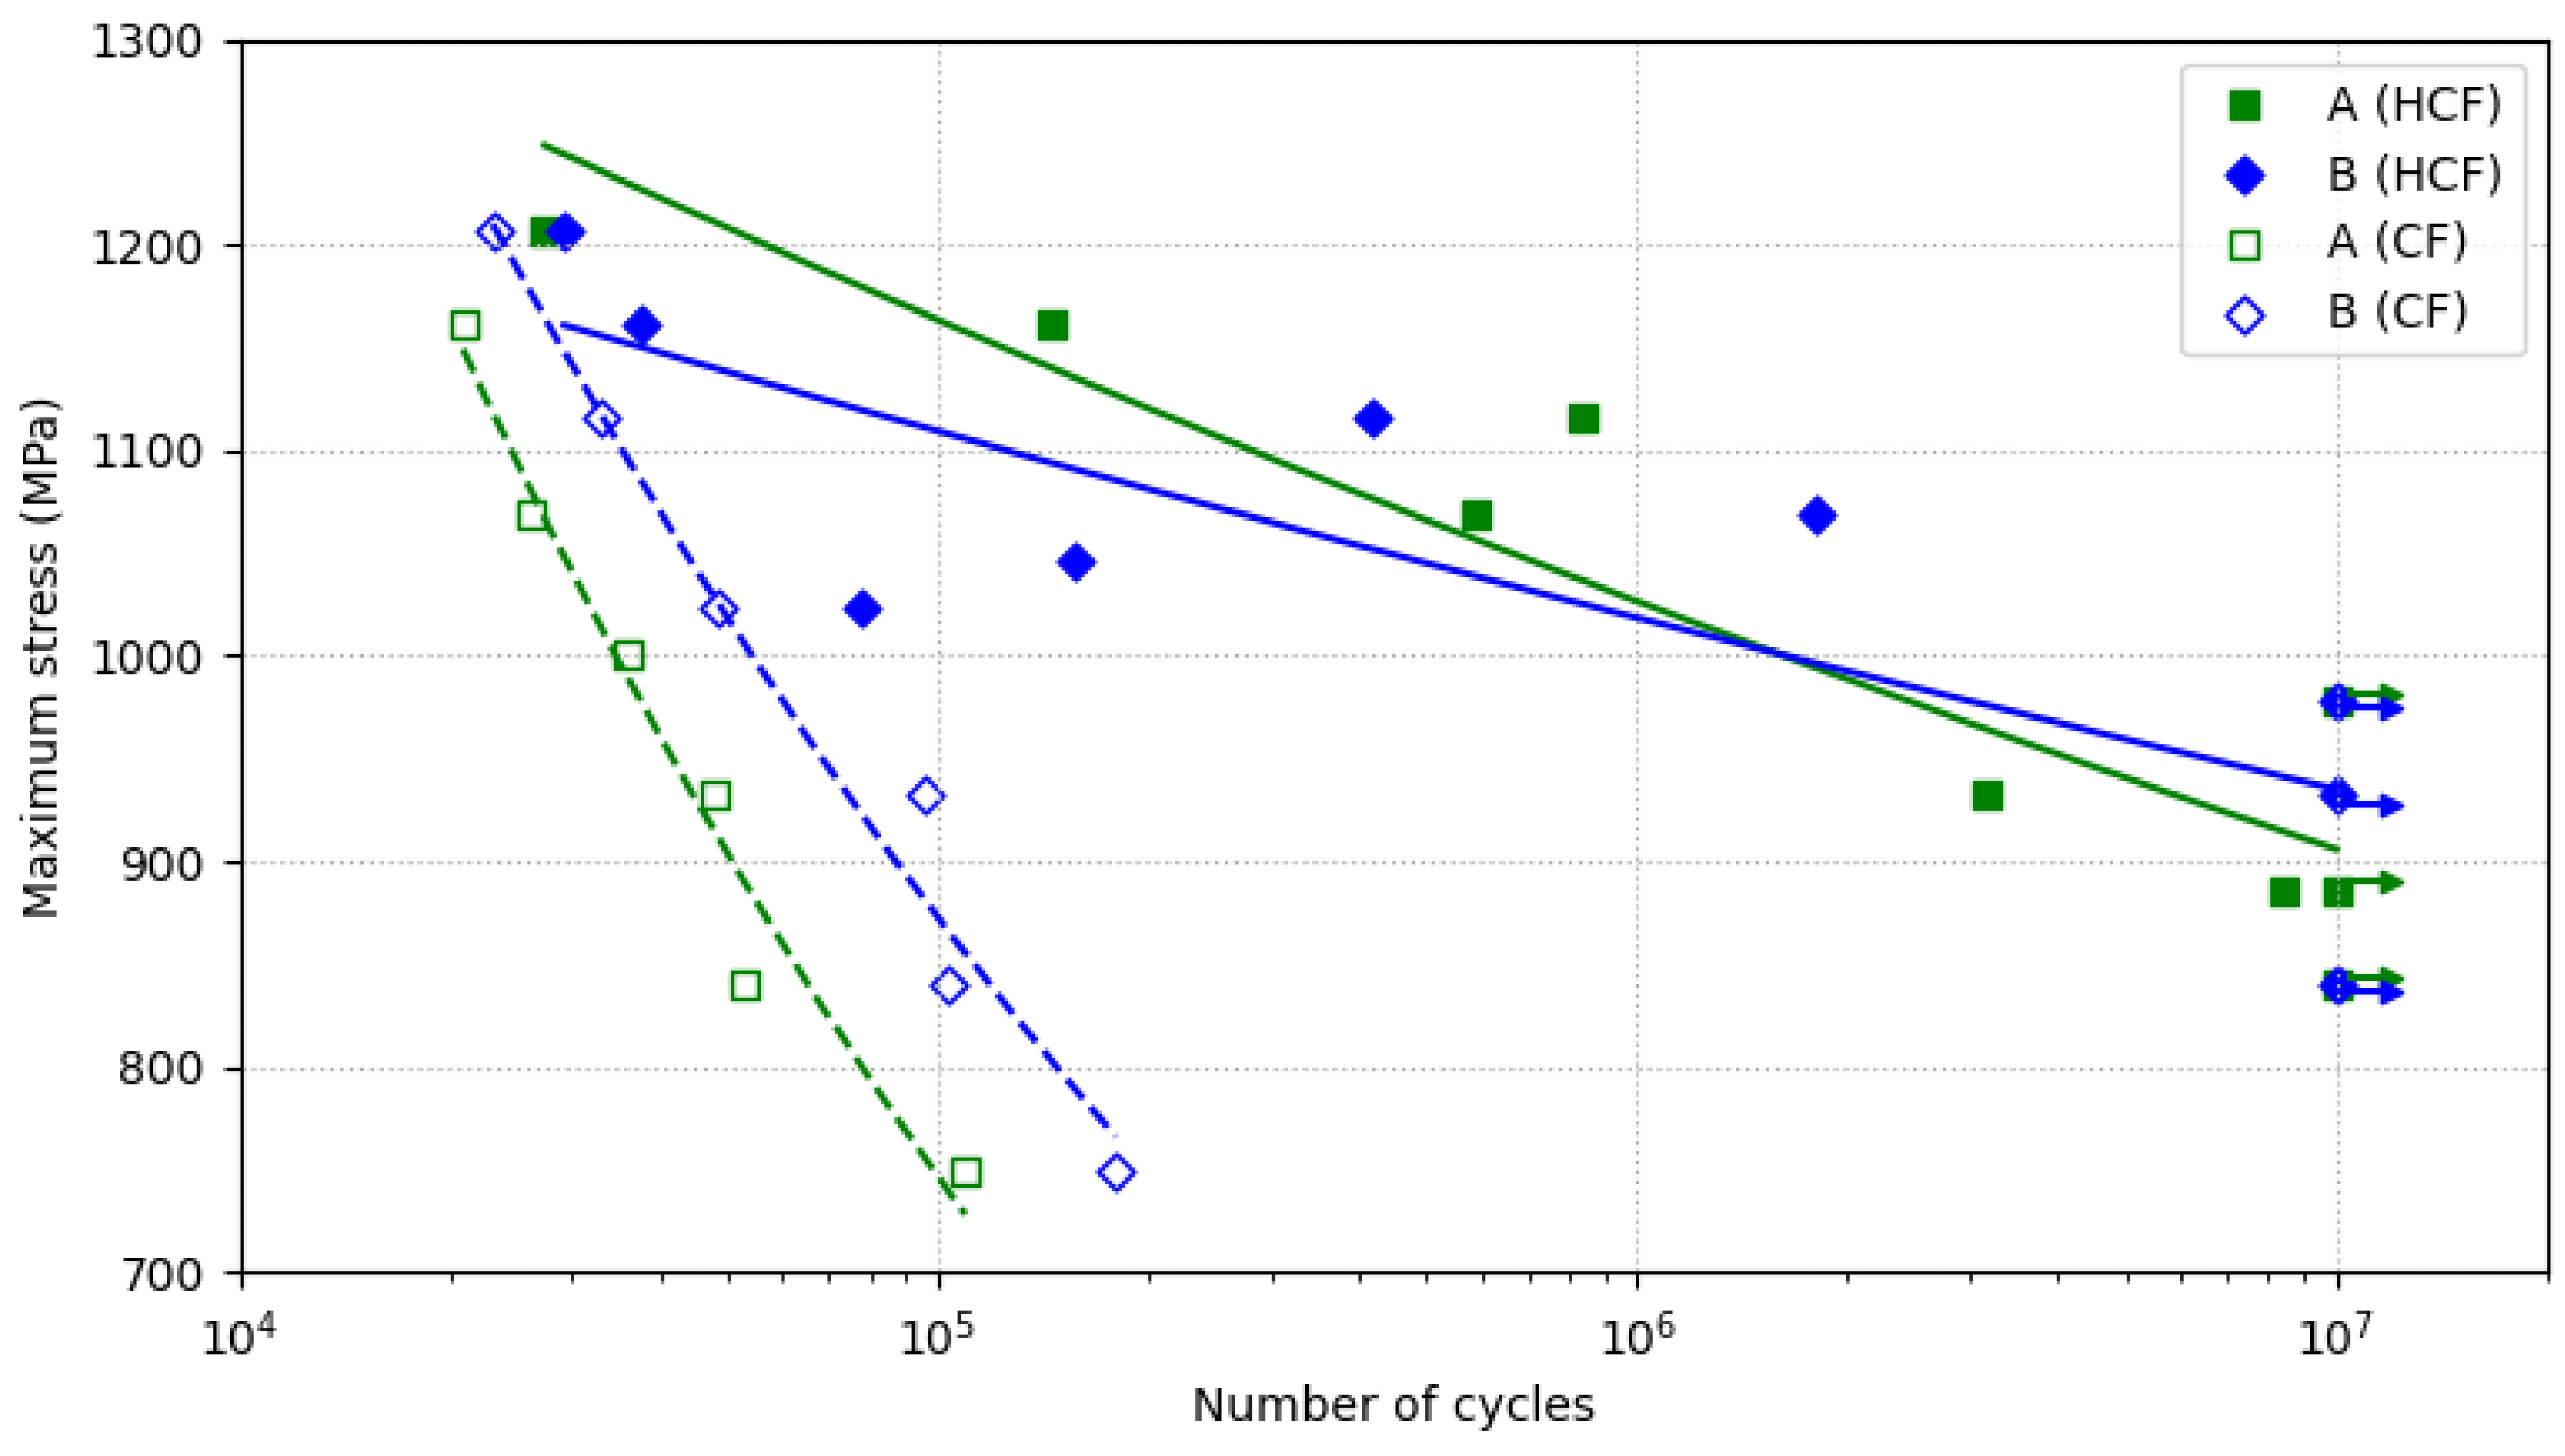
3.5. Fatigue Tests
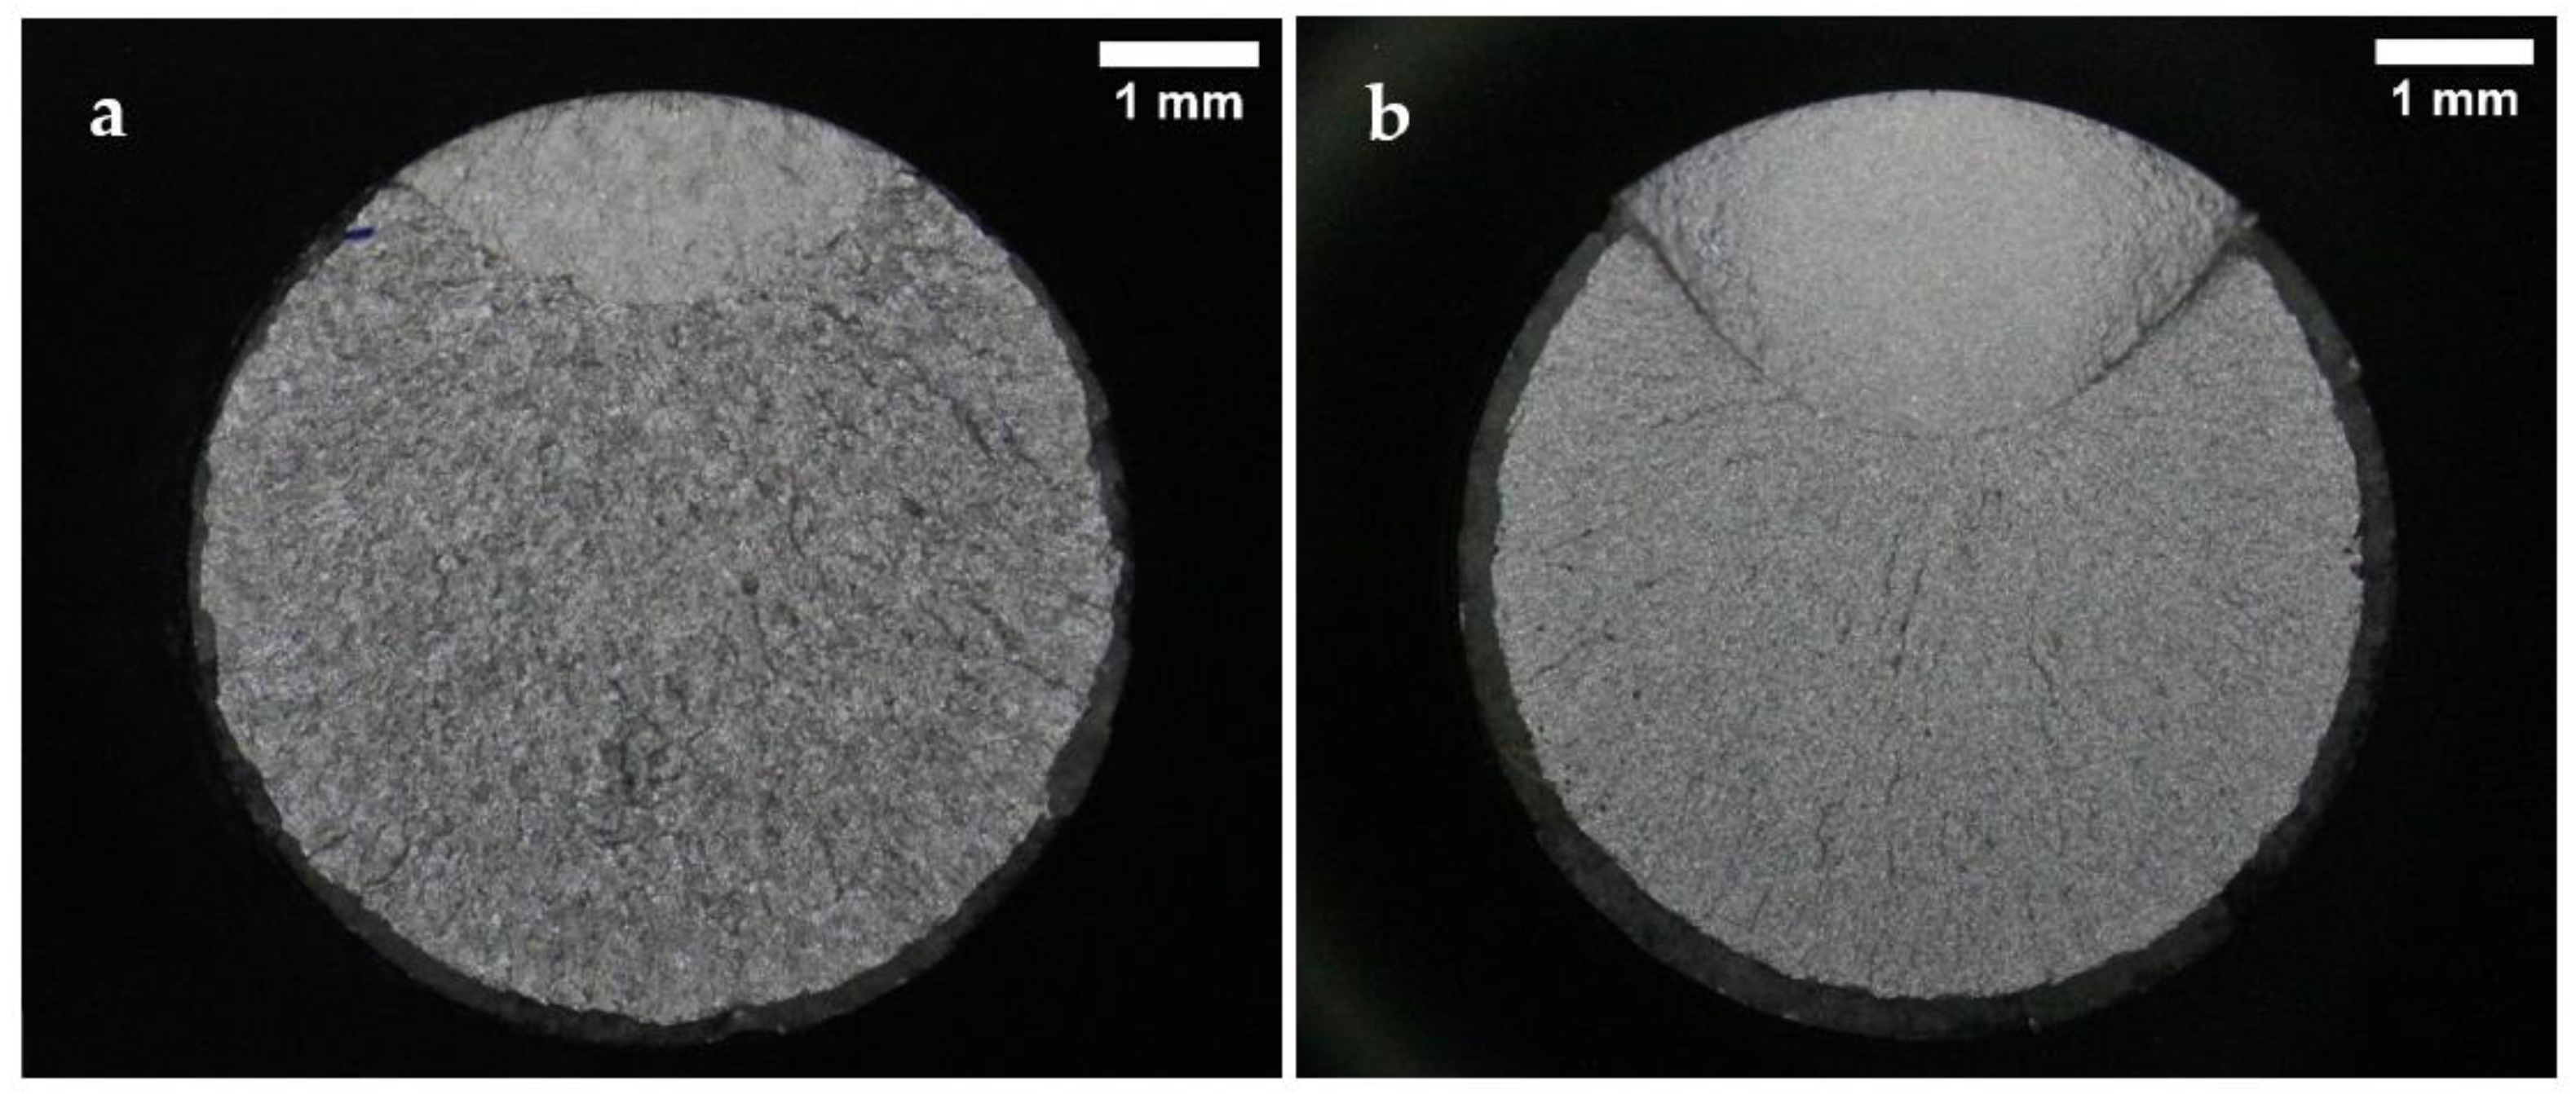
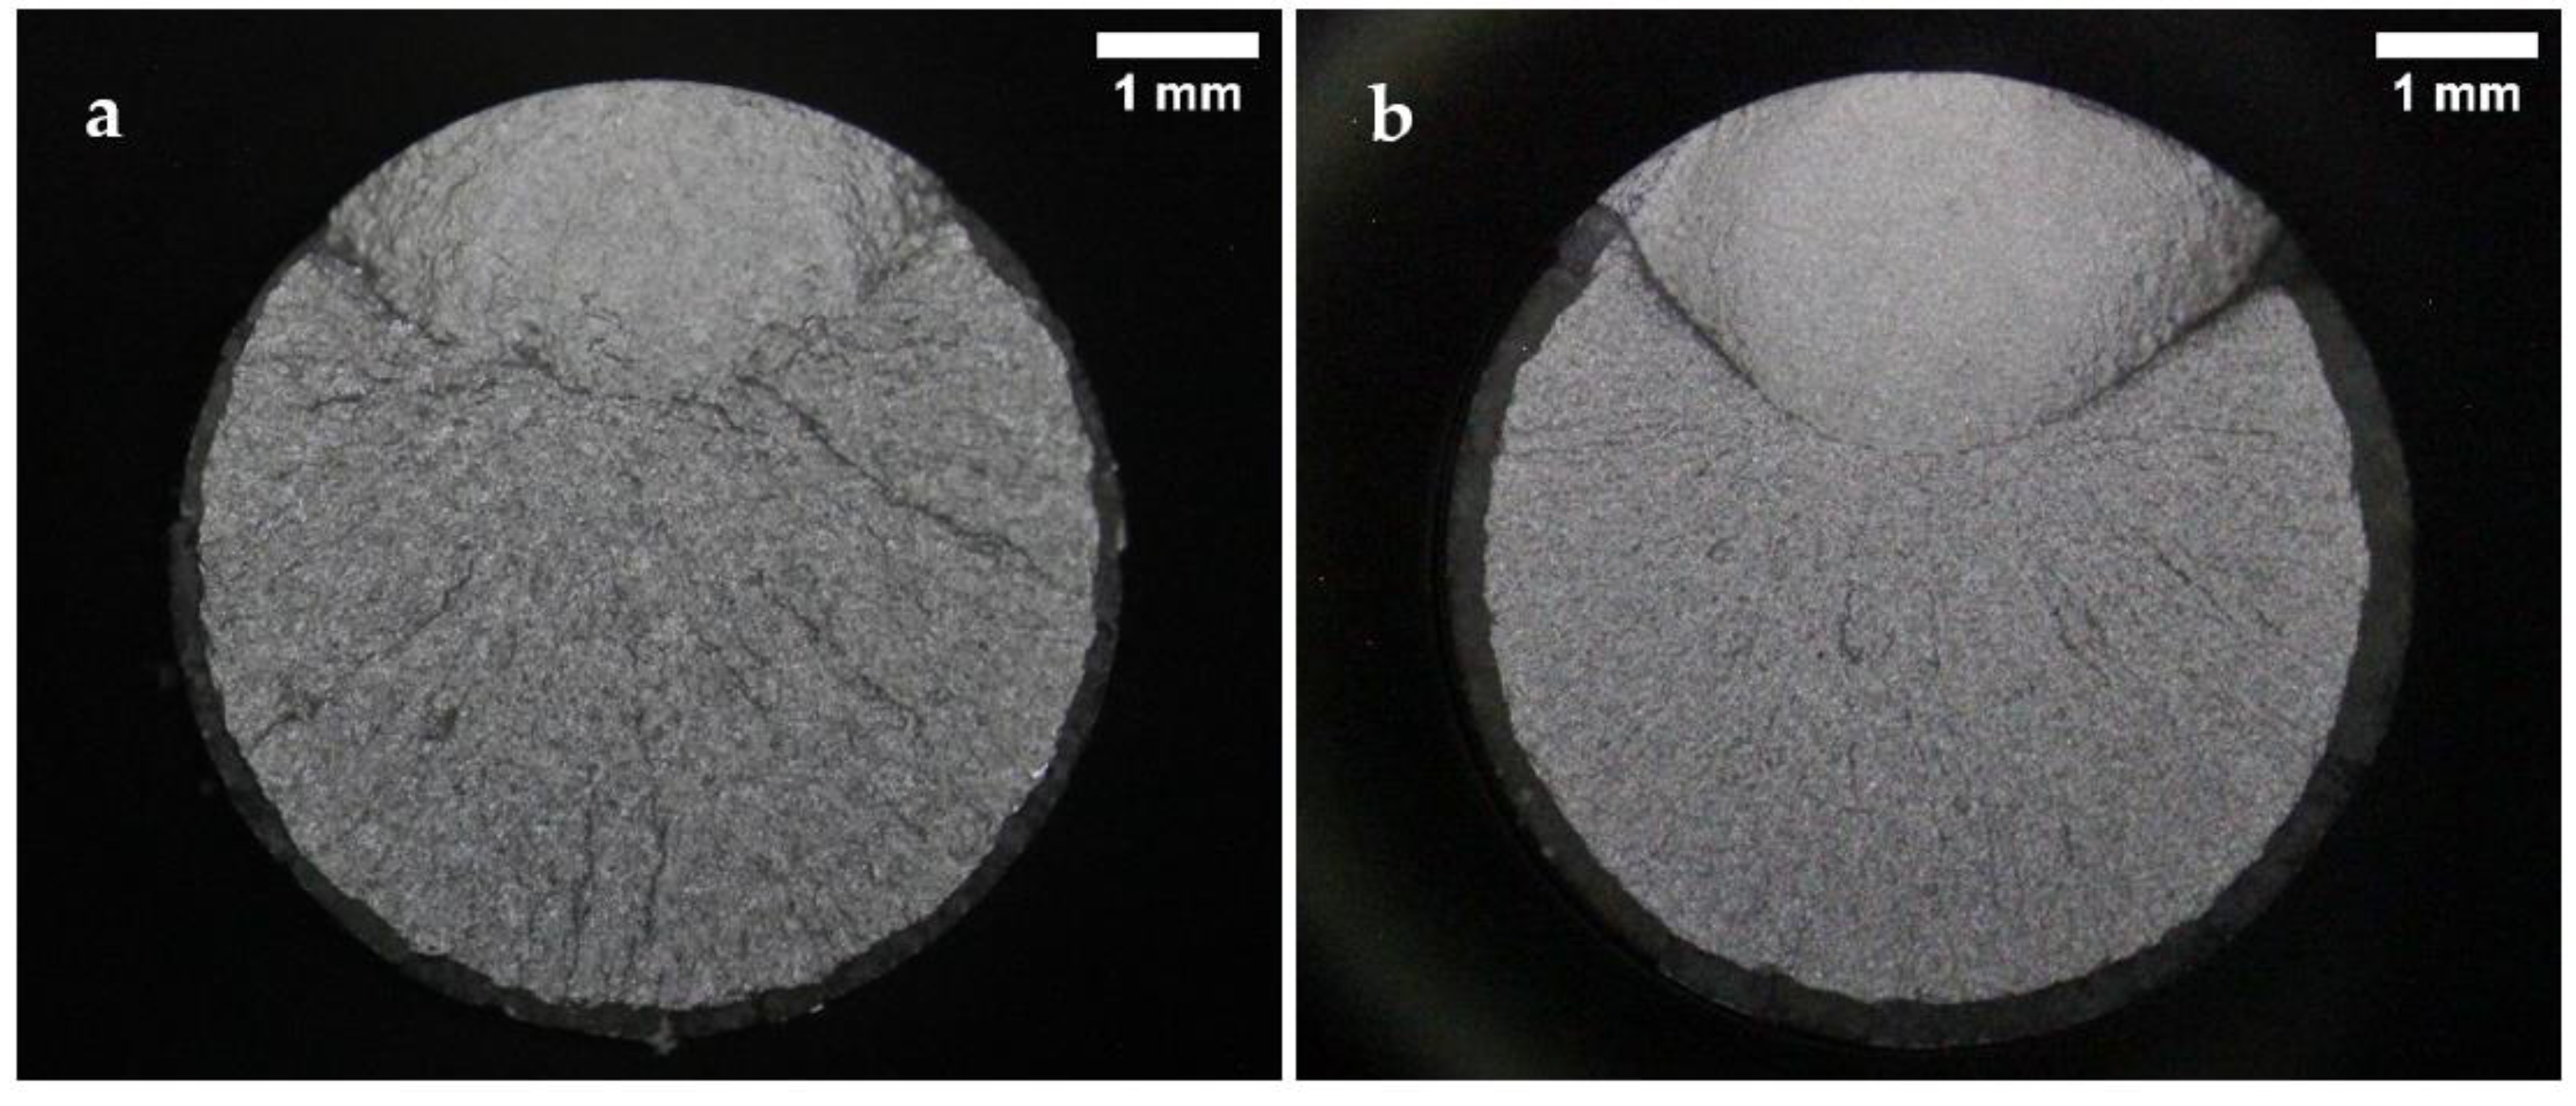
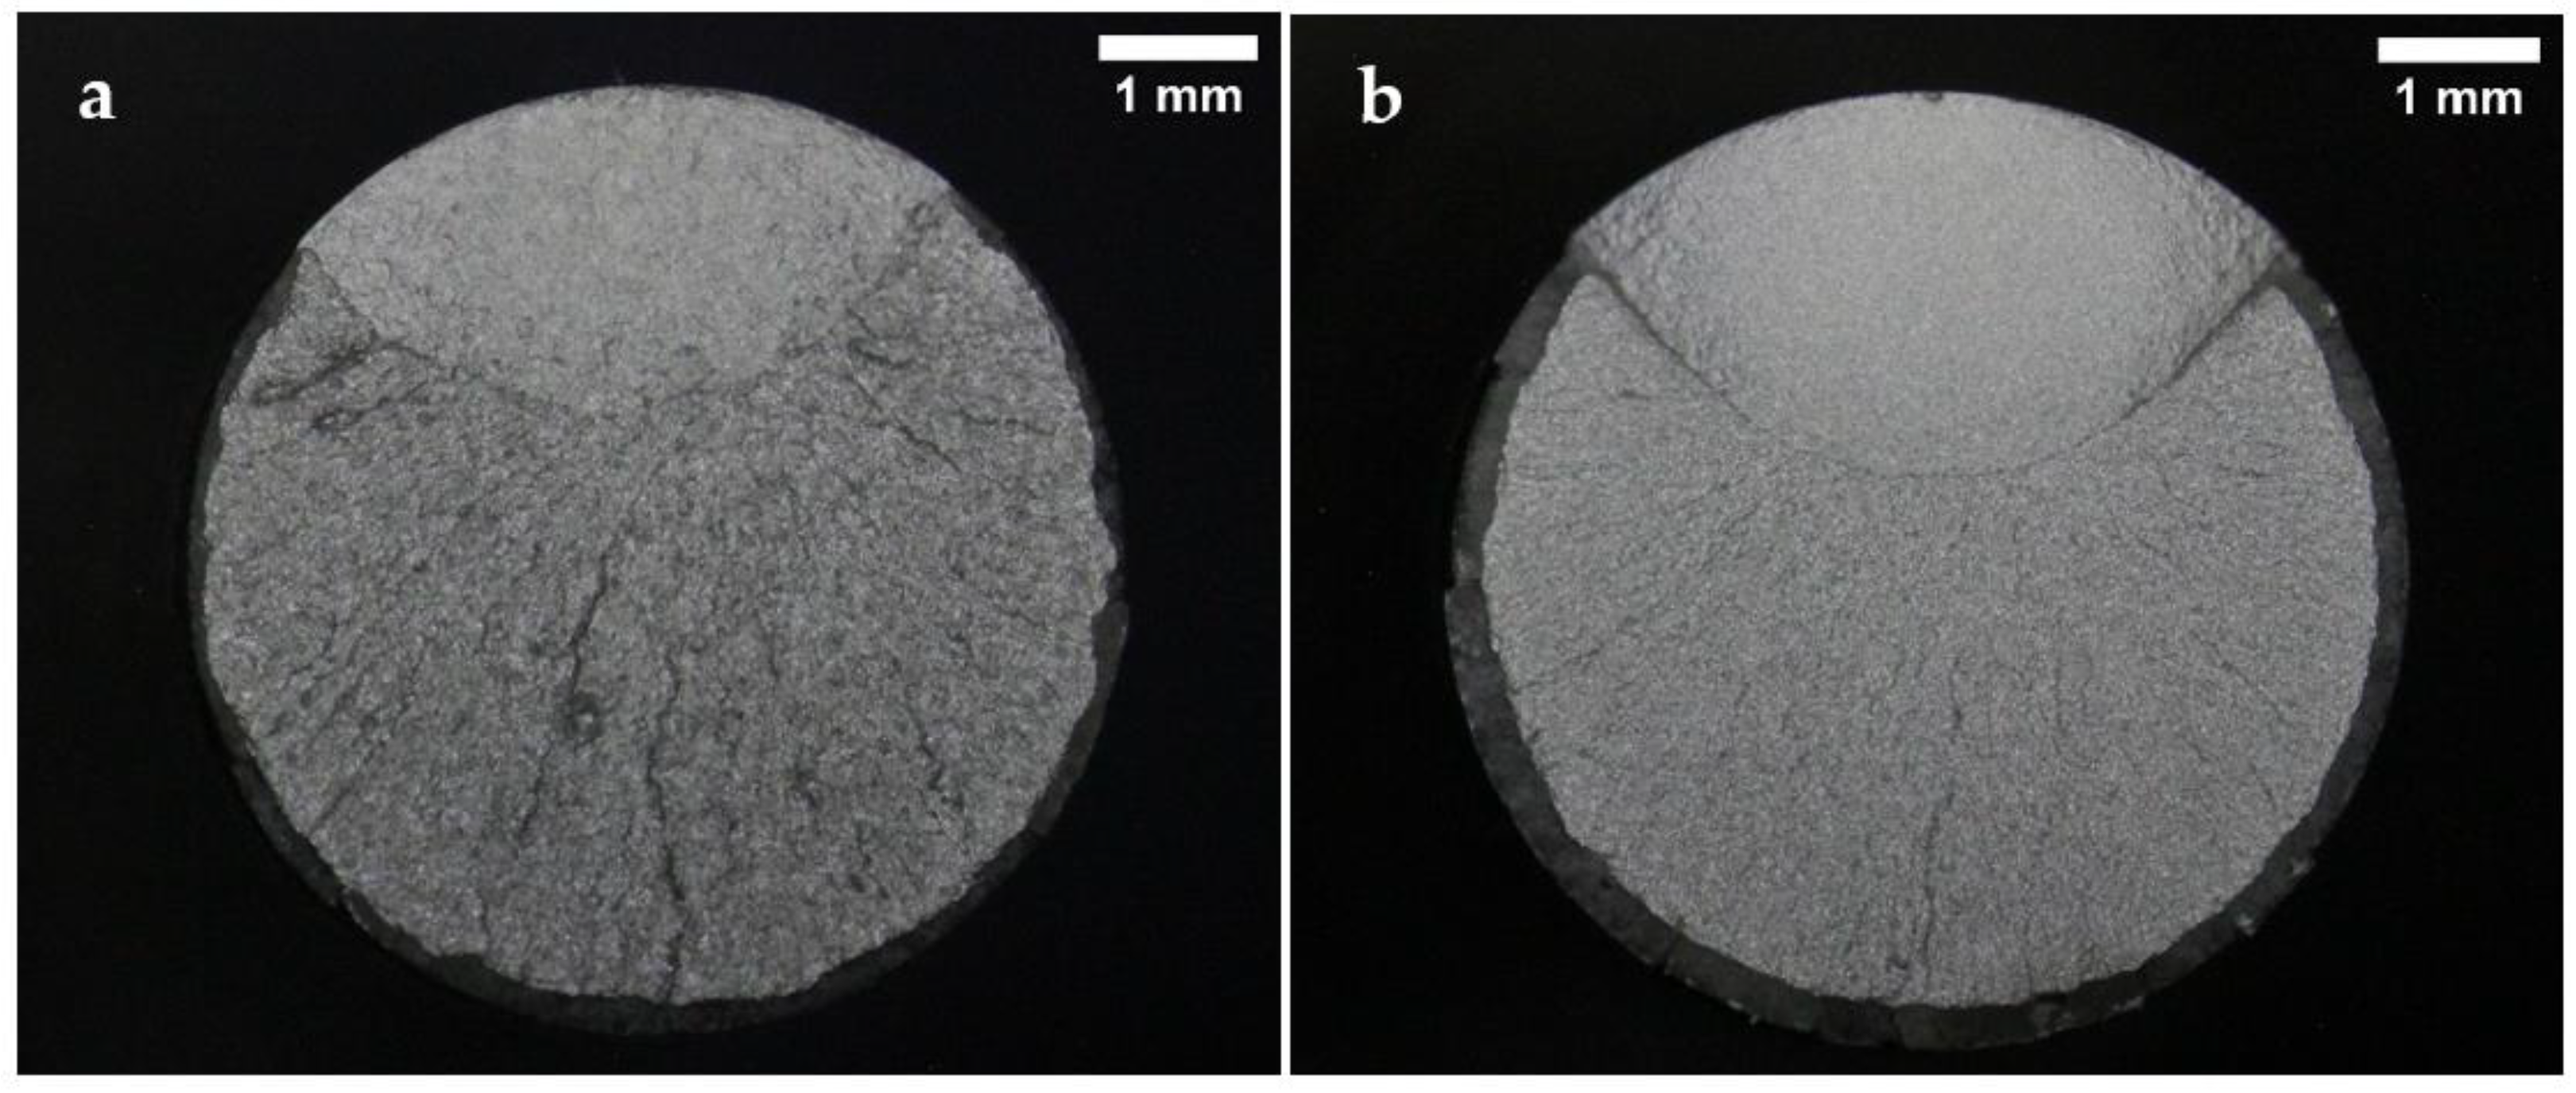
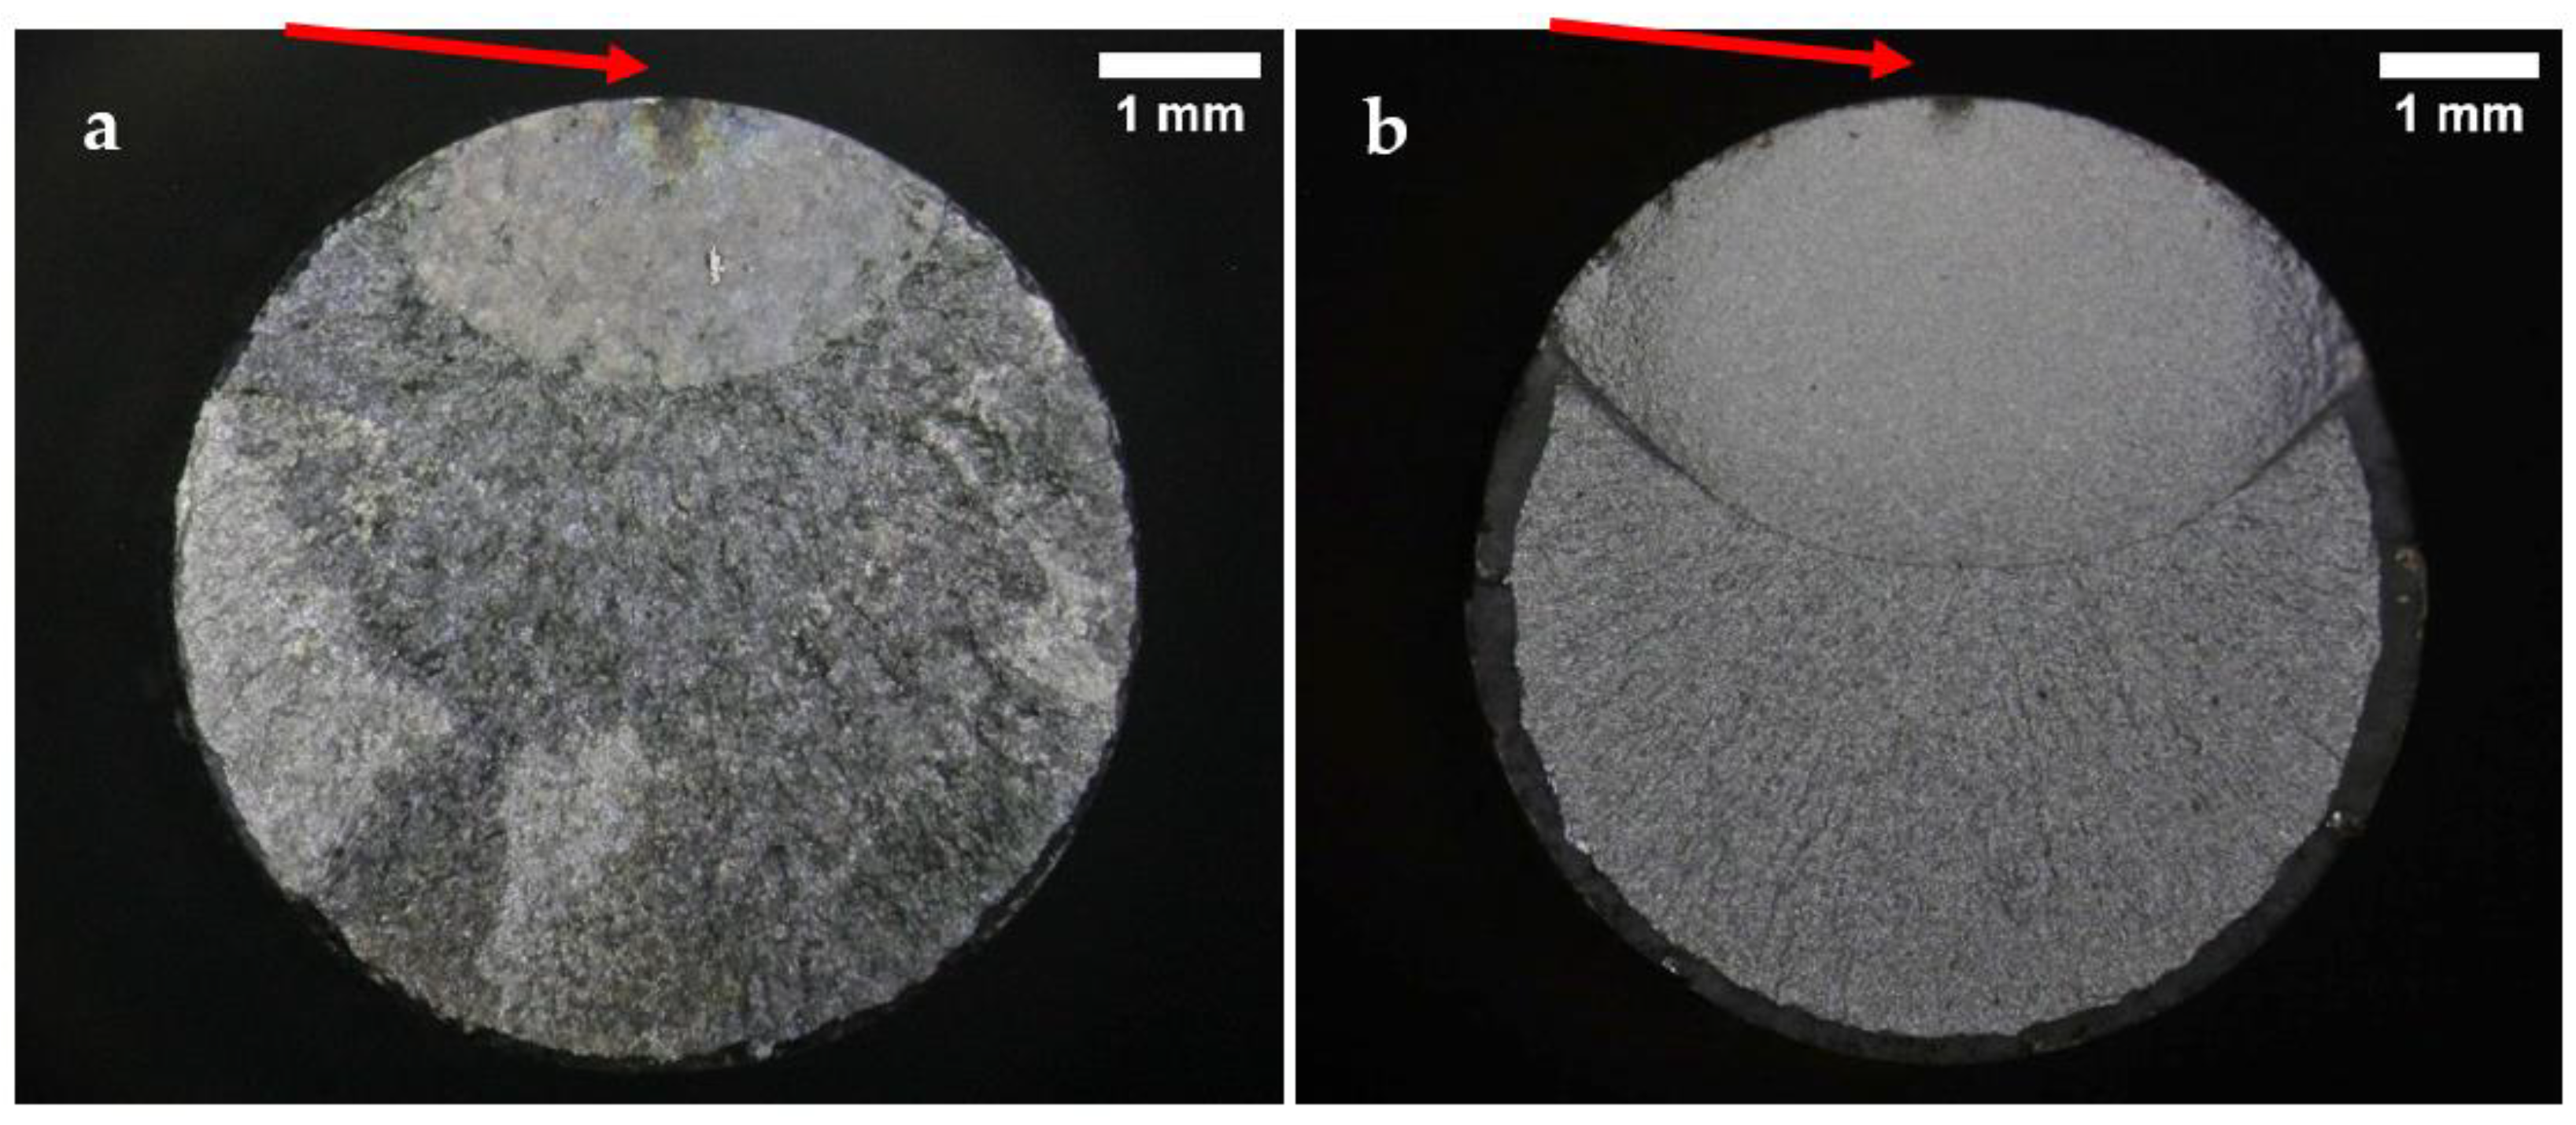
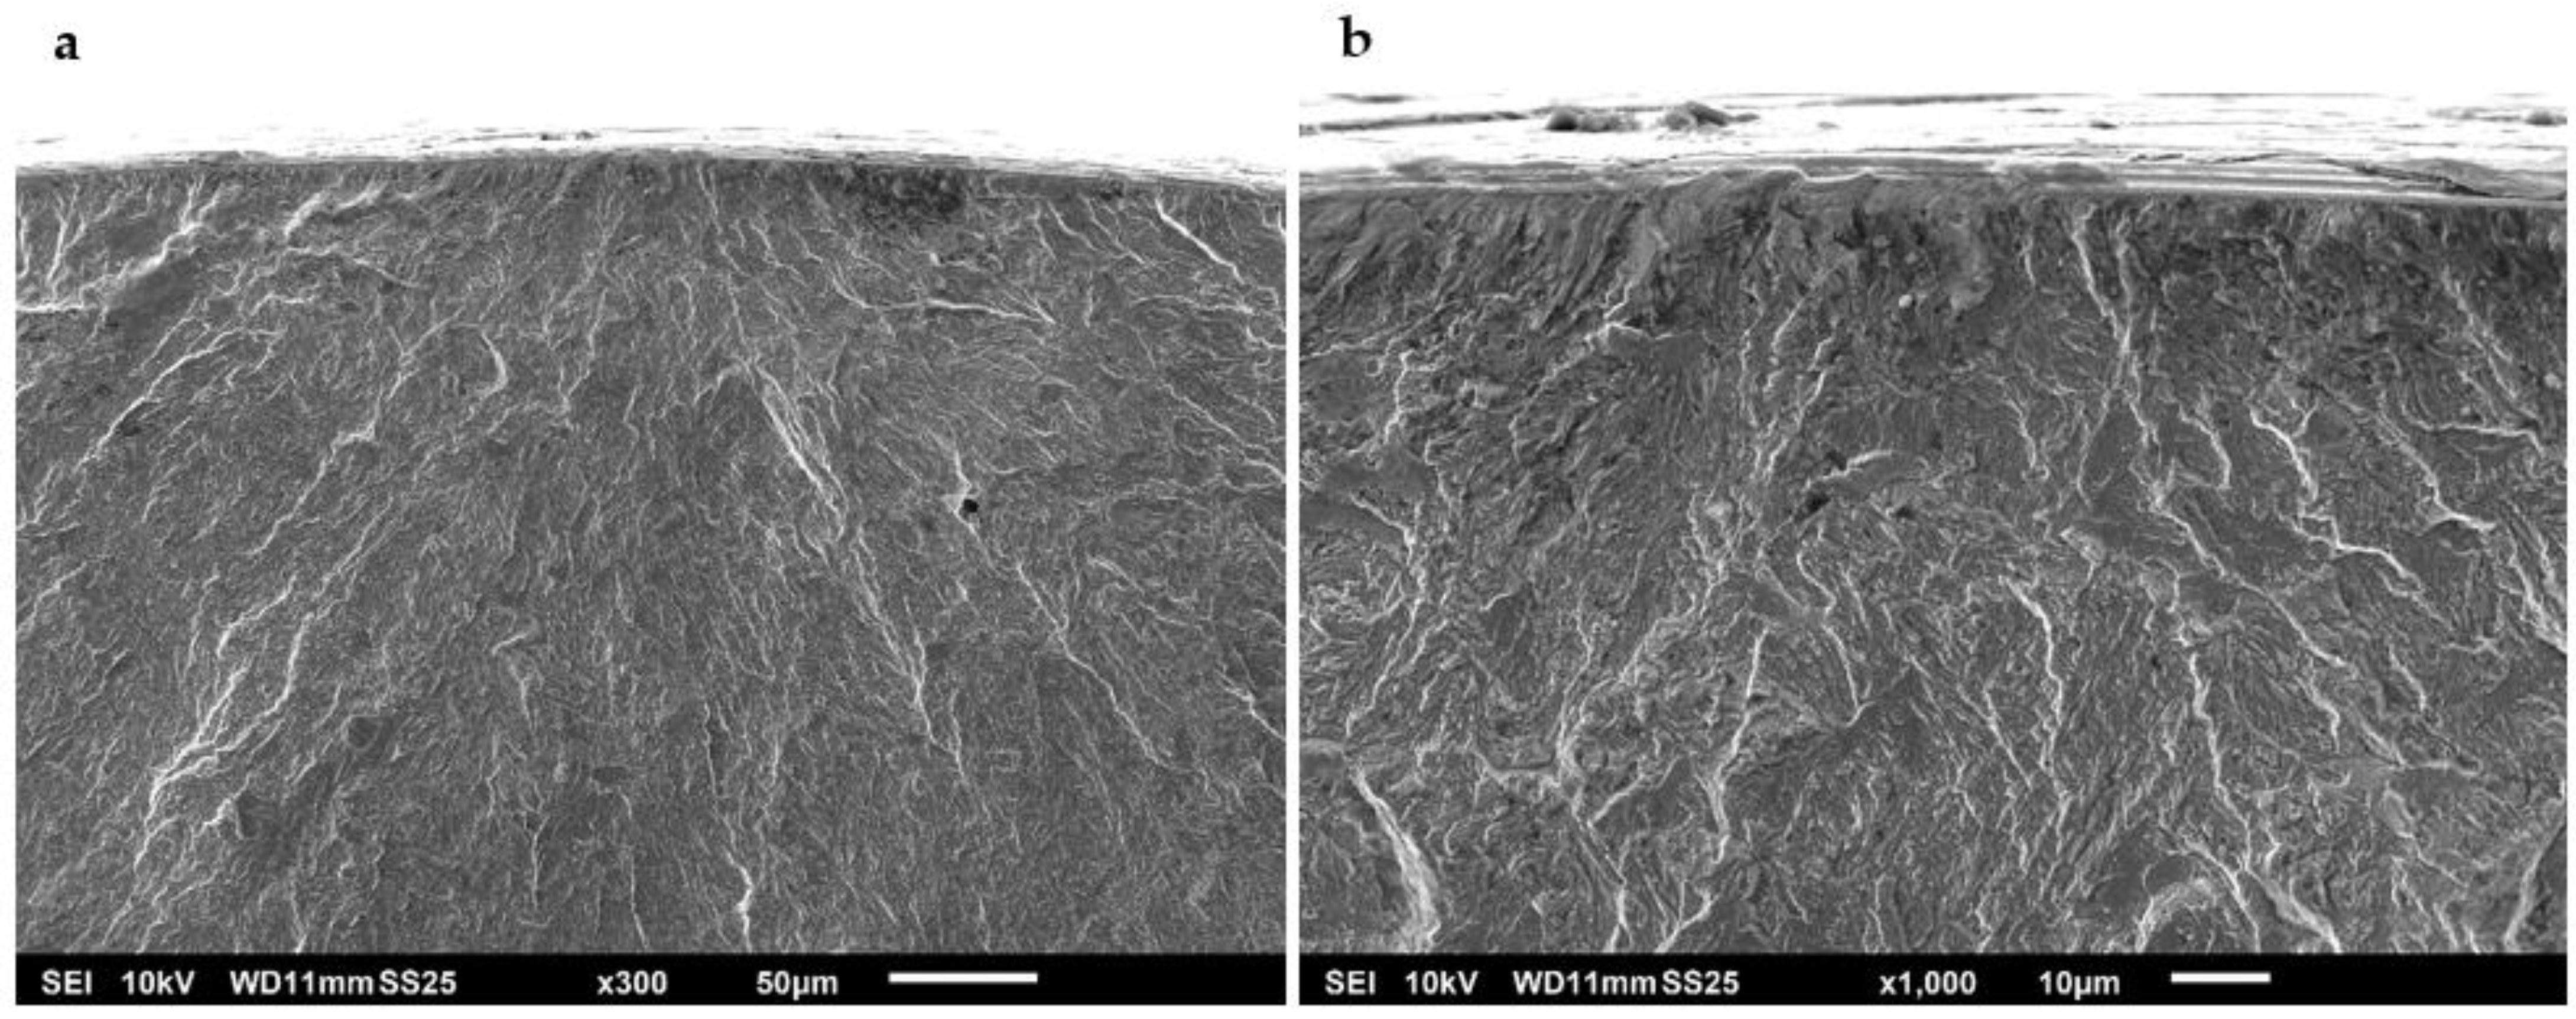
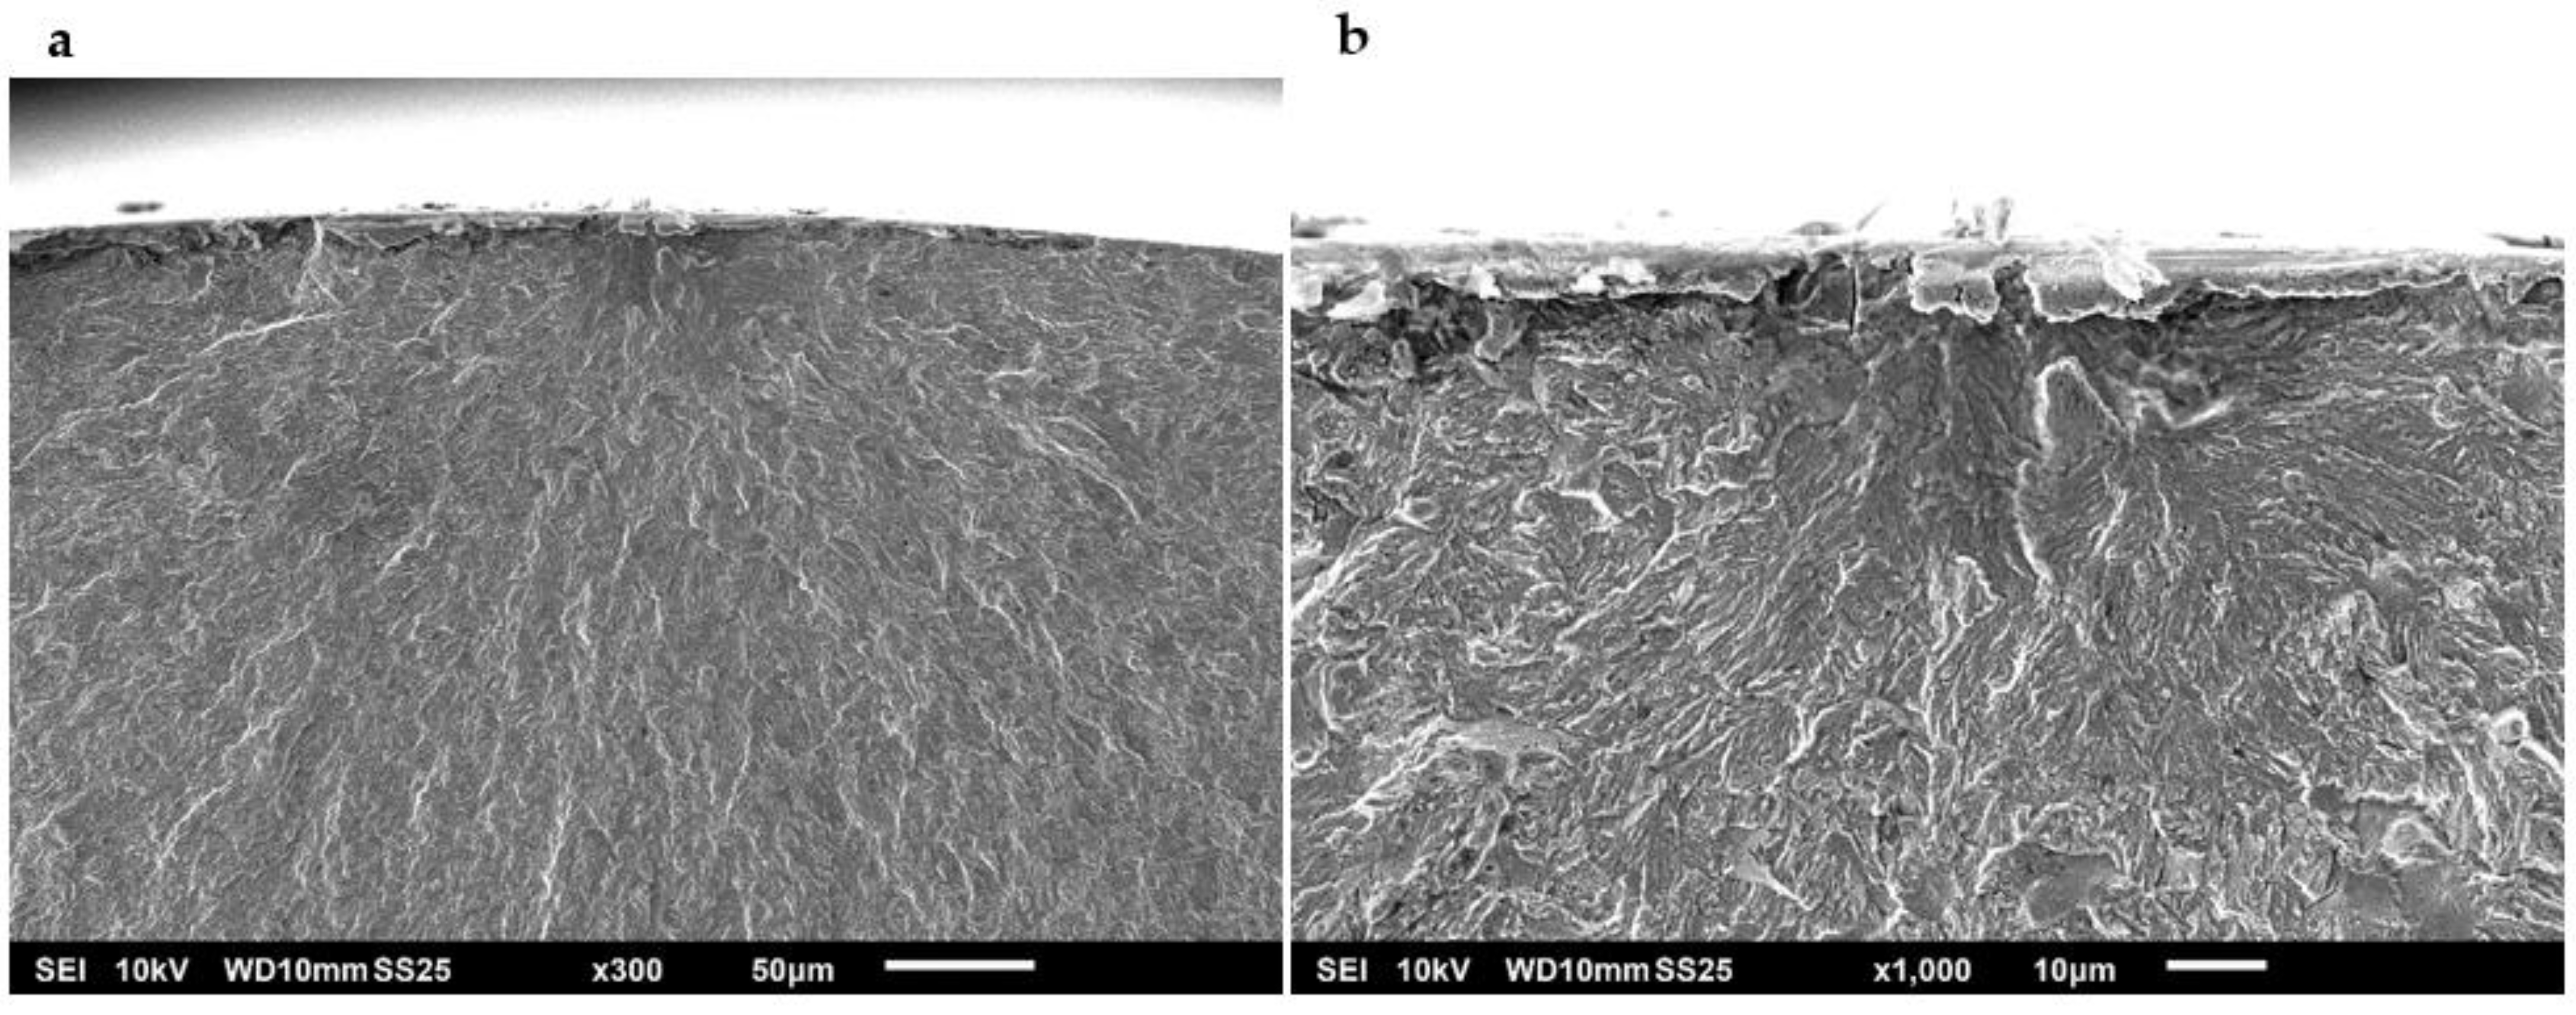
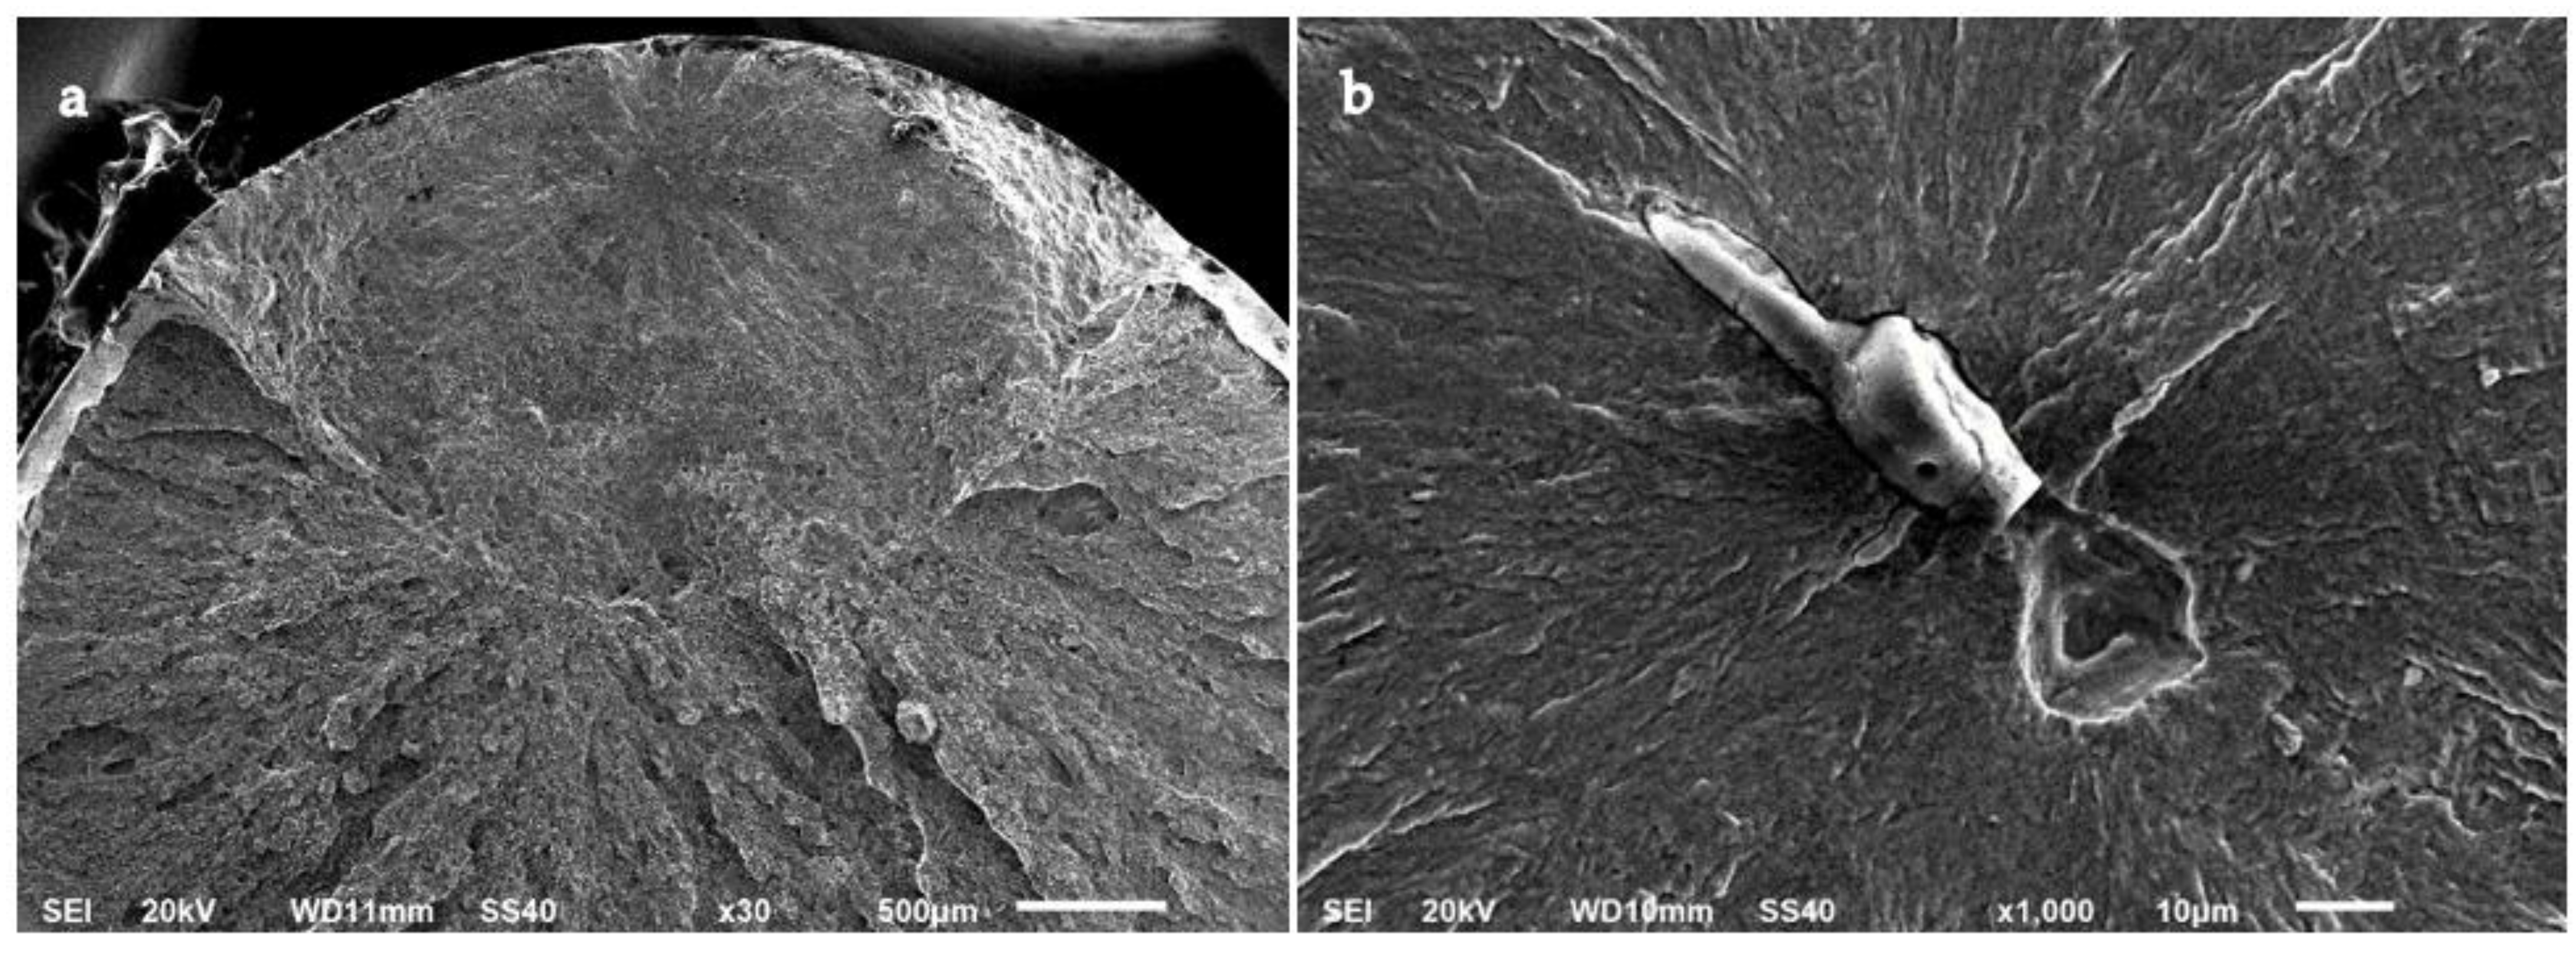
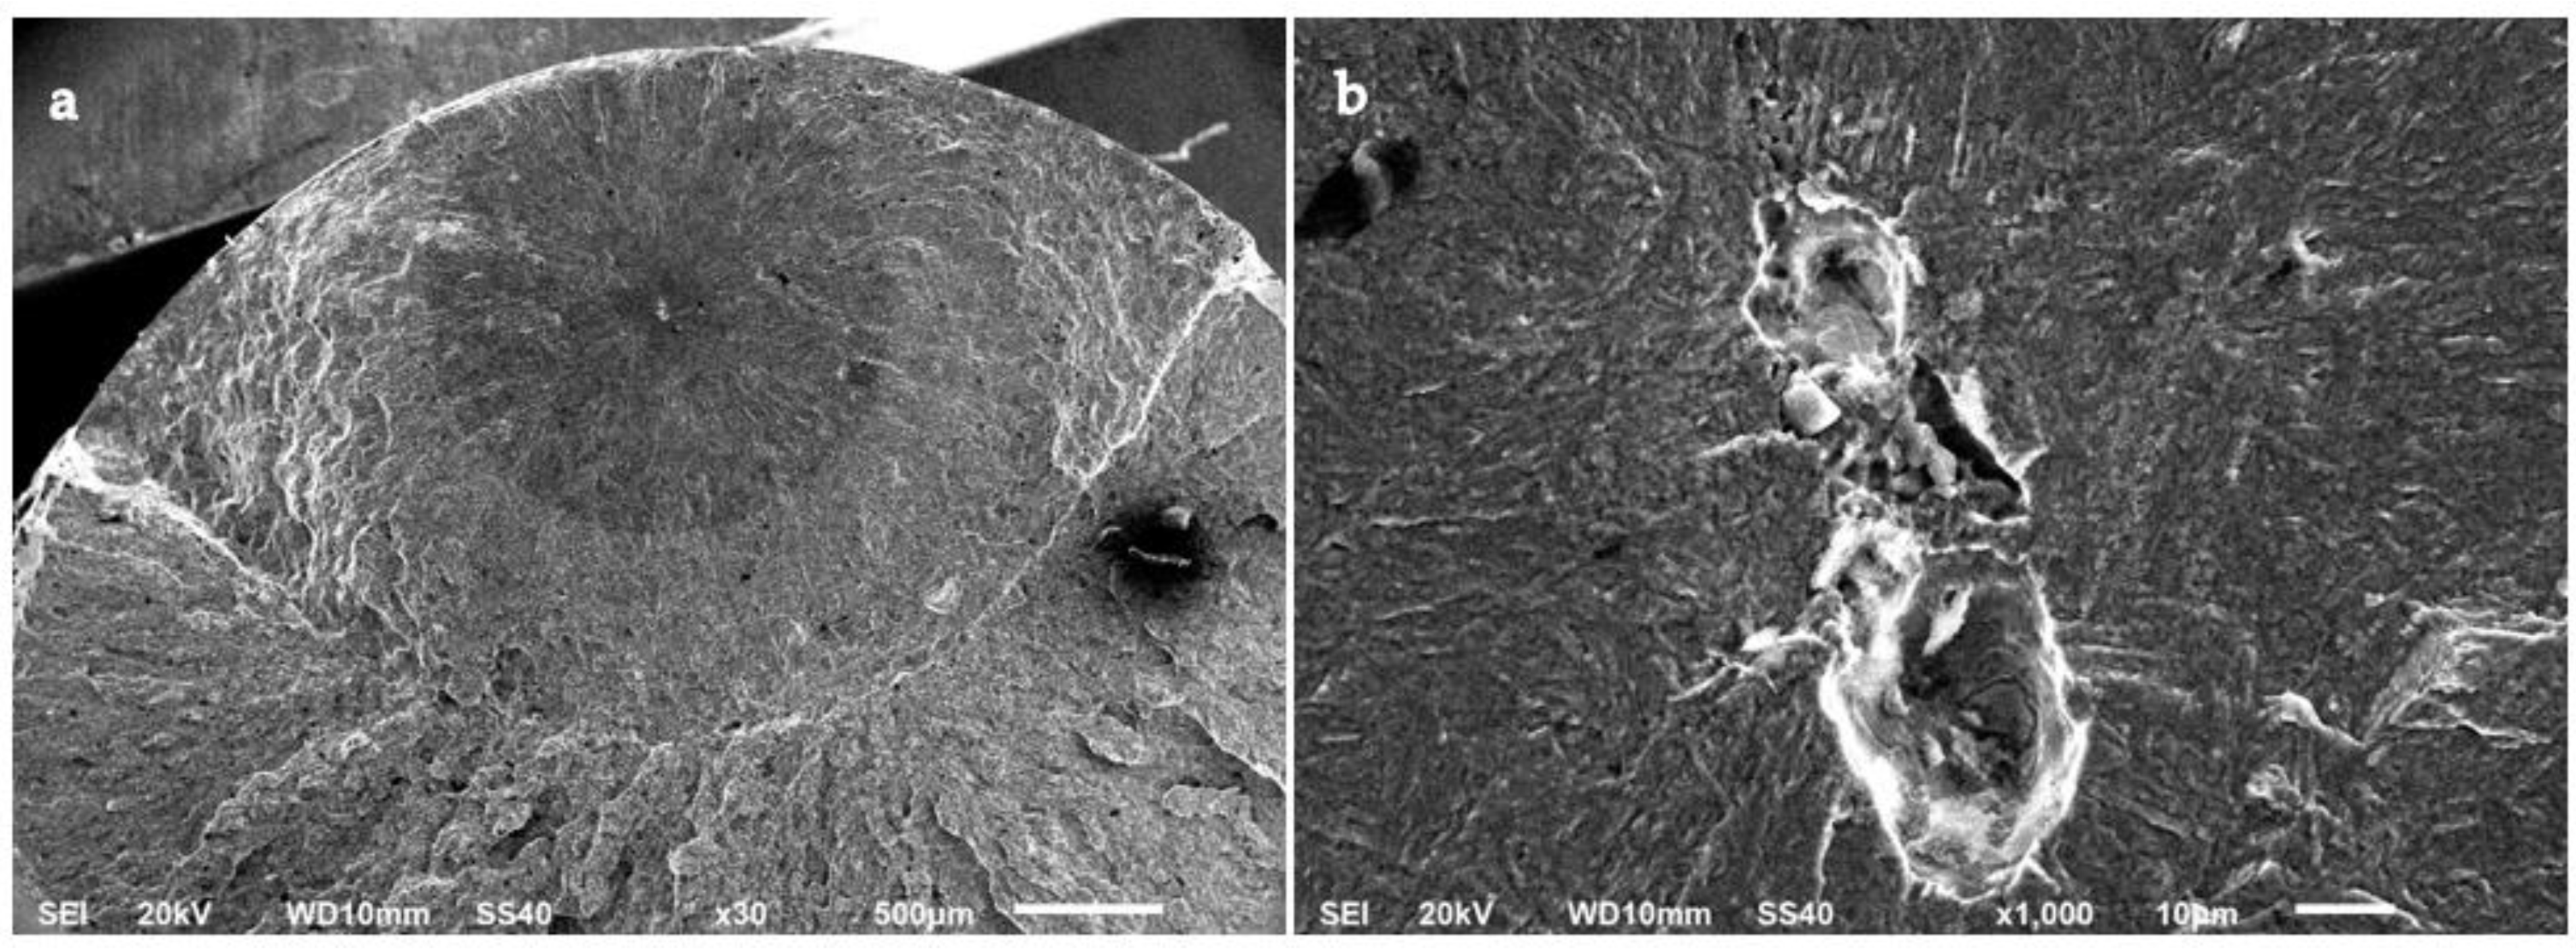
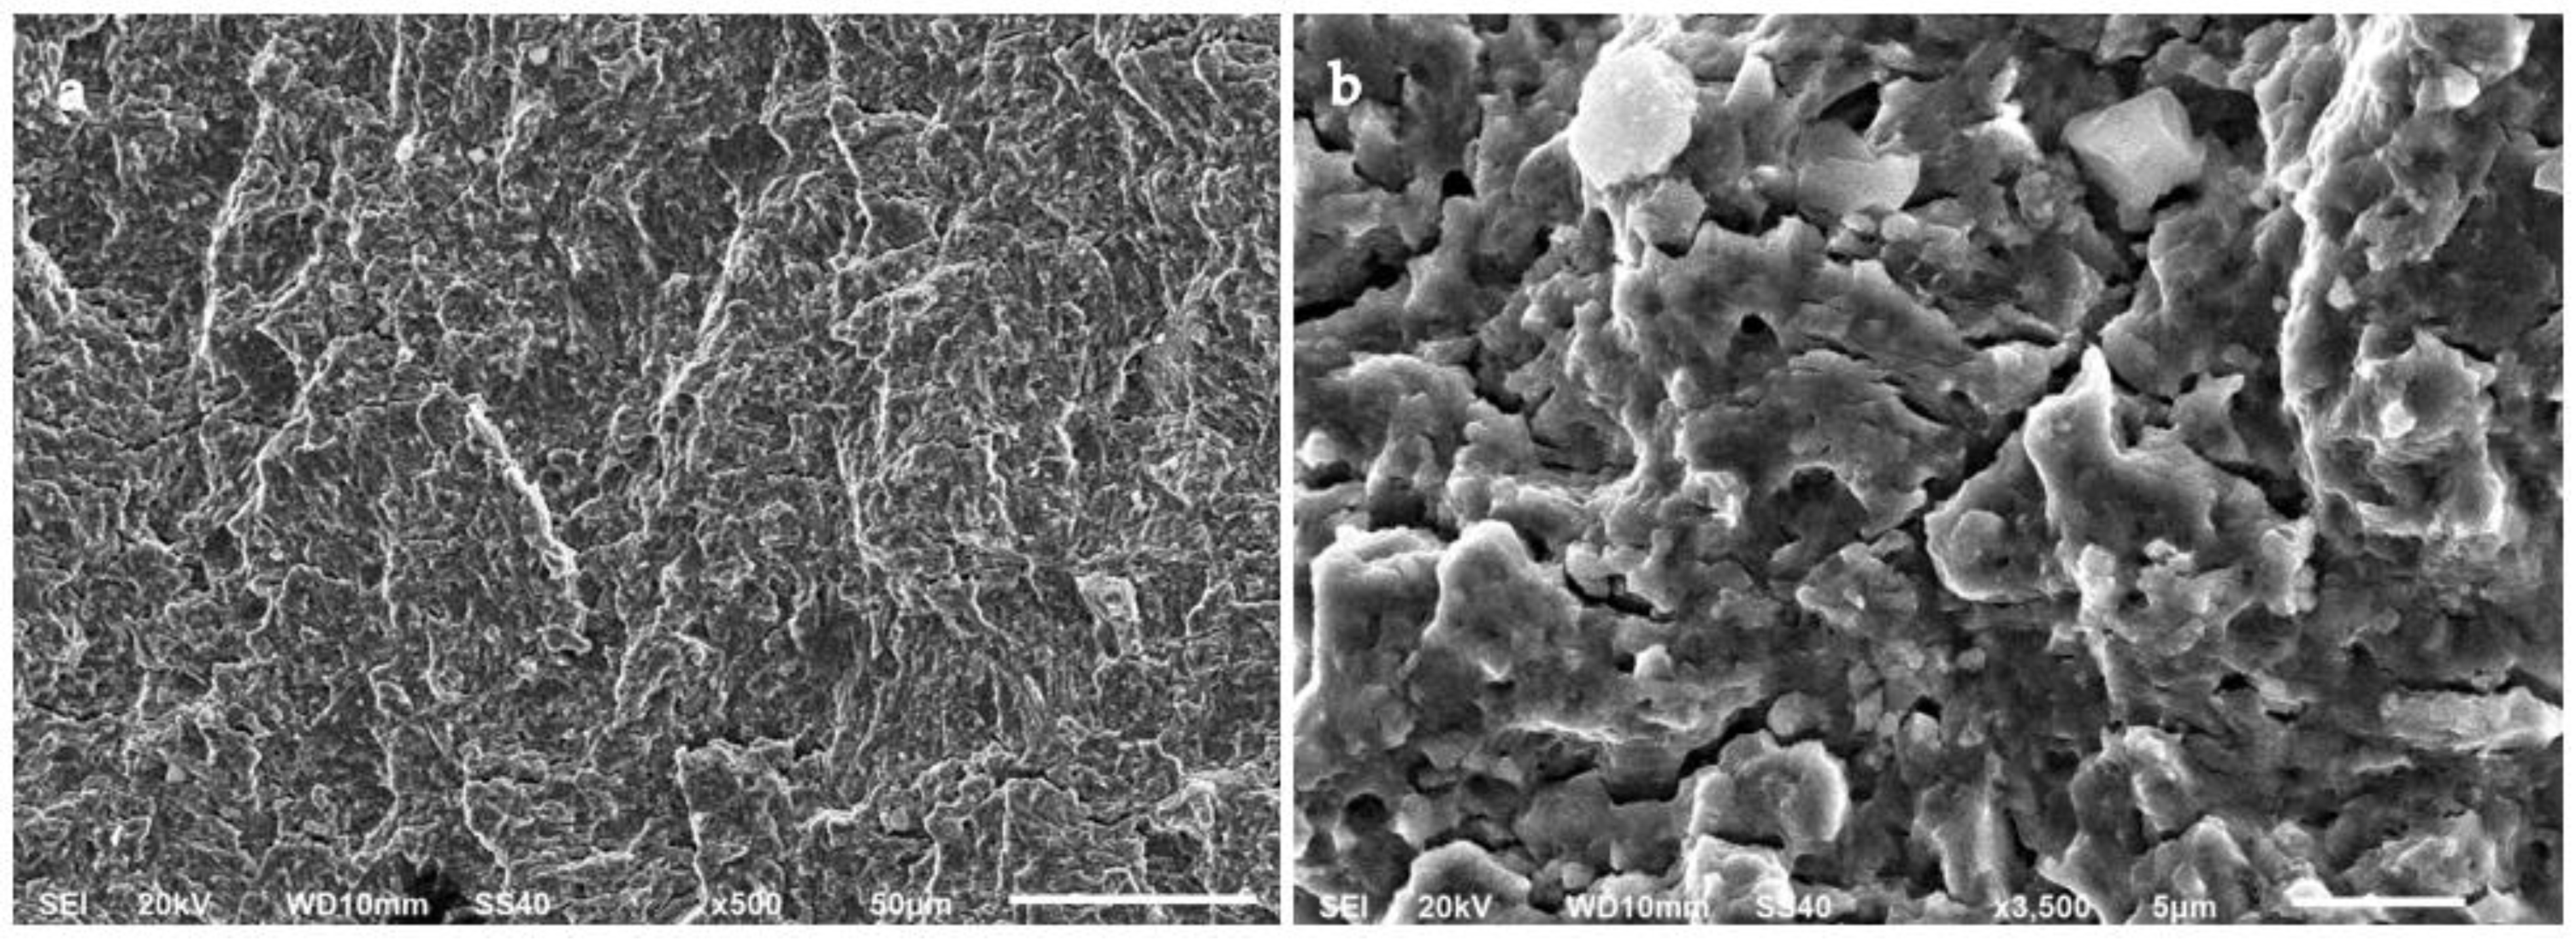
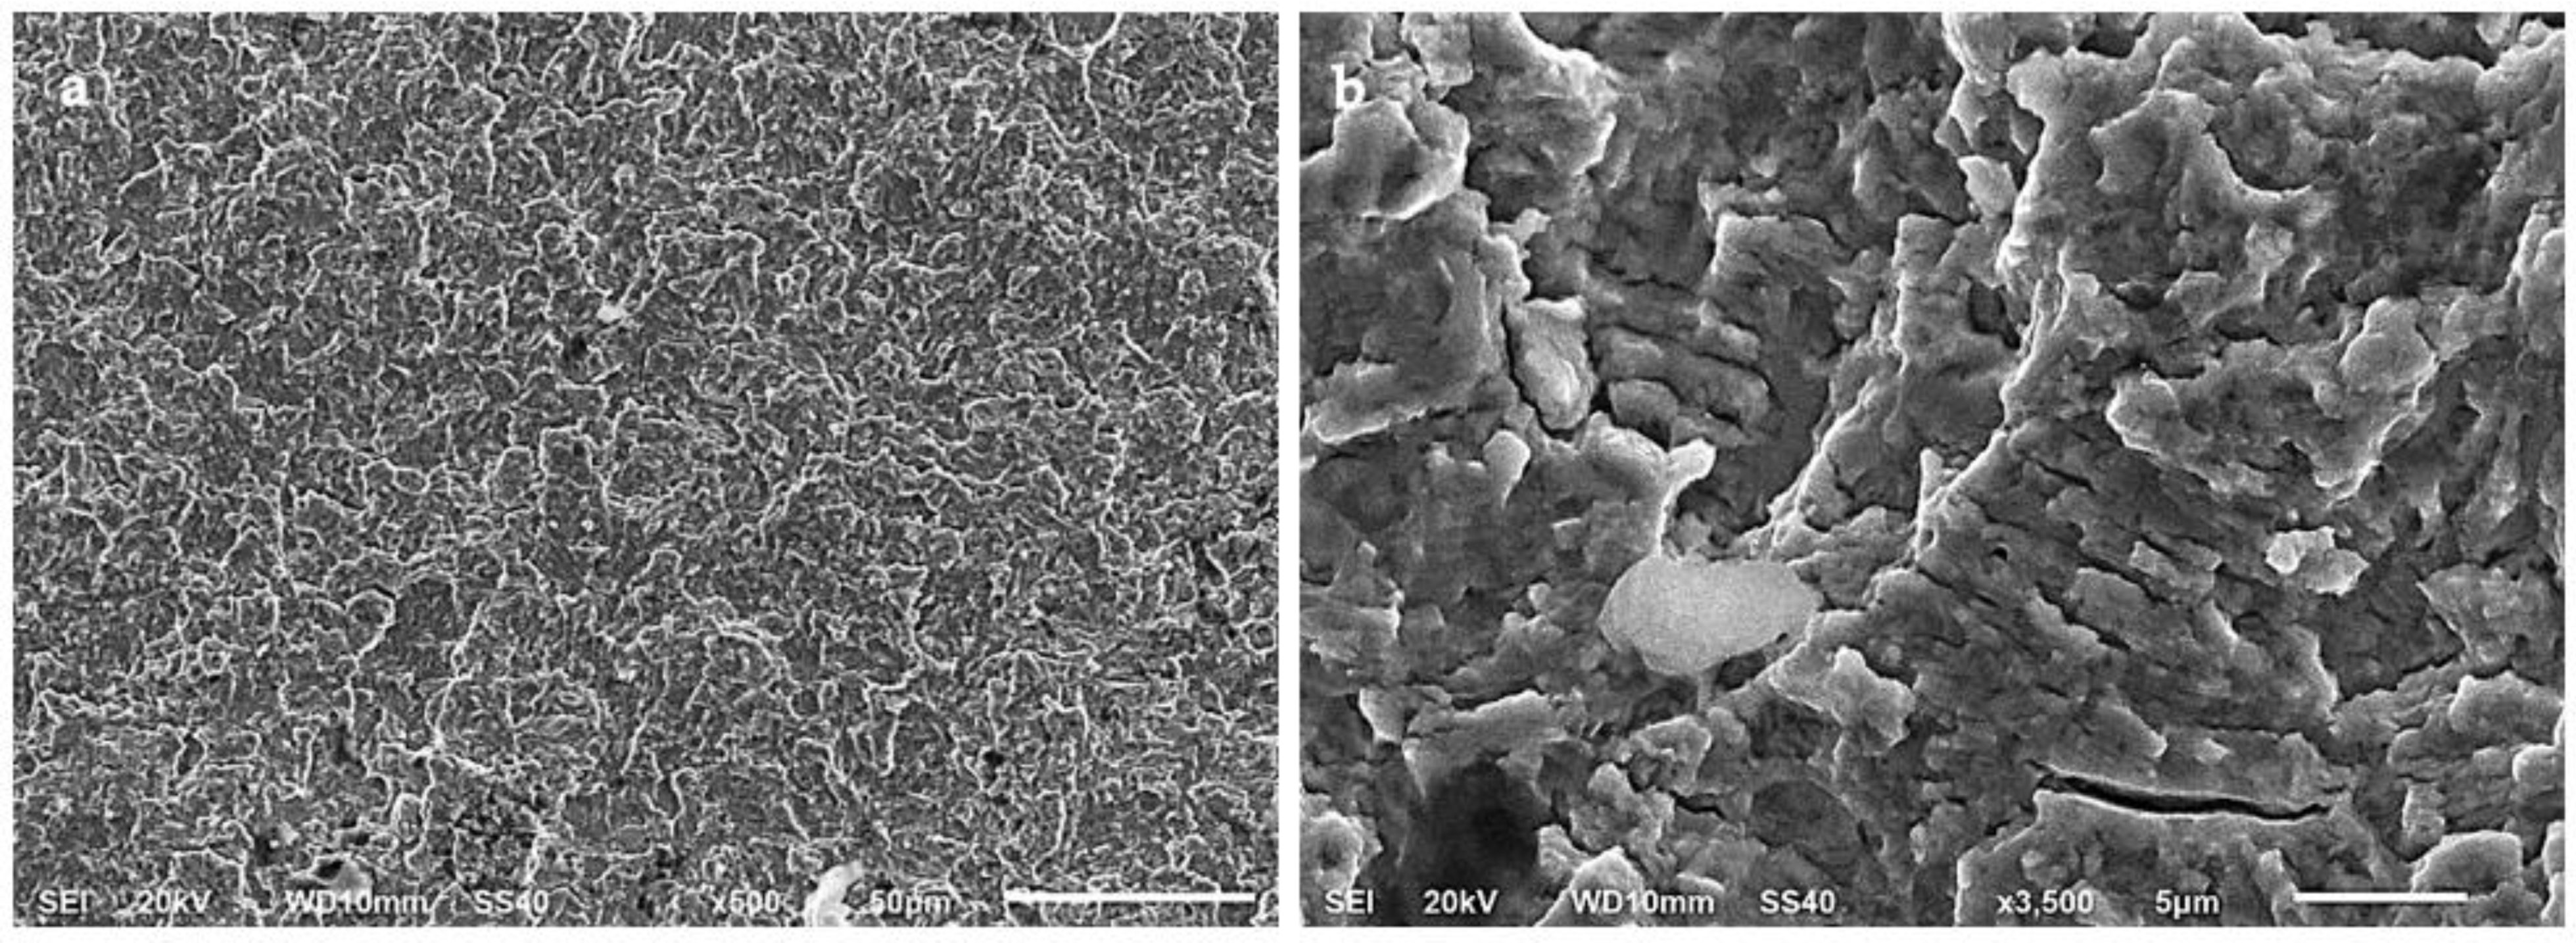
3.6. Fracture Analysis
4. Discussion
5. Conclusions
Author Contributions
Funding
Institutional Review Board Statement
Informed Consent Statement
Data Availability Statement
Acknowledgments
Conflicts of Interest
References
- Riccardo, G.; Rivolta, B.; Gorla, C.; Concli, F. Cyclic Behavior and Fatigue Resistance of AISI H11 and AISI H13 Tool Steels. Eng. Fail. Anal. 2021, 121, 105096. [Google Scholar] [CrossRef]
- Wollmann, J.; Dolny, A.; Kaszuba, M.; Gronostajski, Z.; Gude, M. Methods for Determination of Low-Cycle Properties from Monotonic Tensile Tests of 1.2344 Steel Applied for Hot Forging Dies. Int. J. Adv. Manuf. Technol. 2019, 102, 3357–3367. [Google Scholar] [CrossRef]
- Pérez, M.; Belzunce, F.J. The Effect of Deep Cryogenic Treatments on the Mechanical Properties of an AISI H13 Steel. Mater. Sci. Eng. A 2015, 624, 32–40. [Google Scholar] [CrossRef]
- Ning, A.; Liu, Y.; Gao, R.; Yue, S.; Wang, M.; Guo, H. Effect of Tempering Condition on Microstructure, Mechanical Properties and Precipitates in AISI H13 Steel. JOM 2021, 73, 2194–2202. [Google Scholar] [CrossRef]
- Liu, B.; Wang, B.; Yang, X.; Zhao, X.; Qin, M.; Gu, J. Thermal Fatigue Evaluation of AISI H13 Steels Surface Modified by Gas Nitriding with Pre- and Post-Shot Peening. Appl. Surf. Sci. 2019, 483, 45–51. [Google Scholar] [CrossRef]
- Zeng, Y.; Zuo, P.-p.; Wu, X.-c.; Xia, S.-w. Effects of Mechanical Strain Amplitude on the Isothermal Fatigue Behavior of H13. Int. J. Miner. Metall. Mater. 2017, 24, 1004–1009. [Google Scholar] [CrossRef]
- Behrens, B.A.; Lippold, L. Influence of Shot Peened Surfaces on Friction in Hot Forging. Surf. Topogr. Metrol. Prop. 2018, 6, 045005. [Google Scholar] [CrossRef]
- Shah, M.; Ali, M.; Sultan, A.; Mujahid, M.; Mehmood, H.; Dar, N.U.; Shuaib, M. An Investigation into the Fatigue Crack Growth Rate of Electron Beam-Welded H13 Tool Steel: Effect of Welding and Post-Weld Heat Treatment. Metallogr. Microstruct. Anal. 2014, 3, 114–125. [Google Scholar] [CrossRef]
- Chen, H.; Wang, Y.; Du, W.; Wu, L.; Luo, Y. Fatigue–Creep Interaction Based on Continuum Damage Mechanics for AISI H13 Hot Work Tool Steel at Elevated Temperatures. J. Iron Steel Res. Int. 2018, 25, 580–588. [Google Scholar] [CrossRef]
- Ebara, R. Fatigue and Fracture Behavior of Forging Die Steels. In New Trends and Developments in Automotive System Engineering; Chiaberge, M., Ed.; IntechOpen: London, UK, 2011; pp. 47–64. [Google Scholar]
- Mellouli, D.; Haddar, N.; Köster, A.; Ayedi, H.F. Hardness Effect on Thermal Fatigue Damage of Hot-Working Tool Steel. Eng. Fail. Anal. 2014, 45, 85–95. [Google Scholar] [CrossRef]
- Jagota, V.; Sharma, R.K. Interpreting H13 Steel Wear Behavior for Austenitizing Temperature, Tempering Time and Temperature. J. Brazilian Soc. Mech. Sci. Eng. 2018, 40, 219. [Google Scholar] [CrossRef]
- Podgornik, B.; Puš, G.; Žužek, B.; Leskovšek, V.; Godec, M. Heat Treatment Optimization and Properties Correlation for H11-Type Hot-Work Tool Steel. Metall. Mater. Trans. A Phys. Metall. Mater. Sci. 2018, 49, 455–462. [Google Scholar] [CrossRef]
- Leskovšek, V.; Šuštaršič, B.; Jutriša, G. The Influence of Austenitizing and Tempering Temperature on the Hardness and Fracture Toughness of Hot-Worked H11 Tool Steel. J. Mater. Process. Technol. 2006, 178, 328–334. [Google Scholar] [CrossRef]
- Hawryluk, M.; Dolny, A.; Mroziński, S. Low Cycle Fatigue Studies of WCLV Steel (1.2344) Used for Forging Tools to Work at Higher Temperatures. Arch. Civ. Mech. Eng. 2018, 18, 465–478. [Google Scholar] [CrossRef]
- Ebara, R. Fatigue Crack Initiation and Propagation Behavior of Forging Die Steels. Int. J. Fatigue 2010, 32, 830–840. [Google Scholar] [CrossRef]
- Shinde, T.; Dhokey, N.B. Influence of Tertiary Carbides on Improving Fatigue Limit of H13 Die Steels. Metallogr. Microstruct. Anal. 2017, 6, 398–406. [Google Scholar] [CrossRef]
- Korade, D.N.; Ramana, K.V.; Jagtap, K.R. Effect of Carbide Density on Fatigue Limit of H21 Die Steel. J. Mater. Eng. Perform. 2020, 29, 230–241. [Google Scholar] [CrossRef]
- Papageorgiou, D.; Medrea, C.; Kyriakou, N. Failure Analysis of H13 Working Die Used in Plastic Injection Moulding. Eng. Fail. Anal. 2013, 35, 355–359. [Google Scholar] [CrossRef]
- Olugbade, T.O.; Ojo, O.T.; Omiyale, B.O.; Olutomilola, E.O.; Olorunfemi, B.J. A Review on the Corrosion Fatigue Strength of Surface-Modified Stainless Steels. J. Brazilian Soc. Mech. Sci. Eng. 2021, 43, 421. [Google Scholar] [CrossRef]
- Yongmei, Z.; Junjie, C.; Wenxian, T.; Weicheng, C.; Xiaorong, W.; Fang, W.; Baoji, Y. Fatigue and Corrosion Fatigue of 18ni Maraging Steel. Arch. Metall. Mater. 2021, 66, 321–330. [Google Scholar]
- Ebara, R. Corrosion Fatigue Phenomena Learned from Failure Analysis. Eng. Fail. Anal. 2006, 13, 516–525. [Google Scholar] [CrossRef]
- El May, M.; Palin-Luc, T.; Saintier, N.; Devos, O. Effect of Corrosion on the High Cycle Fatigue Strength of Martensitic Stainless Steel X12CrNiMoV12-3. Int. J. Fatigue 2013, 47, 330–339. [Google Scholar] [CrossRef] [Green Version]
- ISO 4957:2018; Tool Steels. International Organization for Standardization: Geneva, Switzerland, 2018.
- Marashi, J.; Yakushina, E.; Xirouchakis, P.; Zante, R.; Foster, J. An Evaluation of H13 Tool Steel Deformation in Hot Forging Conditions. J. Mater. Process. Technol. 2017, 246, 276–284. [Google Scholar] [CrossRef] [Green Version]
- Leitner, M.; Tuncali, Z.; Steiner, R.; Grün, F. Multiaxial Fatigue Strength Assessment of Electroslag Remelted 50CrMo4 Steel Crankshafts. Int. J. Fatigue 2017, 100, 159–175. [Google Scholar] [CrossRef]
- Tridello, A. VHCF Response of Two AISI H13 Steels: Effect of Manufacturing Process and Size-Effect. Metals 2019, 9, 133. [Google Scholar] [CrossRef] [Green Version]
- Zerbst, U.; Klinger, C. Material Defects as Cause for the Fatigue Failure of Metallic Components. Int. J. Fatigue 2019, 127, 312–323. [Google Scholar] [CrossRef]
- Tridello, A.; Niutta, C.B.; Berto, F.; Paolino, D.S. Size-Effect in Very High Cycle Fatigue: A Review. Int. J. Fatigue 2021, 153, 106462. [Google Scholar] [CrossRef]
- McKelvey, S.A.; Fatemi, A. Surface Finish Effect on Fatigue Behavior of Forged Steel. Int. J. Fatigue 2012, 36, 130–145. [Google Scholar] [CrossRef]
- ISO 1099:2017; Fatigue Testing—Axial Force-Controlled Method. International Organization for Standardization: Geneva, Switzerland, 2017.
- Ning, A.; Mao, W.; Chen, X.; Guo, H.; Guo, J. Precipitation Behavior of Carbides in H13 Hot Work Die Steel and Its Strengthening during Tempering. Metals 2017, 7, 70. [Google Scholar] [CrossRef] [Green Version]
- Ning, A.; Gao, R.; Yue, S.; Guo, H.; Li, L. Effects of Cooling Rate on the Mechanical Properties and Precipitation Behavior of Carbides in H13 Steel during Quenching Process. Mater. Res. Express 2021, 8, 016503. [Google Scholar] [CrossRef]
- Lu, S.Y.; Yao, K.F.; Chen, Y.B.; Wang, M.H.; Shao, Y.; Ge, X.Y. Effects of Austenitizing Temperature on the Microstructure and Electrochemical Behavior of a Martensitic Stainless Steel. J. Appl. Electrochem. 2015, 45, 375–383. [Google Scholar] [CrossRef]
- Li, B.; Li, C.; Wang, Y.; Jin, X. Effect of Cryogenic Treatment on Microstructure and Wear Resistance of Carburized 20CrNi2MoV Steel. Metals 2018, 8, 808. [Google Scholar] [CrossRef] [Green Version]
- Basquin, O.H. The Exponential Law of Endurance Tests. Proc. Am. Soc. Test. Mater. 1910, 10, 625–630. [Google Scholar]
- Shanyavskiy, A.A.; Soldatenkov, A.P. Metallic Materials Fatigue Behavior: Scale Levels and Ranges of Transition between Them. Int. J. Fatigue 2022, 158, 106773. [Google Scholar] [CrossRef]
- Murakami, Y.; Takagi, T.; Wada, K.; Fukushima, Y.; Matsunaga, H. Essential Structure of S-N Curve: Prediction of Fatigue Life and Fatigue Limit of Defective Materials and Nature of Scatter. Int. J. Fatigue 2021, 146, 106138. [Google Scholar] [CrossRef]
- Adasooriya, N.D.; Pavlou, D.; Hemmingsen, T. Fatigue Strength Degradation of Corroded Structural Details: A Formula for S-N Curve. Fatigue Fract. Eng. Mater. Struct. 2020, 43, 721–733. [Google Scholar] [CrossRef] [Green Version]
- Gaur, V.; Doquet, V.; Persent, E.; Roguet, E. Corrosion-Fatigue Behaviour of Cr–Mo Steel under Biaxial Tension. Fatigue Fract. Eng. Mater. Struct. 2020, 43, 2560–2570. [Google Scholar] [CrossRef]
- Milella, P.P. Fatigue and Corrosion in Metals; Springer: Milan, Milano, 2013; ISBN 978-88-470-2335-2. [Google Scholar]
- Meyers, M.; Chawla, K. Mechanical Behavior of Materials, 2nd ed.; Cambridge University Press: Cambridge, UK, 2009; ISBN 9780521866750. [Google Scholar]
- Krupp, U. Fatigue Crack Propagation in Metals and Alloys; Wiley-VCH: Weinheim, Germany, 2007; ISBN 9783527315376. [Google Scholar]
- Persson, E.S.; Karasev, A.; Mitchell, A.; Jönsson, P.G. Origin of the Inclusions in Production-Scale Electrodes, ESR Ingots, and PESR Ingots in a Martensitic Stainless Steel. Metals 2020, 10, 1620. [Google Scholar] [CrossRef]
- Li, Y.-D.; Zhang, L.-L.; Fei, Y.-H.; Liu, X.-Y.; Li, M.-X. On the Formation Mechanisms of Fine Granular Area (FGA) on the Fracture Surface for High Strength Steels in the VHCF Regime. Int. J. Fatigue 2016, 82, 402–410. [Google Scholar] [CrossRef]
- Gaur, V.; Doquet, V.; Persent, E.; Mareau, C.; Roguet, E.; Kittel, J. Surface versus Internal Fatigue Crack Initiation in Steel: Influence of Mean Stress. Int. J. Fatigue 2015, 82, 437–448. [Google Scholar] [CrossRef] [Green Version]
- Krewerth, D.; Lippmann, T.; Weidner, A.; Biermann, H. Influence of Non-Metallic Inclusions on Fatigue Life in the Very High Cycle Fatigue Regime. Int. J. Fatigue 2016, 84, 40–52. [Google Scholar] [CrossRef]
- Schönbauer, B.M.; Mayer, H. Effect of Small Defects on the Fatigue Strength of Martensitic Stainless Steels. Int. J. Fatigue 2019, 127, 362–375. [Google Scholar] [CrossRef]
- Chapetti, M.D. A Simple Model to Predict the Very High Cycle Fatigue Resistance of Steels. Int. J. Fatigue 2011, 33, 833–841. [Google Scholar] [CrossRef]
- Kazymyrovych, V.; Bergström, J.; Burman, C. The Significance of Crack Initiation Stage in Very High Cycle Fatigue of Steels. Steel Res. Int. 2010, 81, 308–314. [Google Scholar] [CrossRef]
- Tomaszewski, T.; Strzelecki, P.; Mazurkiewicz, A.; Musial, J. Probabilistic Estimation of Fatigue Strength for Axial and Bending Loading in High-Cycle Fatigue. Materials 2020, 13, 1148. [Google Scholar] [CrossRef] [PubMed] [Green Version]
- Pérez-Mora, R.; Palin-Luc, T.; Bathias, C.; Paris, P.C. Very High Cycle Fatigue of a High Strength Steel under Sea Water Corrosion: A Strong Corrosion and Mechanical Damage Coupling. Int. J. Fatigue 2015, 74, 156–165. [Google Scholar] [CrossRef] [Green Version]
- Donahue, J.R.; Burns, J.T. Effect of Chloride Concentration on the Corrosion-Fatigue Crack Behavior of an Age-Hardenable Martensitic Stainless Steel. Int. J. Fatigue 2016, 91, 79–99. [Google Scholar] [CrossRef] [Green Version]
- Micone, N.; De Waele, W. Evaluation of Methodologies to Accelerate Corrosion Assisted Fatigue Experiments. Exp. Mech. 2017, 57, 547–557. [Google Scholar] [CrossRef]


| Name | C | Si | Mn | P | S | Cr | Mo | V | Fe | |
|---|---|---|---|---|---|---|---|---|---|---|
| H13 steel | A | 0.40 | 1.01 | 0.36 | 0.012 | 0.0020 | 5.20 | 1.31 | 0.95 | Balance |
| B | 0.39 | 1.01 | 0.38 | 0.013 | 0.0005 | 5.11 | 1.43 | 0.92 | Balance |
| Material | Condition | a [MPa] | b [-] | R2 |
|---|---|---|---|---|
| A | HCF | 2240.0 | −0.057 | 0.850 |
| CF | 16,662.6 | −0.269 | 0.964 | |
| B | HCF | 1711.7 | −0.038 | 0.673 |
| CF | 11,808.1 | −0.227 | 0.971 |
Publisher’s Note: MDPI stays neutral with regard to jurisdictional claims in published maps and institutional affiliations. |
© 2022 by the authors. Licensee MDPI, Basel, Switzerland. This article is an open access article distributed under the terms and conditions of the Creative Commons Attribution (CC BY) license (https://creativecommons.org/licenses/by/4.0/).
Share and Cite
Calvo-García, E.; Valverde-Pérez, S.; Riveiro, A.; Álvarez, D.; Román, M.; Magdalena, C.; Badaoui, A.; Moreira, P.; Comesaña, R. An Experimental Analysis of the High-Cycle Fatigue Fracture of H13 Hot Forging Tool Steels. Materials 2022, 15, 7411. https://doi.org/10.3390/ma15217411
Calvo-García E, Valverde-Pérez S, Riveiro A, Álvarez D, Román M, Magdalena C, Badaoui A, Moreira P, Comesaña R. An Experimental Analysis of the High-Cycle Fatigue Fracture of H13 Hot Forging Tool Steels. Materials. 2022; 15(21):7411. https://doi.org/10.3390/ma15217411
Chicago/Turabian StyleCalvo-García, Erik, Sara Valverde-Pérez, Antonio Riveiro, David Álvarez, Manuel Román, César Magdalena, Aida Badaoui, Pedro Moreira, and Rafael Comesaña. 2022. "An Experimental Analysis of the High-Cycle Fatigue Fracture of H13 Hot Forging Tool Steels" Materials 15, no. 21: 7411. https://doi.org/10.3390/ma15217411