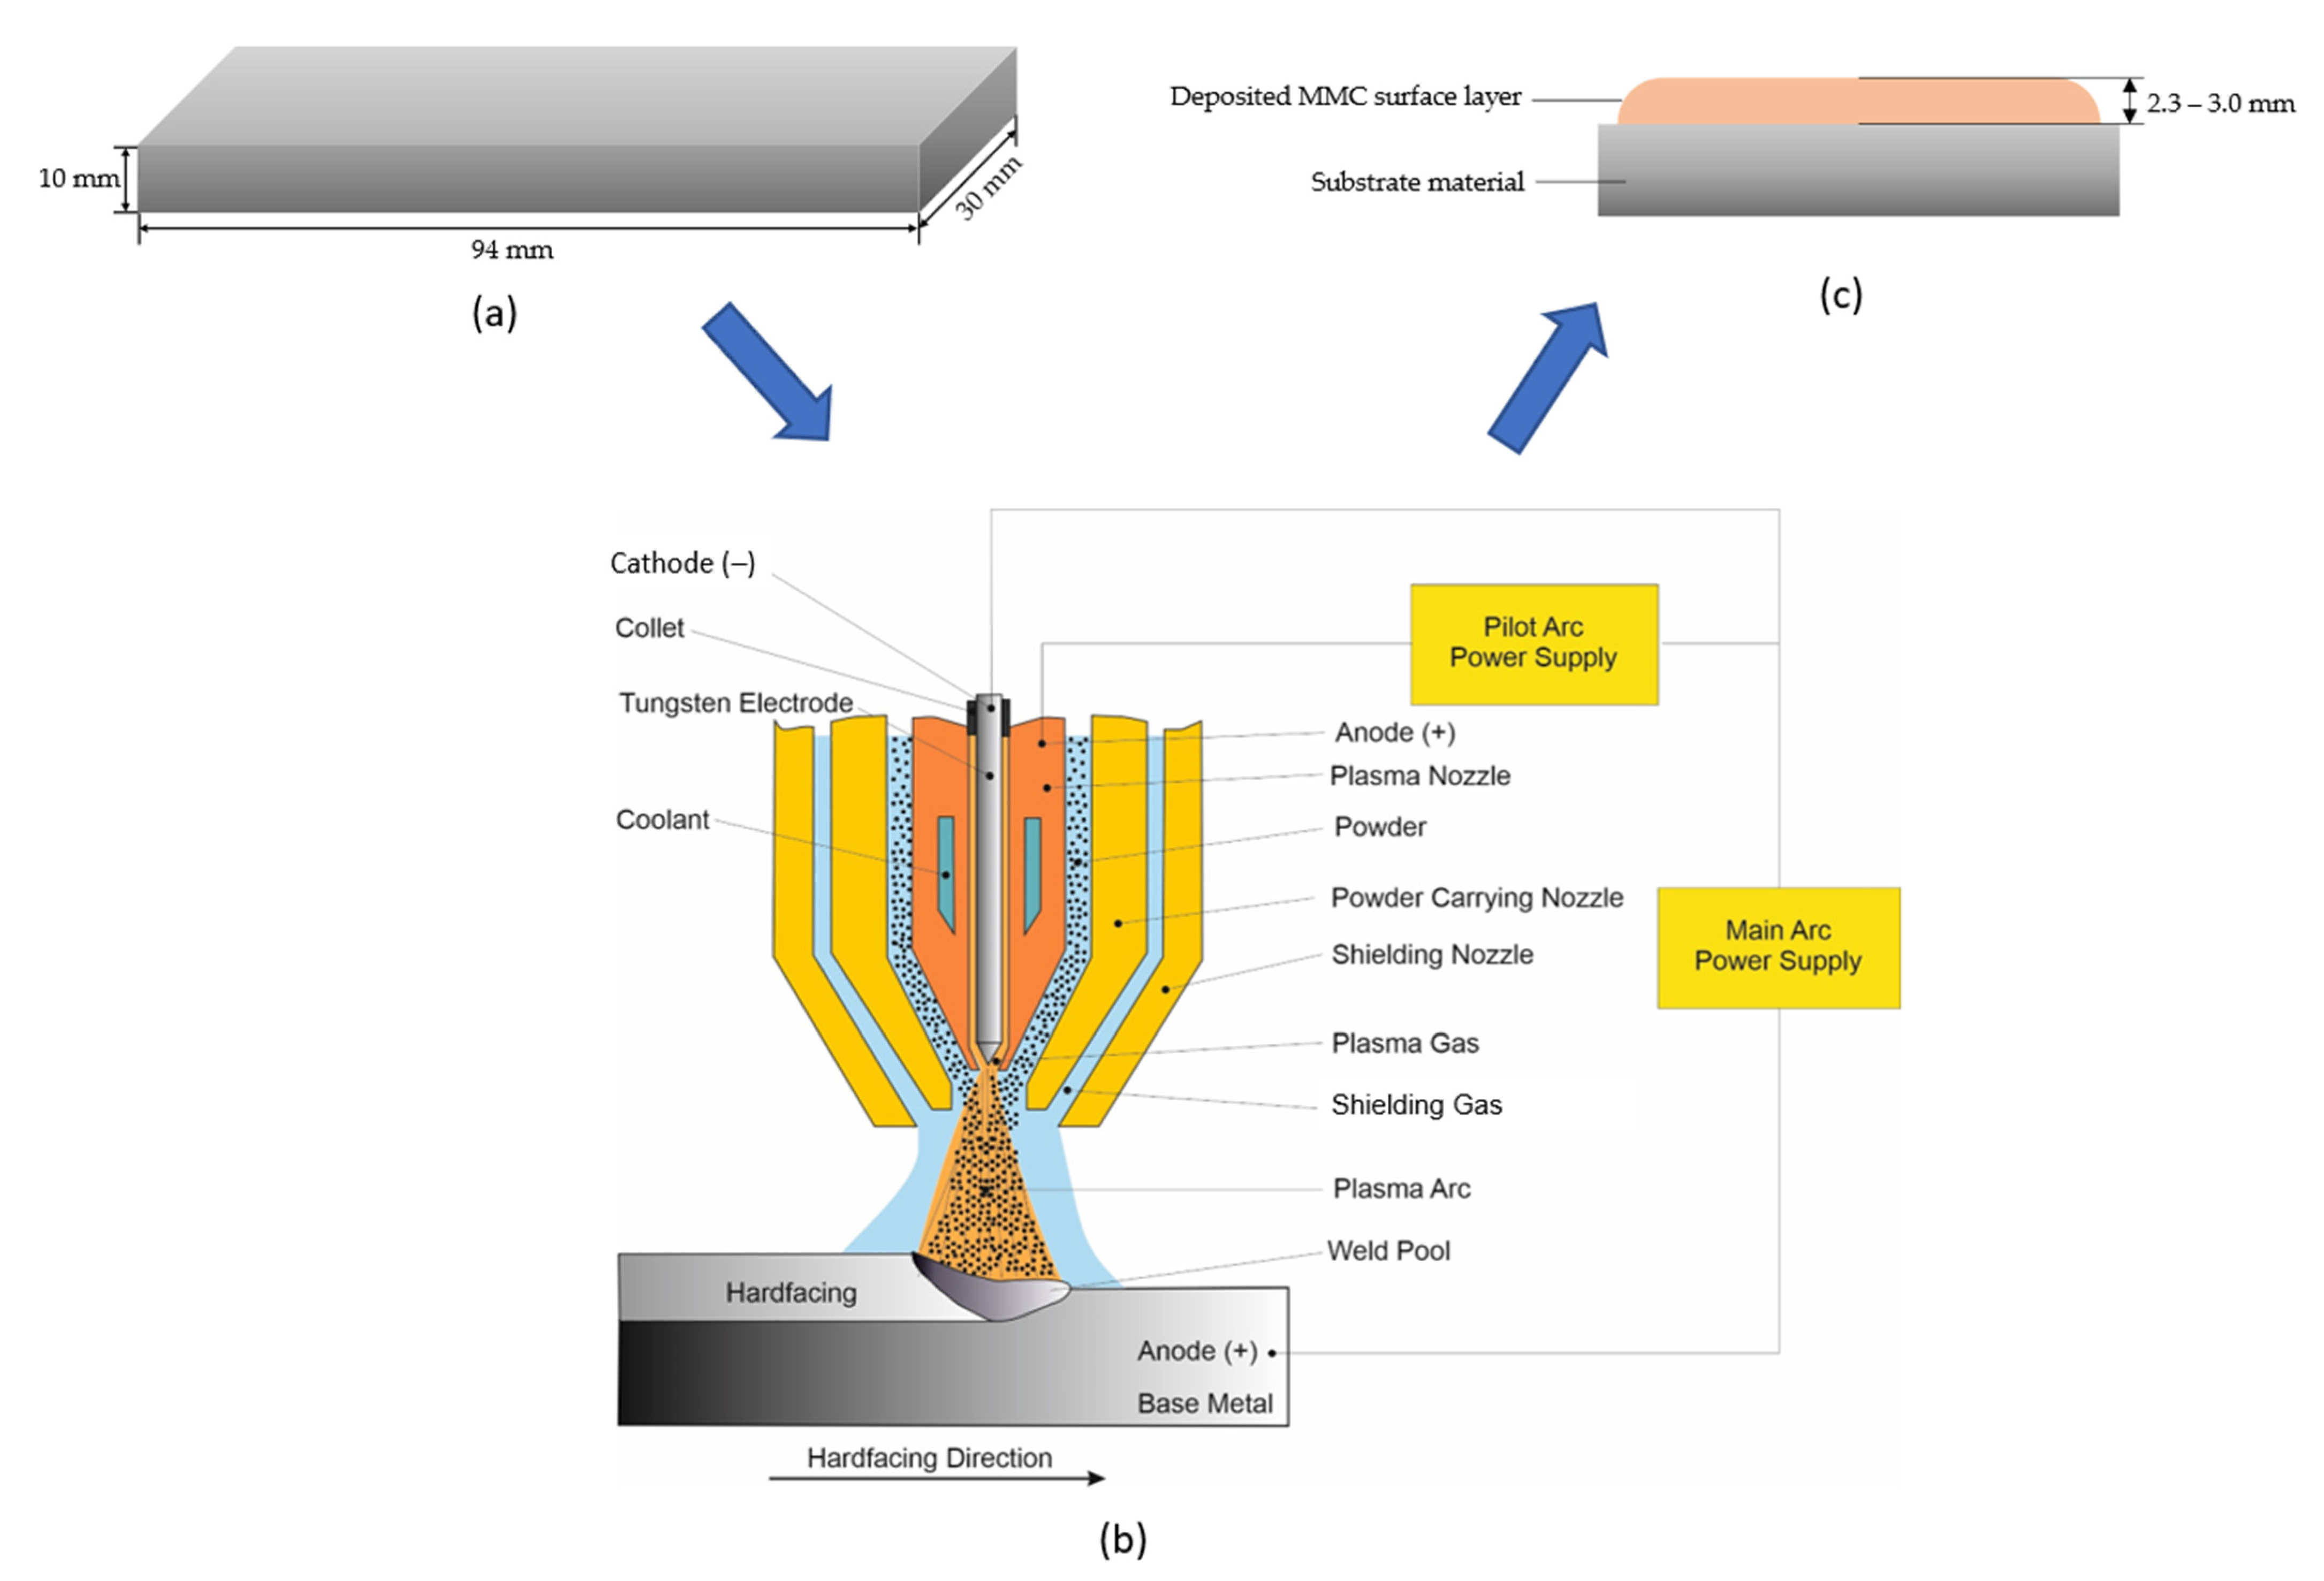
Figure 1.
Process flow diagram for the surface cladding process (a) Image of the prepared structural steel plate specimen used for the study, including its dimensions (b) Schematic diagram of the PPTAW process (c) Schematic image of the cross-section of the final product after surface coating.
Figure 1.
Process flow diagram for the surface cladding process (a) Image of the prepared structural steel plate specimen used for the study, including its dimensions (b) Schematic diagram of the PPTAW process (c) Schematic image of the cross-section of the final product after surface coating.
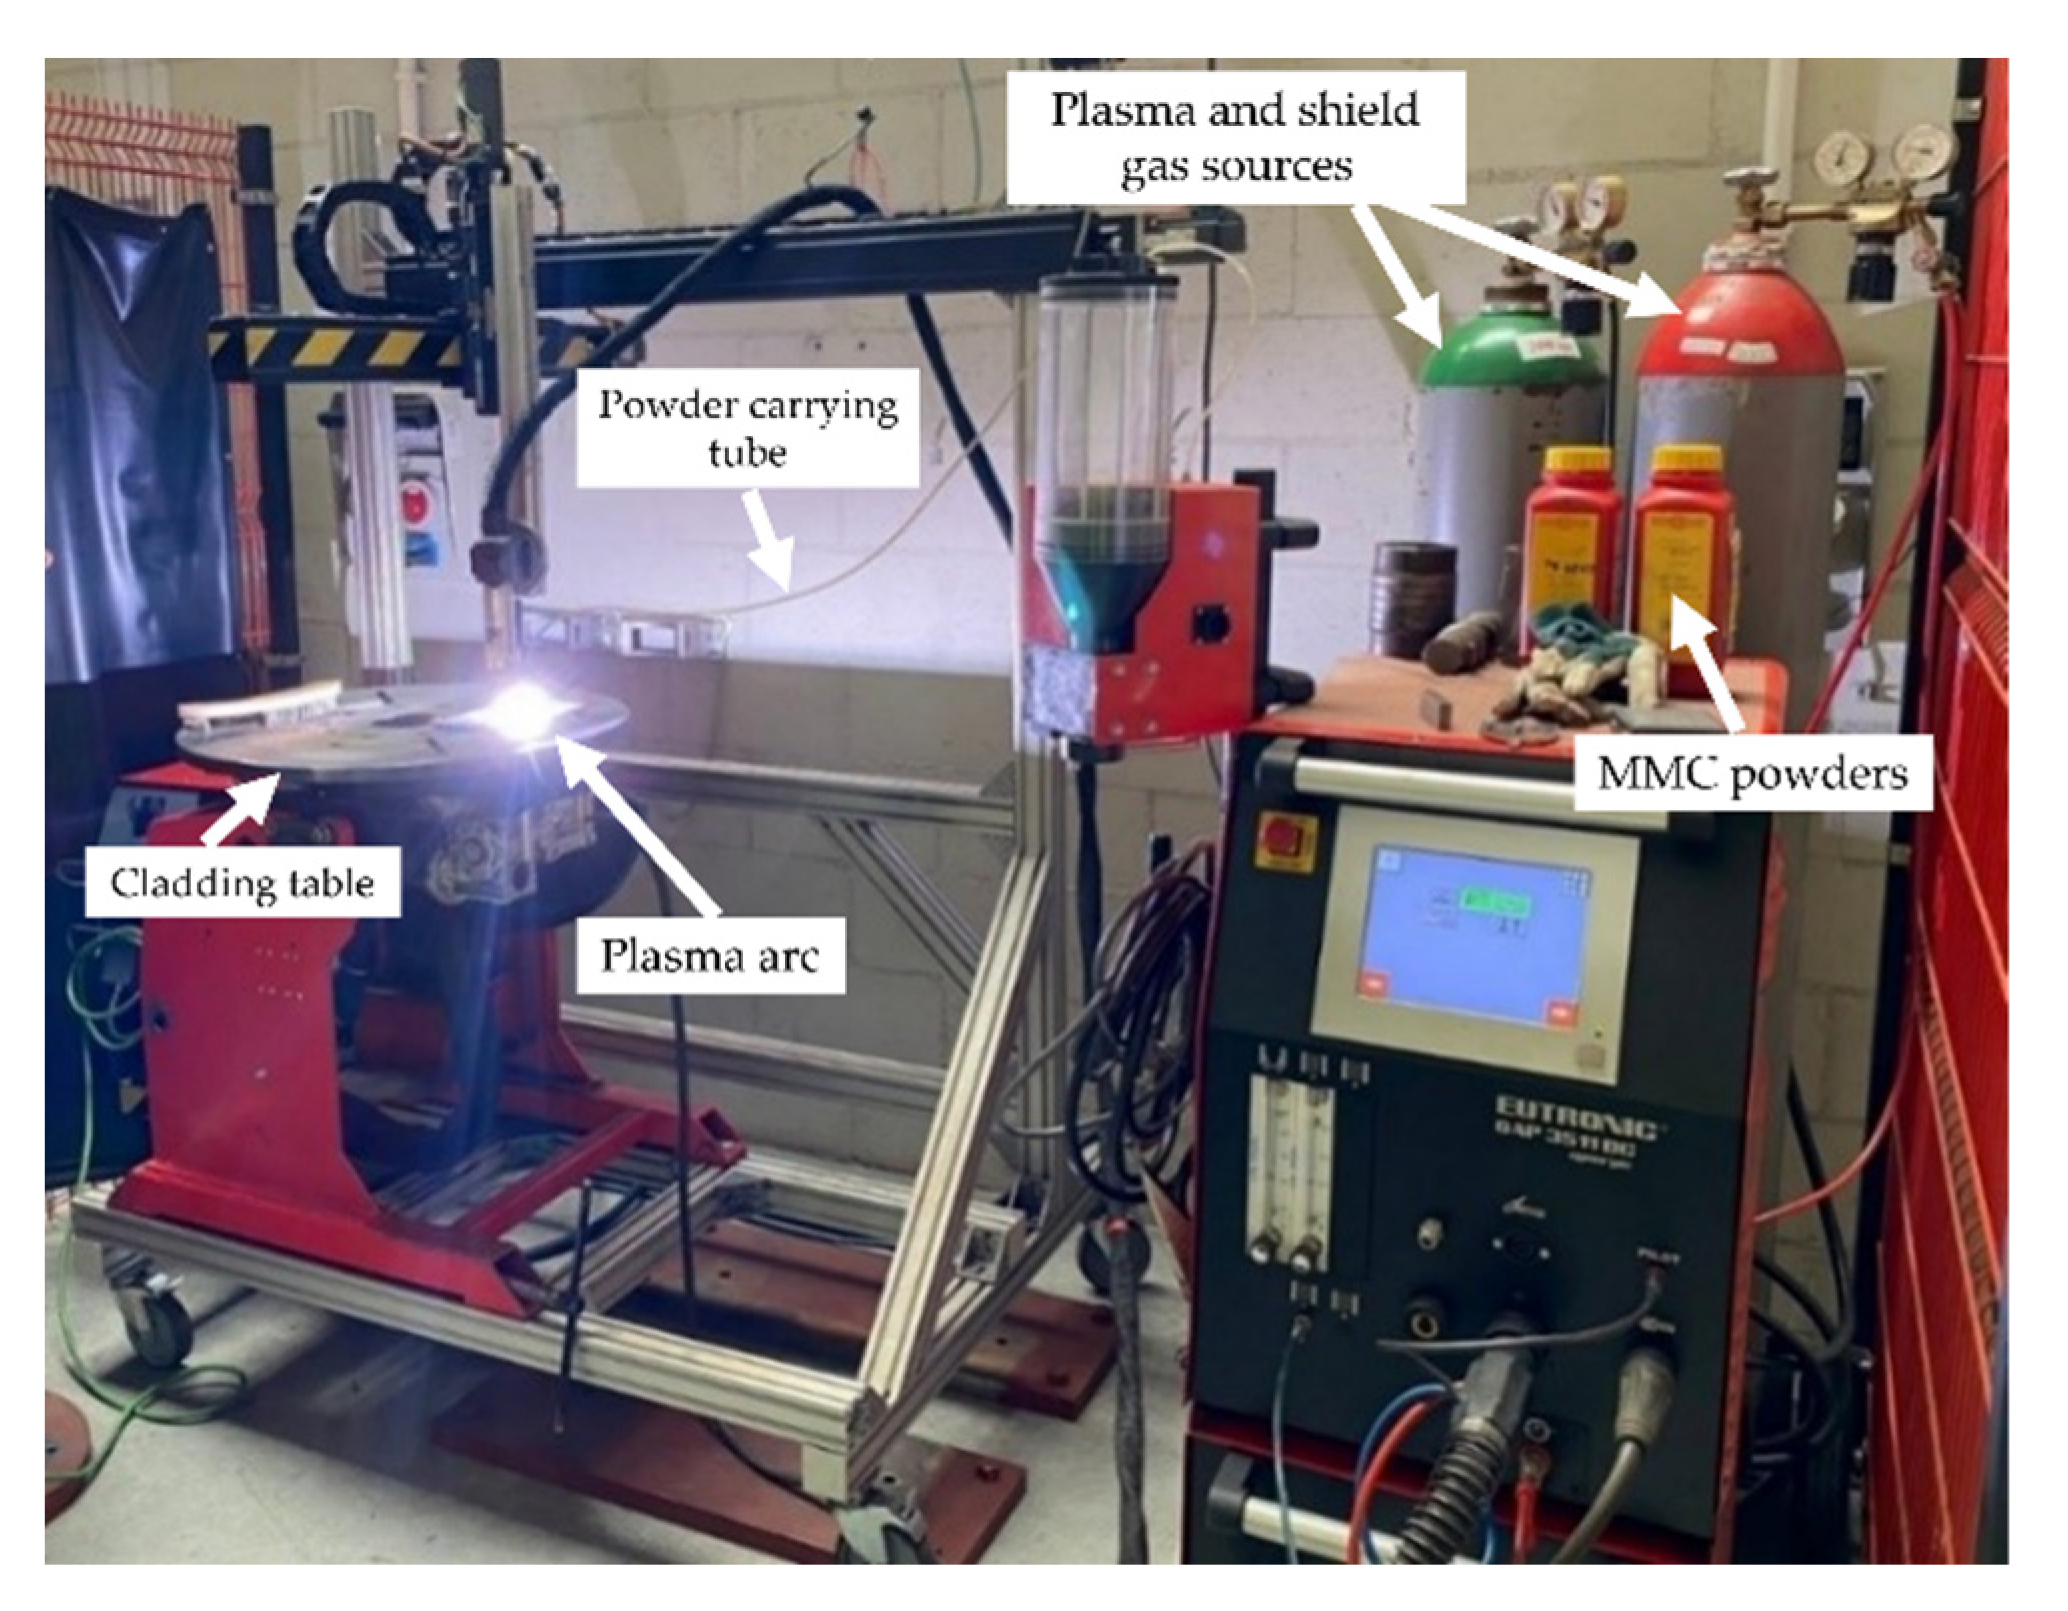
Figure 2.
EuTronic© Gap 3511 DC synergic system used for PPTAW process.
Figure 2.
EuTronic© Gap 3511 DC synergic system used for PPTAW process.
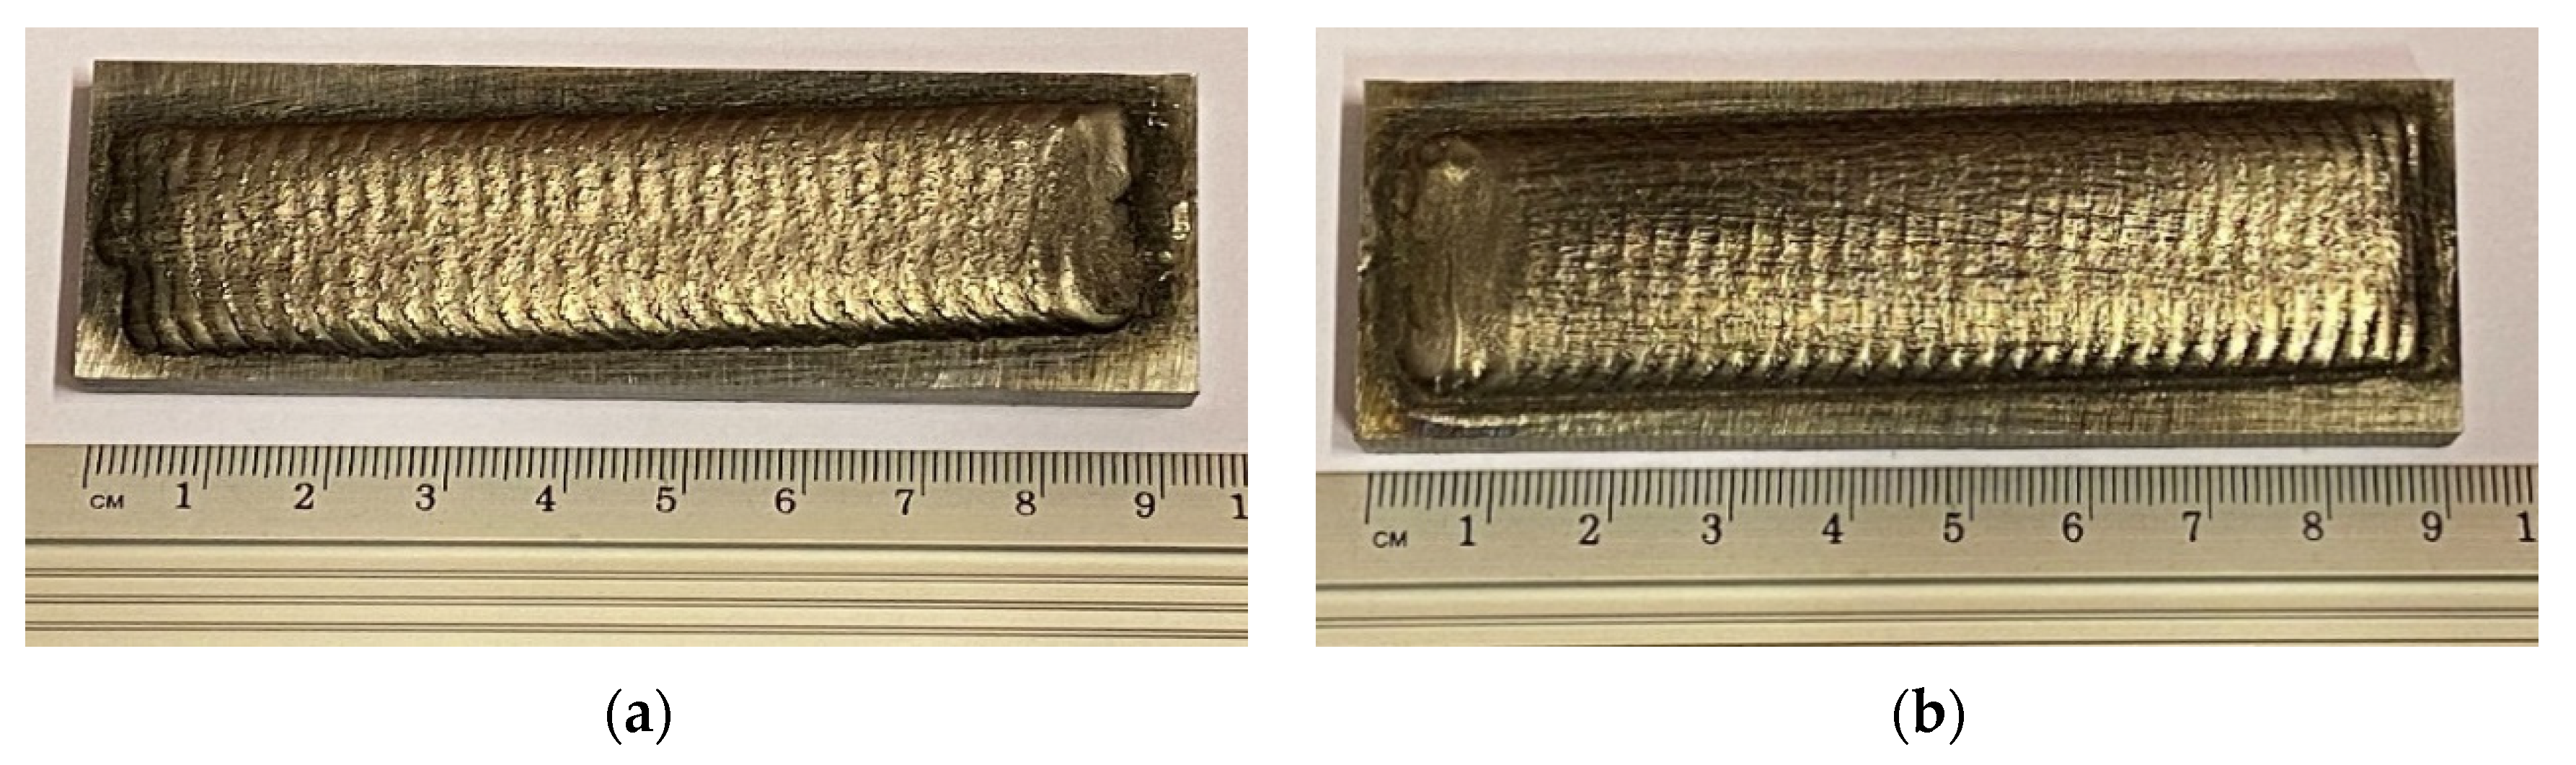
Figure 3.
Images of prepared samples showing the as-deposited MMC surface coatings on the substrate material (a) specimen 2-PG prepared with PG MMC (b) specimen 2-PE prepared with PE MMC.
Figure 3.
Images of prepared samples showing the as-deposited MMC surface coatings on the substrate material (a) specimen 2-PG prepared with PG MMC (b) specimen 2-PE prepared with PE MMC.
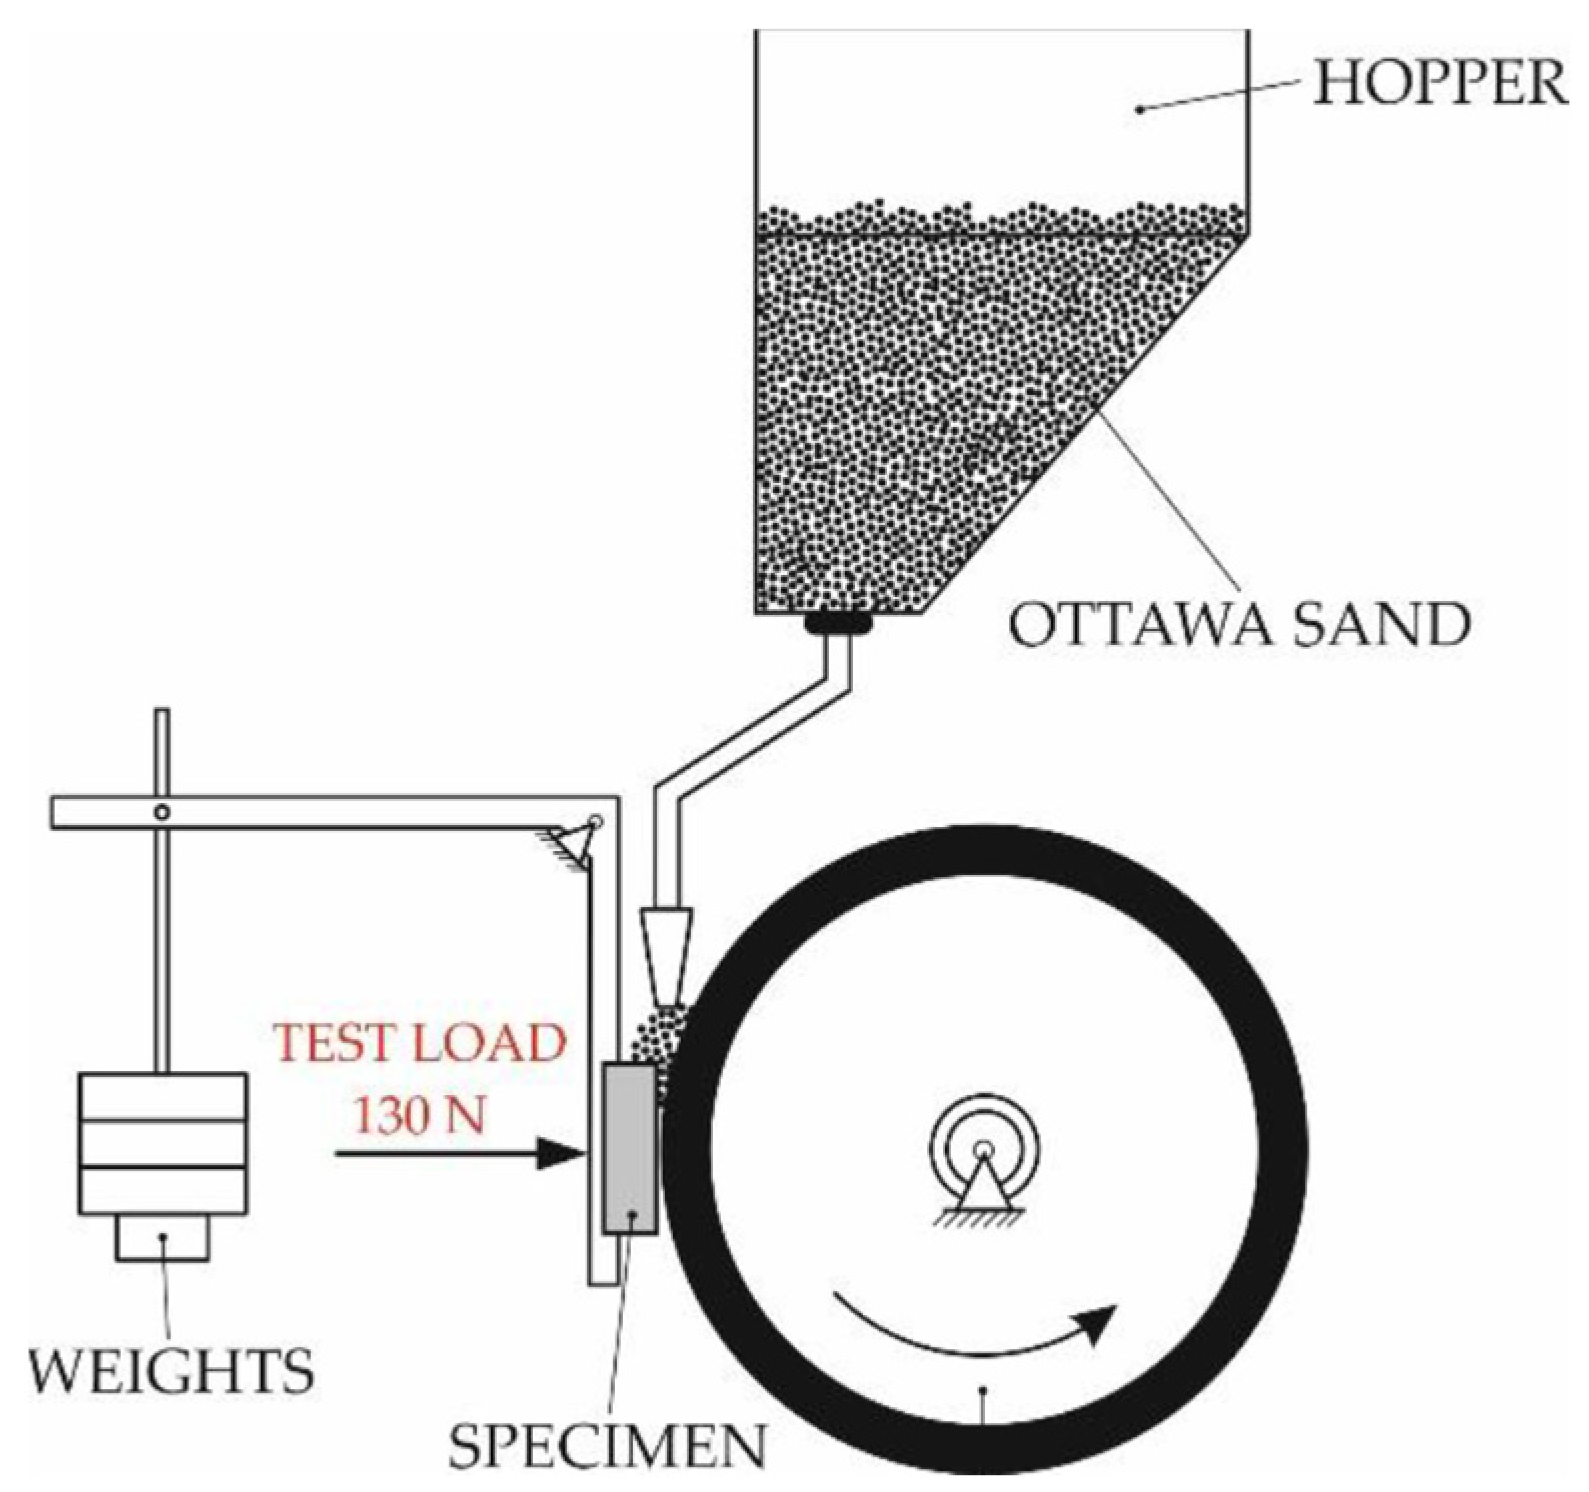
Figure 4.
Abrasive wear resistance testing schematic diagram showing the abrasive quartz sand particles sandwiched between the rotating rubber-lined wheel and the stationary surface of the MMC hard-faced layer.
Figure 4.
Abrasive wear resistance testing schematic diagram showing the abrasive quartz sand particles sandwiched between the rotating rubber-lined wheel and the stationary surface of the MMC hard-faced layer.
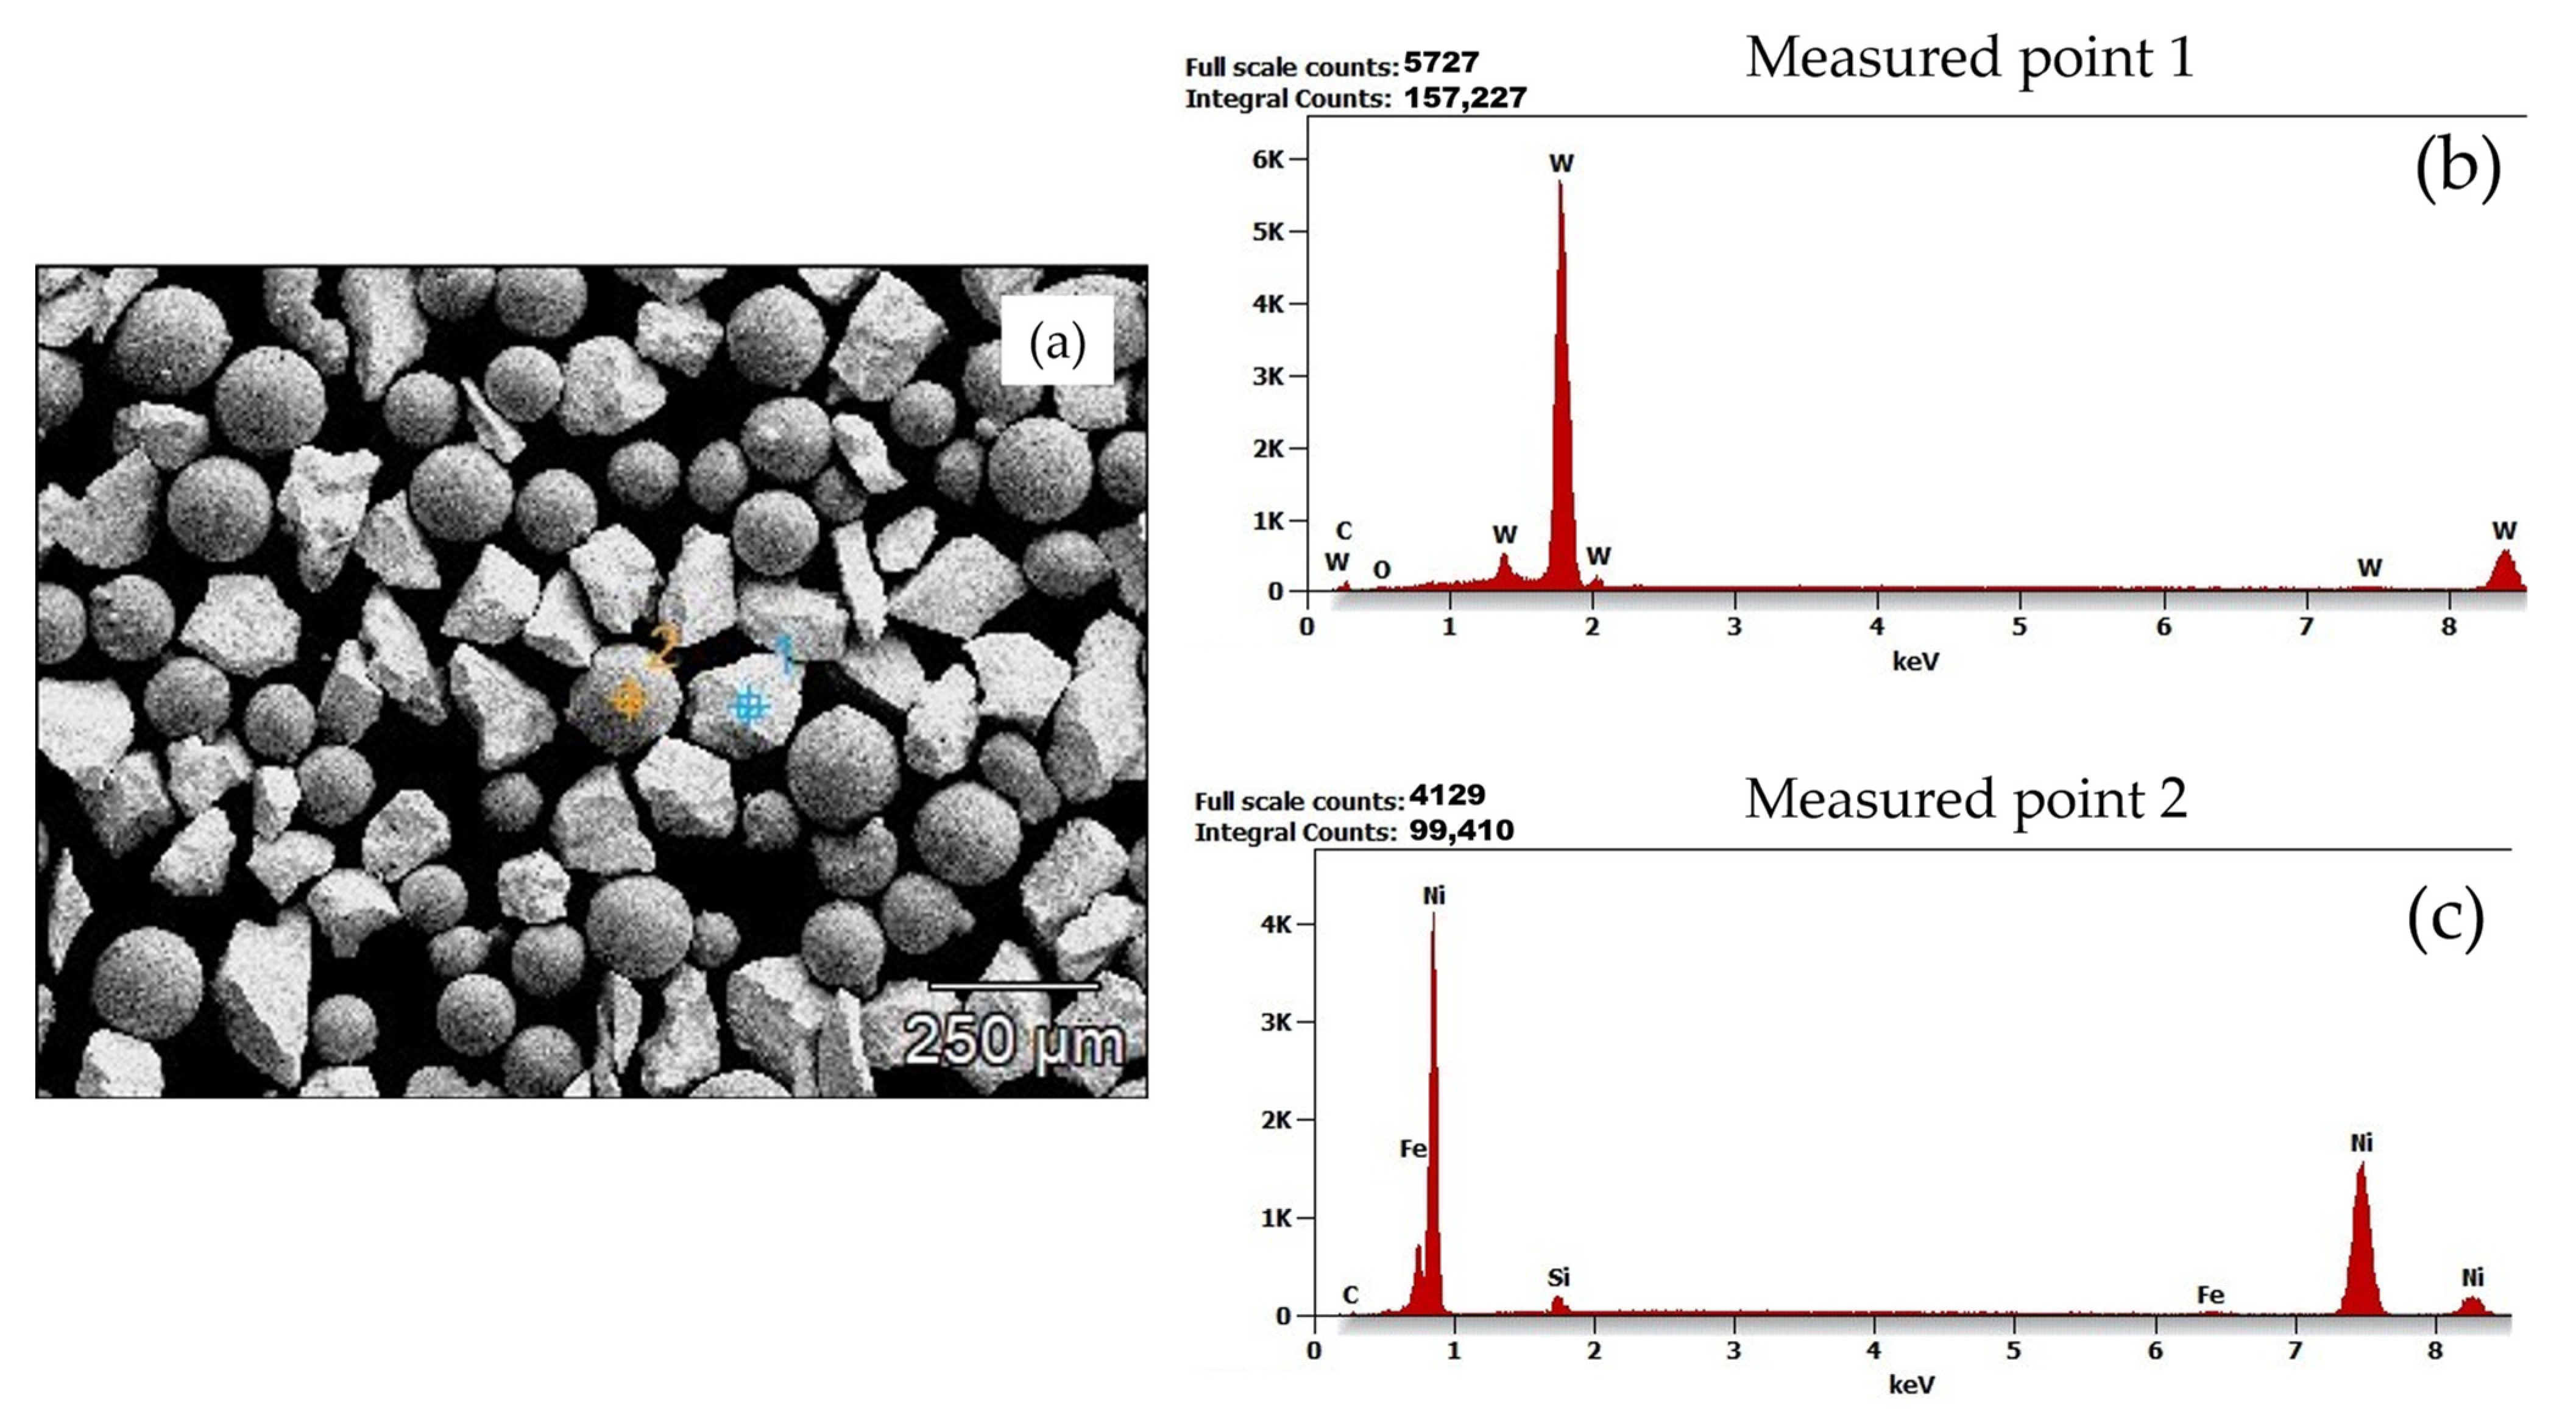
Figure 5.
Microanalysis of powder particles (a) acquired SEM image of PG powder showing its morphology and measured points under analysis (b,c) Energy-dispersive X-ray spectrometry (EDS) diagrams of measured points 1 and 2.
Figure 5.
Microanalysis of powder particles (a) acquired SEM image of PG powder showing its morphology and measured points under analysis (b,c) Energy-dispersive X-ray spectrometry (EDS) diagrams of measured points 1 and 2.
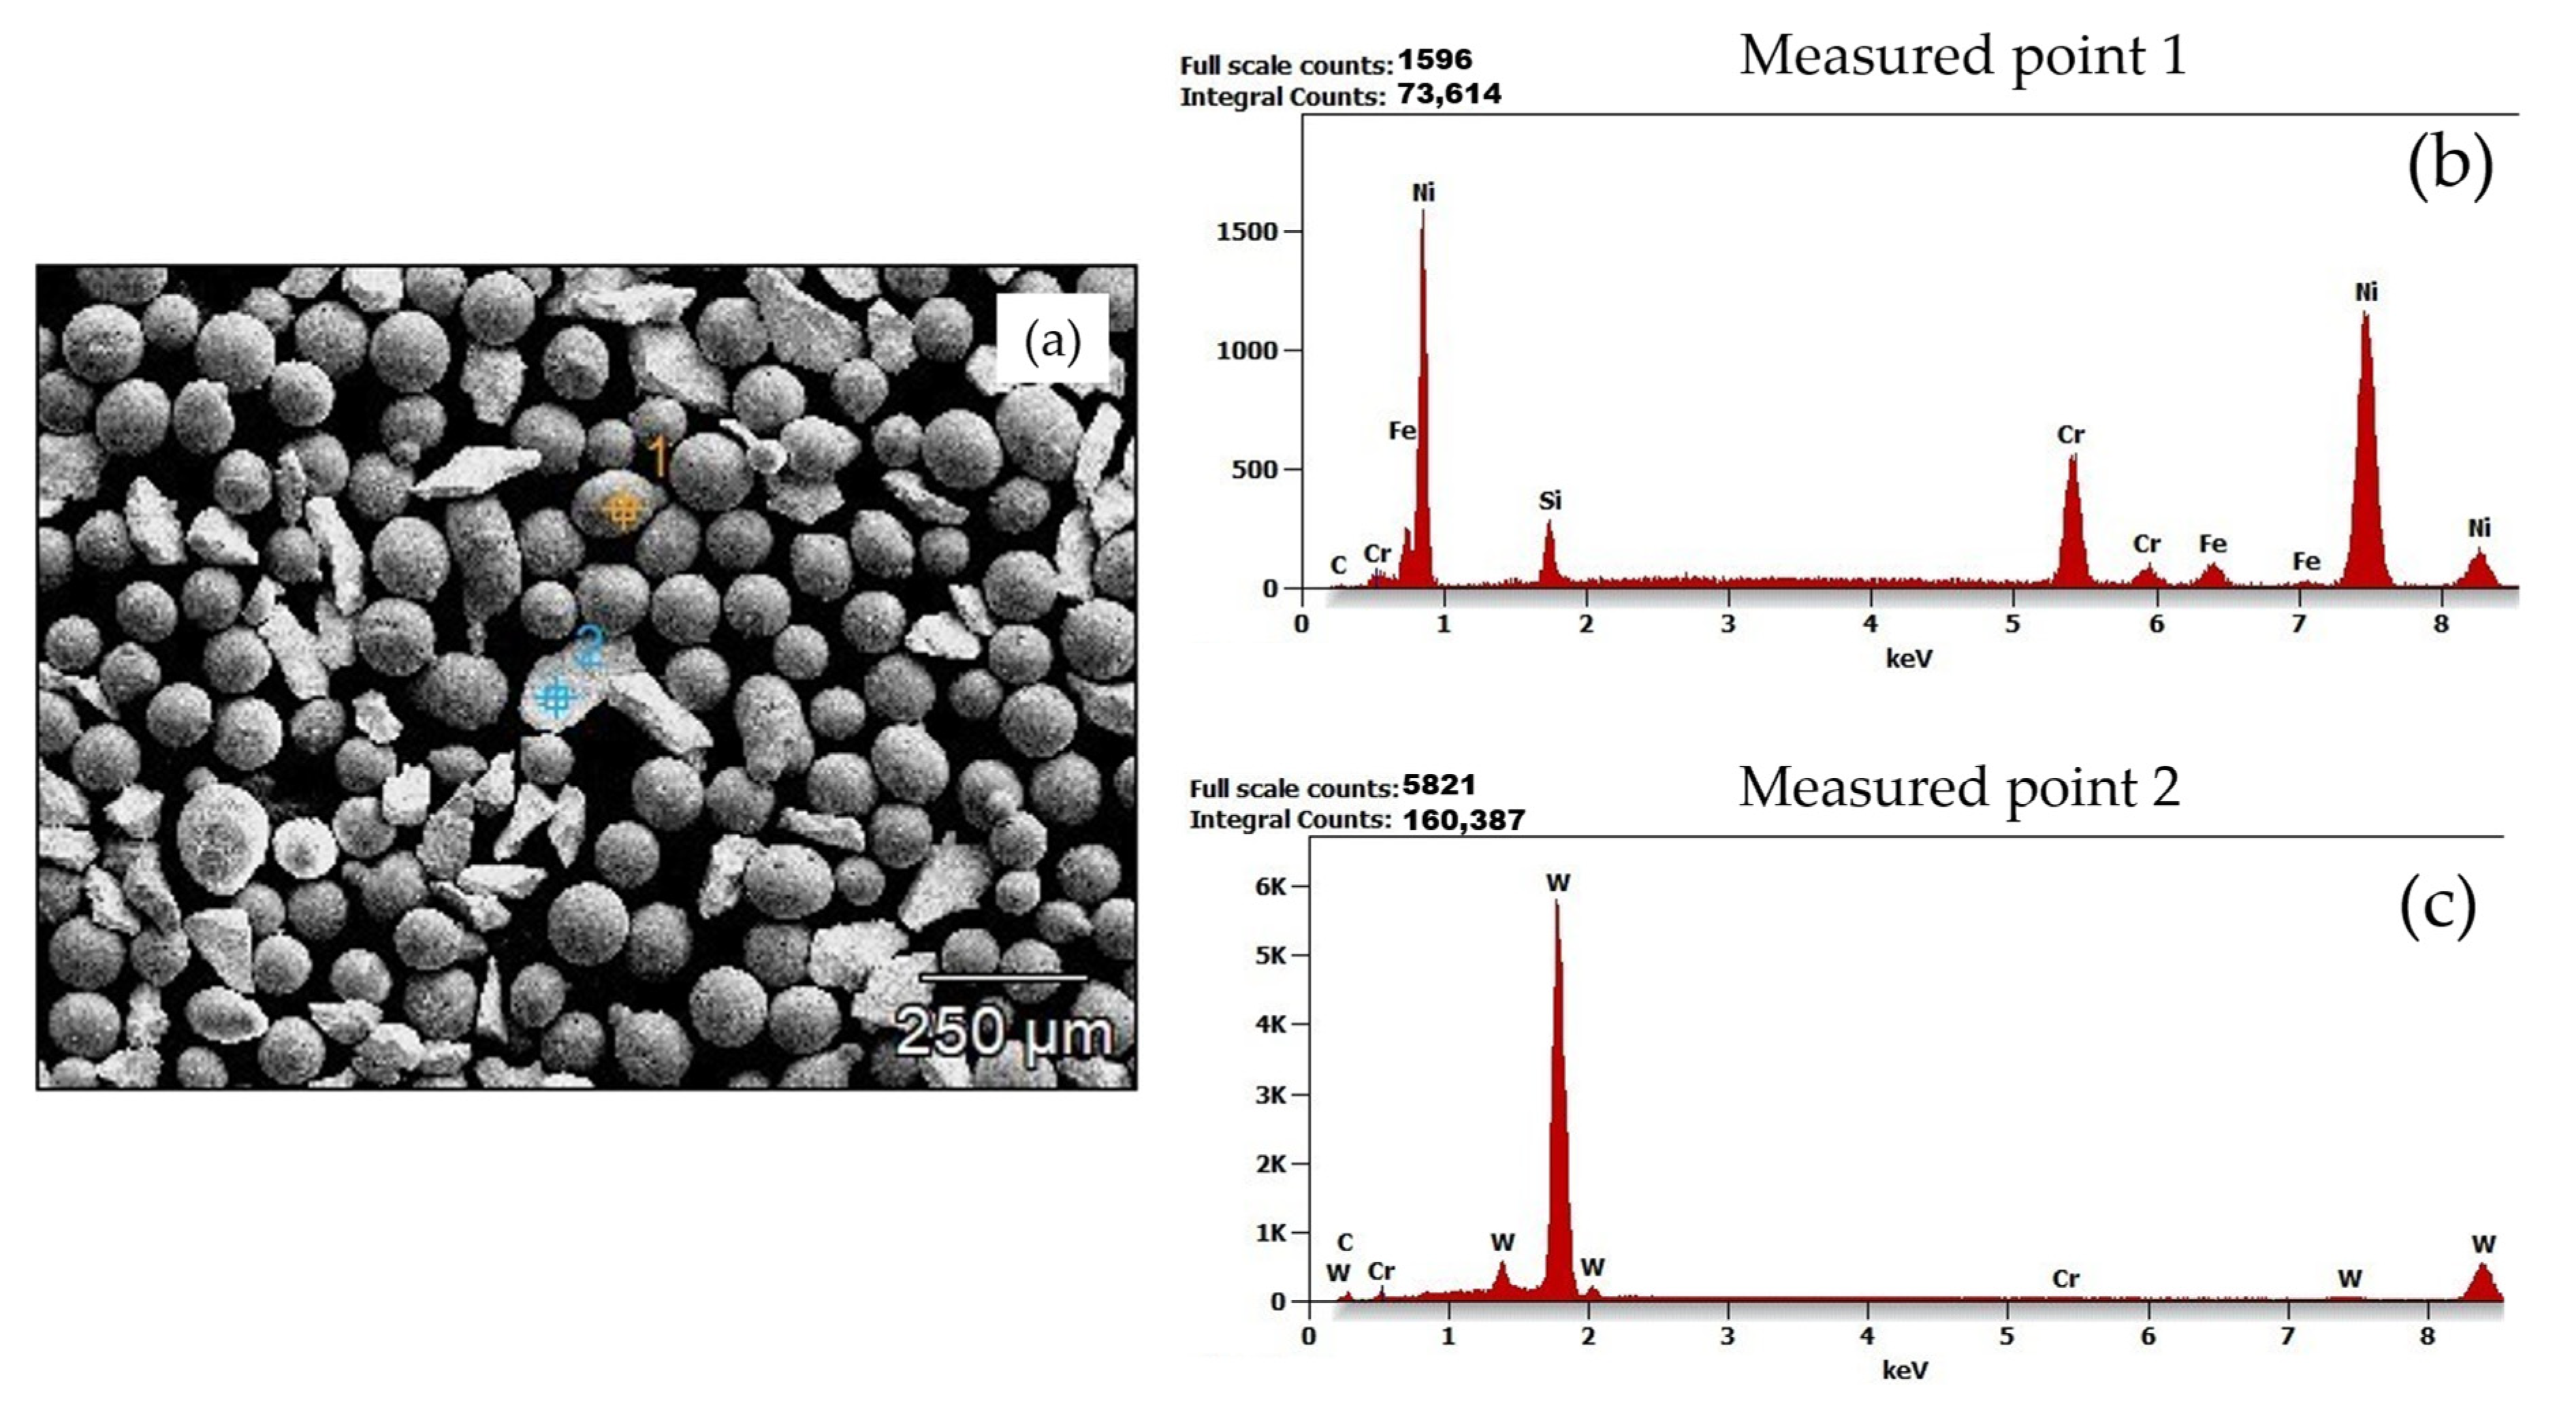
Figure 6.
Microanalysis of powder particles (a) acquired SEM image of PE powder showing its morphology and measured points under analysis (b,c) Energy-dispersive X-ray spectrometry (EDS) diagrams of measured points 1 and 2.
Figure 6.
Microanalysis of powder particles (a) acquired SEM image of PE powder showing its morphology and measured points under analysis (b,c) Energy-dispersive X-ray spectrometry (EDS) diagrams of measured points 1 and 2.
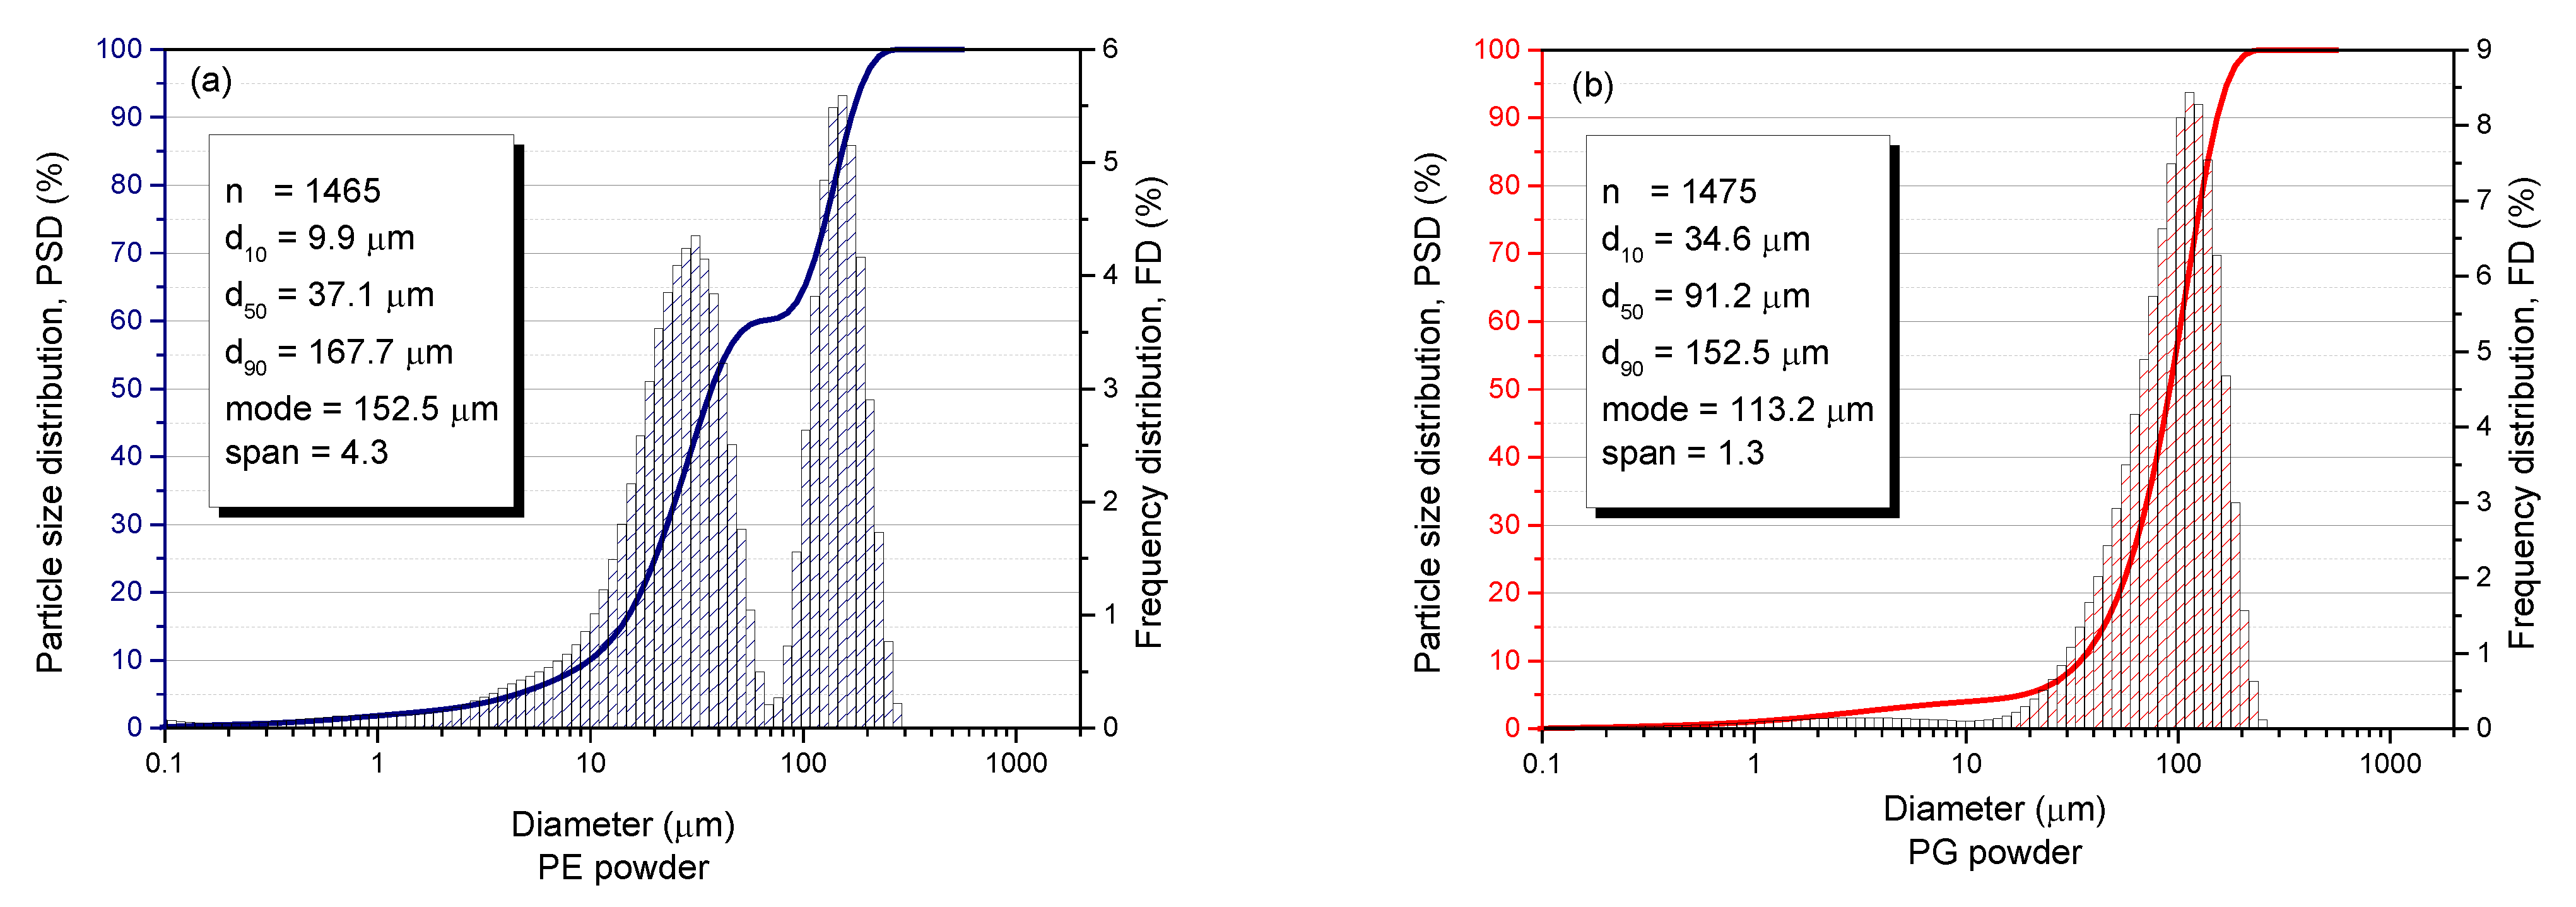
Figure 7.
Particle size distribution (PSD) plots for the MMC powders (a) PE powder PSD plot with particle statistics (b) PG powder PSD plot with particle statistics.
Figure 7.
Particle size distribution (PSD) plots for the MMC powders (a) PE powder PSD plot with particle statistics (b) PG powder PSD plot with particle statistics.
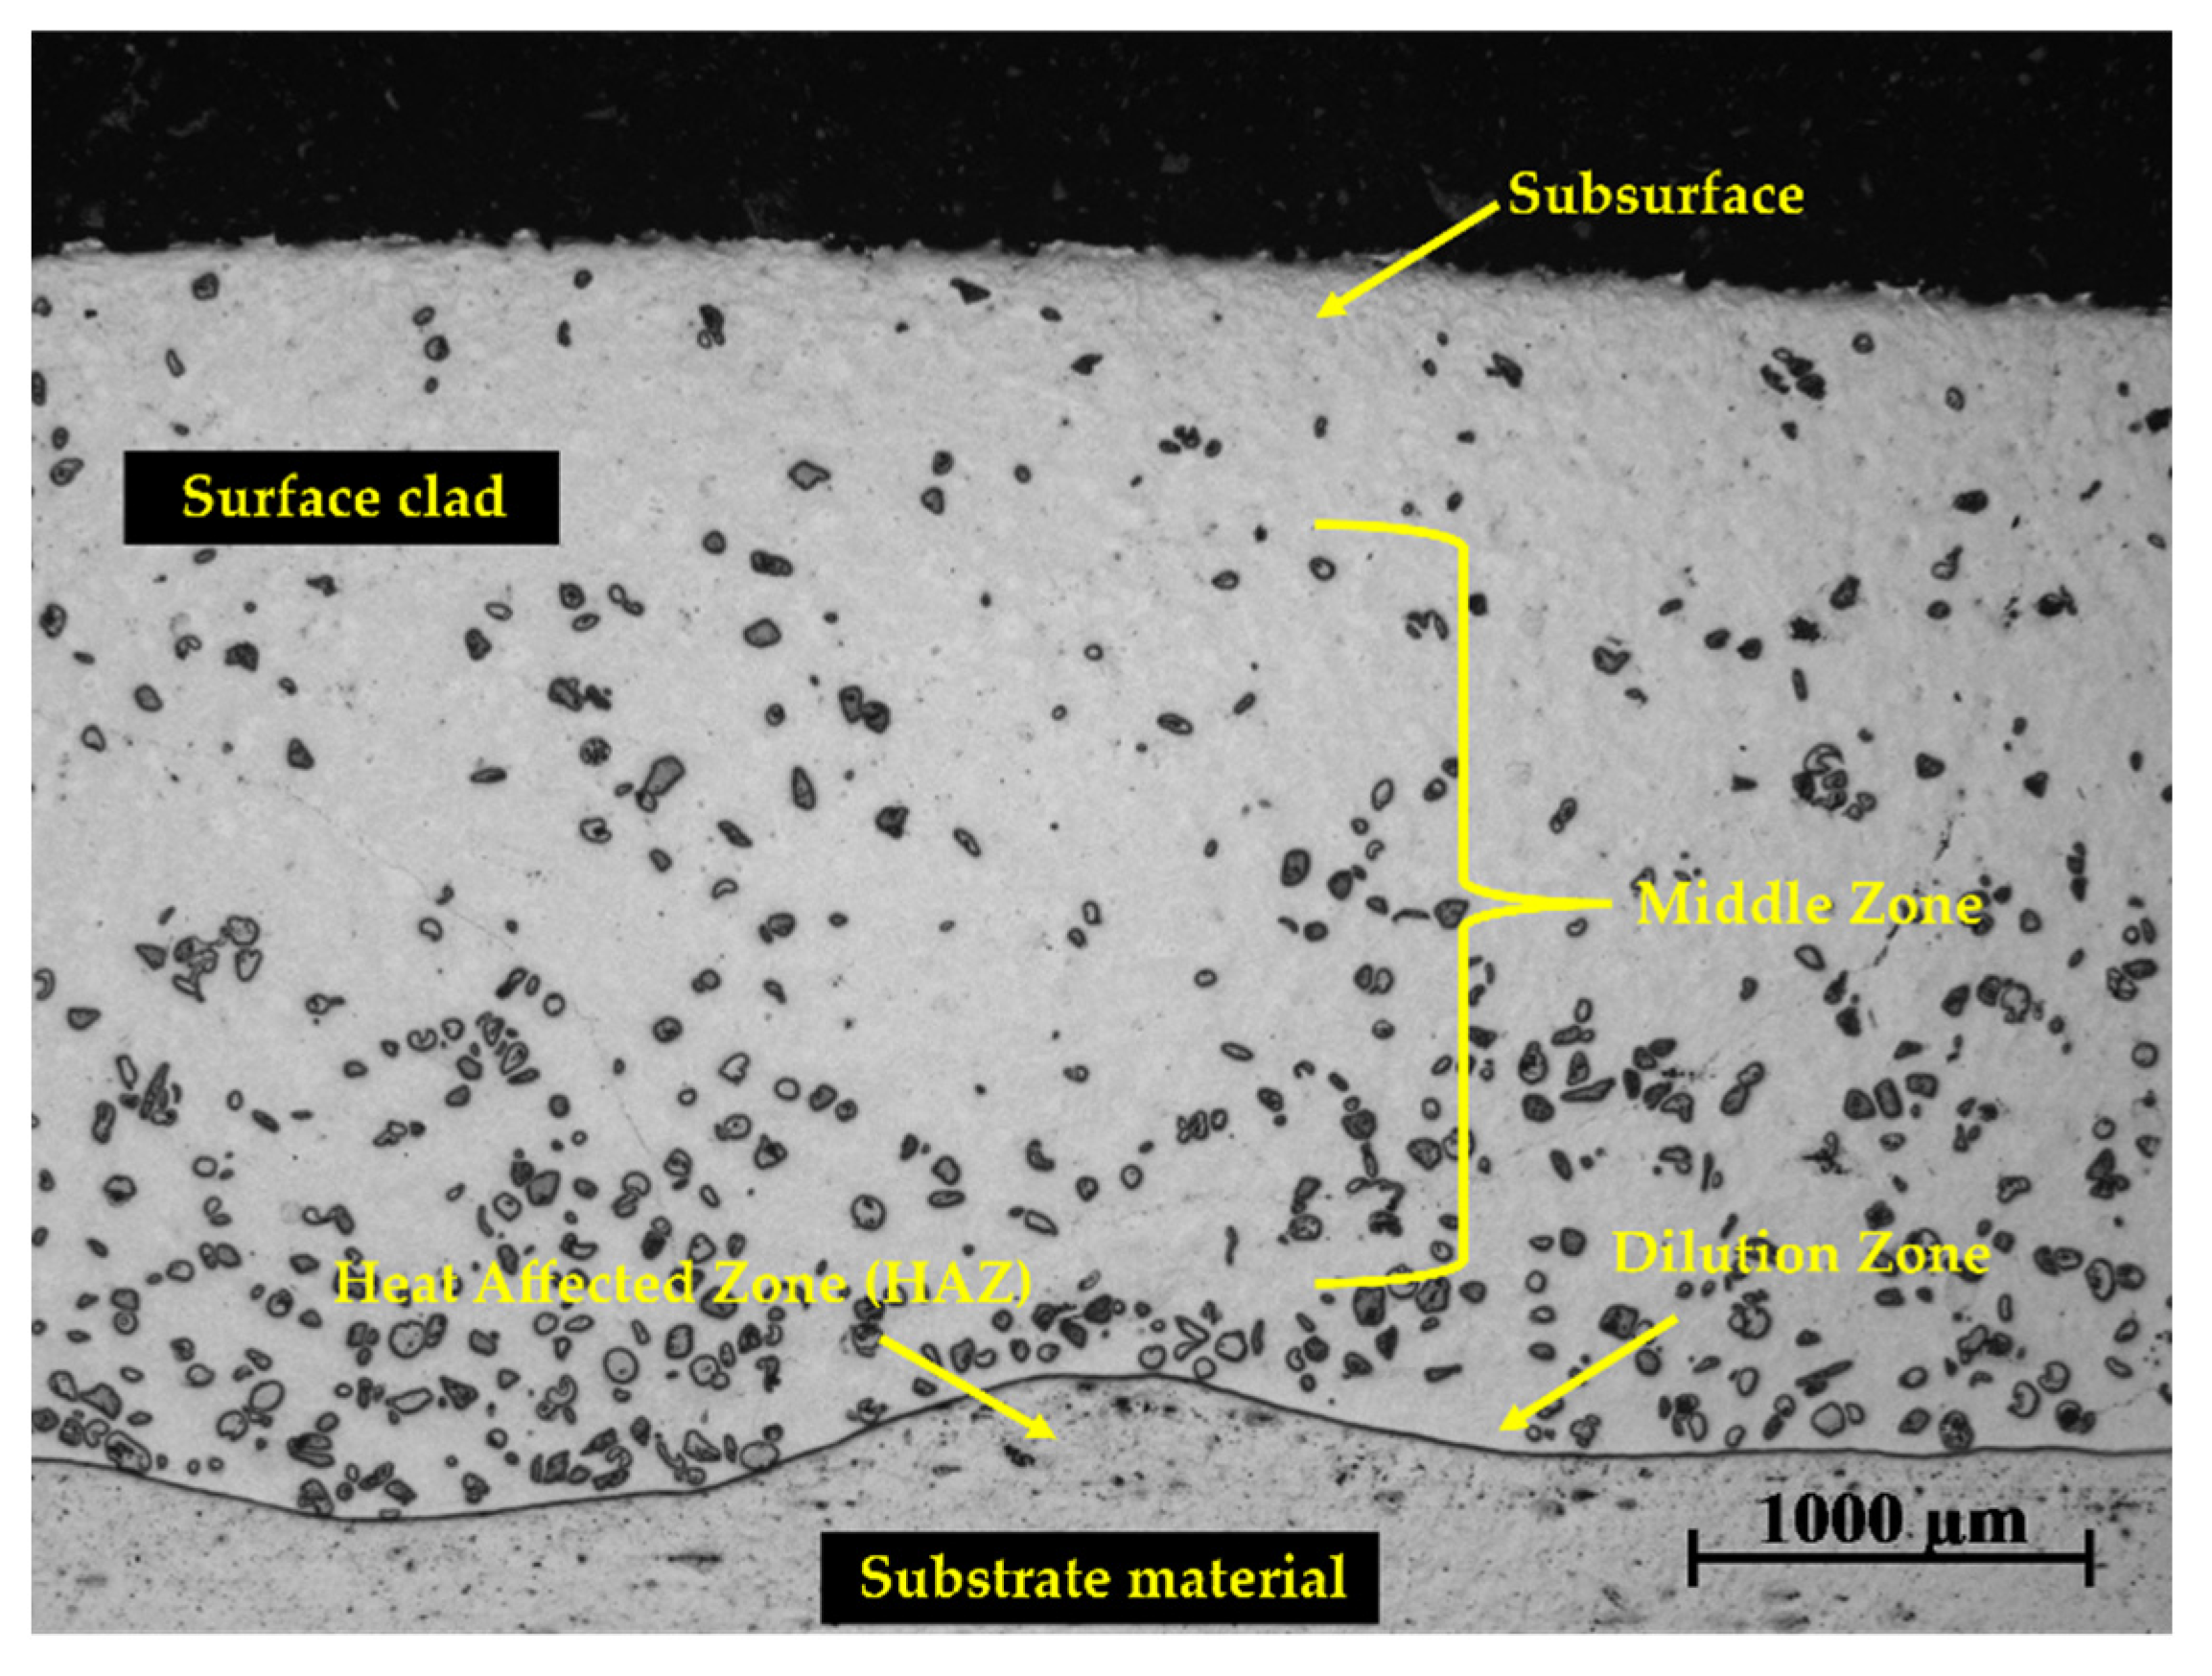
Figure 8.
Cross-section of deposited surface layer of sample 1-PE showing the subsurface of the layer, middle zone, dilution zone, and HAZ.
Figure 8.
Cross-section of deposited surface layer of sample 1-PE showing the subsurface of the layer, middle zone, dilution zone, and HAZ.
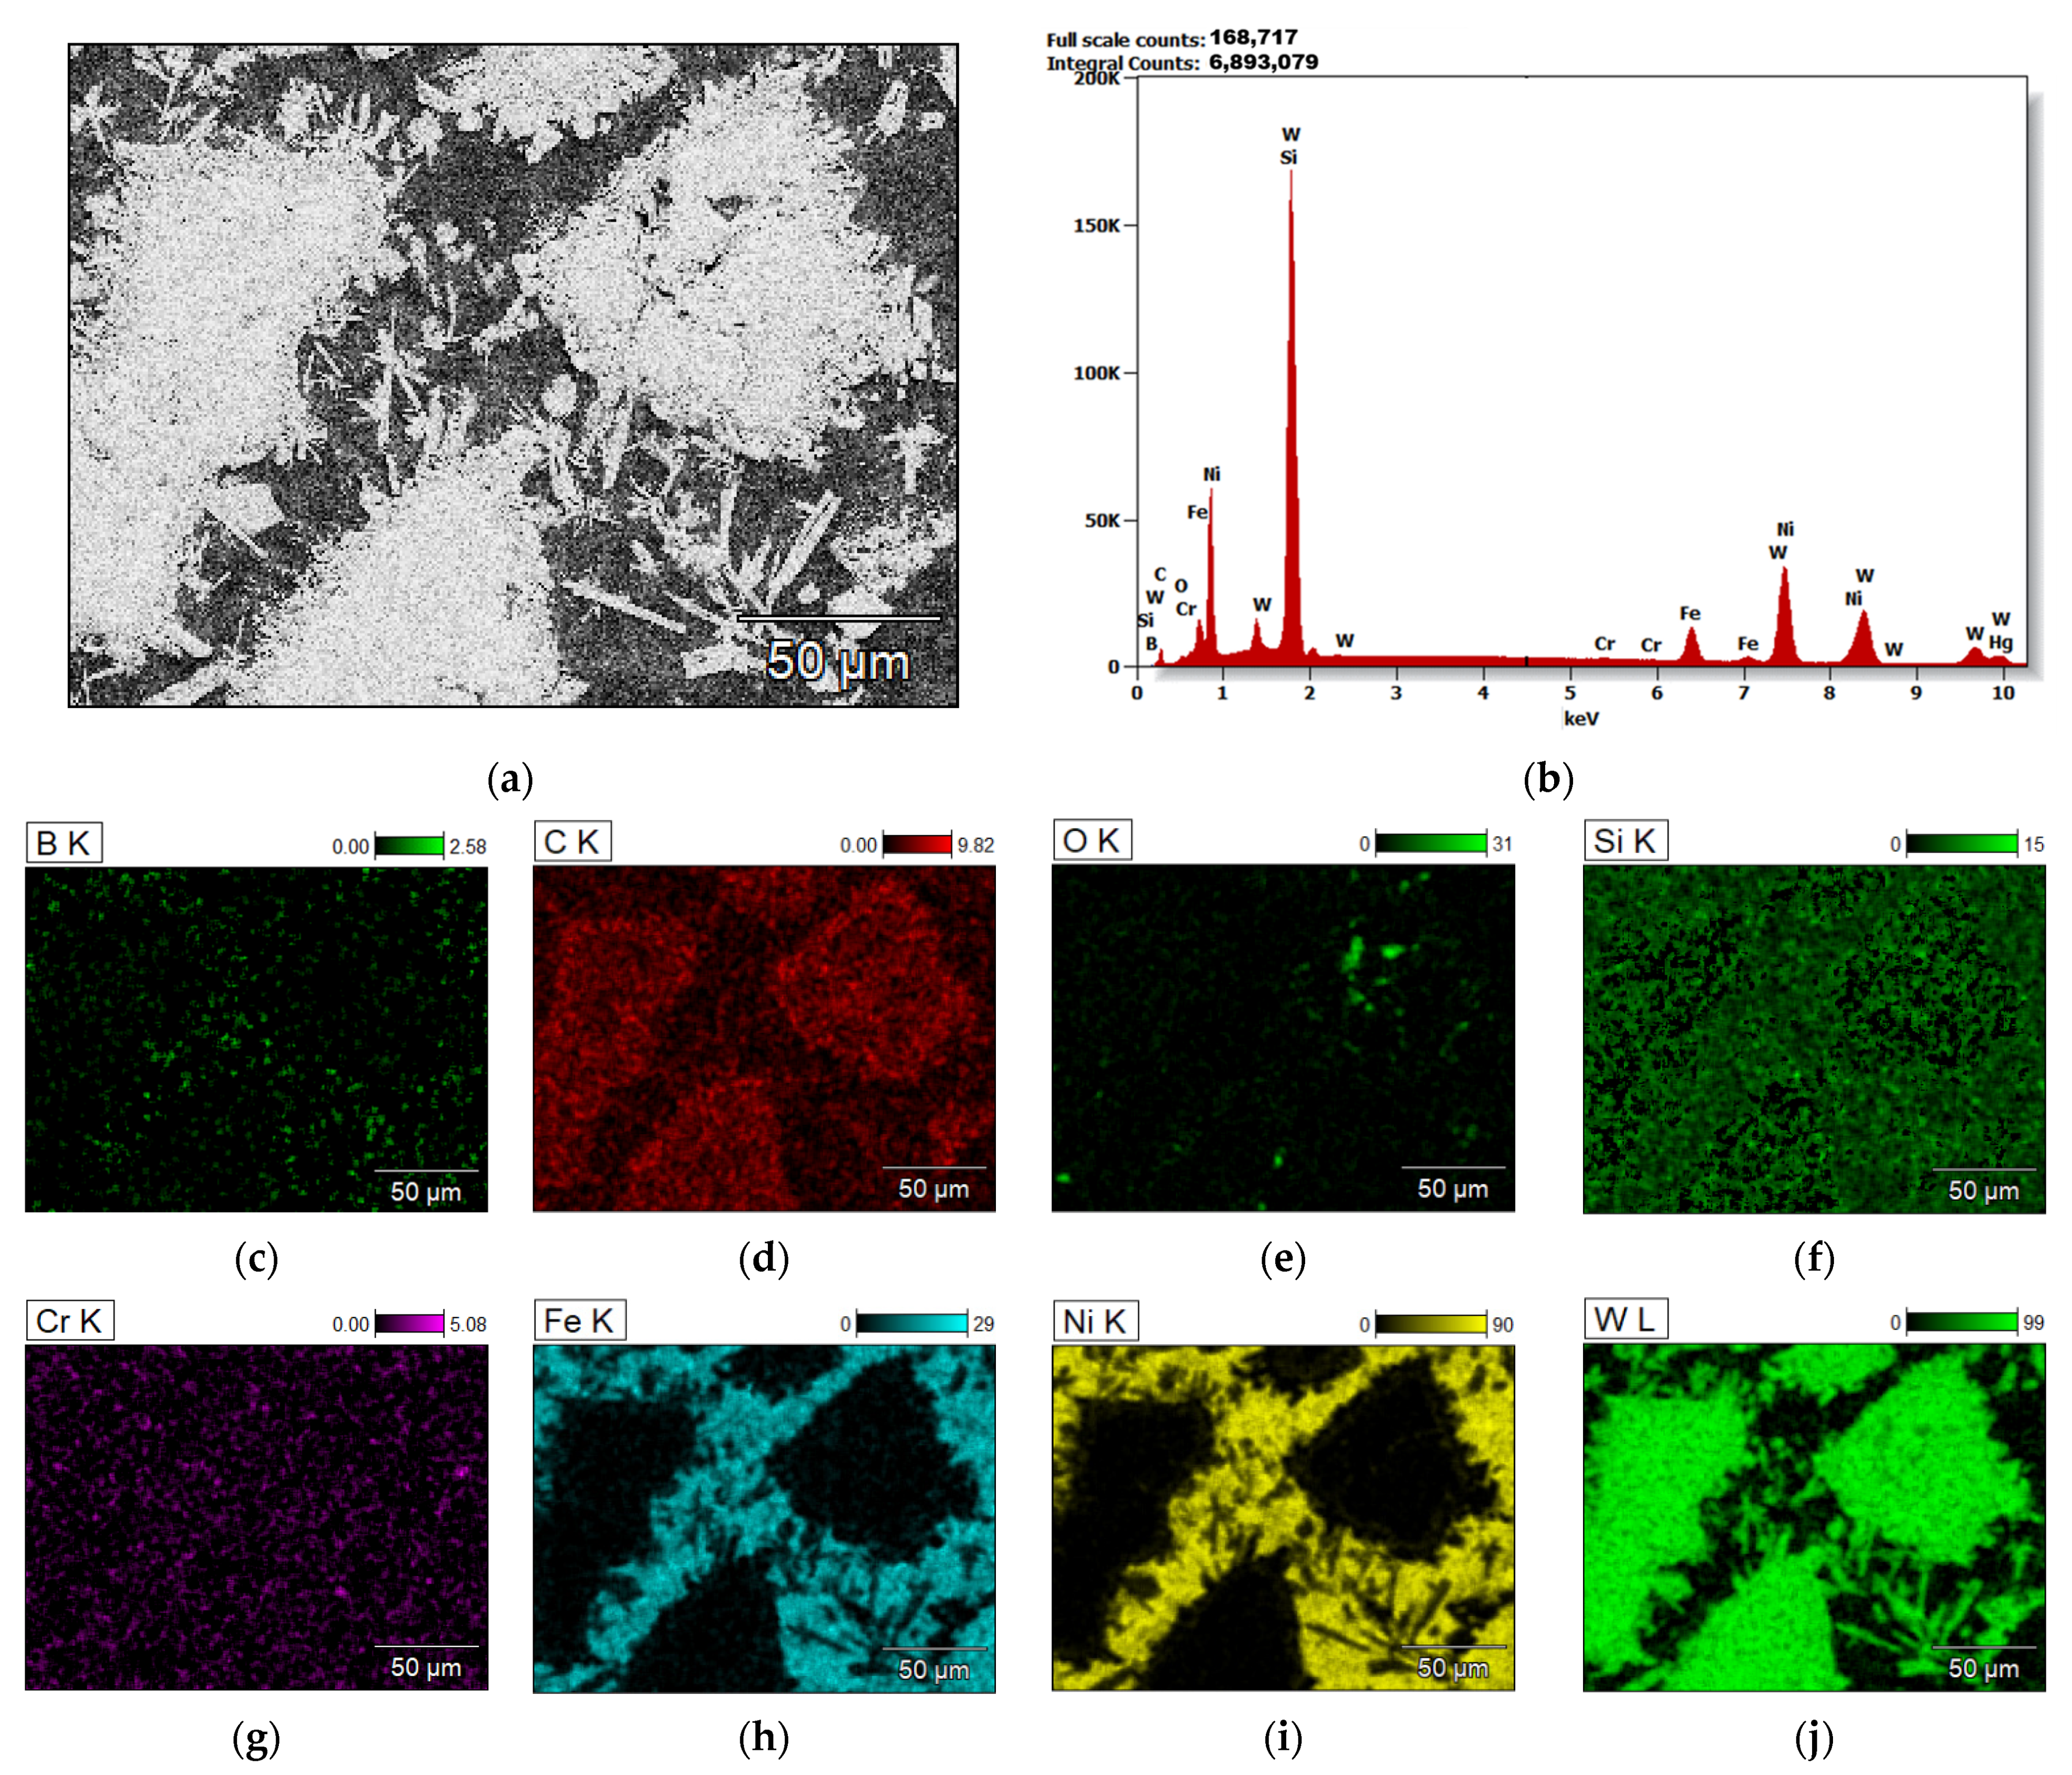
Figure 9.
Elemental analysis of the middle zone of the surface layer of sample 4-PE (a) area under observation (b) X-radiation energy diagram of area under observation (c–j) elemental maps showing the position and amounts of elements present in the area under observation.
Figure 9.
Elemental analysis of the middle zone of the surface layer of sample 4-PE (a) area under observation (b) X-radiation energy diagram of area under observation (c–j) elemental maps showing the position and amounts of elements present in the area under observation.
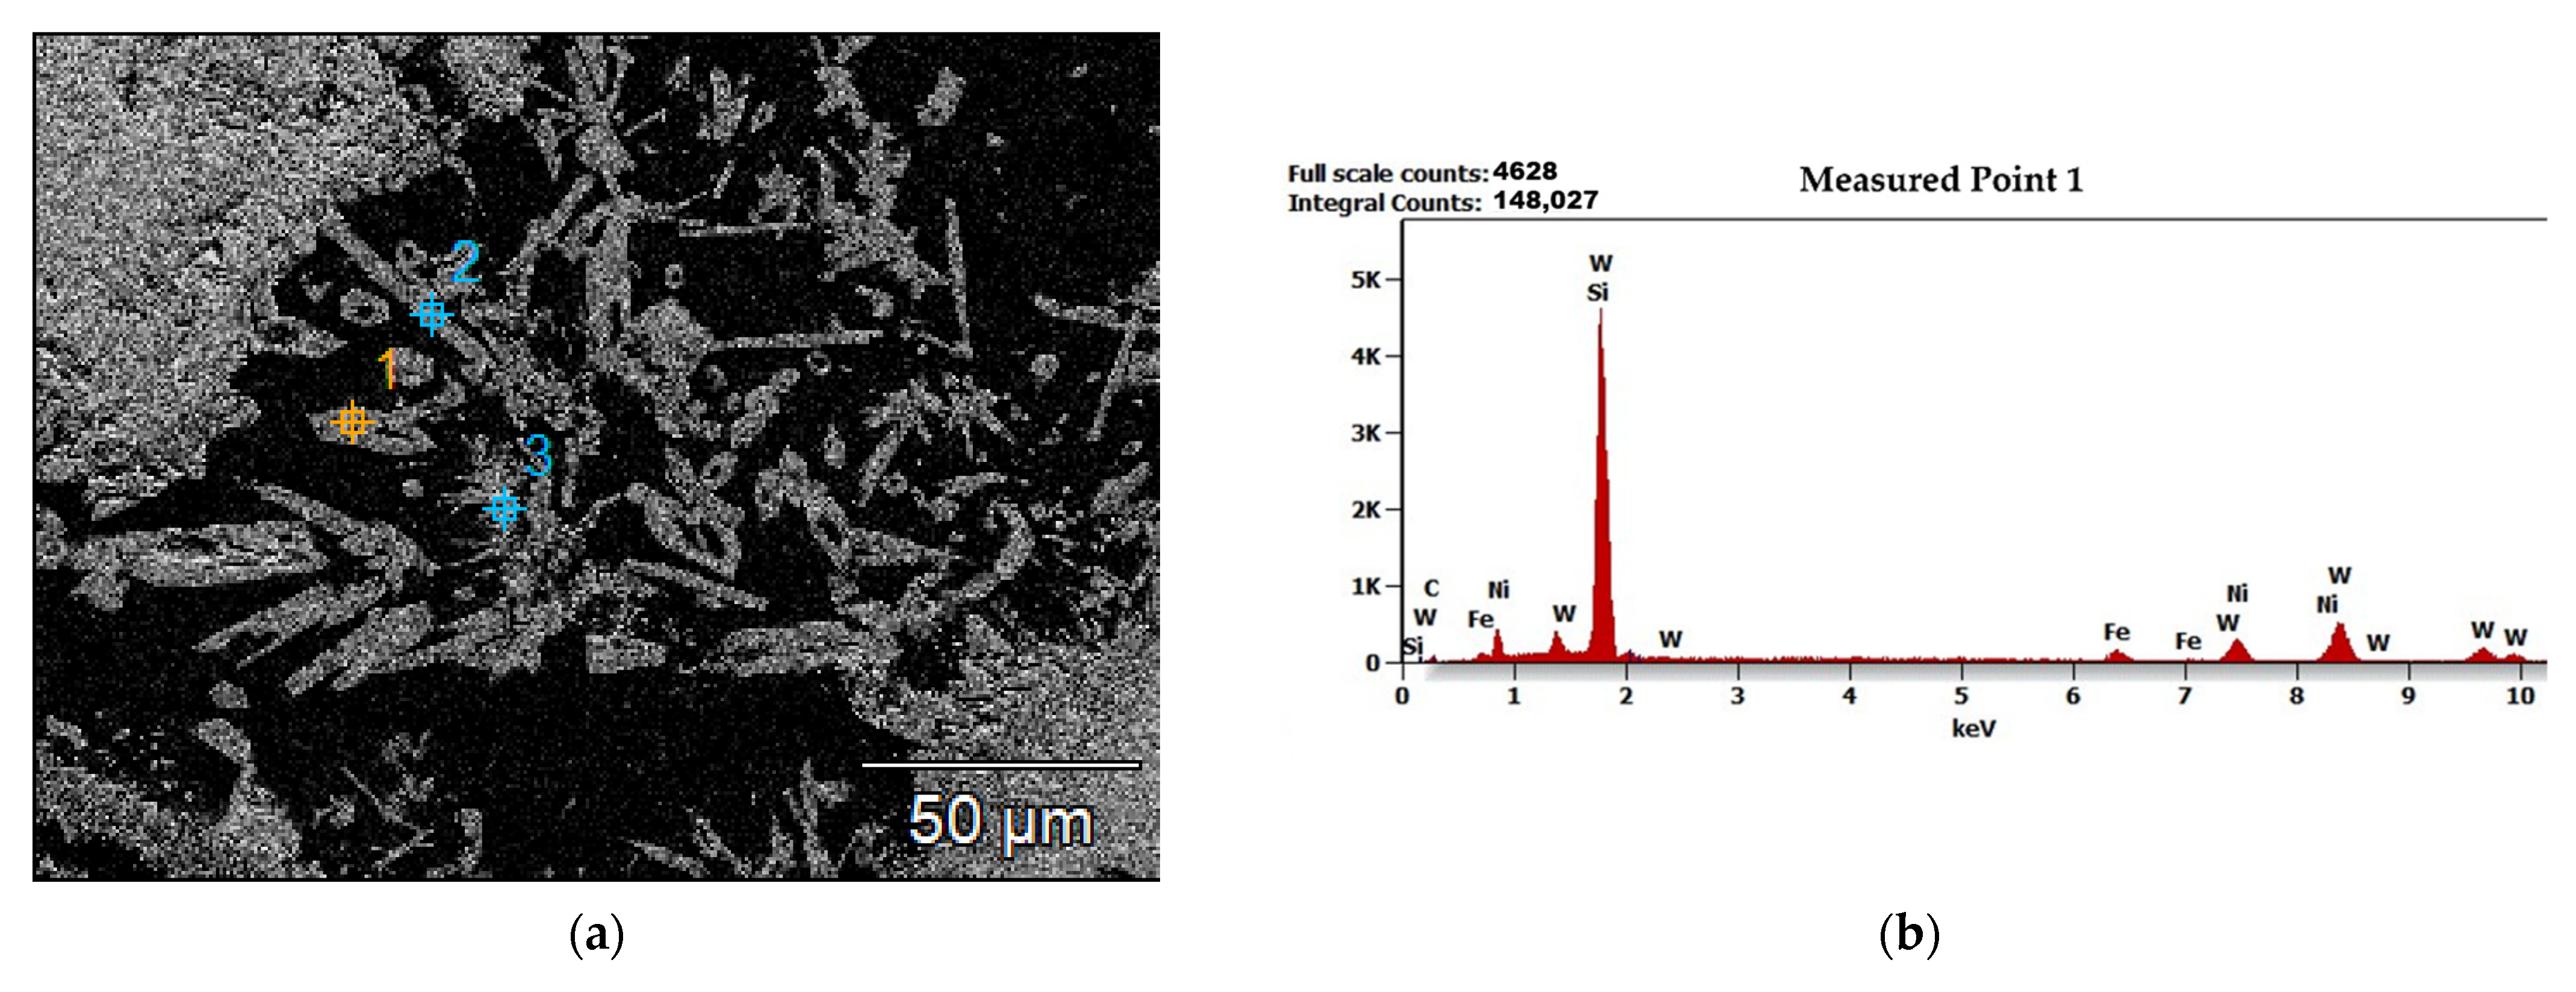
Figure 10.
Results of microanalysis of precipitates of the WC reinforcement within the surface layer of sample 4-PE prepared under conditions of 110 A PTA current and 1.5L/min PGFR (a) Image of microanalytical area showing points of interests for analysis (b–d) Energy-dispersive X-ray spectrometry (EDS) diagrams of measured points 1 through 3.
Figure 11.
SEM image of the coating-substrate interface of sample 3-PE, showing the dilution zone, HAZ and the diffusion gradients of the chemical components involved in the interface adhesion between the coating and the surface.
Figure 11.
SEM image of the coating-substrate interface of sample 3-PE, showing the dilution zone, HAZ and the diffusion gradients of the chemical components involved in the interface adhesion between the coating and the surface.
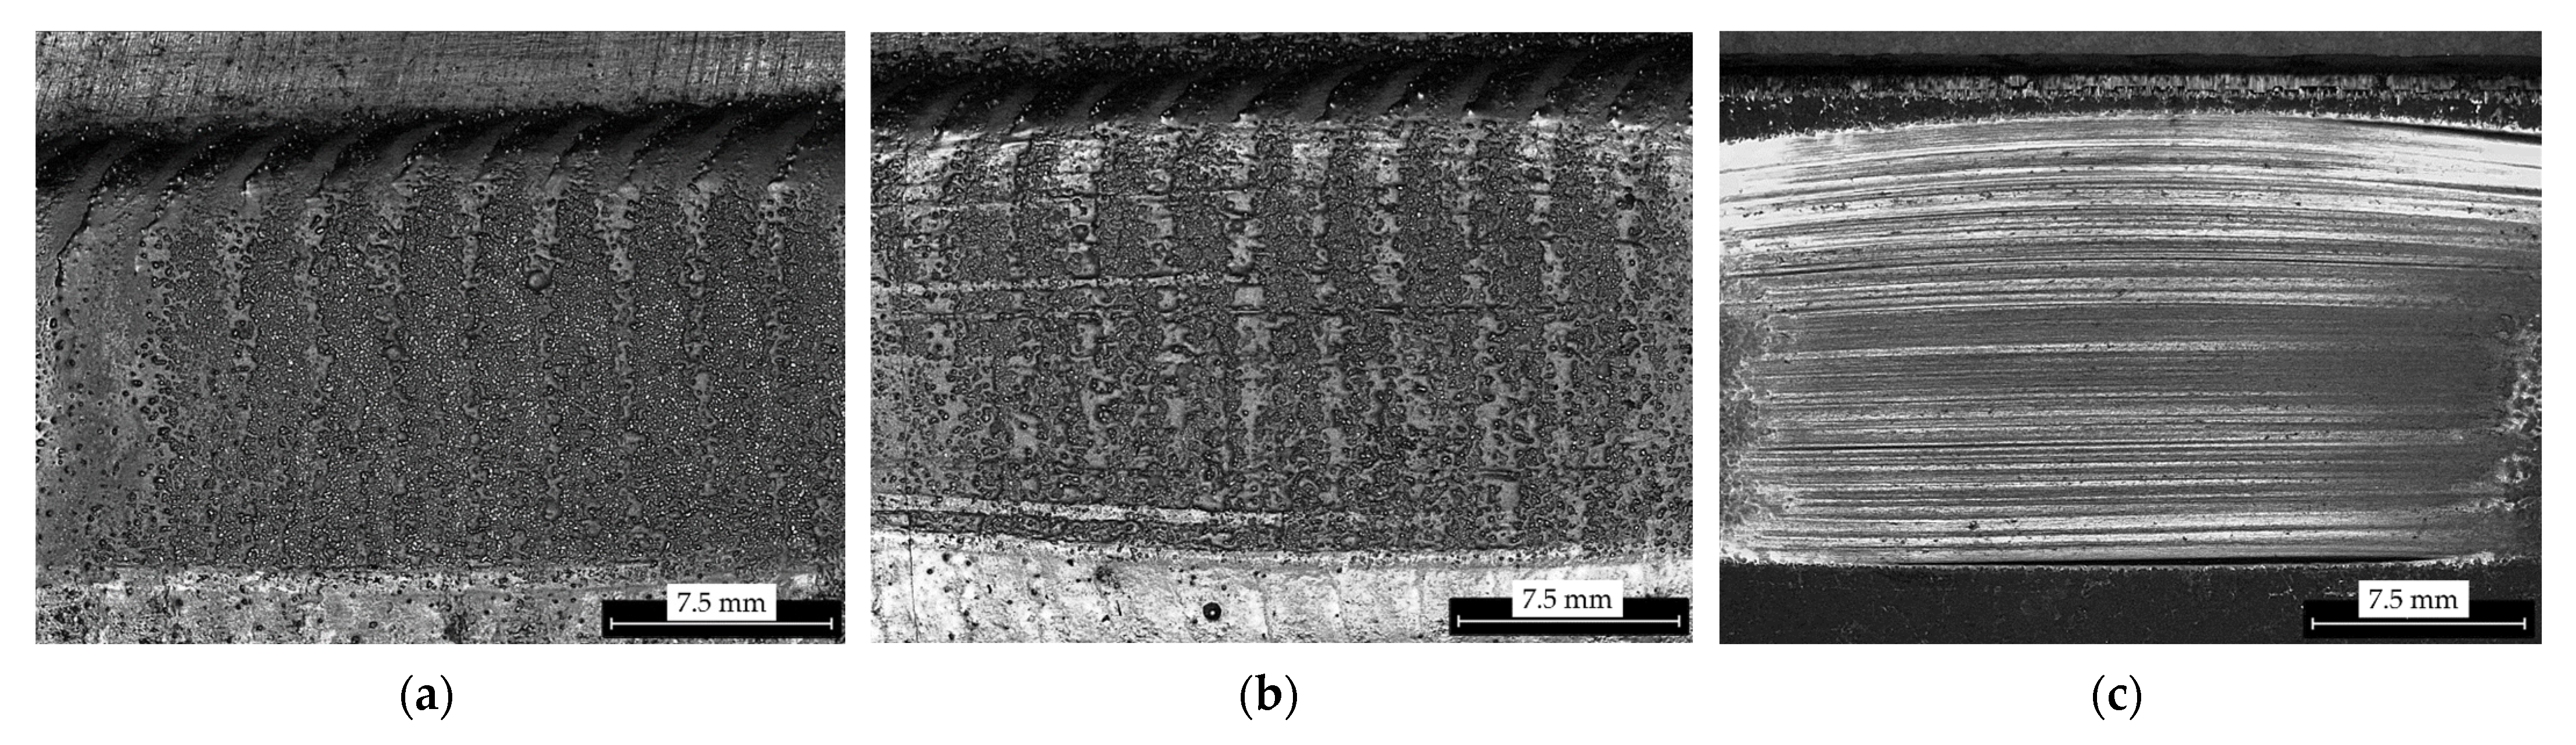
Figure 12.
Surface of coating layers after abrasive wear resistance tests (a) surface of layer of sample 1-PG prepared using PG powder (b) surface of layer of sample 1-PE prepared using PE powder (c) surface of reference material AR400.
Figure 12.
Surface of coating layers after abrasive wear resistance tests (a) surface of layer of sample 1-PG prepared using PG powder (b) surface of layer of sample 1-PE prepared using PE powder (c) surface of reference material AR400.
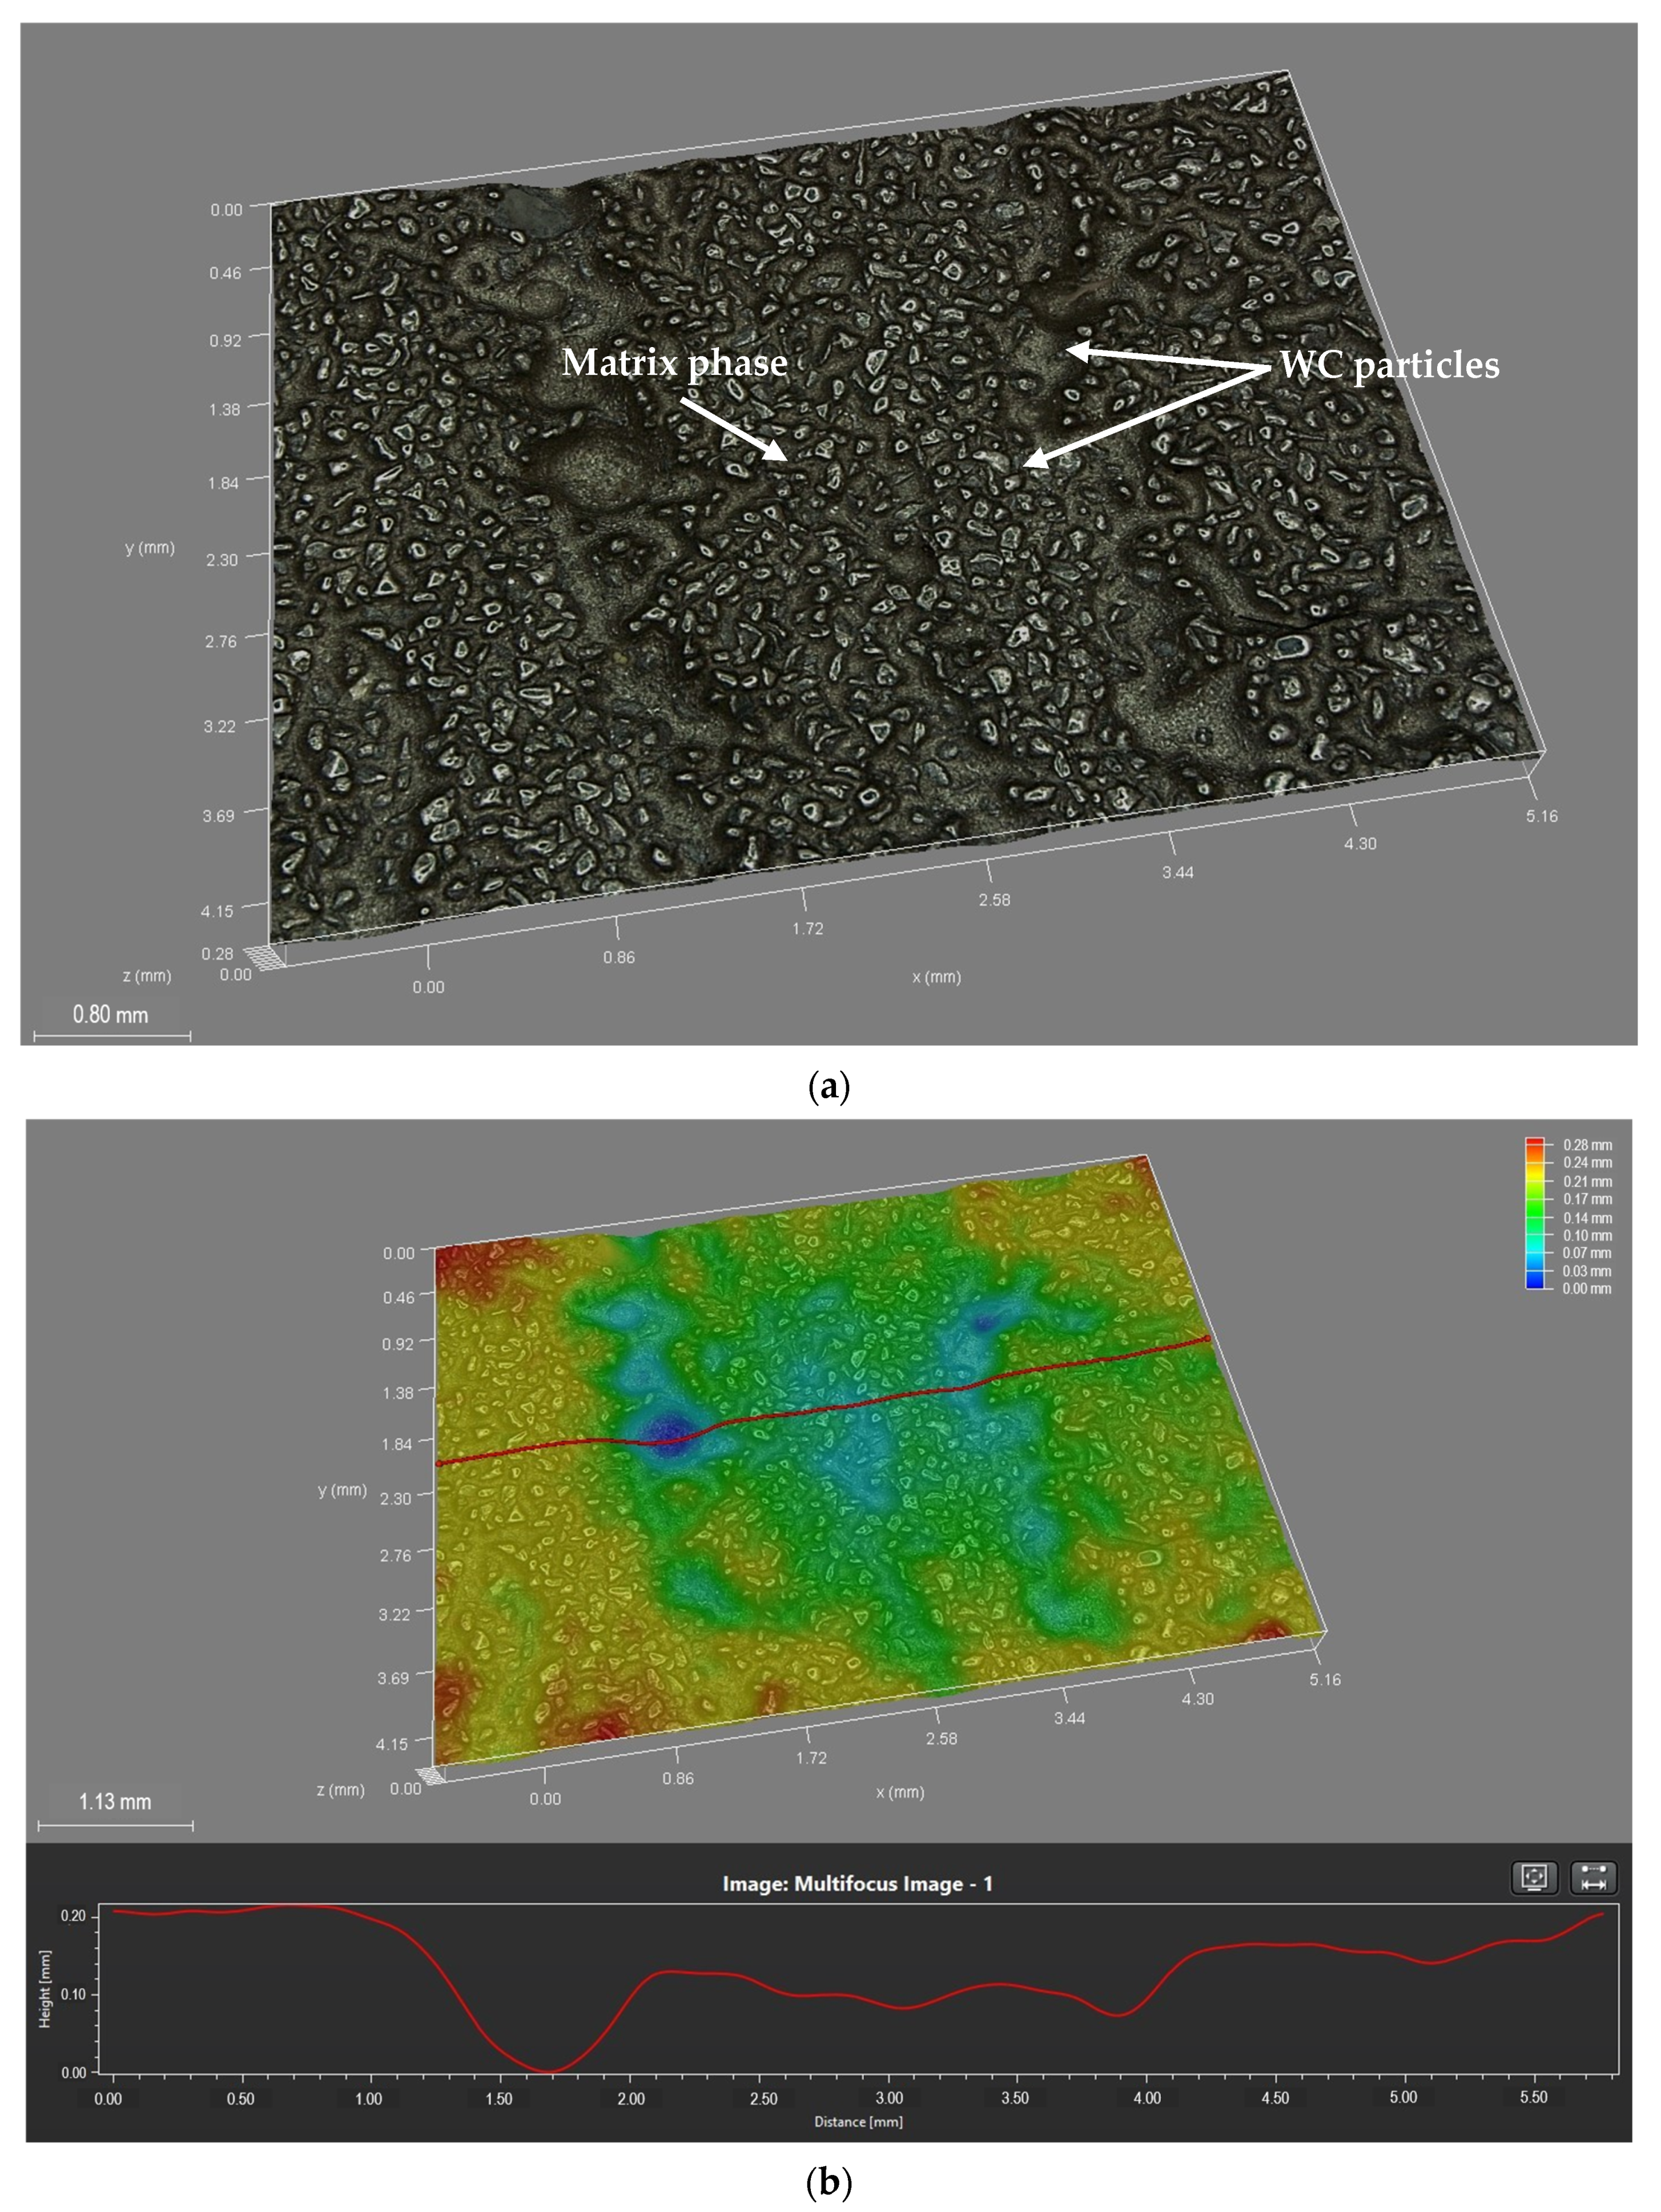
Figure 13.
Images of surface layer of sample 4-PG after abrasive wear resistance test (a) post-abrasive wear test surface showing dispersed WC particles and the matrix phase (b) depth map showing the depth of abrasion on the surface of the layer.
Figure 13.
Images of surface layer of sample 4-PG after abrasive wear resistance test (a) post-abrasive wear test surface showing dispersed WC particles and the matrix phase (b) depth map showing the depth of abrasion on the surface of the layer.
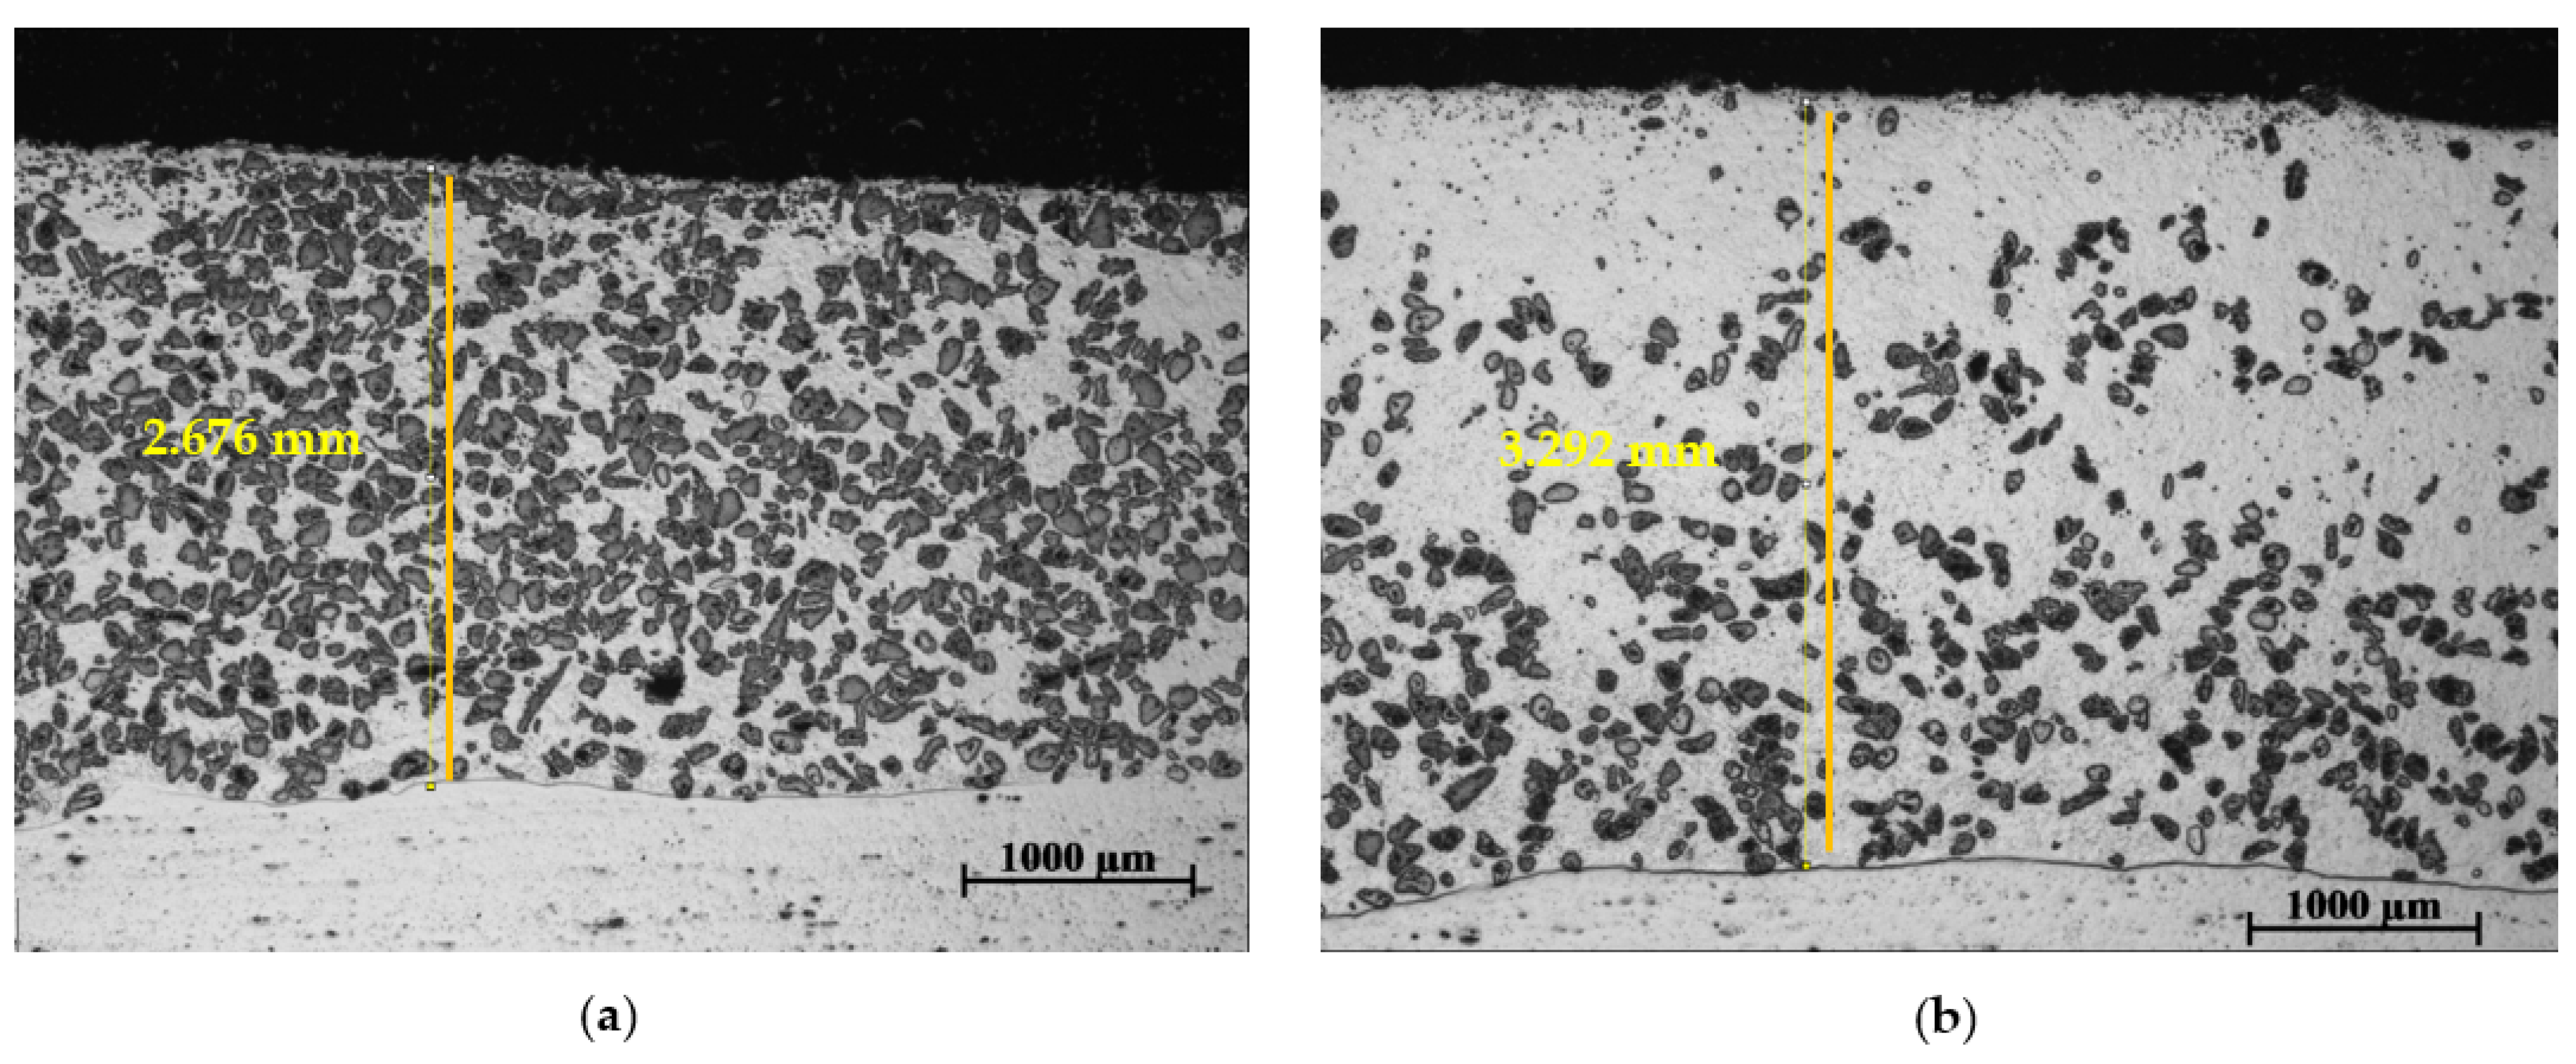
Figure 14.
Cross-section of surface layers prepared with PG powder MMC at different PTA current values showing the measured thickness of surface layers (a) surface layer of 2-PG prepared at PTA current of 110 A (b) surface layer of 3-PG prepared at PTA current of 150 A.
Figure 14.
Cross-section of surface layers prepared with PG powder MMC at different PTA current values showing the measured thickness of surface layers (a) surface layer of 2-PG prepared at PTA current of 110 A (b) surface layer of 3-PG prepared at PTA current of 150 A.
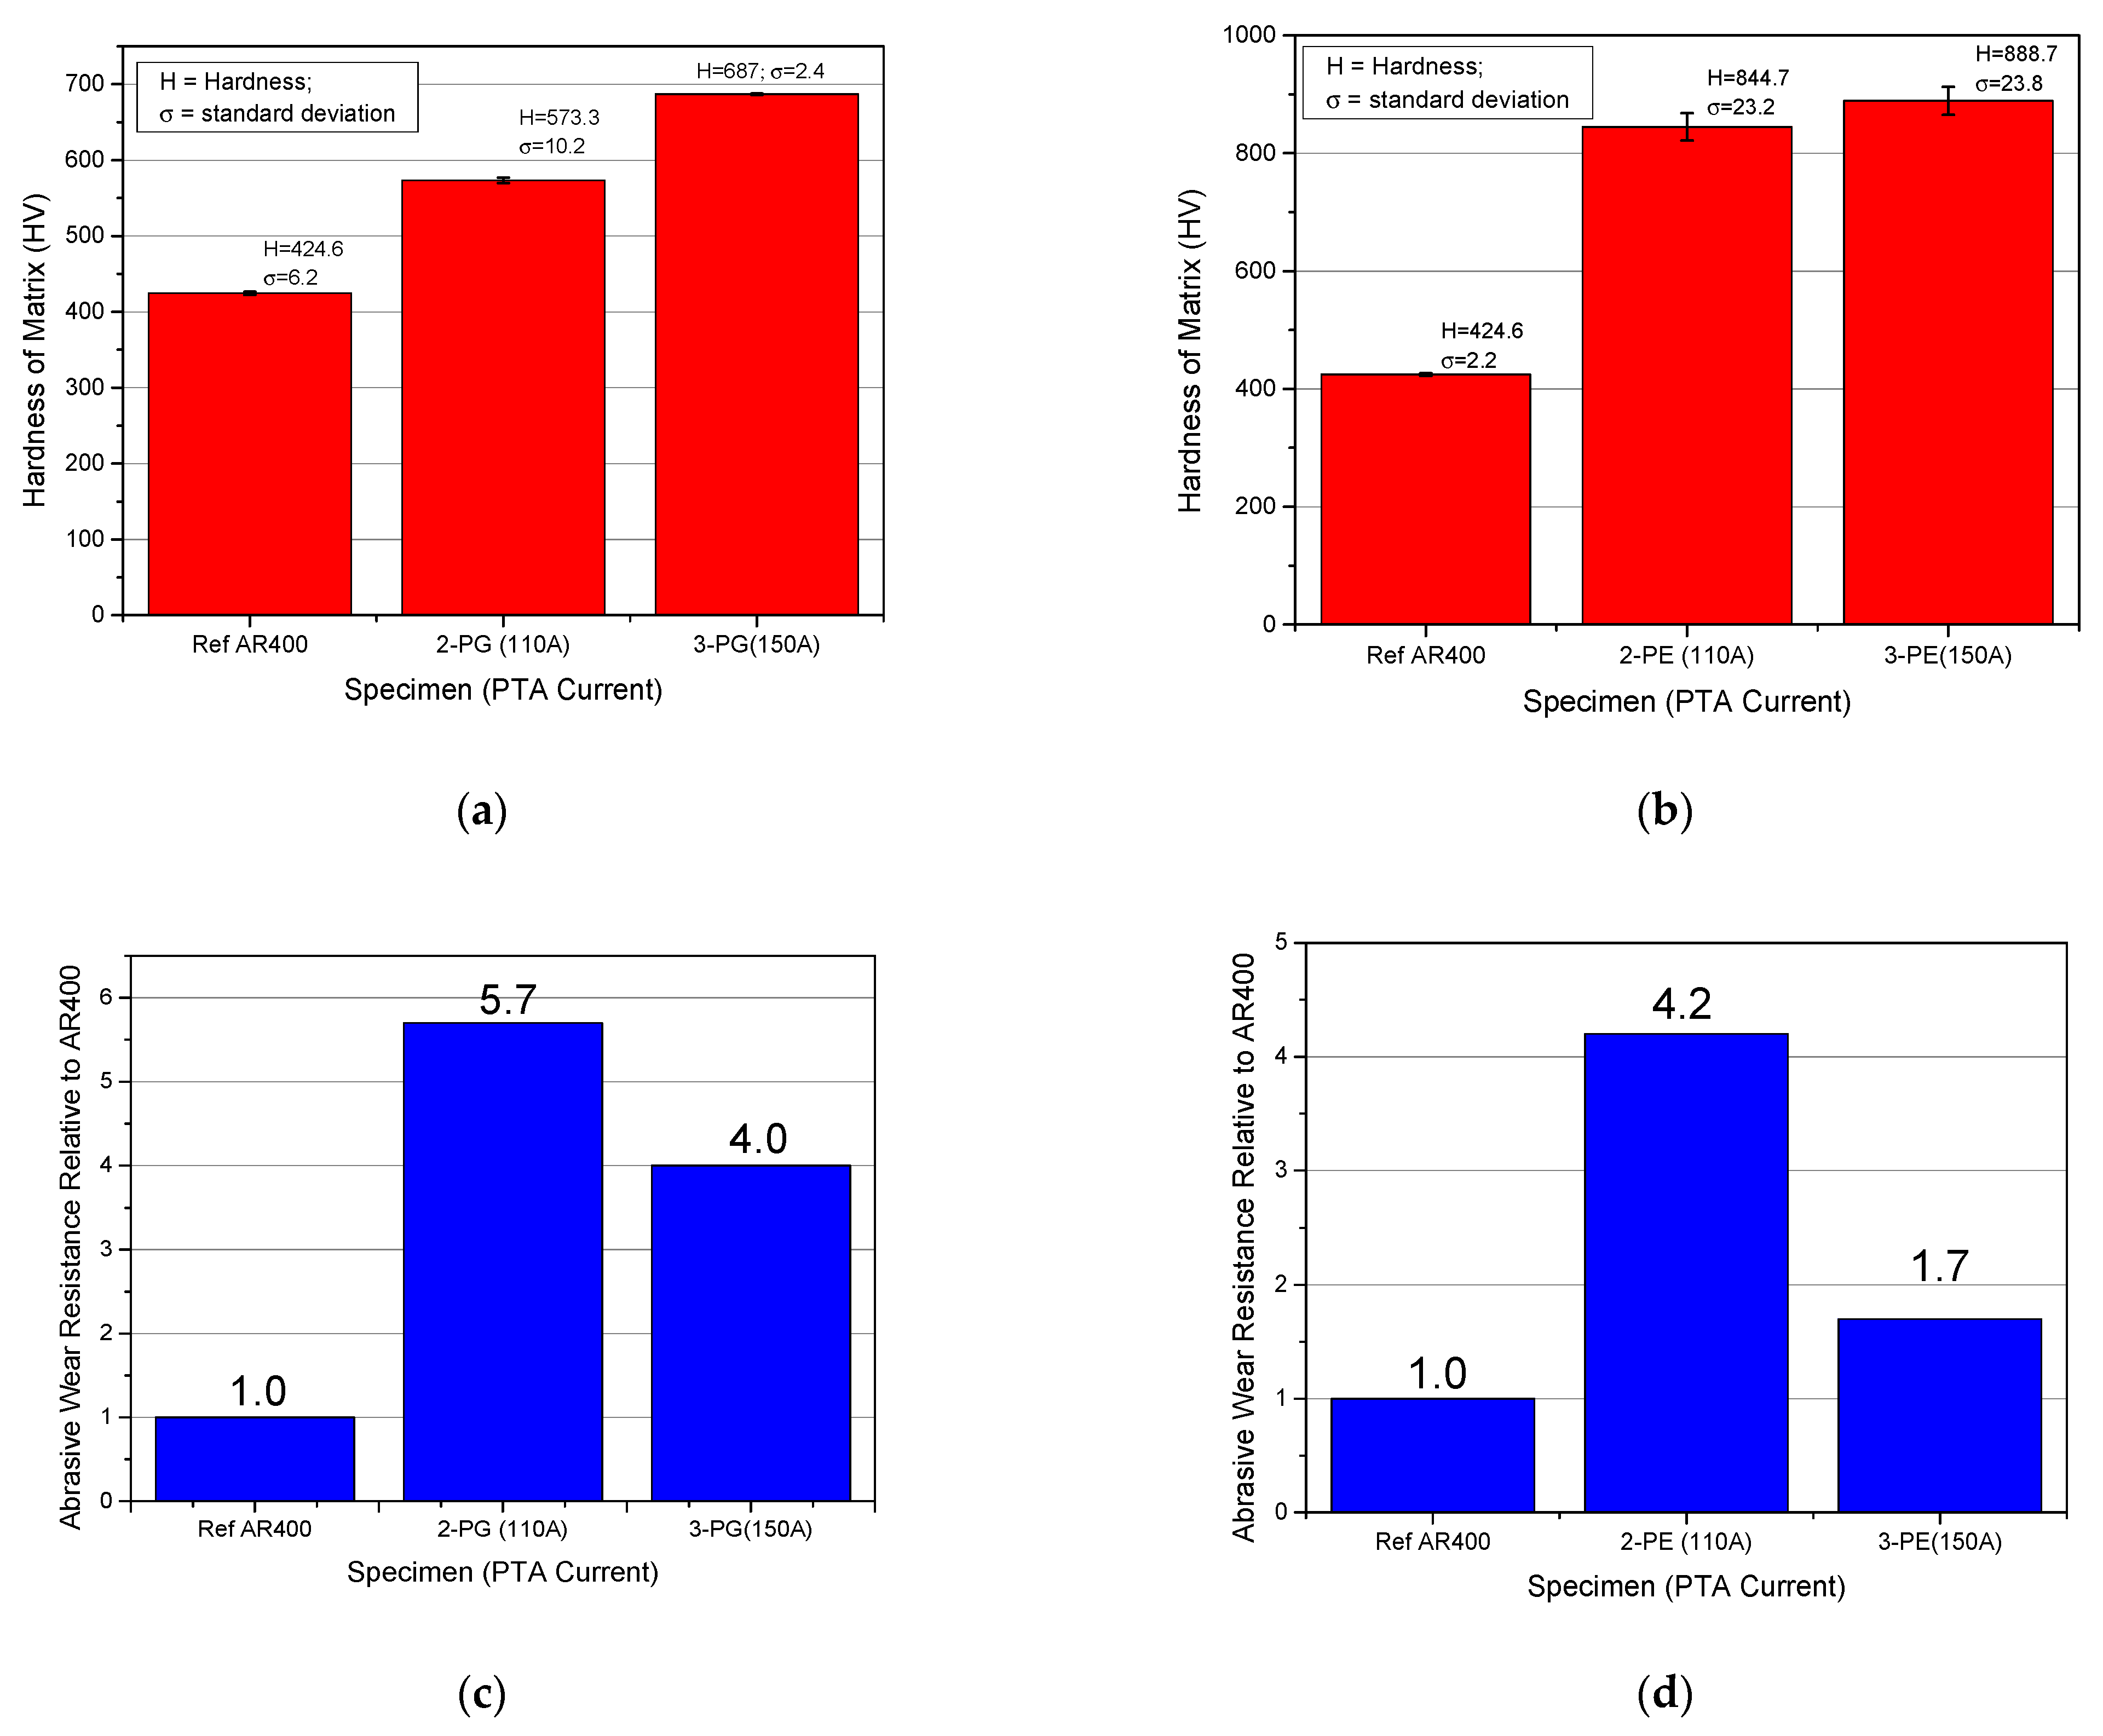
Figure 15.
Comparative plots on the effects of PTA current on hardness and abrasive wear performance of surface coating (a,b) effects of PTA current on hardness of matrix of samples prepared with PG and PE powder MMCs respectively (c,d) effects of PTA current on the abrasive wear resistance of samples prepared with PG and PE powder MMCs respectively.
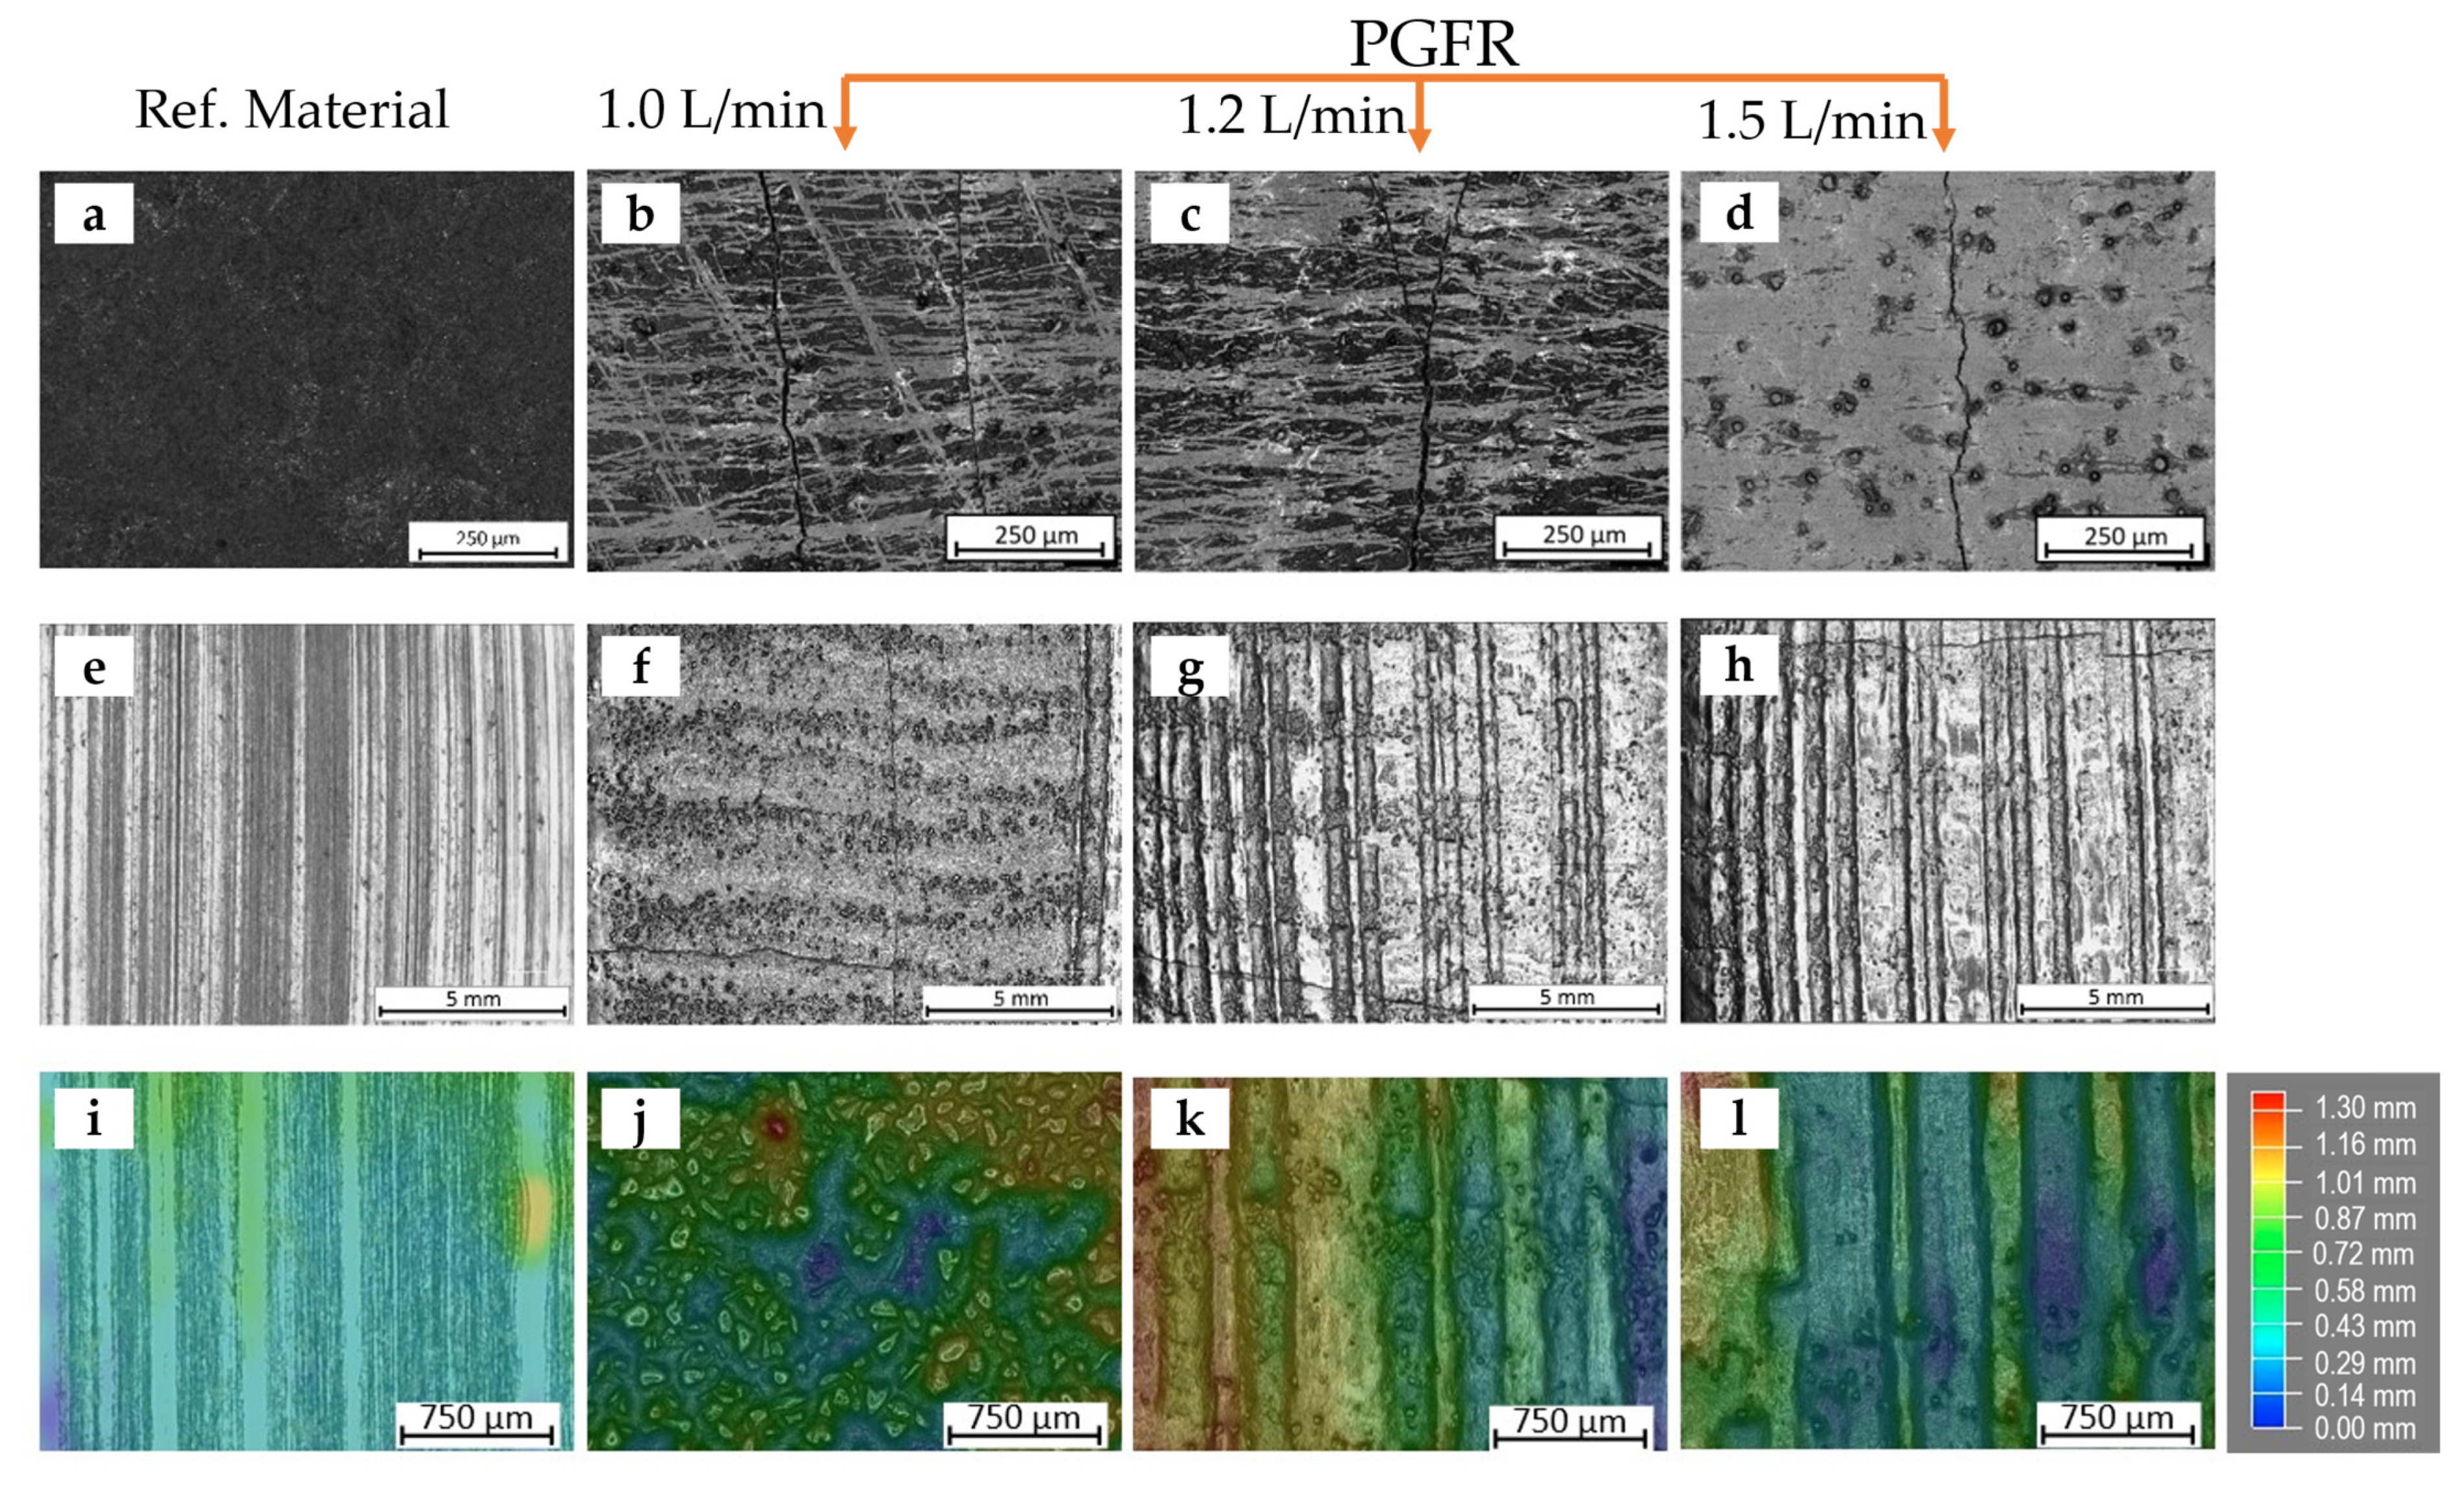
Figure 16.
Images of the surfaces of specimens before and after abrasive wear test (a,e,i), reference material AR400 steel before abrasive wear test, after abrasive wear test and wear depth after abrasive wear, respectively (b,f,j) specimen 1-PE with PGFR of 1.0 L/min and PTA current of 110 A before abrasive wear test, after abrasive wear test and wear depth after abrasive wear, respectively (c,g,k) specimen 2-PE with PGFR of 1.2 L/min and PTA current of 110 A before abrasive wear test, after abrasive wear test and wear depth after abrasive wear, respectively (d,h,l) specimen 4-PE with PGFR of 1.5 L/min and PTA current of 110 A before abrasive wear test, after abrasive wear test and wear depth after abrasive wear, respectively.
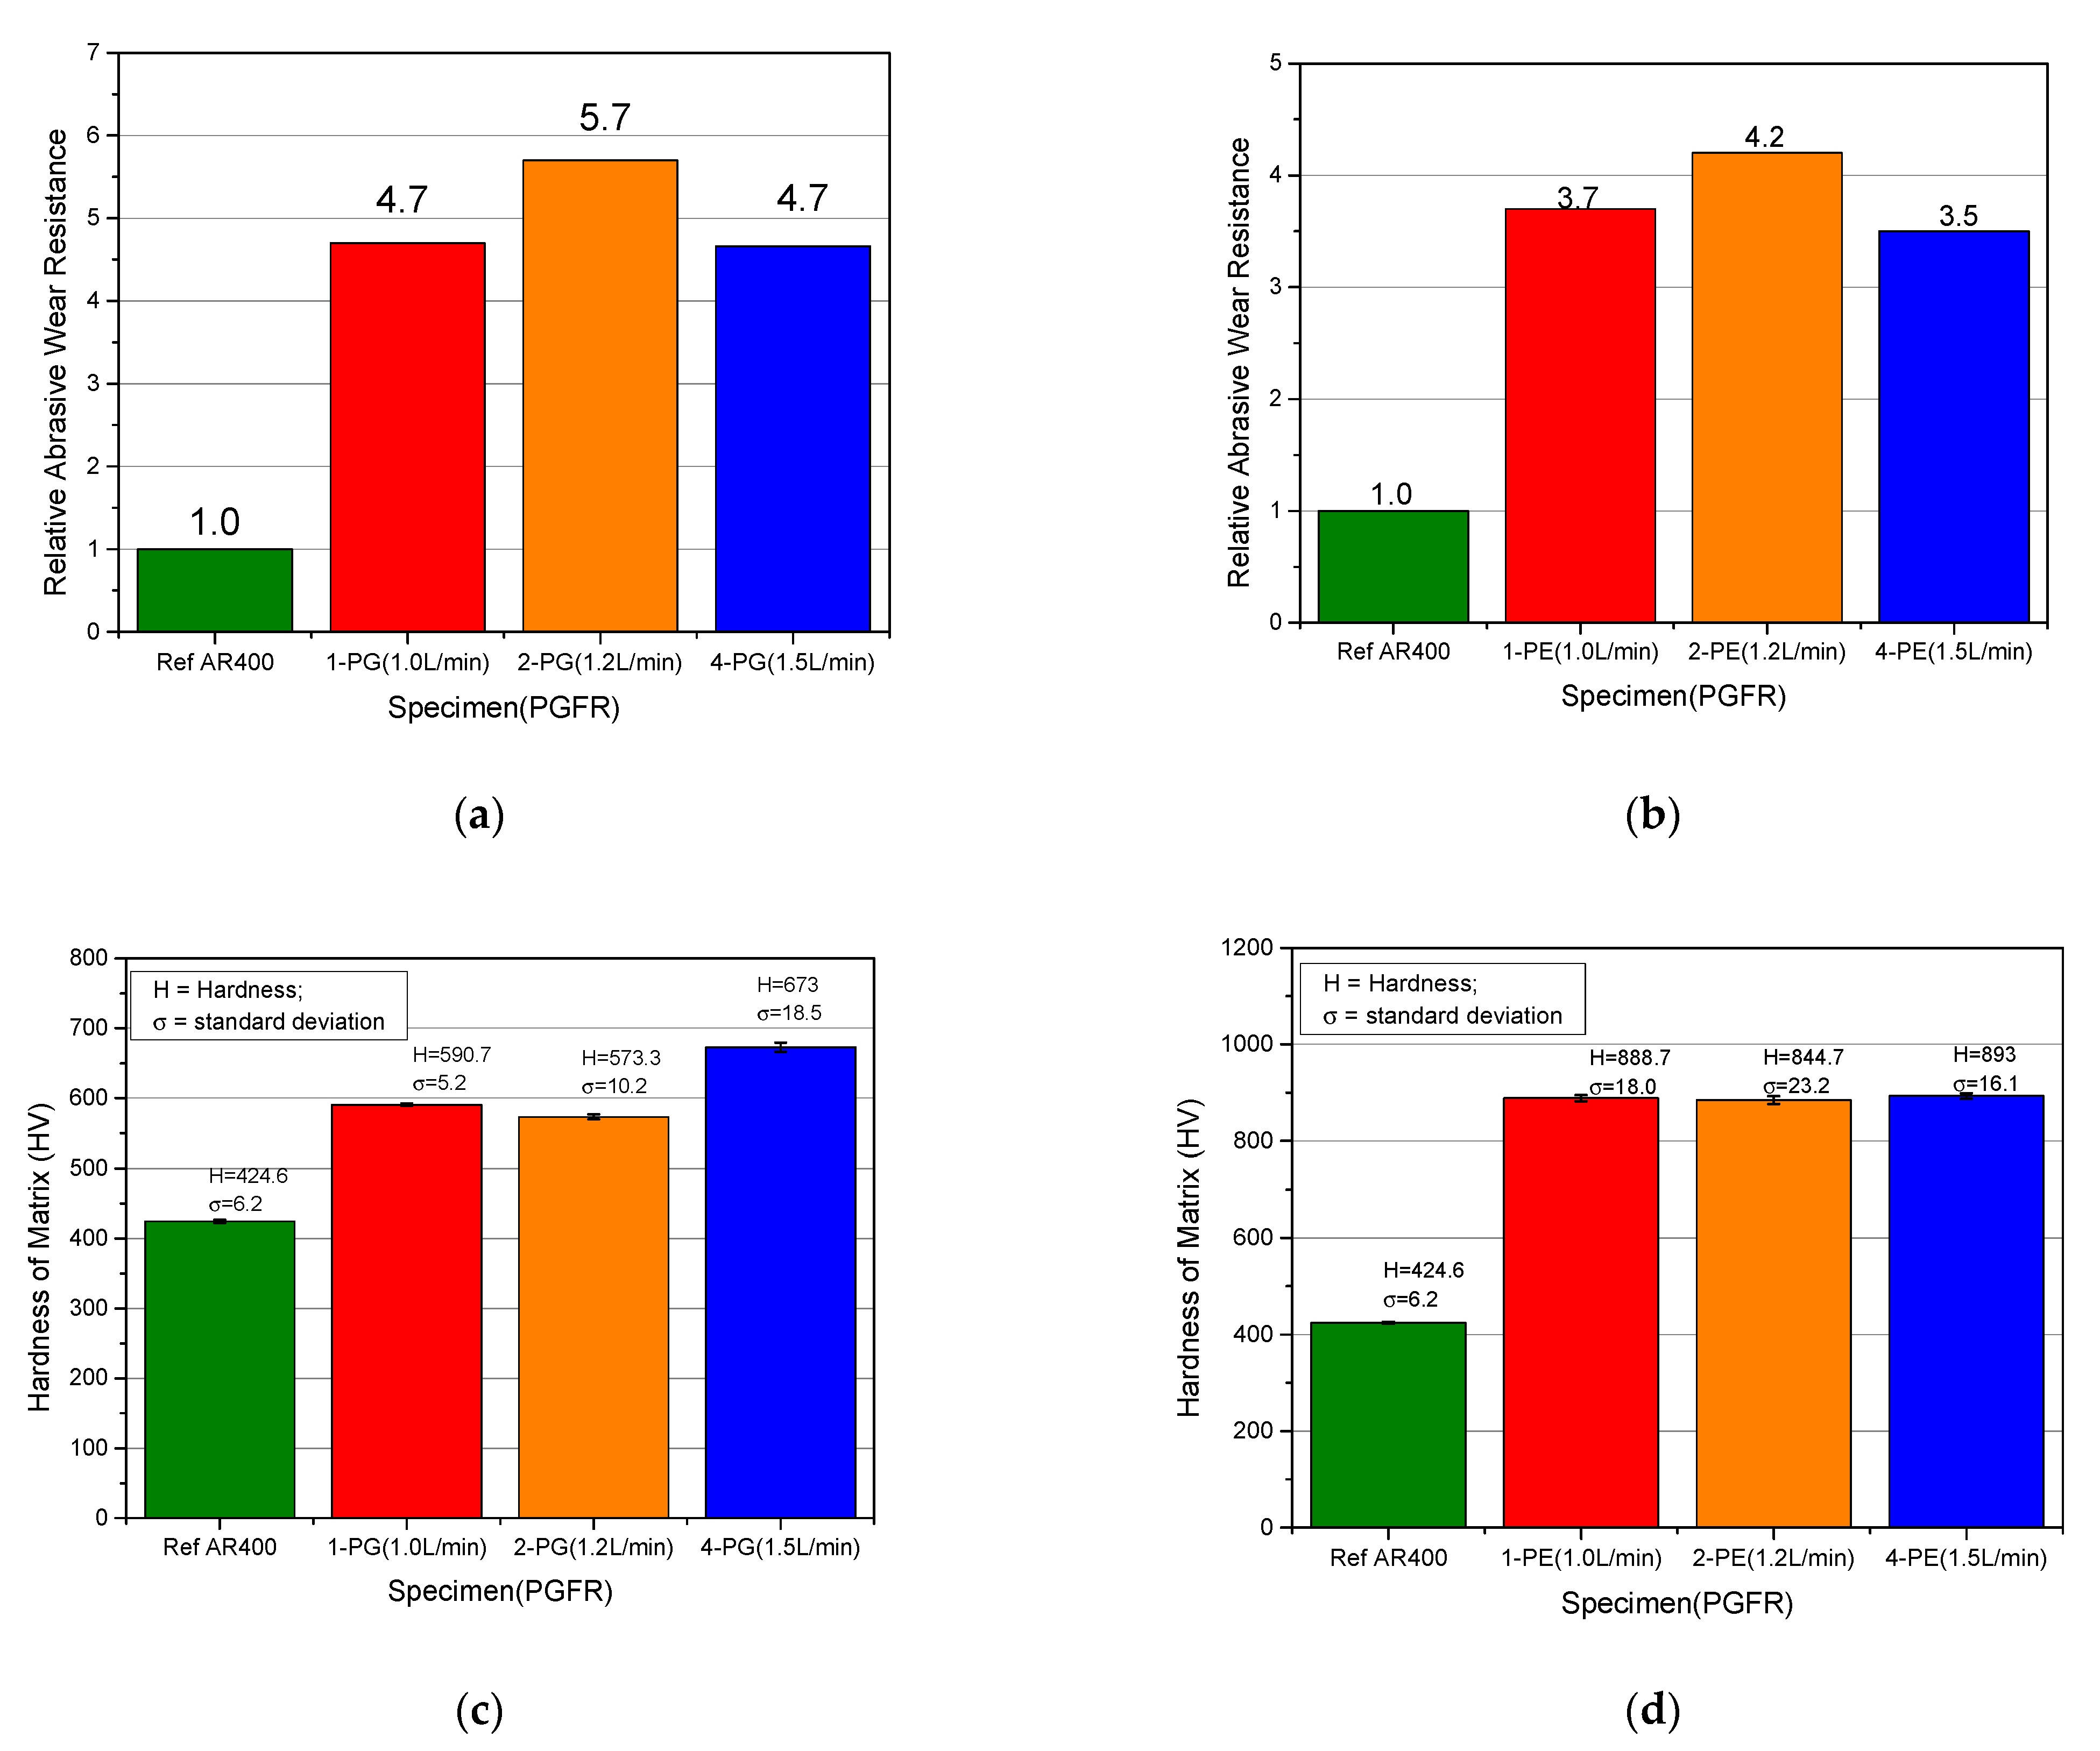
Figure 17.
Comparative plots on the effects of PGFR on abrasive wear performance and hardness of surface coatings (a,b) effects of PGFR on the abrasive wear resistance of samples prepared with PG and PE powder MMCs, respectively (c,d) effects of PGFR on hardness of matrix of samples prepared with PG and PE powder MMCs, respectively.
Table 2.
PPTAW process parameter variation for specimen preparation, Travel Speed, V = 1.3 mm/s.
Table 2.
PPTAW process parameter variation for specimen preparation, Travel Speed, V = 1.3 mm/s.
| Specimen | MMC Powder | Plasma Arc Current (A) | Plasma Gas Flow Rate (L/min) |
|---|
| 1-PG | PG * | 110 | 1.0 |
| 2-PG | PG | 110 | 1.2 |
| 3-PG | PG | 150 | 1.2 |
| 4-PG | PG | 110 | 1.5 |
| 1-PE | PE ** | 110 | 1.0 |
| 2-PE | PE | 110 | 1.2 |
| 3-PE | PE | 150 | 1.2 |
| 4-PE | PE | 110 | 1.5 |
Table 3.
Abrasive wear resistance testing conditions.
Table 3.
Abrasive wear resistance testing conditions.
| Parameter | Value | Unit |
|---|
| Abrasive particle grain size | 210–297 | µm |
| Feed rate | 335 | g/min |
| Pressure | 130 | Pa |
| Rubber wheel turns | 6000 | turns |
| Test time | 30 | min |
Table 4.
Chemical composition in weight % and atom % of measured points of PG powder under analysis.
Table 4.
Chemical composition in weight % and atom % of measured points of PG powder under analysis.
| | | C | O | Si | Fe | Ni | W |
|---|
| Measured point 1 | Weight % | 3.9 | 0.9 | - | - | - | 95.2 |
| Atom % | 36.2 | 6.4 | - | - | - | 57.5 |
| Measured point 2 | Weight % | 1.5 | - | 2.4 | 0.7 | 95.4 | - |
| Atom % | 6.9 | - | 4.7 | 0.6 | 87.8 | - |
Table 5.
Chemical composition in weight % and atom % of measured points of PE powder under analysis.
Table 5.
Chemical composition in weight % and atom % of measured points of PE powder under analysis.
| | | C | O | Si | Cr | Fe | Ni | W |
|---|
| Measured point 1 | Weight % | 0.7 | - | 3.5 | 15.3 | 3.5 | 76.9 | - |
| Atom % | 3.9 | - | 6.7 | 15.8 | 3.4 | 70.3 | - |
| Measured point 2 | Weight % | 3.8 | 3.7 | - | 0.5 | - | - | 92.0 |
| Atom % | 29.8 | 22.0 | - | 0.9 | - | - | 47.3 |
Table 6.
Chemical composition in Weight % and Atom % of measured points of precipitation subjected to microanalysis of sample 4-PE prepared under condition of 110 A PTA current and 1.5 L/min PGFR.
Table 6.
Chemical composition in Weight % and Atom % of measured points of precipitation subjected to microanalysis of sample 4-PE prepared under condition of 110 A PTA current and 1.5 L/min PGFR.
| | | C | Si | Fe | Ni | W |
|---|
| Measured Point 1 | Weight % | 3.0 | 5.0 | 3.6 | 10.0 | 78.4 |
| Atom % | 22.6 | 16.5 | 6.0 | 15.7 | 39.2 |
| Measured Point 2 | Weight % | 3.1 | 3.9 | 2.8 | 11.0 | 79.3 |
| Atom % | 24.2 | 13.0 | 4.7 | 17.6 | 40.6 |
| Measured Point 3 | Weight % | 2.6 | 5.1 | 4.8 | 12.4 | 75.1 |
| Atom % | 19.4 | 16.5 | 7.9 | 19.2 | 37.1 |
Table 7.
Measured microhardness of the matrix and reinforcing carbides through the cross-section of the deposited surface layers for each MMC powder used, compared to the microhardness of abrasive wear-resistant steel, AR400.
Table 7.
Measured microhardness of the matrix and reinforcing carbides through the cross-section of the deposited surface layers for each MMC powder used, compared to the microhardness of abrasive wear-resistant steel, AR400.
| Specimen | Microhardness of Matrix (HV1) | Microhardness of Reinforcement (HV1) |
|---|
| | Mean | Standard Deviation | Mean | Standard Deviation |
| 1-PG | 590.7 | 5.2 | 2413.0 | 62.9 |
| 2-PG | 573.3 | 10.2 | 2128.7 | 33.3 |
| 3-PG | 687.0 | 2.4 | 2162.7 | 76.1 |
| 4-PG | 673.0 | 18.5 | 2275.0 | 49.5 |
| 1-PE | 888.7 | 18.0 | 2349.3 | 38.7 |
| 2-PE | 844.7 | 23.2 | 2436.3 | 24.1 |
| 3-PE | 888.7 | 23.8 | 2343.3 | 61.6 |
| 4-PE | 893.0 | 16.1 | 2391.3 | 80.5 |
| Reference Material |
| AR400 | 424.6 | 6.2 | - | - |
Table 8.
Measured Rockwell hardness on the surface of the surface layers for samples prepared by each MMC powder.
Table 8.
Measured Rockwell hardness on the surface of the surface layers for samples prepared by each MMC powder.
| Specimen | Surface Hardness |
|---|
| | Mean, HV1 | Mean, HRC | Standard Deviation |
| 1-PG | 462 | 46.3 | 0.5 |
| 2-PG | 475 | 47.3 | 2.6 |
| 3-PG | 480 | 47.7 | 2.5 |
| 4-PG | 488 | 48.3 | 1.2 |
| 1-PE | 660 | 58.3 | 3.7 |
| 2-PE | 556 | 52.7 | 3.3 |
| 3-PE | 602 | 55.3 | 2.9 |
| 4-PE | 610 | 55.7 | 1.2 |
Table 9.
Abrasive wear resistance tests results.
Table 9.
Abrasive wear resistance tests results.
| Sample ID | Mass before Test, g | Mass after Test, g | Average Mass Loss, g | Material Density, g/cm3 | Average Volume Loss, mm3 | Relative Abrasive Wear Resistance * |
|---|
| Surface layers prepared with PG powder, NiSiB+60%WC |
| 1-PG | 195.6418 | 195.3264 | 0.3154 | 11.1935 | 28.1771 | 4.7 |
| 2-PG | 209.0038 | 208.7471 | 0.2567 | 11.1935 | 22.9329 | 5.7 |
| 3-PG | 196.0594 | 195.6905 | 0.3689 | 11.1935 | 32.9566 | 4.0 |
| 4-PG | 227.8358 | 227.5179 | 0.3179 | 11.1935 | 28.4004 | 4.7 |
| Surface layers prepared with PE powder, NiCrSiB+45%WC |
| 1-PE | 226.4951 | 226.1412 | 0.3539 | 9.8274 | 36.0116 | 3.7 |
| 2-PE | 228.6697 | 228.3604 | 0.3093 | 9.8274 | 31.4732 | 4.2 |
| 3-PE | 231.6575 | 230.8754 | 0.7821 | 9.8274 | 79.5836 | 1.7 |
| 4-PE | 221.7090 | 221.3348 | 0.3742 | 9.8274 | 38.0772 | 3.5 |
| Reference Marterial AR400 steel |
H1
H2 | 104.6219
111.7377 | 103.4971
110.7989 | 1.0318 | 7.7836 | 132.5607 | 1.0 |
Table 10.
Optimum process parameters used for sample preparation, applicable to the two MMC powders used for this study.
Table 10.
Optimum process parameters used for sample preparation, applicable to the two MMC powders used for this study.
| Process Parameter | Value | Unit |
|---|
| Plasma arc current | 110 | A |
| Pilot arc current | 30 | A |
| Travel speed | 1.3 | mm/s |
| Plasma gas flow rate | 1.2 | L/min |
| Open circuit voltage | 95 | V DC |
| Power flow (Cos phi) | 0.99 | - |


