
Macroscopic and Mesoscopic Deterioration Behaviors of Concrete under the Coupling Effect of Chlorine Salt Erosion and Freezing–Thawing Cycle

Abstract
:1. Introduction
2. Test Materials and Methodology
2.1. Test Materials
2.2. Mixing Ratio
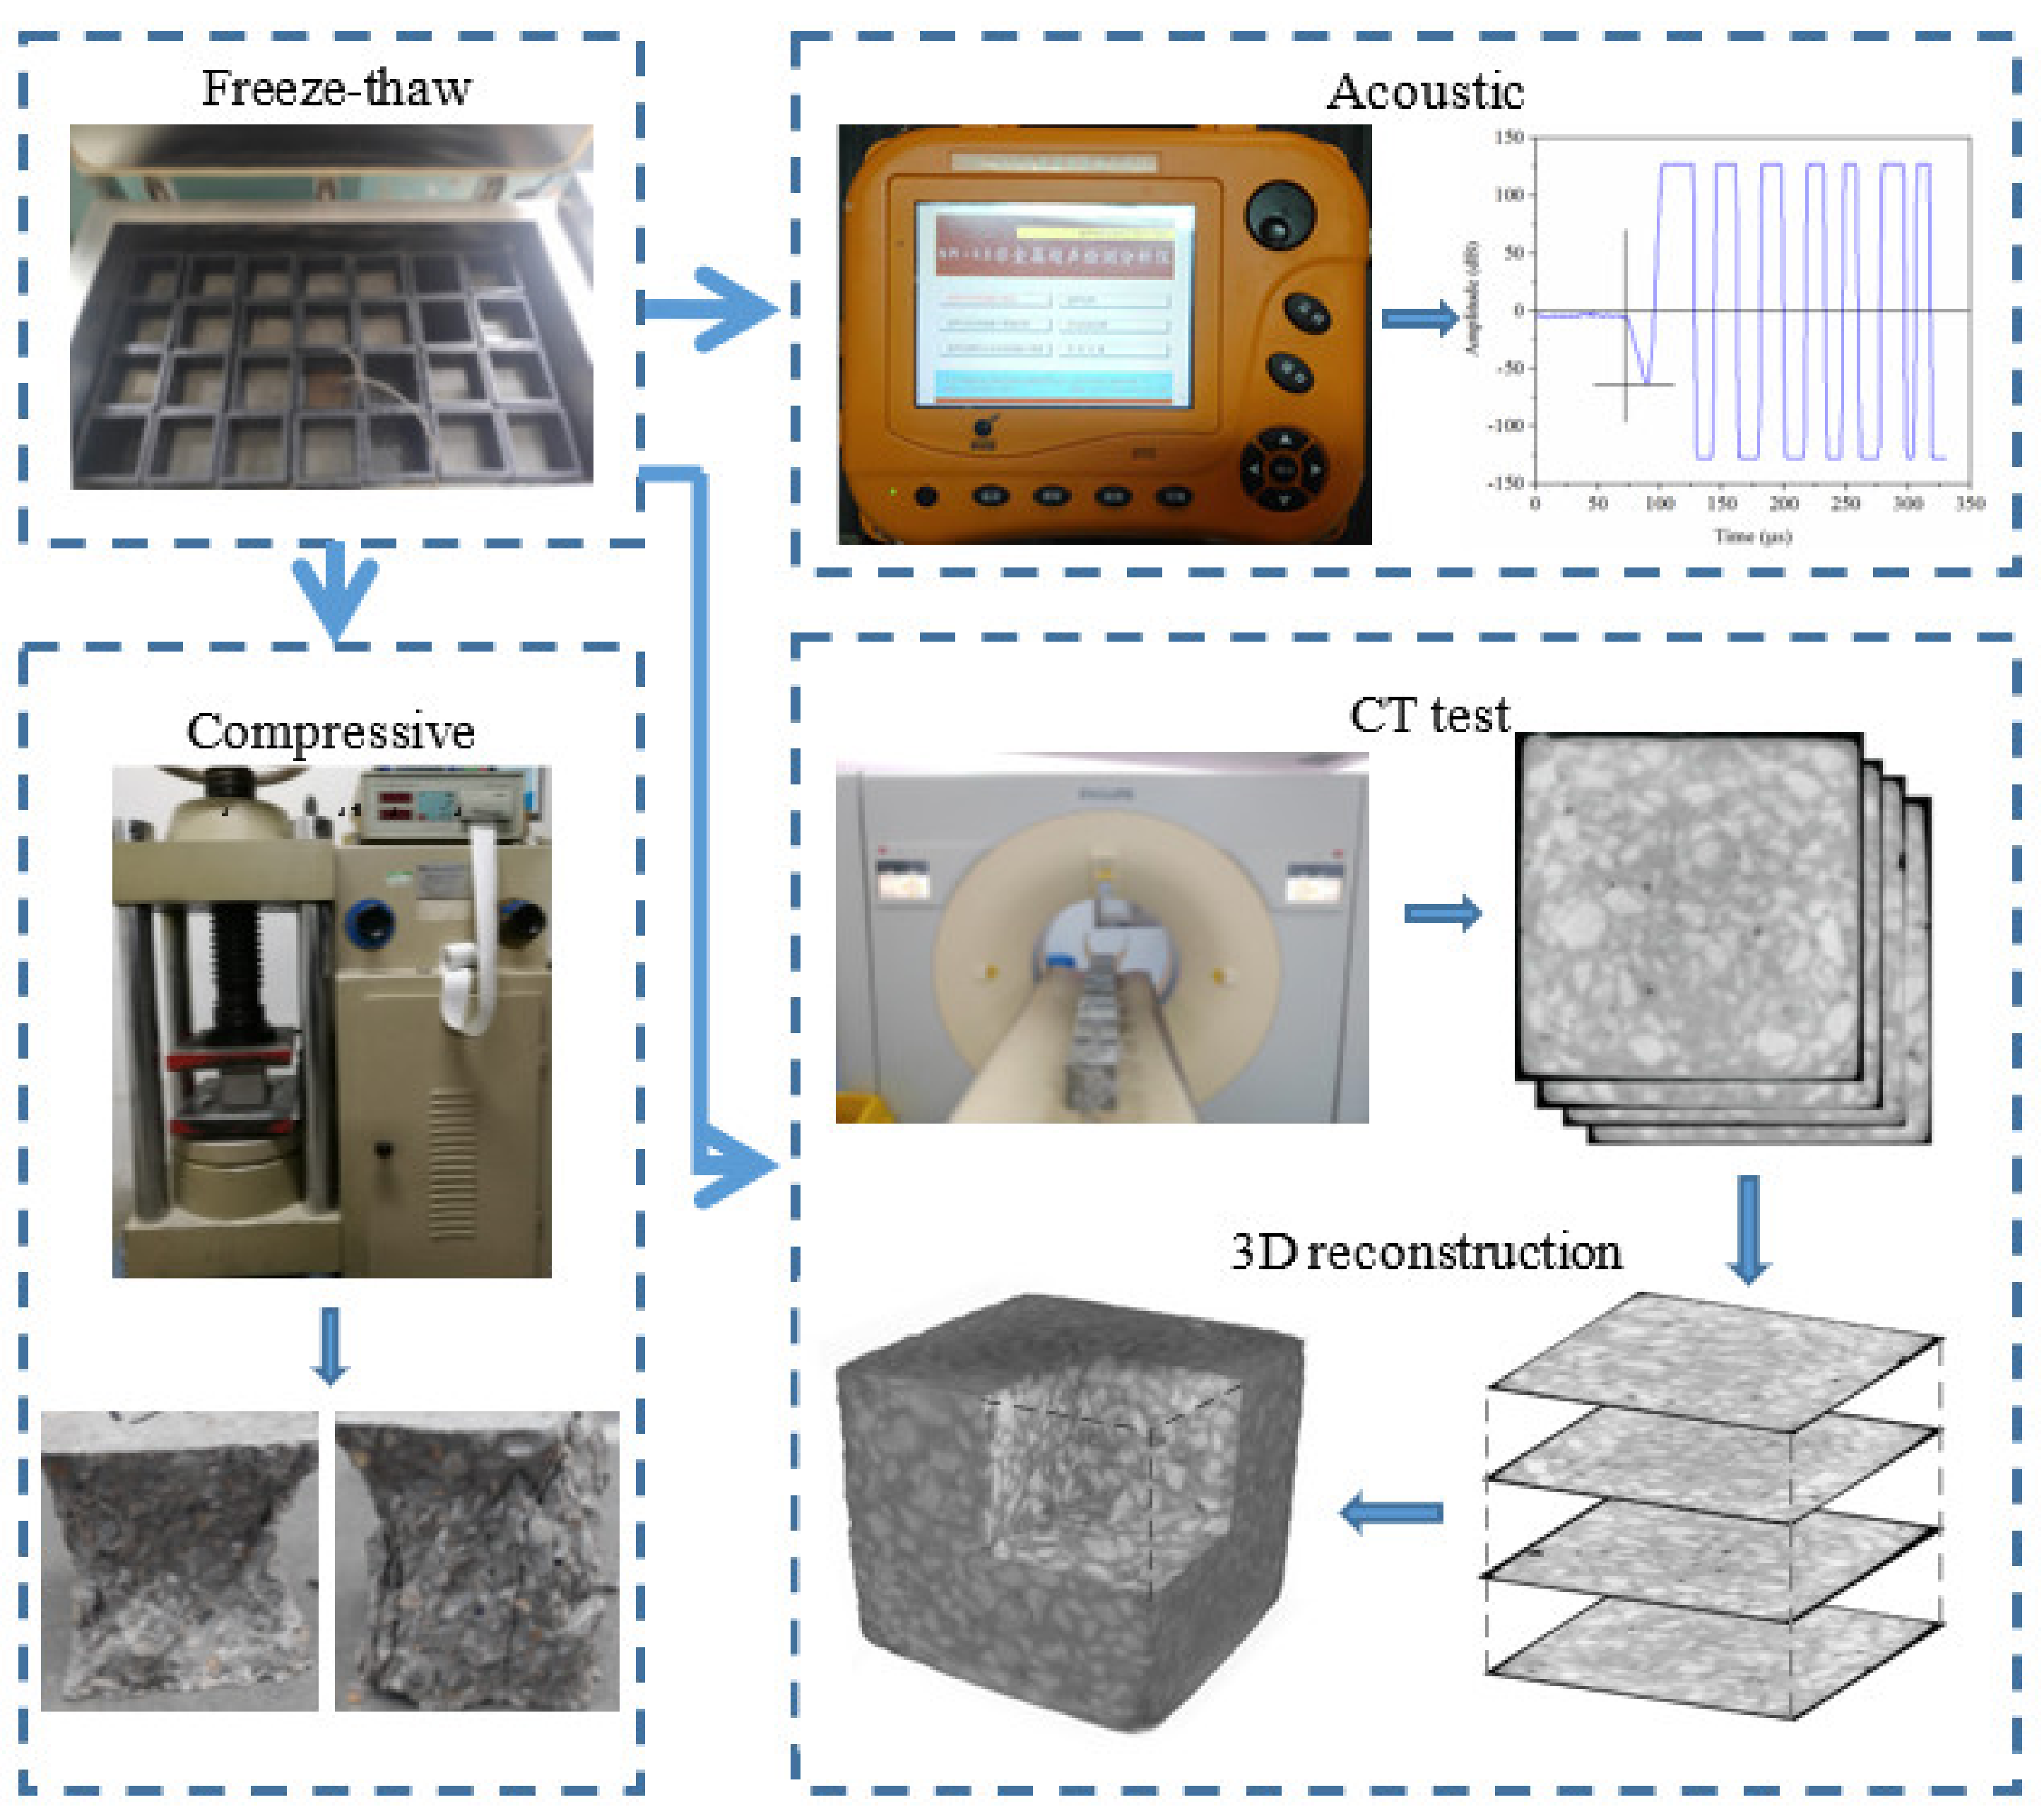
2.3. Methodology
3. Test Results and Analysis
3.1. Evolutionary Rules of the Macroscopic Characteristic of Concrete
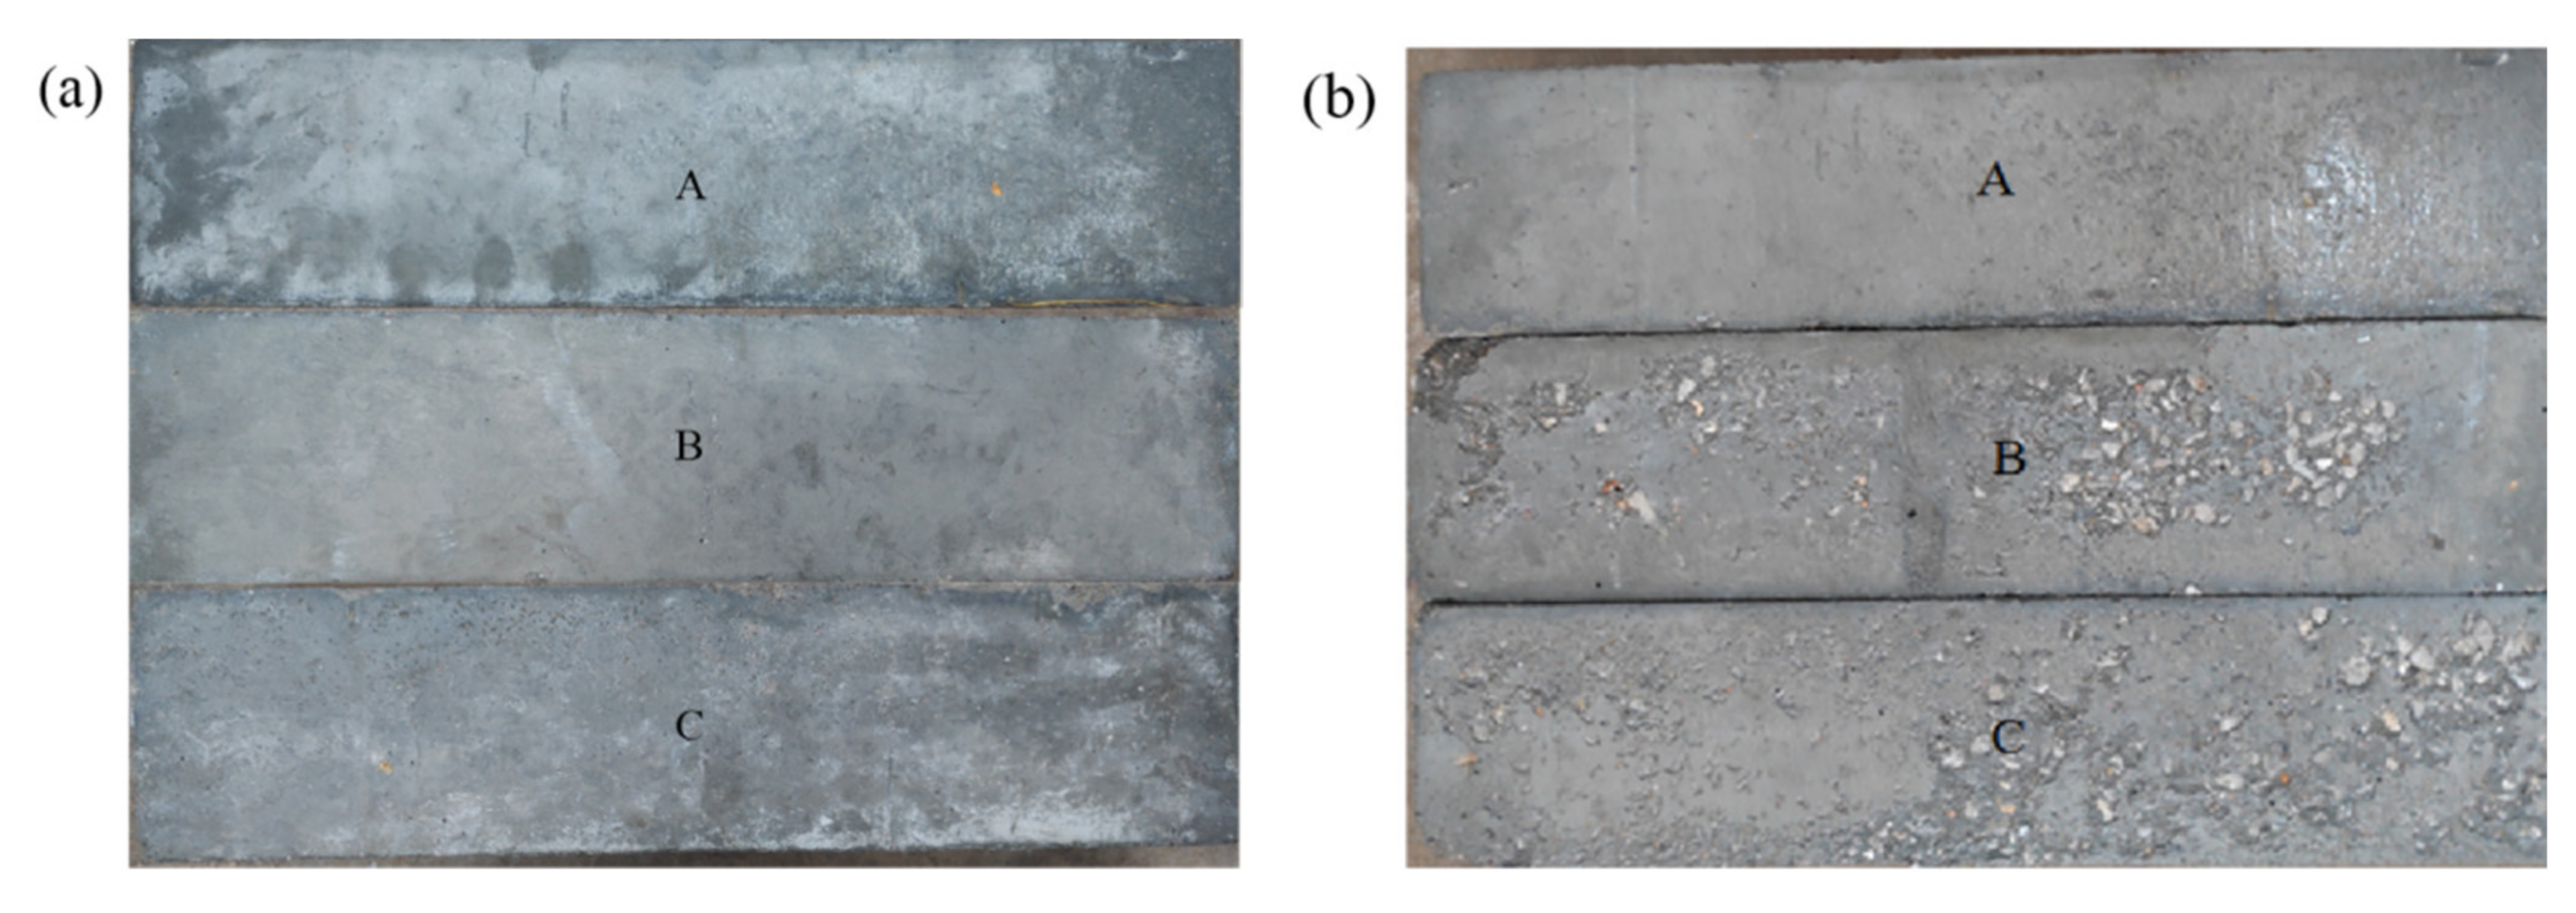
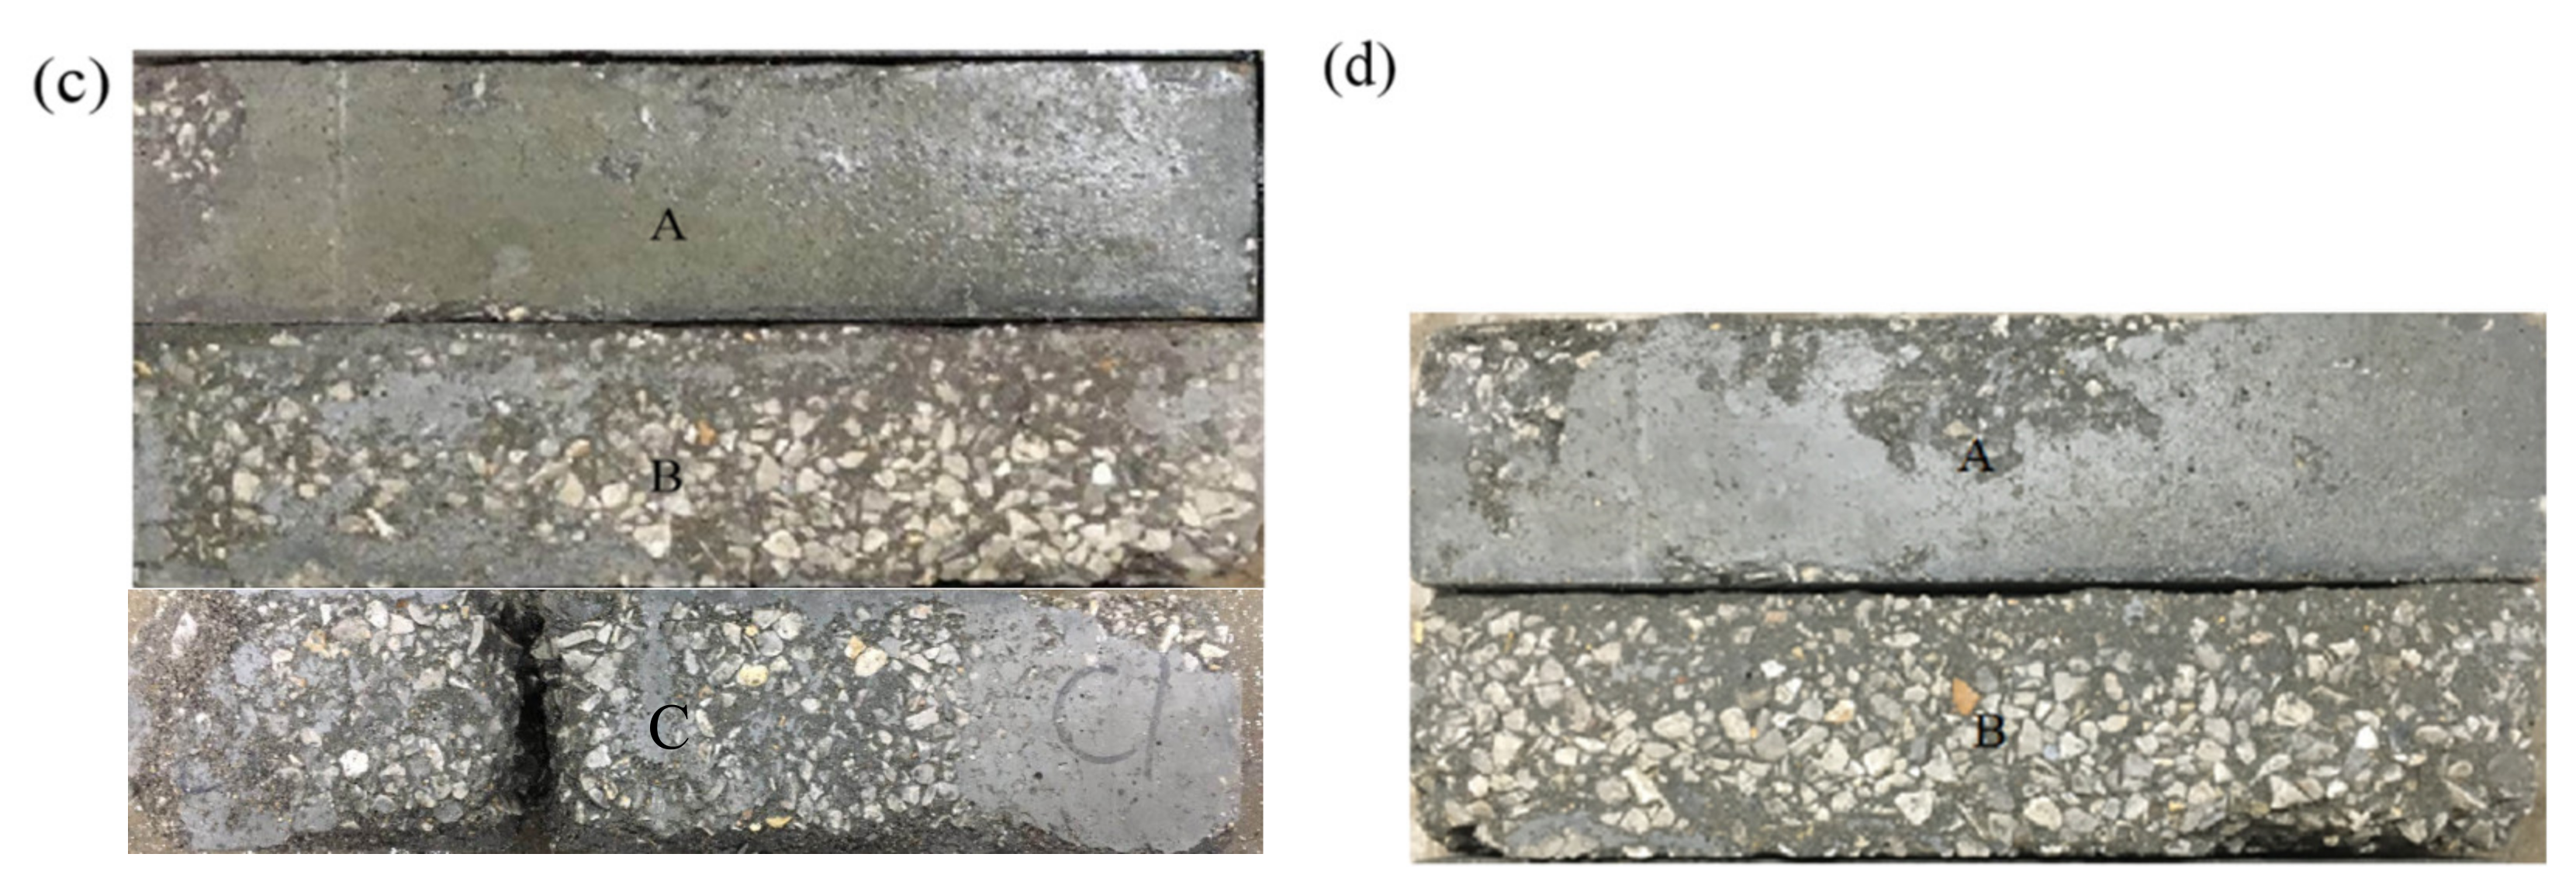
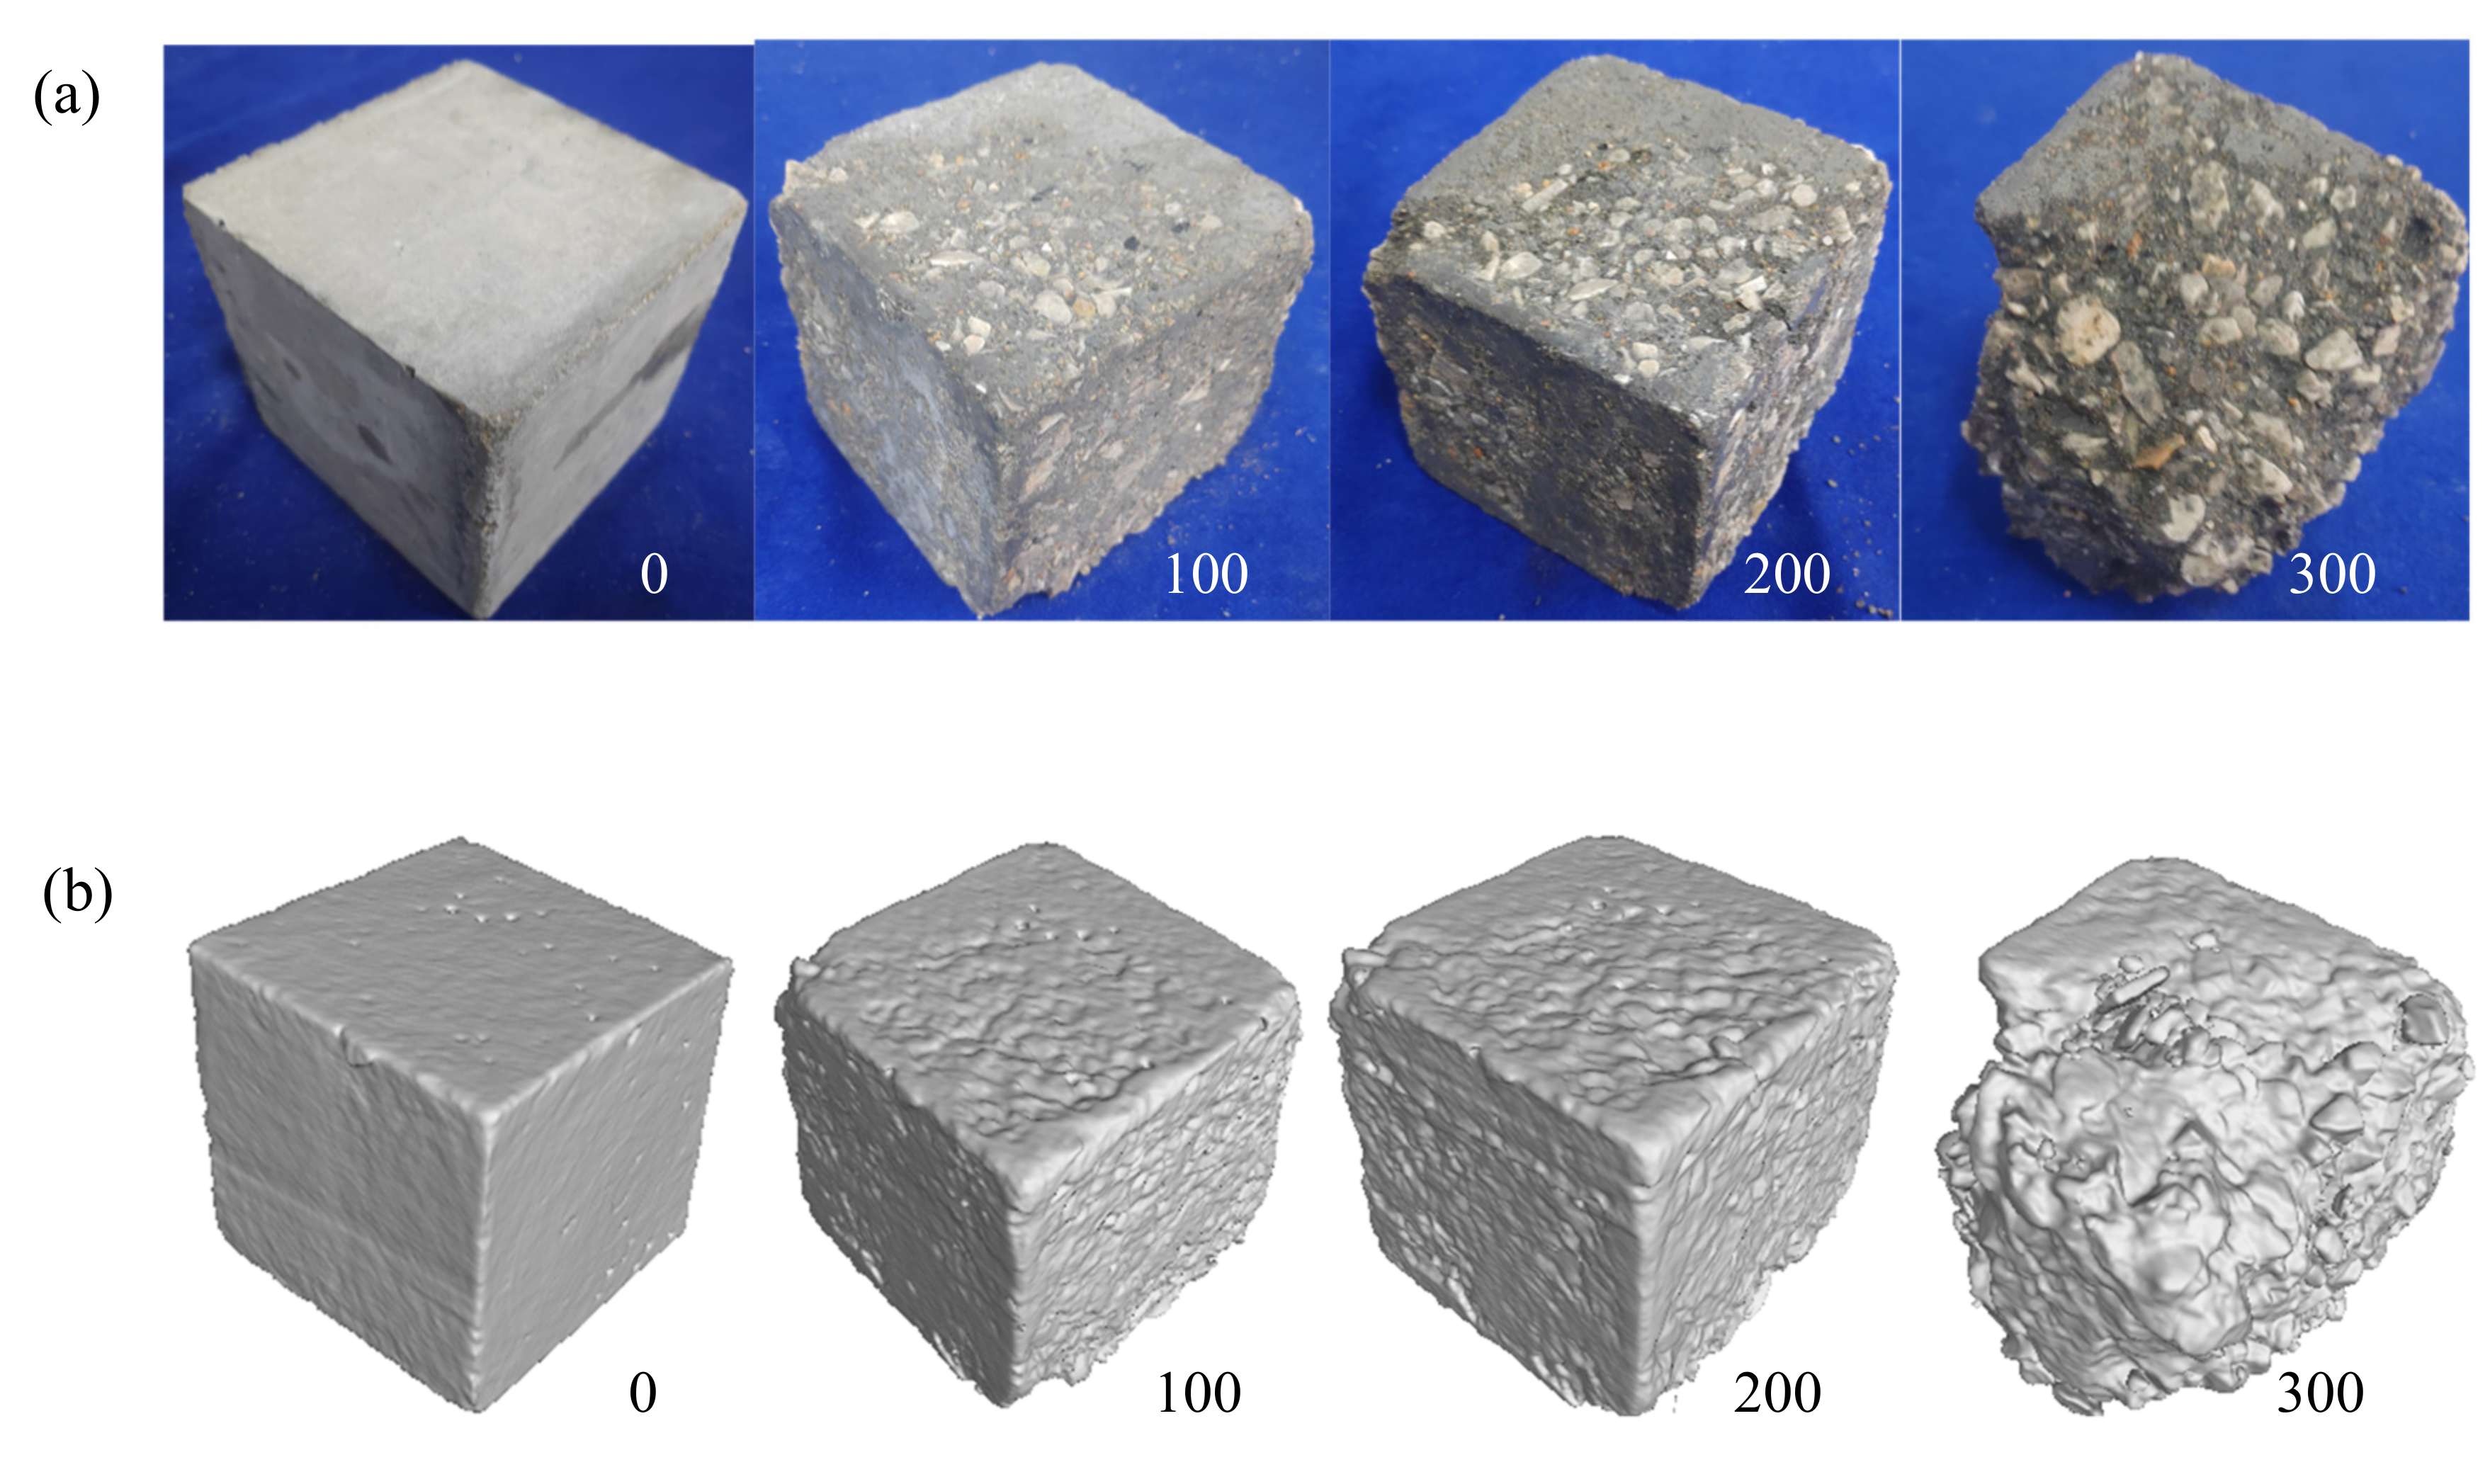
3.1.1. Morphology
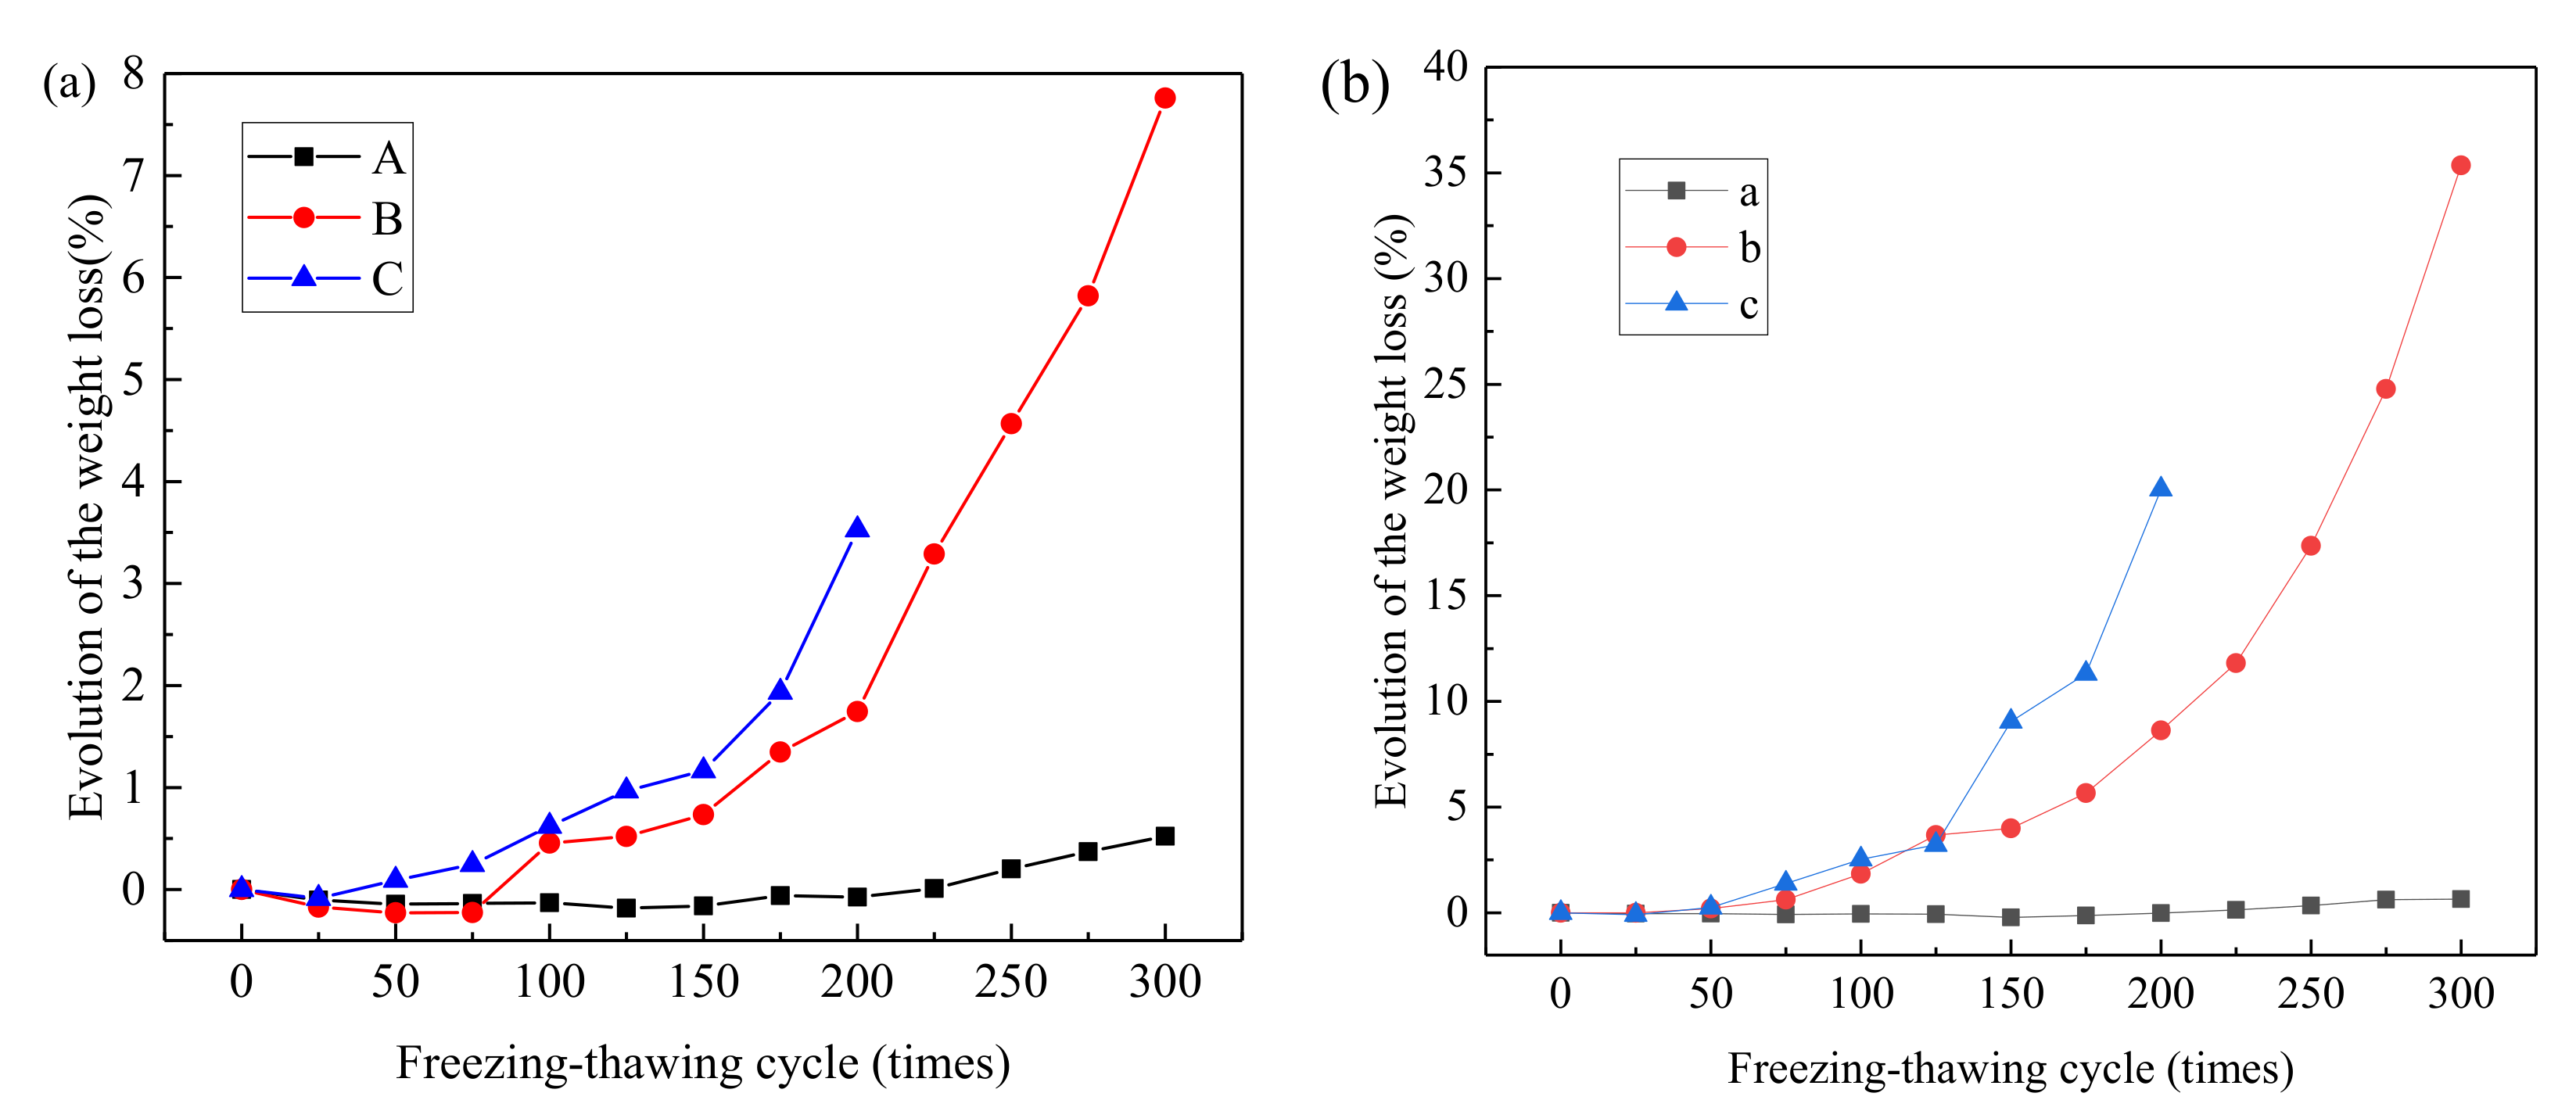
3.1.2. Mass Loss Rate
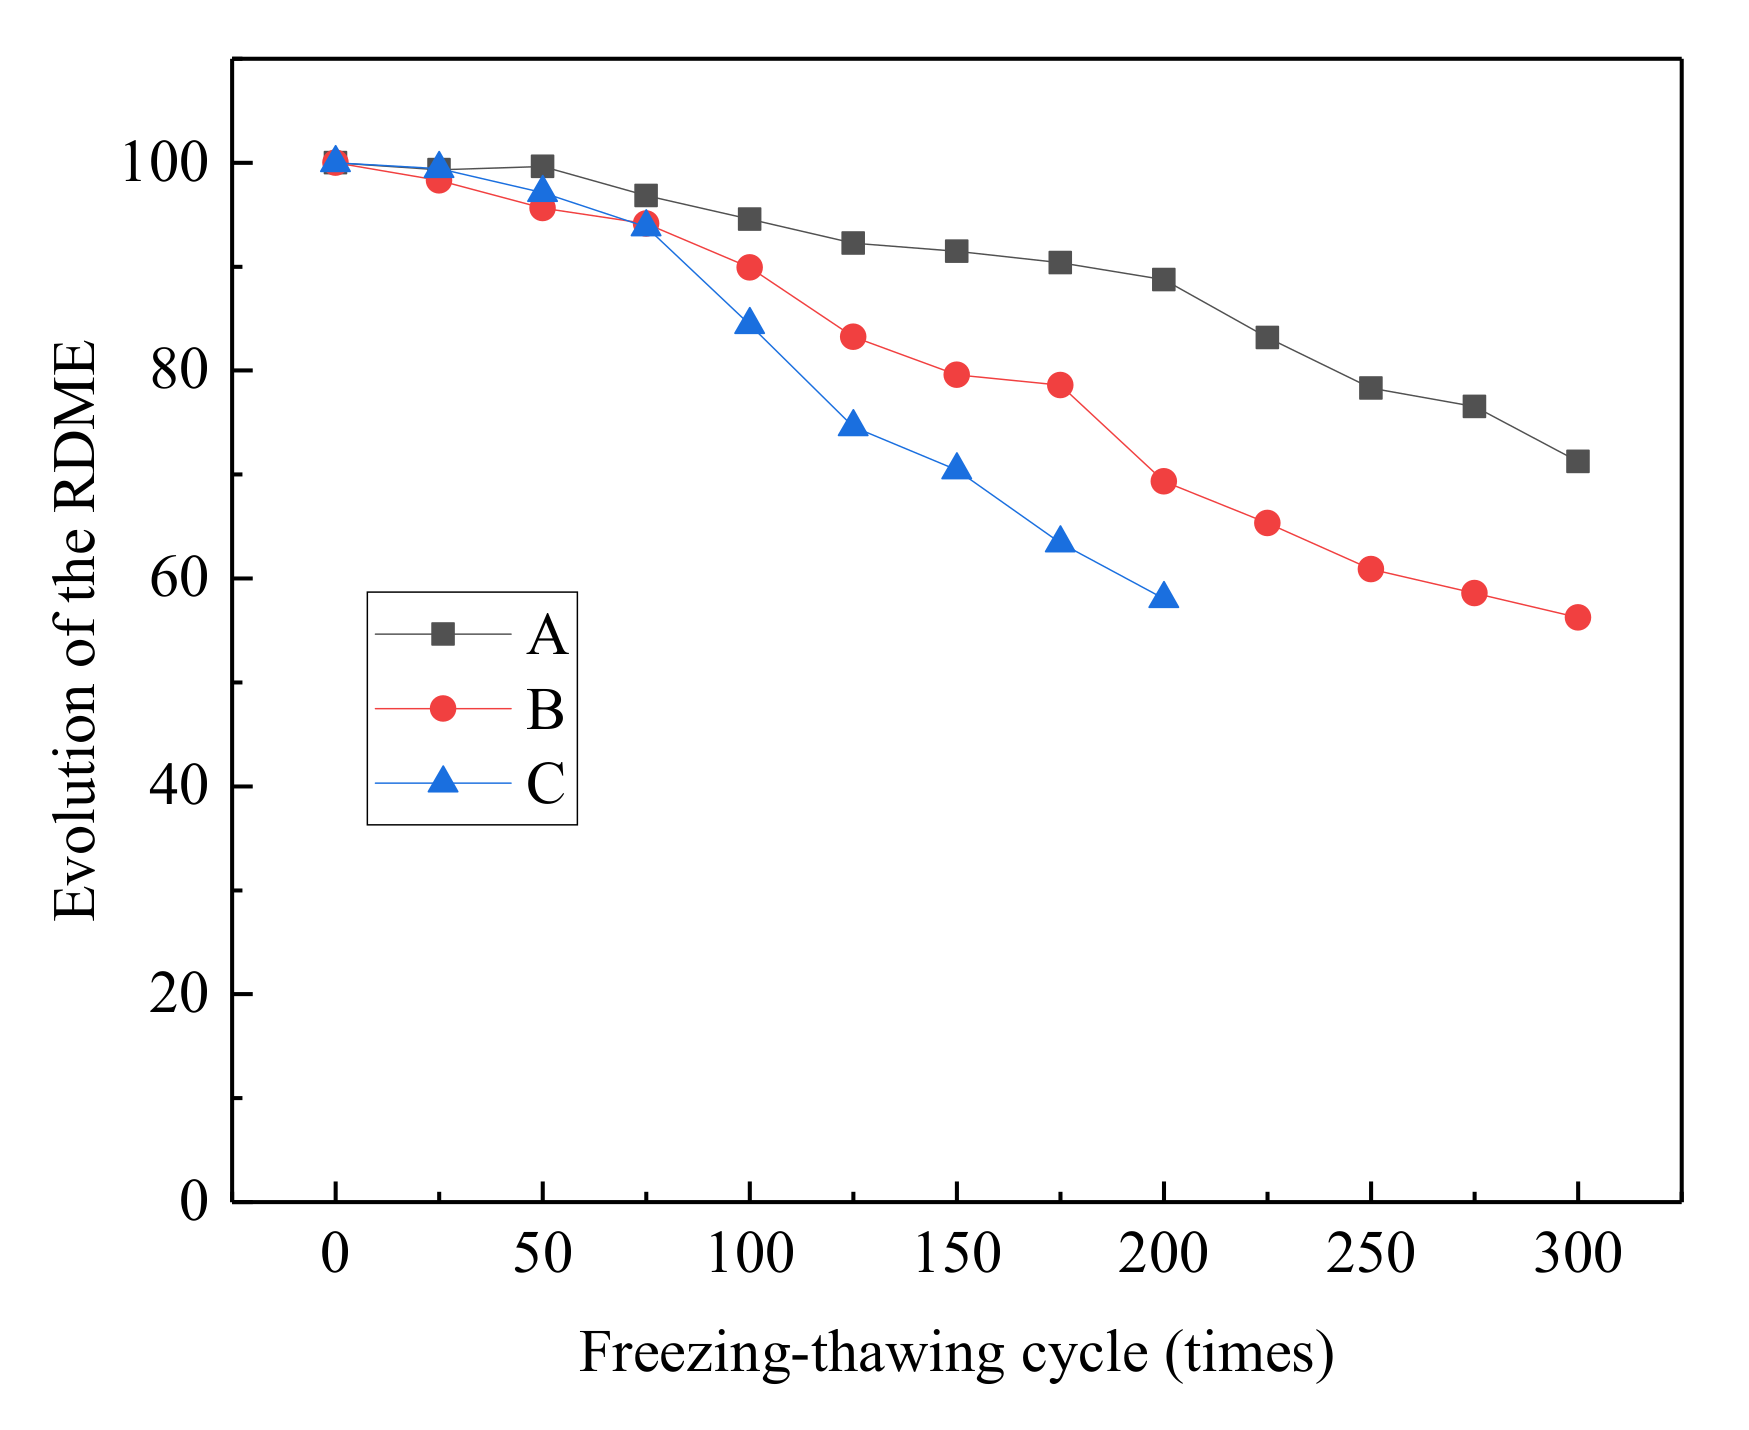
3.1.3. RDME
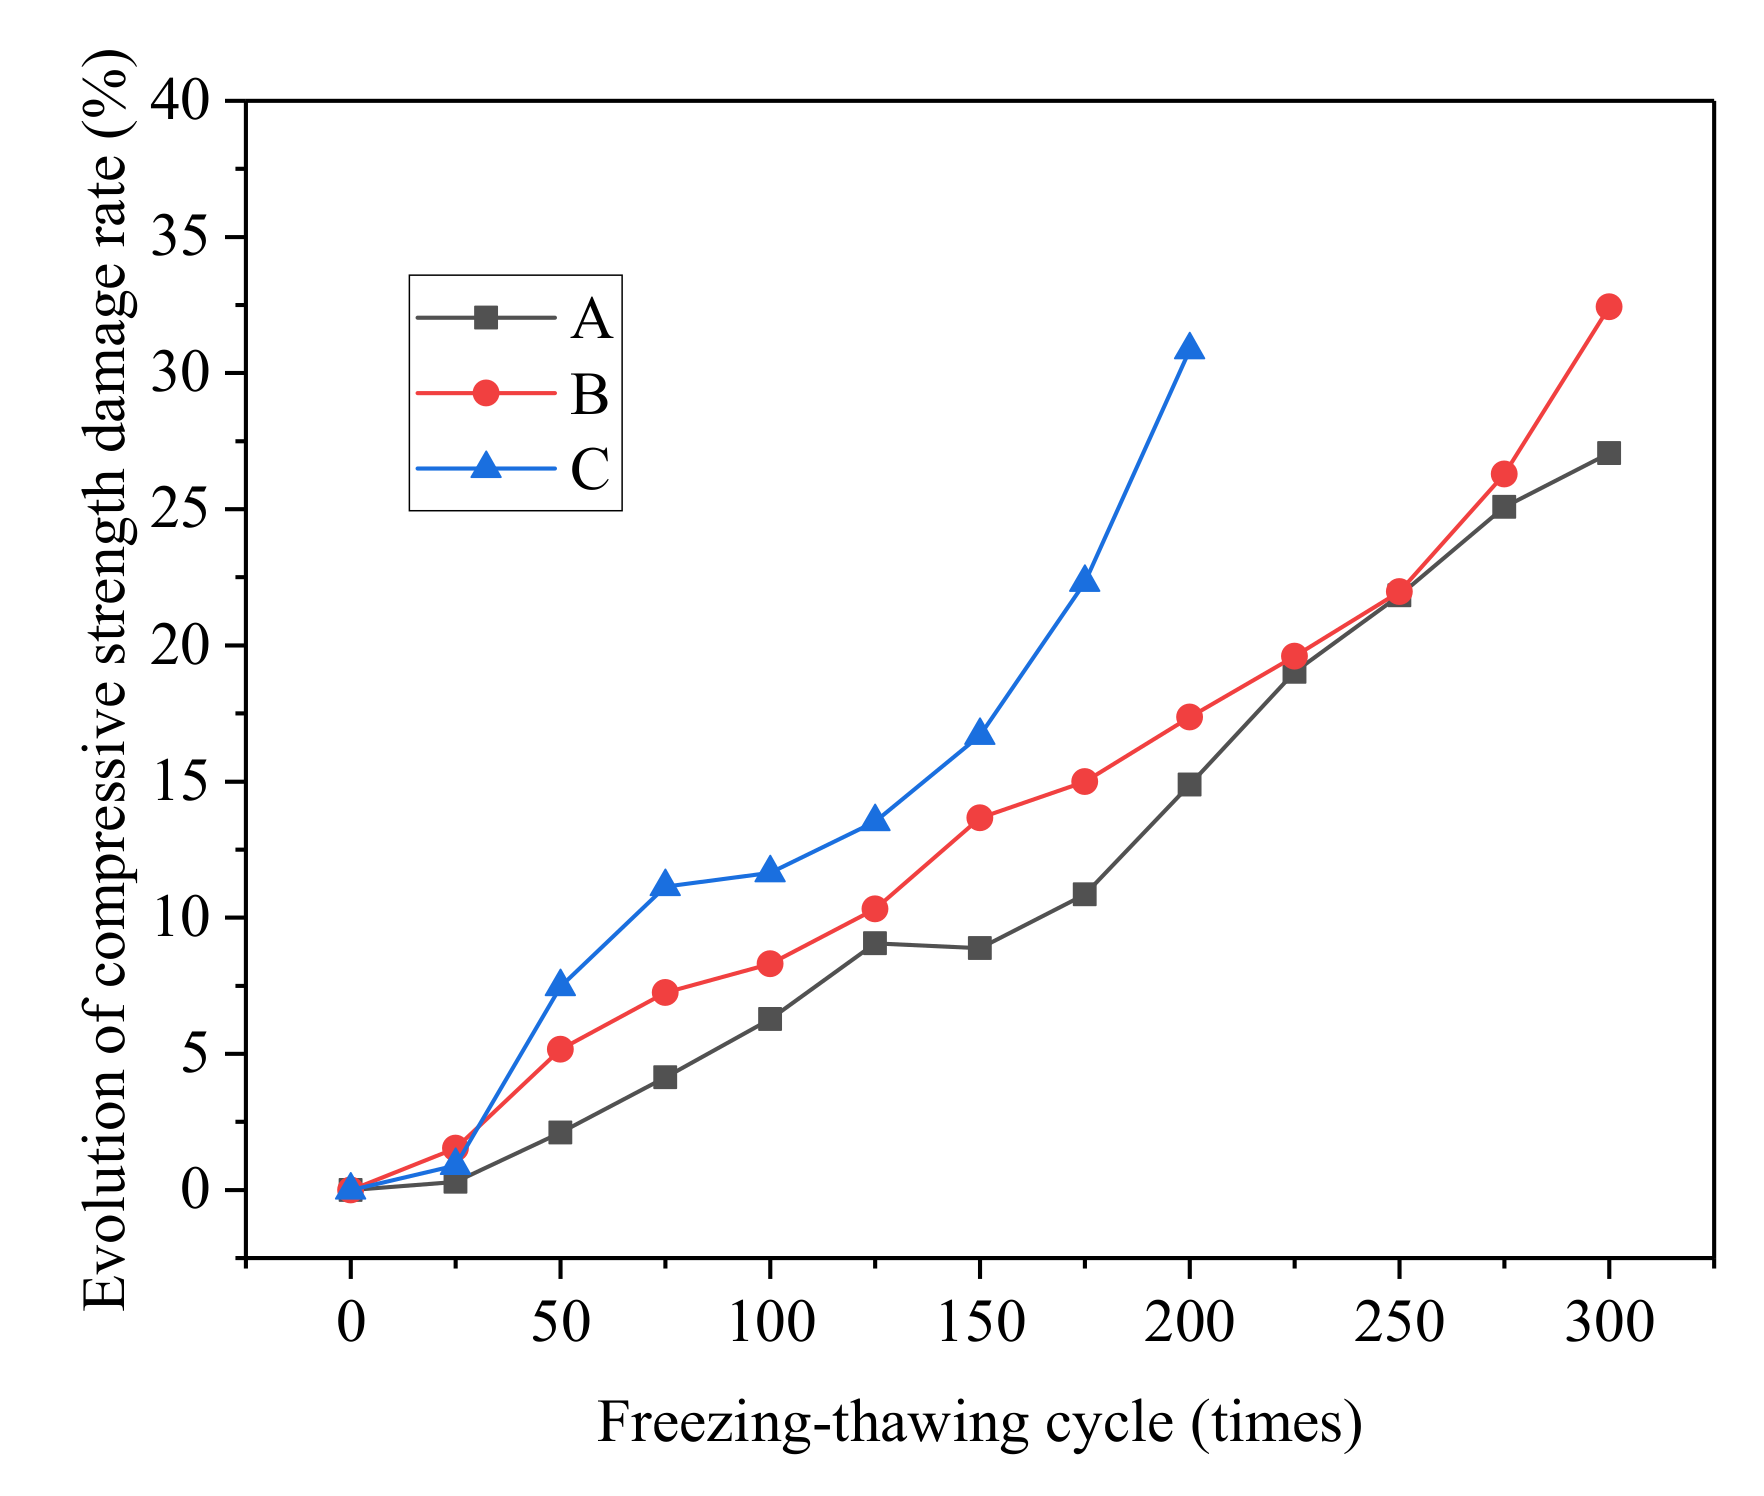
3.1.4. Compressive Strength Loss Rate
3.2. Evolution Rules of Concrete Microstructure
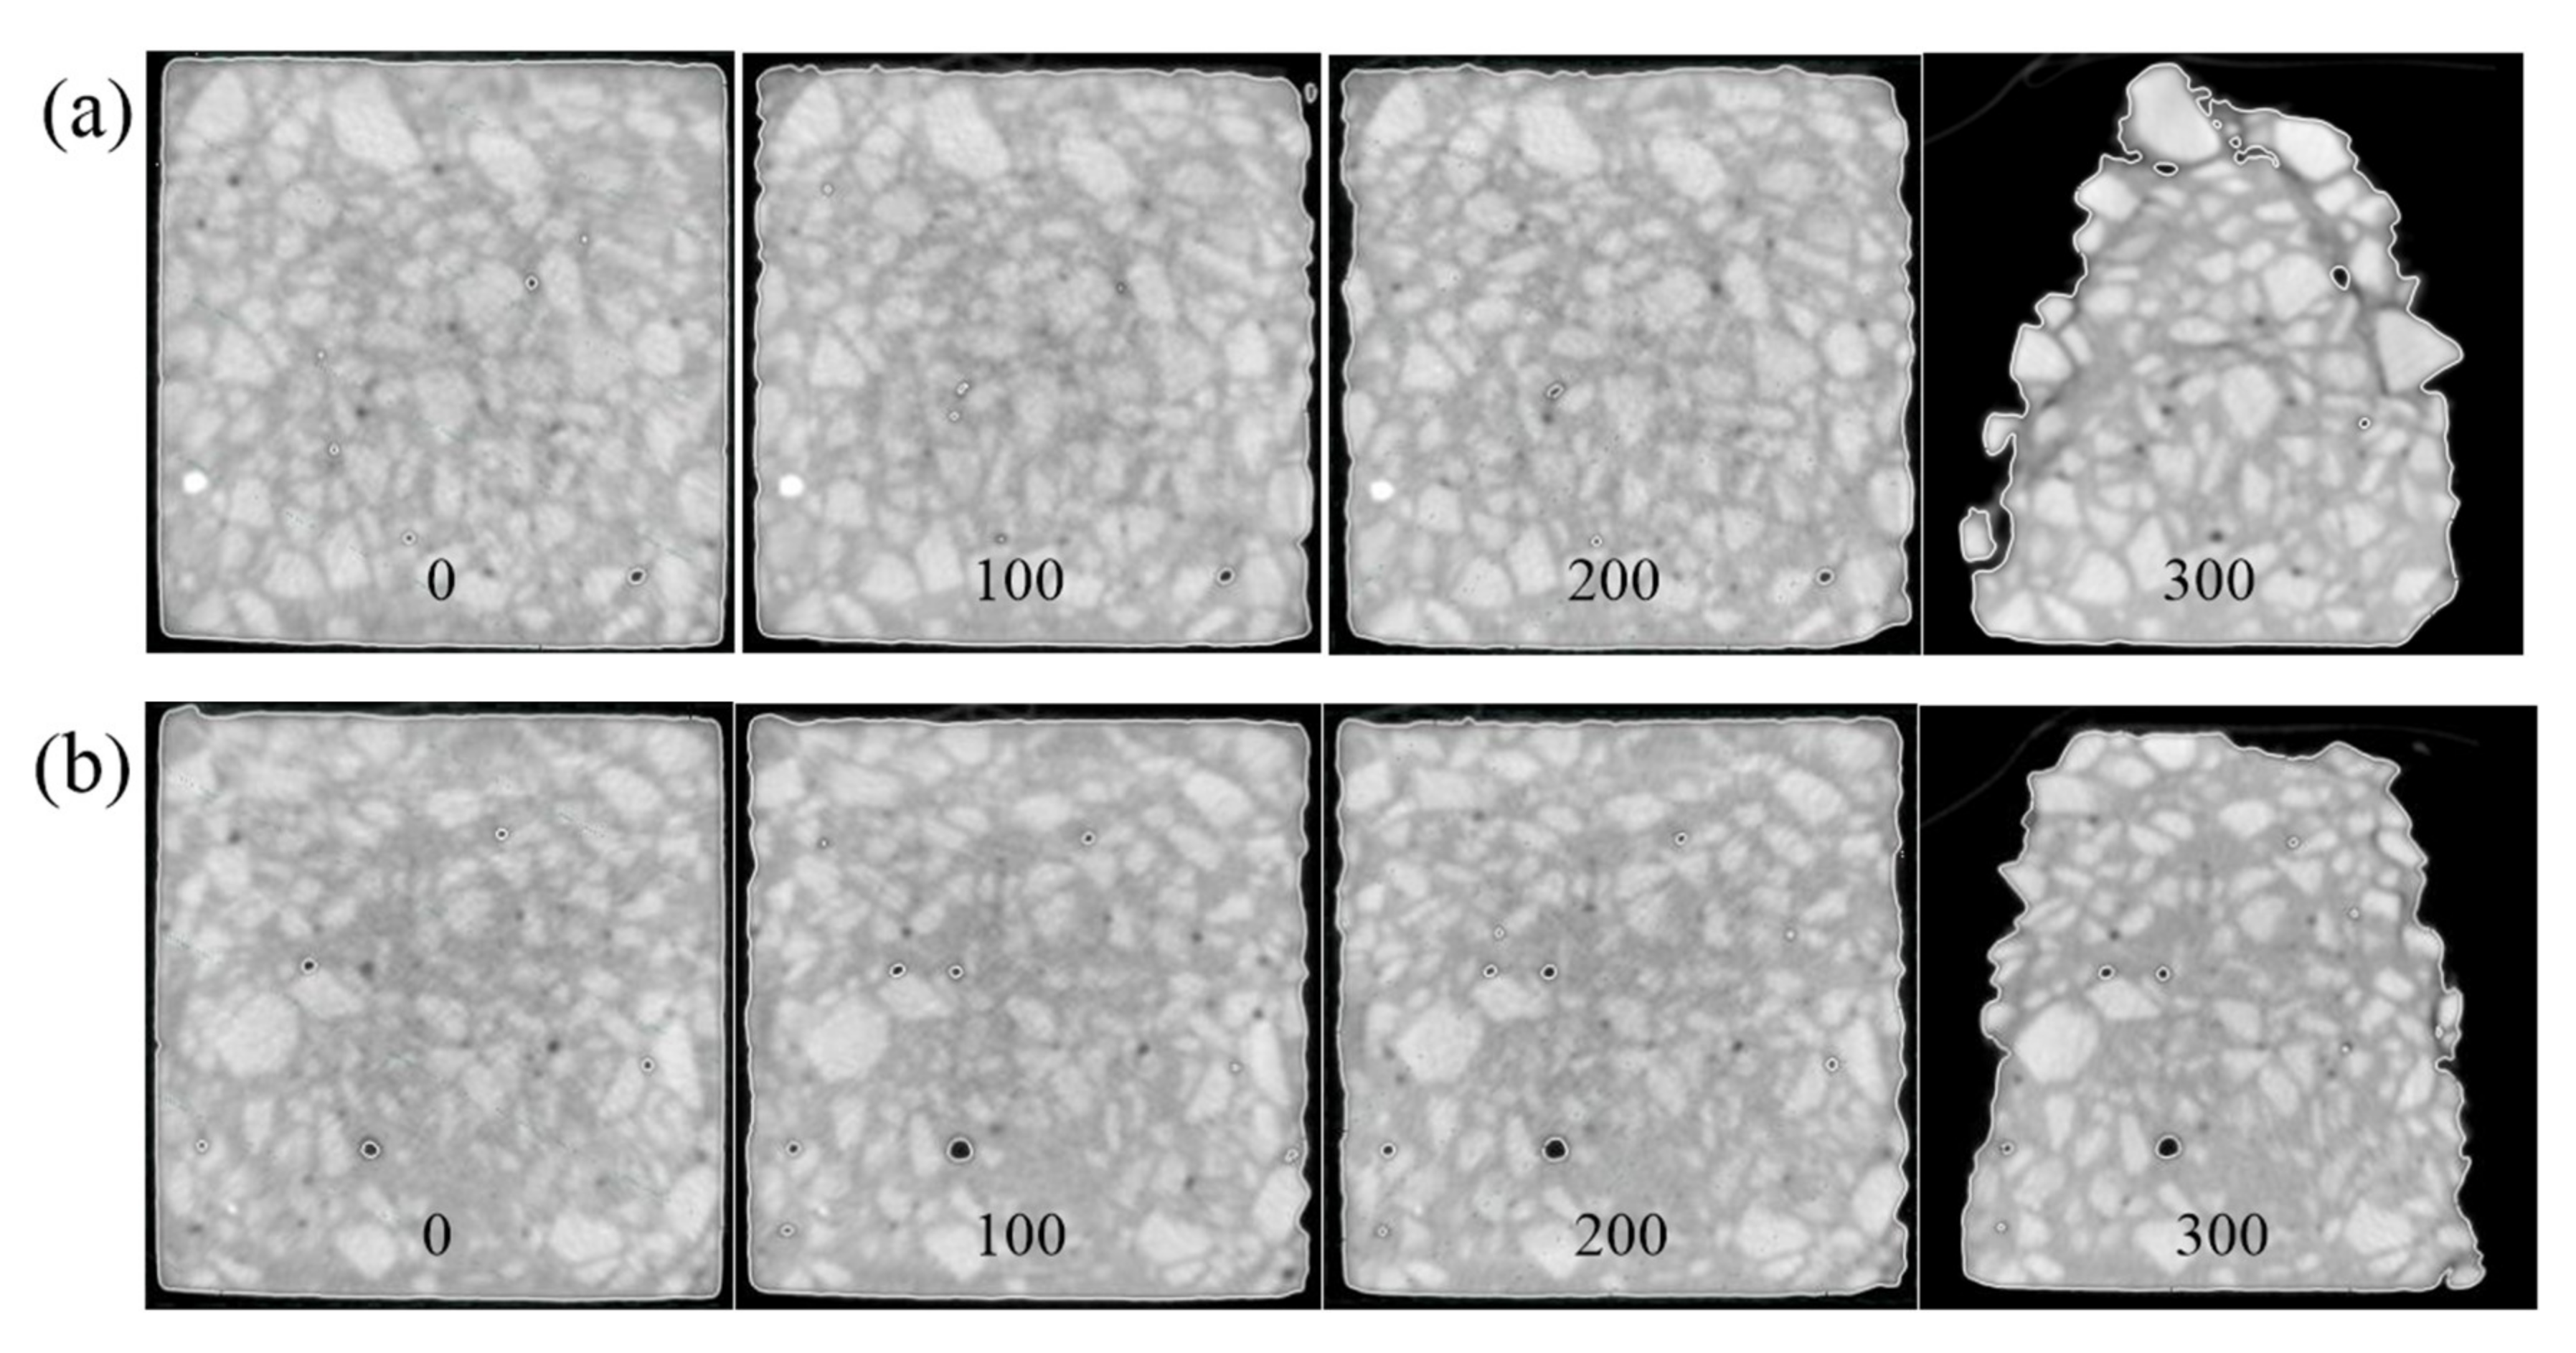
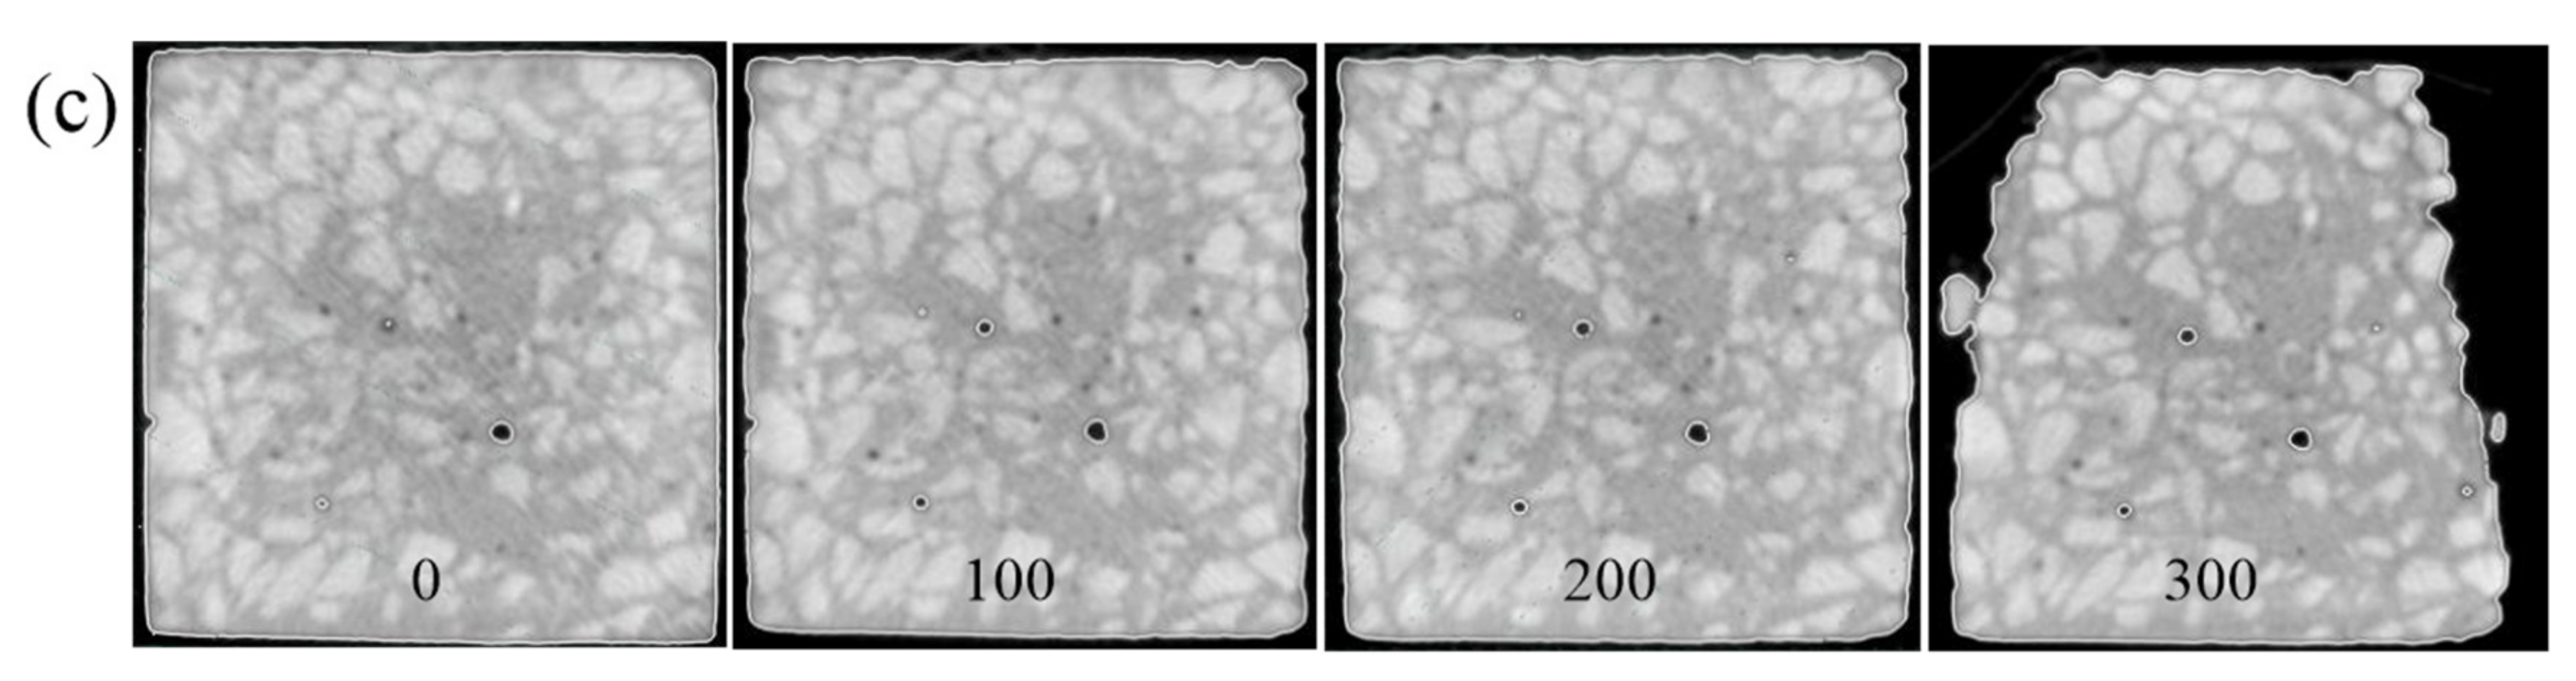
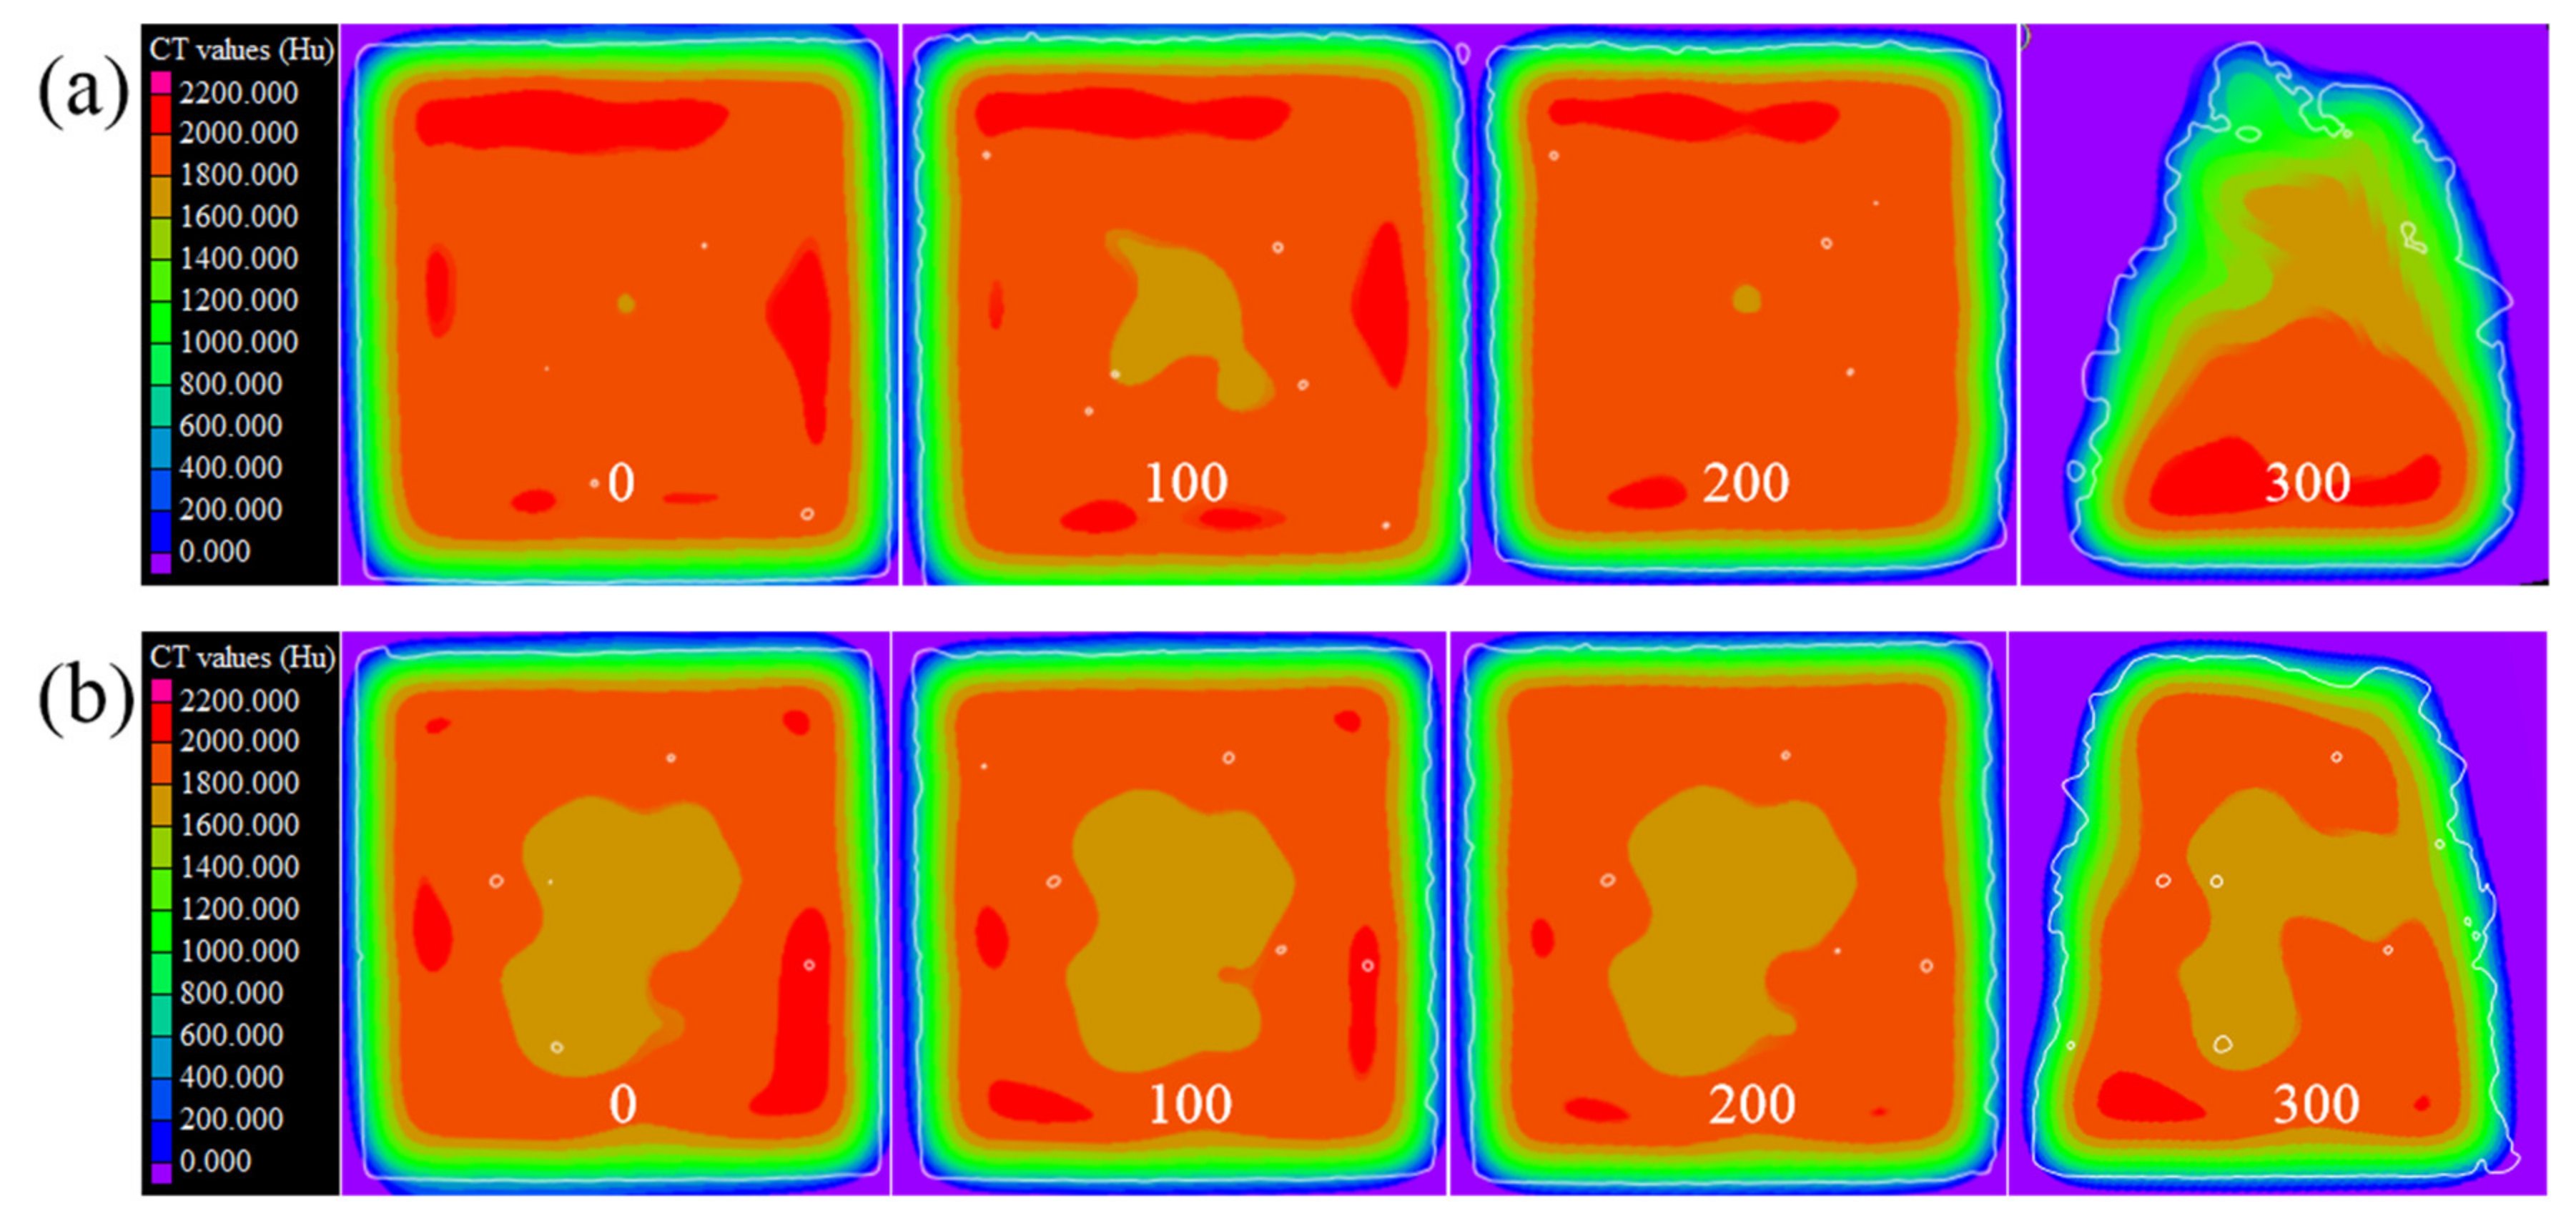
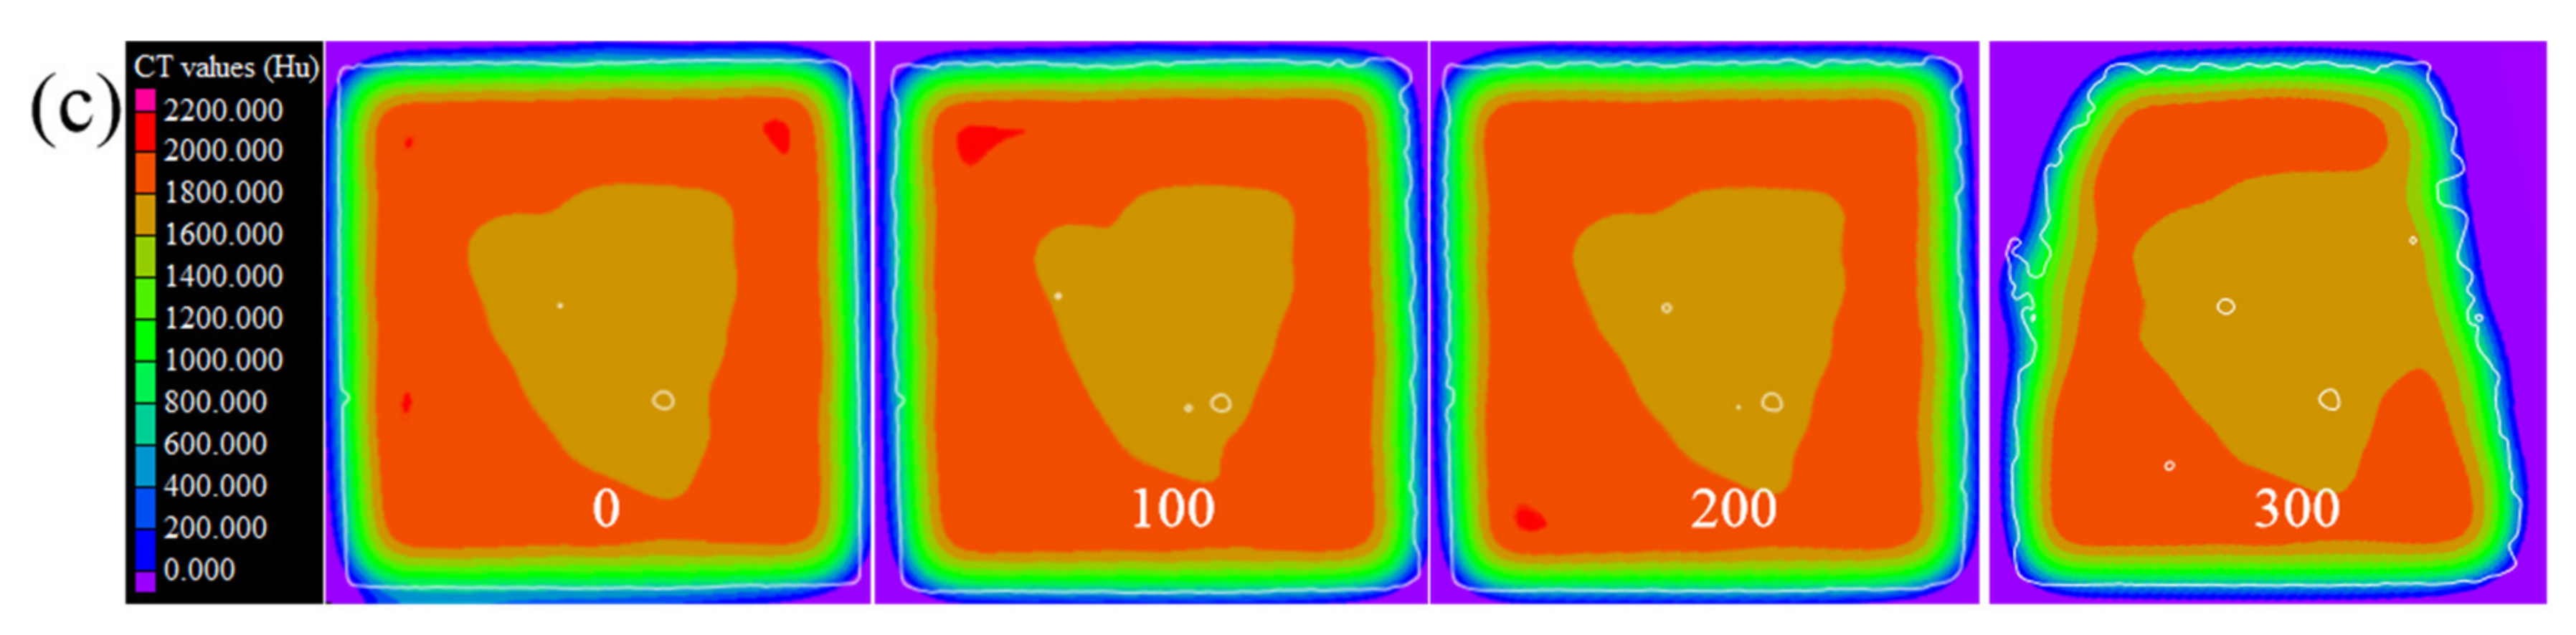
3.2.1. CT Image Analysis
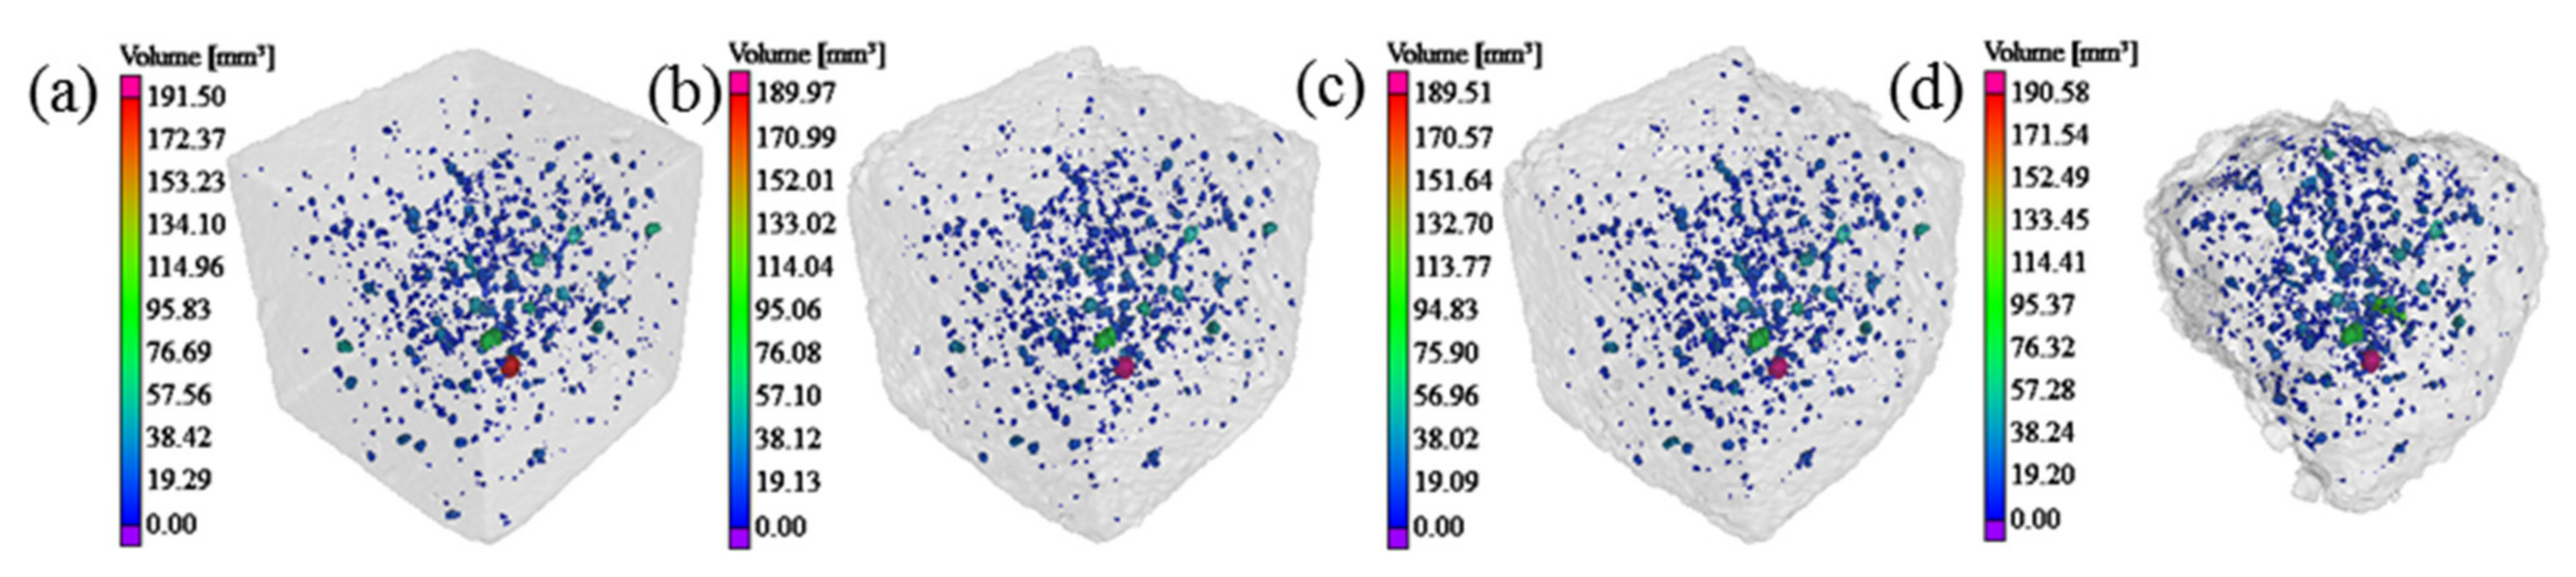
3.2.2. Three-Dimensional Reconstruction
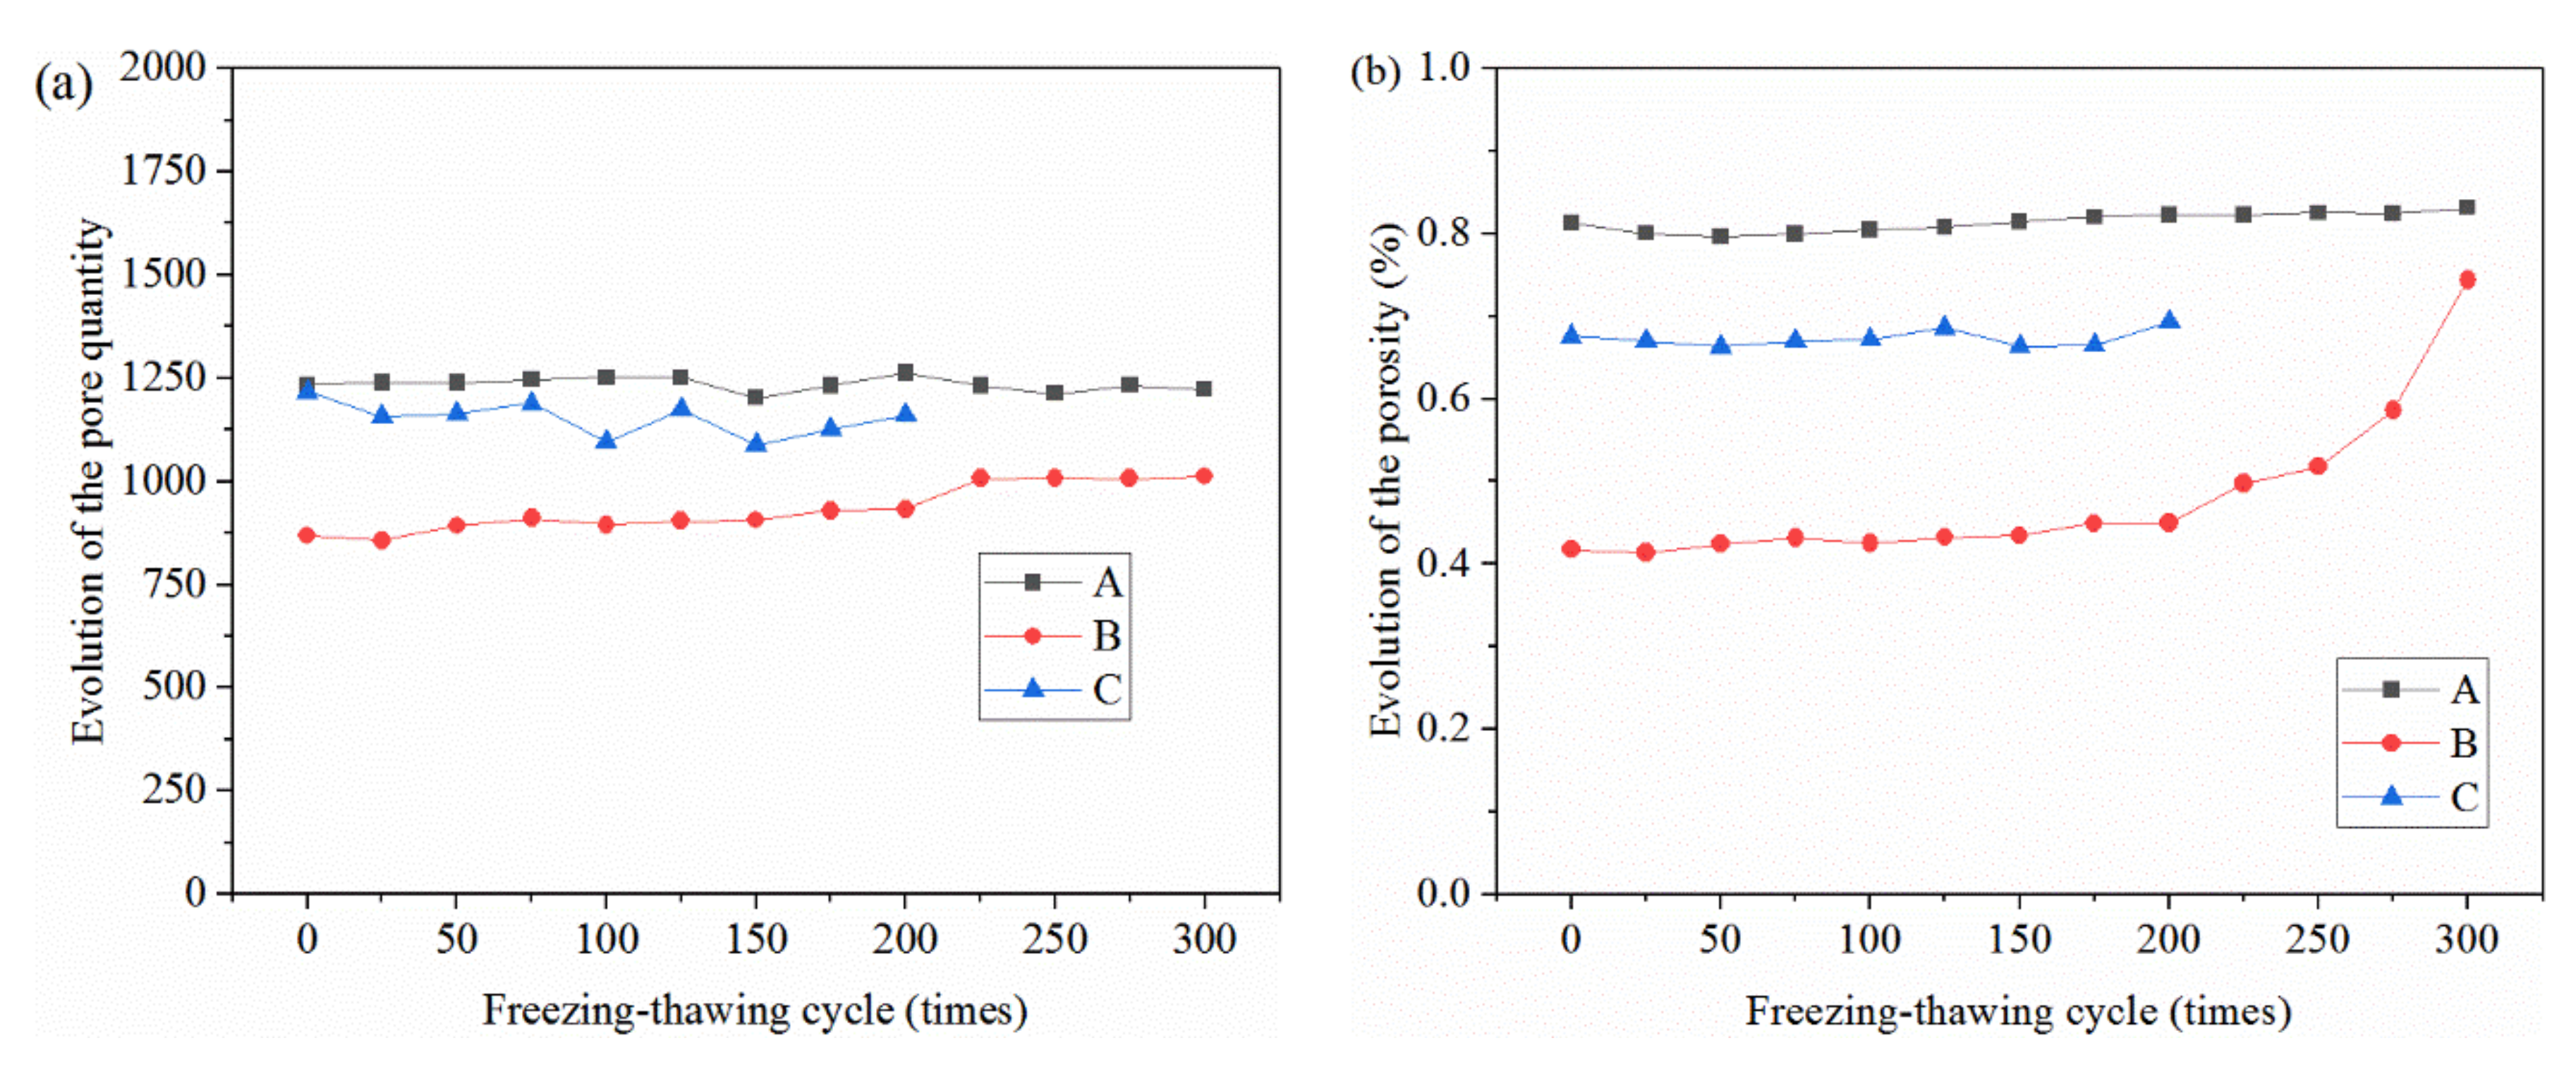
3.2.3. Pore Structures
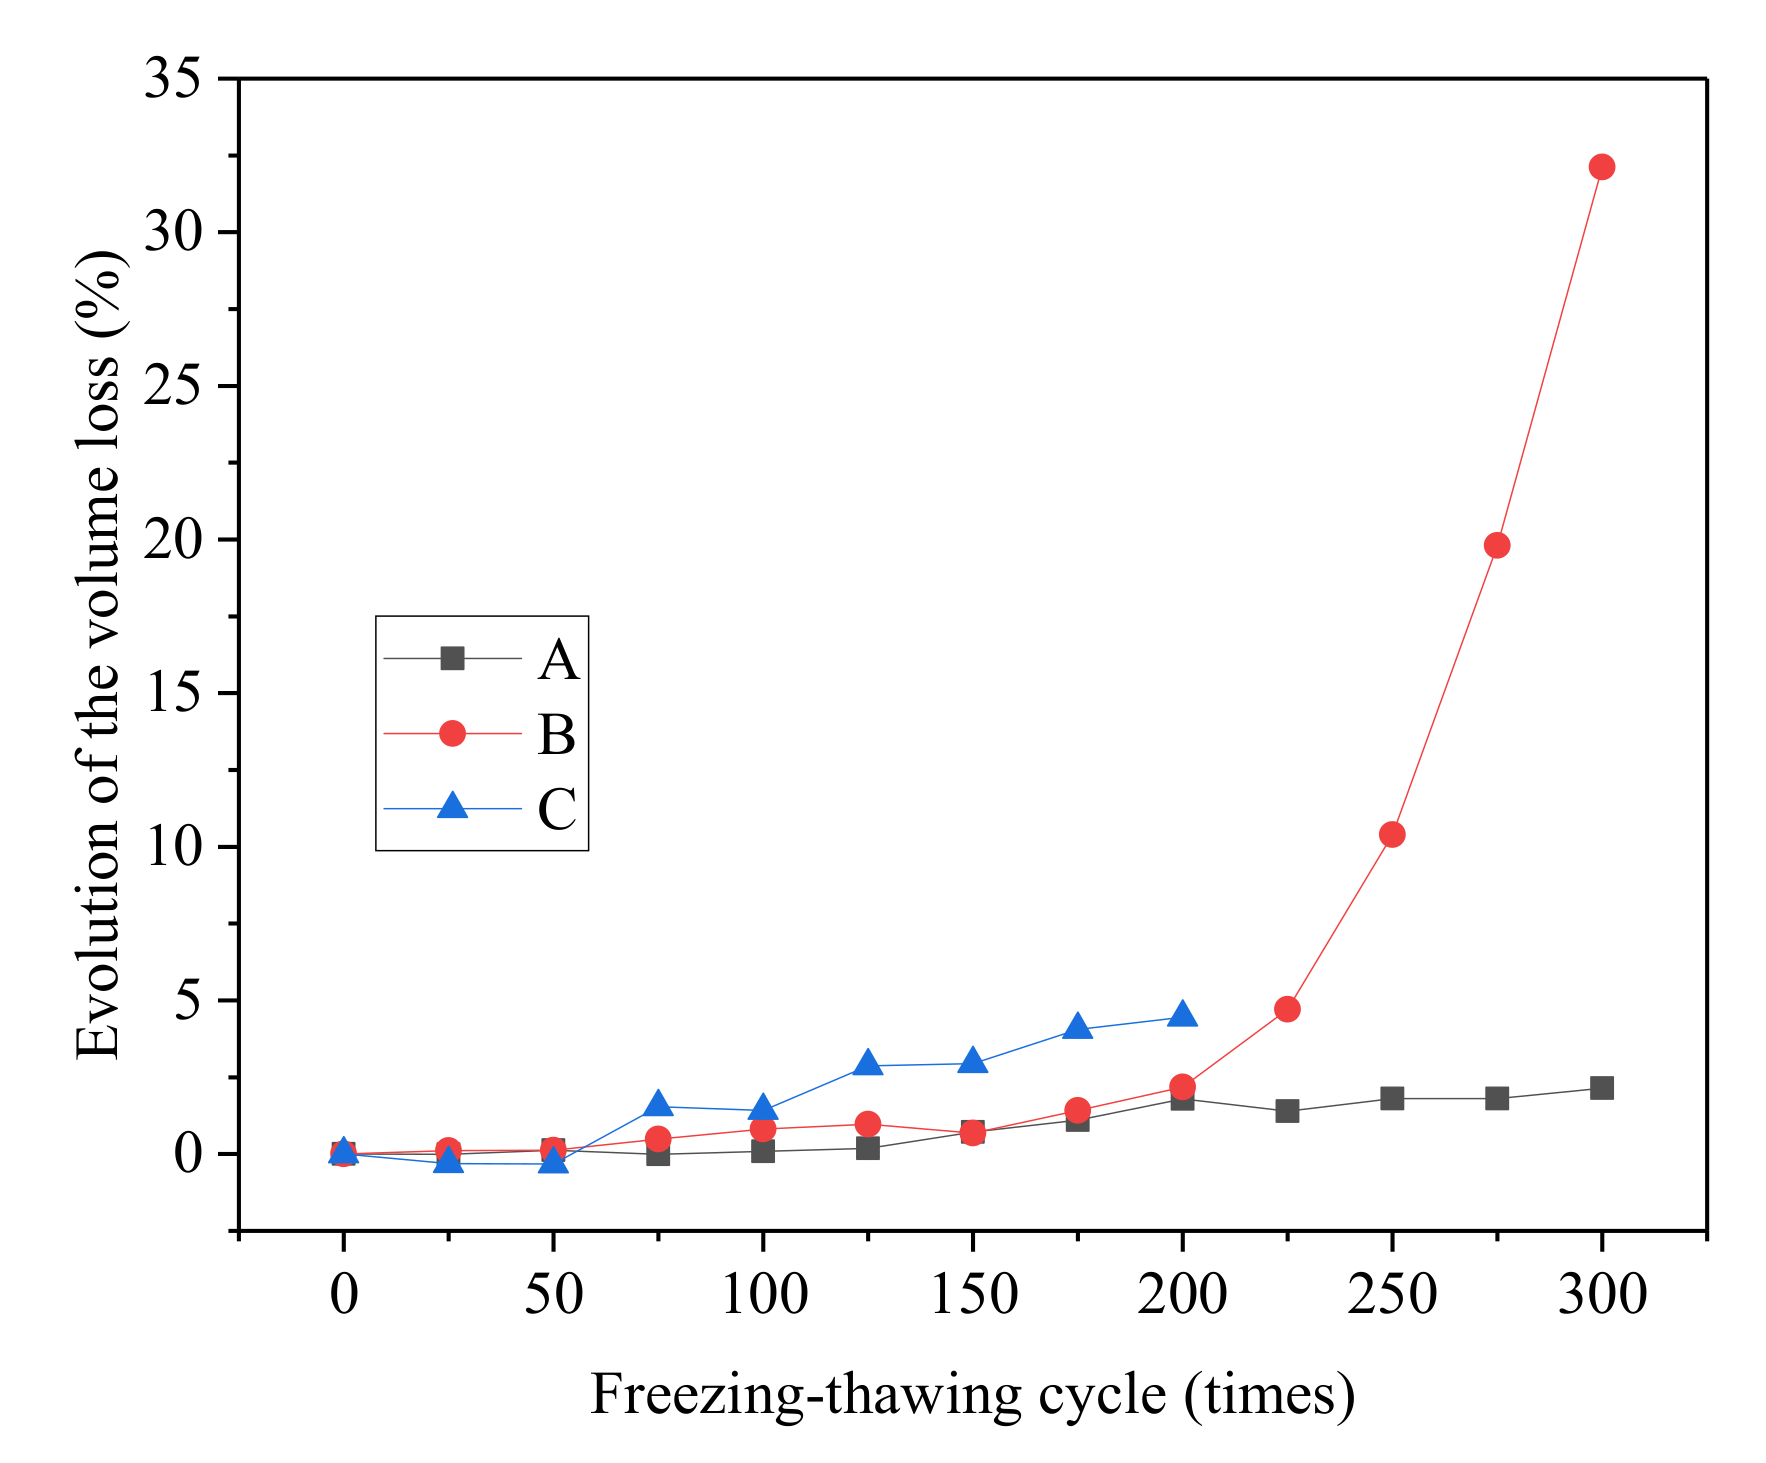
3.2.4. Volume Loss Rate
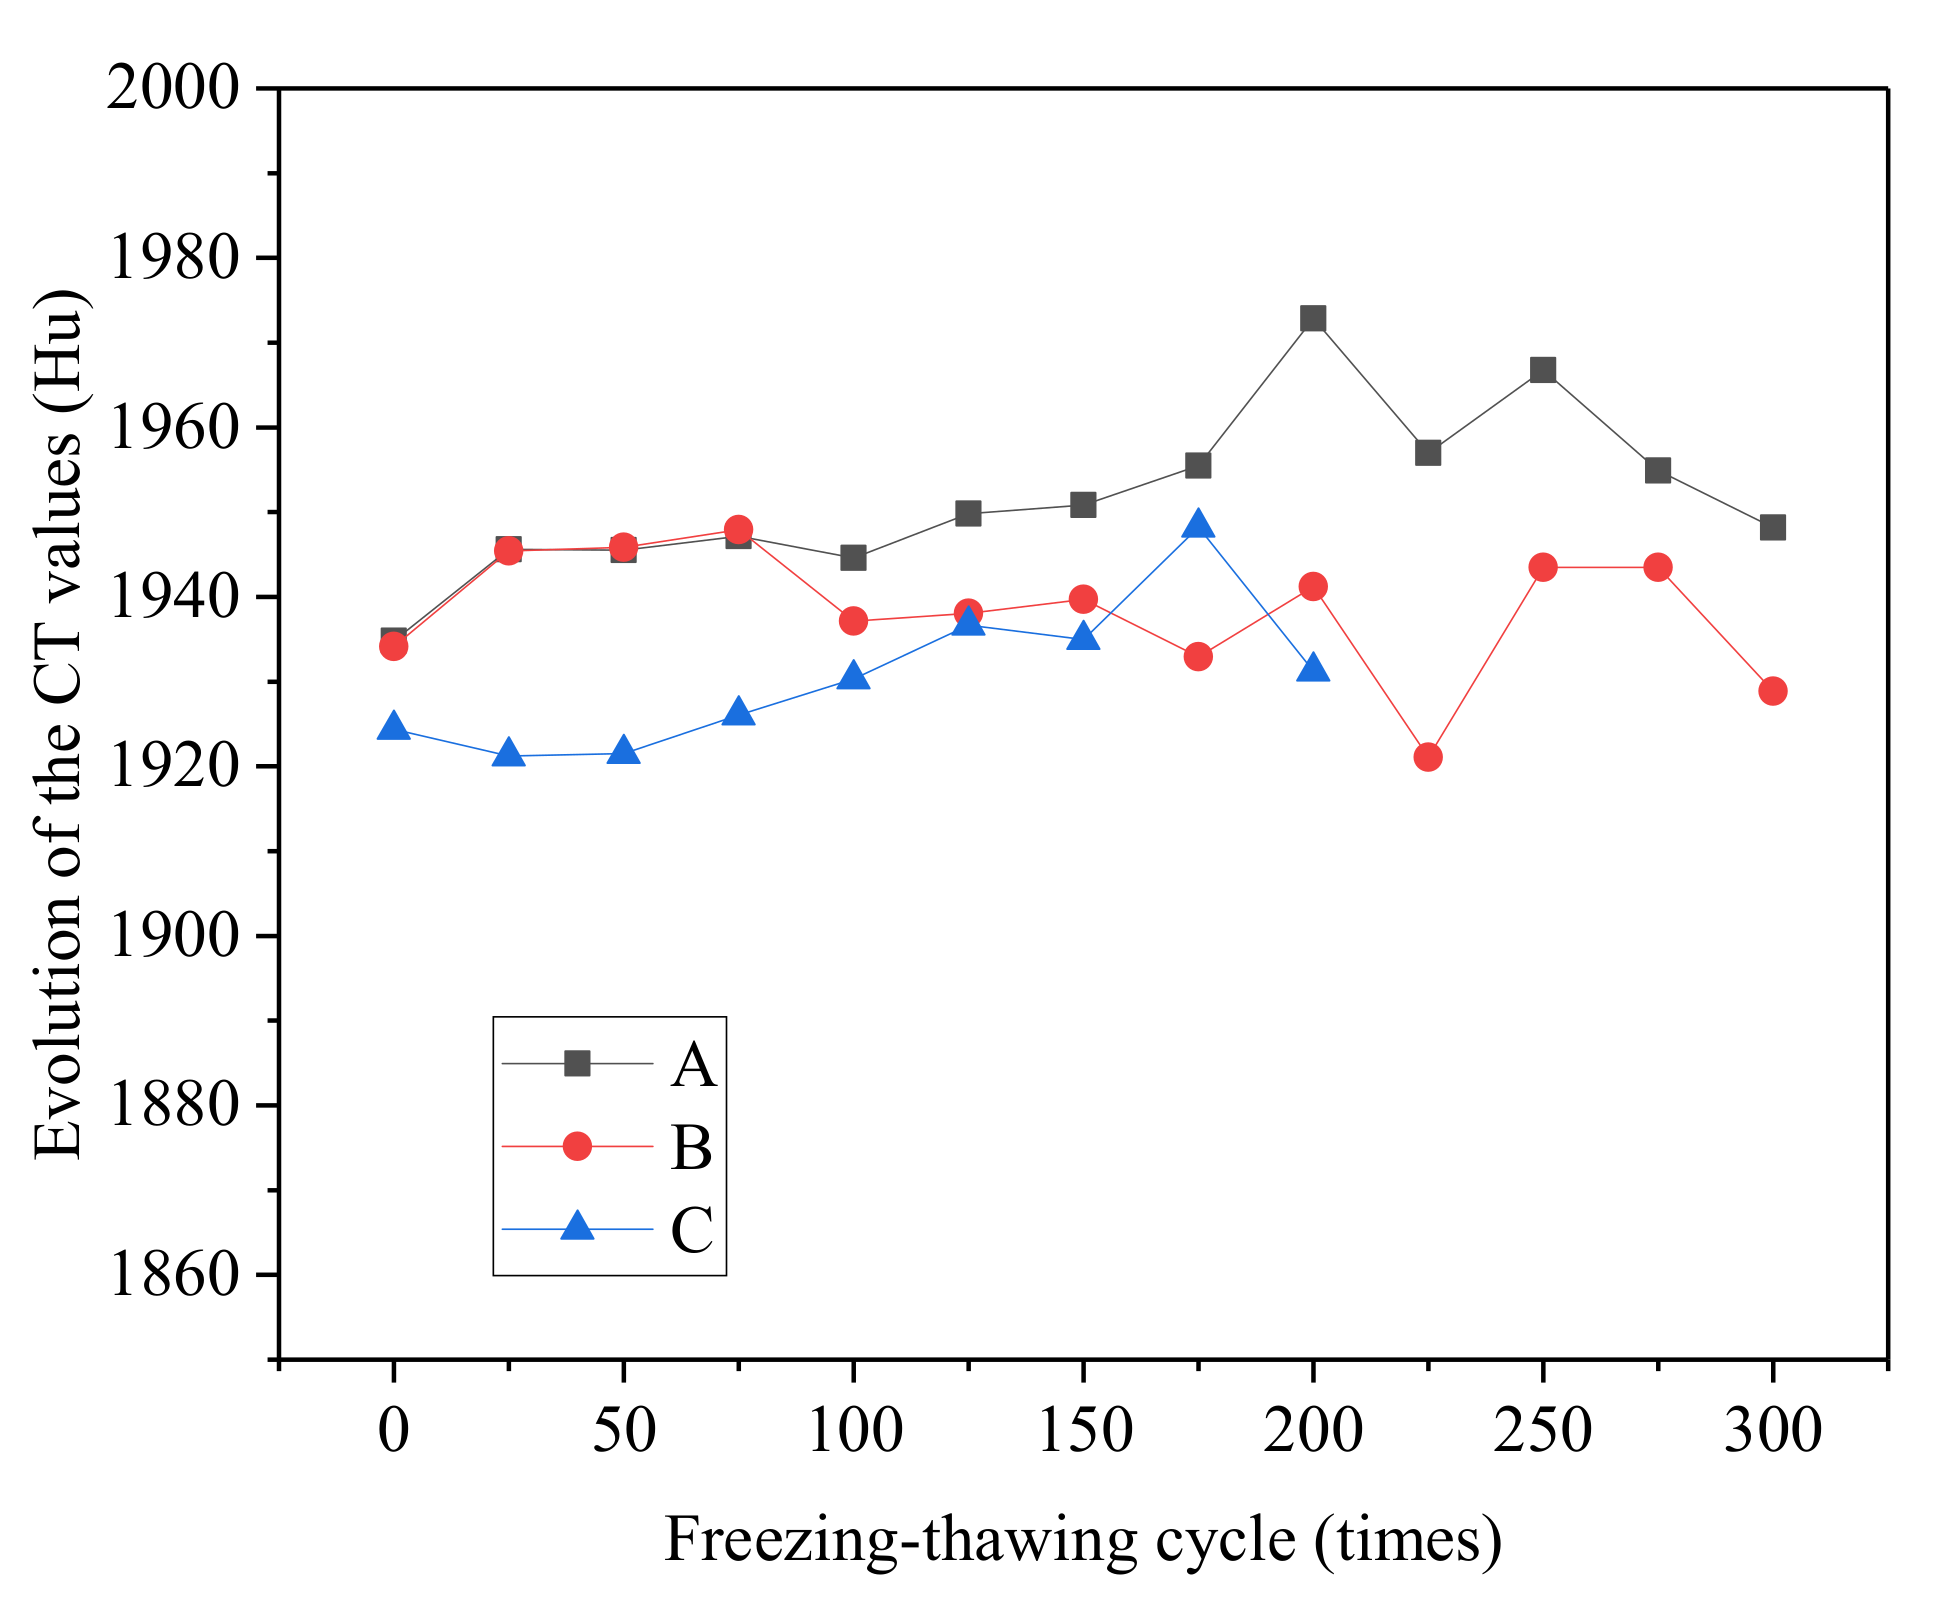
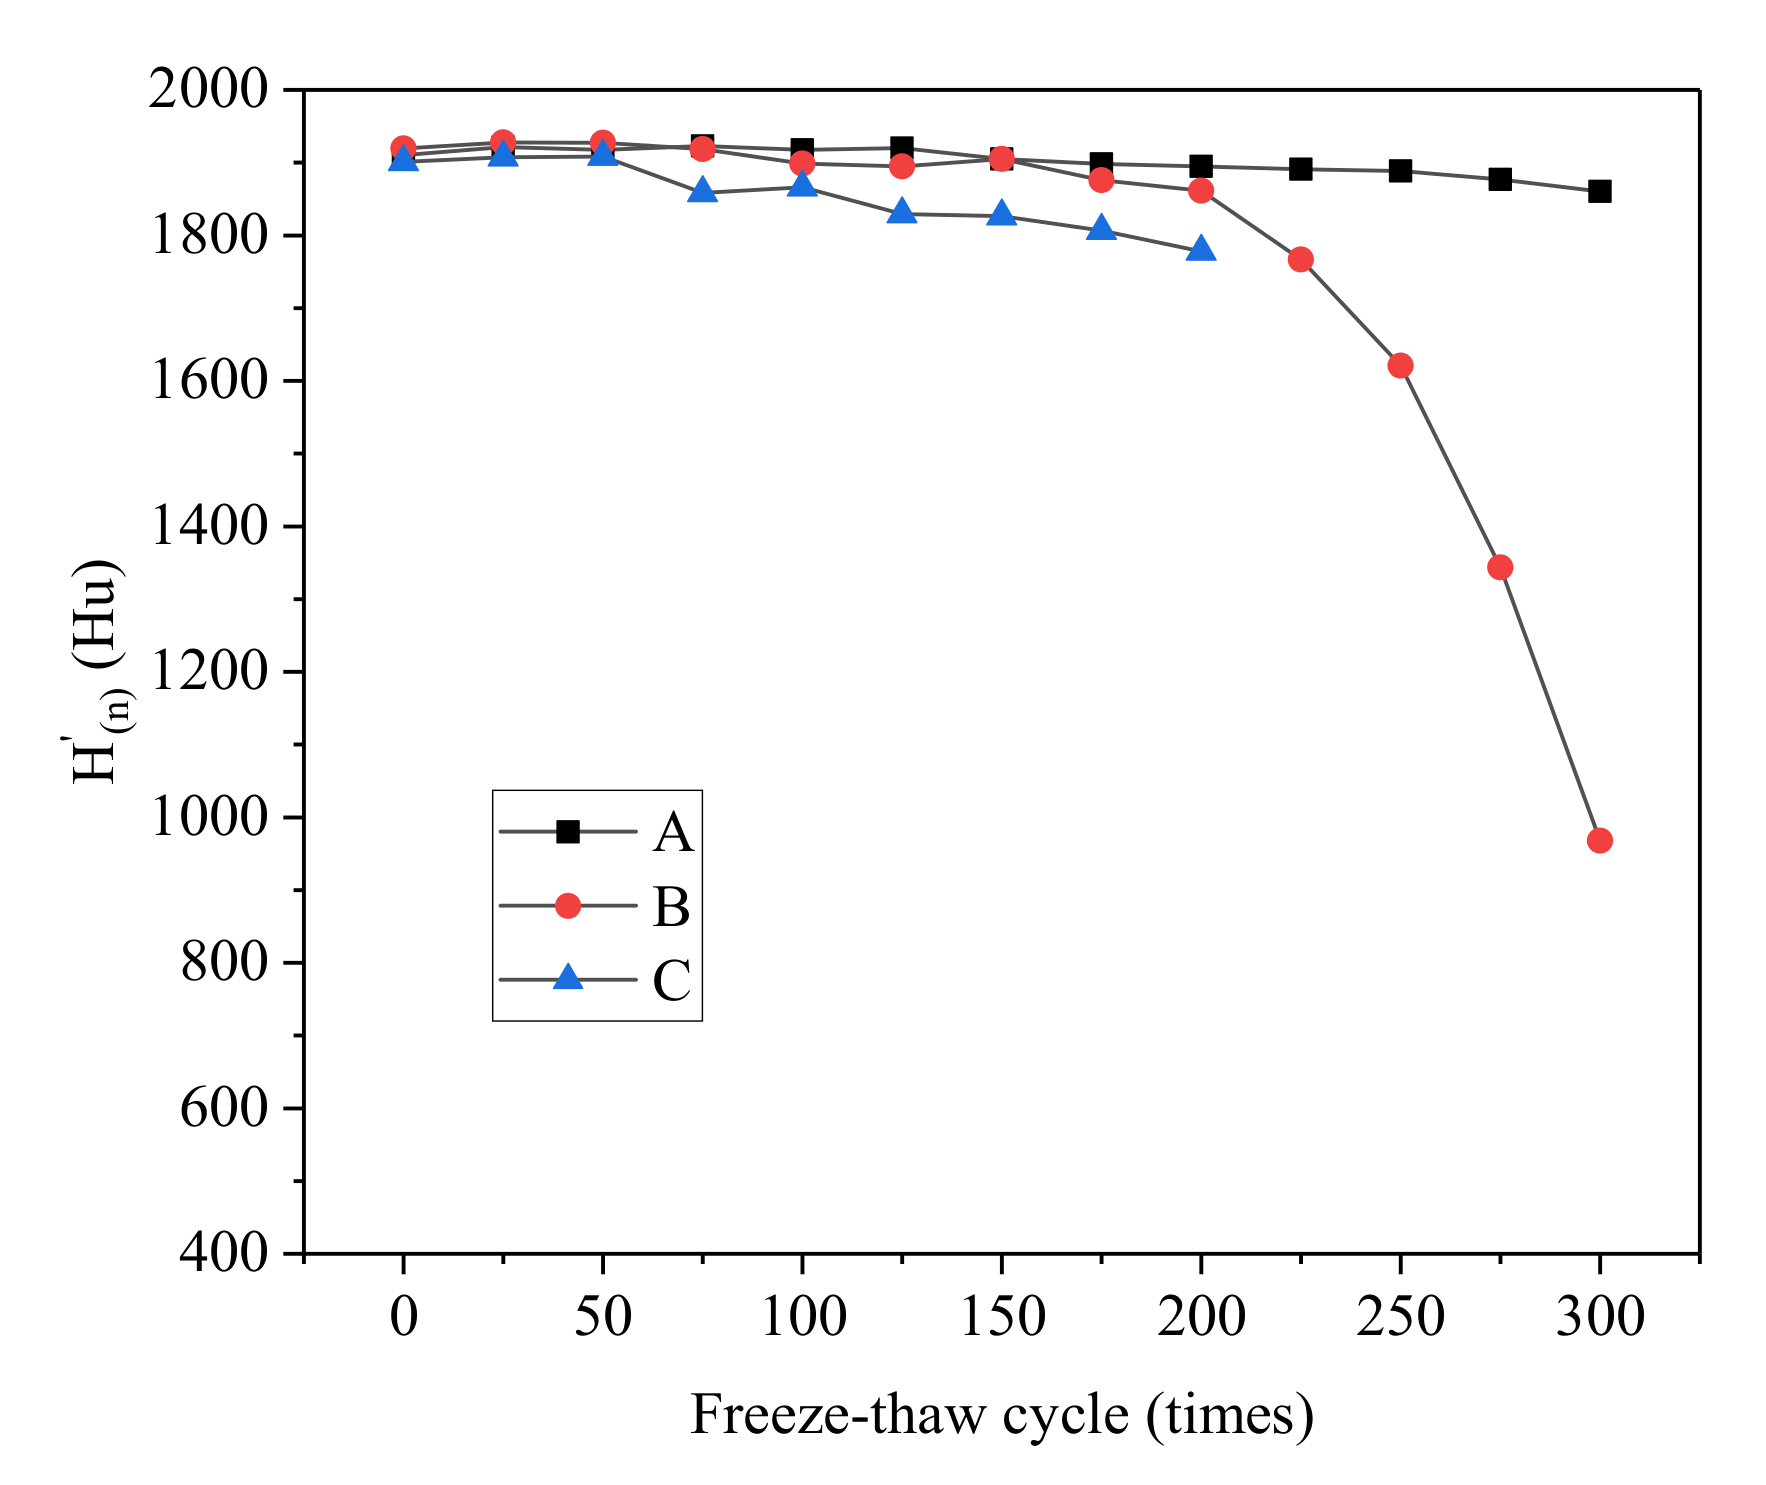
3.2.5. CT Value
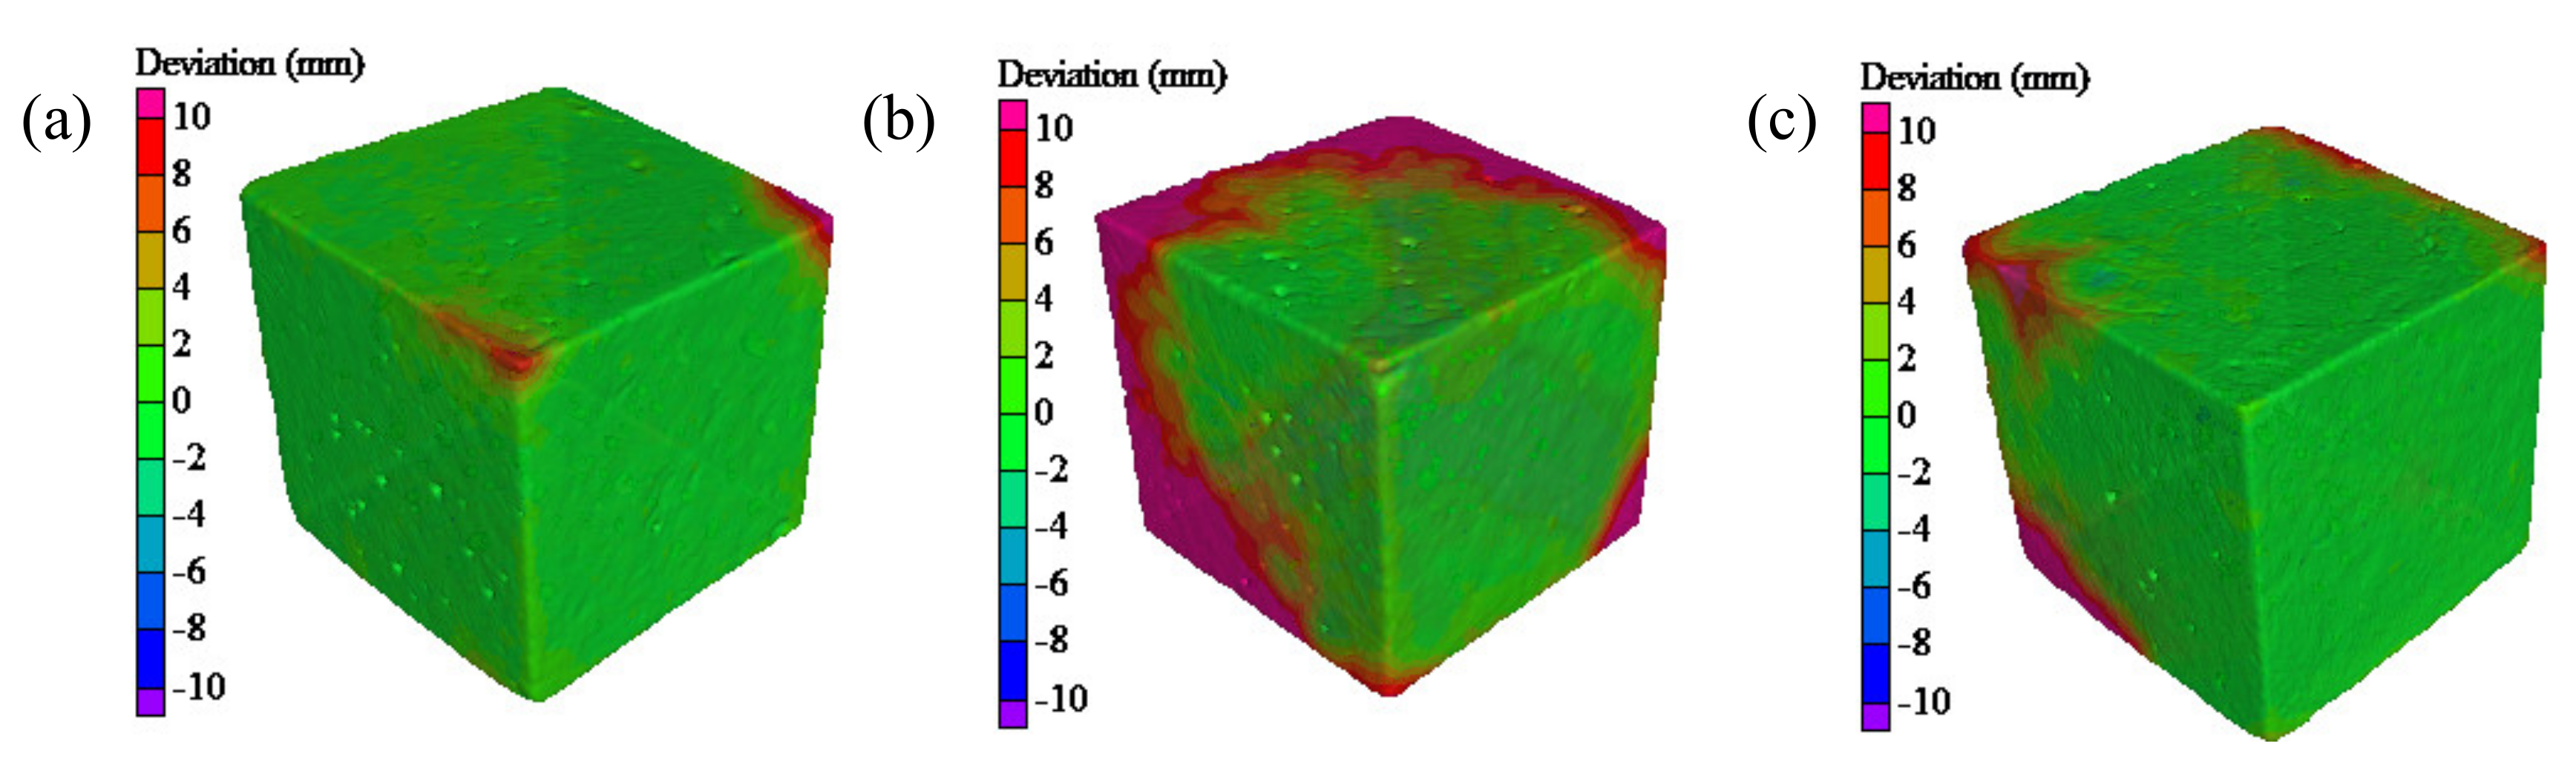
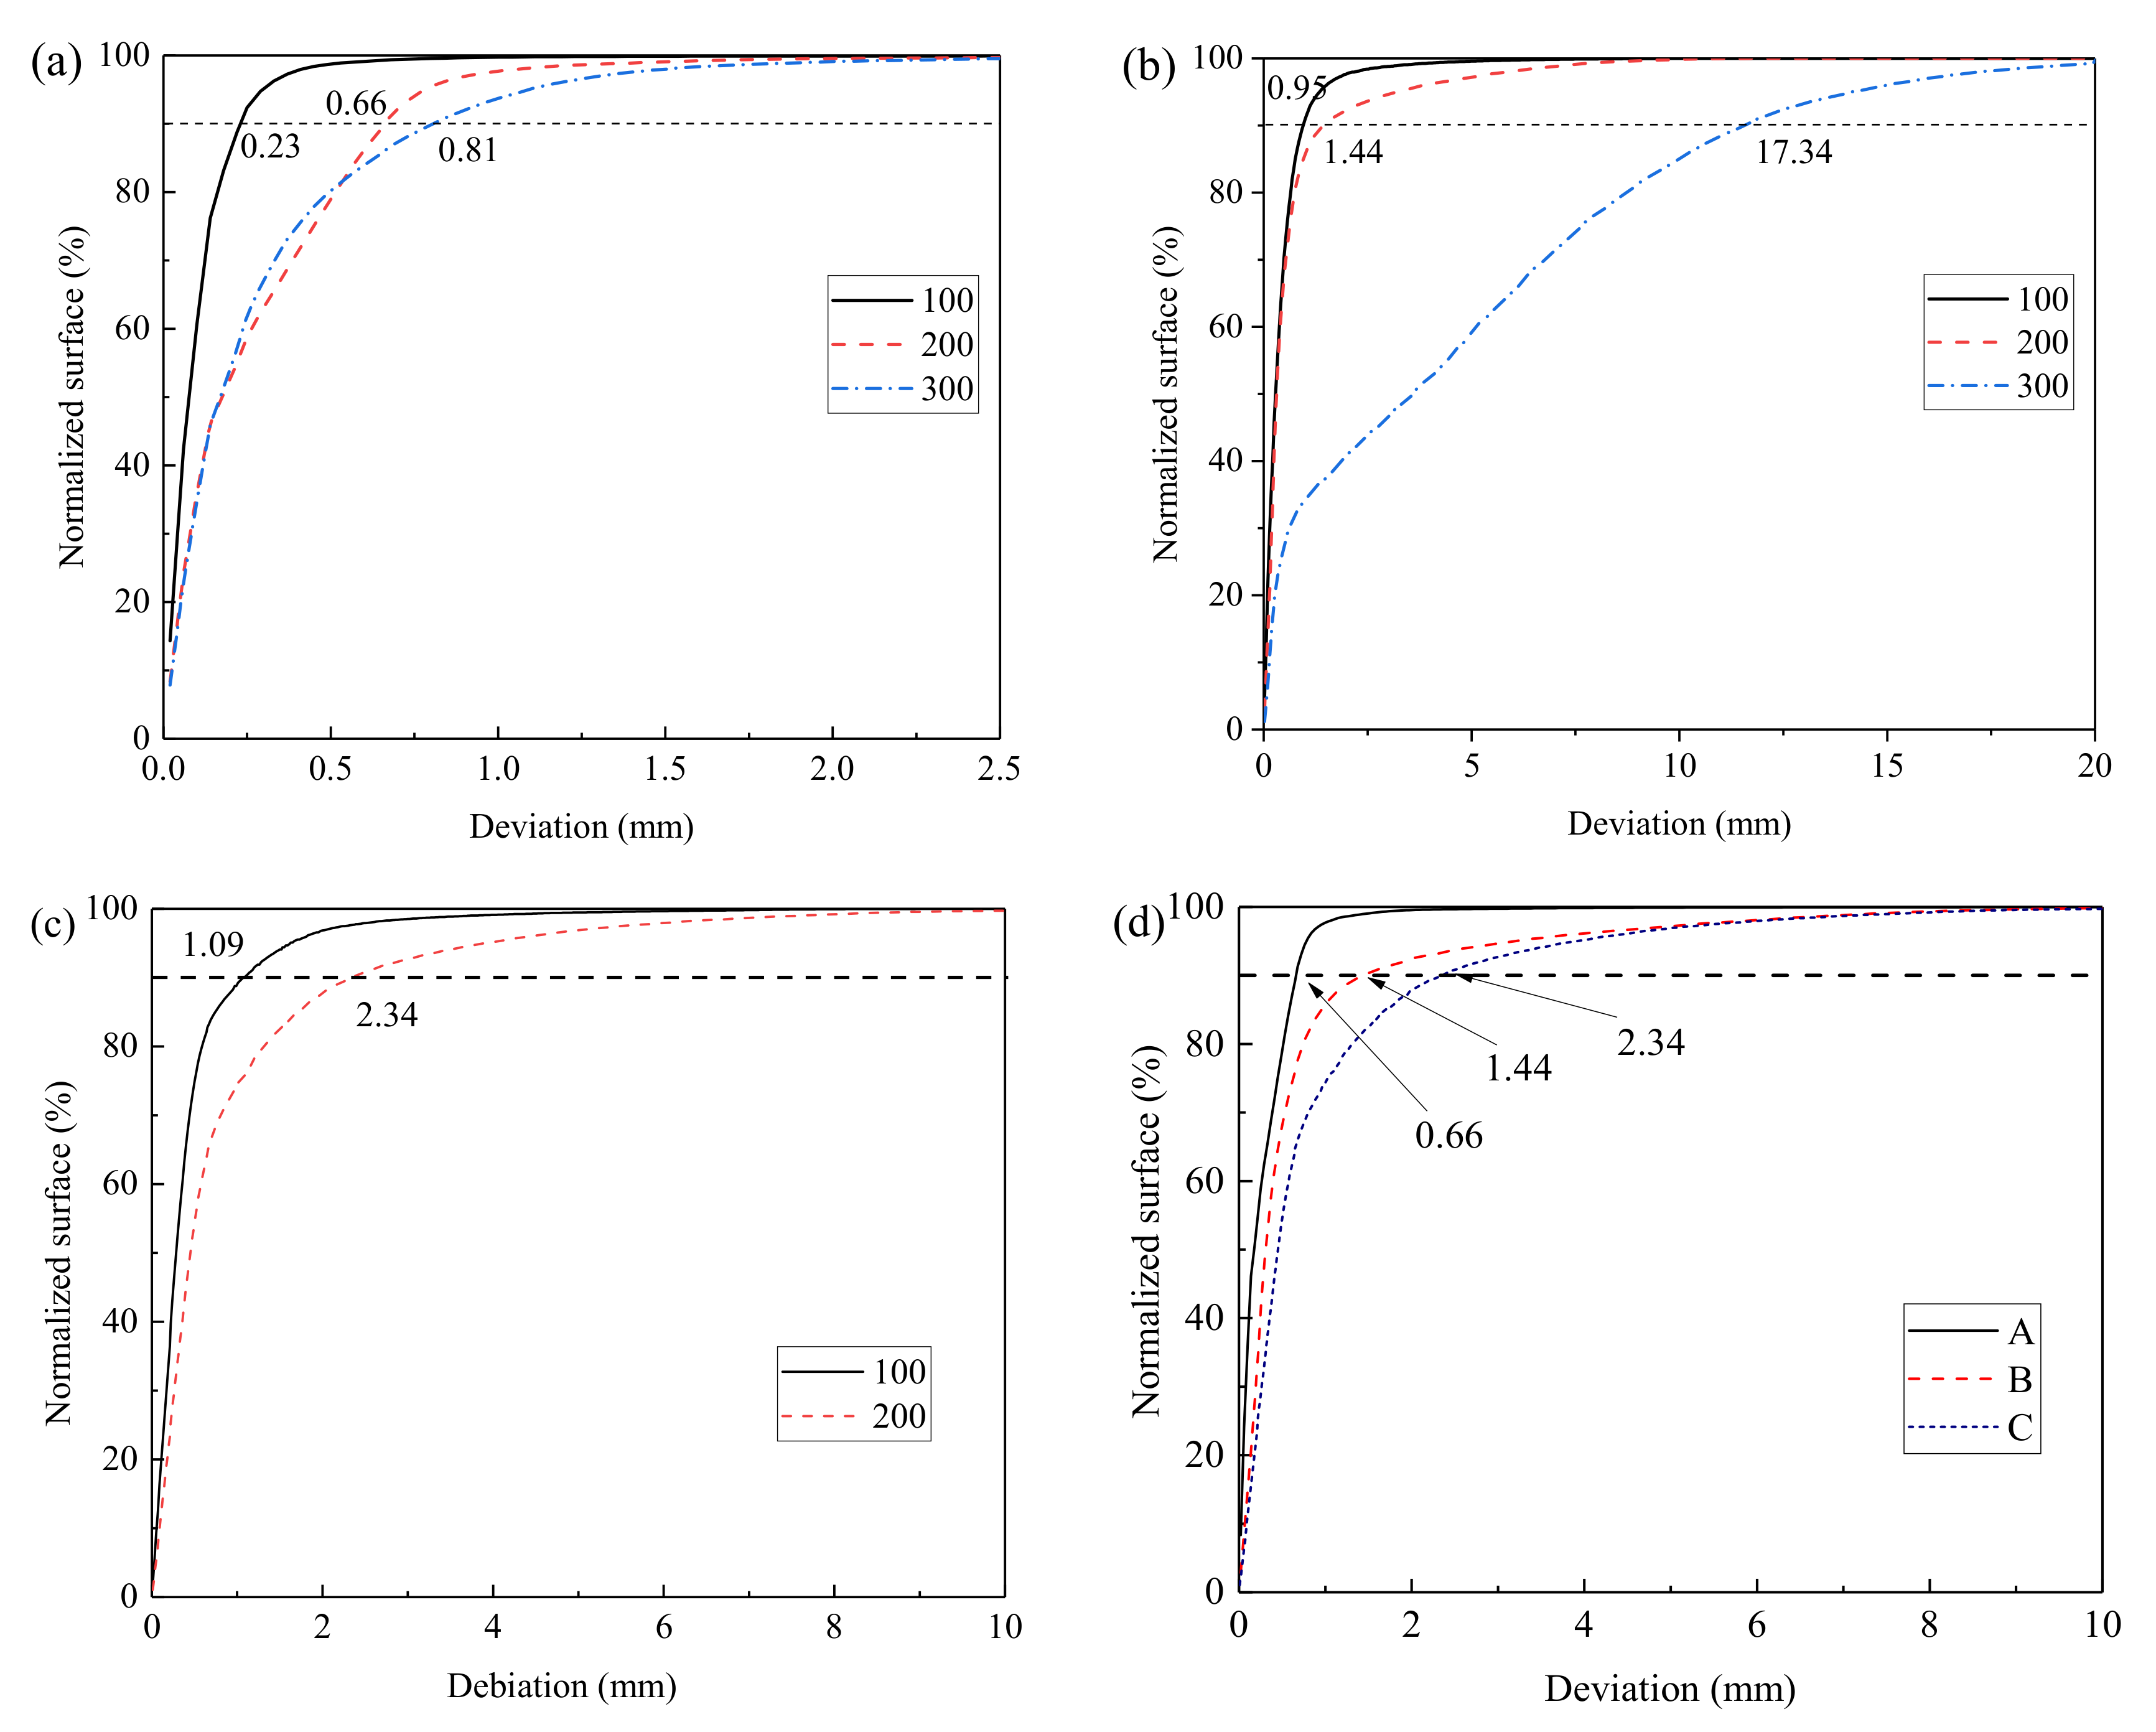
3.2.6. Surface Damages
4. Damage Model and Damage Mechanism of Concretes
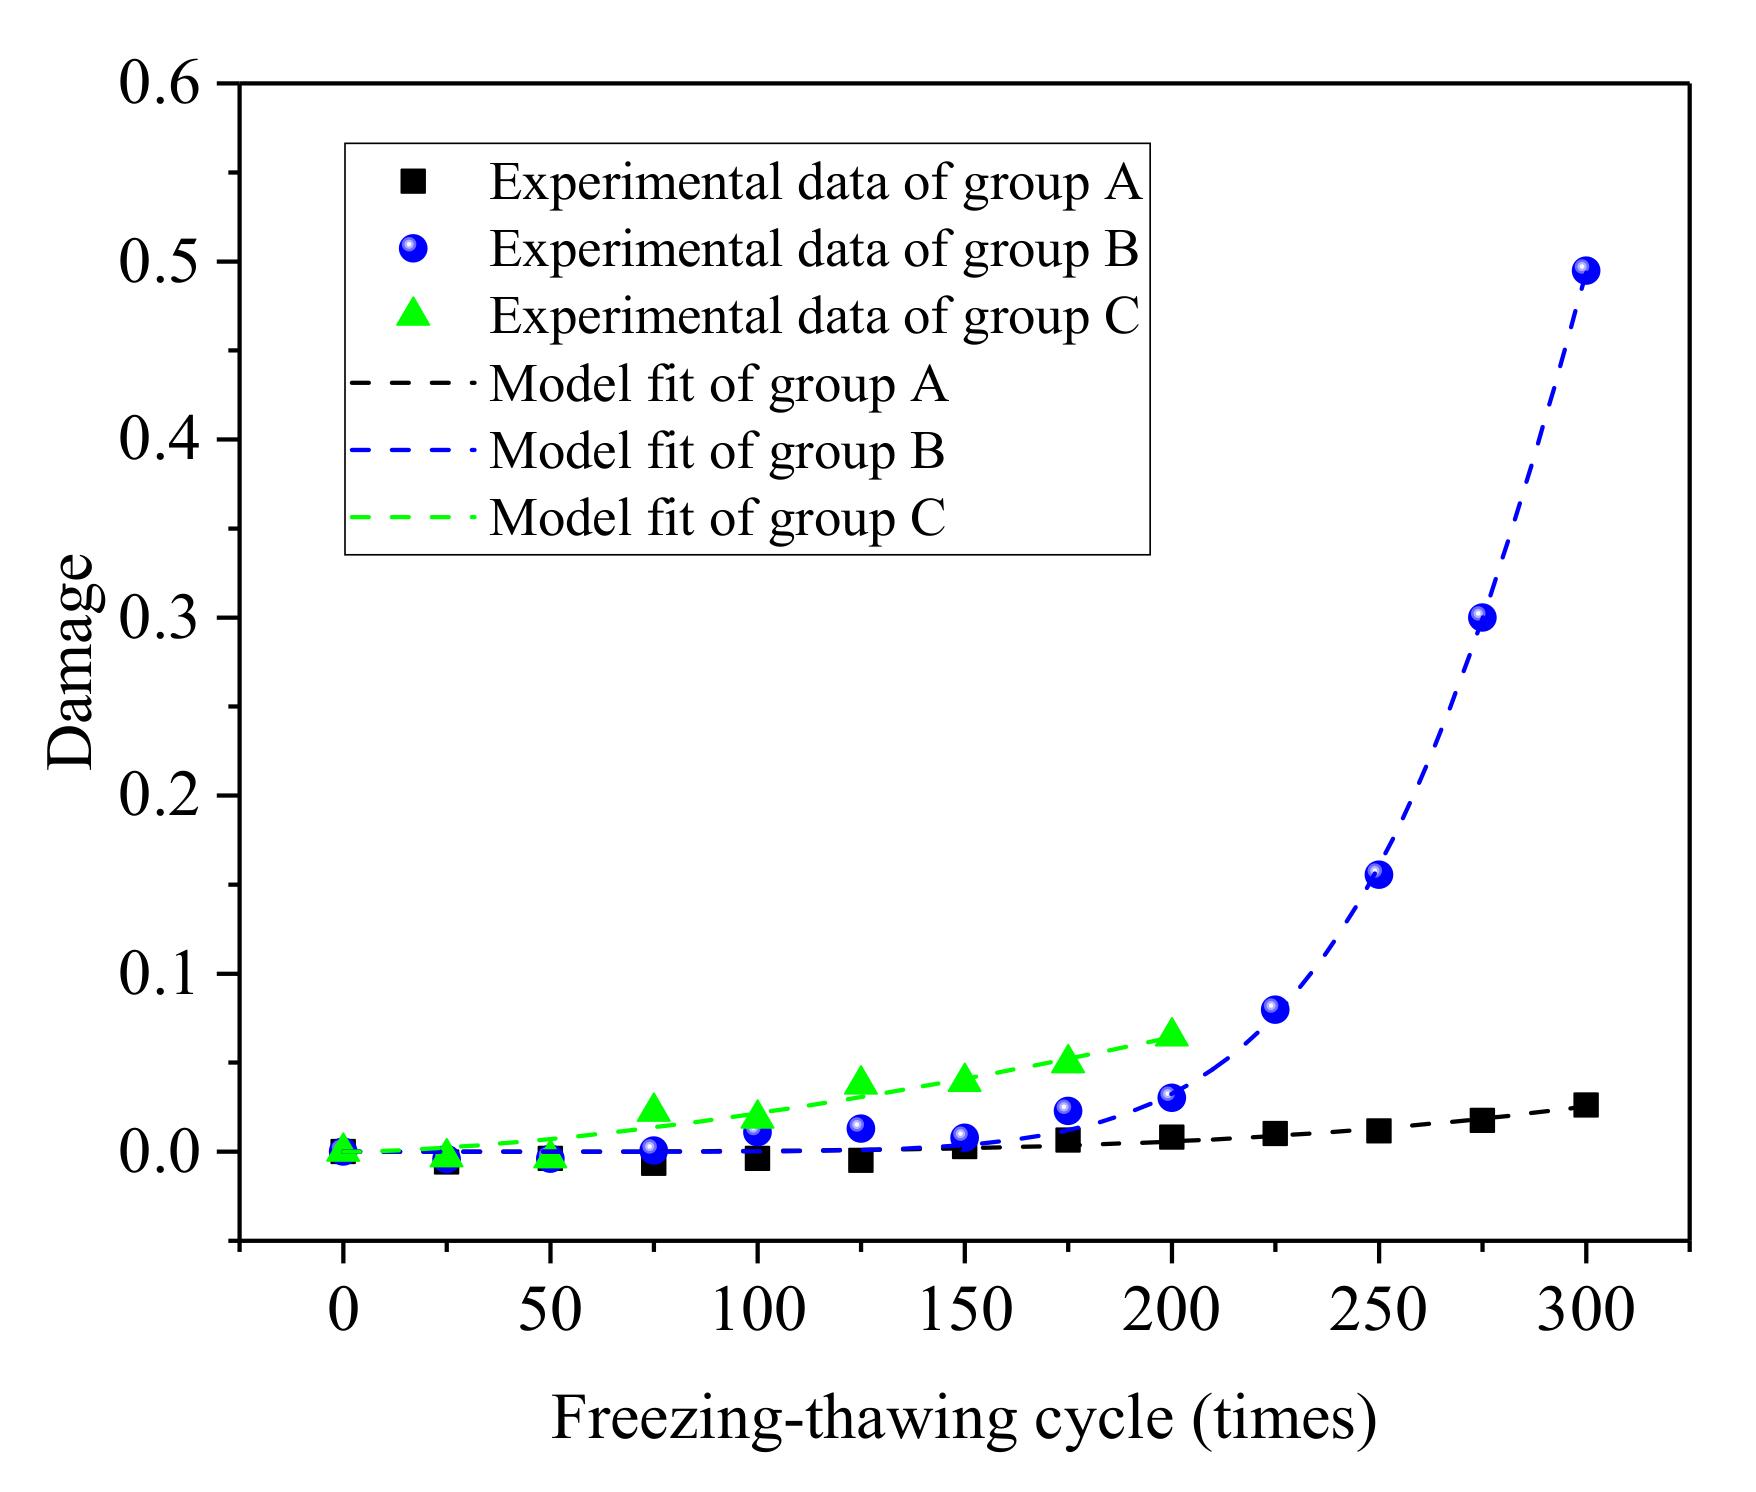
4.1. Construction of Damage Model
4.2. Damage Mechanism Analysis
5. Conclusions
- (1)
- Concrete surface experienced three stages of microcrack initiation, mortar peeling, and aggregate falling during the salt freezing-thawing cycles. The mass loss rate decreases in the beginning and then increases in the process of chlorine salt erosion and freezing–thawing, and the smaller the concrete size, the greater the mass loss rate.
- (2)
- The relative dynamic modulus of elasticity decreases gradually, slowly at the initial stage and then at a faster rate, and the compressive strength loss rate increases gradually. Comprehensive analysis showed that the frost resistance of concrete is negatively related to the water-cement ratio when the freezing–thawing cycle is fixed.
- (3)
- The evolution of concrete micro-structure during the salt freezing–thawing cycles can be quantified by CT technology. The pore quantity, porosity, and volume loss rate of concrete increase in a fluctuating manner, whereas the relative CT value decreases. The peeling depth of the concrete surface increased gradually. The higher the water-cement ratio is, the greater the change of micro-structure will be.
- (4)
- The damage model was established with relative CT value as the damage variable, and the model could better reflect the freezing–thawing damage degree of concrete with different water cement ratios, and the damage evolution process could be well described by the Weibull function.
Author Contributions
Funding
Institutional Review Board Statement
Informed Consent Statement
Data Availability Statement
Conflicts of Interest
References
- Bhardwaj, B.; Kumar, P. Waste foundry sand in concrete: A review. Constr. Build. Mater. 2017, 156, 661–674. [Google Scholar] [CrossRef]
- Tam, V.W.; Soomro, M.; Evangelista, A.C.J. A review of recycled aggregate in concrete applications (2000–2017). Constr. Build. Mater. 2018, 172, 272–292. [Google Scholar] [CrossRef]
- Demis, S.; Papadakis, V.G. Durability design process of reinforced concrete structures-Service life estimation, problems and perspectives. J. Build. Eng. 2019, 26, 100876. [Google Scholar] [CrossRef]
- Jiang, L.; Niu, D.; Yuan, L.; Fei, Q. Durability of concrete under sulfate attack exposed to freeze–thaw cycles. Cold. Reg. Sci. Technol. 2015, 112, 112–117. [Google Scholar] [CrossRef]
- Kim, A.Y.J.; Yoon, D.K. Identifying critical sources of bridge deterioration in cold regions through the constructed bridges in North Dakota. J. Bridge Eng. 2010, 15, 542–552. [Google Scholar] [CrossRef]
- Li, X.; Wang, W.; Zhu, Z.; Zheng, K. Investigation on durability behaviour and optimization of concrete with triple-admixtures subjected to freeze-thaw cycles in salt solution. Adv. Mater. Sci. Eng. 2021, 2021, 5572011. [Google Scholar]
- Zhang, F.; Hu, Z.P.; Wei, F.; Wen, X.; Li, X.G.; Dai, L.; Liu, L. Study on Concrete Deterioration in Different NaCl-Na2SO4 Solutions and the Mechanism of Cl− Diffusion. Materials 2021, 14, 5054. [Google Scholar] [CrossRef] [PubMed]
- Vélez, W.; Matta, F.; Ziehl, P. Electrochemical characterization of early corrosion in prestressed concrete exposed to salt water. Mater. Struct. 2016, 49, 507–520. [Google Scholar] [CrossRef]
- Shen, Y.J.; Wang, Y.; Wei, X.; Jia, H.L.; Yan, R.X. Investigation on meso-debonding process of the–concrete interface induced by freeze–thaw cycles using NMR technology. Constr. Build. Mater. 2020, 252, 118962. [Google Scholar] [CrossRef]
- Heidari, M.; Torabi-Kaveh, M.; Mohseni, H. Assessment of the effects of freeze–thaw and salt crystallization ageing tests on Anahita Temple Stone, Kangavar, West of Iran. Geotech. Geol. Eng. 2017, 35, 121–136. [Google Scholar] [CrossRef]
- Wang, J.B.; Niu, D.T. Influence of freeze–thaw cycles and sulfate corrosion resistance on shotcrete with and without steel fiber. Constr. Build. Mater. 2016, 122, 628–636. [Google Scholar] [CrossRef]
- Li, B.; Yin, H.; Mao, X.; Li, Y.; Zhang, L.; Liu, R.; Qiu, P. Macroscopic and microscopic fracture features of concrete used in coal mine under chlorine salt erosion. Int. J. Min. Sci. Technol. 2016, 26, 455–459. [Google Scholar] [CrossRef]
- Koga, G.Y.; Comperat, P.; Albert, B.; Roche, V.; Nogueira, R.P. Electrochemical responses and chloride ingress in reinforced Belite-Ye’elimite-Ferrite (BYF) cement matrix exposed to exogenous salt sources. Corros. Sci. 2020, 166, 108469. [Google Scholar] [CrossRef]
- Mangi, S.A.; Ibrahim, M.H.W.; Jamaluddin, N.; Arshad, M.F.; Jaya, R.P. Short-term effects of sulphate and chloride on the concrete containing coal bottom ash as supplementary cementitious material. Eng. Sci. Technol. 2019, 22, 515–522. [Google Scholar] [CrossRef]
- Gong, F.; Sicat, E.; Zhang, D.; Ueda, T. Stress analysis for concrete materials under multiple freeze-thaw cycles. J. Adv. Concr. Technol. 2015, 13, 124–134. [Google Scholar] [CrossRef] [Green Version]
- Qiu, J.S.; Zhou, Y.; Vatin, N.I.; Guan, X.; Sultanov, S.; Khemarak, K. Damage constitutive model of coal gangue concrete under freeze-thaw cycles. Constr. Build. Mater. 2020, 264, 120720. [Google Scholar] [CrossRef]
- Shakiba, M.; Rahgozar, P.; Elahi, A.R.; Rahgozar, R. Effect of activated pozzolan with Ca (OH)2 and nano-SiO2 on microstructure and hydration of high-volume natural pozzolan paste. Civ. Eng. J. 2018, 4, 2437–2449. [Google Scholar] [CrossRef] [Green Version]
- Liu, F.; Zhang, T.; Luo, T.; Zhou, M.; Ma, W.; Zhang, K. The effects of Nano-SiO2 and Nano-TiO2 addition on the durability and deterioration of concrete subject to freezing and thawing cycles. Materials 2019, 12, 3608. [Google Scholar] [CrossRef] [PubMed] [Green Version]
- An, M.; Wang, Y.; Yu, Z. Damage mechanisms of ultra-high-performance concrete under freeze–thaw cycling in salt solution considering the effect of rehydration. Constr. Build. Mater. 2019, 198, 546–552. [Google Scholar] [CrossRef]
- Skripkiūnas, G.; Nagrockienė, D.; Girskas, G.; Vaičienė, M.; Baranauskaitė, E. The cement type effect on freeze–thaw and deicing salt resistance of concrete. Procedia. Eng. 2013, 57, 1045–1051. [Google Scholar] [CrossRef] [Green Version]
- Yu, H.F.; Ma, H.X.; Yan, K. An equation for determining freeze-thaw fatigue damage in concrete and a model for predicting the service life. Constr. Build. Mater. 2017, 137, 104–116. [Google Scholar] [CrossRef]
- Amini, B.; Tehrani, S.S. Simultaneous effects of salted water and water flow on asphalt concrete pavement deterioration under freeze–thaw cycles. Int. J. Pavement. Eng. 2014, 15, 383–391. [Google Scholar] [CrossRef]
- Özgan, E.; Serin, S. Investigation of certain engineering characteristics of asphalt concrete exposed to freeze–thaw cycles. Cold. Reg. Sci. Technol. 2013, 85, 131–136. [Google Scholar] [CrossRef]
- Medina, C.; de Rojas, M.I.S.; Frías, M. Freeze-thaw durability of recycled concrete containing ceramic aggregate. J. Clean. Prod. 2013, 40, 151–160. [Google Scholar] [CrossRef]
- Tanesi, J.; Meininger, R. Freeze-thaw resistance of concrete with marginal air content. Transport. Res. Rec. 2007, 2020, 61–66. [Google Scholar] [CrossRef] [Green Version]
- Henry, M.; Hashimoto, K.; Darma, I.S.; Sugiyama, T. Cracking and chemical composition of cement paste subjected to heating and water re-curing. J. Adv. Concr. Technol. 2016, 14, 134–143. [Google Scholar] [CrossRef] [Green Version]
- Suzuki, T.; Shimamoto, Y. On-site damage evaluation of cracked irrigation infrastructure by acoustic emission and related nondestructive elastic wave method. Paddy. Water. Environ. 2019, 17, 315–321. [Google Scholar] [CrossRef]
- JGJ 52. Standard for Technical Requirements and Test Method of Sand and Crushed Stone (or Gravel) for Ordinary Concrete; China Architecture & Building Press: Beijing, China, 2006.
- GB/T 50081, Standard for Test Method of Mechanical Properties on Ordinary Concrete; China Architecture & Building Press: Beijing, China, 2003.
- GB/T 50082-2009, Standard for Test Methods of Long-Term Performance and Durability of Ordinary Concrete; China Architecture & Building Press: Beijing, China, 2009.
- Yang, Q.B. One of mechanisms on the deicer-frost scaling of concrete (Ⅱ):turation and ice-formation pressure during freezing-thawing cycles. J. Build. Mater. 2012, 15, 741–746. [Google Scholar]
- Baltazar-Zamora, M.A.; Bastidas, M.D.; Santiago-Hurtado, G.; Mendoza-Rangel, J.M.; Gaona-Tiburcio, C.; Bastidas, J.M.; Almeraya-Calderón, F. Effect of silica fume and fly ash admixtures on the corrosion behavior of AISI 304 embedded in concrete exposed in 3.5% NaCl solution. Materials 2019, 12, 4007. [Google Scholar] [CrossRef] [Green Version]
- Sun, L.F.; Jiang, K.; Zhu, X.; Xu, L. An alternating experimental study on the combined effect of freeze-thaw and chloride penetration in concrete. Constr. Build. Mater. 2020, 252, 119025. [Google Scholar] [CrossRef]
- Geng, J.; Diao, B.; Chen, S.G. Degradation mechanism of air-entrained concrete under alternative actions of freeze-thaw cycles and seawater immersion. J. B. Univ. Aeronaut. Astronaut. 2013, 39, 1392–1396. [Google Scholar]
- Akin, S.; Kovscek, A.R. Computed tomography in petroleum engineering research. Geo. Soc. London Special Pub. 2003, 215, 23–38. [Google Scholar] [CrossRef]
- Ao, B.; Zhang, D.H.; Zhao, X.B.; Xu, X.G. Theory analysis of crack defect in ct image. Comput. Tomogr. Theory Appl. 2005, 14, 12–18. [Google Scholar]
- Niu, D.T.; Xiao, Q.H. Analysis of cumulative damage characteristics and life prediction for the concrete in freezing-thawing circumstance. J. Xi’an Univ. Archit. Technol: Nat. Sci. Ed. 2010, 42, 319–322. [Google Scholar]
- Zhu, J.J.; Gao, J.M.; Chen, F.; He, Z.Z. Corrosion mechanism of cement mortars partially immersed in combined NaCl-Na2SO4 solution. J. Southeast U Nat. Sci. Ed. 2019, 49, 964–972. [Google Scholar]
- Xing, B.Y.; Cheng, P.Y.; Tang, J.P.; Xie, E.H.; Zeng, Q.; Zhou, C.S. Pore structure evolution of water-saturated mortar under freeze-thaw cycles. J. Chin. Ceram. Soc. 2021, 49, 331–339. [Google Scholar]
- Han, J.W.; Yan, C.C.; Hu, W.L.; Zhu, S.R.; Yan, S.L. Pores evolution and characterization of hardened cement mortar with different water/cement ratios under capillary suction of deicing solution freeze-thaw action. J. Chin. Ceram. Soc. 2020, 48, 1842–1851. [Google Scholar]


| Initial/Final Setting Time (min) | Density (g/cm3) | Specific Surface Area (m2/kg) | Standard Consistency Water Consumption (%) | Flexural Strength (MPa) | Compressive Strength (MPa) | ||
|---|---|---|---|---|---|---|---|
| 3d | 28d | 3d | 28d | ||||
| 65/260 | 3.05 | 358 | 28.8 | 5.6 | 8.6 | 29.5 | 51.0 |
| Samples | Water–Cement Ratio | Cement (kg/m3) | Sand (kg/m3) | Gravel (kg/m3) | Water (kg/m3) | 7d Compressive Strength (MPa) | 28d Compressive Strength (MPa) |
|---|---|---|---|---|---|---|---|
| A | 0.35 | 571 | 600 | 1160 | 200 | 29.8 | 50.5 |
| B | 0.45 | 444 | 620 | 1200 | 200 | 25.8 | 39.2 |
| C | 0.55 | 364 | 670 | 1240 | 200 | 18.8 | 32.6 |
Publisher’s Note: MDPI stays neutral with regard to jurisdictional claims in published maps and institutional affiliations. |
© 2021 by the authors. Licensee MDPI, Basel, Switzerland. This article is an open access article distributed under the terms and conditions of the Creative Commons Attribution (CC BY) license (https://creativecommons.org/licenses/by/4.0/).
Share and Cite
Chen, S.; Ren, J.; Li, Y.; Ren, X.; Song, Y.; Sun, J. Macroscopic and Mesoscopic Deterioration Behaviors of Concrete under the Coupling Effect of Chlorine Salt Erosion and Freezing–Thawing Cycle. Materials 2021, 14, 6471. https://doi.org/10.3390/ma14216471
Chen S, Ren J, Li Y, Ren X, Song Y, Sun J. Macroscopic and Mesoscopic Deterioration Behaviors of Concrete under the Coupling Effect of Chlorine Salt Erosion and Freezing–Thawing Cycle. Materials. 2021; 14(21):6471. https://doi.org/10.3390/ma14216471
Chicago/Turabian StyleChen, Shaojie, Jianxi Ren, Yugen Li, Xiang Ren, Yongjun Song, and Jielong Sun. 2021. "Macroscopic and Mesoscopic Deterioration Behaviors of Concrete under the Coupling Effect of Chlorine Salt Erosion and Freezing–Thawing Cycle" Materials 14, no. 21: 6471. https://doi.org/10.3390/ma14216471