
Effects of Self-Lubricant Coating and Motion on Reduction of Friction and Wear of Mild Steel and Data Analysis from Machine Learning Approach

 ,
,
Abstract
:
1. Introduction
2. Methodology
2.1. Material Preparation
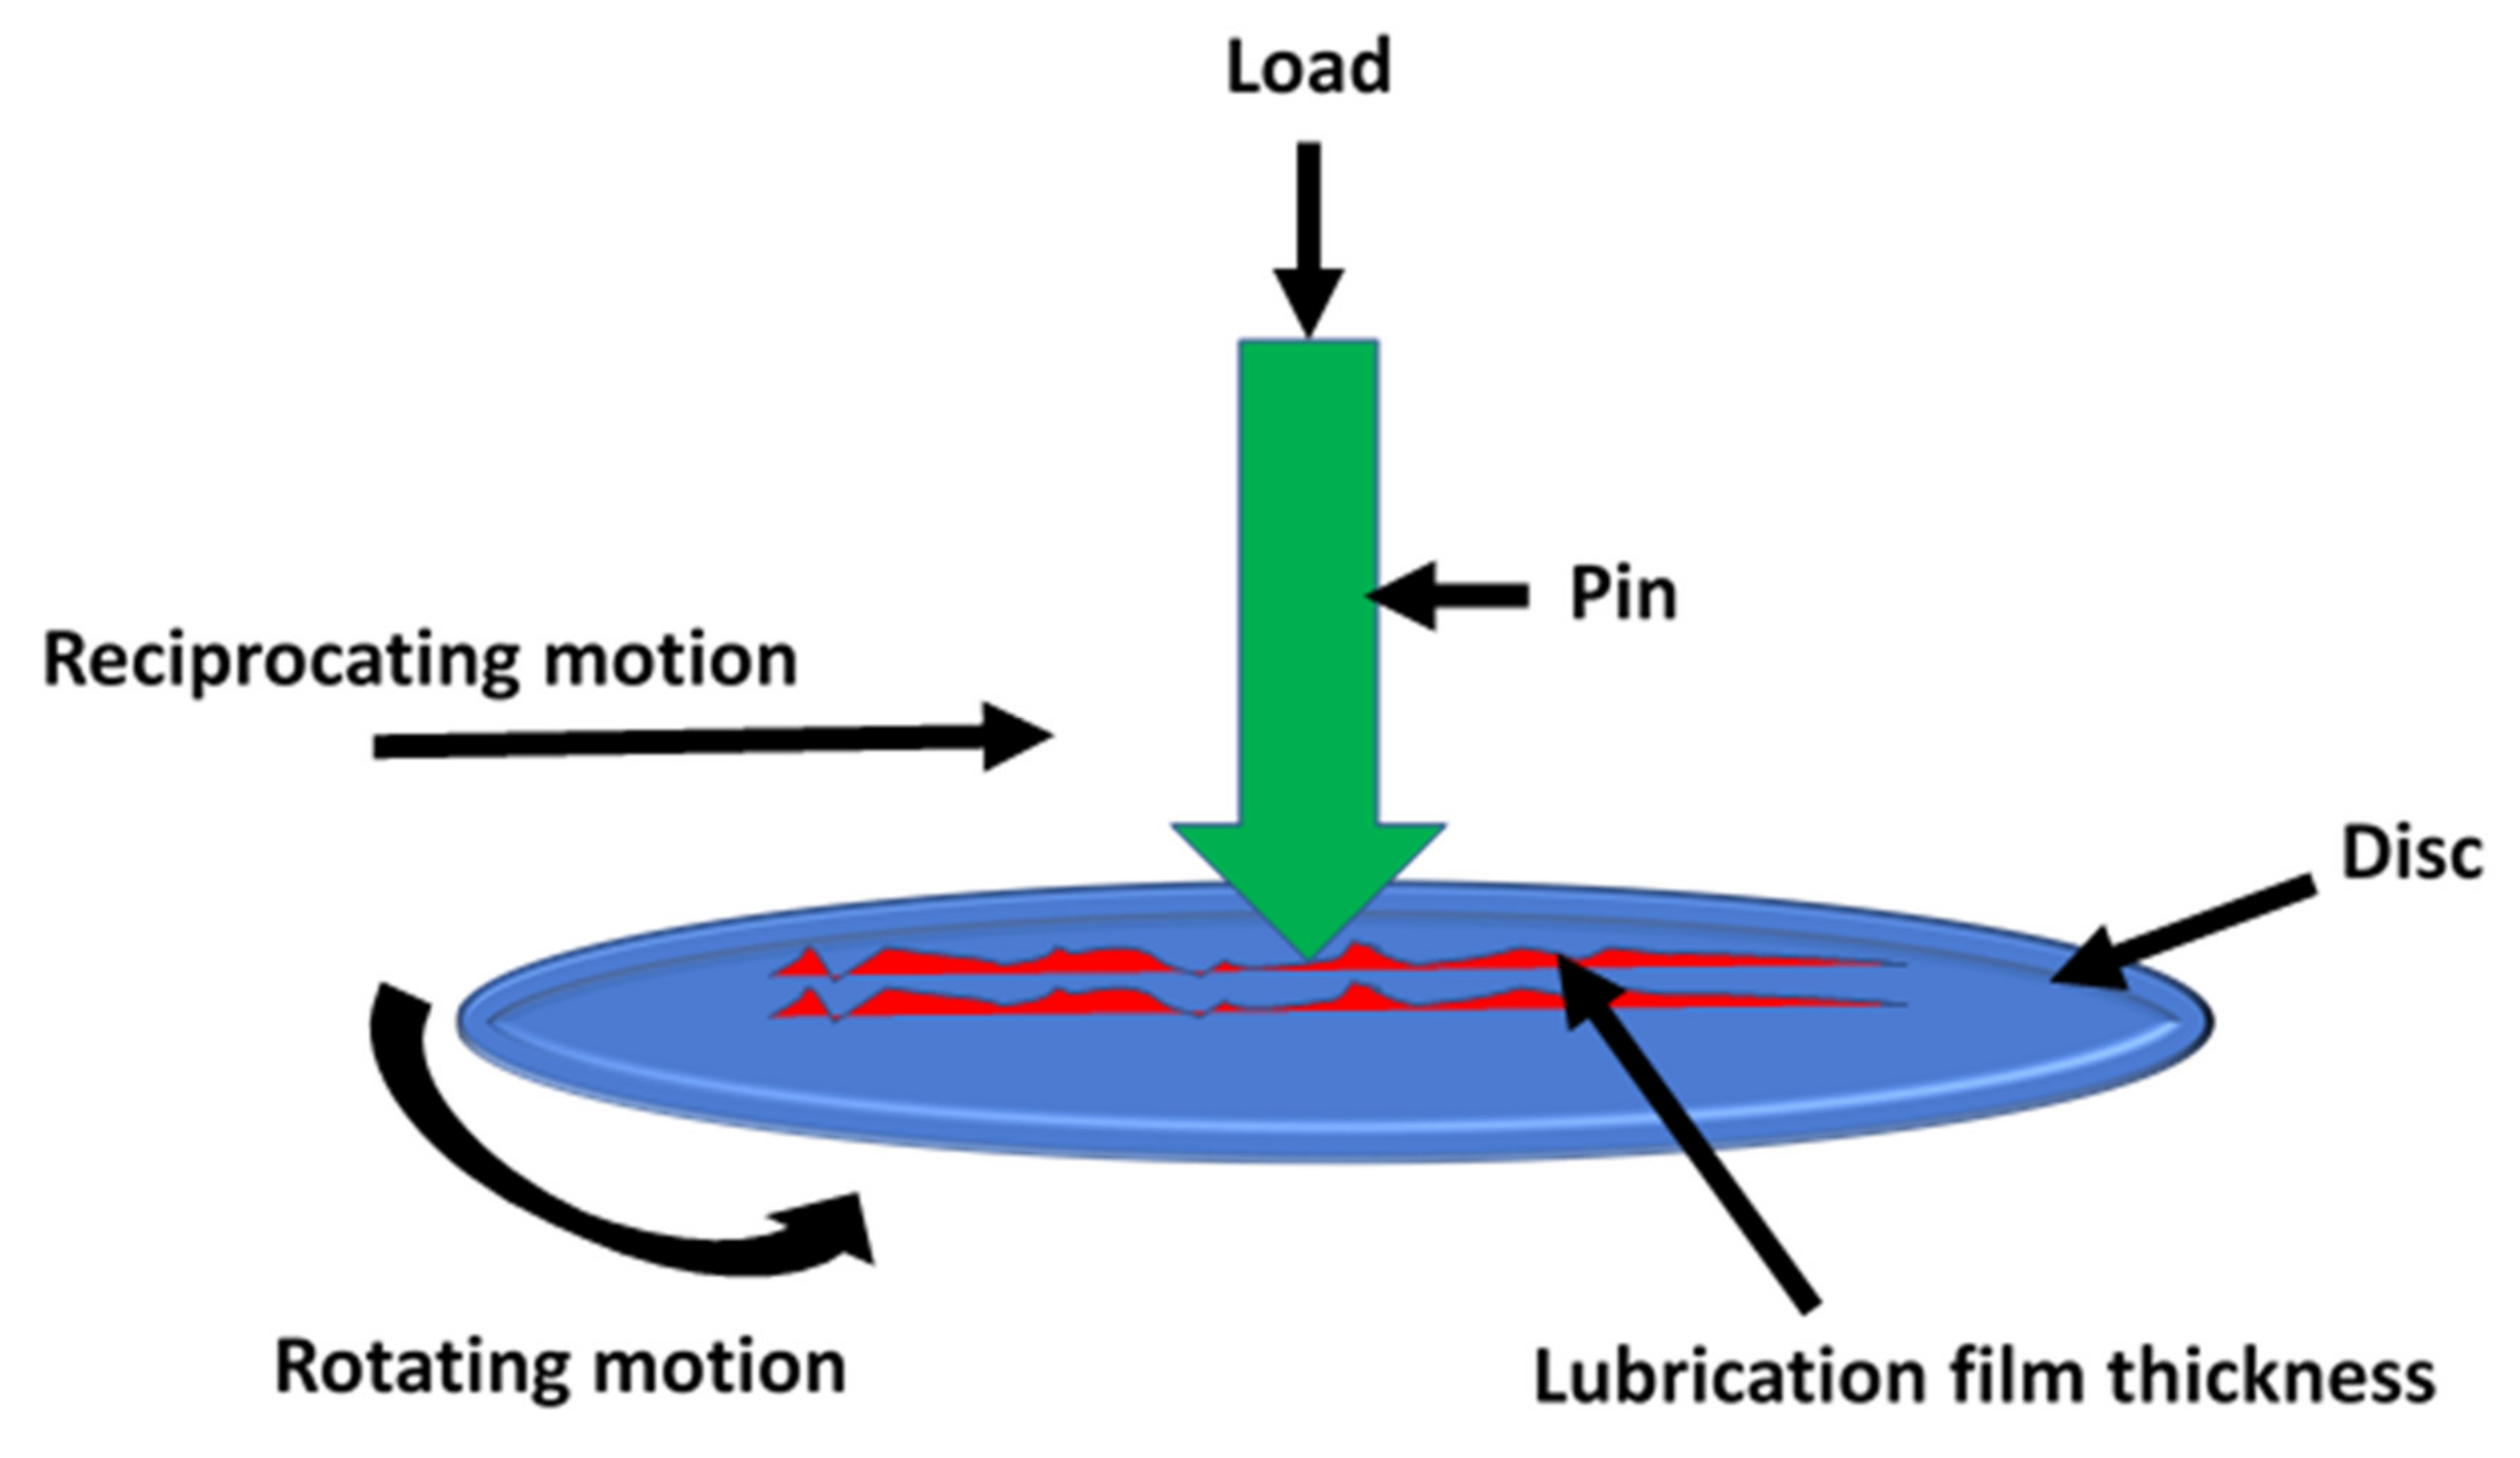
2.2. Experimental Procedure
2.3. Characterization Approaches
3. Results and Discussion
3.1. Analysis of the Coating Layer on the Material Investigated
3.1.1. Effects of Coating
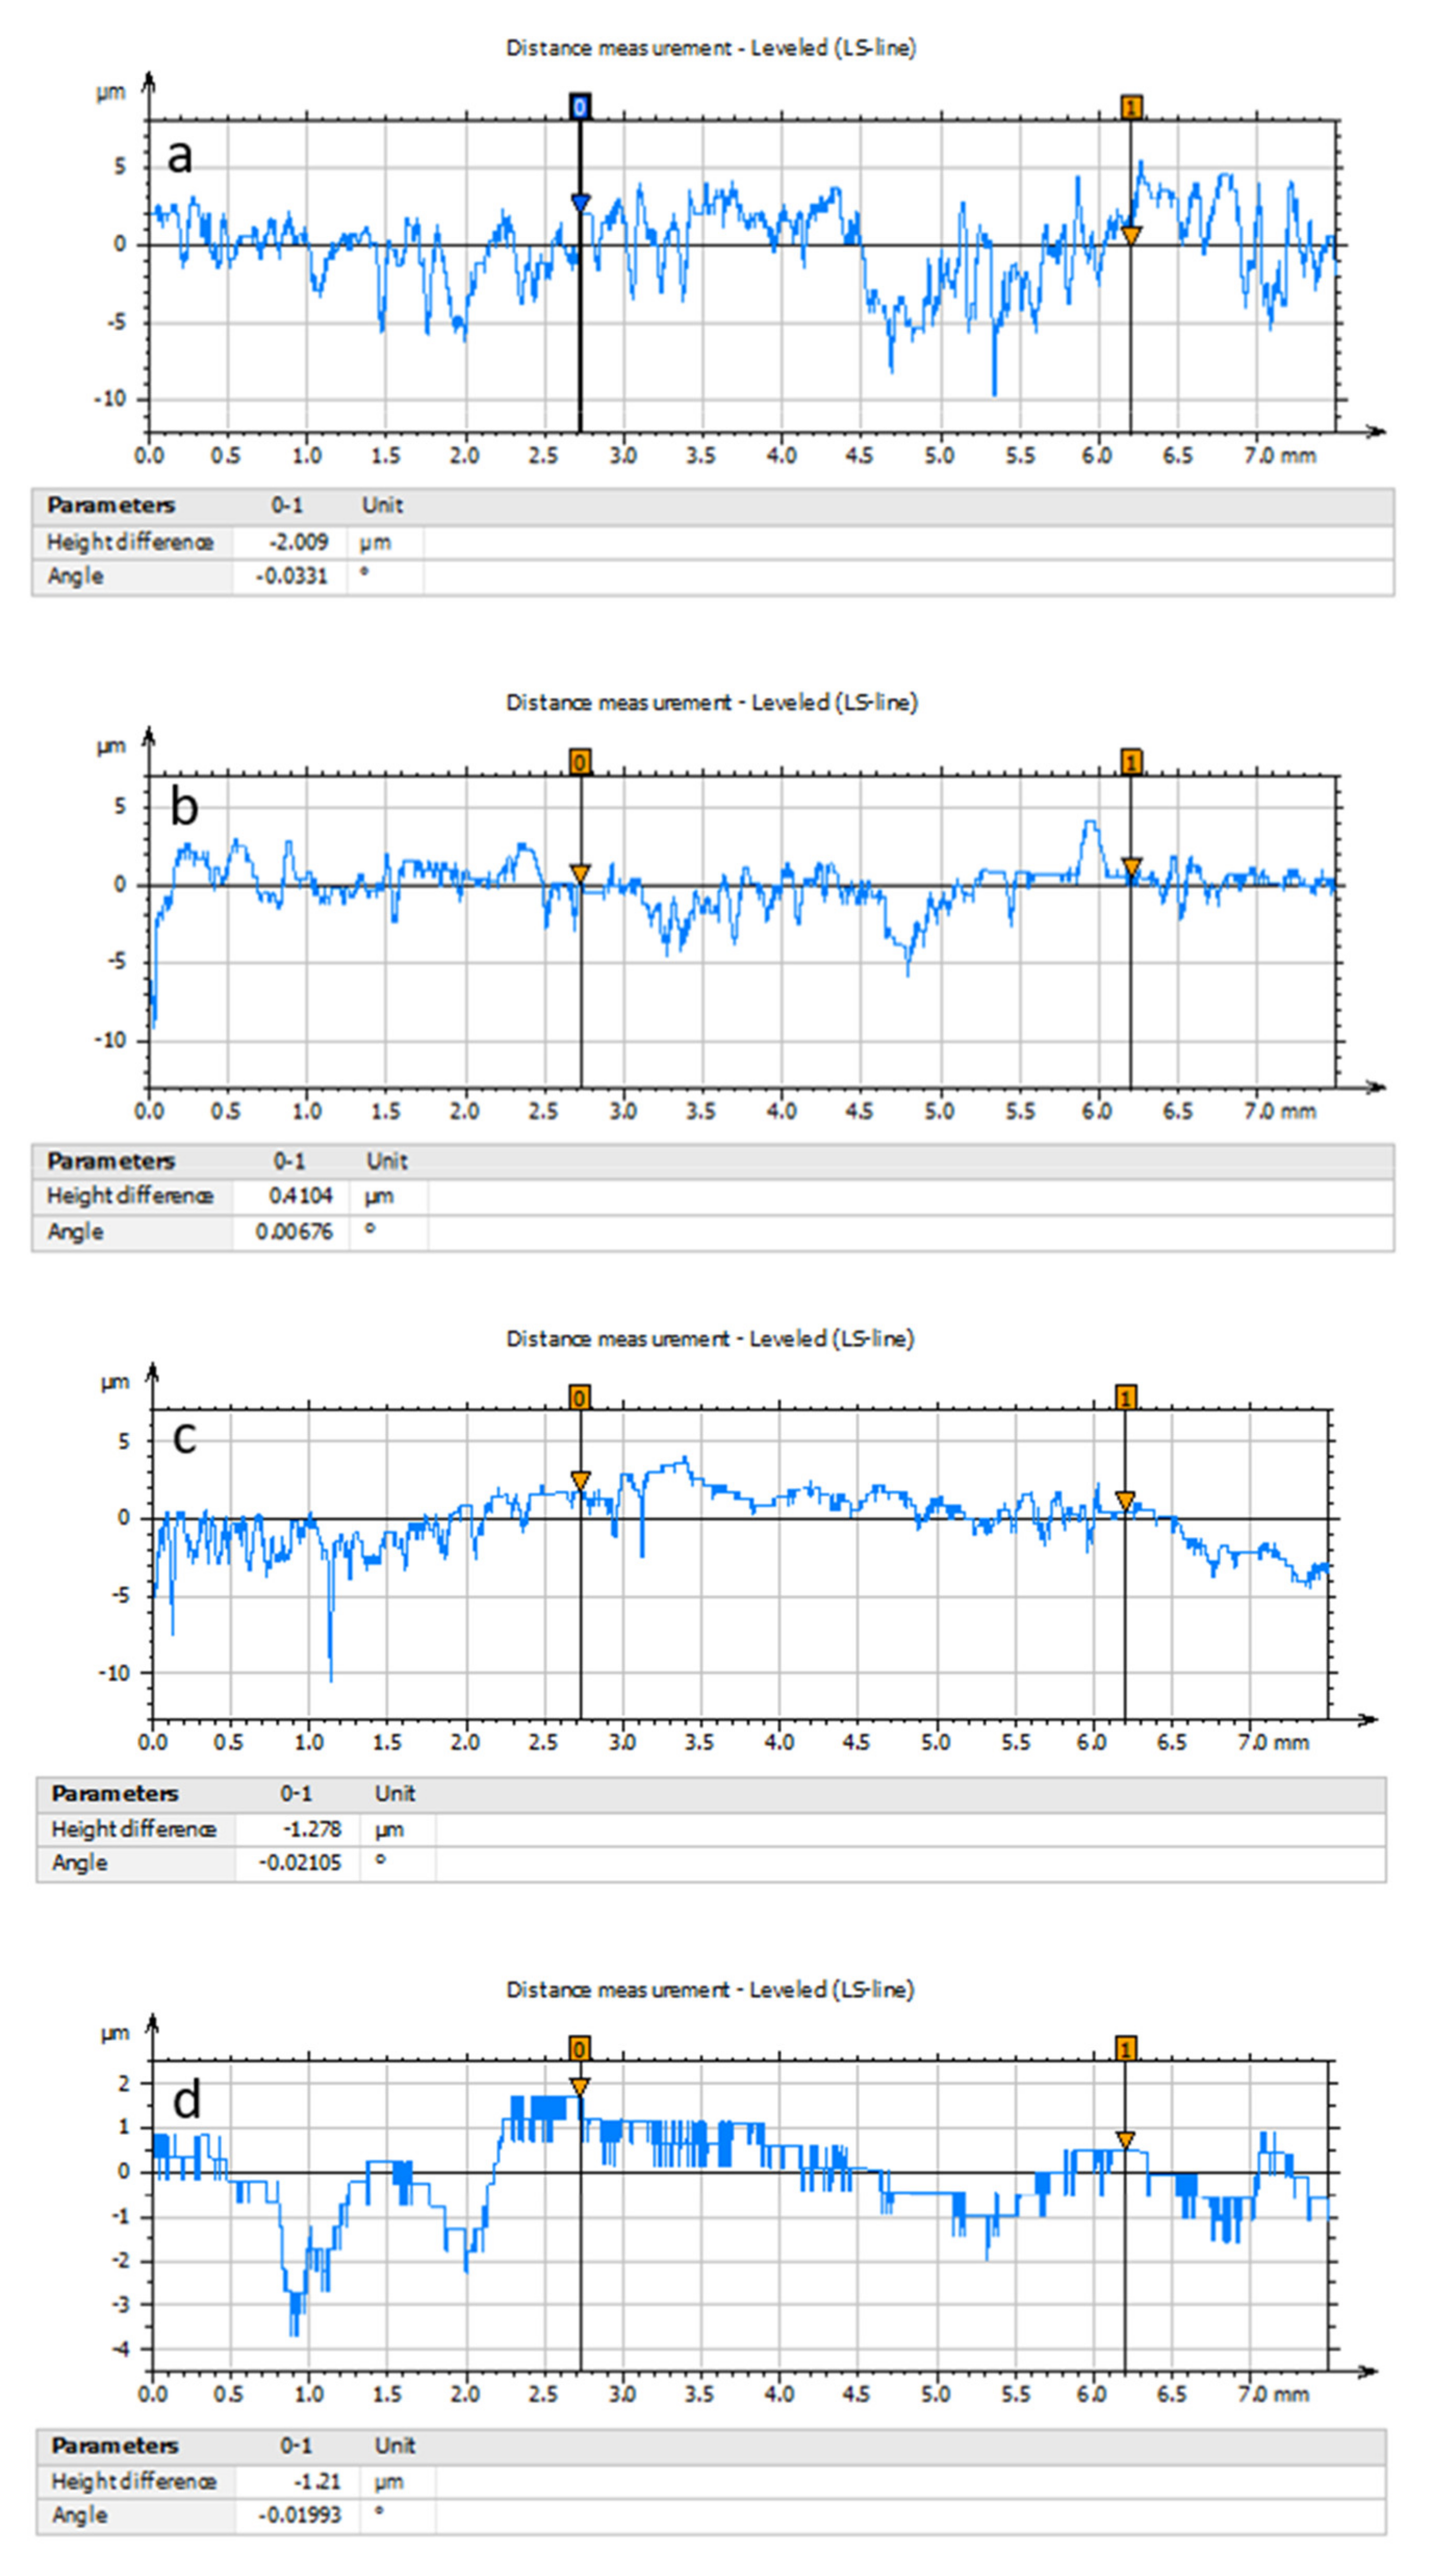
3.1.2. Roughness Variation of Coating Surface
3.1.3. Scanning Electron Microscopy Analysis of the Coated Sample
3.1.4. EDX of Coated Sample
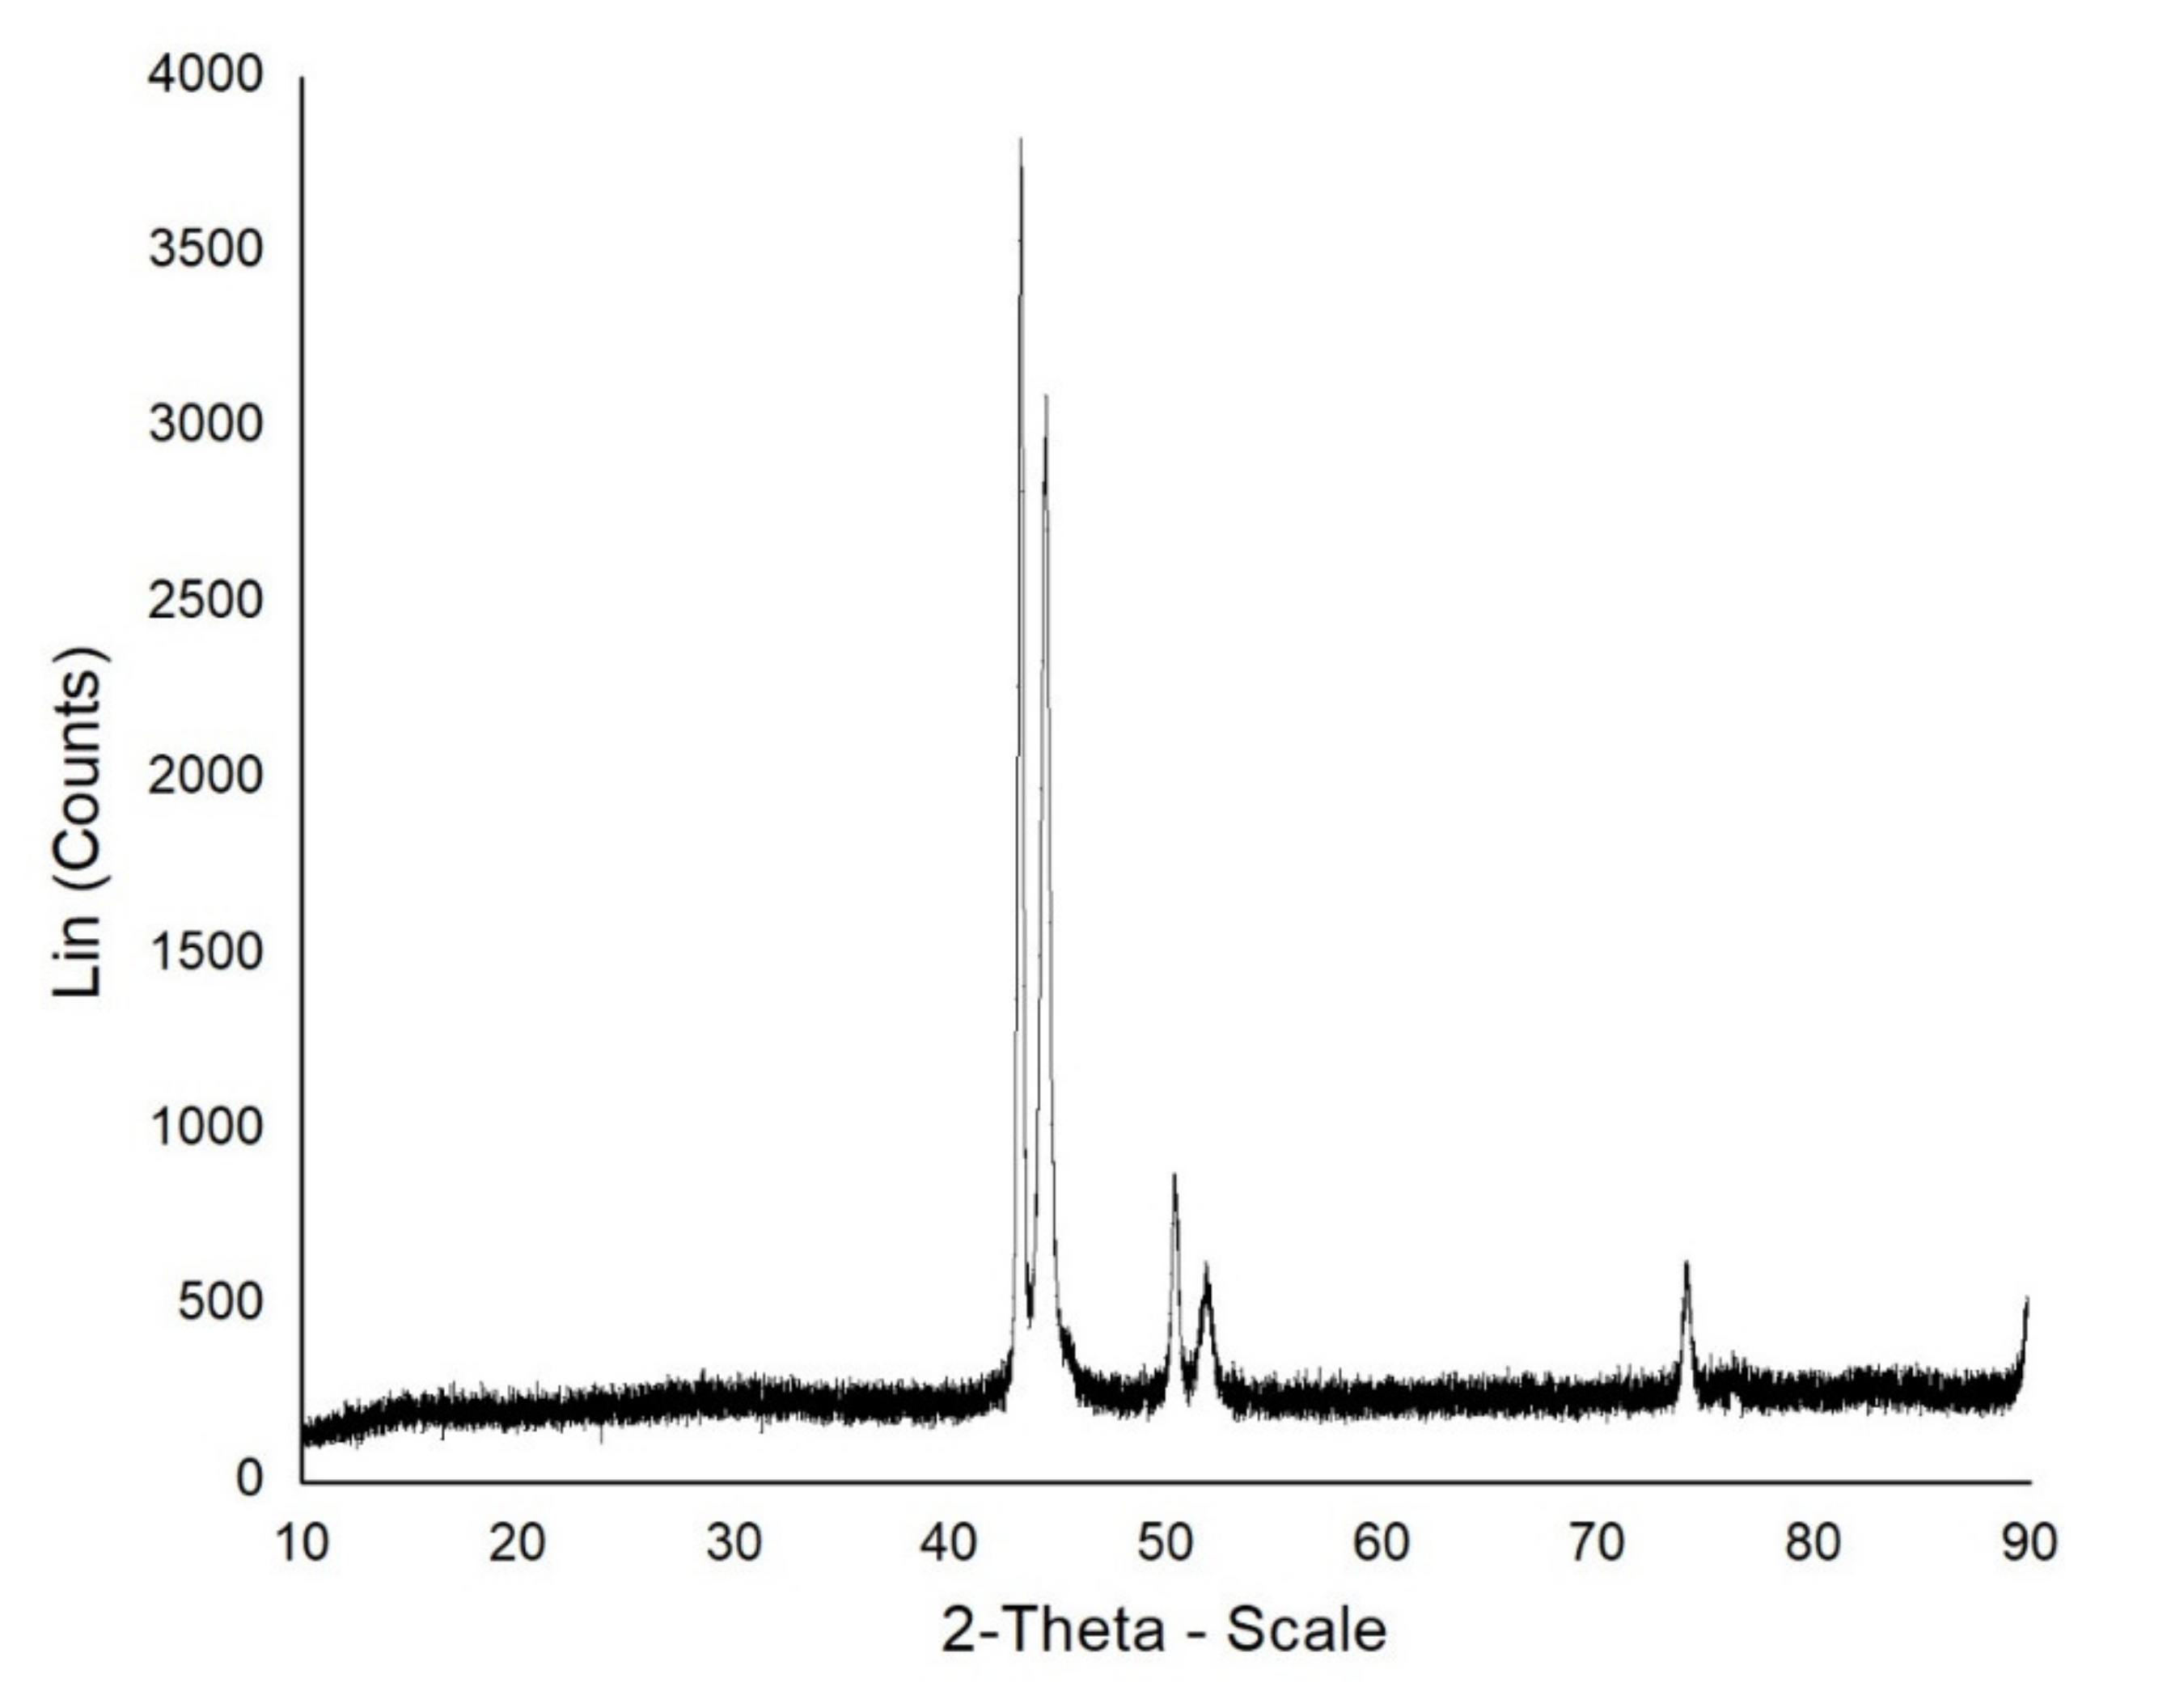
3.1.5. X-ray Diffraction Analysis of the Coated Sample
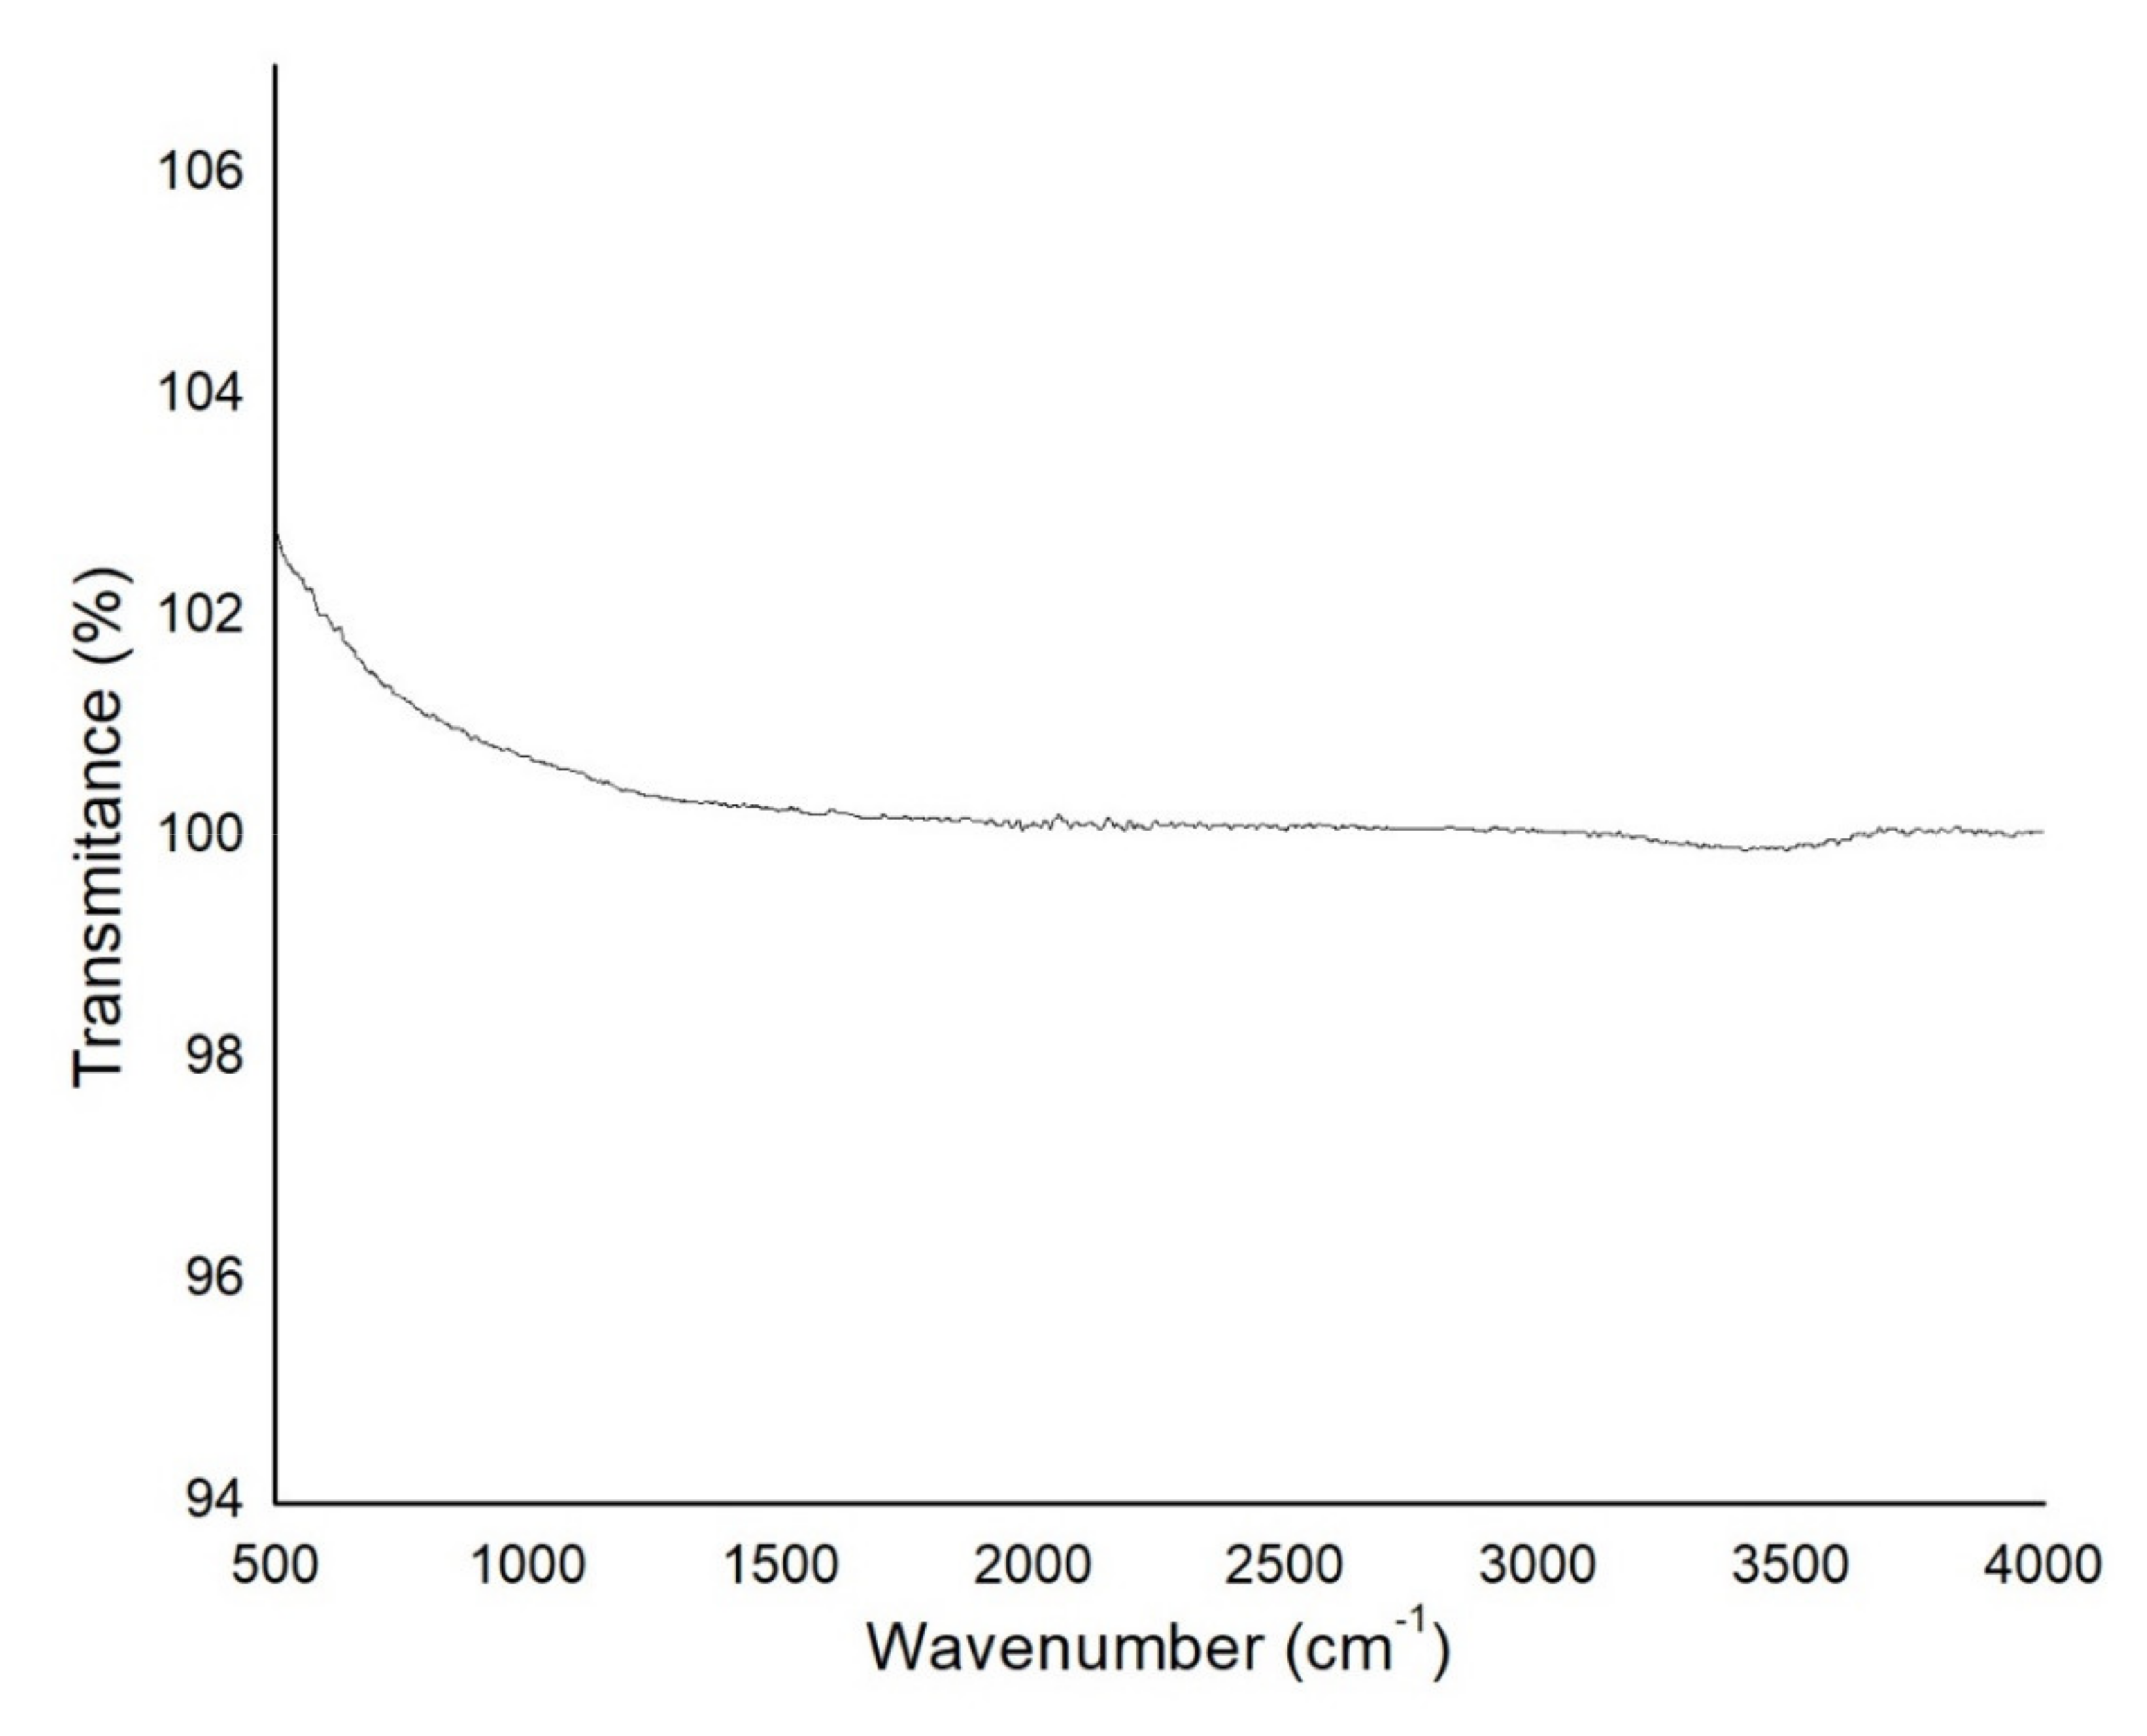
3.1.6. Fourier Transform Infrared Ray Analysis of the Coated Sample
3.1.7. Adhesiveness of the Coating
3.1.8. Modulus of Elasticity and Hardness Analysis
3.2. Lubricant Effect
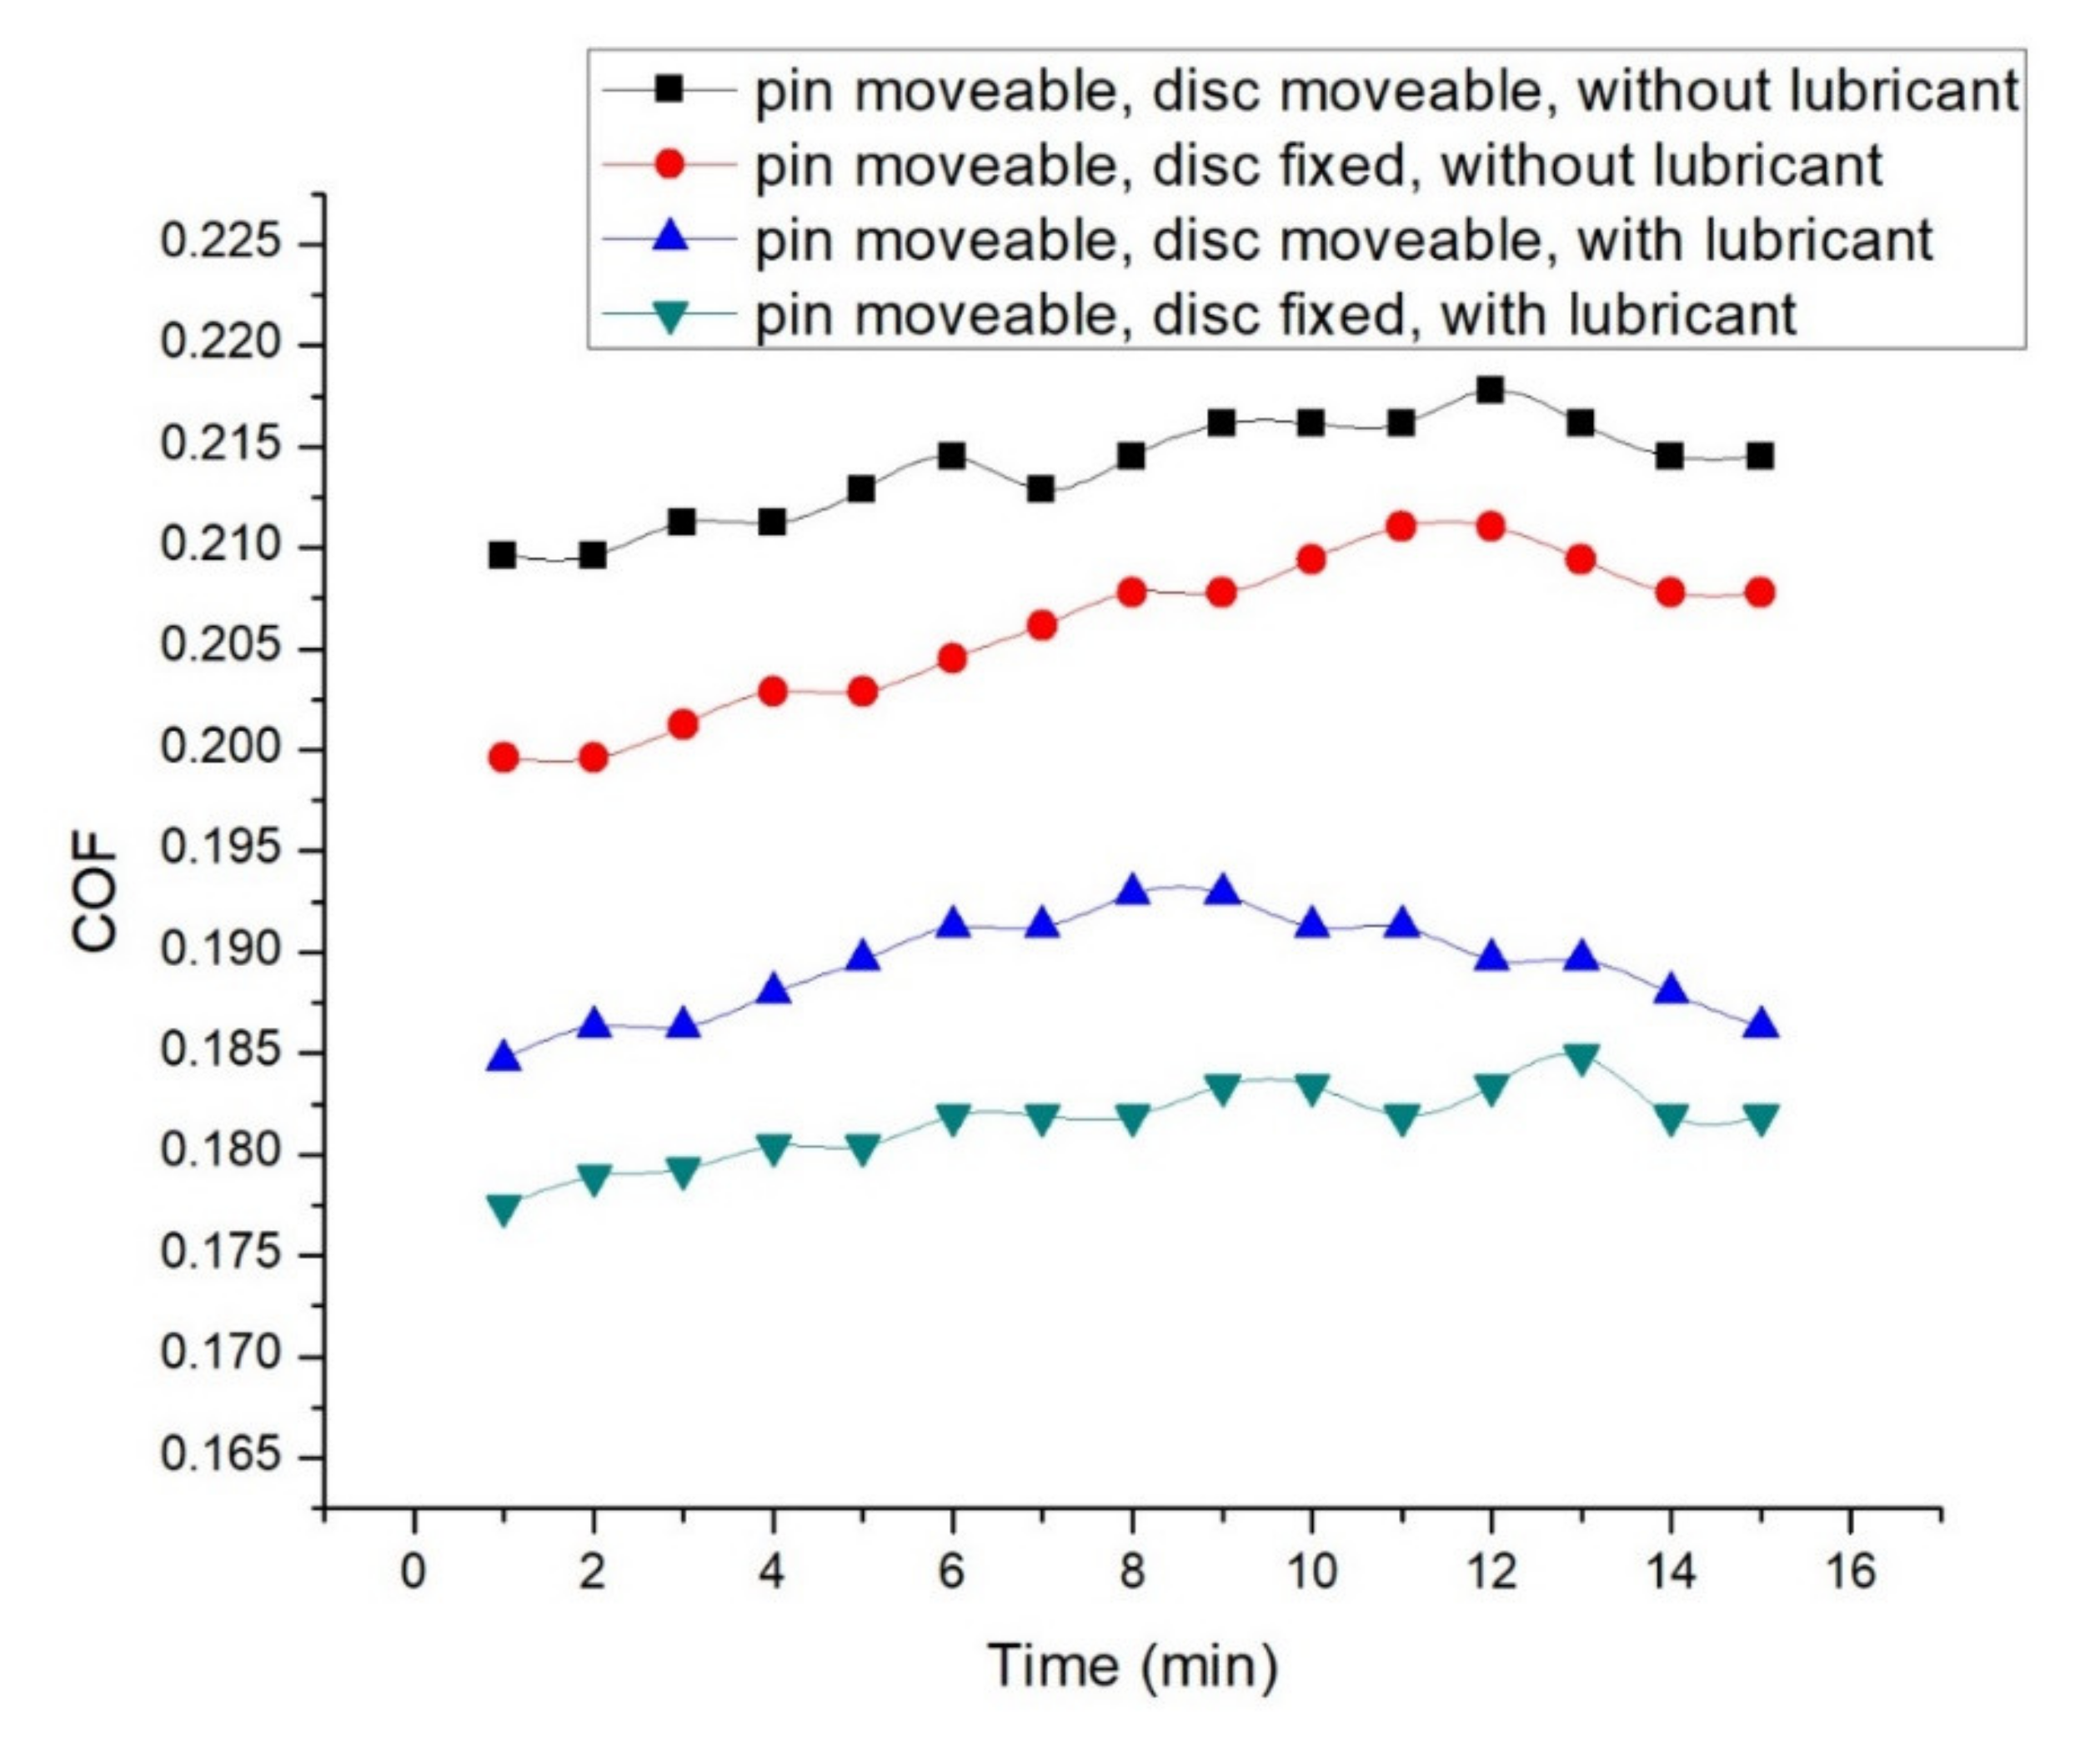
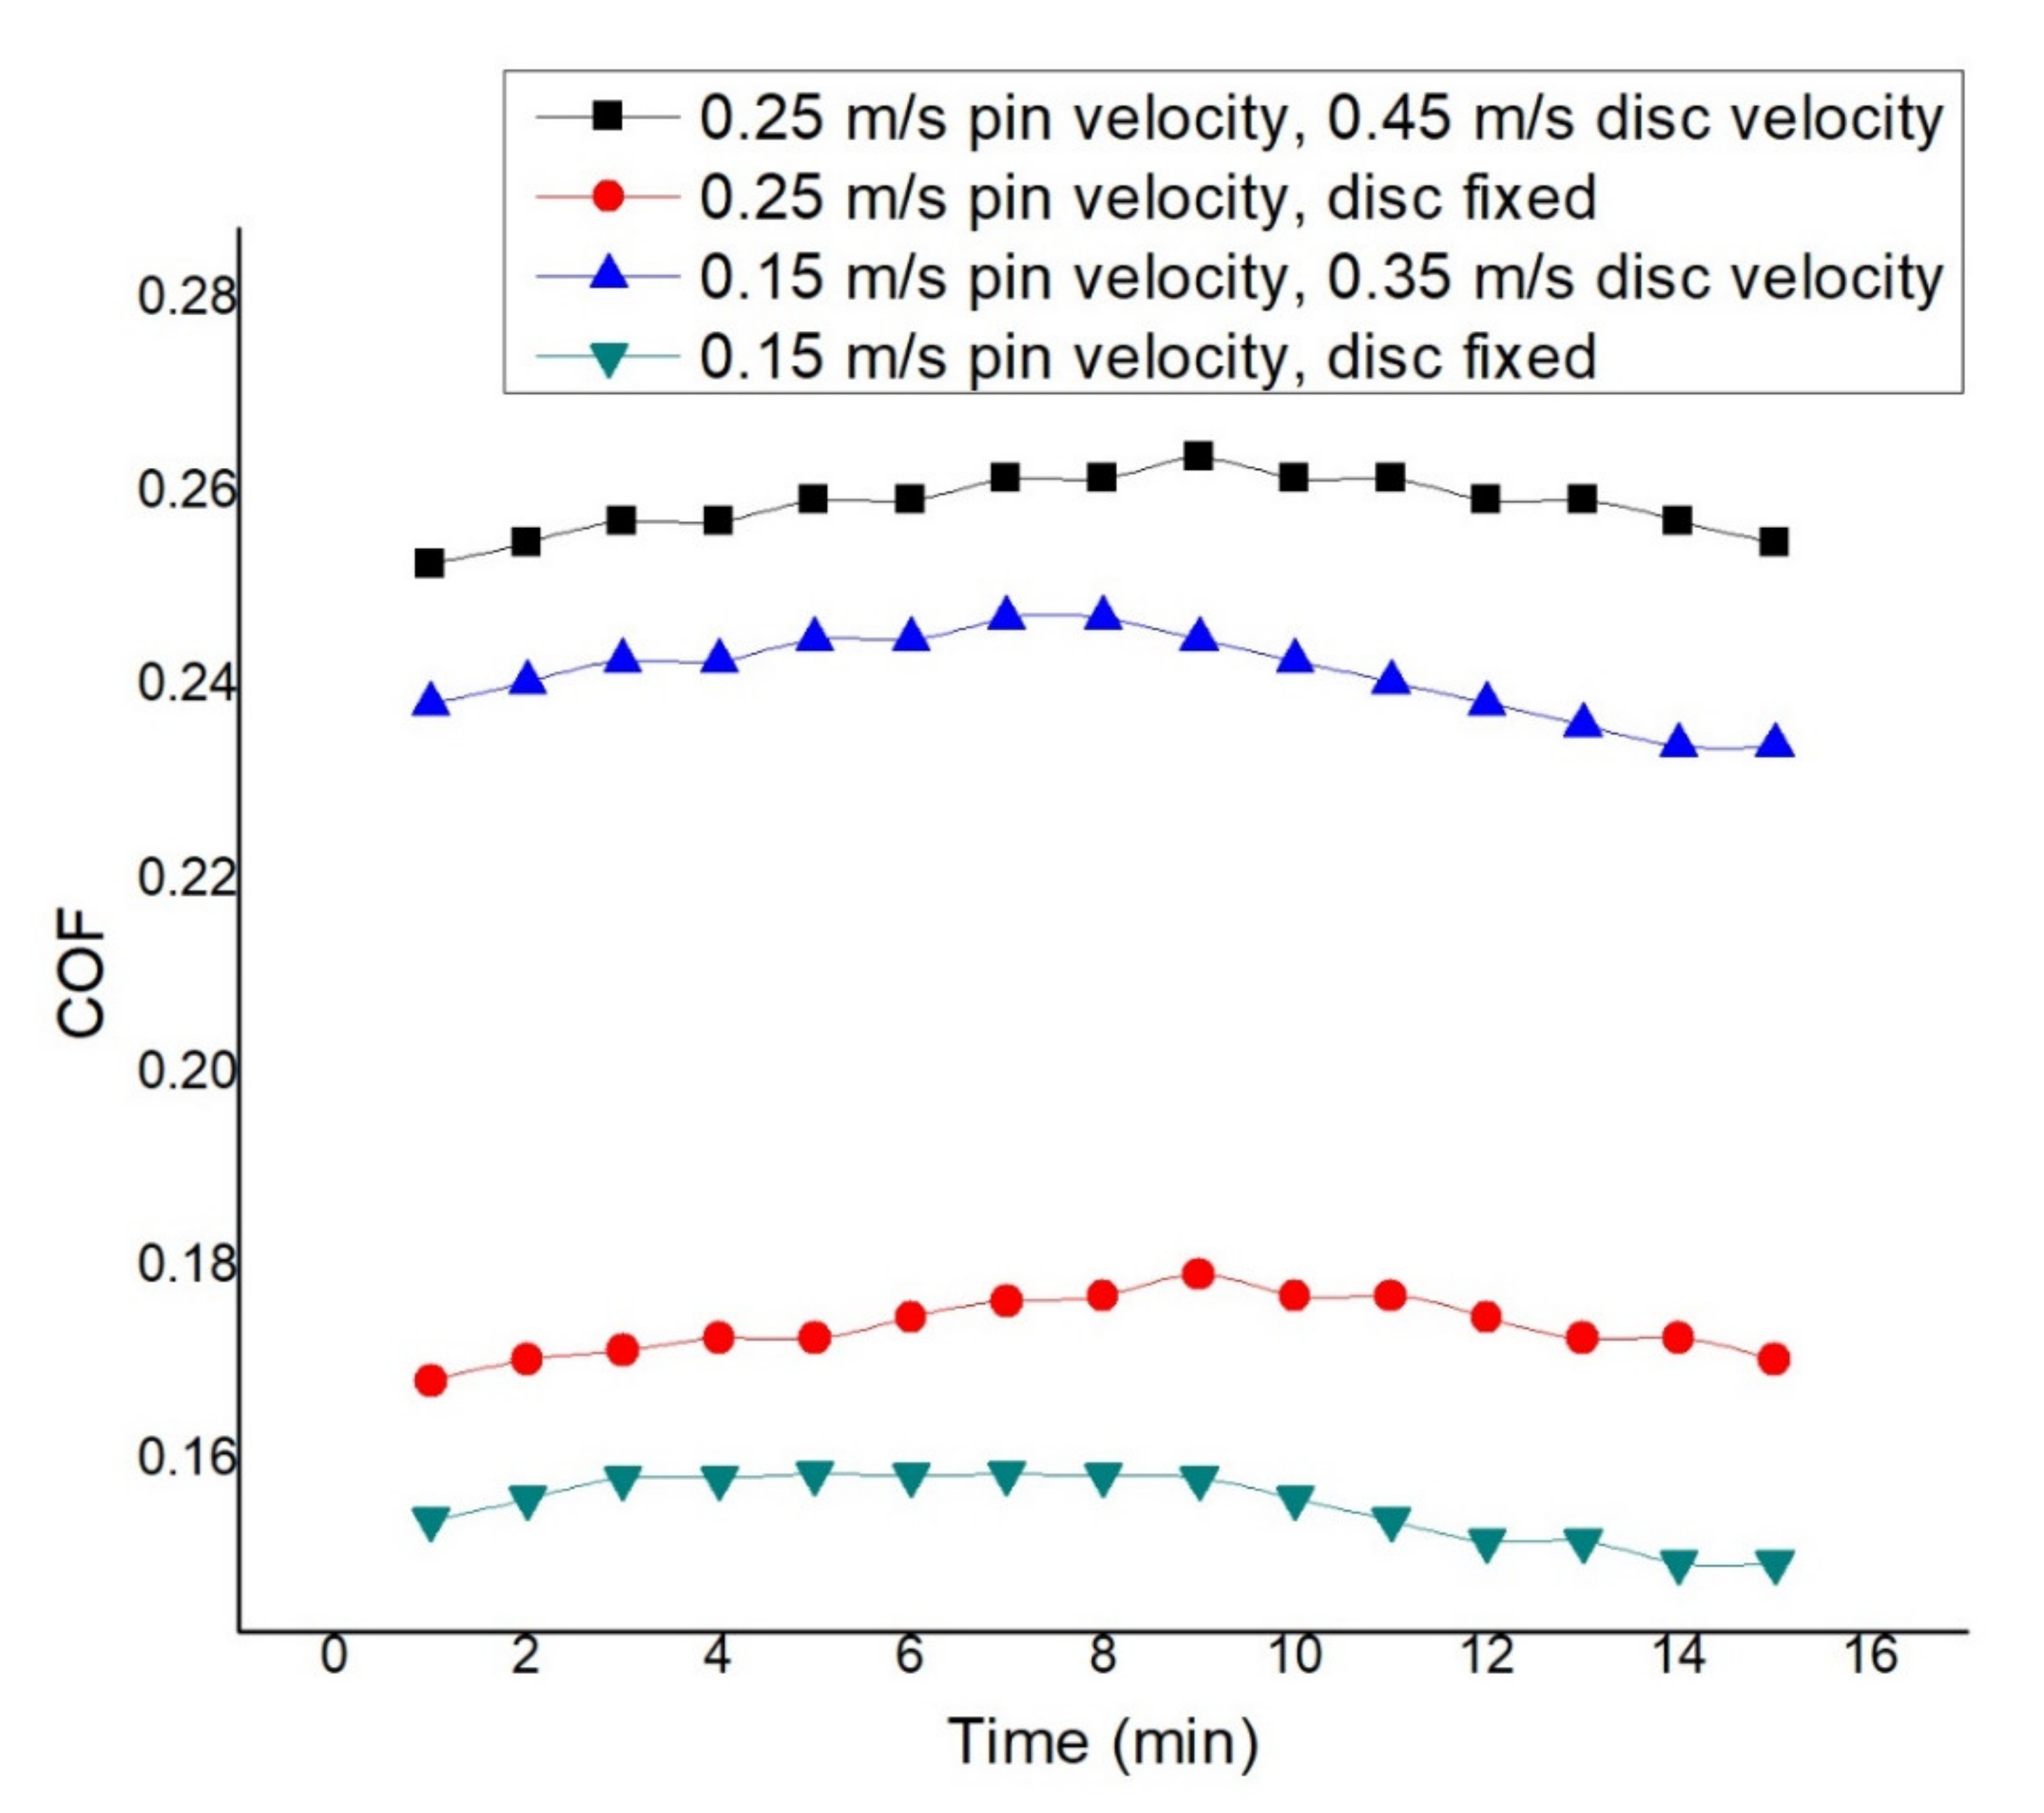
3.2.1. COF Analysis
3.2.2. Wear Rate Analysis
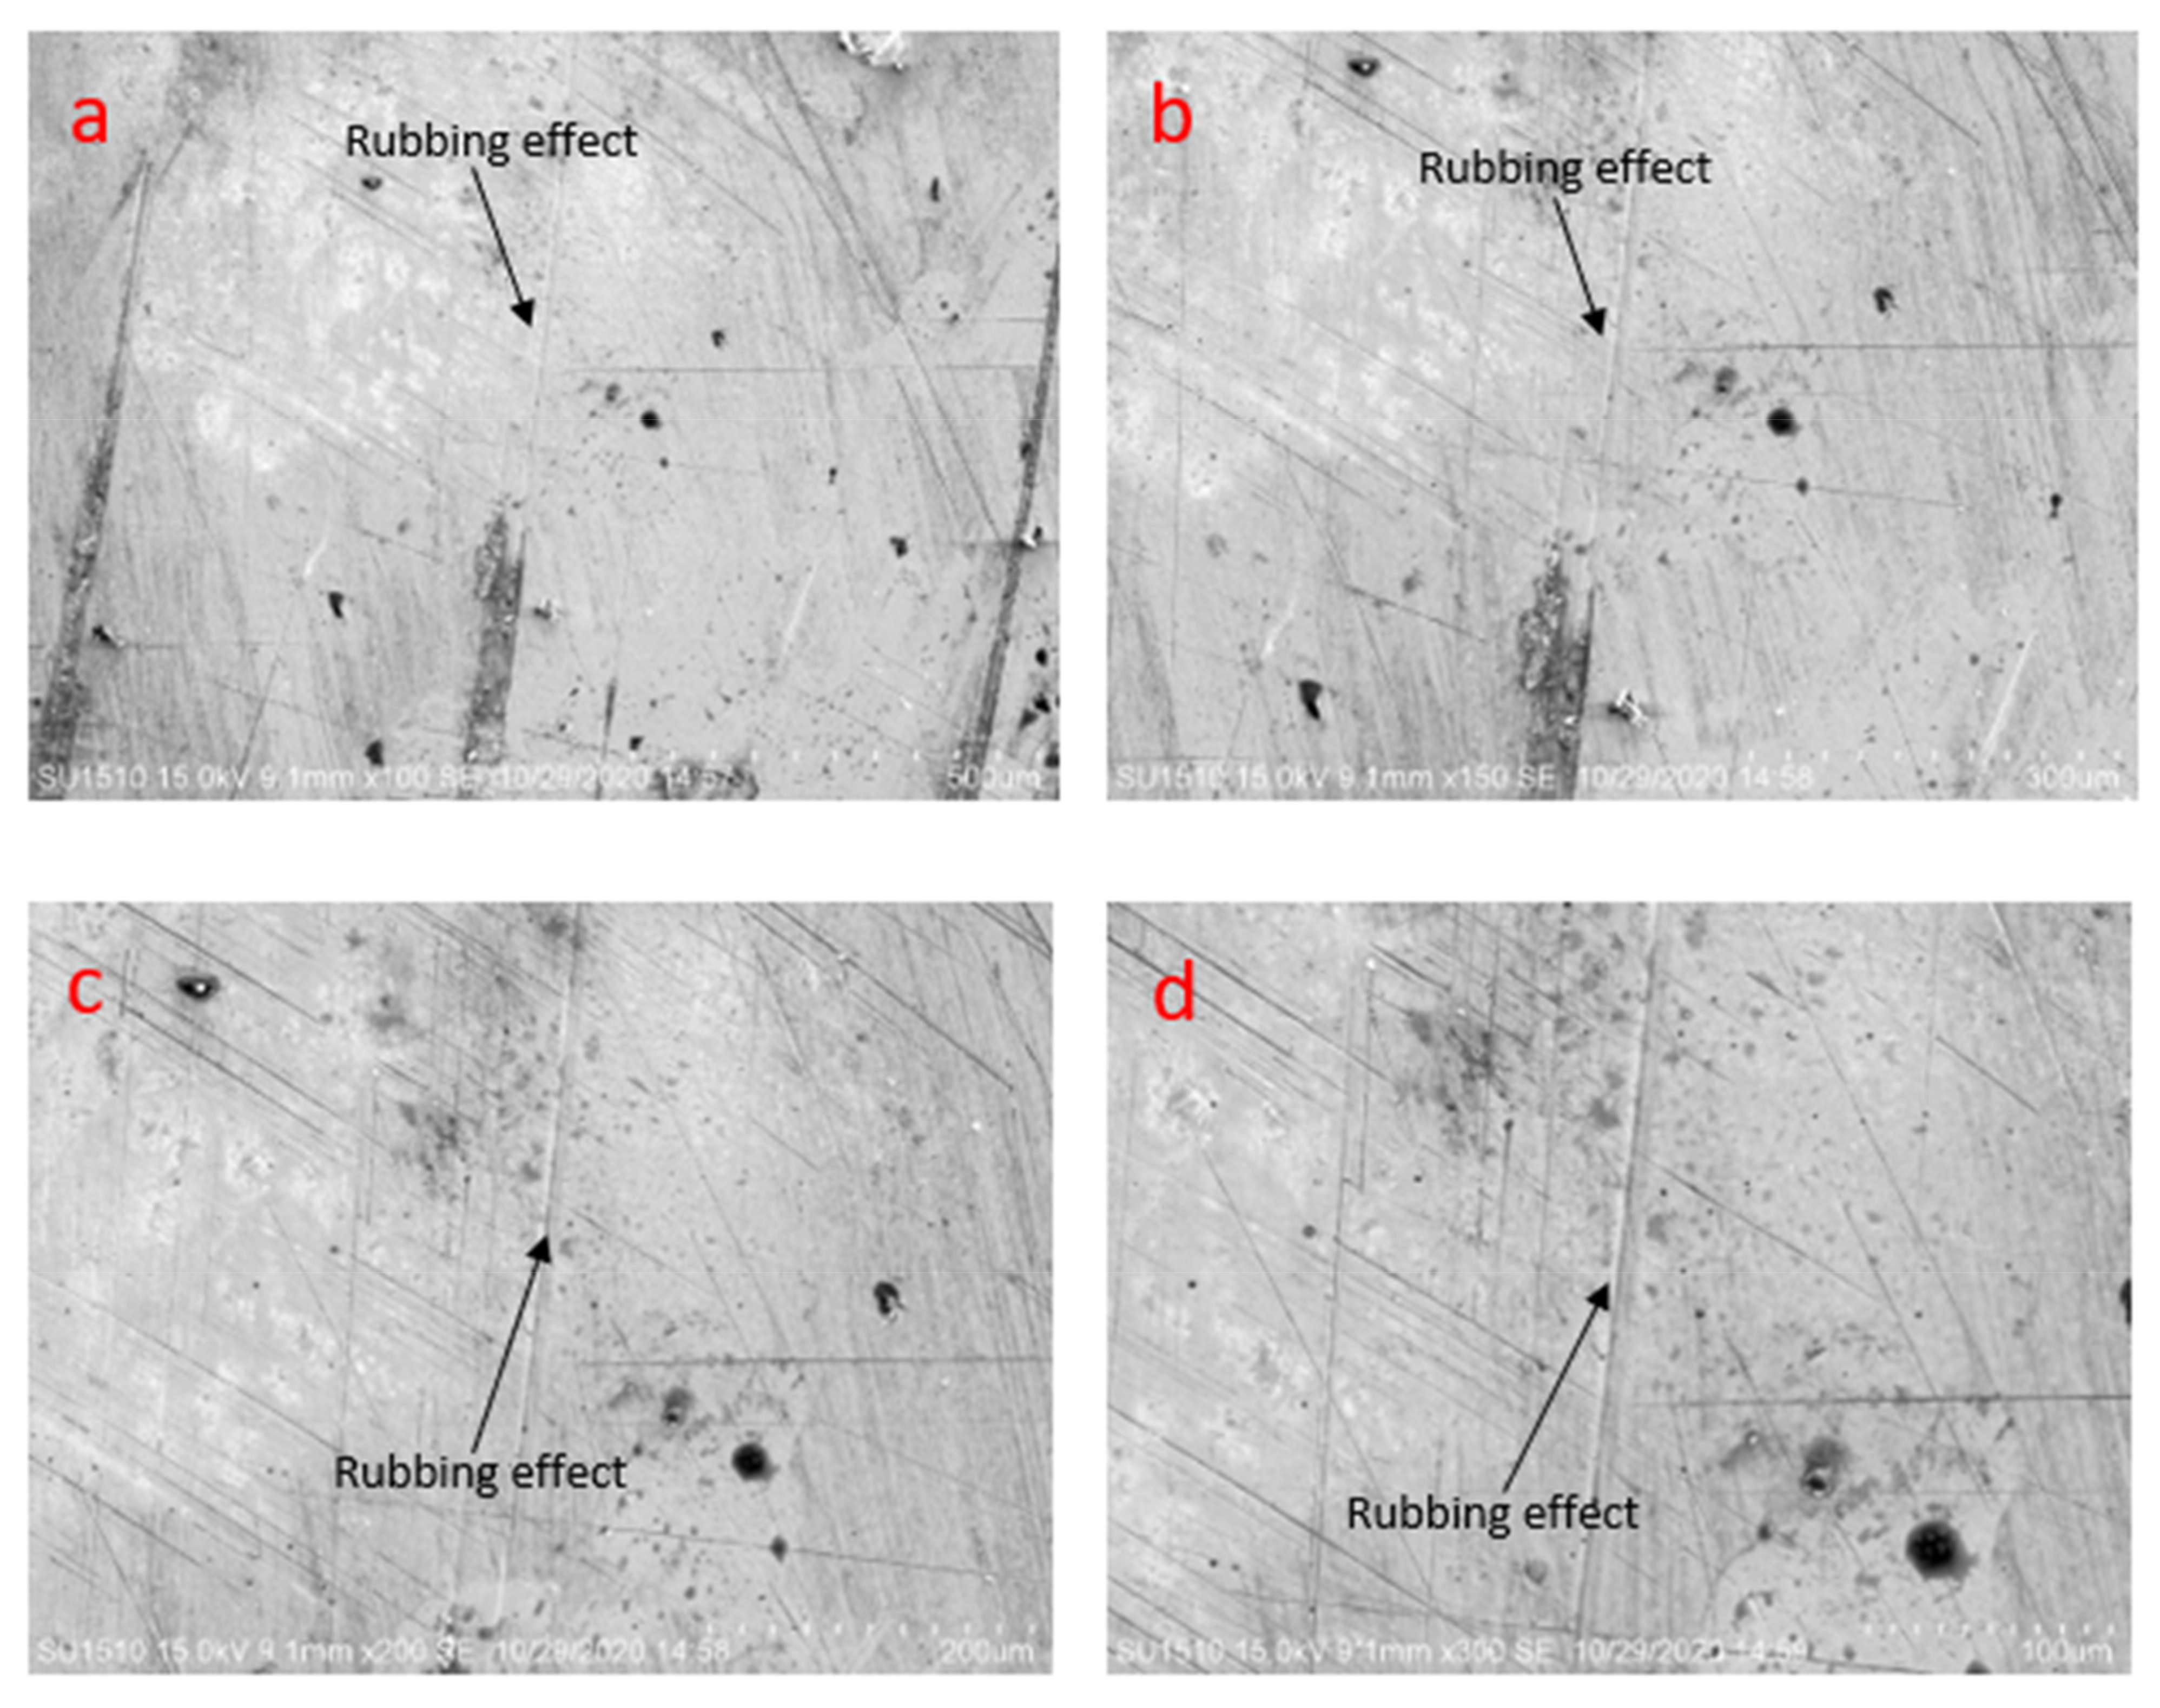
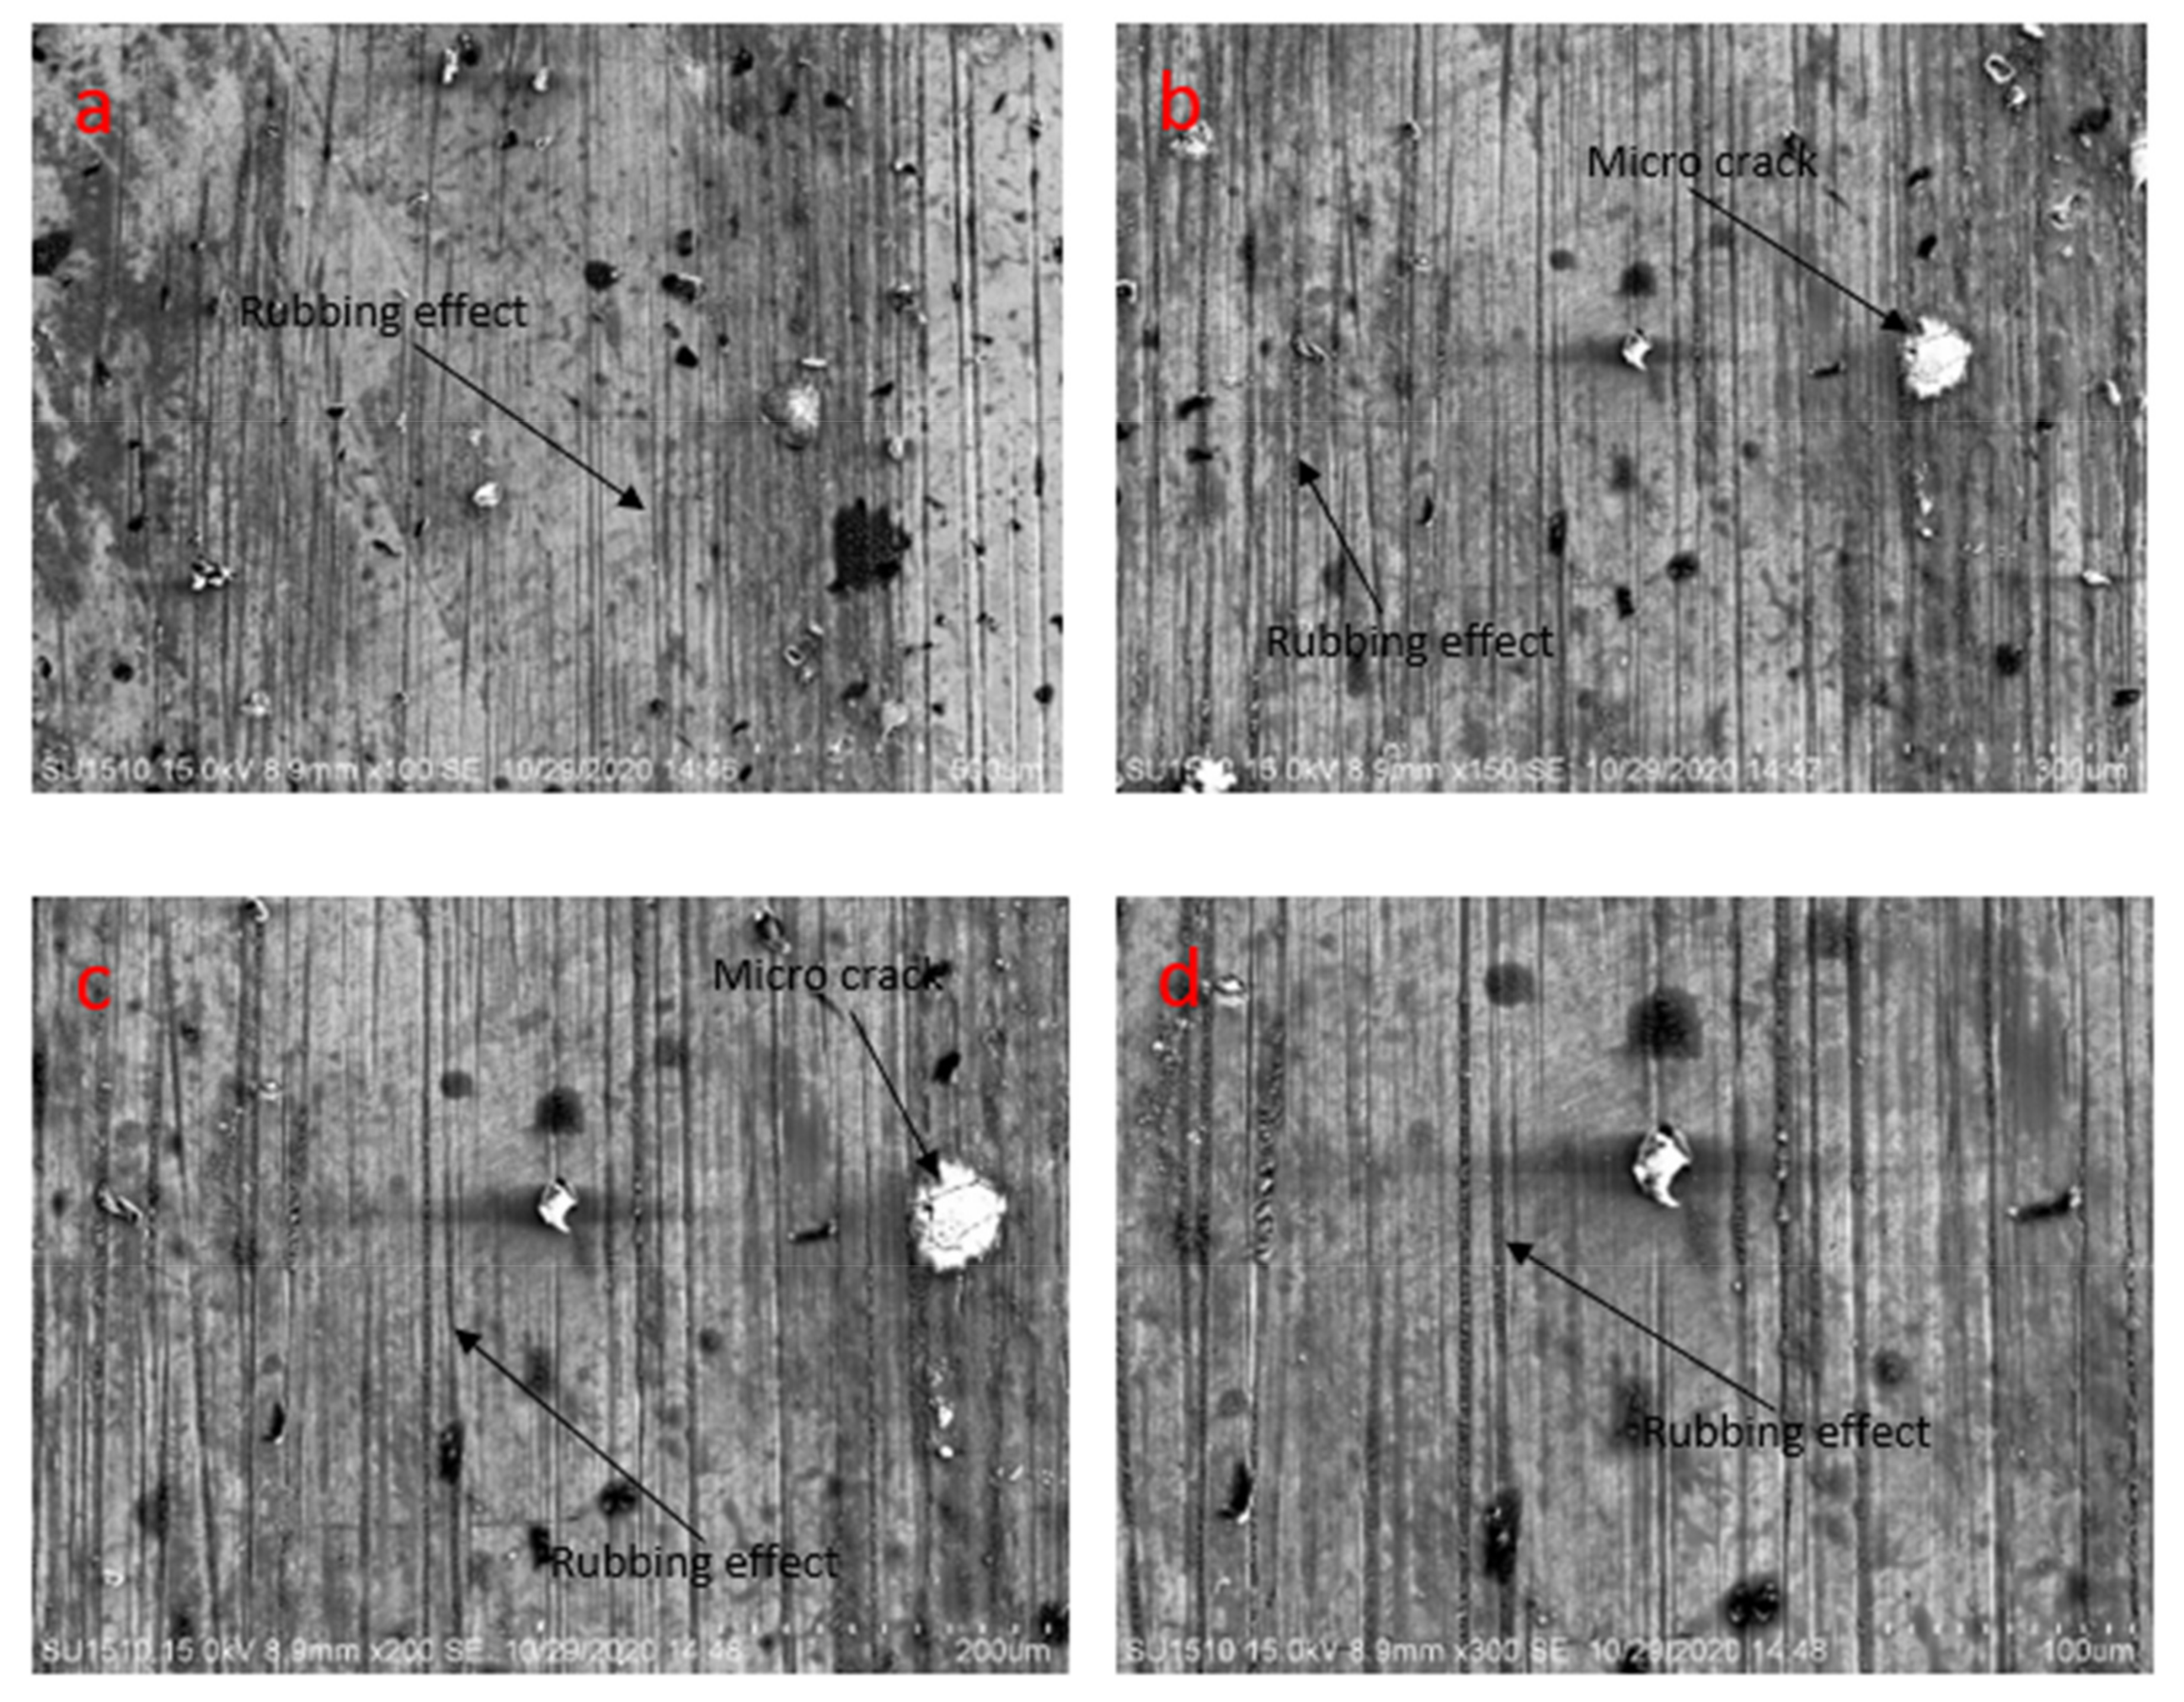
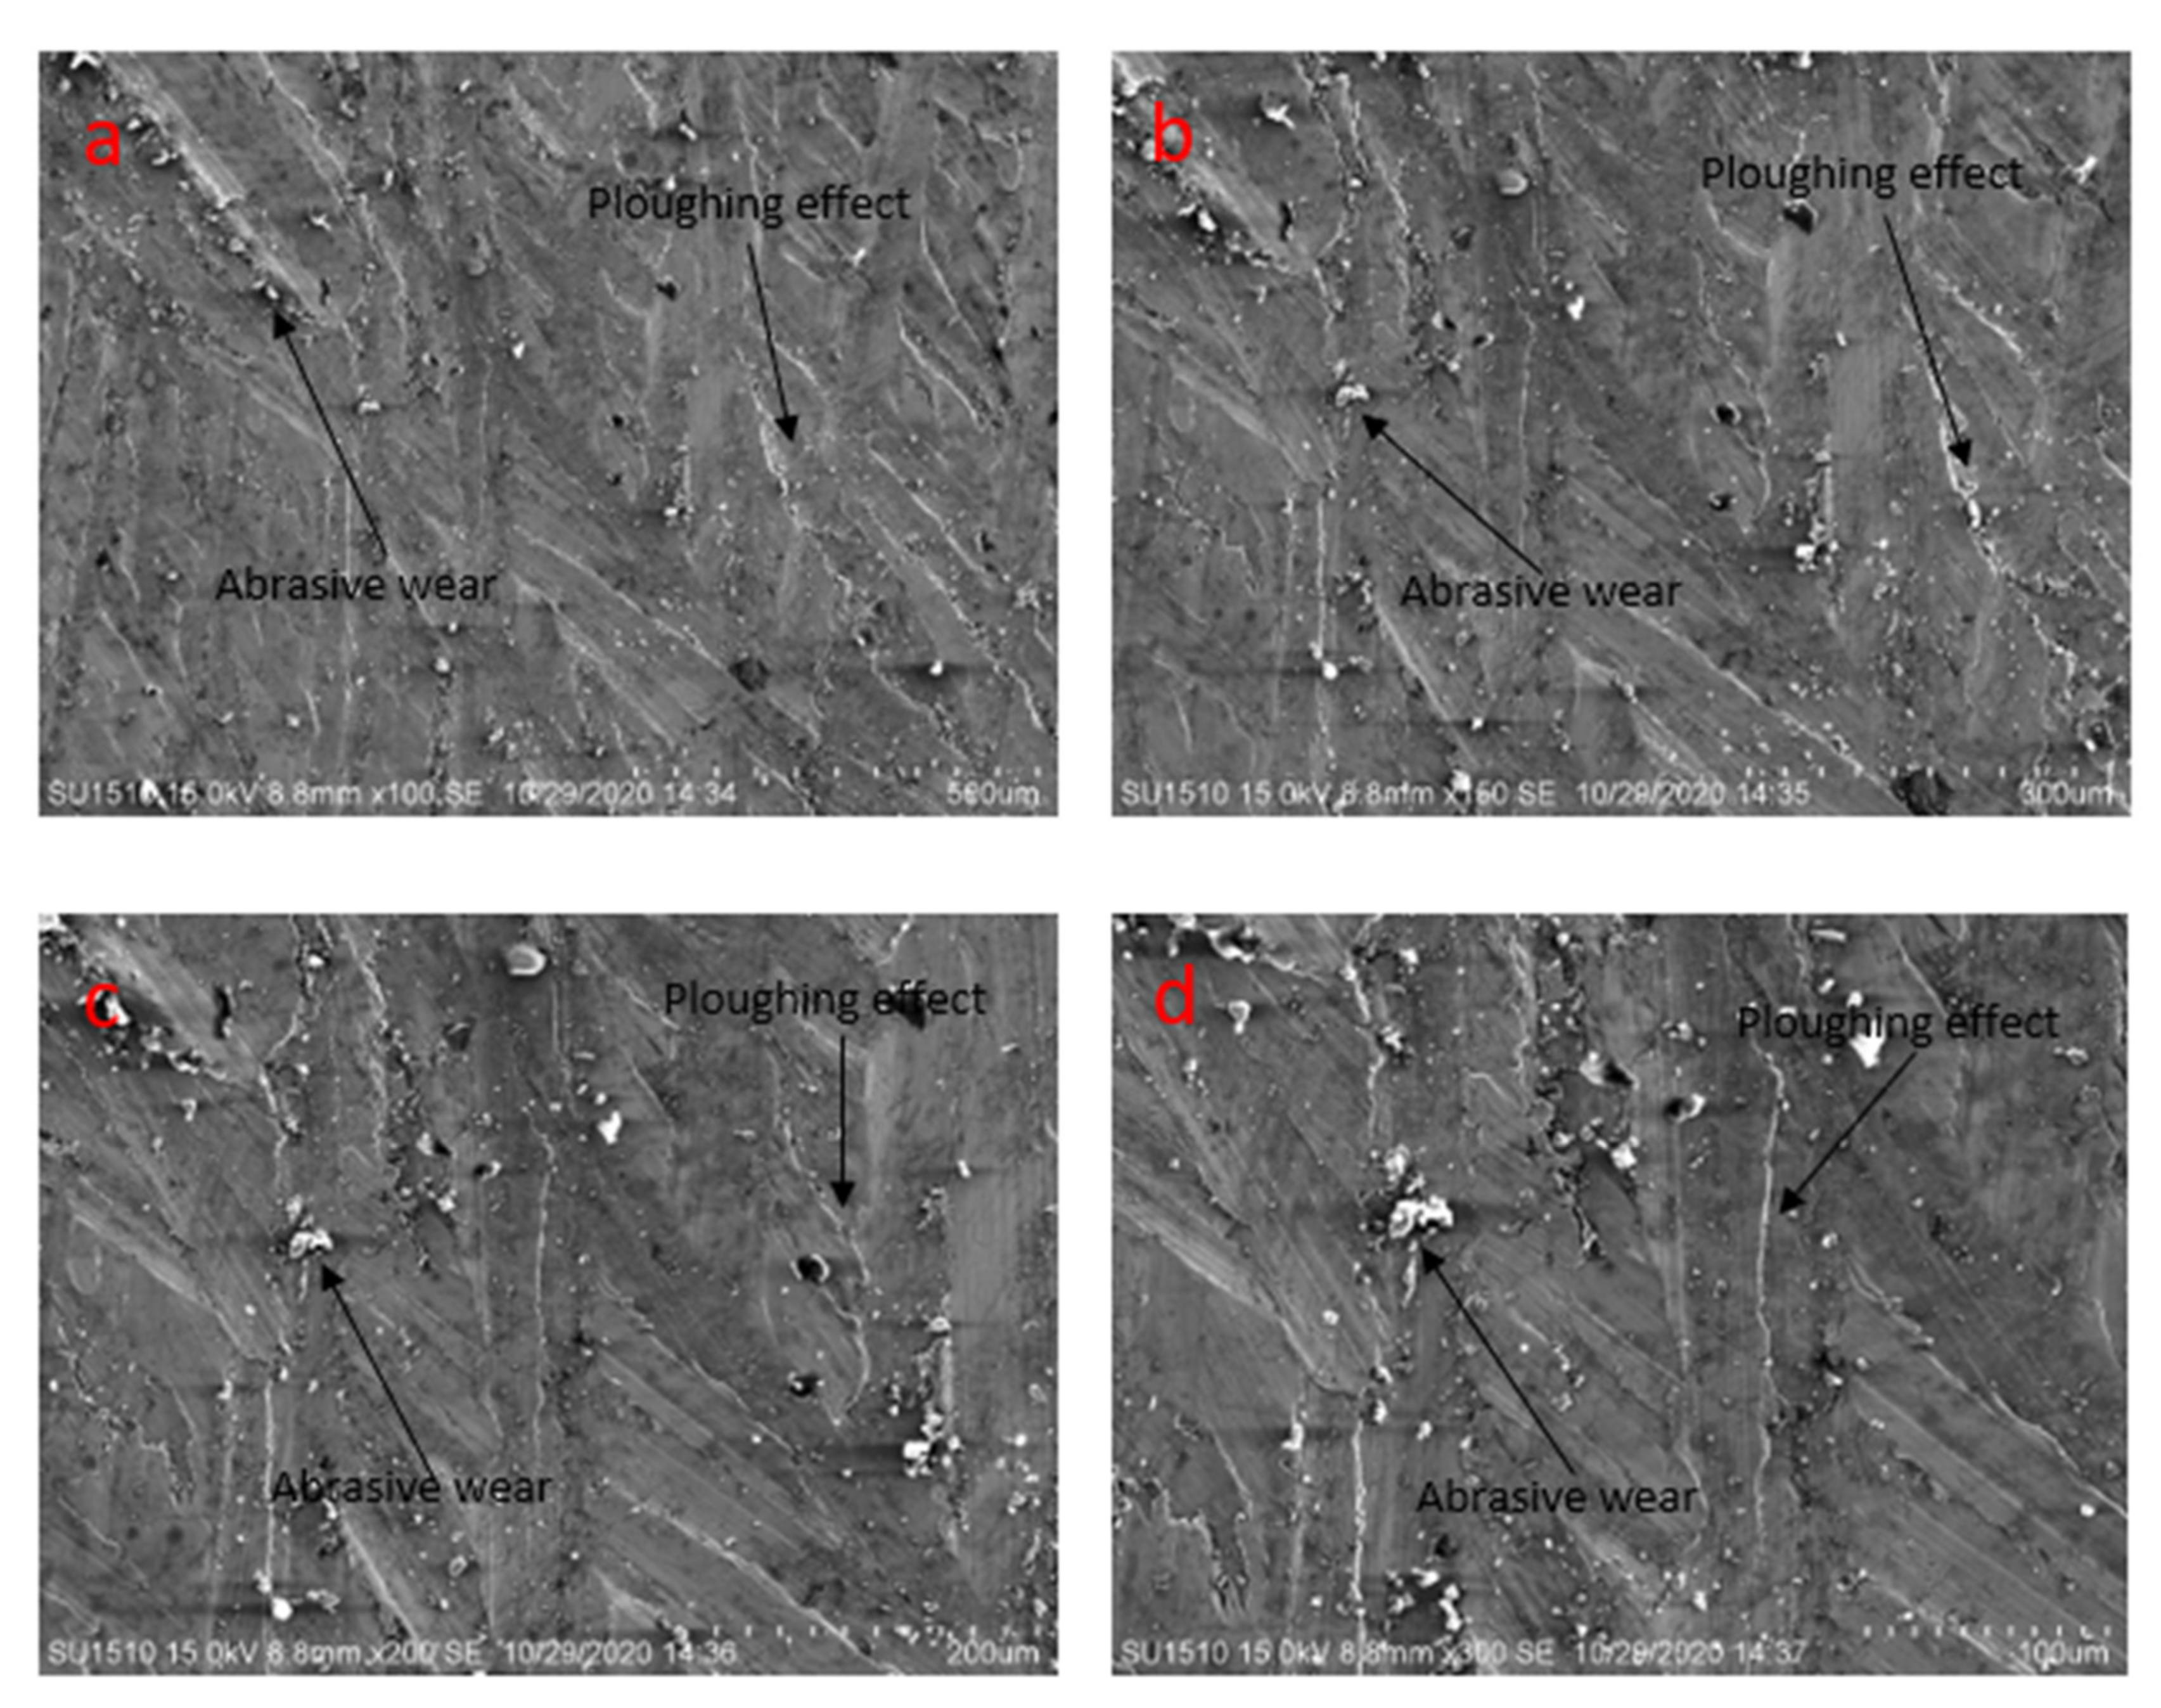
3.2.3. SEM Analysis
3.2.4. Lubrication Regimes Analysis
3.3. Effect of Motion
3.3.1. COF Analysis
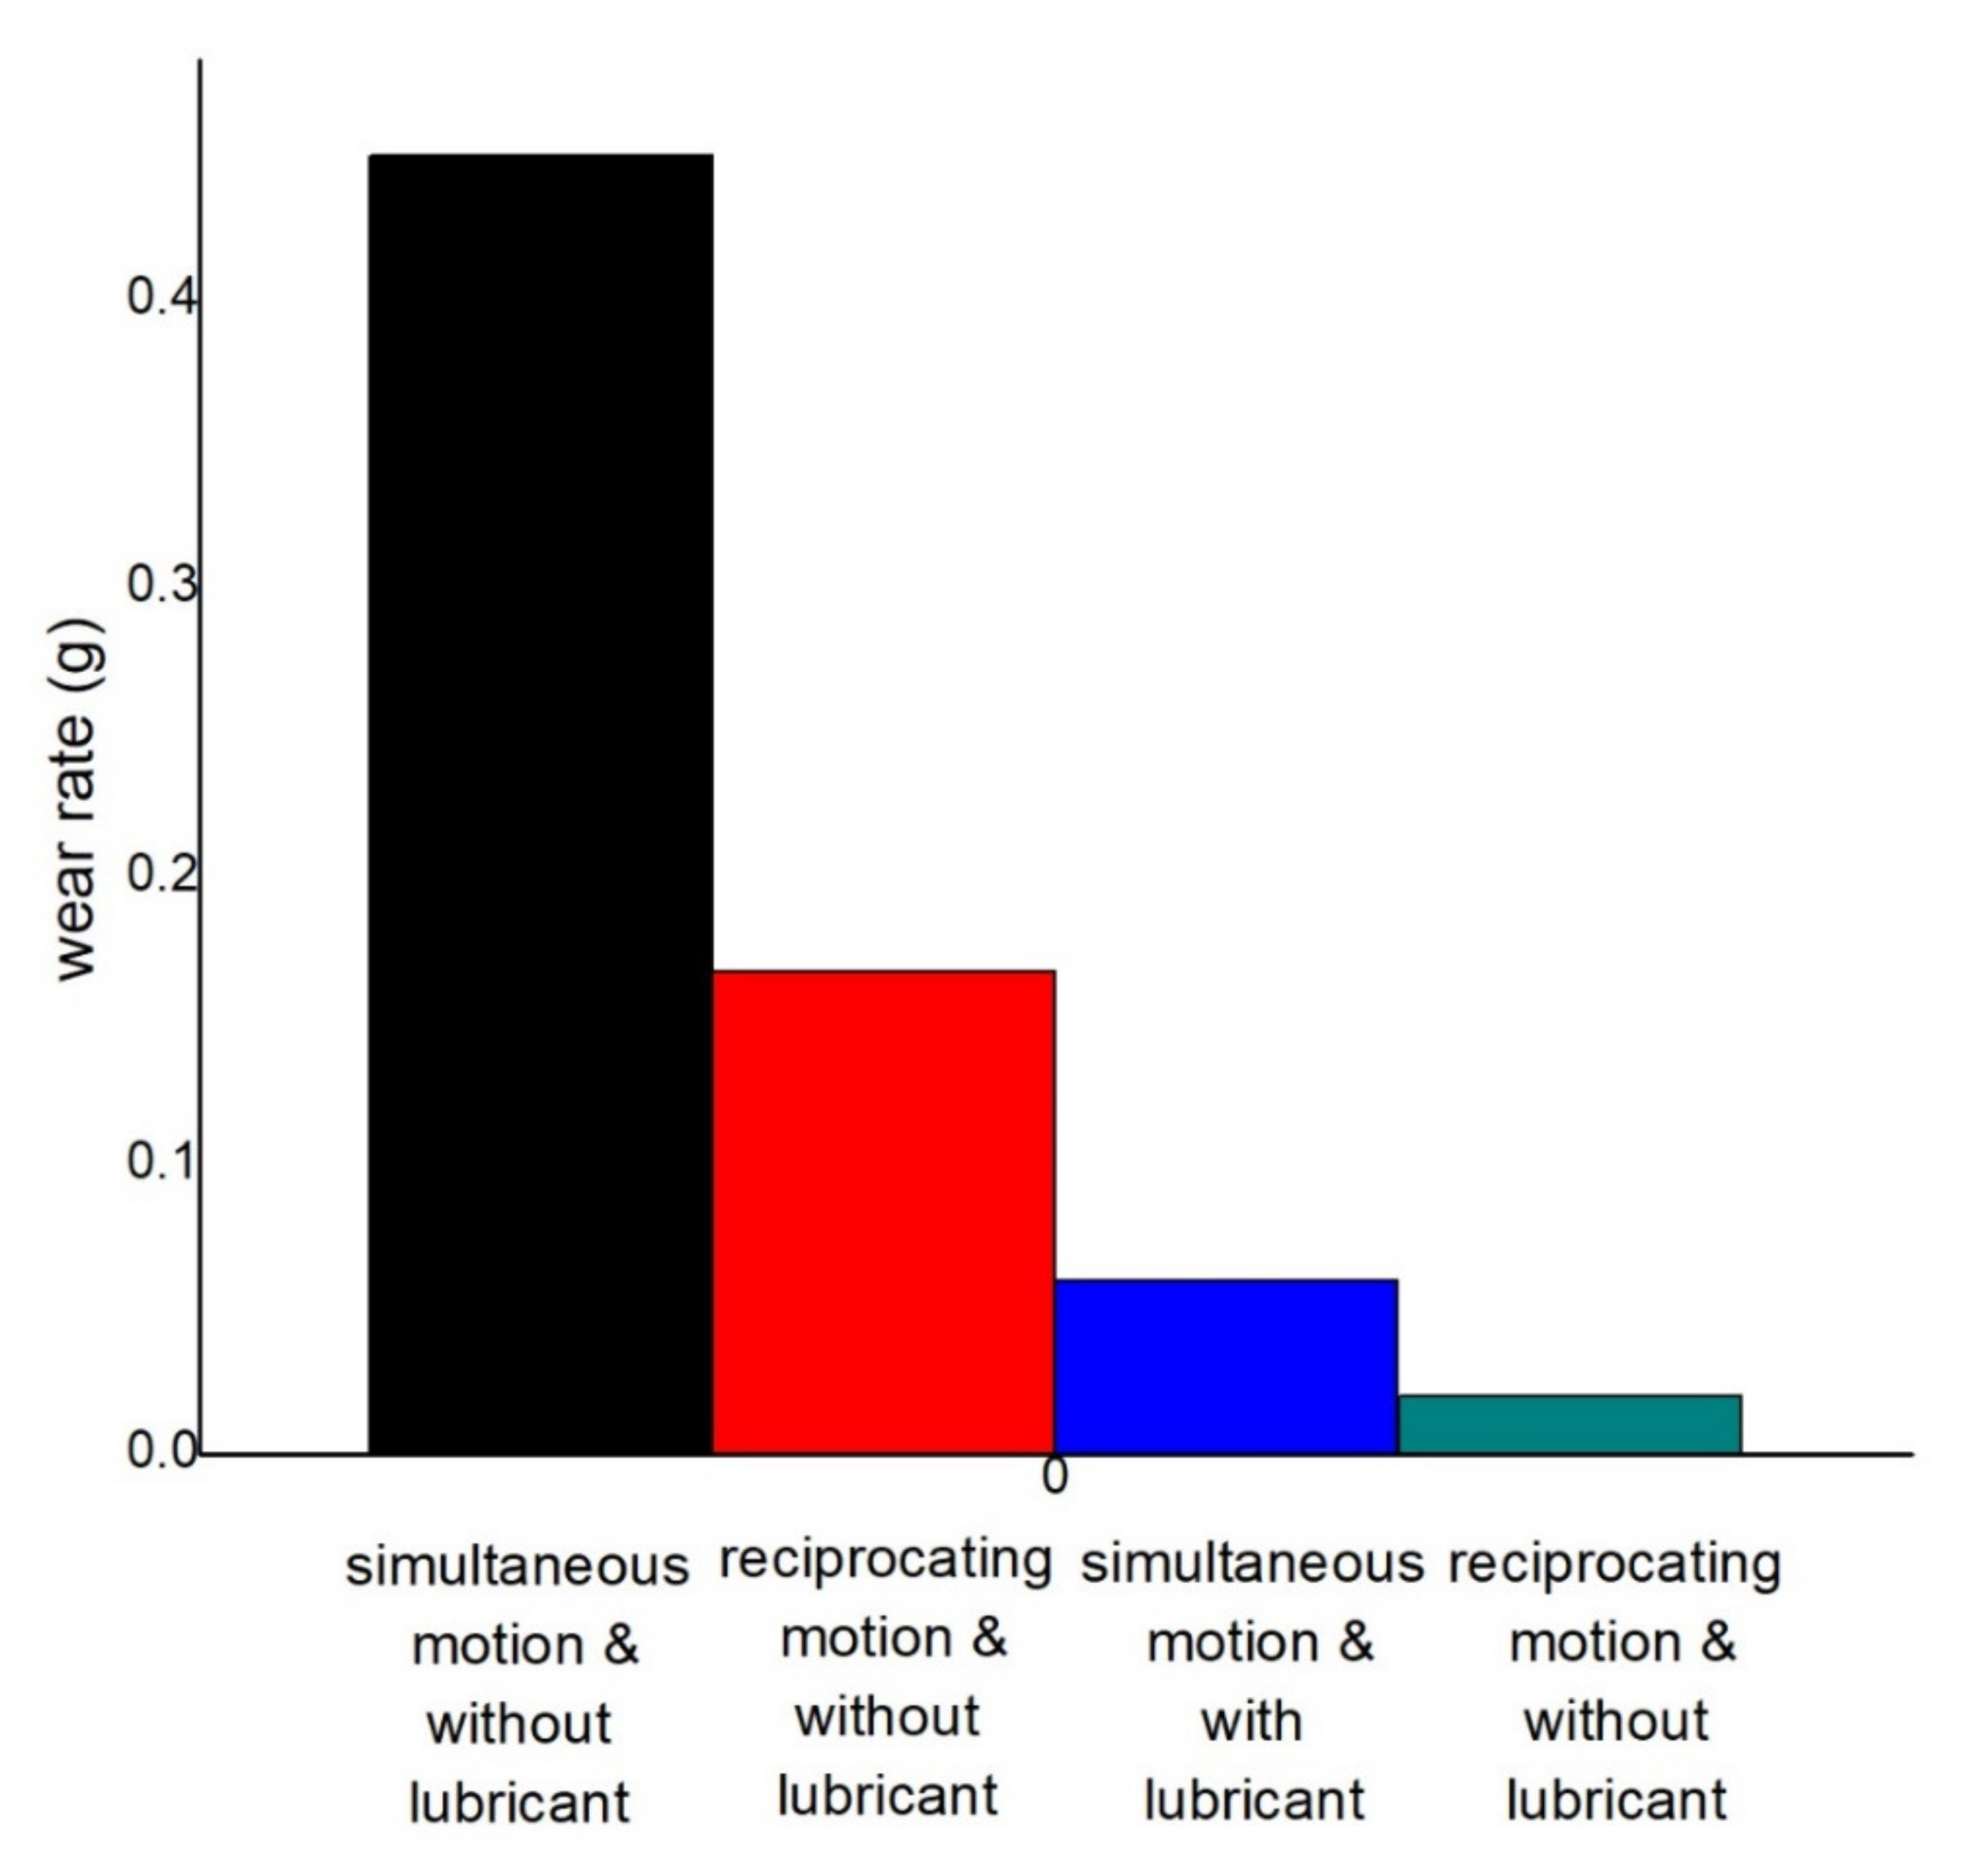
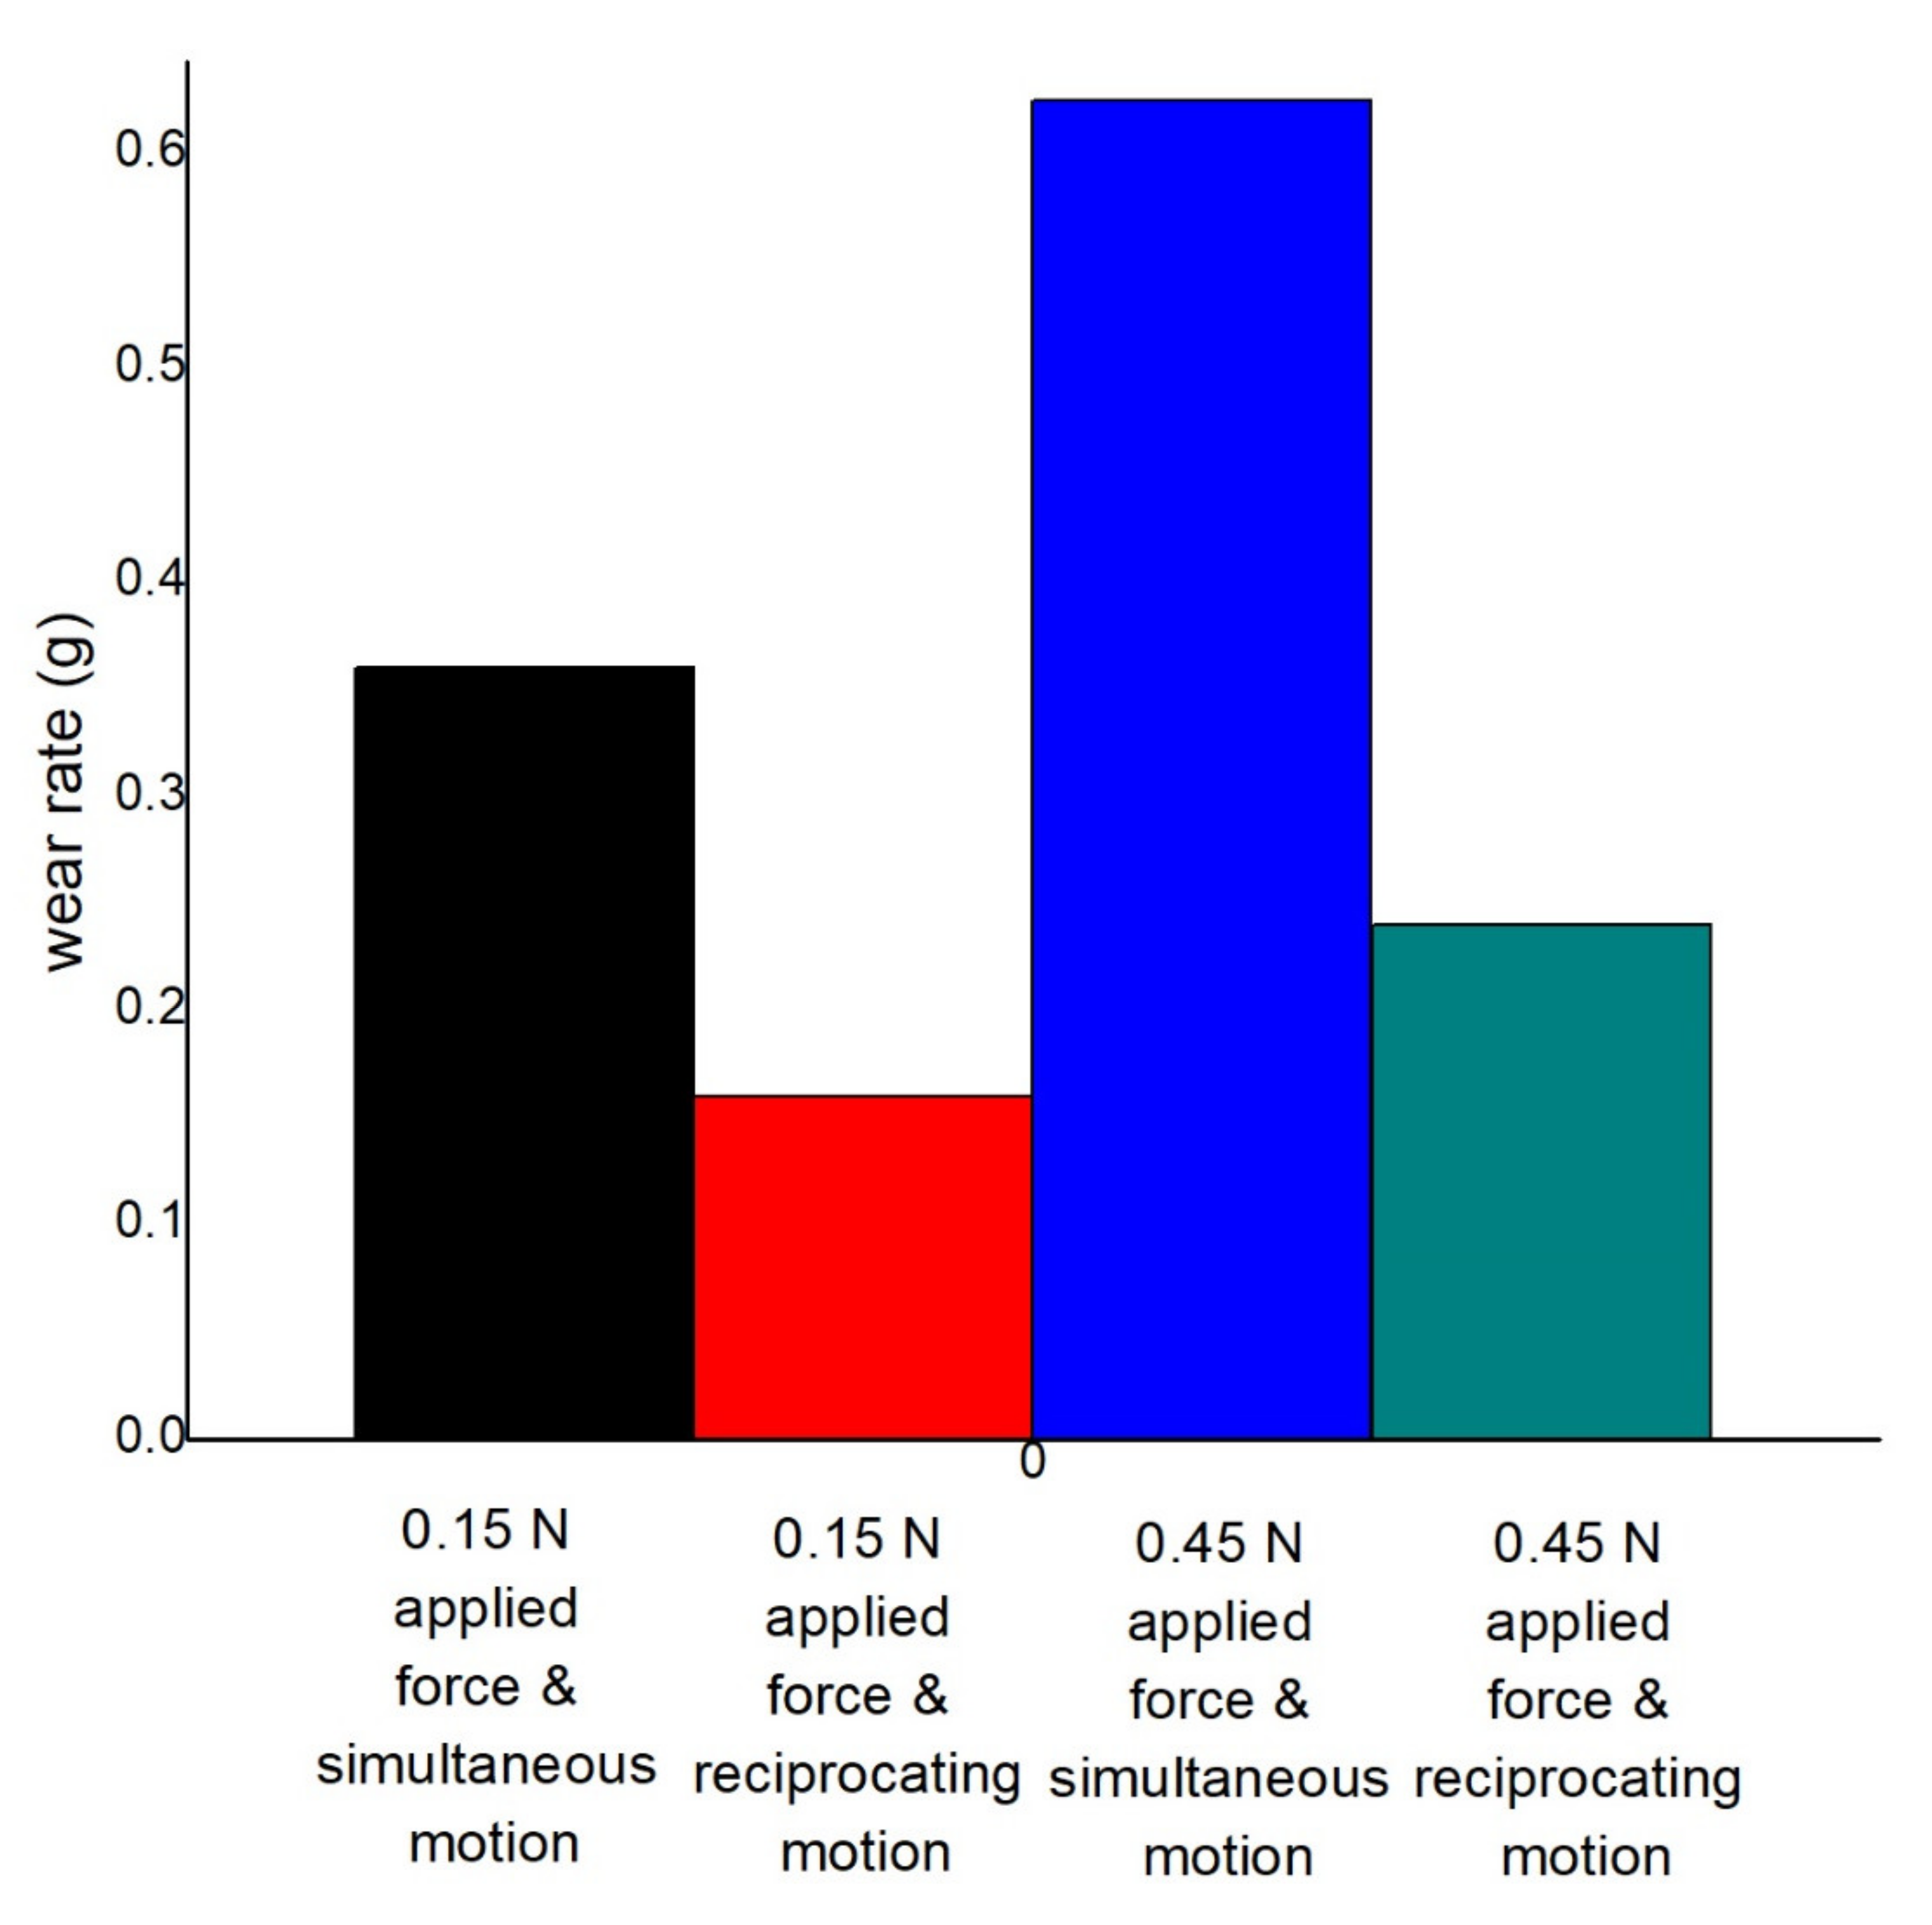
3.3.2. Wear Rate Analysis
3.3.3. SEM Analysis
3.4. Effect of Normal Load
3.4.1. COF Analysis
3.4.2. Wear Rate
3.4.3. SEM Analysis
3.5. Effects of Surface Roughness
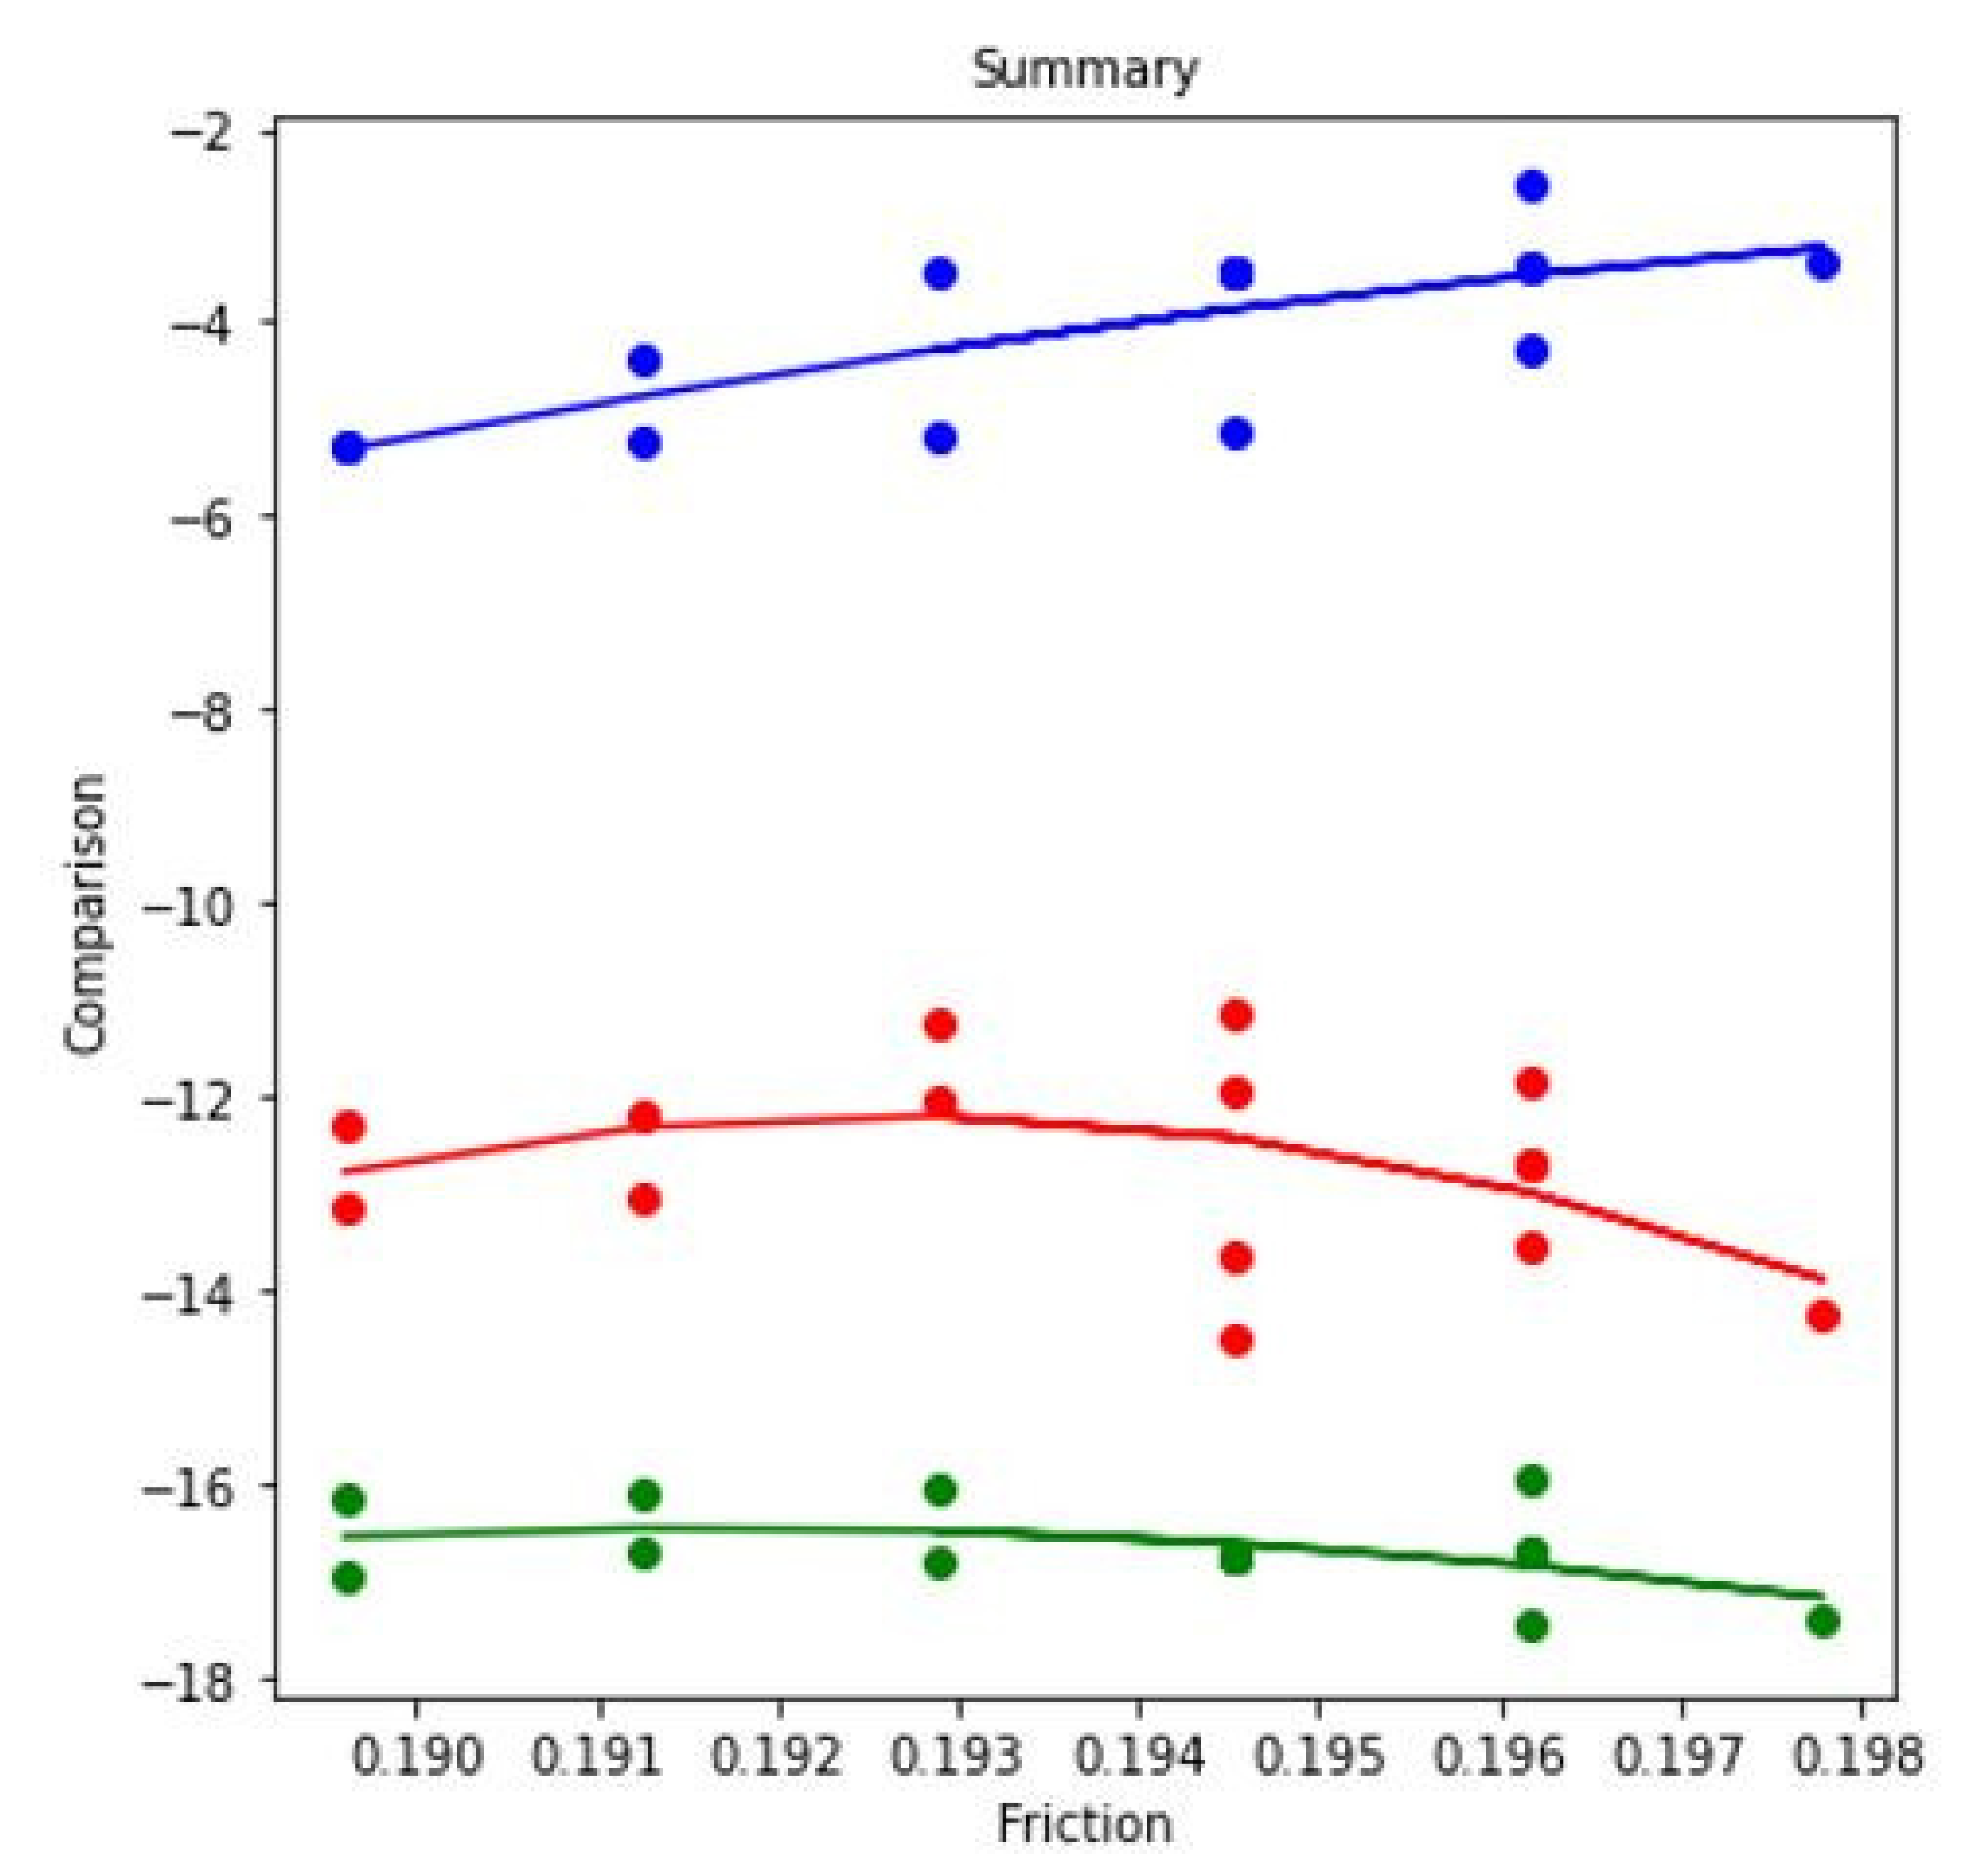
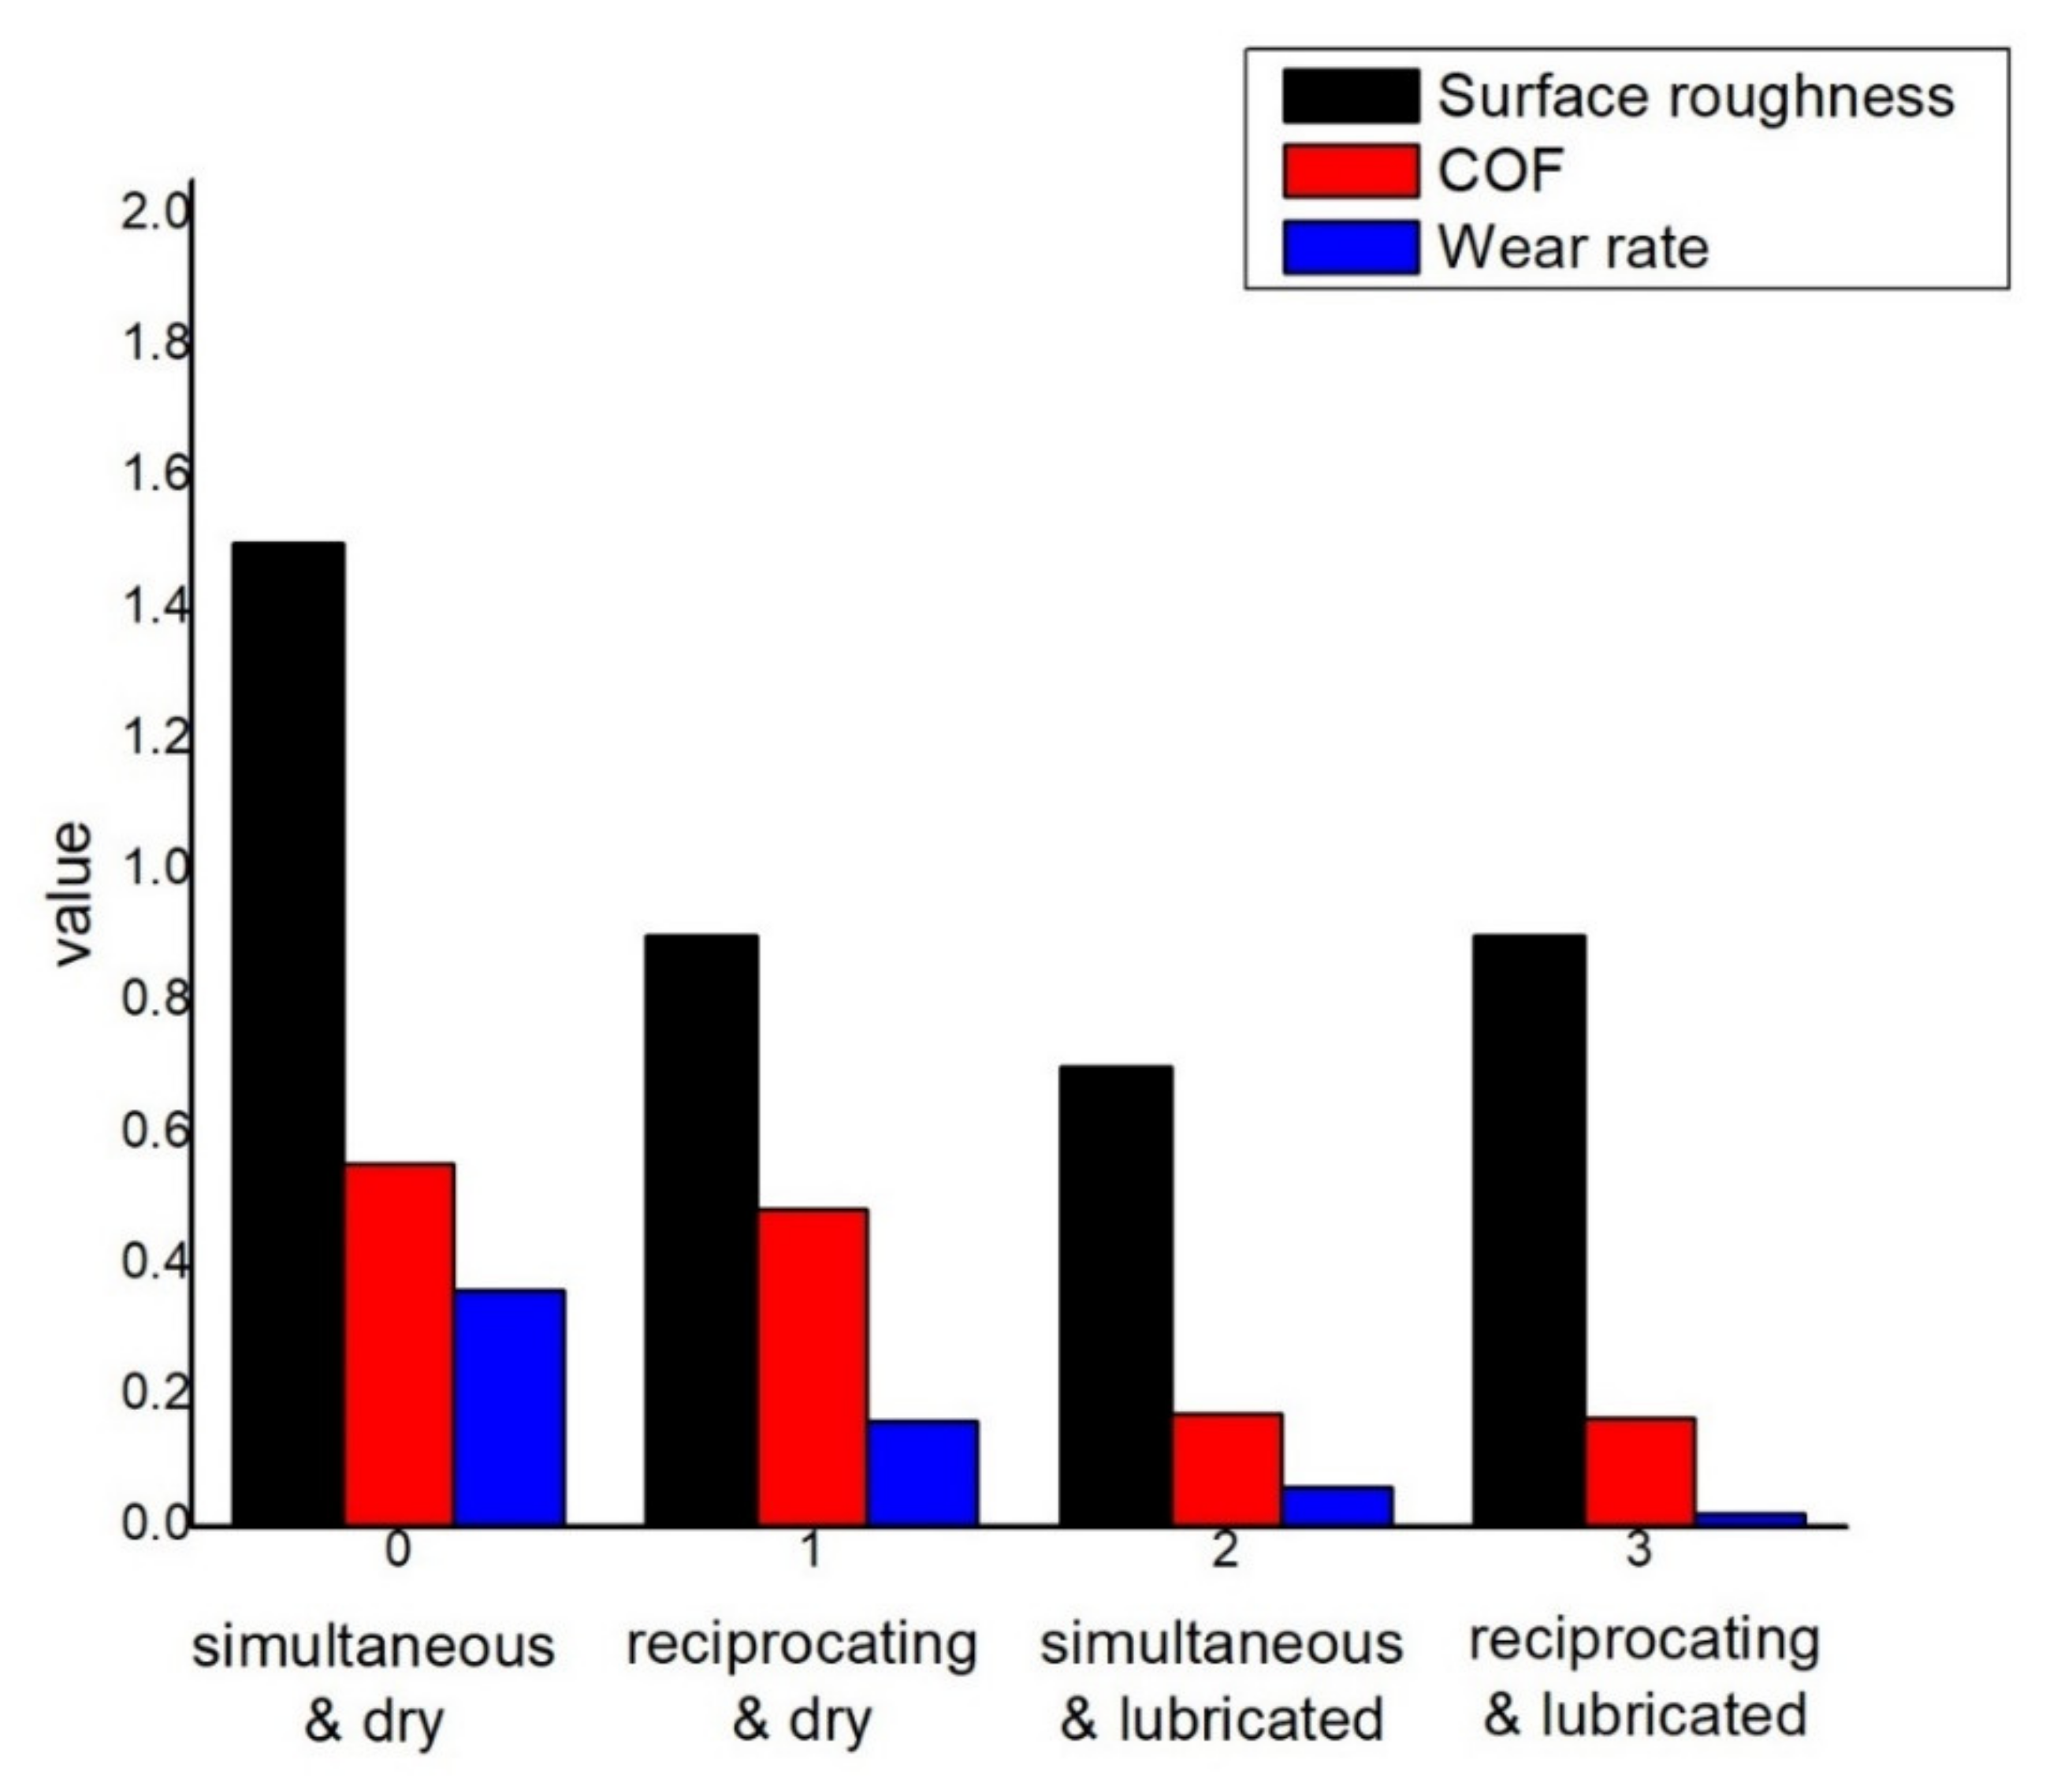
3.6. Comparison among Surface Roughness, Friction, and Wear
4. Conclusions
Author Contributions
Funding
Institutional Review Board Statement
Informed Consent Statement
Data Availability Statement
Conflicts of Interest
References
- John, V.B. Introduction to Engineering Materials, 2nd ed.; Macmillan Publishing Company Ltd.: London, UK, 1980; pp. 321–324. [Google Scholar]
- Sultana, M.N.; Hasan, M.F.; Islam, M. Analysis of Mechanical Properties of Mild Steel Applying Various Heat Treatment. In Proceedings of the International Conference on Mechanical, Industrial and Energy Engineering, Khulna, Bangladesh, 25–26 December 2014. [Google Scholar]
- Rao, P.N. Manufacturing Technology; McGraw Hill Companies: New Delhi, India, 2011; Volume 1, pp. 11–53. [Google Scholar]
- Xu, G.; Wang, K.; Dong, X.; Yang, L.; Ebrahimi, M.; Jiang, H.; Wang, Q.; Ding, W. Review on corrosion resistance of mild steels in liquid aluminum. J. Mater. Sci. Technol. 2021, 71, 12–22. [Google Scholar] [CrossRef]
- Asuquo, L.O.; Ihom, P.A. Mathematical modeling of the hardness of case-hardened steel with respect to carburizing time. Res. Rev. J. Eng. Technol. 2013, 1, 19–25. [Google Scholar]
- Badiger, P.V.; Desai, V.; Ramesh, M.R.; Joladarashi, S.; Gourkar, H. Tribological behaviour of monolayer and multilayer Ti-based thin solid films deposited on alloy steel. Mater. Res. Express 2018, 6, 026419. [Google Scholar] [CrossRef]
- Popoola, A.P.I.; Fatoba, O.S.; Aigbodion, V.S.; Popoola, O.M. Tribological evaluation of mild steel with ternary alloy of Zn-Al-Sn by laser deposition. Int. J. Adv. Manuf. Technol. 2017, 89, 1443–1449. [Google Scholar] [CrossRef]
- Khadem, M.; Penkov, O.V.; Yang, H.K.; Kim, D.E. Tribology of multilayer coatings for wear reduction: A review. Friction 2017, 5, 248–262. [Google Scholar] [CrossRef] [Green Version]
- Zhang, Z.; Lu, W.; Wu, B.; Du, X. Effect of diamond grain size on the tribological properties of WS2-based multilayer coatings. Diam. Relat. Mater. 2021, 113, 108298. [Google Scholar] [CrossRef]
- Lotfi-Khojasteh, E.; Sahebazamani, M.; Elmkhah, H.; Nouri, M.; Imantalab, O.; Fattah-Alhosseini, A. A study of the electrochemical and tribological properties of TiN/CrN nano-layer coating deposited on carburized-H13 hotwork steel by Arc-PVD technique. J. Asian Ceram. Soc. 2021, 9, 270–282. [Google Scholar] [CrossRef]
- Syed, D.; Wani, M.F. Tribological behavior of chrome-deposited SAE9254 grade steel top compression piston ring under lubrication starvation and mild extreme pressure lubrication. Int. J. Engine Res. 2021, 22, 1285–1300. [Google Scholar] [CrossRef]
- Mitrović, S.; Babić, M.; Adamović, D.; Živić, F.; Džunić, D.; Pantić, M. Wear Behaviour of Hard Cr Coatings for Cold Forming Tools Under Dry Sliding Conditions. Tribol. Ind. 2012, 34, 44–48. [Google Scholar]
- Scheerer, H.; Hoche, H.; Broszeit, E.; Schramm, B.; Abele, E.; Berger, C. Effects of the chromium to aluminum content on the tribology in dry machining using (Cr,Al)N coated tools. Surf. Coat. Technol. 2005, 200, 203–207. [Google Scholar] [CrossRef]
- Yu, J.; Wang, Y.; Zhao, X.; Li, Q.; Qiao, Q.; Zhao, J.; Zhai, S. Wear Resistance of Ni-Based Alloy Coatings. Sci. Eng. 2019, 303, 591–601. [Google Scholar] [CrossRef] [Green Version]
- Sahoo, P.; Das, S.K. Tribology of electroless nickel coatings—A review. Mater. Des. 2011, 32, 1760–1775. [Google Scholar] [CrossRef]
- Ashrafizadeh, F. Tribological evaluation of copper coated aluminium. Surf. Eng. 1997, 13, 41–44. [Google Scholar] [CrossRef]
- James, G.; Witten, D.; Hastie, T.; Tibshirani, R. An Introduction to Statistical Learning: With Applications in R; Springer: Basel, Switzerland, 2017; ISBN 978-1-4614-7138-7. [Google Scholar]
- Murphy, K.P. Machine Learning: A Probabilistic Perspective; MIT Press: Cambridge, UK, 2013; ISBN 978-0262018029. [Google Scholar]
- Barber, D. Bayesian Reasoning and Machine Learning; Cambridge University Press: Cambridge, UK, 2012; ISBN 978-0521518147. [Google Scholar]
- Maru, M.; Tanaka, D.K. Influence of loading, contamination and additive on the wear of a metallic pair under rotating and reciprocating lubricated sliding. J. Braz. Soc. Mech. Sci. Eng. 2006, 28, 278–285. [Google Scholar] [CrossRef]
- Cai, P.; Luo, Z.; Duan, X.; Qin, X. Effect of reciprocating and unidirectional sliding motion on the friction and wear of phenolic resin-based composite. Ind. Lubr. Tribol. 2019, 71, 573–577. [Google Scholar] [CrossRef]
- Ranjbarkohan, M.; Rasekh, M.; Hoseini, A.H.; Kheiralipour, K.; Asadi, M.R. Kinematics and kinetic analysis of the slider-crank mechanism in otto linear four-cylinder Z24 engine. J. Mech. Eng. Res. 2011, 3, 85–95. [Google Scholar]
- Erkaya, S.; Uzmay, I. Experimental investigation of joint clearance effects on the dynamics of a slider-crank mechanism. Multibody Syst. Dyn. 2010, 24, 81–102. [Google Scholar] [CrossRef]
- Krebs, G.; Tounzi, A.; Pauwels, B.; Willemot, D.; Piriou, M.F. Design of a permanent magnet actuator for linear and rotary movements. Eur. Phys. J. Appl. Phys. 2008, 44, 77–85. [Google Scholar] [CrossRef]
- Xu, L.; Lin, M.; Fu, X.; Li, N. Design and analysis of a double-stator linear–rotary permanent-magnet motor. IEEE Trans. Appl. Supercond. 2016, 26, 1–4. [Google Scholar] [CrossRef]
- Mousavi, A.; Akbarzadeh, A.; Shariatee, M.; Alimardani, S. Design and construction of a linear-rotary joint for robotics applications. In Proceedings of the 2015 3rd RSI International Conference on Robotics and Mechatronics (ICROM), Tehran, Iran, 7–9 October 2015; pp. 229–233. [Google Scholar]
- Szabó, L.; Benţia, I.; Ruba, M. A rotary-linear switched reluctance motor for automotive applications. In Proceedings of the 2012 XXth International Conference on Electrical Machines, Marseille, France, 2–5 September 2012; pp. 2615–2621. [Google Scholar]
- Chowdhury, M.A.; Hossain, N.; Masum, A.A.; Islam, M.S.; Shahin, M.; Hossain, M.I.; Shuvho, M.B.A.; Ali, M.R.; Ahmed, A.K.M.F.; Nandee, M.R. Surface coatings analysis and their effects on reduction of tribological properties of coated aluminum under motion with ML approach. Mater. Res. Express 2021, 8, 086508. [Google Scholar] [CrossRef]
- Kavimani, V.; Prakash, K.S. Tribological behaviour predictions of r-GO reinforced Mg composite using ANN coupled Taguchi approach. J. Phys. Chem. Solids 2017, 110, 409–419. [Google Scholar] [CrossRef]
- Ravinder, K.; Chauhan, S. Study on surface roughness measurement for turning of Al 7075/10/SiCp and Al 7075 hybrid composites by using response surface methodology (RSM) and artificial neural networking (ANN). Measurement 2015, 65, 166–180. [Google Scholar]
- Rosenkranz, A.; Marian, M.; Profito, F.J.; Aragon, N.; Shah, R. The use of artificial intelligence in tribology—A perspective. Lubricants 2021, 9, 2. [Google Scholar] [CrossRef]
- Ramachandran, R. Machine Learning Model to Map Tribocorrosion Regimes in Feature Space. Coatings 2021, 11, 450. [Google Scholar] [CrossRef]
- Desai, P.S.; Victoria Granja, V.; Higgs, F.C. Lifetime Prediction Using a Tribology-Aware, Deep Learning-Based Digital Twin of Ball Bearing-Like Tribosystems in Oil and Gas. Processes 2021, 9, 922. [Google Scholar] [CrossRef]
- Zhang, E.; Gao, F.; Fu, R.; Lu, Y.; Han, X.; Su, L. Tribological Behavior of Phenolic Resin-Based Friction Composites Filled with Graphite. Materials 2021, 14, 742. [Google Scholar] [CrossRef] [PubMed]
- Omrani, E.; Moghadam, A.D.; Kasar, A.K.; Rohatgi, P.; Menezes, P.L. Tribological performance of Graphite nanoplatelets reinforced Al and Al/Al2O3 self-lubricating composites. Materials 2021, 14, 1183. [Google Scholar] [CrossRef]
- Kaczorowski, W.; Świątek, H.; Łuczak, K.; Głuszek, M.; Cłapa, M. Impact of Plasma Pre-Treatment on the Tribological Properties of DLC Coatings on PDMS Substrates. Materials 2021, 14, 433. [Google Scholar] [CrossRef]
- Elisabeth, G.; Kahlert, M.; Vollmer, M.; Niendorf, T.; Greiner, C. Tribological Performance of Additively Manufactured AISI H13 Steel in Different Surface Conditions. Materials 2021, 14, 928. [Google Scholar]
- Minami, I.; Sugibuchi, A. Surface Chemistry of Aluminium Alloy Slid against Steel Lubricated by Organic Friction Modifier in Hydrocarbon Oil. Adv. Tribol. 2012, 2012, 926870. [Google Scholar] [CrossRef] [Green Version]
- Canute, S.; Bhat, S.; Hebbar, S.P. A Brief Review on Nickel and Chromium Coatings Developed by Electrochemical Route. AIP Publishing LLC: College Park, MD, USA, 2020; Volume 2236, p. 040007. [Google Scholar]
- Moniruzzaman, M.; Rakib, M.; Matin, F. Cr-Ni Alloy Electrodeposition and Comparison with Conventional Pure Cr Coating Technique. Int. J. Automot. Mech. Eng. 2012, 6, 692–700. [Google Scholar] [CrossRef]
- Cao, T.; Zhu, Z.; Liu, Y. Preparation of a Self-Lubricating Cu/h-BN Coating on Cemented Carbide. Adv. Mater. Sci. Eng. 2018, 2018, 8150791. [Google Scholar] [CrossRef] [Green Version]
- Gong, H.; Yu, C.; Zhang, L.; Xie, G.; Guo, D.; Luo, J. Intelligent lubricating materials: A review. Compos. Part B Eng. 2020, 202, 108450. [Google Scholar]
- Yan, H.; Chen, Z.; Zhao, J.; Zhang, P.; Yu, Z.; Lu, Q. Enhancing tribological properties of WS2/NbC/Co-based self-lubricating coating via laser texturing and laser cladding two-step process. J. Mater. Res. Technol. 2020, 9, 9907–9919. [Google Scholar] [CrossRef]
- Ghanem, F.; Stremsdoerfer, G.; Cornuault, P.H.; Meas-Vong, Y.; Ortega-Borges, R. Characterization of Cu/Ni-B multilayers deposited by dynamic chemical plating. Plat. Surf. Finish. 2005, 92, 33–36. [Google Scholar]
- Costa, D.; Tavares, M.V.; Neagu, C.; Fayet, P.; Wiklund, U.; Li, H.; Leifer, K.; Gamstedt, E.K. Comparison of test methods estimating the stiffness of ultrathin coatings. J. Coat. Technol. Res. 2018, 15, 743–752. [Google Scholar] [CrossRef] [Green Version]
- Macdonald, W.A.; Looney, M.K.; MacKerron, D.; Eveson, R.; Adam, R.; Hashimoto, K.; Rakos, K. Latest advances in substrates for flexible electronics. J. Soc. Inf. Disp. 2007, 15, 1075–1083. [Google Scholar] [CrossRef]
- Zhu, Y.; Zou, J.; Chen, X.; Yang, H. Tribology of selective laser melting processed parts: Stainless steel 316L under lubricated conditions. Wear 2016, 350, 46–55. [Google Scholar] [CrossRef]
- Rahaman, M.L.; Zhang, L.; Liu, M.; Liu, W. Surface roughness effect on the friction and wear of bulk metallic glasses. Wear 2015, 332, 1231–1237. [Google Scholar] [CrossRef]
- Lin, B.; Wang, H.; Wei, J.; Zheng, W.; Ma, Y.; Wang, J.; Sui, T. Dry sliding tribological behavior of C/SiC under different load and speed. Ceram. Int. 2021, 47, 8627–8633. [Google Scholar] [CrossRef]
- Yu, H.; Chen, H.; Zheng, Z.; Ba, Z.; Qiao, D.; Feng, D.; Gong, Z.; Dong, G. Transformation mechanism between the frictional interface under dioctyl sebacate lubrication. Tribol. Int. 2021, 155, 106745. [Google Scholar] [CrossRef]
- Tavakoli, S.; Hajibagheri, A.; Sukthankar, G. Learning social graph topologies using generative adversarial neural networks. In Proceedings of the International Conference on Social Computing, New York, NY, USA, 5–7 August 2017. [Google Scholar]
- Tavakoli, S.; Yooseph, S. Algorithms for inferring multiple microbial networks. In Proceedings of the 2019 IEEE International Conference on Bioinformatics and Biomedicine (BIBM), San Diego, CA, USA, 18–21 November 2019; pp. 223–227. [Google Scholar]
- Roshani, M.; Phan, G.; Faraj, R.H.; Phan, N.H.; Roshani, G.H.; Nazemi, B.; Nazemi, E. Proposing a gamma radiation based intelligent system for simultaneous analyzing and detecting type and amount of petroleum by-products. Nucl. Eng. Technol. 2021, 53, 1277–1283. [Google Scholar] [CrossRef]
- Yan, Y. Tribology and tribo-corrosion testing and analysis of metallic biomaterials. In Metals for Biomedical Devices; Woodhead Publishing: Sawston, UK, 2010; pp. 178–201. [Google Scholar]
- Stachowiak, G.W.; Batchelor, A.W. Engineering Tribology; Butterworth Heinemann: Woburn, UK, 2001. [Google Scholar]
- Li, J.-S.; Qu, Y.-G.; Hua, H.-X. Numerical analysis of added mass and damping of elastic hydrofoils. J. Hydrodyn. 2020, 32, 1009–1023. [Google Scholar] [CrossRef]
- Xie, Z.; Zhu, W. An investigation on the lubrication characteristics of floating ring bearing with consideration of multi-coupling factors. Mech. Syst. Signal. Process. 2022, 162, 108086. [Google Scholar] [CrossRef]
- Dai, H.; Abdelkefi, A.; Ni, Q.; Wang, L. Modeling and identification of circular cylinder-based piezoaeroelastic energy harvesters. Energy Procedia 2014, 61, 2818–2821. [Google Scholar] [CrossRef] [Green Version]
- Saleem, S.S.; Wani, M.F. Tribological characterization of N 80A and 21-4N valve materials against GGG-40 seat material under dry sliding conditions at temperatures to 500 °C. ASME J. Tribol. 2017, 139, 061605. [Google Scholar] [CrossRef]
- Ashraf, U.; Saleem, S.S.; Wani, M.F.; Khan, M.J. Effect of load on the tribo-performance of 23-8N valve steel against GGG-60 seat material. Mater. Today Proc. 2019, 19, 349–353. [Google Scholar] [CrossRef]
- Naika, M.P.; Padal, K.T.B. A review on friction and wear performance of Al-Si alloy/steel tribopair. Mater. Today Proc. 2019, 18, 5502–5506. [Google Scholar] [CrossRef]
- Zapletal, T.; Sperka, P.; Krupka, I.; Hartl, M. The effect of surface roughness on friction and film thickness in transition from EHL to mixed lubrication. Tribol. Int. 2018, 128, 356–364. [Google Scholar] [CrossRef]
- Wang, A.Y.; Mo, J.L.; Wang, X.C.; Zhu, M.H.; Zhou, Z.R. Effect of surface roughness on friction-induced noise: Exploring the generation of squeal at sliding friction interface. Wear 2018, 402, 80–90. [Google Scholar] [CrossRef]
- Ibrahim, D.; Mezghani, S.; Yousfi, M.; Zahouani, H.; Mansori, M.E. The scale effect of roughness on hydrodynamic contact friction. Tribol. Trans. 2012, 55, 705–712. [Google Scholar]


| SL. | Friction at 3.5 N Applied Force, 0.45 m/s Disc Velocity, 0.15 m/s Pin Velocity, and without Lubricant | Comparison of Friction at 3.5 N Applied Force, 0.15 m/s Pin Motion, and without Lubricant with the First One (%) | Comparison of Friction at 3.5 N Applied Force, 0.45 m/s Disc Motion, 0.15 m/s Pin Motion, and with Lubricant with the First One (%) | Comparison of Friction at 3.5 N Applied Force, 0.15 m/s Pin Motion, and with Lubricant with the First One (%) |
|---|---|---|---|---|
| 1 | 0.18961 | −5.273983 | −13.13749 | −16.9664 |
| 2 | 0.18961 | −5.273983 | −12.27783 | −16.18058 |
| 3 | 0.19125 | −5.228758 | −13.03007 | −16.72157 |
| 4 | 0.19125 | −4.371242 | −12.17255 | −16.12026 |
| 5 | 0.19289 | −5.184302 | −12.06905 | −16.83343 |
| 6 | 0.19452 | −5.14086 | −11.96792 | −16.76434 |
| 7 | 0.19289 | −3.489035 | −11.22401 | −16.06097 |
| 8 | 0.19452 | −3.459798 | −11.12482 | −16.76434 |
| 9 | 0.19616 | −4.266925 | −11.86786 | −16.70065 |
| 10 | 0.19616 | −3.430873 | −12.70392 | −16.70065 |
| 11 | 0.19616 | −2.594821 | −12.70392 | −17.46024 |
| 12 | 0.19779 | −3.397543 | −14.24743 | −17.38713 |
| 13 | 0.19616 | −3.430873 | −13.53487 | −15.93597 |
| 14 | 0.19452 | −3.459798 | −13.64898 | −16.76434 |
| 15 | 0.19452 | −3.459798 | −14.49208 | −16.76434 |
| SL. | Wear Rate at 3.5 N Load, 0.45 m/s disc, 0.15 m/s Pin Velocity, and Dry Condition | Variation of Wear Rate at 3.5 N Load, 0.15 m/s Pin Motion, and Dry Condition with the First One (%) | Variation of Wear Rate at 3.5 N Load, 0.45 m/s Disc Motion, 0.15 m/s Pin Motion, and with Lubricant with the First One (%) | Variation of Wear Rate at 3.5 N Load, 0.15 m/s Pin Motion, and with Lubricant with the First One (%) |
|---|---|---|---|---|
| 1 | 0.45 | −62.88889 | −86.66667 | −95.55556 |
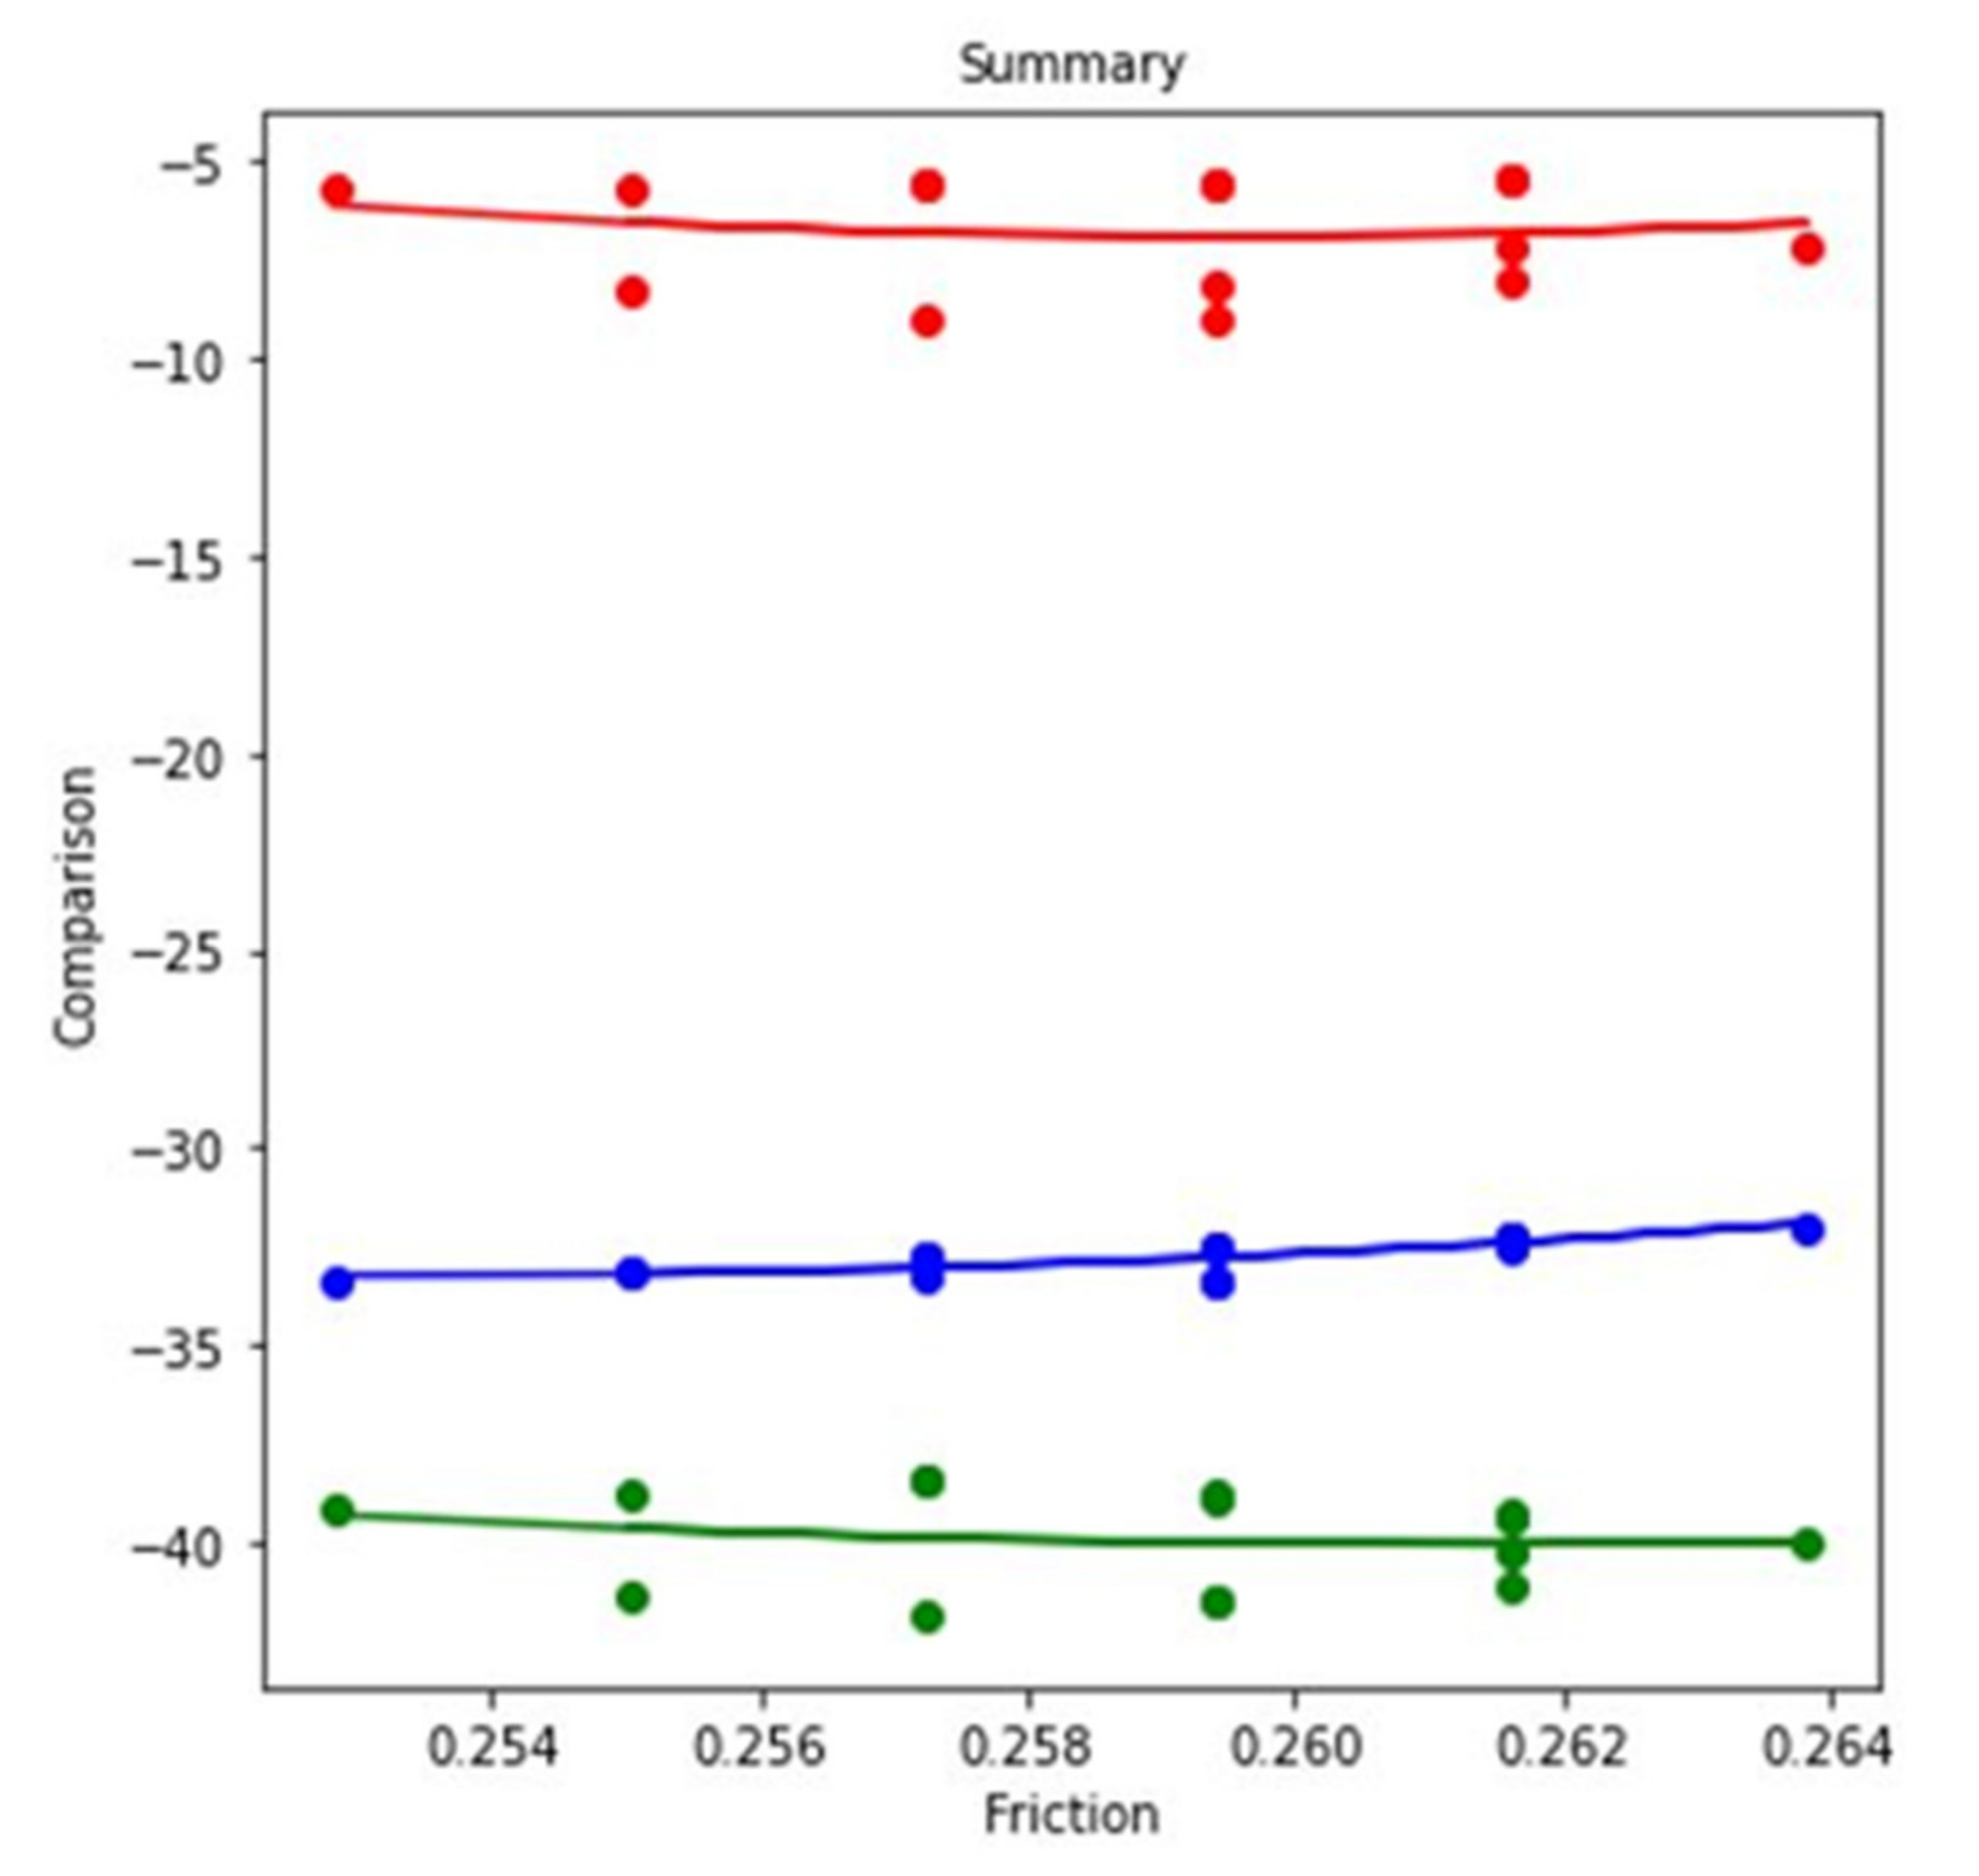
| SL. | Friction at 2.5 N Load, 0.45 m/s Disc, 0.25 m/s Pin Velocity, and No Lubricant | Comparison of Friction at 2.5 N load, 0.25 m/s Pin Velocity, and No Lubricant with the First One (%) | Comparison of Friction at 2.5 N Applied Force, 0.35 m/s Disc, 0.15 m/s Pin Velocity, and No Lubricant with the First One (%) | Comparison of Friction at 2.5 N Load, 0.15 m/s Pin Velocity, and No Lubricant with the First One (%) |
|---|---|---|---|---|
| 1 | 0.25283 | −33.38211 | −5.695527 | −39.07764 |
| 2 | 0.25503 | −33.09415 | −5.646395 | −38.74054 |
| 3 | 0.25723 | −33.27761 | −5.598103 | −38.40921 |
| 4 | 0.25723 | −32.8111 | −5.598103 | −38.40921 |
| 5 | 0.25943 | −33.38087 | −5.55063 | −38.77732 |
| 6 | 0.25943 | −32.53286 | −5.55063 | −38.85441 |
| 7 | 0.26163 | −32.4657 | −5.503956 | −39.29213 |
| 8 | 0.26163 | −32.2593 | −5.503956 | −39.36857 |
| 9 | 0.26383 | −31.9903 | −7.125801 | −39.94997 |
| 10 | 0.26163 | −32.2593 | −7.18572 | −40.2859 |
| 11 | 0.26163 | −32.2593 | −8.026602 | −41.12678 |
| 12 | 0.25943 | −32.53286 | −8.094669 | −41.47554 |
| 13 | 0.25943 | −33.38087 | −8.942682 | −41.47554 |
| 14 | 0.25723 | −32.8111 | −9.019166 | −41.83027 |
| 15 | 0.25503 | −33.09415 | −8.234325 | −41.32847 |
| SL. | Wear Rate at 2.5 N Applied Force, 0.45 m/s Disc Velocity, 0.25 m/s Pin Velocity, and Dry Condition | Comparison of Wear Rate at 2.5 N Applied Force, 0.25 m/s Pin Velocity, and Dry Condition with the First One (%) | Comparison of Wear Rate at 2.5 N Applied Force, 0.35 m/s Disc Velocity, 0.15 m/s Pin Velocity, and Dry Condition with the First One (%) | Comparison of Wear Rate at 2.5 N Applied Force, 0.15 m/s Pin Velocity, and Dry Condition with the First One (%) |
|---|---|---|---|---|
| 1 | 0.47 | −63.82979 | −25.53191 | −68.08511 |
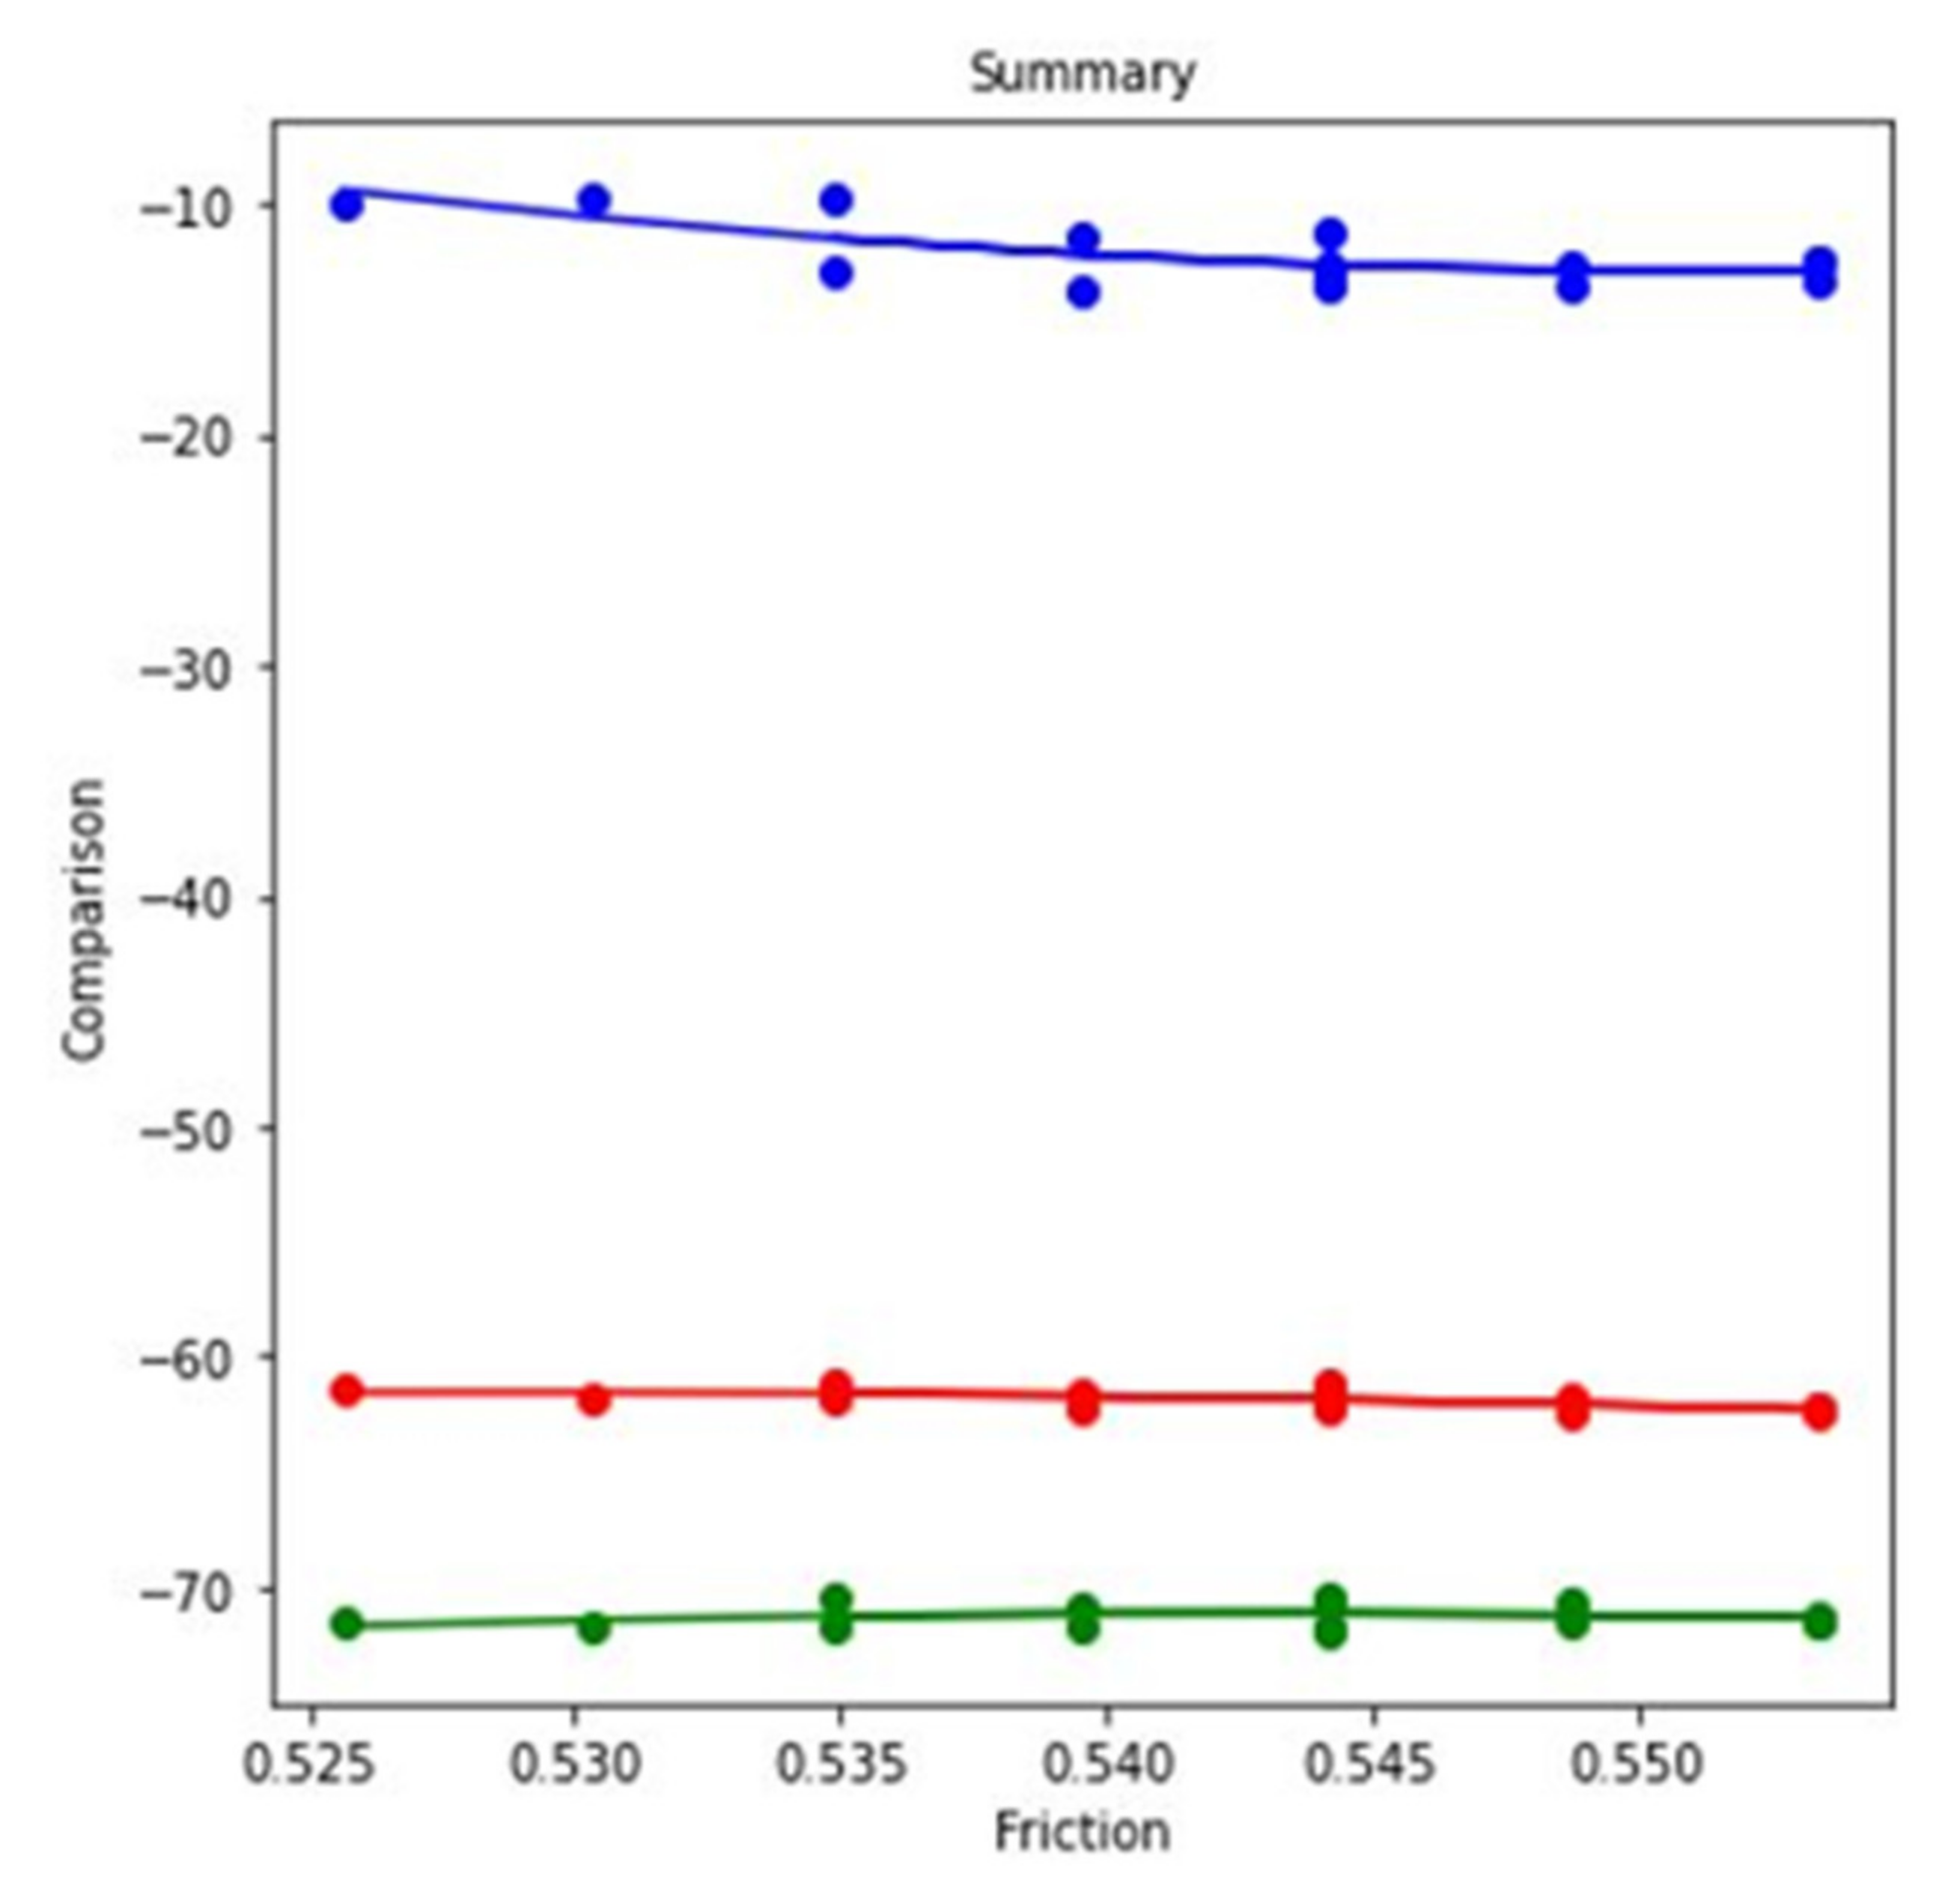
| SL. | Friction at 1.5 N Load, 0.45 m/s Disc, 0.2 m/s Pin Velocity, and Dry Condition | Variation of Friction at 1.5 N Load, 0.2 m/s Pin Velocity, and Dry Condition with the First One (%) | Variation of Friction at 4.5 N Load, 0.45 m/s Disc, 0.2 m/s Pin Velocity, and Dry Condition with the First One (%) | Variation of Friction at 4.5 N Load, 0.2 m/s Pin Velocity, and Dry Condition with the First One (%) |
|---|---|---|---|---|
| 1 | 0.52566 | −9.939885 | −61.45607 | −71.53864 |
| 2 | 0.53028 | −9.853285 | −61.79188 | −71.7866 |
| 3 | 0.53491 | −9.769868 | −61.81601 | −71.72422 |
| 4 | 0.53953 | −11.39881 | −62.14298 | −71.66237 |
| 5 | 0.54416 | −13.00169 | −62.1637 | −71.90348 |
| 6 | 0.54416 | −11.164 | −62.04793 | −71.60394 |
| 7 | 0.54878 | −12.75557 | −62.48223 | −71.54415 |
| 8 | 0.55341 | −12.51333 | −62.50158 | −71.48769 |
| 9 | 0.55341 | −12.51333 | −62.20524 | −71.48769 |
| 10 | 0.55341 | −13.34996 | −62.20524 | −71.19134 |
| 11 | 0.54878 | −13.46077 | −61.88637 | −70.64944 |
| 12 | 0.54416 | −12.72604 | −61.26323 | −70.40025 |
| 13 | 0.54416 | −13.57689 | −61.56278 | −70.70163 |
| 14 | 0.53953 | −13.69155 | −61.53689 | −70.75417 |
| 15 | 0.53491 | −12.9461 | −61.20469 | −70.50158 |
| SL. | Wear Rate at 1.5 N Load, 0.45 m/s Disc Velocity, 0.2 m/s Pin Velocity, and Dry Condition | Comparison of Wear Rate at 1.5 N Load, 0.2 m/s Pin Velocity, and Dry Condition with the First One (%) | Comparison of Wear Rate at 4.5 N Applied Force, 0.45 m/s Disc, 0.2 m/s Pin Velocity, and Dry Condition with the First One (%) | Comparison of Wear Rate at 4.5 N Load, 0.2 m/s Pin Velocity, and Dry Condition with the First One (%) |
|---|---|---|---|---|
| 1 | 0.36 | −55.55556 | +73.6111 | −33.33333 |
Publisher’s Note: MDPI stays neutral with regard to jurisdictional claims in published maps and institutional affiliations. |
© 2021 by the authors. Licensee MDPI, Basel, Switzerland. This article is an open access article distributed under the terms and conditions of the Creative Commons Attribution (CC BY) license (https://creativecommons.org/licenses/by/4.0/).
Share and Cite
Hossain, N.; Chowdhury, M.A.; Masum, A.A.; Islam, M.S.; Shahin, M.; Irfan, O.M.; Djavanroodi, F. Effects of Self-Lubricant Coating and Motion on Reduction of Friction and Wear of Mild Steel and Data Analysis from Machine Learning Approach. Materials 2021, 14, 5732. https://doi.org/10.3390/ma14195732
Hossain N, Chowdhury MA, Masum AA, Islam MS, Shahin M, Irfan OM, Djavanroodi F. Effects of Self-Lubricant Coating and Motion on Reduction of Friction and Wear of Mild Steel and Data Analysis from Machine Learning Approach. Materials. 2021; 14(19):5732. https://doi.org/10.3390/ma14195732
Chicago/Turabian StyleHossain, Nayem, Mohammad Asaduzzaman Chowdhury, Abdullah Al Masum, Md. Sakibul Islam, Mohammad Shahin, Osama M. Irfan, and Faramarz Djavanroodi. 2021. "Effects of Self-Lubricant Coating and Motion on Reduction of Friction and Wear of Mild Steel and Data Analysis from Machine Learning Approach" Materials 14, no. 19: 5732. https://doi.org/10.3390/ma14195732