
Evaluation of the Corrosion Behavior of Reinforced Concrete with an Inhibitor by Electrochemical Impedance Spectroscopy


1
Korea Institute of Future Convergence Technology, Hankyong National University, Anseong 17579, Korea
2
Industry Academic Cooperation Foundation, Hankyong National University, Anseong 17579, Korea
*
Author to whom correspondence should be addressed.
Materials 2021, 14(19), 5508; https://doi.org/10.3390/ma14195508
Submission received: 24 August 2021
/
Revised: 15 September 2021
/
Accepted: 17 September 2021
/
Published: 23 September 2021
(This article belongs to the Special Issue Reinforced Concrete Structures for Durability and Corrosion Resistance)
Abstract
:In this study, the effect of NaCl and LiNO2 content on the deterioration of embedded rebars in concrete due to corrosion was examined by measuring the natural potential and impedance. Wet–dry cycles were performed to accelerate the corrosion of embedded rebars in reinforced concrete, following which the potential and impedance corresponding to the cycles were measured. For the reinforced concrete containing only NaCl, the passive film of the embedded rebar surfaces deteriorated after two weeks of accelerated corrosion, and its polarization resistance decreased. When 0.6 M LiNO2 per NaCl was added, the reinforced concrete deteriorated at the same rate as the normal embedded rebars, and the polarization resistance was higher than the initial values. When 1.2 M LiNO2 per NaCl was added, the passive film of the embedded rebars remained intact even after 10 weeks of accelerated corrosion, protecting the rebars from deterioration.
1. Introduction
The use of reinforced concrete with embedded rebars has been increasing with the rapid advancement of the industry. Corrosion of rebars embedded in reinforced concrete is one of the major factors that affects the durability of concrete structures. In addition, despite the layering of concrete, the rebars embedded within concrete corrode, thereby making it easy for chloride ions to penetrate [1,2].
Embedded rebars are protected from corrosion by stable passive films formed in the strong alkaline (pH > 12.5) environment of concrete [3,4]. However, in recent years, the usage of crushed and washed sea sand mixtures in concrete has led to a scarcity of natural aggregates, such as river gravel and sand [5,6]. Particularly, in terms of sea sand, the presence of chloride ions in the form of NaCl and MgCl2 destabilizes the passive films around the embedded rebars, leading to the corrosion of the rebars from the electrochemical potential [7,8,9,10].
The volume of the rebars increases as corrosion propagates and accelerates due to the corrosion products, resulting in concrete cracks. Extensive literature on the corrosion of embedded rebars and its measurements are available [11,12]. Examples of electrochemical techniques adopted to analyze the same include the spontaneous polarization method, linear polarization resistance measurements, and electrochemical impedance spectroscopy (EIS). EIS has been widely used as it allows one to quantitatively calculate the degree of corrosion and continuously observe the crack behavior of rebars [13,14,15,16,17].
To establish fundamental research data, the electrochemical corrosion behavior of embedded rebars in concrete and the effects of chloride ions and corrosion inhibitors are analyzed using electrochemical techniques. Furthermore, to reduce the time required for corrosion of the rebars, a corrosion acceleration method was implemented. Corrosion acceleration was applied to the reinforced concrete specimen, and the characteristic changes in the open circuit potential (OCP) and impedance of the rebar embedded in the concrete, according to the corrosion acceleration time, were observed [18,19].
The changes in the impedance, solution resistance (Rs), and polarization resistance (Rp) in the embedded rebars of the reinforced concrete were observed over several cycles of accelerated corrosion. The effects of chloride ions and the corrosion inhibitor content on the corrosion behavior of the embedded rebars were subsequently compared and analyzed. The results were used to evaluate the anticorrosive performance of the inhibitor and suggest the appropriate amount of inhibitor used.
2. Materials and Methods
2.1. Materials
Type 1 ordinary Portland cement (OPC), compliant with the ASTM C 150 standard [20], with a density of 3.15 g/cm3 (Ssangyong Company, Seoul, Korea) was used in this study. Table 1 details the chemical composition of OPC.
Domestically sourced crushed stones were used as coarse aggregates, and domestically sourced washed sand was used as the fine aggregate. Polycarbonate admixtures were obtained from S.P (Dongnam company, Pyeongtaek, South Korea). Moreover, NaCl (Duksan company, Ansan, Korea) was used as the source of the chloride ions and LiNO2 (Honjo Chemical, Tokyo, Japan) was used as the corrosion inhibitor [21,22].
KS D 3504 D13 rebars (SD400, Hyundai steel, Seoul, Korea) were used for reinforcing concrete [23], and were preprocessed with sandpaper and acetone (Duksan Company, Ansan, Korea) to remove any preexisting corrosion products and accelerate corrosion by peeling off the coating on the surface of the rebar. Furthermore, the surface area not in contact with the concrete was coated with epoxy (Samhwa Paints, Ansan, Korea).
2.2. Concrete Mix Proportion
To analyze the effect of the polycarbonate additives on the corrosion behavior of the embedded rebars in concrete, four mixtures of varying concentrations were produced; details of the same are provided in Table 2 and Table 3. The control groups included concrete without introducing chloride ions (normal) and concrete with 1.2 kg/m3 chloride ions (C12). Additionally, 0 M LiNO2, 0.6 M LiNO2 (C12N6), and 1.2 M LiNO2 (C12N12) were added to the concrete samples containing chloride ions. Table 2 shows the concrete mix proportions, while Table 3 shows the concentrations of the NaCl and LiNO2 added.
2.3. Specimens
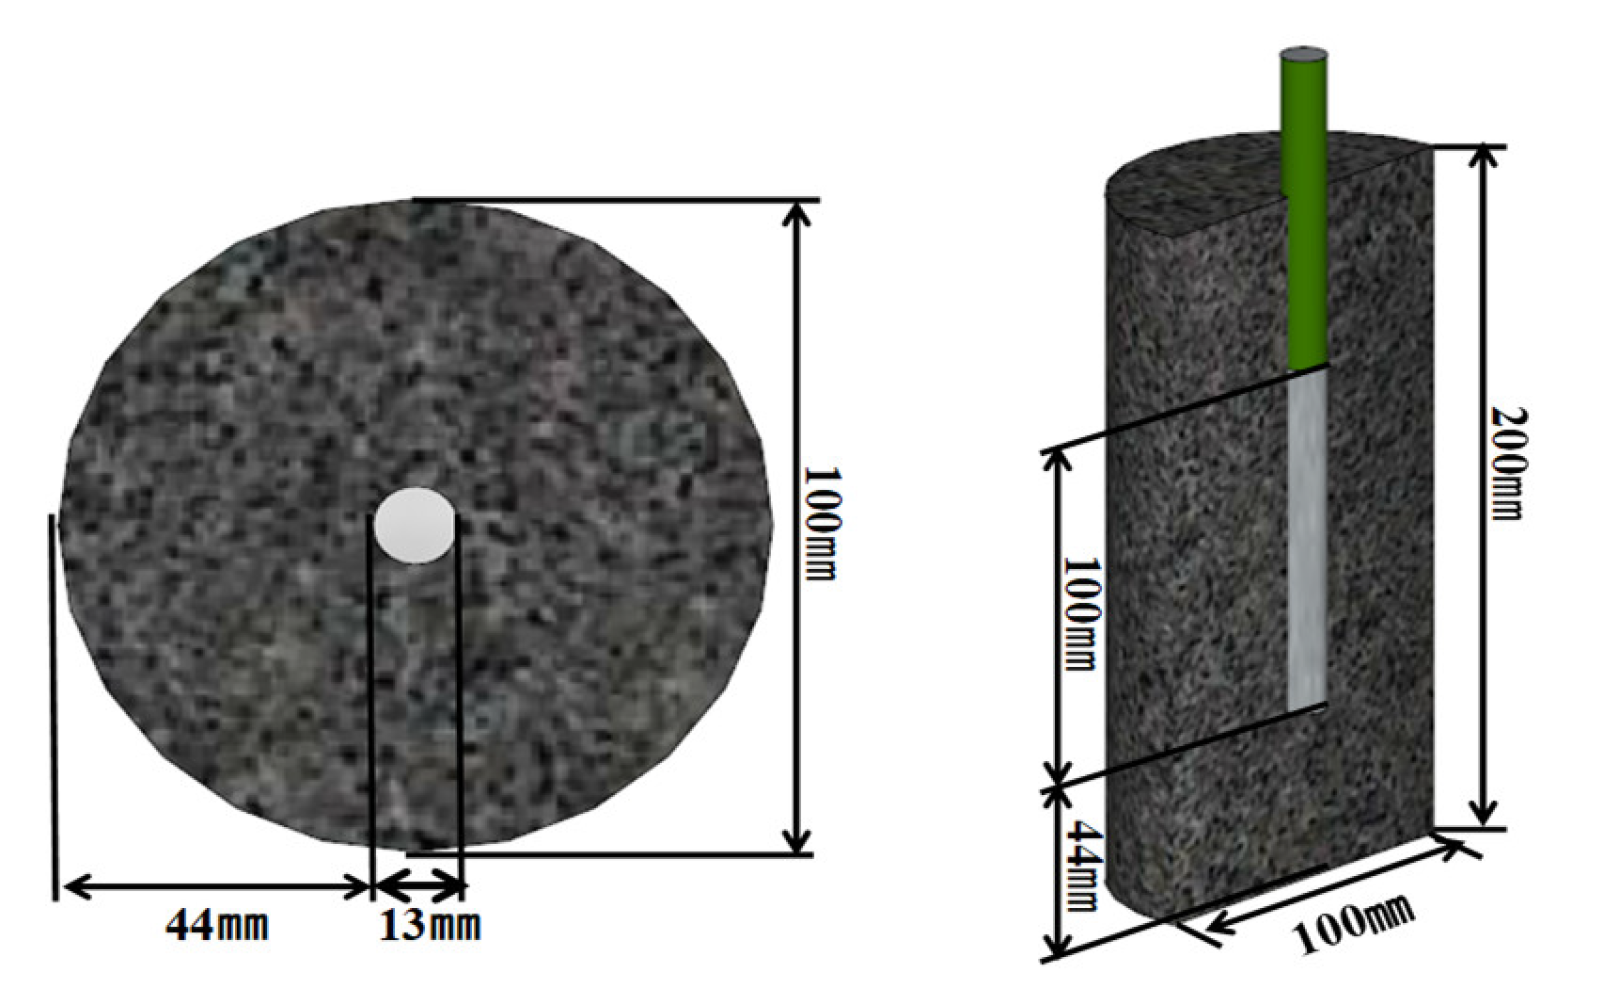
To measure the corrosion behavior of the rebars embedded in concrete and evaluate the corrosion area, a reinforced concrete specimen was prepared. The reinforced concrete specimens were prepared by fixing a ϕ13 mm rebar (SD-400 deformed) at the center of a Ø100 × 200 mm cylindrical mold and then pouring the concrete into the mold. After cleaning the rebar surface by grit blasting, an epoxy coating was applied to the surface to observe the penetrating effect of the NaCl from the concrete immersed in the NaCl solution; only a length of 100 mm at the center of the concrete specimen was exposed. Figure 1 illustrates the fabricated reinforced concrete specimen. The specimen was demolded 24 h later and cured for 28 days.
2.4. Accelerated Corrosion of Reinforced Concrete
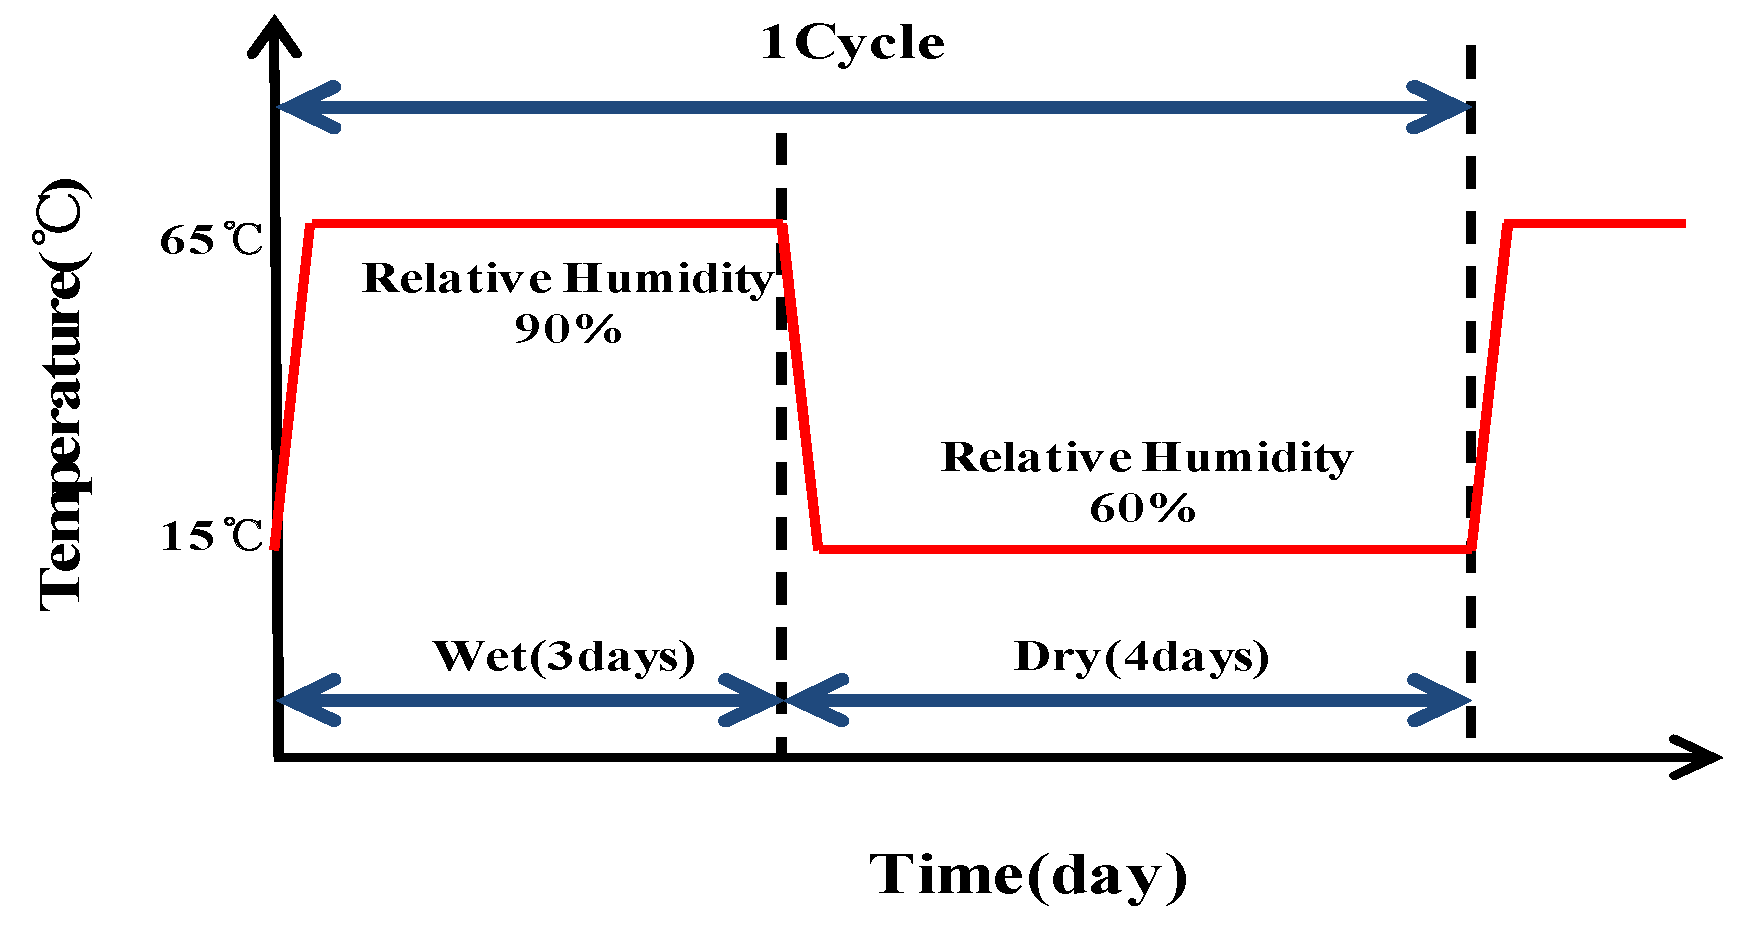
As one of the test methods to accelerate corrosion of the reinforced bars, the wetting-drying process was used. Wet–dry cycles accelerate corrosion due to the presence of excess water, and high temperature and humidity, thereby facilitating the diffusion of oxygen. However, as the water content increases, the diffusion of oxygen decreases; accordingly, the temperature and humidity are lowered so as to encourage diffusion and promote further corrosion. This approach was applied in the cycles performed herein to accelerate corrosion of the embedded rebars in concrete [24,25]. Figure 2 illustrates the cycle conditions.
A temperature and humidity chamber was used to maintain a constant wet period (temperature of 65 °C, relative humidity of 90%) for three days and a constant dry period (15 °C, 60%) for four days; hence, each wet–dry cycle was 1-week-long [26]. At the end of each cycle, the test specimen was immersed in 3.5 wt% NaCl solution for 24 h to stabilize its open circuit potential before measuring its impedance. Accelerated corrosion started immediately following the experiment.
2.5. Electrochemical Measurement
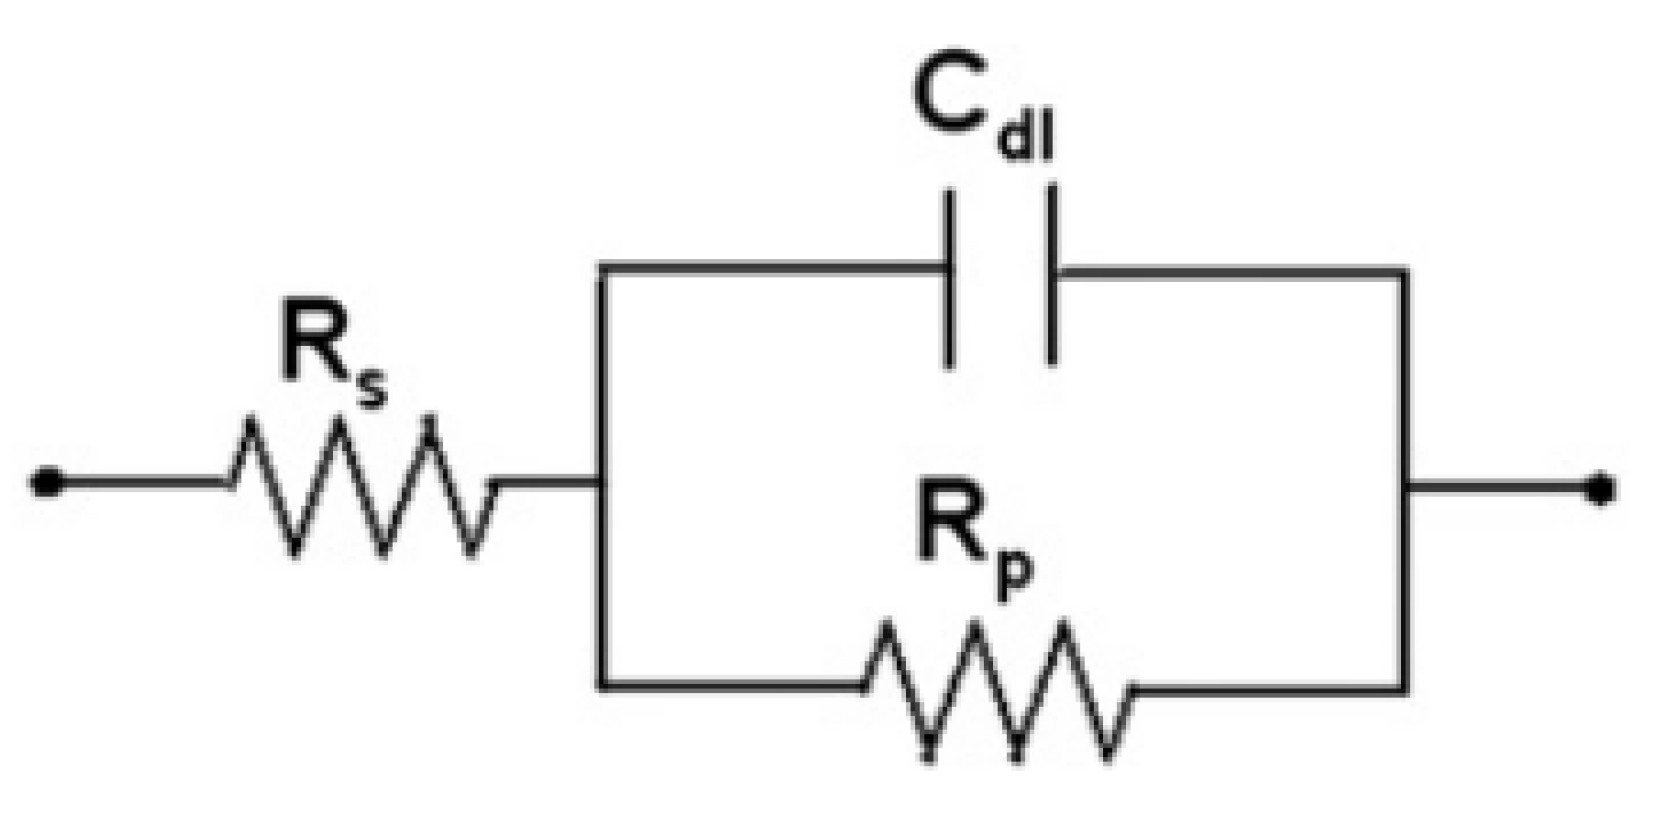
According to the electrochemical theory, a simple electrochemical electrode system can be described by an equivalent circuit [14,15,16,17], as shown in Figure 3.
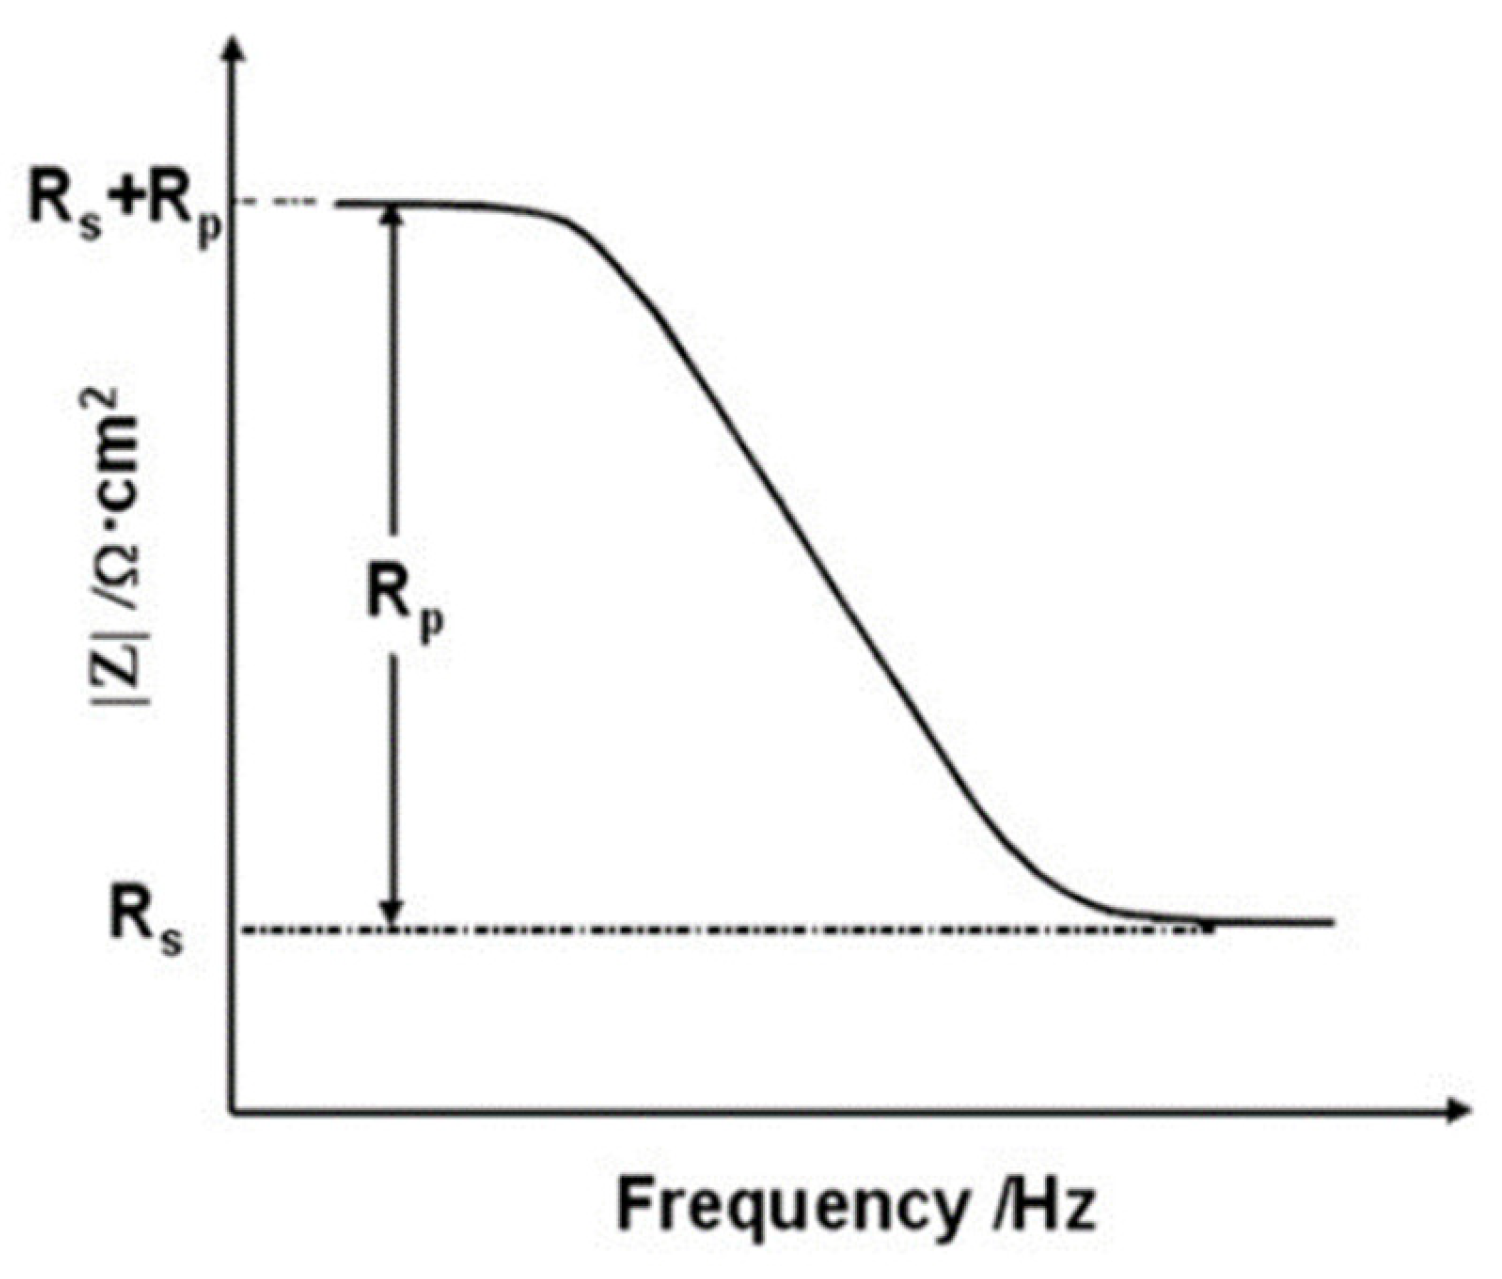
Here, Rs denotes the solution resistance, Cdl is the capacitance of an electrical double layer, and Rp is the polarization resistance by the charge transfer reaction. Figure 4 shows a Bode plot corresponding to the impedance results obtained by using the circuit in Figure 3.
Rs corresponds to the impedance at the highest frequency and Rs + Rp corresponds to the impedance at the lowest frequency. For the rebar-embedded concrete, the Rp of the rebar accounts for contributions from the resistance of the film Rf and the charge transfer resistance Rct [14,15,16,17]. Therefore, the corrosion resistance of the rebars can be represented by Rp. In EIS, it can be assumed that the value of the Bode plot at 100 kHz is equal to Rs and that at 0.1 Hz is equal to Rs + Rp. Therefore, Rp can be calculated.
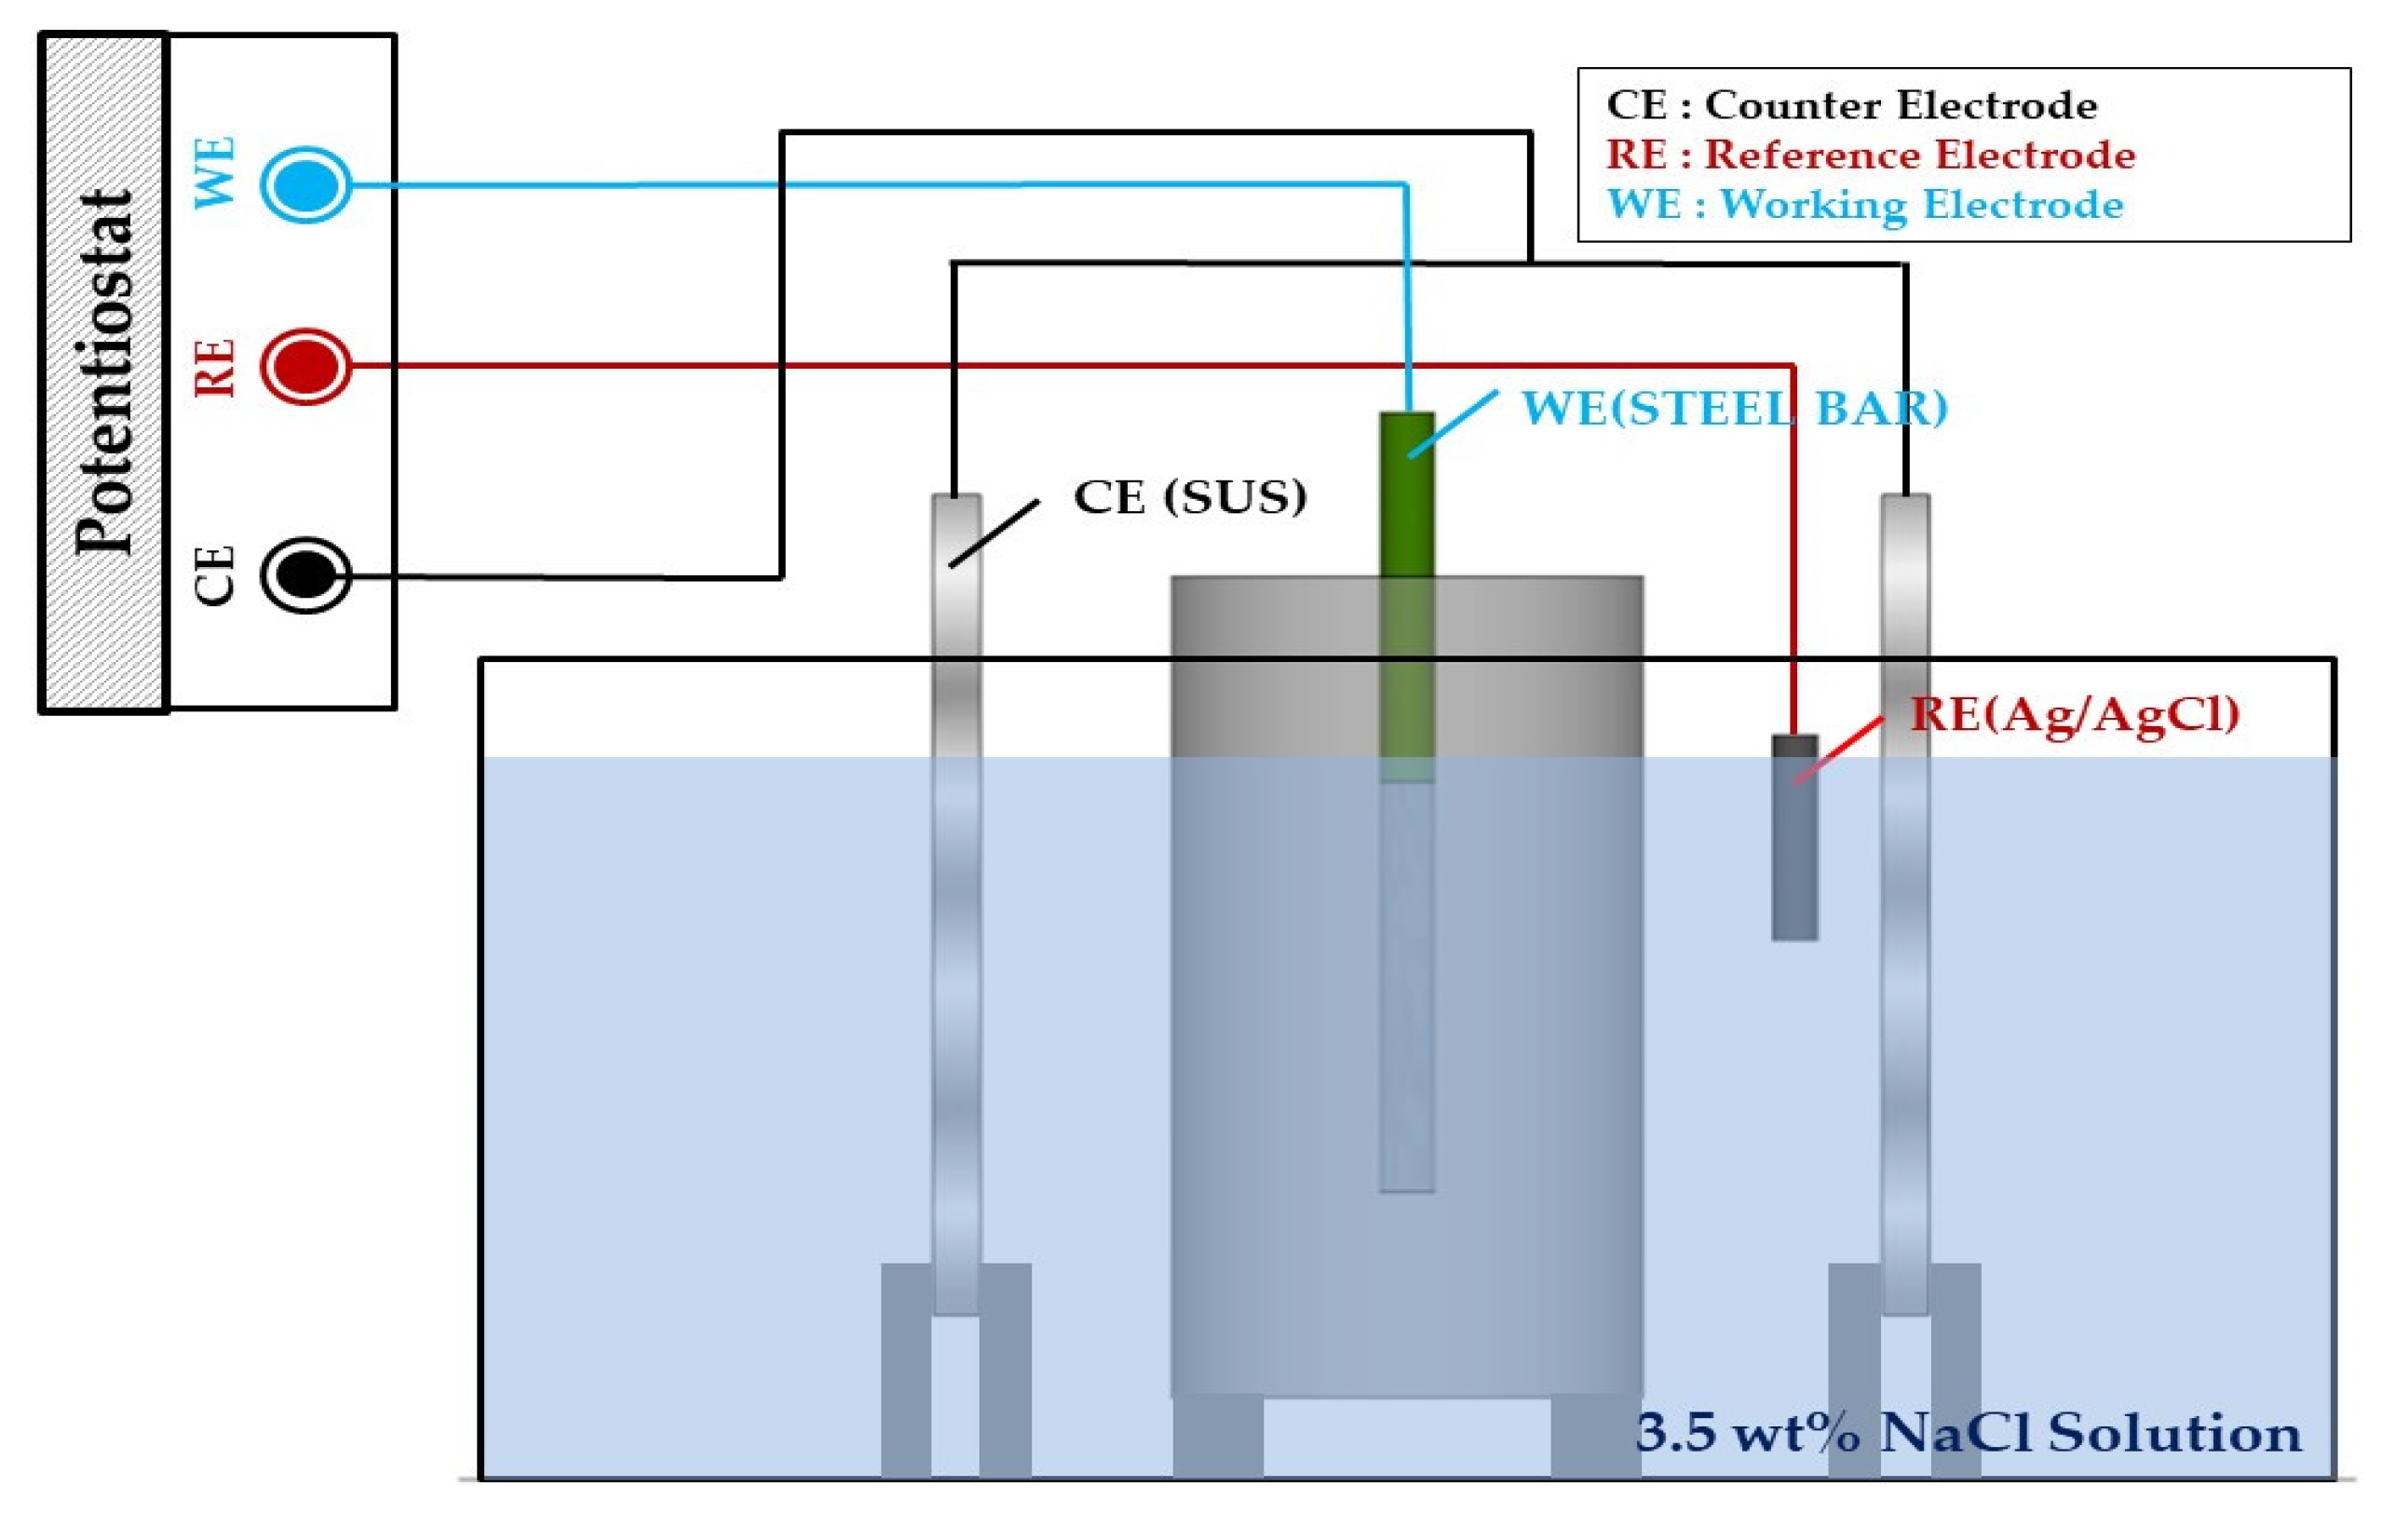
EIS was performed to measure the impedance of the reinforced concrete after each wet–dry cycle [27,28,29,30] using a potentiostat (PGSTAT302N, Metrohm Autolab B.V., Utrecht, The Netherlands). A three-electrode system was employed, using the rebar as a working electrode (WE), SUS304 as a counter electrode (CE), and Ag/AgCl as a reference electrode (RE). Additionally, before performing EIS for every week of the wet–dry cycle, the rebar was immersed in 3.5 wt% NaCl solution at 25 °C. The experiment is illustrated and summarized in Figure 5 and Table 4 [31].
For EIS, the electrode was allowed to stabilize to an open circuit immersed in a 3.5 wt% NaCl solution for 24 h. An AC voltage in the range of 10−1 Hz−105 Hz was applied using a potentiostat. The data were subsequently analyzed using Nova software (Metrohm Autolab B.V., Utrecht, The Netherlands).
3. Result and Discussion
3.1. OCP Results
Metals used in rebars have a unique equilibrium electrode potential. This value is negatively related to the RE and represents the likelihood of the metal to ionize. This phenomenon is known to reflect its degree of corrosion [32,33]. Table 5 shows the criteria for determining rebar corrosion according to the rebar potentials by the type of RE in ASTM C 876 [34] used to determine rebar corrosion.
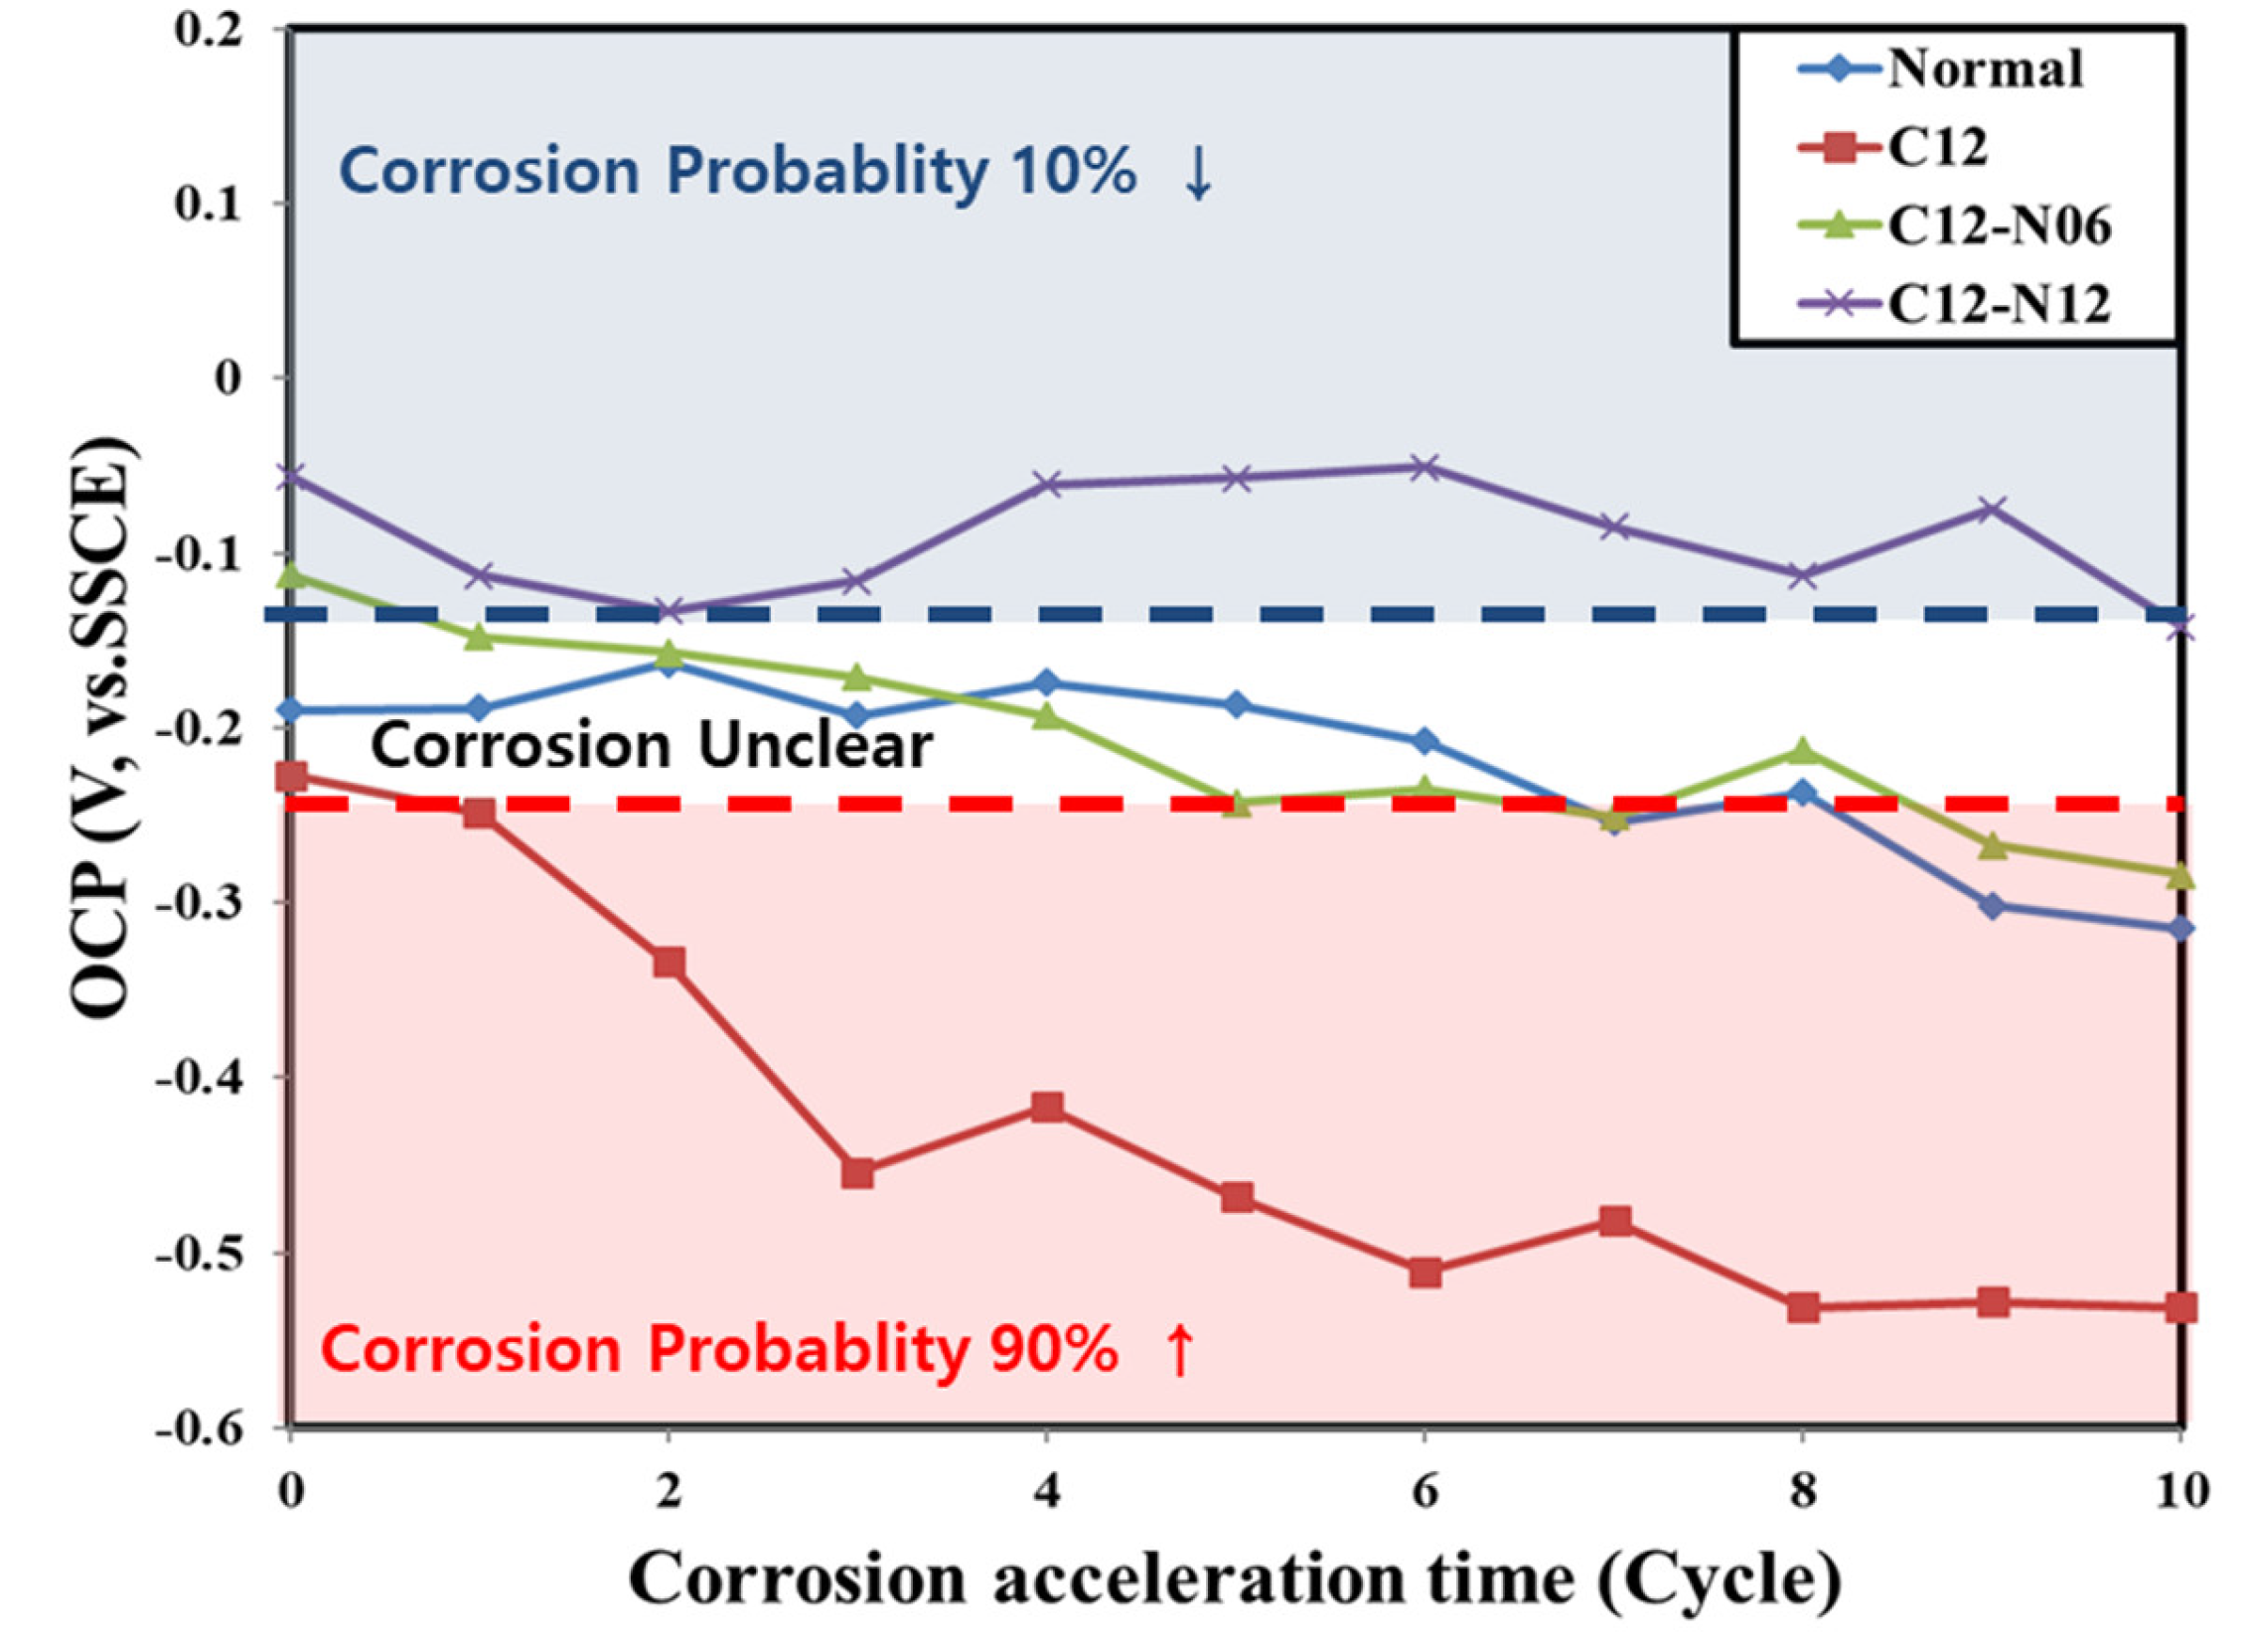
Accordingly, the equilibrium electrode potential of the rebar in the concrete was measured to quantify the degree of corrosion of the rebar. The OCP of the rebar as a function of the accelerated corrosion time is shown in Figure 6.
For the normal concrete, the OCP did not change significantly as compared to the other samples and remained stable between −0.25 and −0.15 V until the end of 10 weeks of accelerated corrosion, whereby it decreased to −0.315 V. For the C12N6 concrete, the OCP decreased with time from −0.1 to −0.284 V, at a rate much lower than that in the case of the concrete containing only chloride ions. This can be attributed to LiNO2, which acts to retard the degradation of the stable passive film that forms around the embedded rebar owing to the strong alkaline nature of the concrete mixture [22,35,36]. For the normal and C12N6 concrete samples, the corrosion status was uncertain until after 9 weeks of cycles, where it entered the initial phase of corrosion, as per ASTM C 876 [34].
For the C12N12 concrete with 1.2 kg/m3 chloride ions and 1.2 M LiNO2, the OCP remained stable between −0.05 and −0.15 V. The OCP after 10 weeks of cycles was measured to be −0.142 V, corresponding to less than 10% corrosion as per ASTM C 876, implying that no significant corrosion had taken place. This is because the use of an LiNO2 concentration equal to or higher than 1.2 M inhibits the degradation of the passive film surrounding the embedded rebar.
3.2. Electrochemical Results
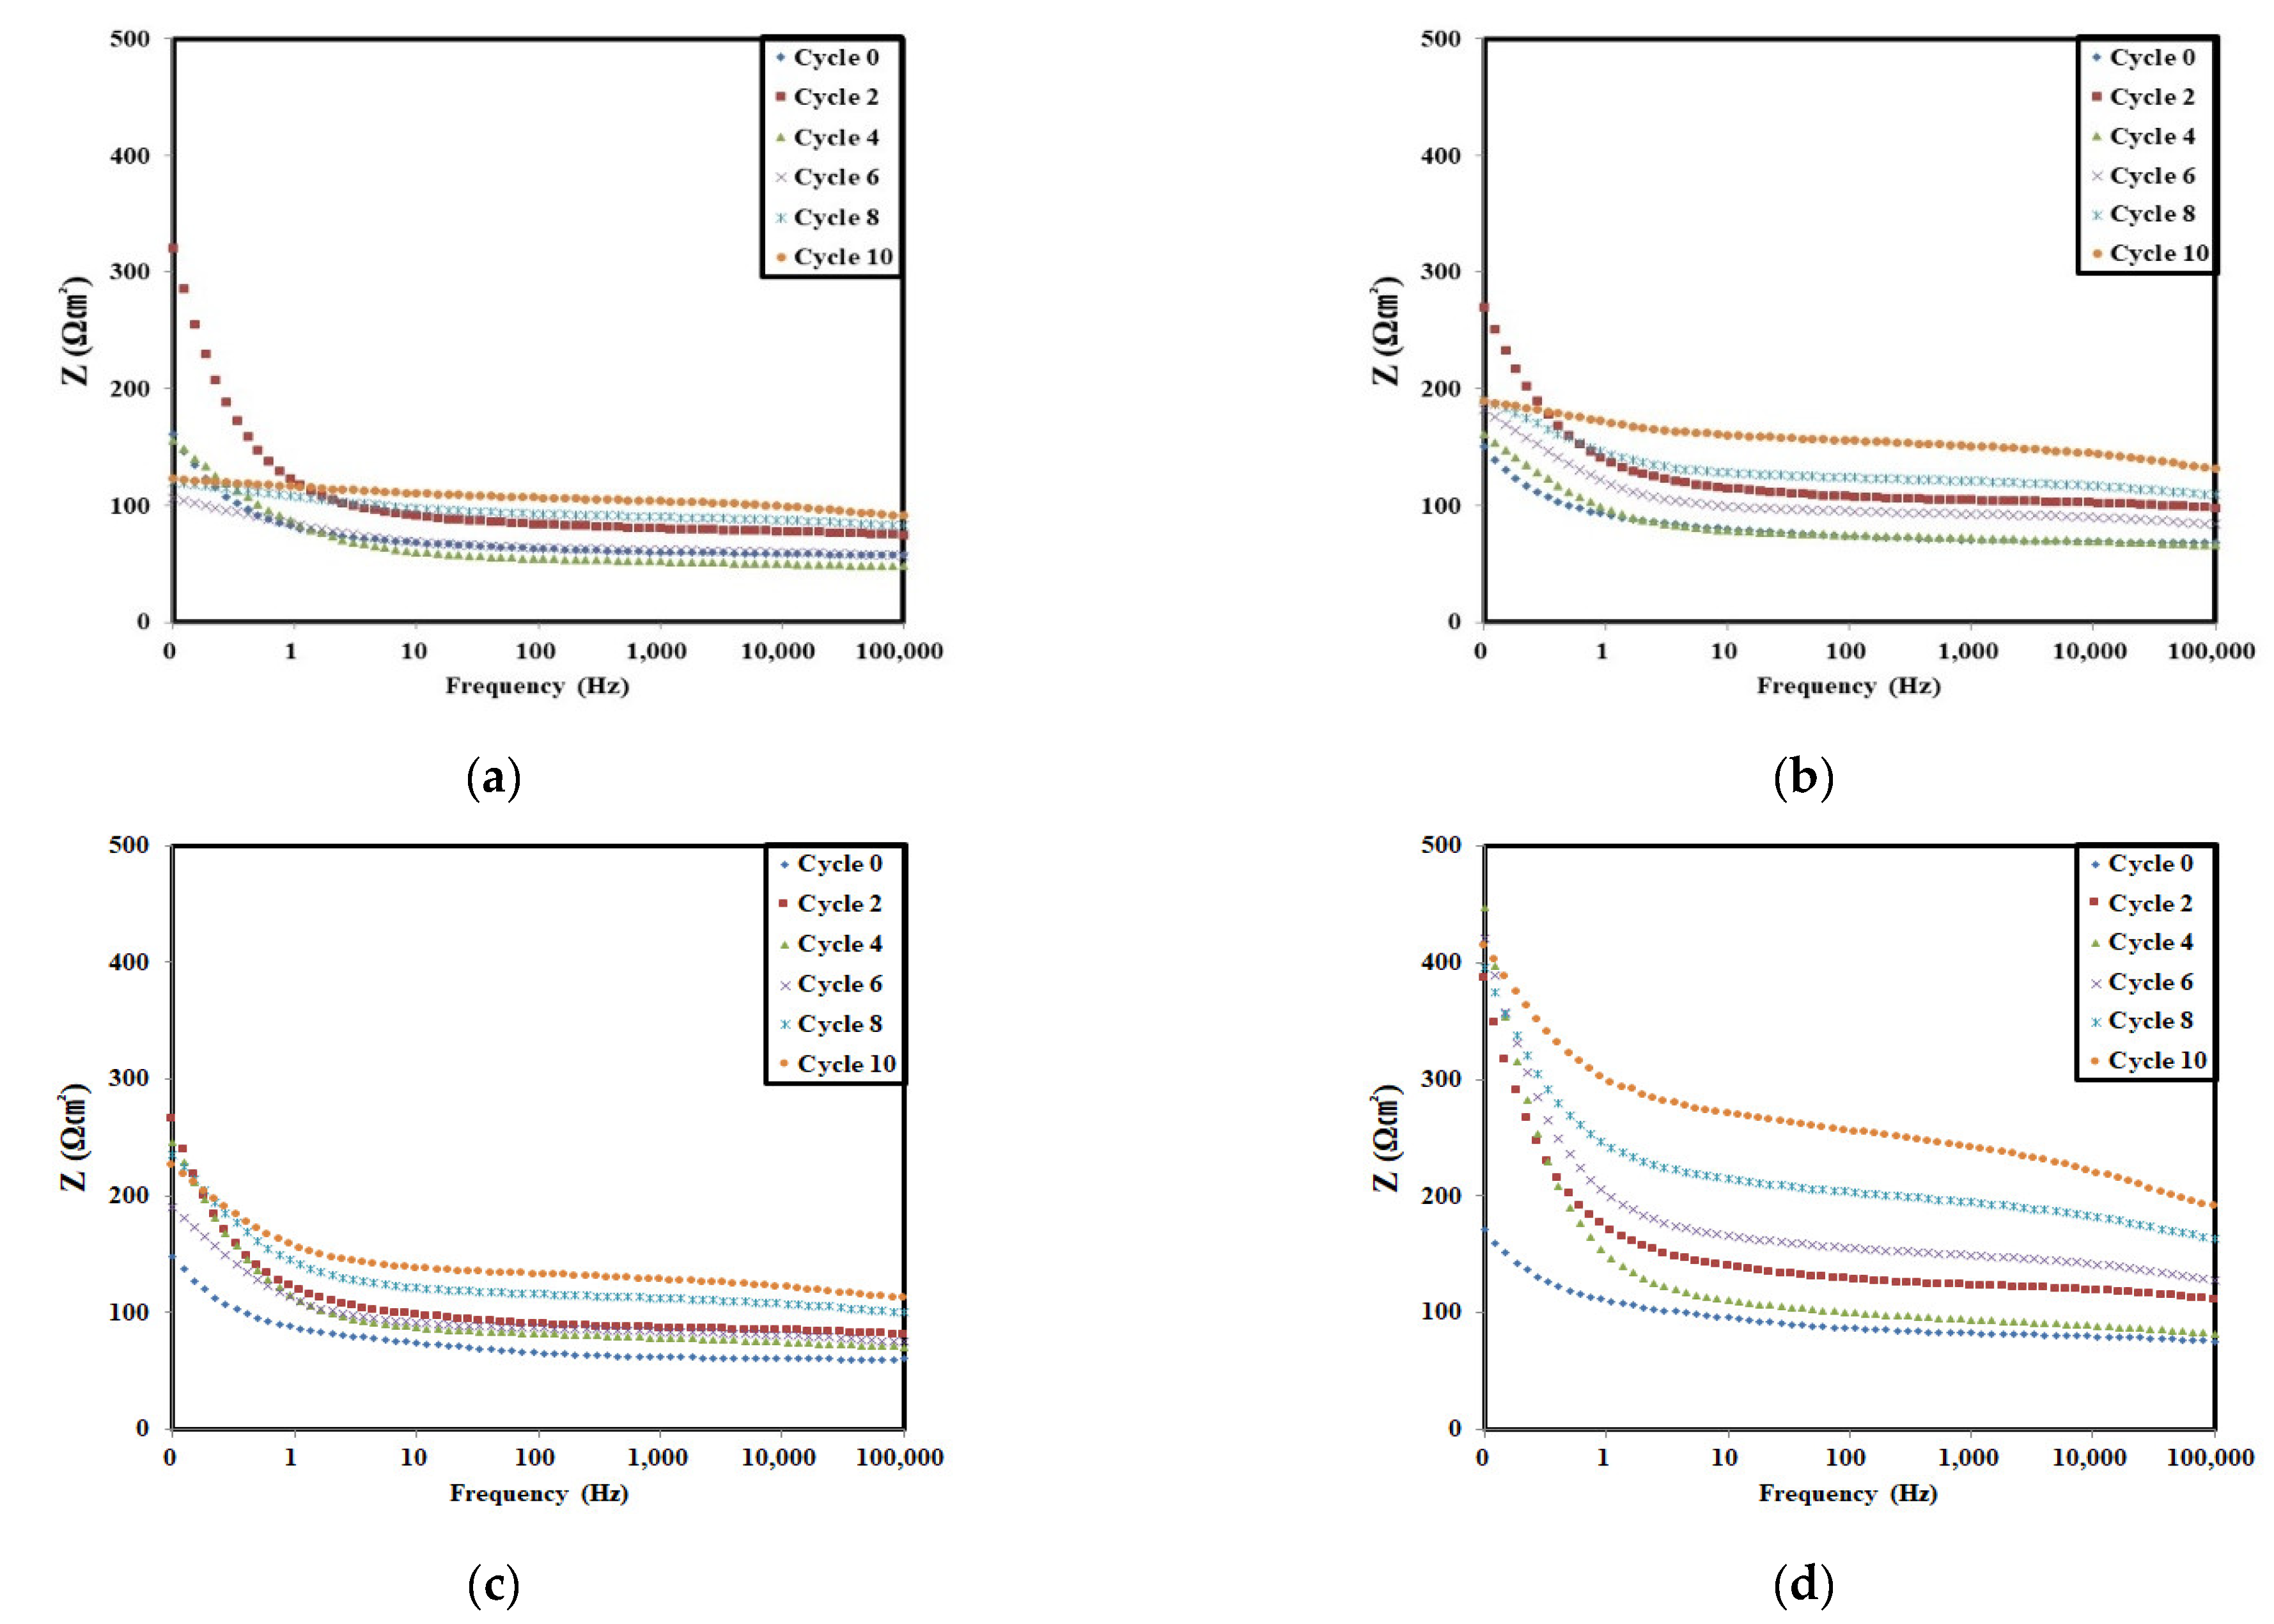
The Bode modulus plot shows the impedance Z as a function of the applied frequency. The plots can be categorized by the impedance at a high frequency and the impedance at a low frequency. At a high frequency, the impedance can be used to determine the electrolyte resistance based on the electrode reaction time, and at a low frequency, the polarization resistance of the rebars due to the diffusion and movement of the substances can be identified [27,28,29].
The Bode modulus plots of all test specimens at the selected accelerated corrosion cycles are shown in Figure 7.
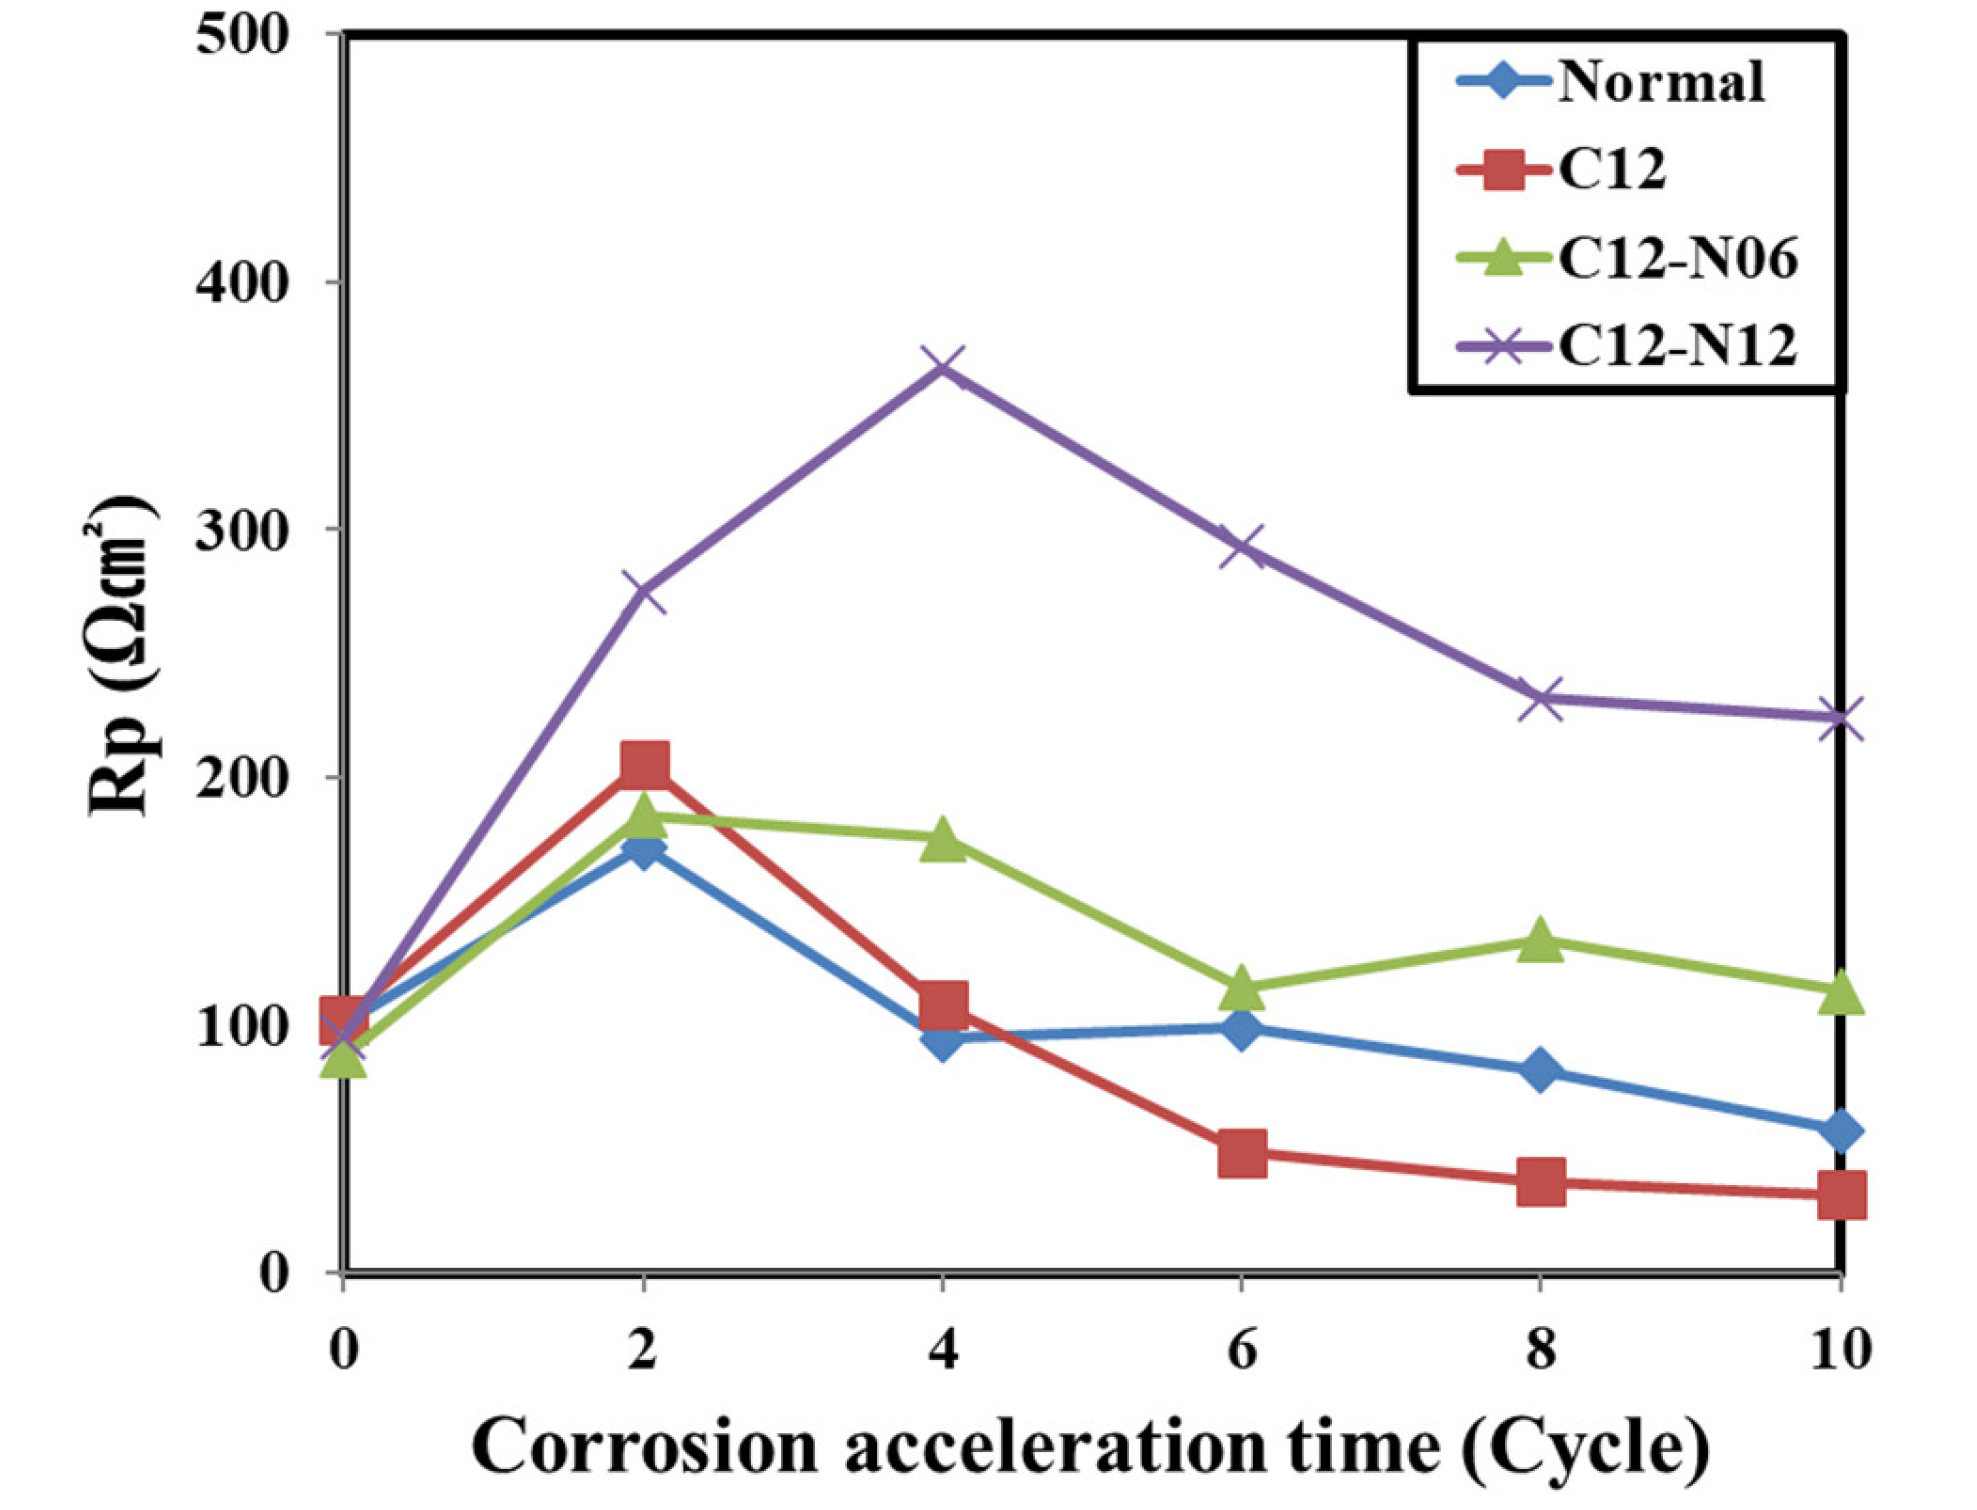
As the curves in each Bode modulus plot change according to the accelerated corrosion cycle, the polarization resistance Rp can be calculated for the embedded rebars. The calculated Rp values are shown in Table 6 and plotted in Figure 8.
For the normal, C12, and C12N6 concrete specimens, the Rp of the embedded rebars increased until the second week of the accelerated corrosion cycles and decreased after the fourth week. This can be attributed to the degradation of the passive films of all embedded rebars as they enter the initial stages of corrosion.
Notably, the Rp of the embedded rebar in the C12N12 concrete continued to increase until the fourth week of the accelerated corrosion cycles and decreased after the sixth week. Hence, the addition of 1.2 M LiNO2 per added chloride ion enables better protection of the passive film on the embedded rebars as compared to the concrete without chloride ions. Further, 1.2 M LiNO2, or more, must be added to the concrete with 1.2 kg/m3 chloride ions to retain the protection capability of LiNO2.
4. Conclusions
In this study, the effects of adding chloride ions and corrosion inhibitors to concrete on the embedded rebars within concrete were analyzed and compared. To accelerate the corrosion of the embedded rebars, wet–dry cycles were performed, and the natural potential and impedance were measured at the end of each 1-week wet–dry cycle. The results are presented as follows:
- The embedded rebar in the C12 concrete underwent the most rapid deterioration; the rebars embedded in the normal and C12N6 concrete were corrosion initiated at the ninth week of the accelerated corrosion cycle. However, the embedded rebar in the C12N12 concrete was observed to undergo no significant deterioration at the end of 10 weeks of cycles. The passive films were significantly stable with 0.6 M LiNO2, although a concentration higher than 1.2 M LiNO2 may be required for environments having high salinity in the air, such as coastal structures.
- The polarization resistance of the normal, C12, and C12N06 concrete increased until the end of the second week of cycles and then decreased, while that of the C12N012 concrete increased until the end of the fourth week and then decreased. This is attributed to the presence of the corrosion inhibitor, LiNO2.
- C12 presented the lowest Rp at the end of 10 weeks of cycles at 31.7 Ω cm3. The Rp values of the normal, C12N06, and C12N12 samples, in increasing order, were 57.6, 113.8, and 223.8 Ω cm3, respectively. With 1.2 kg/m3 NaCl and more than 0.6 M LiNO2 added to concrete, the reinforced concrete is expected to inhibit corrosion more than the normal concrete.
- The performance of the corrosion inhibitor and the corrosion behavior of the embedded rebars in concrete were analyzed using wet–dry cycles and electrochemical techniques. In addition, it was confirmed that the corrosion of the rebar embedded in the concrete can be protected from the penetration of chloride ions using an appropriate inhibitor. Through electrochemistry and microanalysis of in/organic inhibitors, their mechanisms toward inhibiting corrosion may be considered in future research.
Author Contributions
Conceptualization, J.P. and M.J.; methodology, J.P.; software, J.P.; validation, J.P. and M.J.; formal analysis, J.P.; investigation, J.P.; resources, J.P.; data curation, J.P.; writing—original draft preparation, J.P.; writing—review and editing, J.P.; visualization, J.P.; supervision, M.J.; project administration, J.P.; funding acquisition, M.J. All authors have read and agreed to the published version of the manuscript.
Funding
This work was supported by the Korea Agency for Infrastructure Technology Advancement (KAIA) grant funded by the Ministry of Land, Infrastructure and Transport, Grant number 21POQW-B152343-03.
Institutional Review Board Statement
Not applicable.
Informed Consent Statement
Not applicable.
Data Availability Statement
The data presented in this study are available on request from the corresponding author.
Conflicts of Interest
The authors declare no conflict of interest.
References
- Page, C.L.; Treadaway, K.W.J. Aspects of the electrochemistry of steel in concrete. Nature 1982, 297, 109–115. [Google Scholar] [CrossRef]
- Rosenberg, A.; Hanson, C.M.; Andrade, C. Mechanisms of corrosion of steel in concrete. In Material Science of Concrete; Skalny, J., Ed.; American Ceramic Society: Westerville, OH, USA, 1989; pp. 285–313. [Google Scholar]
- Kumar, V. Protection of steel reinforcement for concrete—A review. Corros. Rev. 1998, 16, 317–358. [Google Scholar] [CrossRef]
- Amey, S.L.; Johson, D.A.; Miltenberfer, M.A.; Farzam, H. Predicting the service life of concrete marine structures: An environmental methodology. Struct. J. 1998, 95, 205–214. [Google Scholar]
- Kim, J.-H.; Yoon, S.-C.; Jee, N.-Y. The effect of combined aggregates on fluidity of the high fluid concrete containing GGBFS. J. Korea Inst. Build. Constr. 2003, 3, 79–86. [Google Scholar]
- Kang, M.-J.; Lee, P.-K.; Youm, S.-J. Assessment of Environmental Contamination caused by the Stone-dust using Leaching Tests. J. Soil Groundw. Environ. 2010, 15, 52–60. [Google Scholar]
- Broomfield, J.P. Corrosion of Steel in Concrete: Understanding, Investigation and Repair; CRC Press: Boca Raton, FL, USA, 2003; pp. 140–152. [Google Scholar]
- Page, C.L. Mechanism of corrosion protection in reinforced concrete marine structures. Nature 1975, 258, 514–515. [Google Scholar] [CrossRef]
- Moreno, M.; Morris, W.; Alvarez, M.G.; Du, G.S. Corrosion of reinforcing steel in simulated concrete pore solutions: Effect of carbonation and chloride content. Corros. Sci. 2004, 46, 2681–2699. [Google Scholar] [CrossRef]
- Wei, J.; Dong, J.H.; Ke, W. Corrosion resistant performance of a chemical quenched rebar in concrete. Constr. Build. Mater. 2011, 25, 1243–1247. [Google Scholar] [CrossRef]
- Castaldo, P.; Palazzo, B.; Marinello, A. Effects of the axial force eccentricity on the time-variant structural reliability of aging r.c. cross-sections subjected to chloride-induced corrosion. Eng. Struct. 2017, 130, 261–274. [Google Scholar] [CrossRef]
- Biondini, F.; Vergani, M. Deteriorating beam finite element for nonlinear analysis of concrete structures under corrosion, Deteriorating beam finite element for nonlinear analysis of concrete structures under corrosion. Struct. Infrastruct. Eng. 2015, 11, 519–532. [Google Scholar] [CrossRef]
- Sanchez, M.; Gregori, J.; Alonso, C.; Garcia-Jareno, J.J.; Takenouti, H.; Vicente, F. Electrochemical impedance spectroscopy for studying passive layers on steel rebars immersed in alkaline solutions simulating concrete pores. Electrochim. Acta 2007, 52, 7634–7641. [Google Scholar] [CrossRef]
- Mansfeld, F. Electrochemical Impedance Spectroscopy (EIS) as a new tool for investigating methods of corrosion protection. Electrochim. Acta 1990, 35, 1533–1544. [Google Scholar] [CrossRef]
- Lay, P.; Lawrence, P.F.; Wilkins, N.J.M.; Williams, D.E. An ac impedance study of steel in concrete. J. Appl. Electrochem. 1985, 15, 755–766. [Google Scholar] [CrossRef]
- Wang, W.; Chen, H.; Li, X.; Zhu, Z. Corrosion behavior of steel bars immersed in simulated pore solutions of alkali-activated slag mortar. Constr. Build. Mater. 2017, 143, 289–297. [Google Scholar] [CrossRef]
- Ortega, J.M.; Sánchez, I.; Climent, M.A. Impedance spectroscopy study of the effect of environmental conditions in the microstructure development of OPC and slag cement mortars. Arch. Civ. Mech. Eng. 2015, 15, 569–583. [Google Scholar] [CrossRef]
- Wei, J.; Fu, X.X.; Dong, J.H. Corrosion Evolution of Reinforcing Steel in Concrete under Dry/Wet Cyclic condition Contaminated with Chloride. J. Mater. Sci. Technol. 2012, 28, 905–912. [Google Scholar] [CrossRef]
- Kawasaki, Y.; Wakuda, T.; Kobarai, T.; Ohtsu, M. Corrosion Mechanisms in reinforced concrete by acoustic emission. Constr. Build. Mater. 2013, 48, 1240–1247. [Google Scholar] [CrossRef]
- ASTM. C150, Standard specification for Portland cement. In Annual Book of ASTM Standards; ASTM International: West Conshohocken, PA, USA, 2001; Volume 4, p. 1. [Google Scholar]
- Aoyama, M.; Miyazato, S.; Kawamura, M. Protection of steel corrosion in concrete members by the combination of galvanic anode and nitrite penetration. Int. J. Corros. 2014, 2014, 618280. [Google Scholar] [CrossRef]
- Lee, H.S.; Ryu, H.S.; Park, W.J.; Ismail, M.A. Comparative study on corrosion protection of reinforcing steel by using amino alcohol and lithium nitrite inhibitors. Materials 2015, 8, 251–269. [Google Scholar] [CrossRef]
- KS D. 3504. Steel Bars for Concrete Reinforcement; Korean Agency for Technology and Standard: Eumseong, Korea, 2016; pp. 1–31. [Google Scholar]
- Austin, S.A.; Lyons, R.; Ing, M.J. Electrochemical Behavior of Steel-Reinforced Concrete during Accelerated Corrosion Testing. Corrosion 2004, 60, 203–212. [Google Scholar] [CrossRef]
- Otieno, M.; Golden, G.; Alexander, M.G.; Beushausen, H. Acceleration of steel corrosion in concrete by cyclic wetting and drying: Effect of drying duration and concrete quality. Mater. Struct. 2019, 52, 1–14. [Google Scholar] [CrossRef]
- KS F. 2599-2. Standard Test Method for the Accelerated Corrosion of Reinforced Concrete (Wet-Drying Cycle Method); Korea Industrials Standard: Eumseong, Korea, 2013. [Google Scholar]
- Walter, G.W. A review of impedance plot methods used for corrosion performance analysis of painted metals. Corros. Sci. 1986, 26, 168–703. [Google Scholar] [CrossRef]
- Poupard, O.; Ait-Mokhtar, A.; Dumargue, P. Corrosion by chlorides in reinforced concrete: Determination of chloride concentration threshold by impedance spectroscopy. Cem. Concr. Res. 2004, 34, 991–1000. [Google Scholar] [CrossRef]
- Sagoe-Crentsil, K.K.; Glasser, F.P.; Irvine, J.T. Electrochemical characteristics of reinforced concrete corrosion as determined by impedance spectroscopy. Br. Corros. J. 2013, 27, 113–118. [Google Scholar] [CrossRef]
- Ribeiro, D.V.; Abranted, J.C.C. Application of electrochemical impedance spectroscopy (EIS) to monitor the corrosion of reinforced concrete: A new approach. Constr. Build. Mater. 2016, 111, 98–104. [Google Scholar] [CrossRef]
- Park, J.H.; Park, C.; Joh, S.H.; Lee, H.S. Effect of curing condition on resistance to chloride ingress in concrete using ground granulated blast furnace slag. Materials 2019, 12, 3223. [Google Scholar] [CrossRef] [Green Version]
- Song, H.W.; Sarawathy, V. Corrosion monitoring of reinforced concrete structures—A review. Int. J. Electrochem. Sci. 2007, 2, 1–28. [Google Scholar]
- Parthiban, T.; Ravi, R.; Parthiban, G.T. Potential monitoring system for corrosion of steel in concrete. Adv. Eng. Softw. 2006, 37, 375–381. [Google Scholar] [CrossRef]
- ASTM. C876, Standard Test Method for Corrosion Potentials of Uncoated Reinforcing Steel in Concrete; ASTM International: West Conshohocken, PA, USA, 2015. [Google Scholar]
- Lee, H.S.; Shin, S.W. Evaluation on the effect of lithium nitrite corrosion inhibitor by the corrosion sensors embedded in mortar. Constr. Build. Mater. 2007, 21, 1–6. [Google Scholar] [CrossRef]
- Hazehara, H.; Katpady, D.N.; Soeda, M.; Okabe, Y.; Era, K. Neutralization inhibition mechanism of lithium nitrite and its effect on the microstructure of mortar. Constr. Build. Mater. 2020, 264, 120586. [Google Scholar] [CrossRef]
Figure 1.
Schematic of specimen fabricated for electrochemical measurement.

Figure 2.
Corrosion acceleration cycle (wet–dry method).

Figure 3.
Schematic of a simple electrochemical electrode system.

Figure 4.
Bode plot for electrochemical impedance spectroscopy measurement.

Figure 5.
Experimental setup for the EIS experiment.

Figure 6.
OCP of the rebars embedded in concrete according to the corrosion acceleration cycle.

Figure 7.
Bode modulus plot of the rebars embedded in concrete according to the corrosion acceleration cycle: (a) normal, (b) C12, (c) C12N6, and (d) C12N12.
Figure 7.
Bode modulus plot of the rebars embedded in concrete according to the corrosion acceleration cycle: (a) normal, (b) C12, (c) C12N6, and (d) C12N12.

Figure 8.
Variation in Rp with accelerated corrosion cycle.


Table 1.
Chemical composition of cement.
| Name | Chemical Composition (%) | * L.O.I. | ||||||||
|---|---|---|---|---|---|---|---|---|---|---|
| SiO2 | Al2O3 | TiO2 | Fe2O3 | CaO | MgO | SO3 | K2O | etc. | ||
| OPC | 19.74 | 5.33 | 0.30 | 2.93 | 61.74 | 3.78 | 2.47 | 0.89 | 2.82 | 2.3 |
* L.O.I.: loss on ignition.
Table 2.
Mix proportion of concrete.
| W/C | Unit Weight (kg/m3) | ||||
|---|---|---|---|---|---|
| Water | Cement | Gravel | Sand | * S.P. | |
| 50% | 172 | 344 | 941 | 711 | 1.03 |
* S.P.: superplasticizer admixture.
Table 3.
Amounts of NaCl and LiNO2 added to concrete.
| No. | Name | NaCl (kg/m3) | LiNO2 | |
|---|---|---|---|---|
| Molar Ratio (NO2−/Cl−) | Addition (kg/m3) | |||
| 1 | Normal | 0.0 | 0.0 | 0.0 |
| 2 | C12 | 1.2 | 0.0 | 0.0 |
| 3 | C12N6 | 0.6 | 4.3 | |
| 4 | C12N12 | 1.2 | 8.6 | |
Table 4.
Electrochemical experiment conditions.
| Frequency range | 105–10−1 Hz |
| Specimen size | Ø100 × 200 mm2 |
| Cover concrete | 44 mm |
| WE | Ø13 mm rebar (SD 400) |
| RE | Ag/AgCl |
| CE | STS 304 |
Table 5.
ASTM C 876 criteria for corrosion.
| Potential of Rebar (mV) | Corrosion Probablity | ||
|---|---|---|---|
| CSE | SSCE | SHE | |
| <−500 | <−426 | <−184 | Severe |
| <−350 | <−276 | <−34 | 90% ↑ |
| −350~−200 | −276~−126 | −34~+116 | 50% ↓ |
| >−200 | >−126 | >+116 | 10% ↓ |
Table 6.
Variation in Rp with accelerated corrosion cycle.
| Name | Rp with Accelerated Corrosion Cycle (Ω cm2) | |||||
|---|---|---|---|---|---|---|
| 0 | 2 | 4 | 6 | 8 | 10 | |
| Normal | 100 | 172 | 94 | 99 | 82 | 58 |
| C12 | 103 | 206 | 108 | 49 | 37 | 32 |
| C12-N06 | 88 | 185 | 176 | 115 | 135 | 114 |
| C12-N12 | 96 | 275 | 366 | 293 | 232 | 224 |
Publisher’s Note: MDPI stays neutral with regard to jurisdictional claims in published maps and institutional affiliations. |
© 2021 by the authors. Licensee MDPI, Basel, Switzerland. This article is an open access article distributed under the terms and conditions of the Creative Commons Attribution (CC BY) license (https://creativecommons.org/licenses/by/4.0/).
Share and Cite
MDPI and ACS Style
Park, J.; Jung, M. Evaluation of the Corrosion Behavior of Reinforced Concrete with an Inhibitor by Electrochemical Impedance Spectroscopy. Materials 2021, 14, 5508. https://doi.org/10.3390/ma14195508
AMA Style
Park J, Jung M. Evaluation of the Corrosion Behavior of Reinforced Concrete with an Inhibitor by Electrochemical Impedance Spectroscopy. Materials. 2021; 14(19):5508. https://doi.org/10.3390/ma14195508
Chicago/Turabian StylePark, JangHyun, and MyeongGyu Jung. 2021. "Evaluation of the Corrosion Behavior of Reinforced Concrete with an Inhibitor by Electrochemical Impedance Spectroscopy" Materials 14, no. 19: 5508. https://doi.org/10.3390/ma14195508
Note that from the first issue of 2016, this journal uses article numbers instead of page numbers. See further details here.