Effects of the Ultrasonic Assisted Surface Rolling Process on the Fatigue Crack Initiation Position Distribution and Fatigue Life of 51CrV4 Spring Steel

Abstract
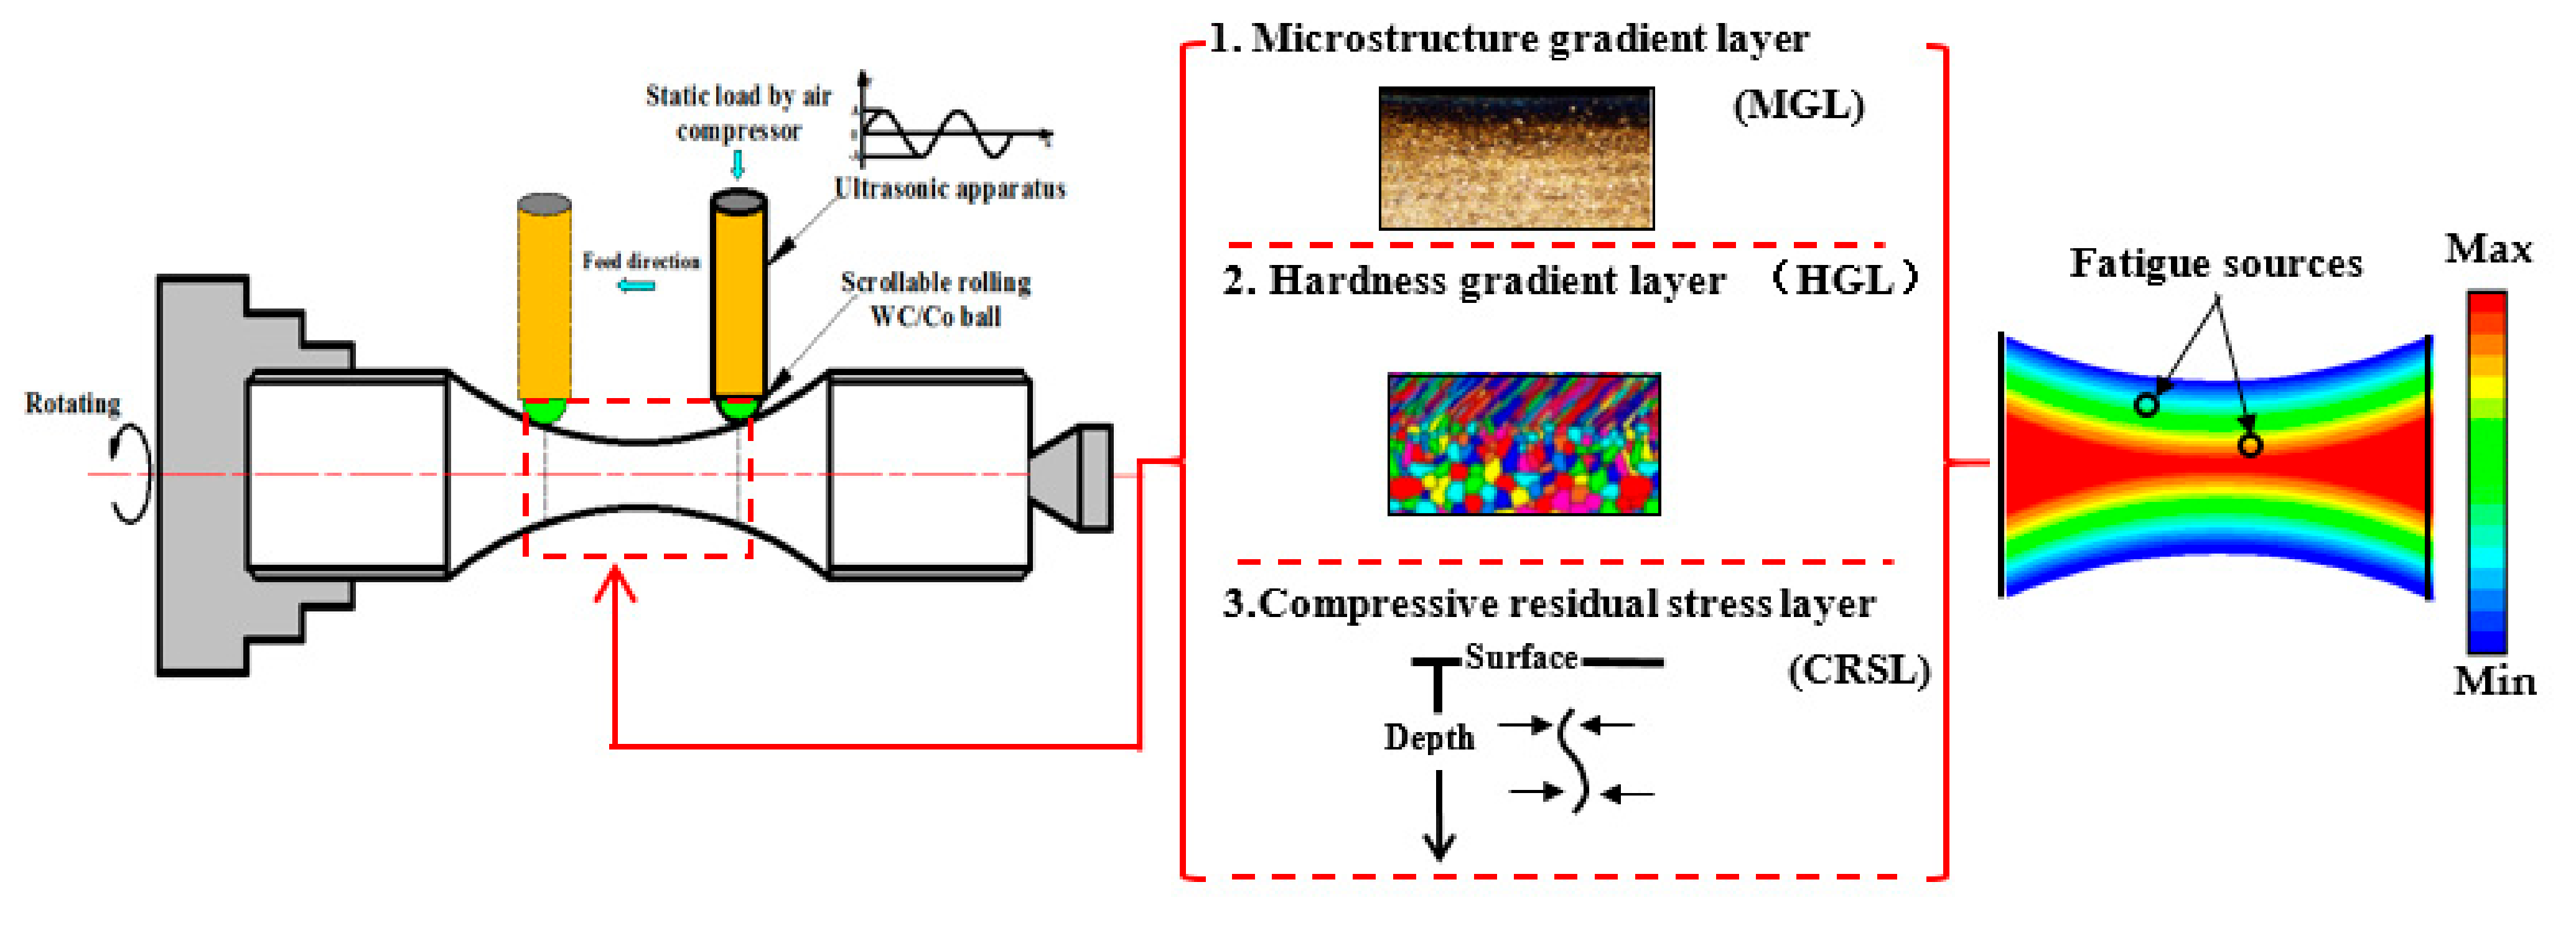
:1. Introduction
2. Experimental
2.1. Materials
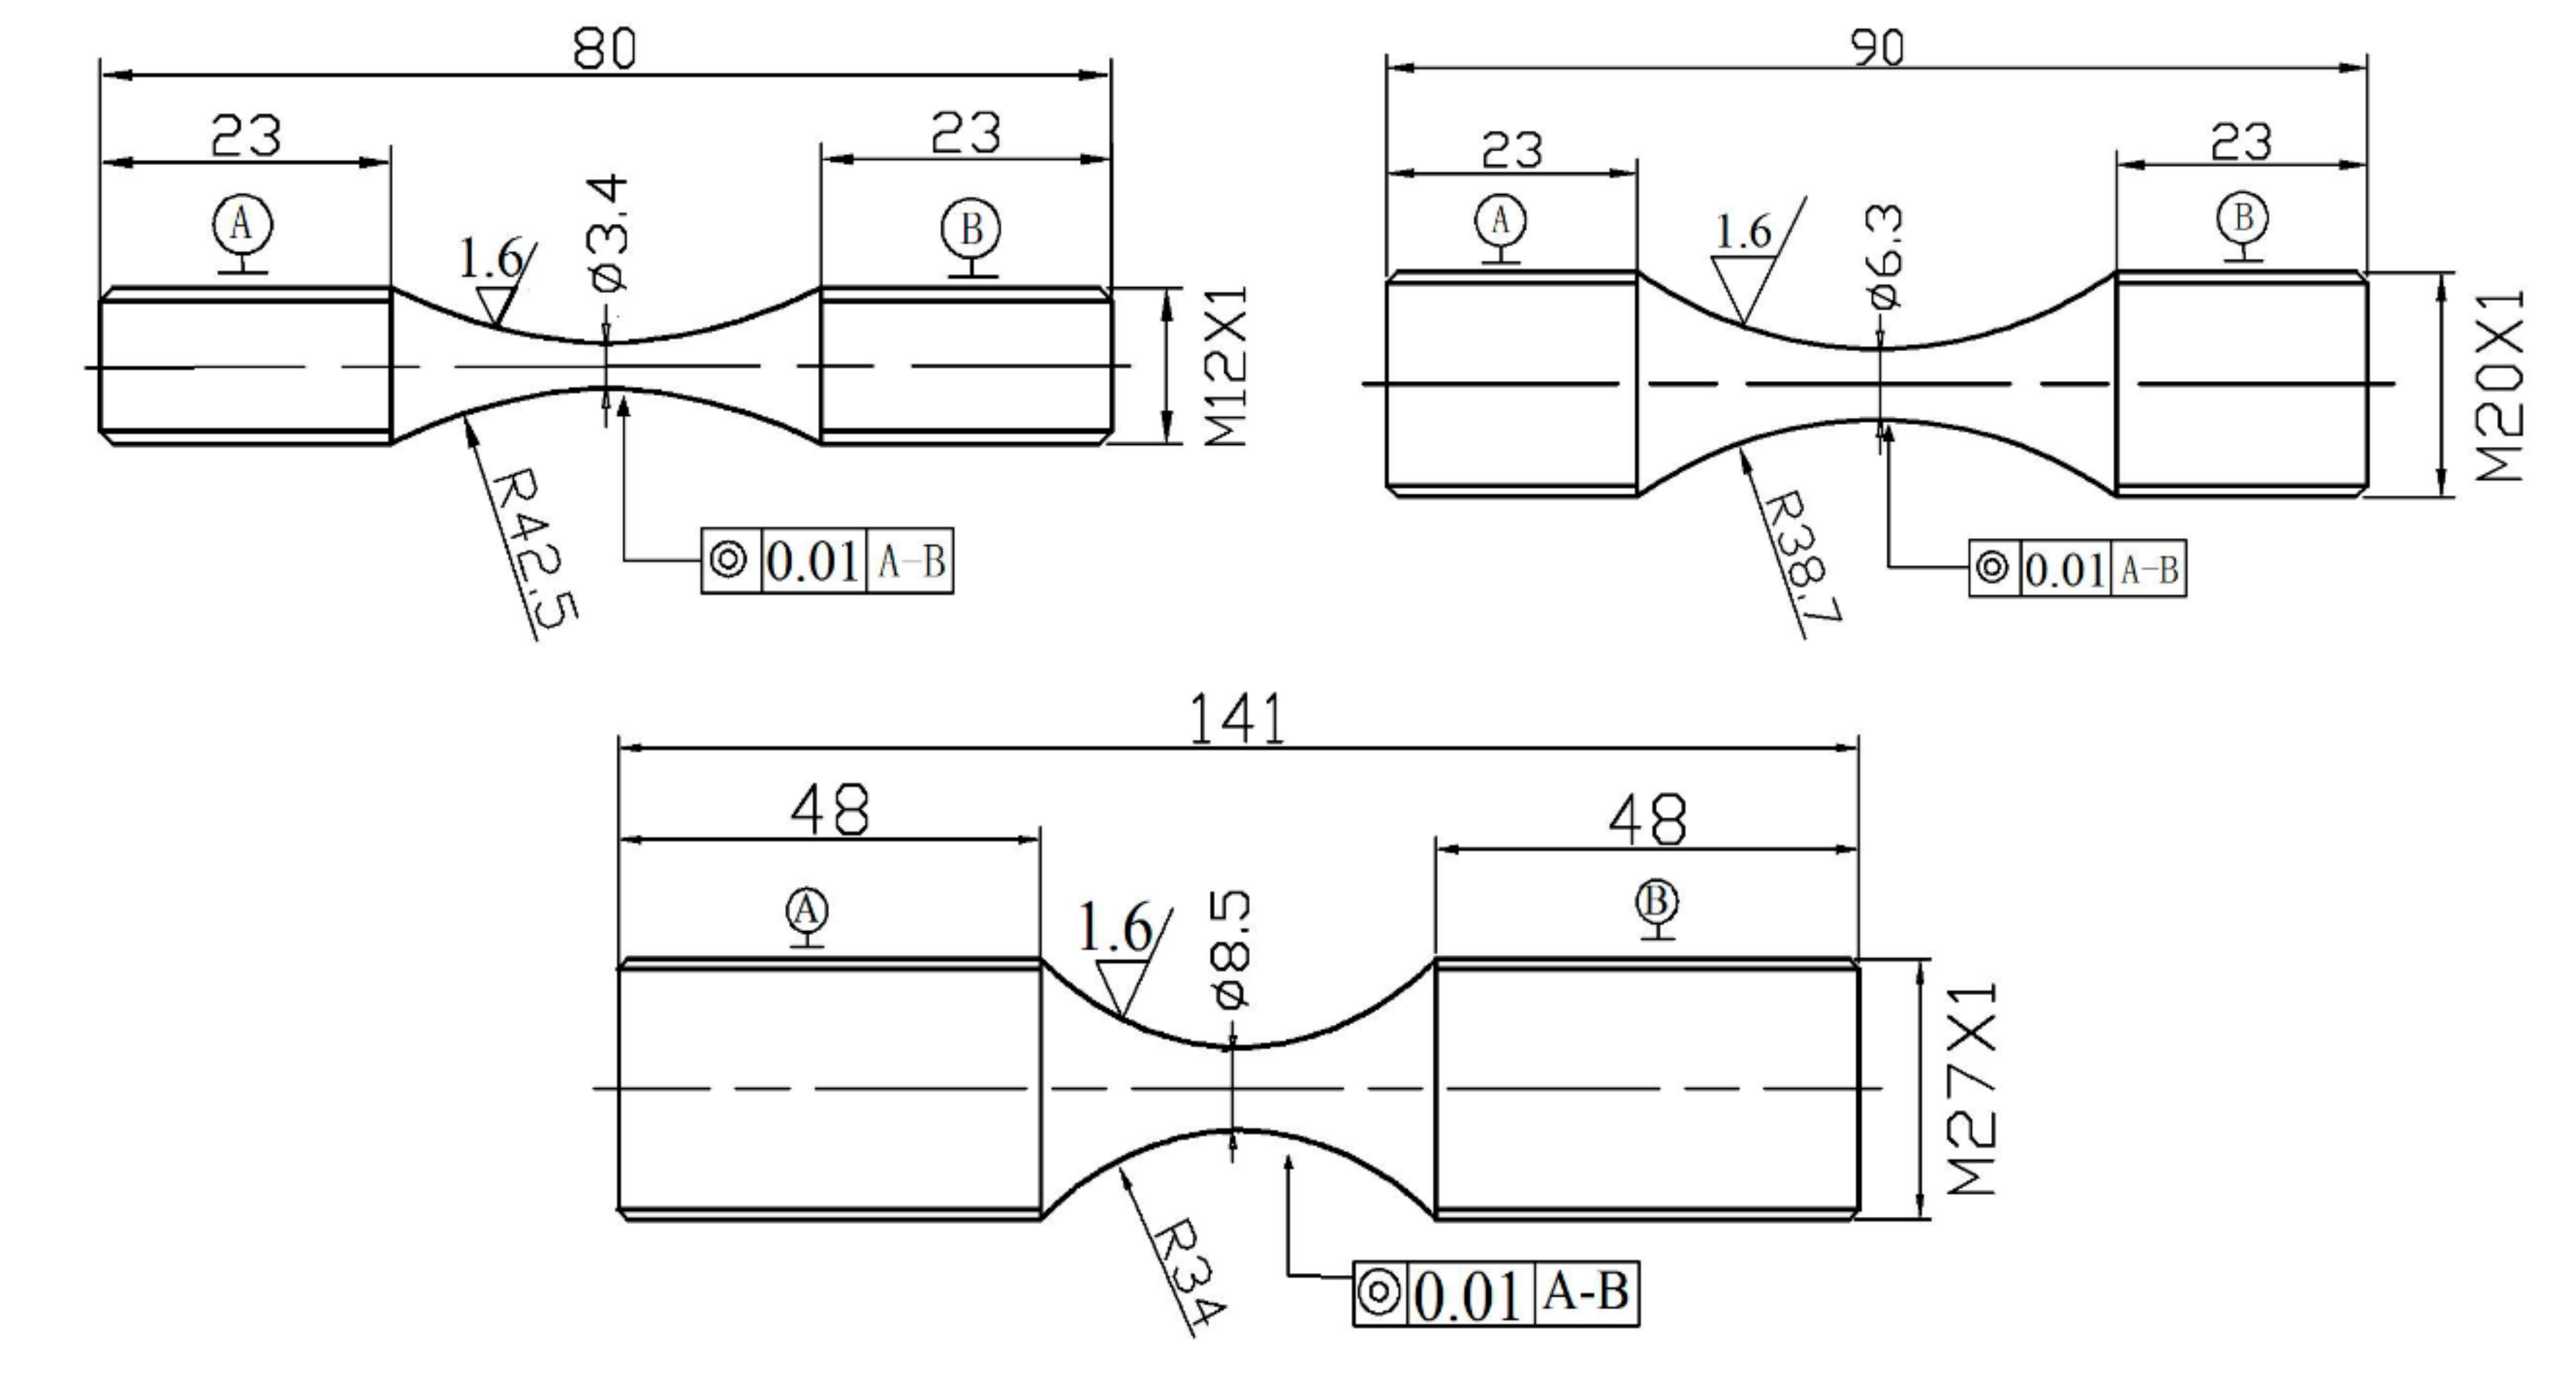
2.2. Fatigue Testing
2.3. Experimental Measurement and Characterisation Method
3. Results
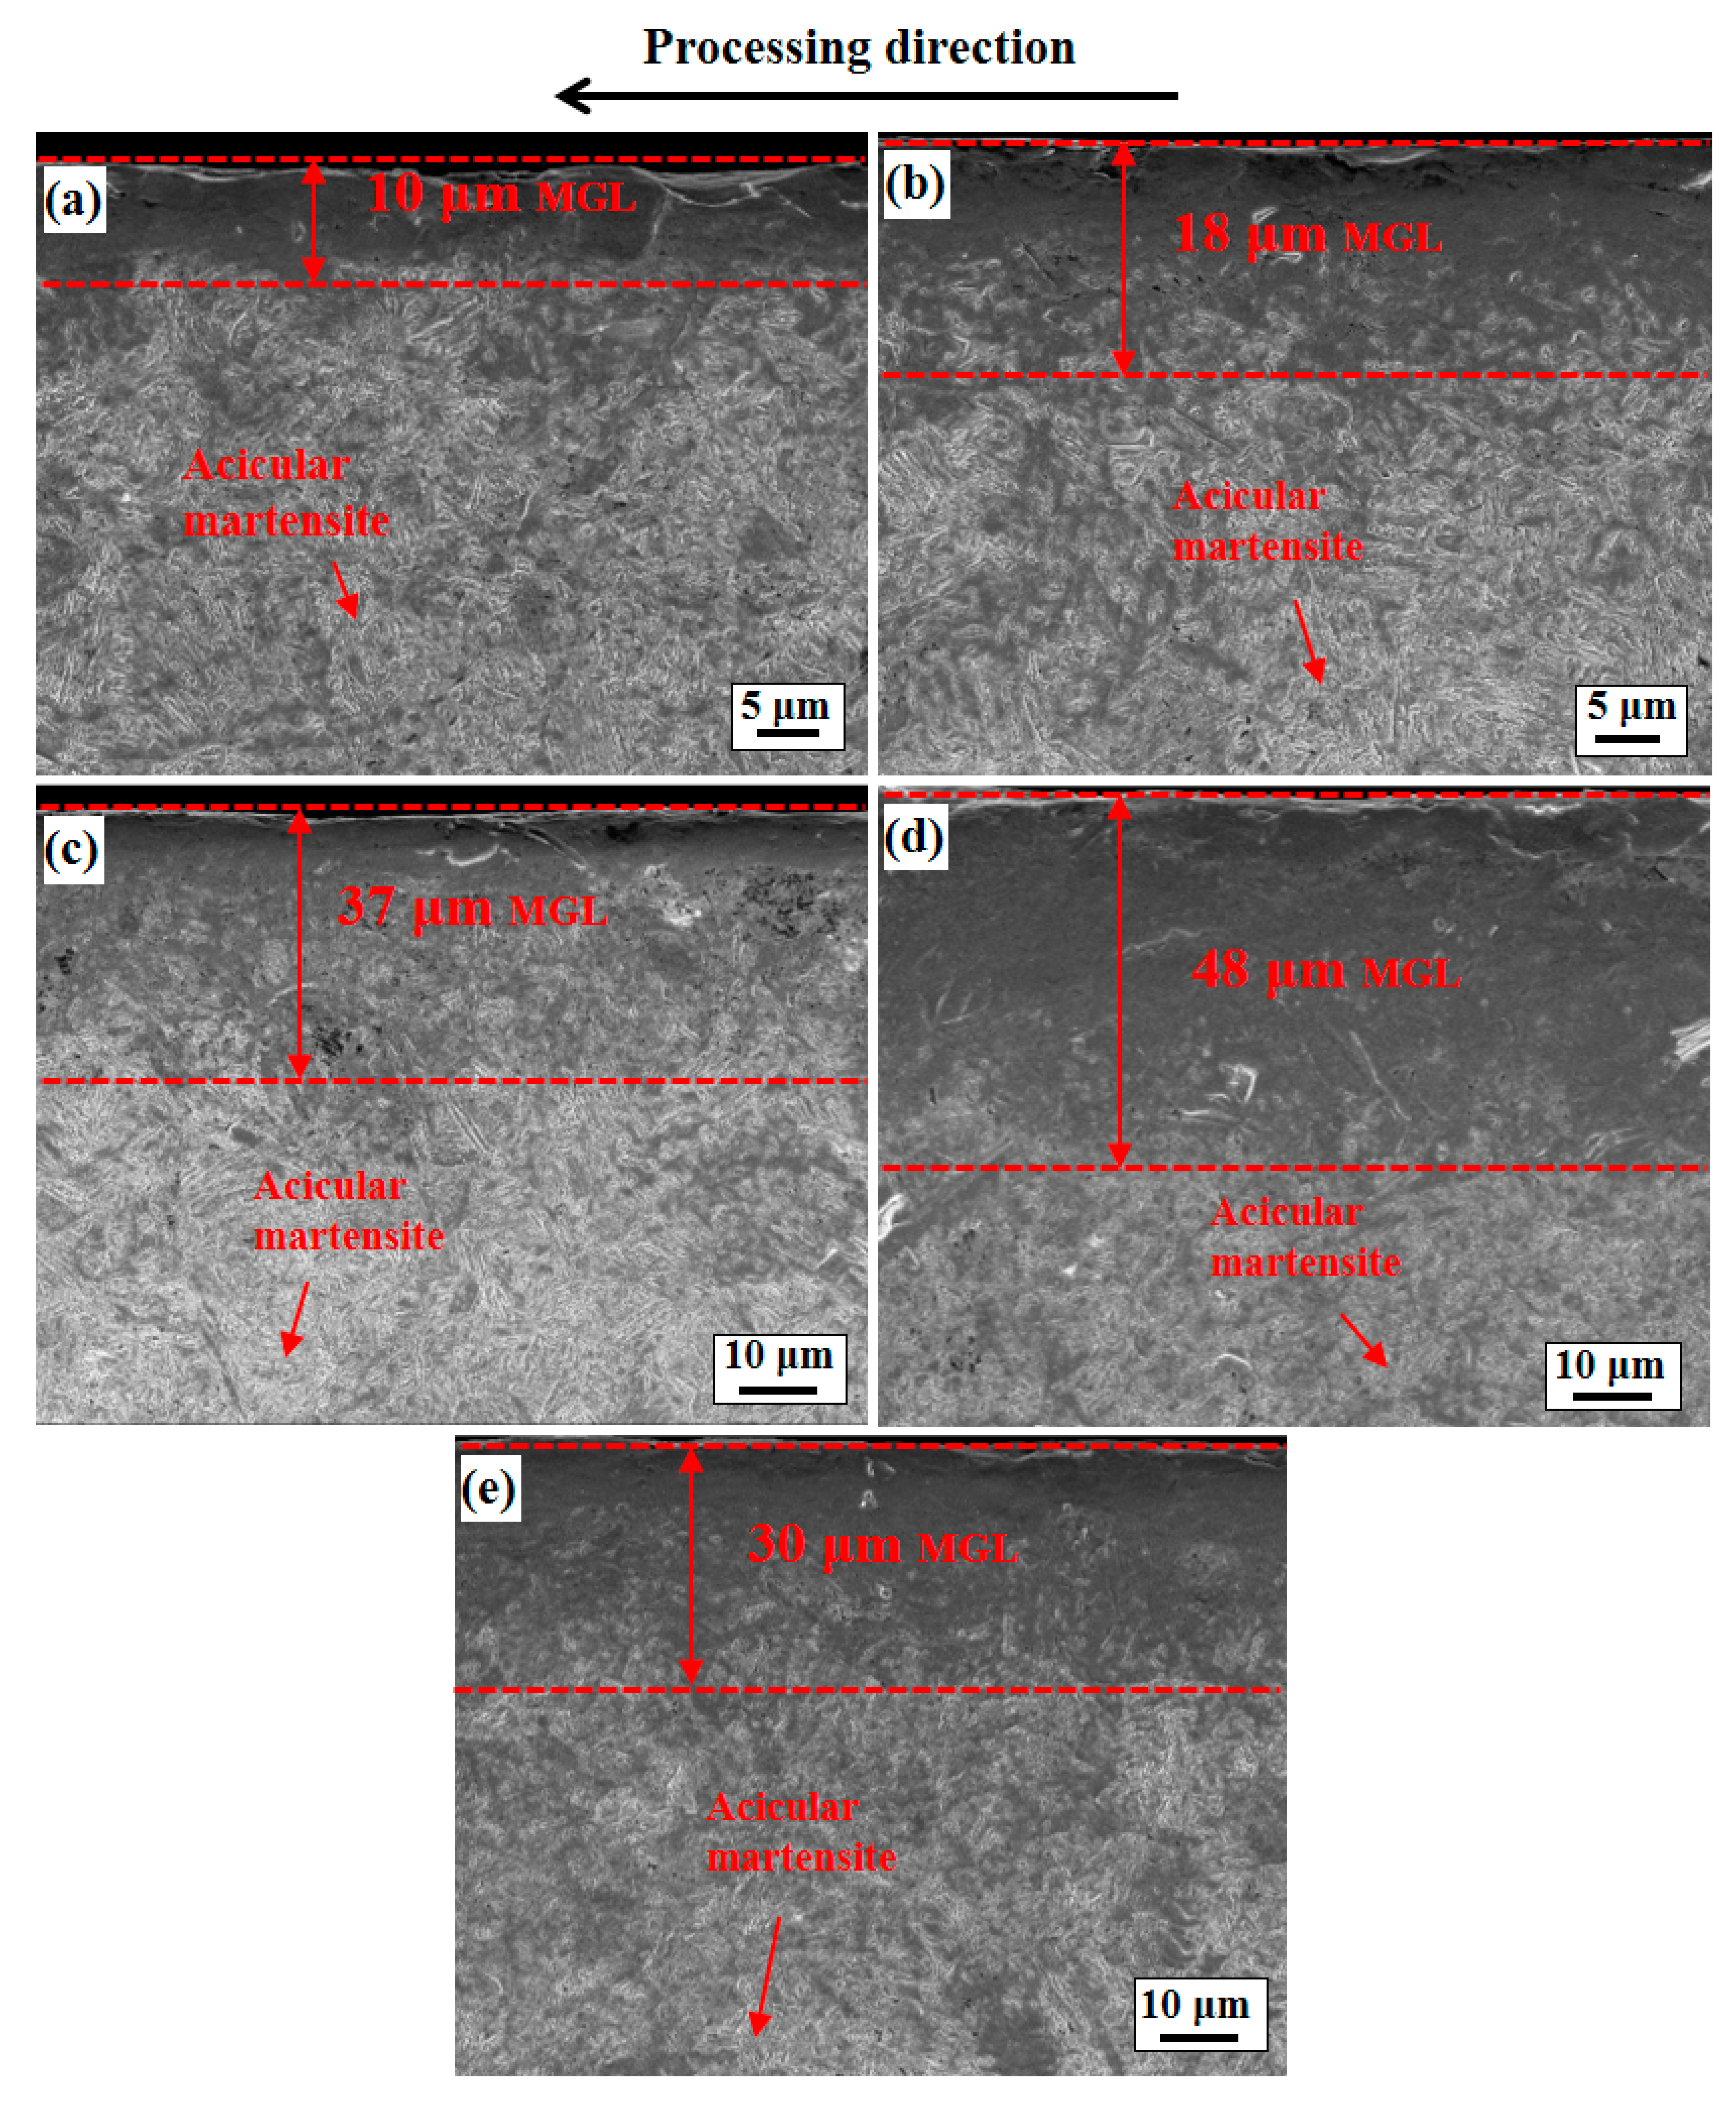
3.1. Microstructure
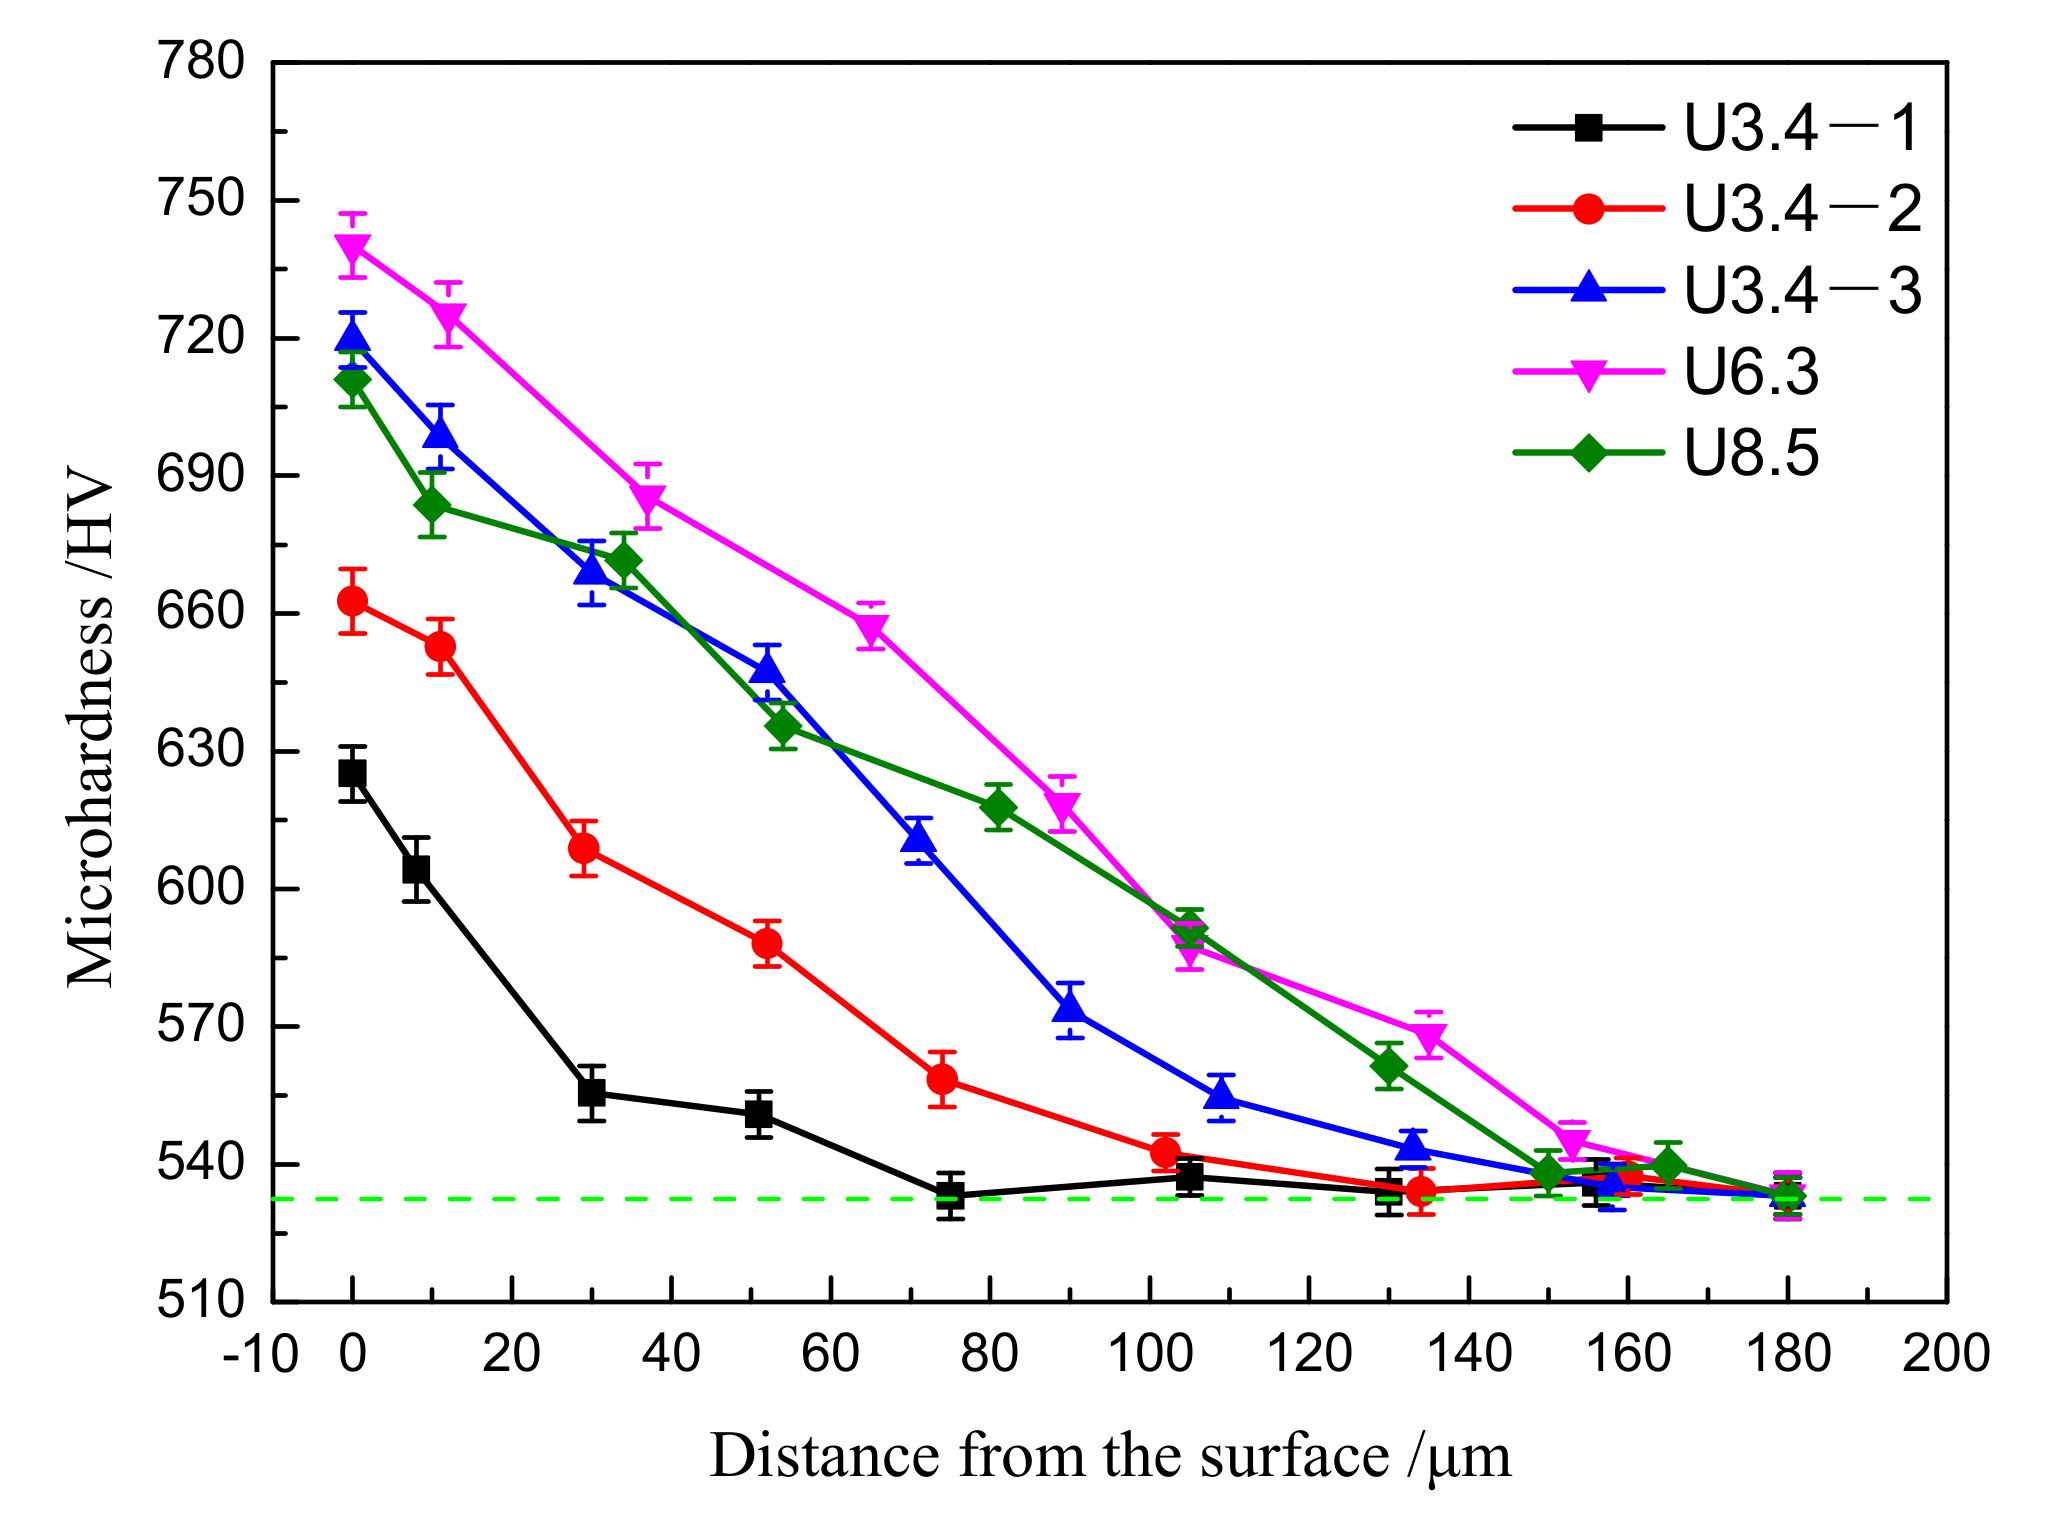
3.2. Hardness
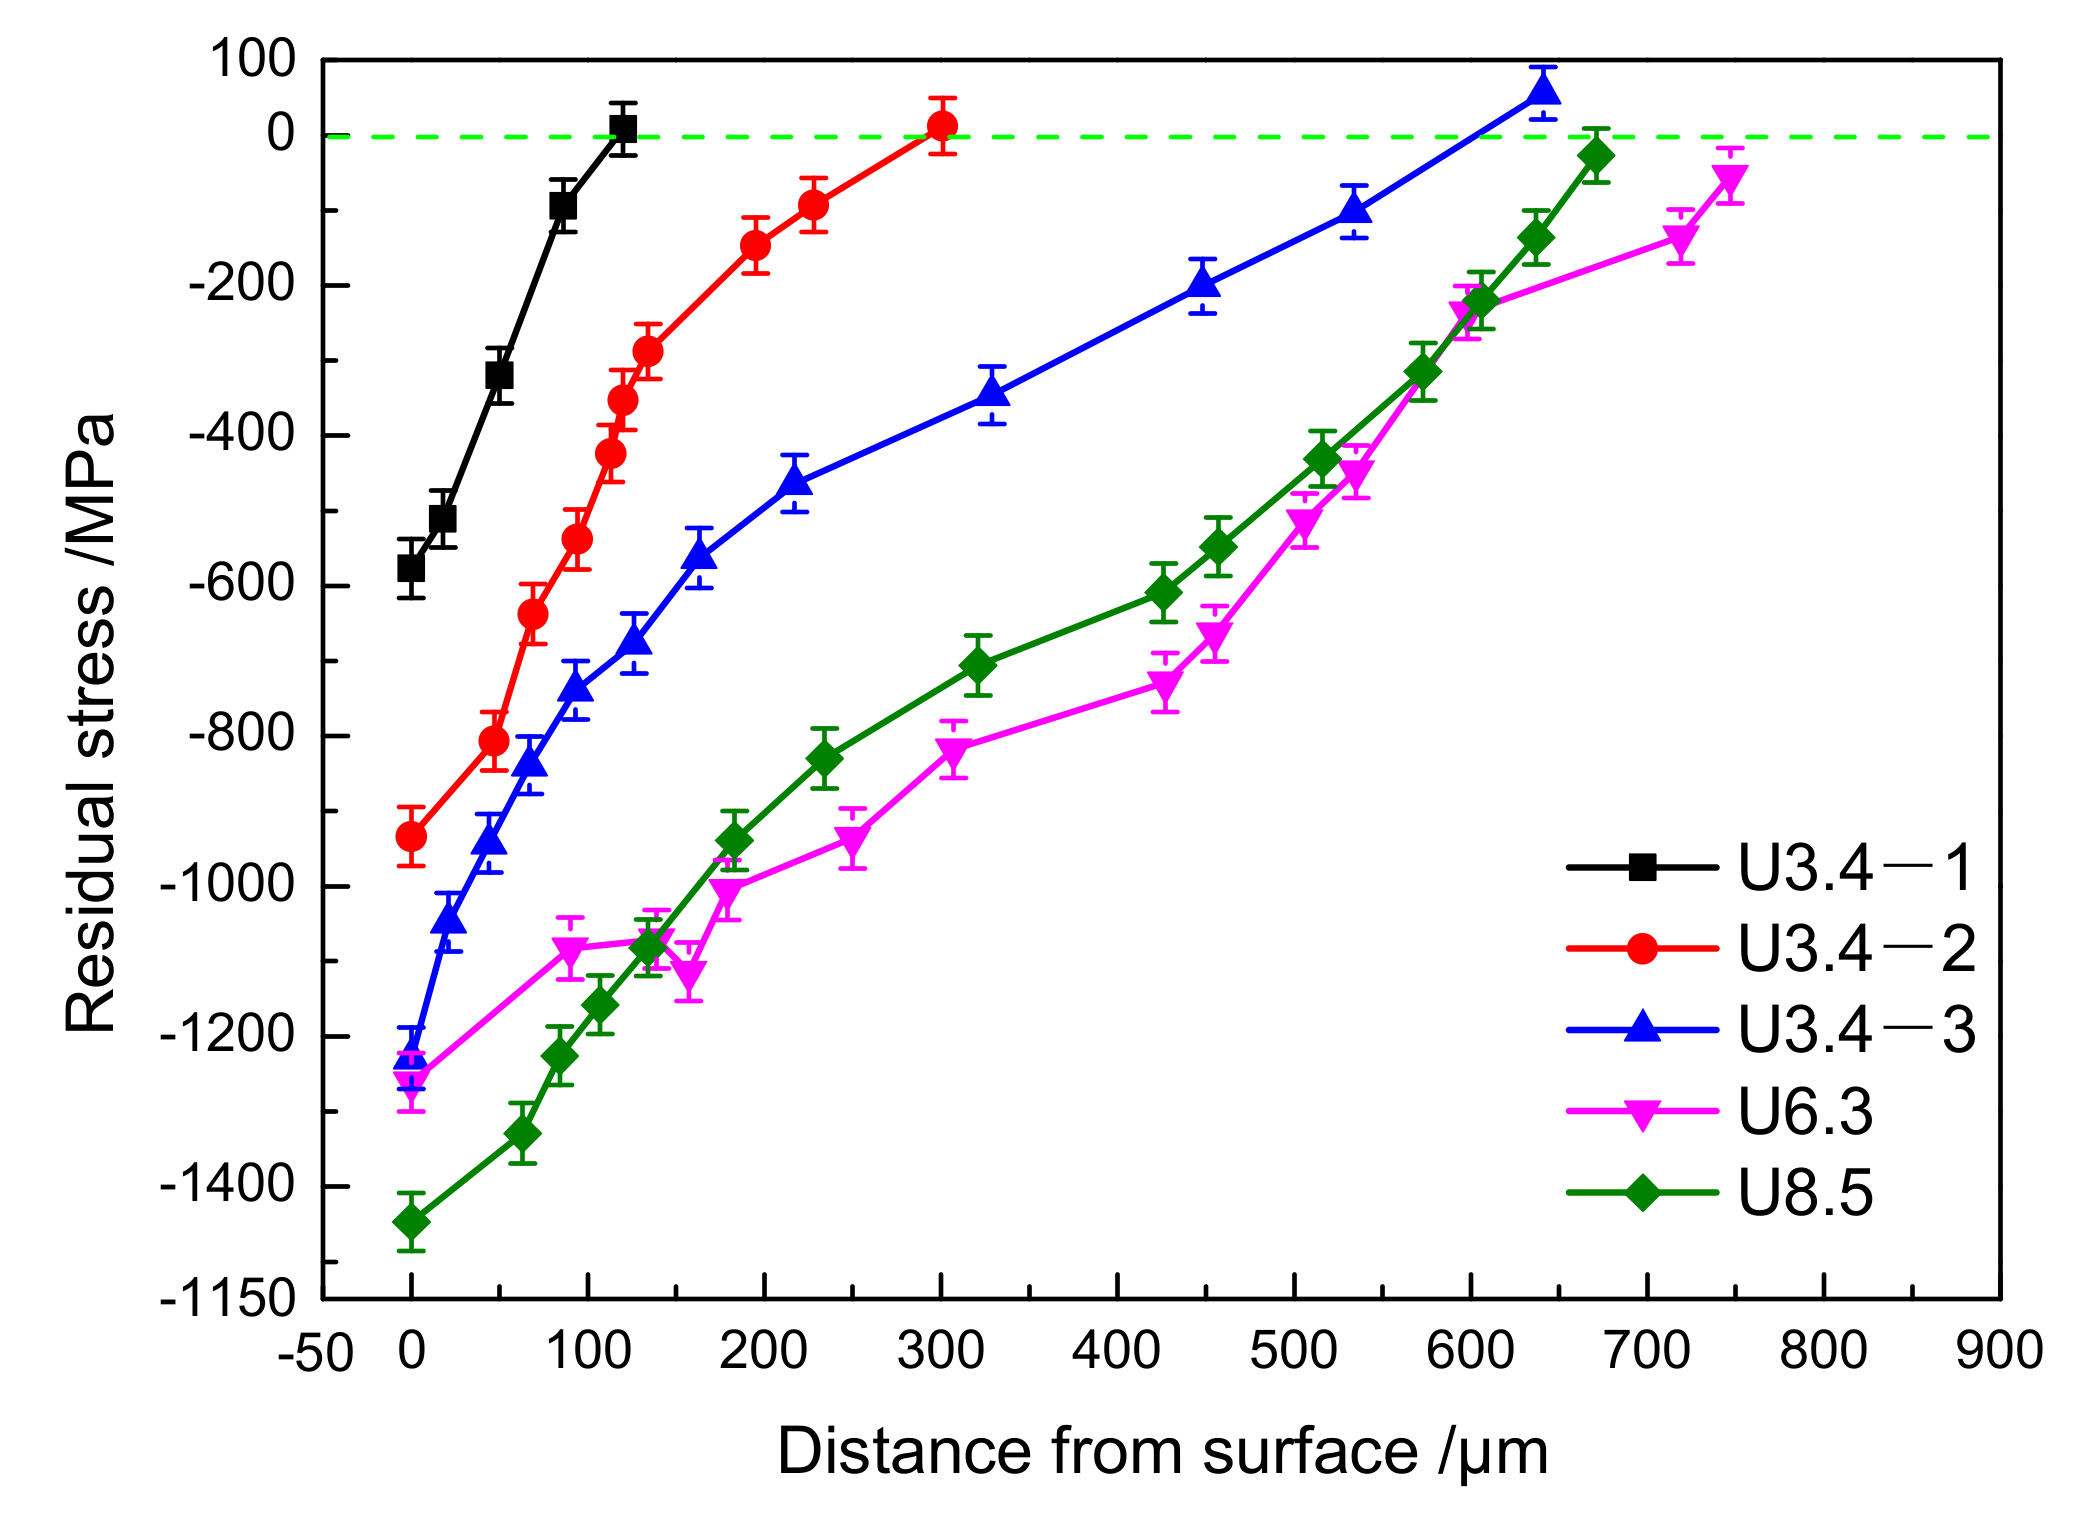
3.3. Residual Stress
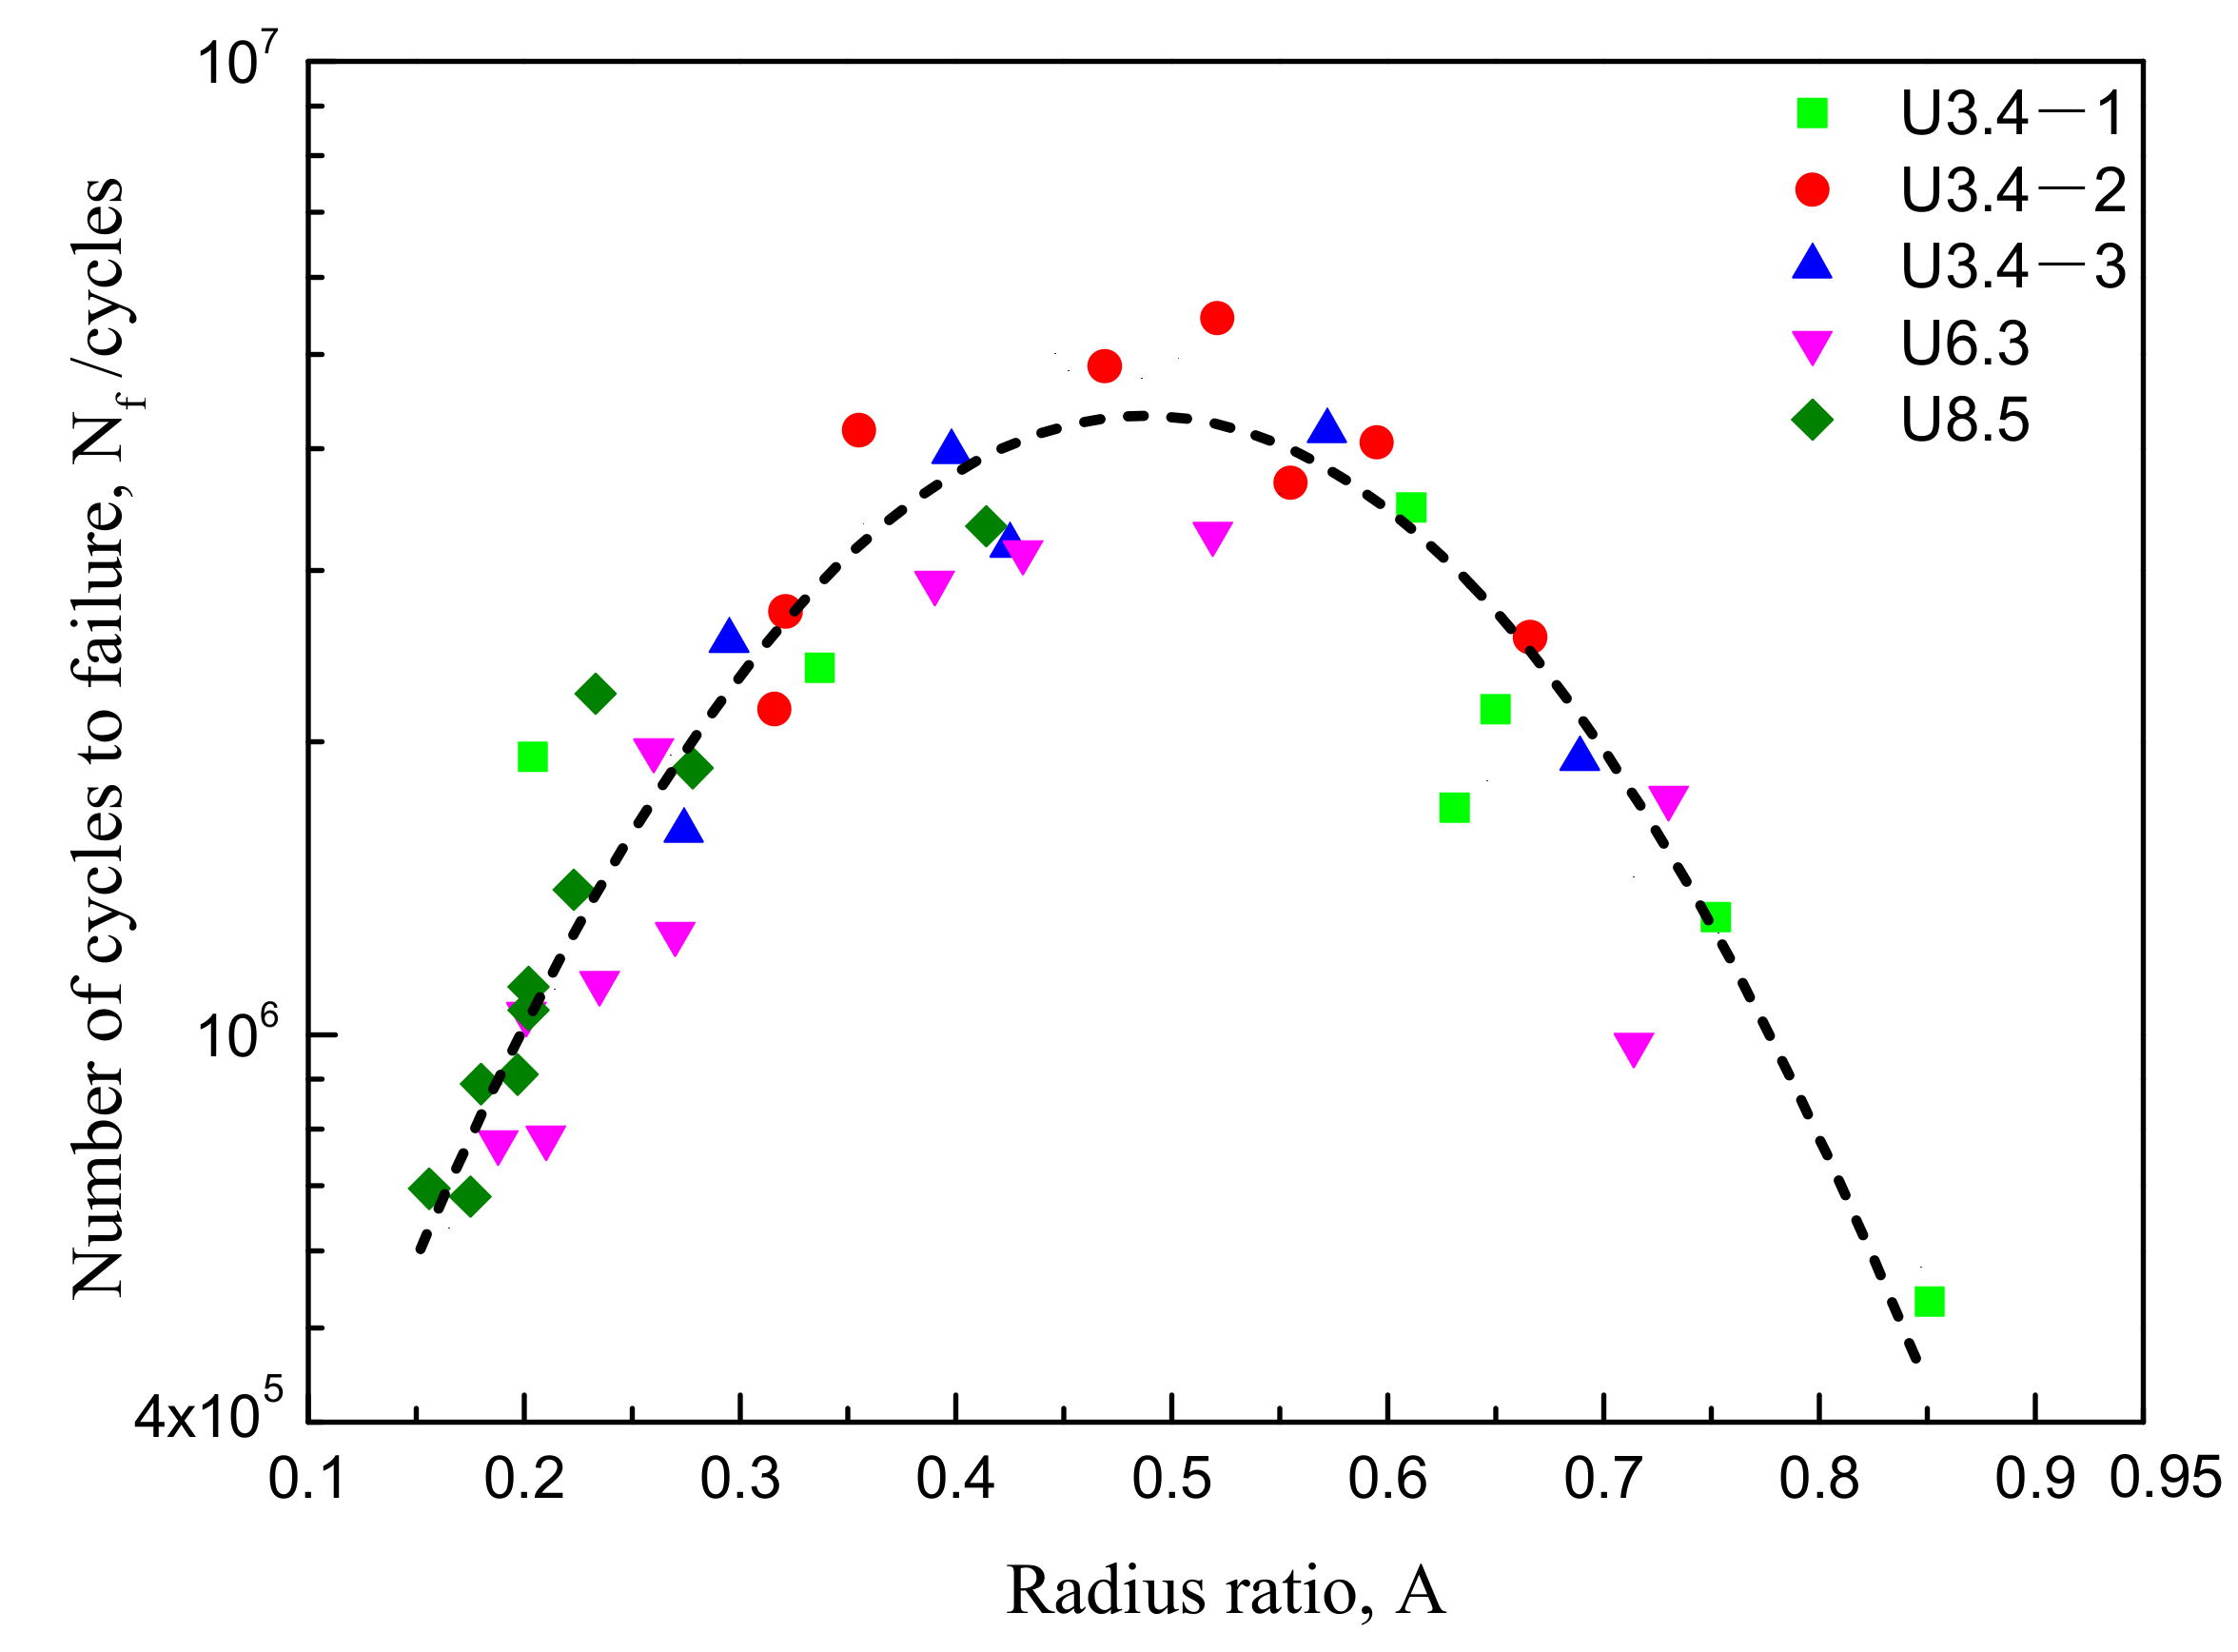
3.4. Fatigue Behaviour
4. Discussion
4.1. Major Factors Affecting the FCIP
Effect of the MGF on the FCIP
4.2. Fractographic Analysis
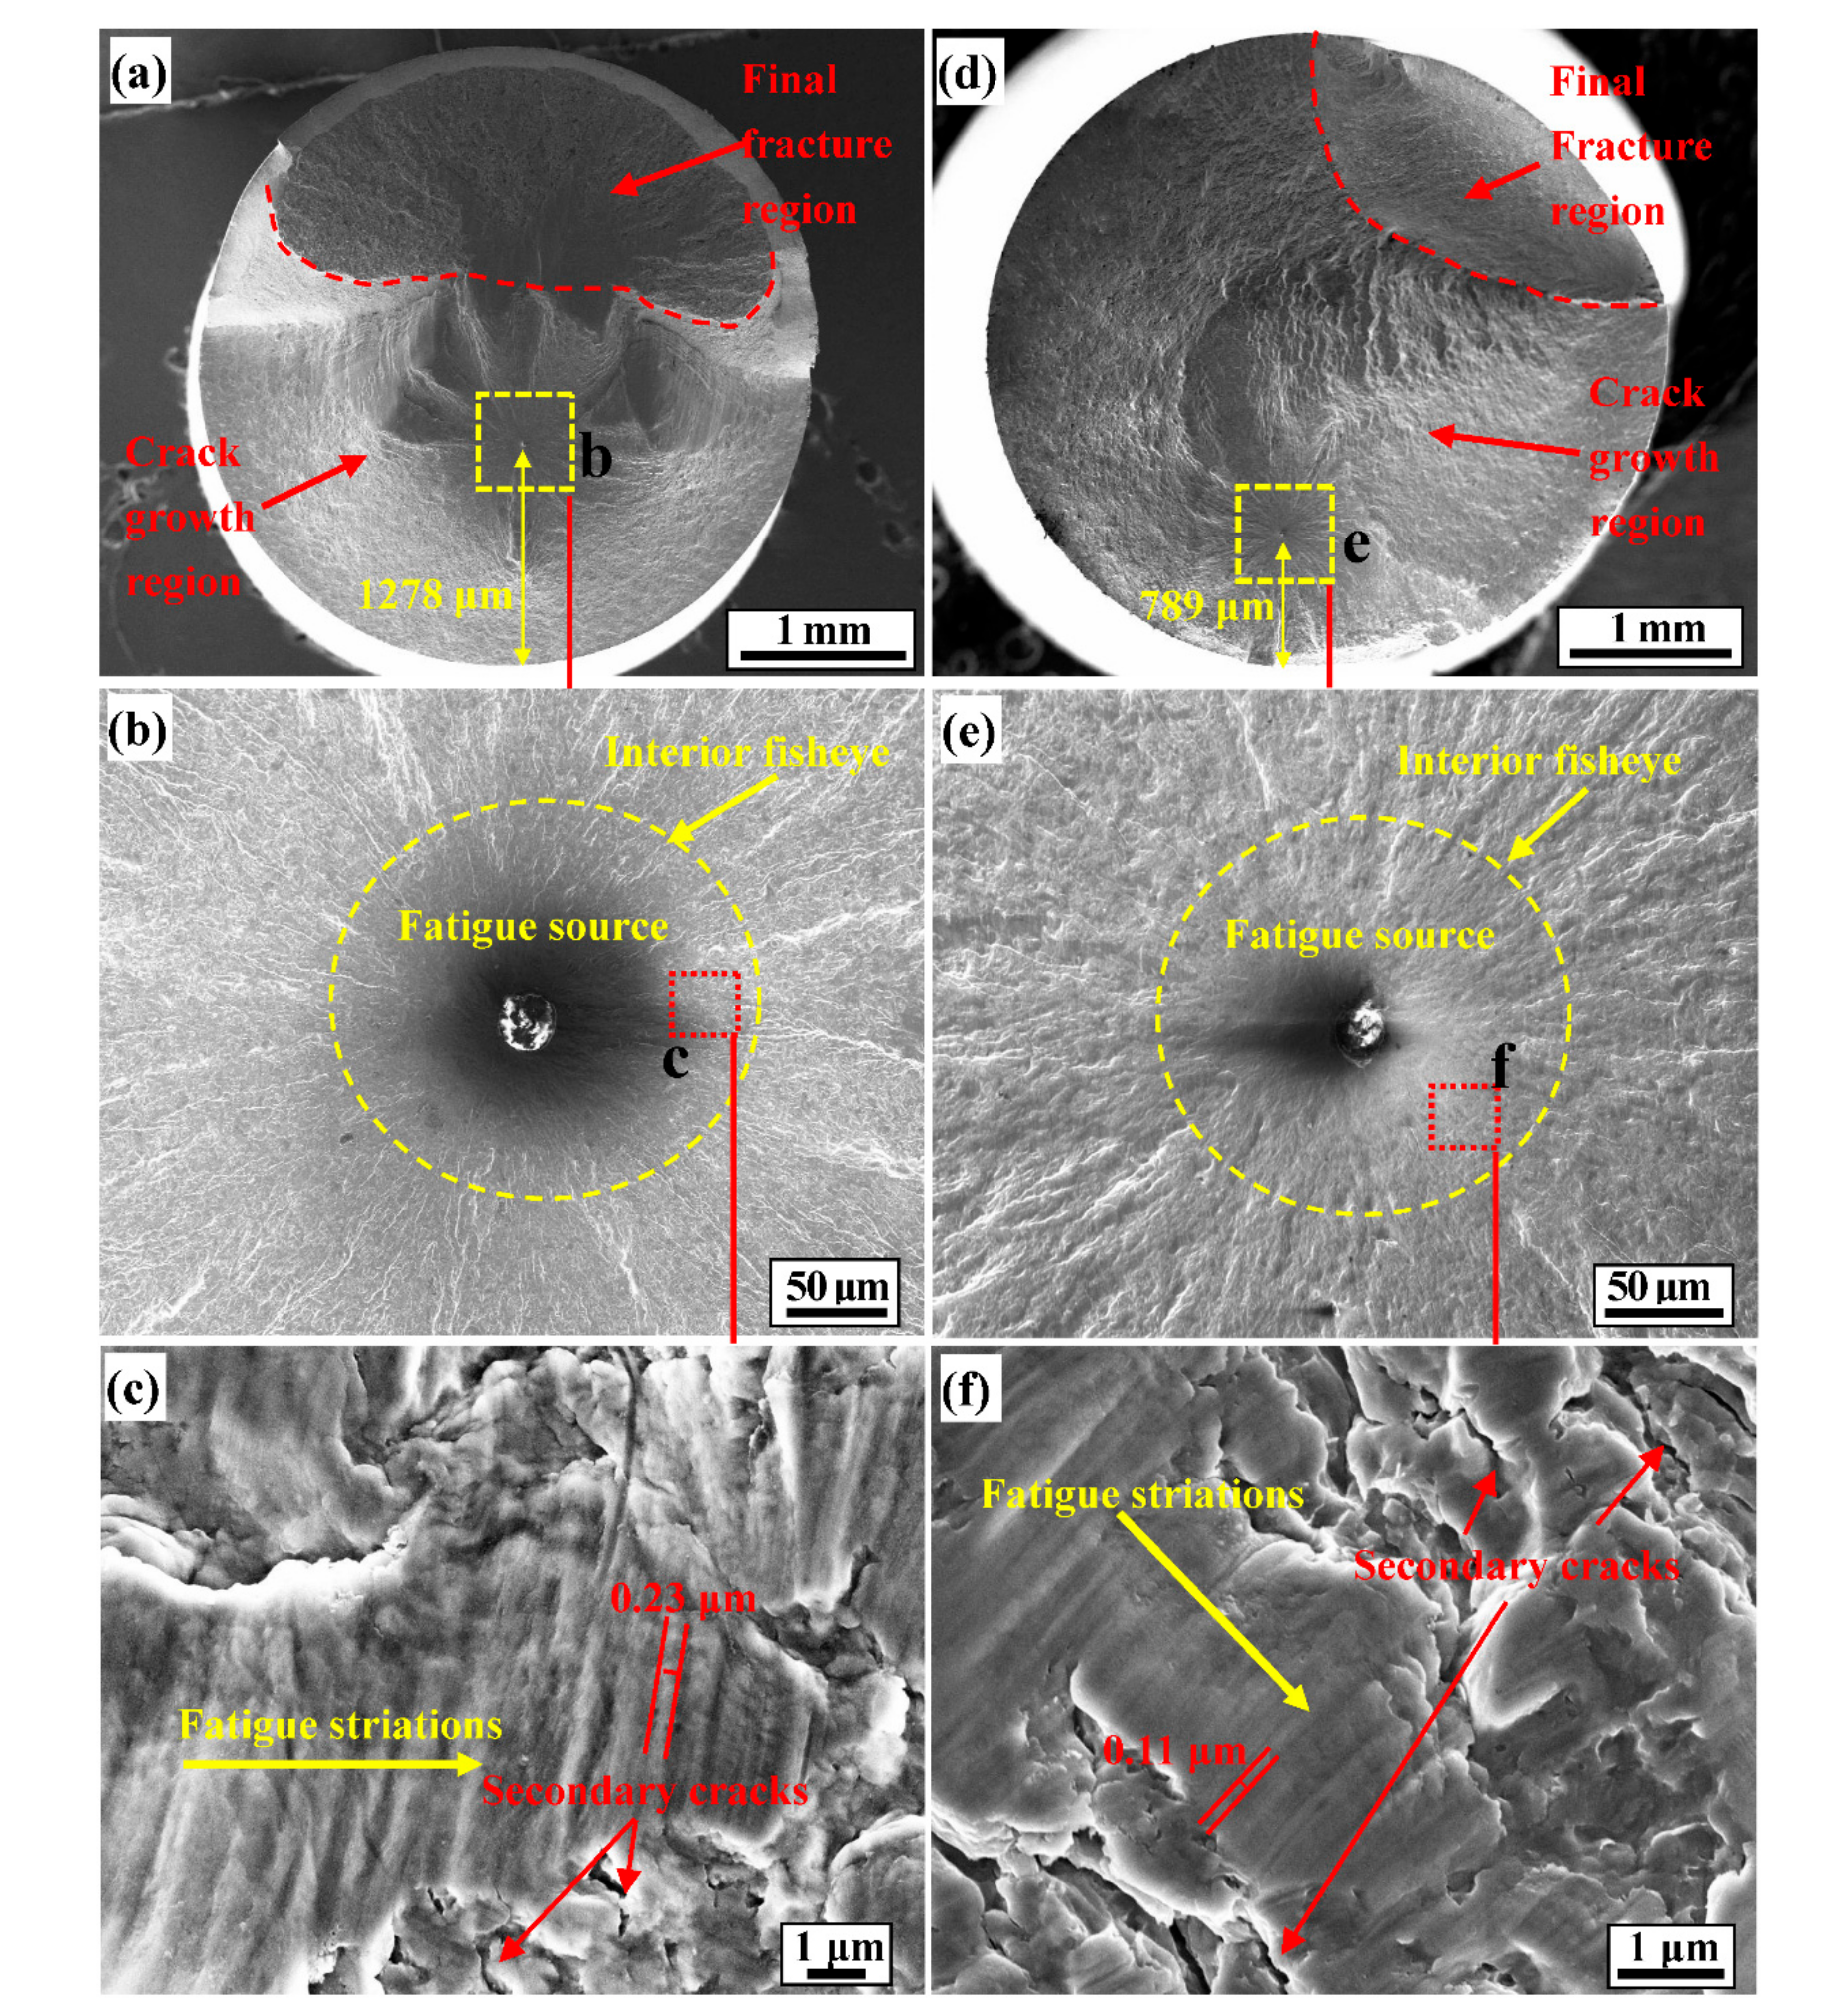
4.2.1. Fracture Surface Morphology Analysis
4.2.2. FCIP Profile Analysis
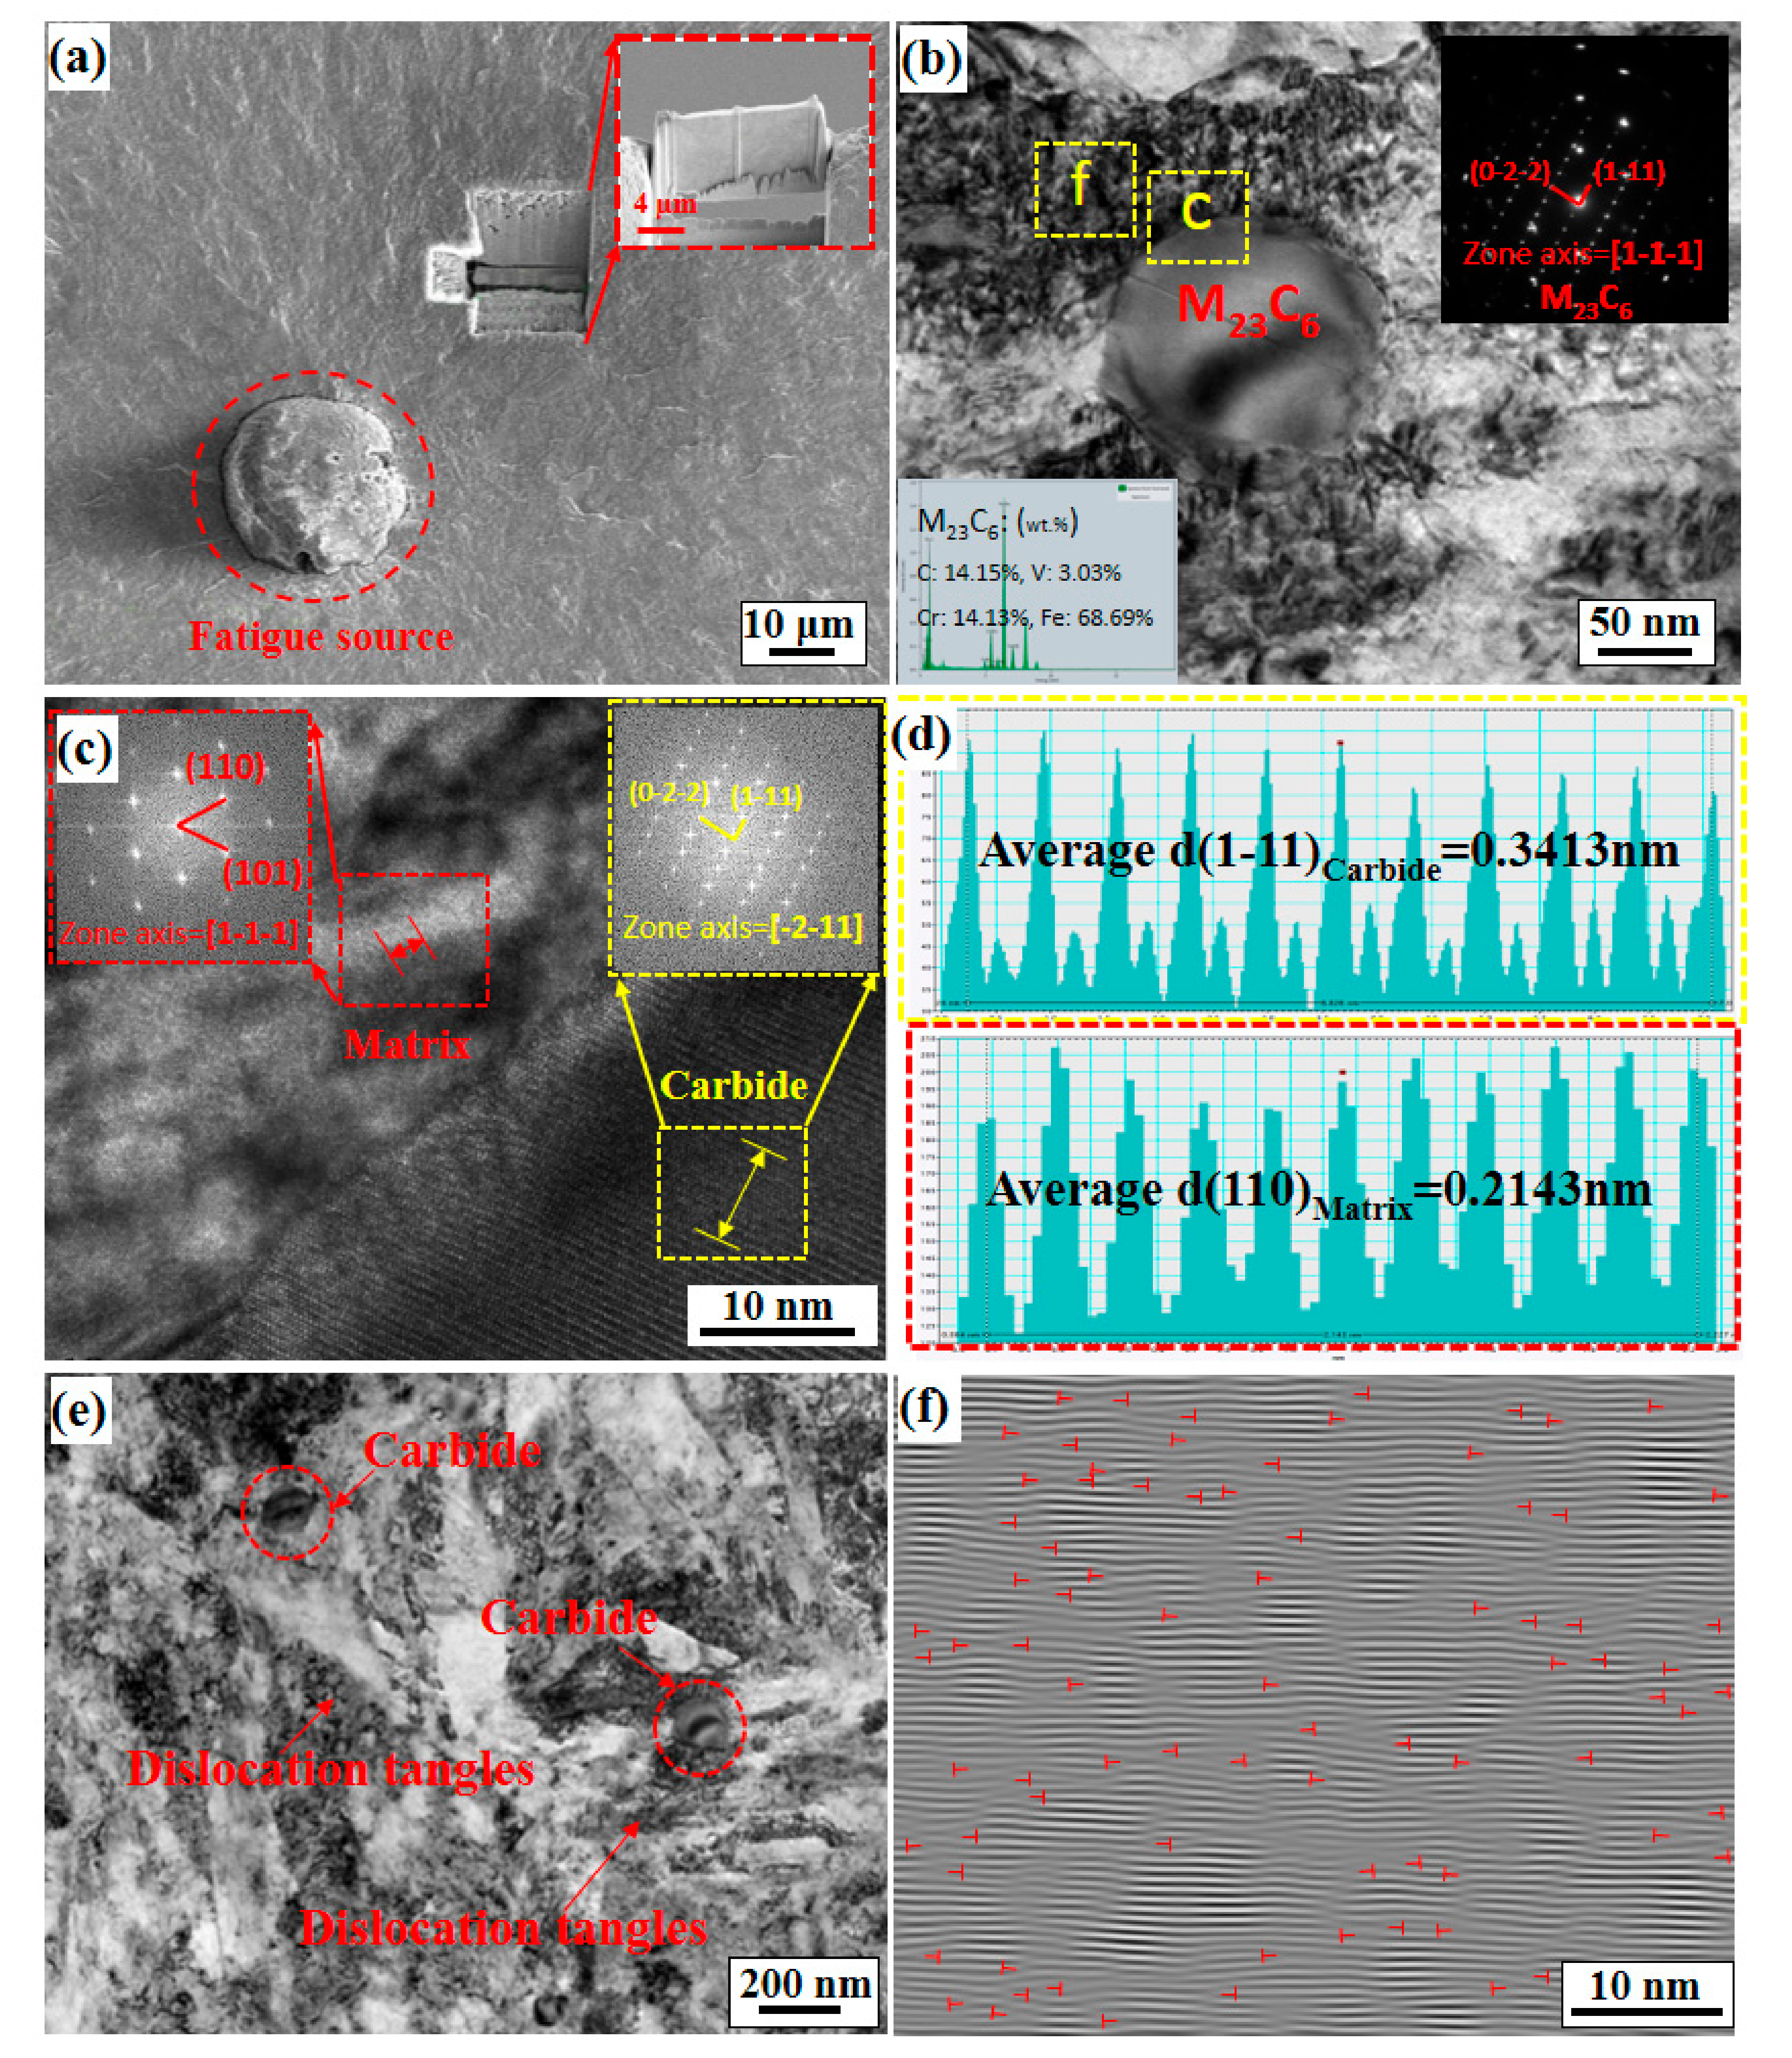
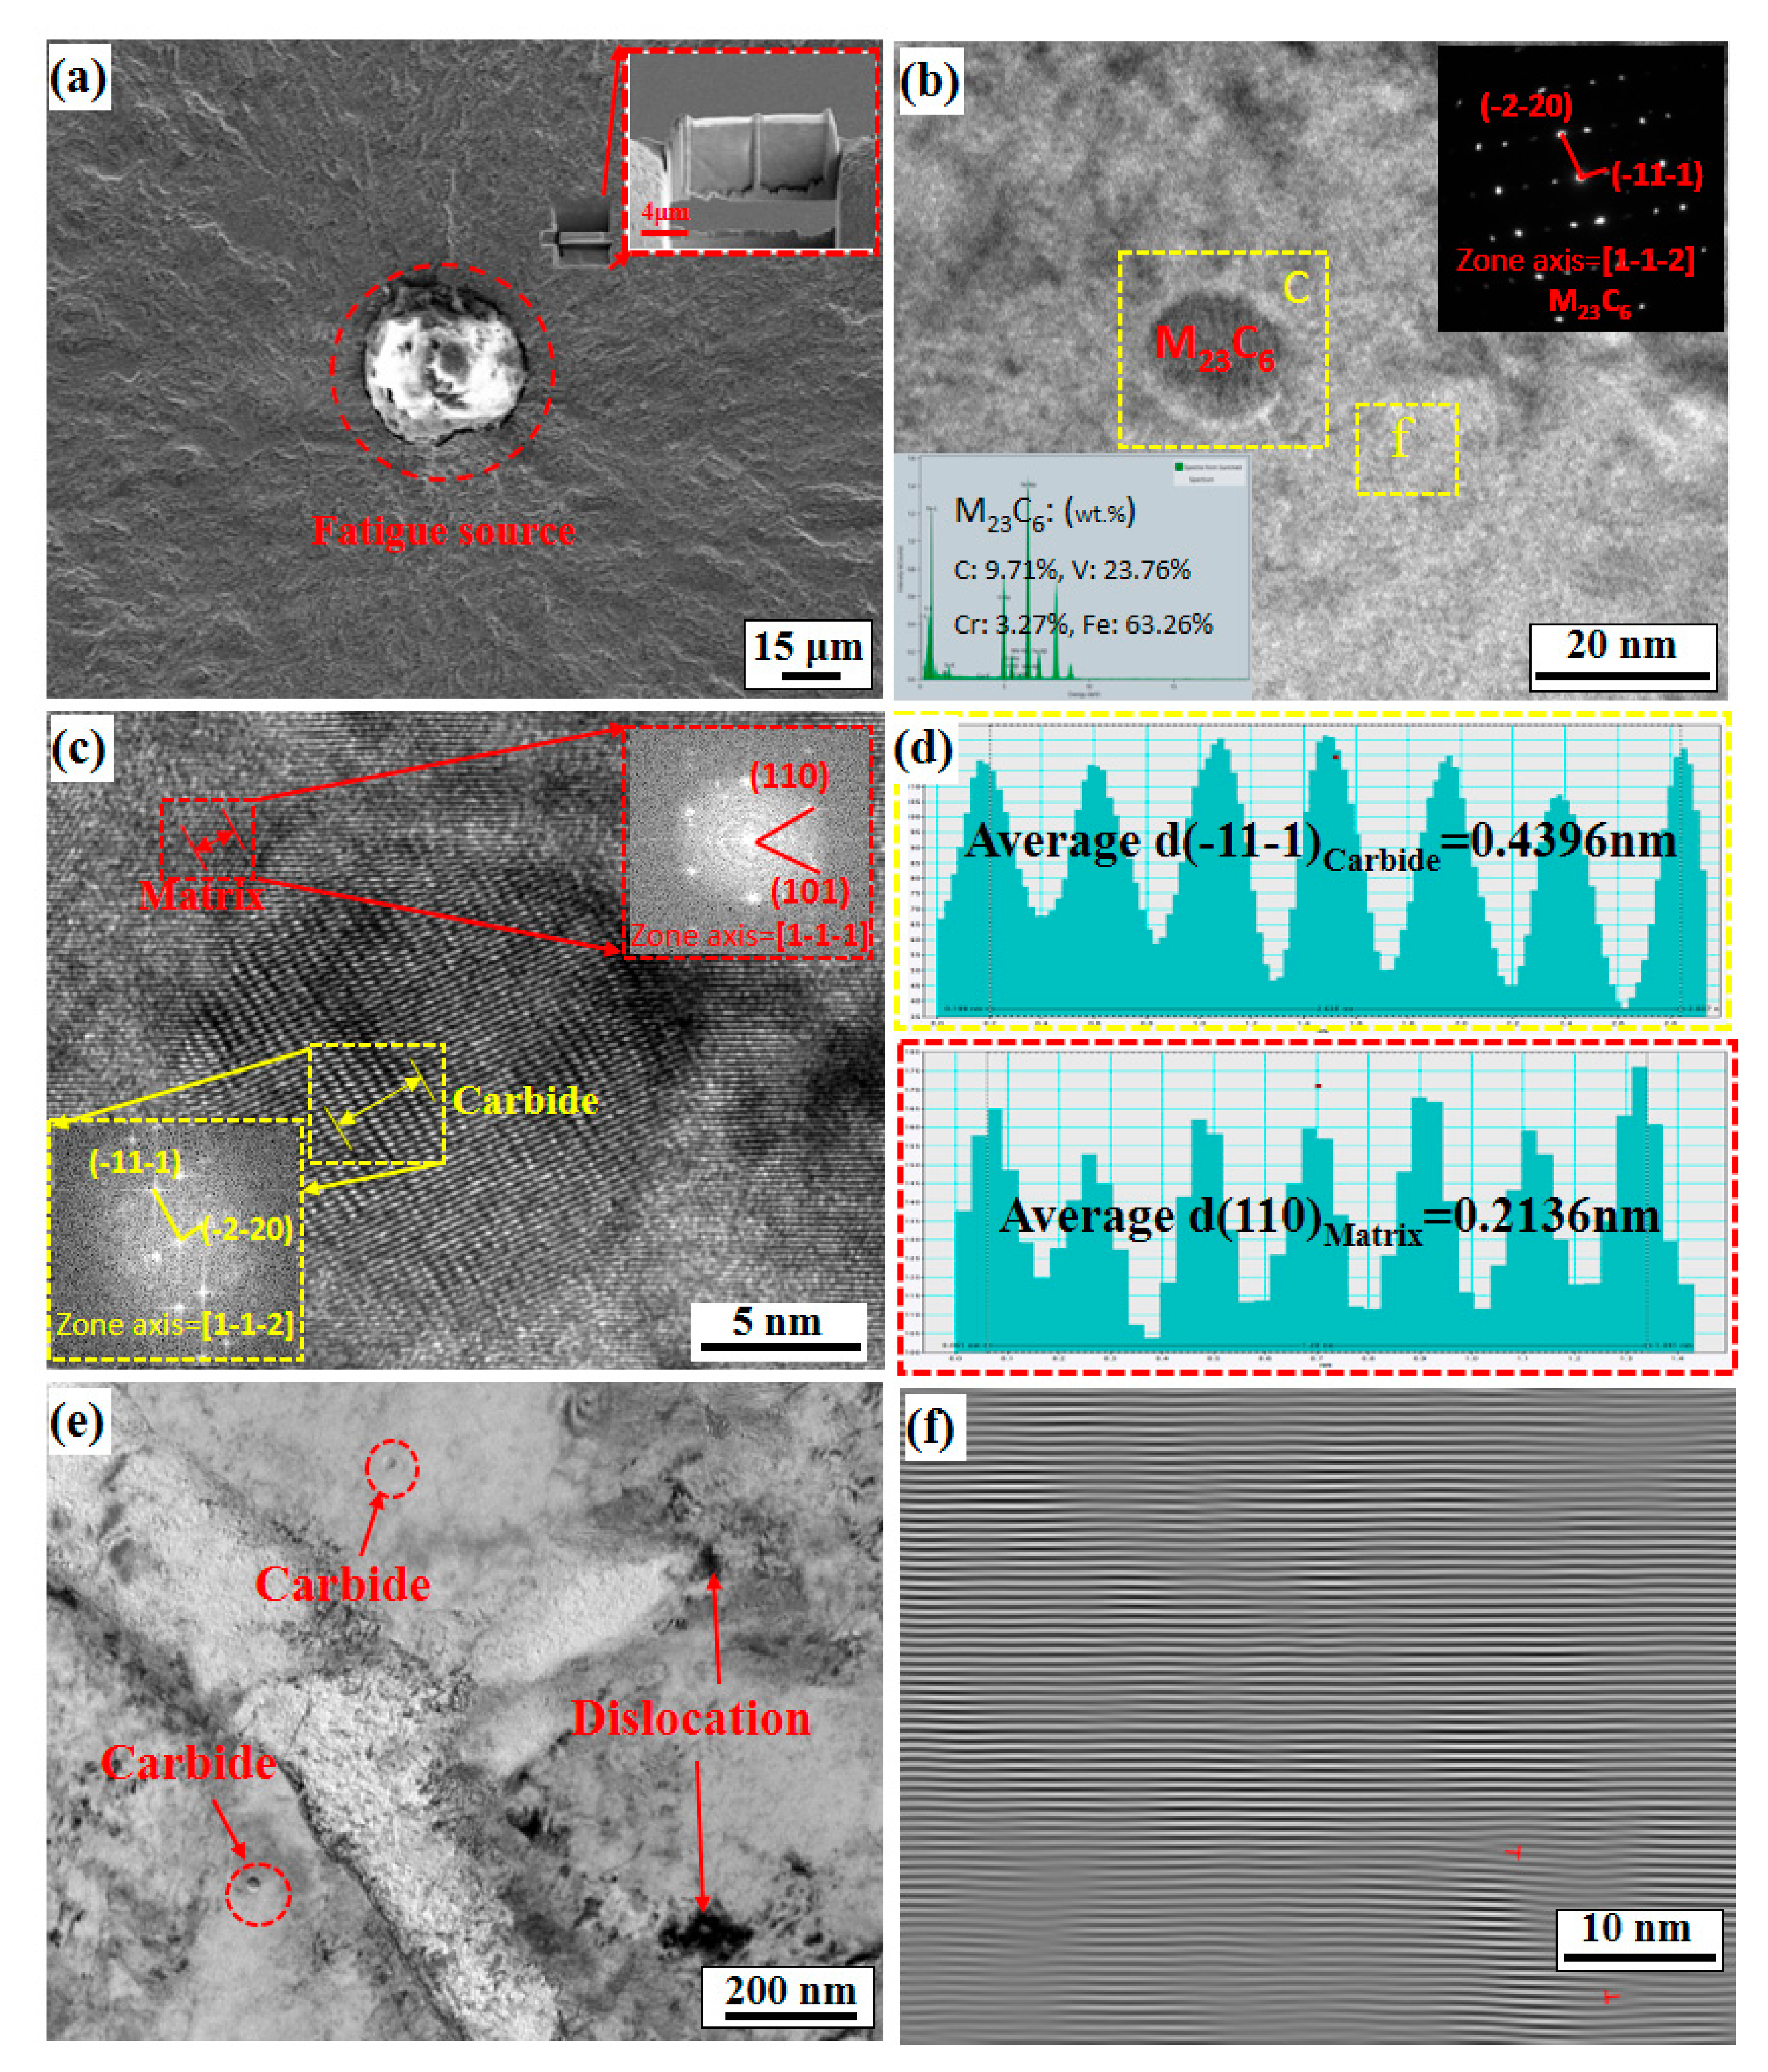
4.3. Dislocation Structures and Precipitate Characteristics near the FCIPs
5. Conclusions
Author Contributions
Funding
Institutional Review Board Statement
Informed Consent Statement
Data Availability Statement
Acknowledgments
Conflicts of Interest
References
- Liu, Y.; Wang, L.; Chou, K. Effect of cerium on the cleanliness of spring steel used in fastener of high-speed railway. J. Rare Earths 2014, 32, 759–766. [Google Scholar] [CrossRef]
- Zhu, J.; Zhang, Z.; Xie, J. Improving strength and ductility of H13 die steel by pre-tempering treatment and its mechanism. Mater. Sci. Eng. A 2019, 752, 101–114. [Google Scholar] [CrossRef]
- Correa, C.D.; De Lara, L.R.; Diaz, M.; Gil-Santos, A.; Porro, J.; Ocaña, J. Effect of advancing direction on fatigue life of 316L stainless steel specimens treated by double-sided laser shock peening. Int. J. Fatigue 2015, 79, 1–9. [Google Scholar] [CrossRef]
- Amanov, A.; Karimbaev, R.; Maleki, E.; Unal, O.; Pyun, Y.-S.; Amanov, T. Effect of combined shot peening and ultrasonic nanocrystal surface modification processes on the fatigue performance of AISI. Surf. Coat. Technol. 2019, 358, 695–705. [Google Scholar] [CrossRef]
- Fu, H.; Liang, Y. Study of the Surface Integrity and High Cycle Fatigue Performance of AISI 4340 Steel after Composite Surface Modification. Metals 2019, 9, 856. [Google Scholar] [CrossRef] [Green Version]
- Srivastava, M.; Tripathi, R.; Hloch, S.; Chattopadhyaya, S.; Dixit, A.R. Potential of Using Water Jet Peening as a Surface Treatment Process for Welded Joints. Procedia Eng. 2016, 149, 472–480. [Google Scholar] [CrossRef] [Green Version]
- Jia, W.; Hong, Q.; Zhao, H.; Li, L.; Han, D. Effect of laser shock peening on the mechanical properties of a near-α titanium alloy. Mater. Sci. Eng. A 2014, 606, 354–359. [Google Scholar] [CrossRef]
- Nalla, R.; Altenberger, I.; Noster, U.; Liu, G.; Scholtes, B.; Ritchie, R. On the influence of mechanical surface treatments—Deep rolling and laser shock peening—On the fatigue behavior of Ti–6Al–4V at ambient and elevated temperatures. Mater. Sci. Eng. A 2003, 355, 216–230. [Google Scholar] [CrossRef]
- Pandey, V.; Chattopadhyay, K.; Srinivas, N.S.; Singh, V. Role of ultrasonic shot peening on low cycle fatigue behavior of 7075 aluminium alloy. Int. J. Fatigue 2017, 103, 426–435. [Google Scholar] [CrossRef]
- Kumar, S.; Chattopadhyay, K.; Singh, V. Effect of ultrasonic shot peening on LCF behavior of the Ti–6Al–4V alloy. J. Alloys Compd. 2017, 724, 187–197. [Google Scholar] [CrossRef]
- Liu, D.; Liu, D.; Zhang, X.; Liu, C.; Ao, N. Surface nanocrystallization of 17-4 precipitation-hardening stainless steel subjected to ultrasonic surface rolling process. Mater. Sci. Eng. A 2018, 726, 69–81. [Google Scholar] [CrossRef]
- Ao, N.; Liu, D.; Liu, C.; Zhang, X.; Liu, D. Face-centered titanium induced by ultrasonic surface rolling process in Ti-6Al-4V alloy and its tensile behavior. Mater. Charact. 2018, 145, 527–533. [Google Scholar] [CrossRef]
- Liu, Y.; Zhao, X.; Wang, D. Determination of the plastic properties of materials treated by ultrasonic surface rolling process through instrumented indentation. Mater. Sci. Eng. A 2014, 600, 21–31. [Google Scholar] [CrossRef]
- Liu, C.; Liu, D.; Zhang, X.; Ao, N.; Xu, X.; Liu, D.; Yang, J. Fretting fatigue characteristics of Ti-6Al-4V alloy with a gradient nanostructured surface layer induced by ultrasonic surface rolling process. Int. J. Fatigue 2019, 125, 249–260. [Google Scholar] [CrossRef]
- Iwata, N.; Tomota, Y.; Katahira, K.; Suzuki, H. Effect of shot peening on fatigue fracture for an as quenched martensitic steel. Mater. Sci. Technol. 2002, 18, 629–632. [Google Scholar] [CrossRef]
- Kim, J.-C.; Cheong, S.-K.; Noguchi, H. Evolution of residual stress redistribution associated with localized surface microcracking in shot-peened medium-carbon steel during fatigue test. Int. J. Fatigue 2013, 55, 147–157. [Google Scholar] [CrossRef]
- Ajaja, J.; Jomaa, W.; Bocher, P.; Chromik, R.; Brochu, M. High cycle fatigue behavior of hard turned 300 M ultra-high strength steel. Int. J. Fatigue 2020, 131, 105380. [Google Scholar] [CrossRef]
- Ren, C.; Wang, D.; Wang, Q.; Guo, Y.; Zhang, Z.; Shao, C.; Yang, H. Enhanced bending fatigue resistance of a 50CrMnMoVNb spring steel with decarburized layer by surface spinning strengthening. Int. J. Fatigue 2019, 124, 277–287. [Google Scholar] [CrossRef]
- Liu, C.; Liu, D.; Zhang, X.; He, G.; Xu, X.; Ao, N.; Ma, A.; Liu, D. On the influence of ultrasonic surface rolling process on surface integrity and fatigue performance of Ti-6Al-4V alloy. Surf. Coat. Technol. 2019, 370, 24–34. [Google Scholar] [CrossRef]
- RWang, Z.; Ru, J.L.; Li, X.B.; Yao, M.; Li, J.K.; Wang, S.P.; Shao, P.G. A Micro-meso-process theory of fatigue crack initiation and theoryof internal fatigue limit. Trans. Metal Heat Treatment 1995, 16, 26–34. [Google Scholar] [CrossRef]
- Yu, S.; Liu, D.; Zhang, X.; Du, N. Effects of combined plasma chromizing and shot peening on the fatigue properties of a Ti6Al4V alloy. Appl. Surf. Sci. 2015, 353, 995–1002. [Google Scholar] [CrossRef]
- Li, K.; Fu, X.-S.; Li, R.-D.; Gai, P.-T.; Li, Z.-Q.; Zhou, W.-L.; Chen, G.-Q. Fretting fatigue characteristic of Ti–6Al–4V strengthened by wet peening. Int. J. Fatigue 2016, 85, 65–69. [Google Scholar] [CrossRef]
- Wang, Q. Effect of inclusion on subsurface crack initiation and gigacycle fatigue strength. Int. J. Fatigue 2002, 24, 1269–1274. [Google Scholar] [CrossRef]
- Bridgman, P.W. Studies in Large Plastic Flow and Fracture; McGraw-Hill: New York, NY, USA, 1952; p. 177. [Google Scholar] [CrossRef]
- Bag, A.; Delbergue, D.; Bocher, P.; Lévesque, M.; Brochu, M. Study of short crack growth in shot peened 300M steel. In Proceedings of the 13th International Conference on Shot Peening, Montréal, QC, Canada, 18–21 September 2017. [Google Scholar]
- Itoga, H. Effect of surface roughness on step-wise S–N characteristics in high strength steel. Int. J. Fatigue 2003, 25, 379–385. [Google Scholar] [CrossRef]
- Huang, H.; Wang, Z.; Lu, J.; Lu, K. Fatigue behaviors of AISI 316L stainless steel with a gradient nanostructured surface layer. Acta Mater. 2015, 87, 150–160. [Google Scholar] [CrossRef]
- Ge, M.-Z.; Xiang, J.-Y. Effect of laser shock peening on microstructure and fatigue crack growth rate of AZ31B magnesium alloy. J. Alloys Compd. 2016, 680, 544–552. [Google Scholar] [CrossRef]
- Carlsson, S.; Larsson, P.-L. On the determination of residual stress and strain fields by sharp indentation testing. Acta Mater. 2001, 49, 2179–2191. [Google Scholar] [CrossRef]
- Segurado, E.; Belzunce, F.; Pariente, I.F. Effects of low intensity shot peening treatments applied with different types of shots on the fatigue performance of a high-strength steel. Surf. Coat. Technol. 2018, 340, 25–35. [Google Scholar] [CrossRef]
- ASM International Handbook Committee. ASM Handbook Volume 19 Fatigue and Fracture, 10th ed.; ASM International: Materials Park, OH, USA, 1996; p. 2136. [Google Scholar]
- Liu, A.F. Mechanics and Mechanisms of Fracture: An Introduction, 1st ed.; ASM International: Materials Park, OH, USA, 2005. [Google Scholar]
- Richards, C.; Lindley, T. The influence of stress intensity and microstructure on fatigue crack propagation in ferritic materials. Eng. Fract. Mech. 1972, 4, 951–978. [Google Scholar] [CrossRef]
- Lei, Z.; Hong, Y.; Xie, J.; Sun, C.; Zhao, A. Effects of inclusion size and location on very-high-cycle fatigue behavior for high strength steels. Mater. Sci. Eng. A 2012, 558, 234–241. [Google Scholar] [CrossRef] [Green Version]
- Krewerth, D.; Lippmann, T.; Weidner, A.; Biermann, H. Influence of non-metallic inclusions on fatigue life in the very high cycle fatigue regime. Int. J. Fatigue 2016, 84, 40–52. [Google Scholar] [CrossRef]
- Hershko, E.; Mandelker, N.; Gheorghiu, G.; Sheinkopf, H.; Cohen, I.; Levy, O. Assessment of fatigue striation counting accuracy using high resolution scanning electron microscope. Eng. Fail. Anal. 2008, 15, 20–27. [Google Scholar] [CrossRef]
- Murakam, Y.; Nomoto, T.; Ueda, T. Factors influencing the mechanism of superlong fatigue failure in steels. Fatigue Fract. Eng. Mater. Struct. 1999, 22, 581–590. [Google Scholar] [CrossRef]
- McEvily, A.J.; Walter, I. The Rate of Fatigue-Crack Propagation in Two Aluminum Alloys; NACA Technical Note; Langley Aeronautical Laboratory: Hampton,VA, USA, 1958; pp. 1–47. [Google Scholar]
- Lütjering, G.; Albrecht, J.; Sauer, C.; Krull, T. The influence of soft, precipitate-free zones at grain boundaries in Ti and Al alloys on their fatigue and fracture behavior. Mater. Sci. Eng. A 2007, 468–470, 201–209. [Google Scholar] [CrossRef]
- Depres, C.; Reddy, G.P.; Robertson, C.; Fivel, M. An extensive 3D dislocation dynamics investigation of stage-I fatigue crack propagation. Philos. Mag. 2014, 94, 4115–4137. [Google Scholar] [CrossRef] [Green Version]
- Zhou, J.; Shen, Y.; Hong, Y.; Xue, W.; Misra, R. Strengthening a fine-grained low activation martensitic steel by nanosized carbides. Mater. Sci. Eng. A 2020, 769, 138471. [Google Scholar] [CrossRef]
- Ran, X.-Z.; Liu, D.; Li, J.; Liu, X.; Wang, H.-M.; Cheng, X.; He, B.; Tang, H.-B. Effects of post homogeneity heat treatment processes on microstructure evolution behavior and tensile mechanical properties of laser additive manufactured ultrahigh-strength AerMet100 steel. Mater. Sci. Eng. A 2018, 723, 8–21. [Google Scholar] [CrossRef]
- Li, J.; Liu, B.; Fang, Q.; Huang, Z.; Liu, Y. Atomic-scale strengthening mechanism of dislocation-obstacle interaction in silicon carbide particle-reinforced copper matrix nanocomposites. Ceram. Int. 2017, 43, 3839–3846. [Google Scholar] [CrossRef]
- Fintová, S.; Kuběna, I.; Trško, L.; Horník, V.; Kunz, L. Fatigue behavior of AW7075 aluminum alloy in ultra-high cycle fatigue region. Mater. Sci. Eng. A 2020, 774, 138922. [Google Scholar] [CrossRef]
- Wang, C.; Luo, K.; Bu, X.; Su, Y.; Cai, J.; Zhang, Q.; Lu, J. Laser shock peening-induced surface gradient stress distribution and extension mechanism in corrosion fatigue life of AISI 420 stainless steel. Corros. Sci. 2020, 177, 109027. [Google Scholar] [CrossRef]


| Element | C | Si | Mn | S | P | Cr | Ni | Cu | V |
|---|---|---|---|---|---|---|---|---|---|
| wt.% | 0.496 | 0.252 | 0.98 | 0.0095 | 0.0056 | 1.12 | 0.03 | 0.06 | 0.147 |
| Tensile Strength σb/MPa | Yield Strength σs/MPa | Elongation δ/% | Section Shrinkage ψ/% |
|---|---|---|---|
| 1707 | 1547 | 9.95 | 41.57 |
| Parameters | U3.4-1 | U3.4-2 | U3.4-3 | U6.3 | U8.5 |
|---|---|---|---|---|---|
| Static pressure (N) | 398 | 862 | 663 | 663 | 862 |
| Spindle speed (r/min) | 180 | 180 | 180 | 180 | 280 |
| Feed speed (mm/r) | 0.1 | 0.1 | 0.1 | 0.1 | 0.1 |
| Repeated rolling times | 3 | 3 | 3 | 3 | 3 |
| Amplitude (μm) | 6 | 6 | 6 | 6 | 6 |
| Technologies Conditions | MGL (μm) | HGL (μm) | CRSL (μm) | The Distance between FCIP and the Surface (μm) |
|---|---|---|---|---|
| U3.4-1 | 10 | 75 | 120 | 346, 573, 1039, 1072, 1105, 1278, 1446 |
| U3.4-2 | 18 | 110 | 320 | 538, 546, 603, 798, 887, 943, 1012, 1132 |
| U3.4-3 | 37 | 155 | 650 | 466, 501, 676, 722, 973, 1172 |
| U8.5 | 30 | 160 | 670 | 671, 744, 764, 836, 857, 860, 949, 989, 1183, 1758 |
| U6.3 | 48 | 180 | 740 | 591, 634, 660, 745, 820, 851, 1230, 1359, 1636, 2247, 2300 |
| Specimen Condition | Striations (μm) | da/dN (μm/Cycle) | ΔKfisheye, (MPa∙m1/2) | |
|---|---|---|---|---|
| A = 0.752–870 MPa | 4.3 ± 0.04 | 0.22 ± 0.02 | 190.28 | 10.64 |
| A = 0.469–870 MPa | 9.0 ± 0.09 | 0.1 ± 0.01 | 155.09 | 9.60 |
Publisher’s Note: MDPI stays neutral with regard to jurisdictional claims in published maps and institutional affiliations. |
© 2021 by the authors. Licensee MDPI, Basel, Switzerland. This article is an open access article distributed under the terms and conditions of the Creative Commons Attribution (CC BY) license (https://creativecommons.org/licenses/by/4.0/).
Share and Cite
Xu, C.; Liang, Y.; Yang, M.; Yu, J.; Peng, X. Effects of the Ultrasonic Assisted Surface Rolling Process on the Fatigue Crack Initiation Position Distribution and Fatigue Life of 51CrV4 Spring Steel. Materials 2021, 14, 2565. https://doi.org/10.3390/ma14102565
Xu C, Liang Y, Yang M, Yu J, Peng X. Effects of the Ultrasonic Assisted Surface Rolling Process on the Fatigue Crack Initiation Position Distribution and Fatigue Life of 51CrV4 Spring Steel. Materials. 2021; 14(10):2565. https://doi.org/10.3390/ma14102565
Chicago/Turabian StyleXu, Changxing, Yilong Liang, Ming Yang, Jiabang Yu, and Xiang Peng. 2021. "Effects of the Ultrasonic Assisted Surface Rolling Process on the Fatigue Crack Initiation Position Distribution and Fatigue Life of 51CrV4 Spring Steel" Materials 14, no. 10: 2565. https://doi.org/10.3390/ma14102565