
Influence of Scanning-Aid Materials on the Accuracy and Time Efficiency of Intraoral Scanners for Full-Arch Digital Scanning: An In Vitro Study

 , , ,
, , ,
Abstract
:1. Introduction
2. Materials and Methods
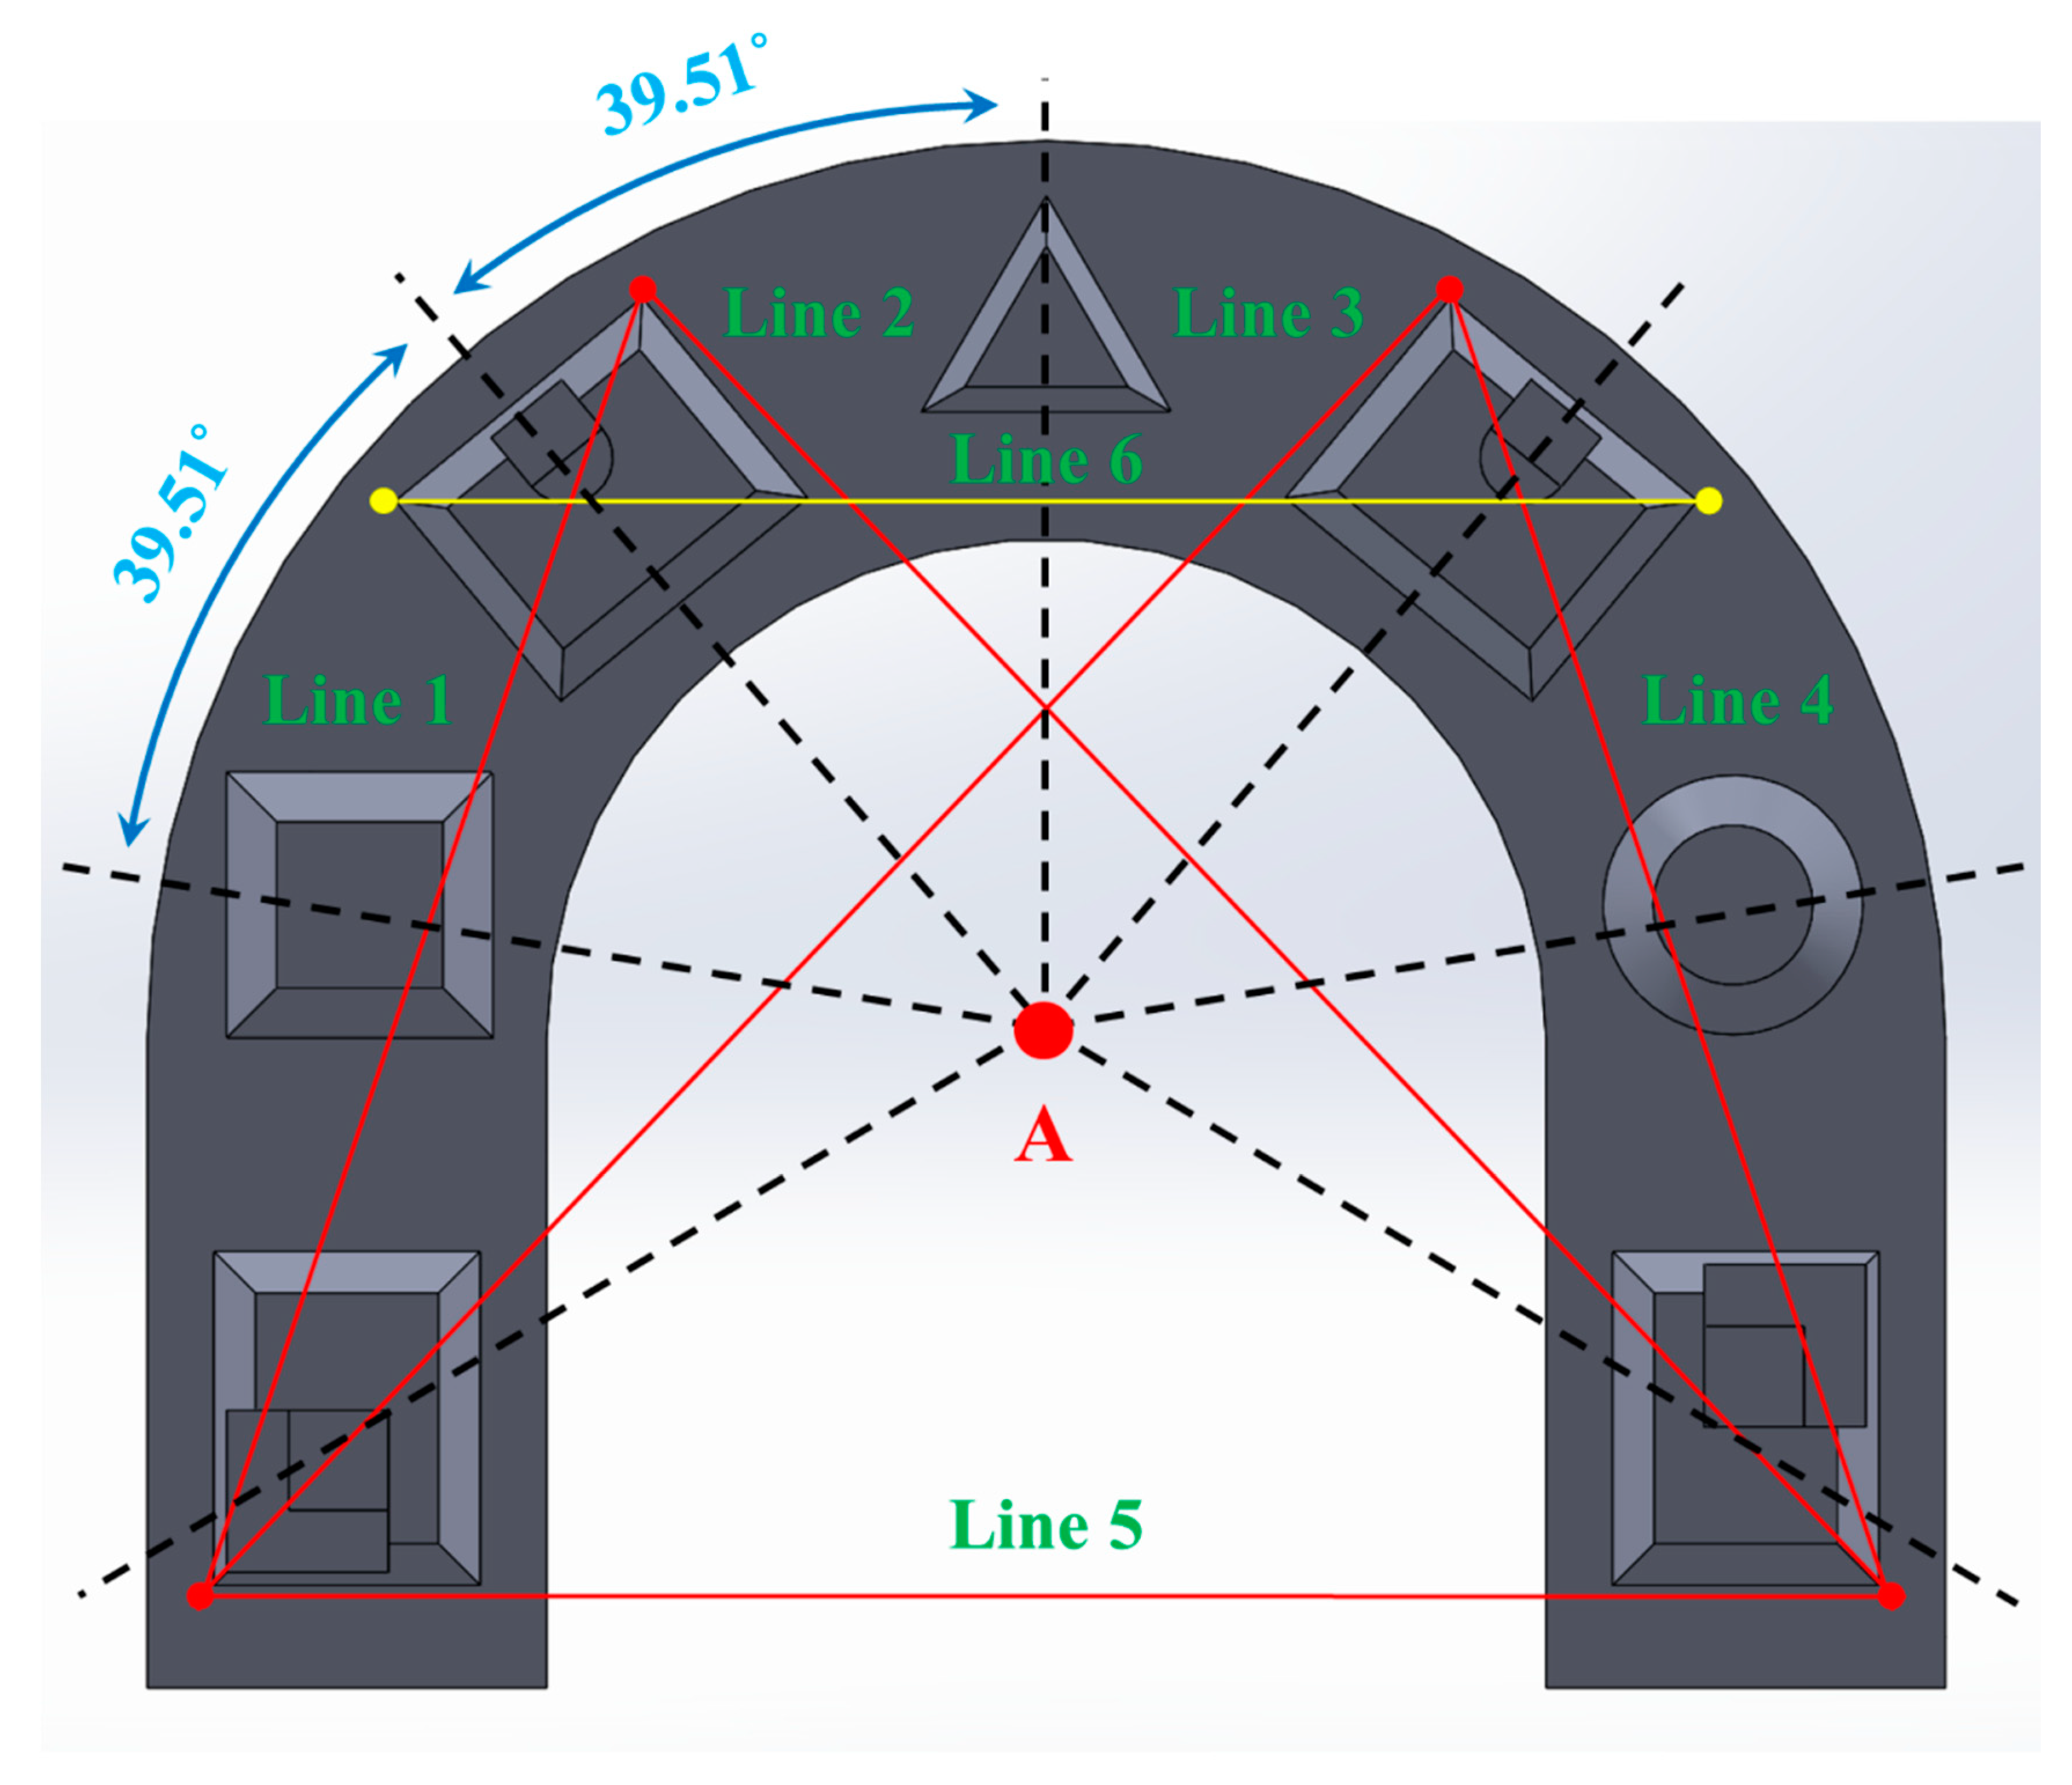
2.1. Reference Model
2.2. Digital Impressions
2.3. Scanning-Aid Materials
2.4. Three-Dimensional Measurements
2.5. Two-Dimensional Measurements
2.6. Scanning Time Measurements
2.7. Statistical Analysis
3. Results
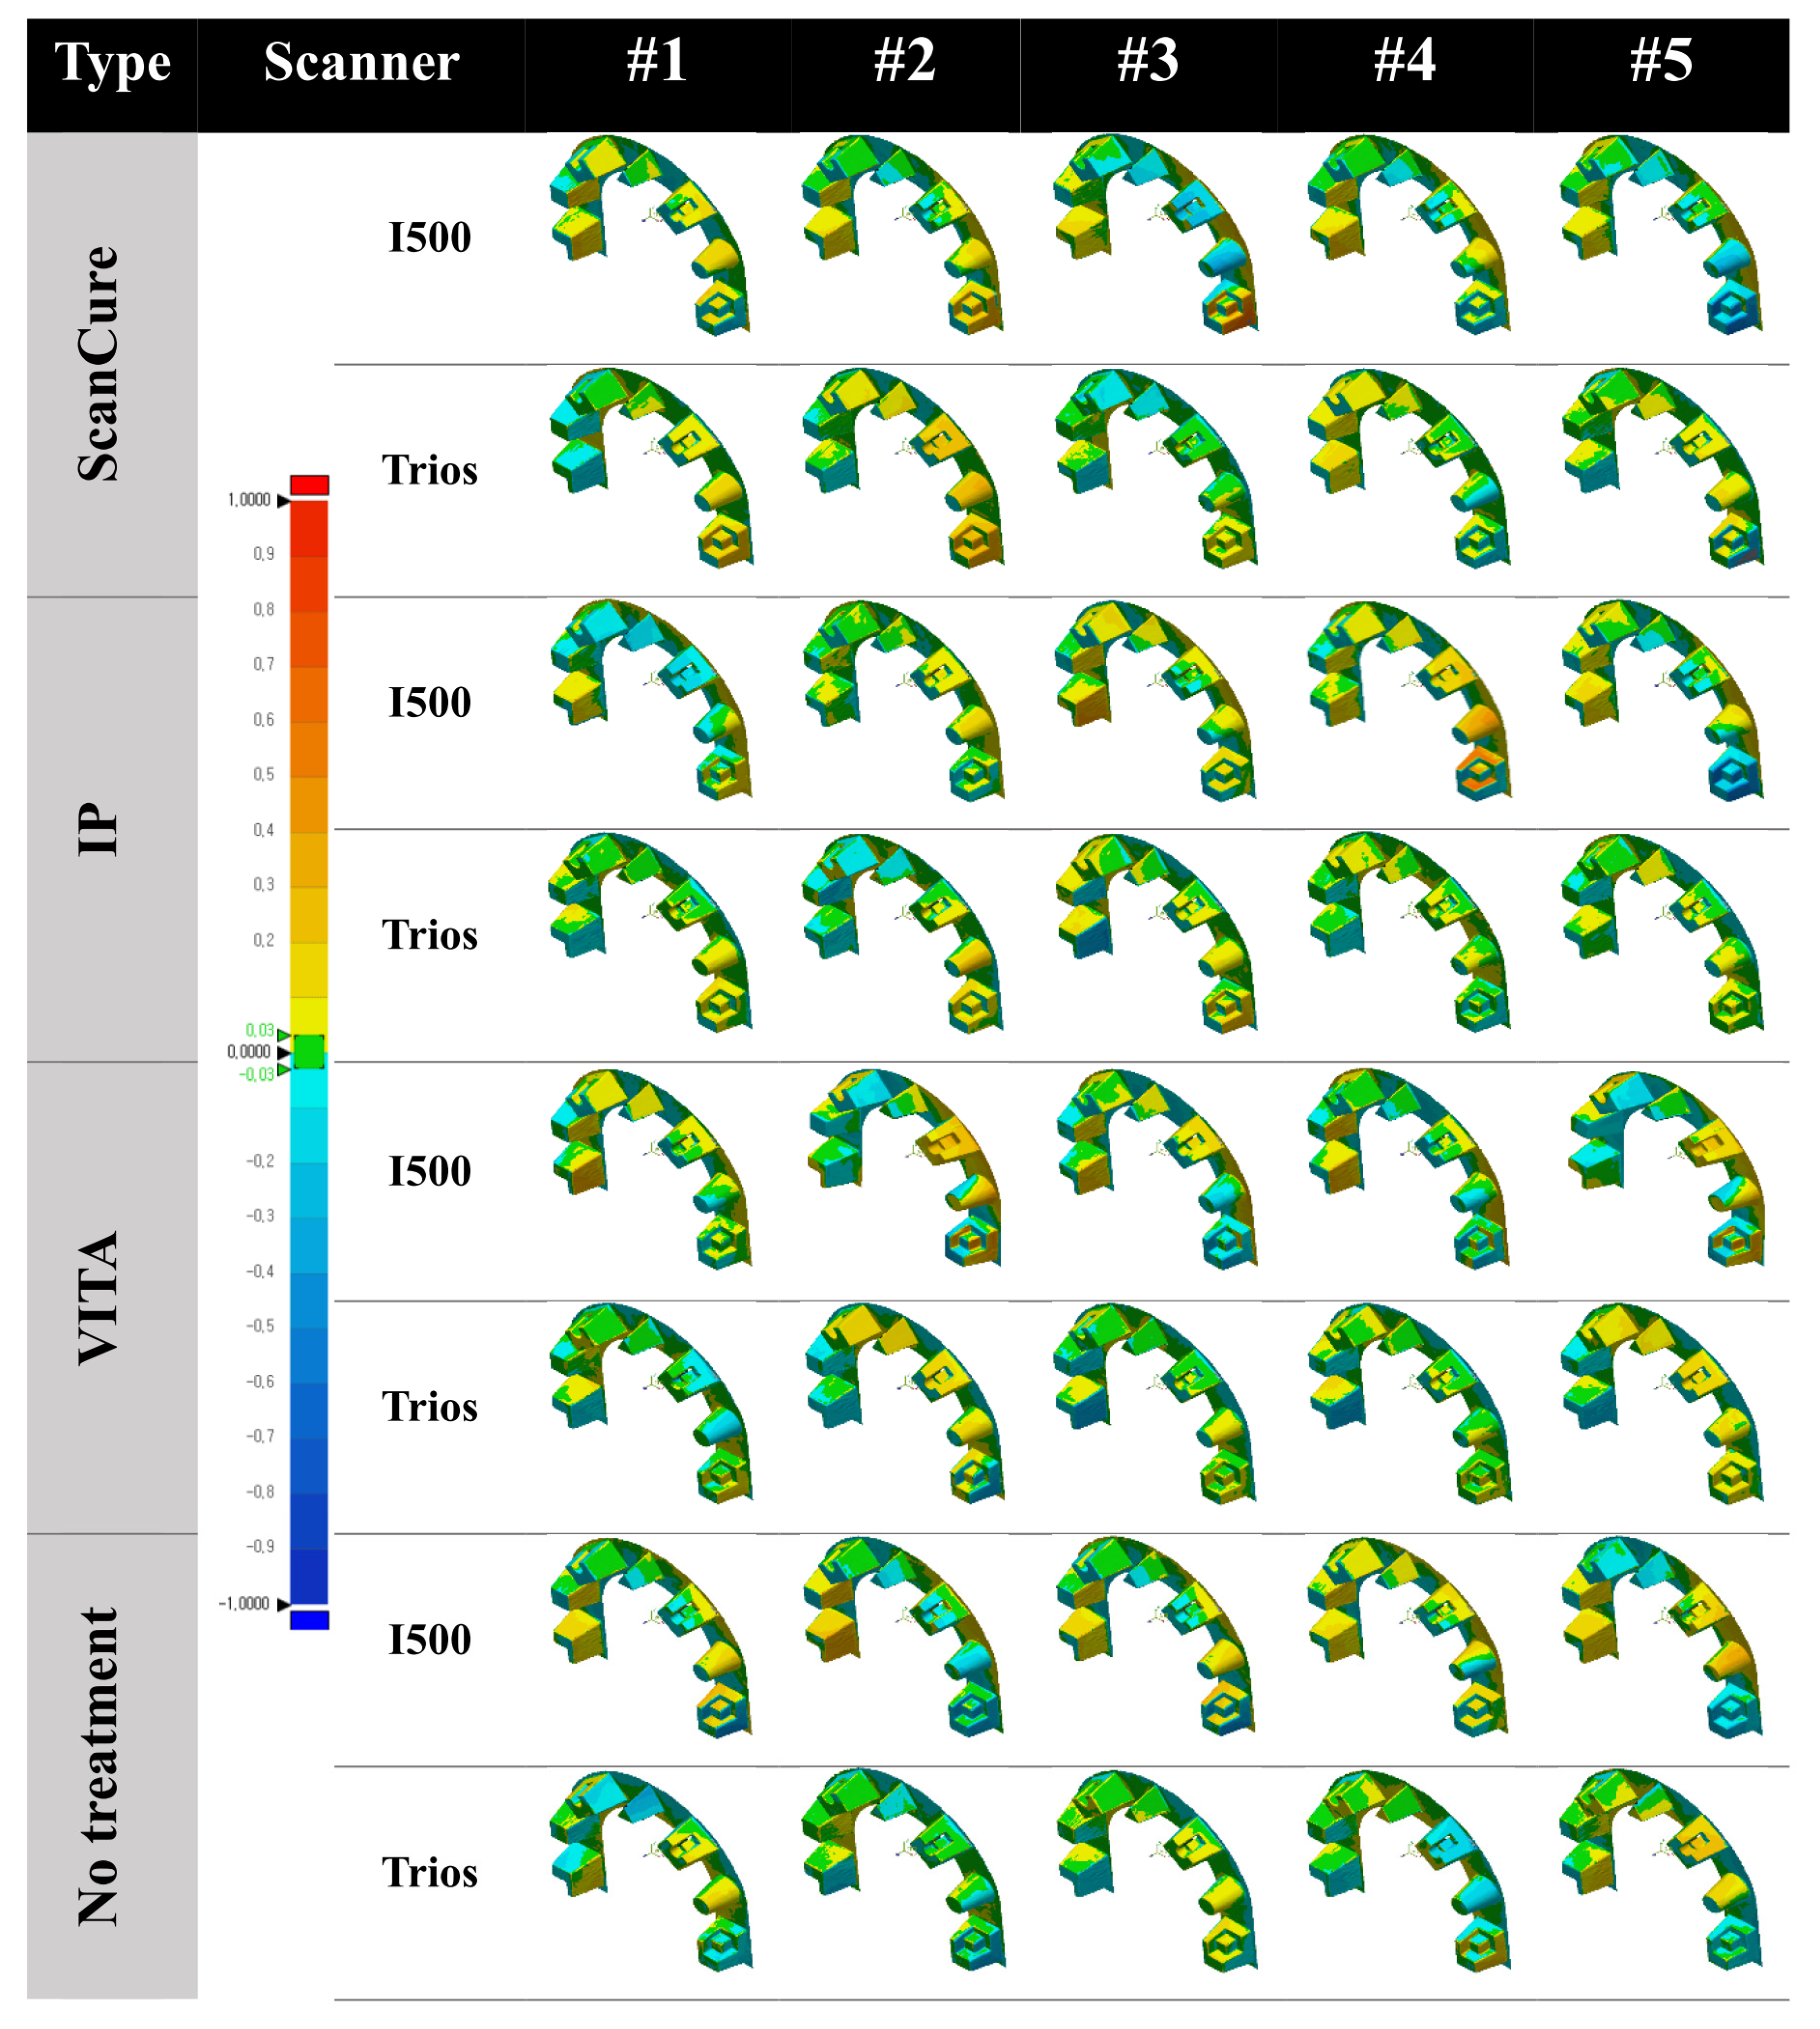
3.1. Three-Dimensional Analysis
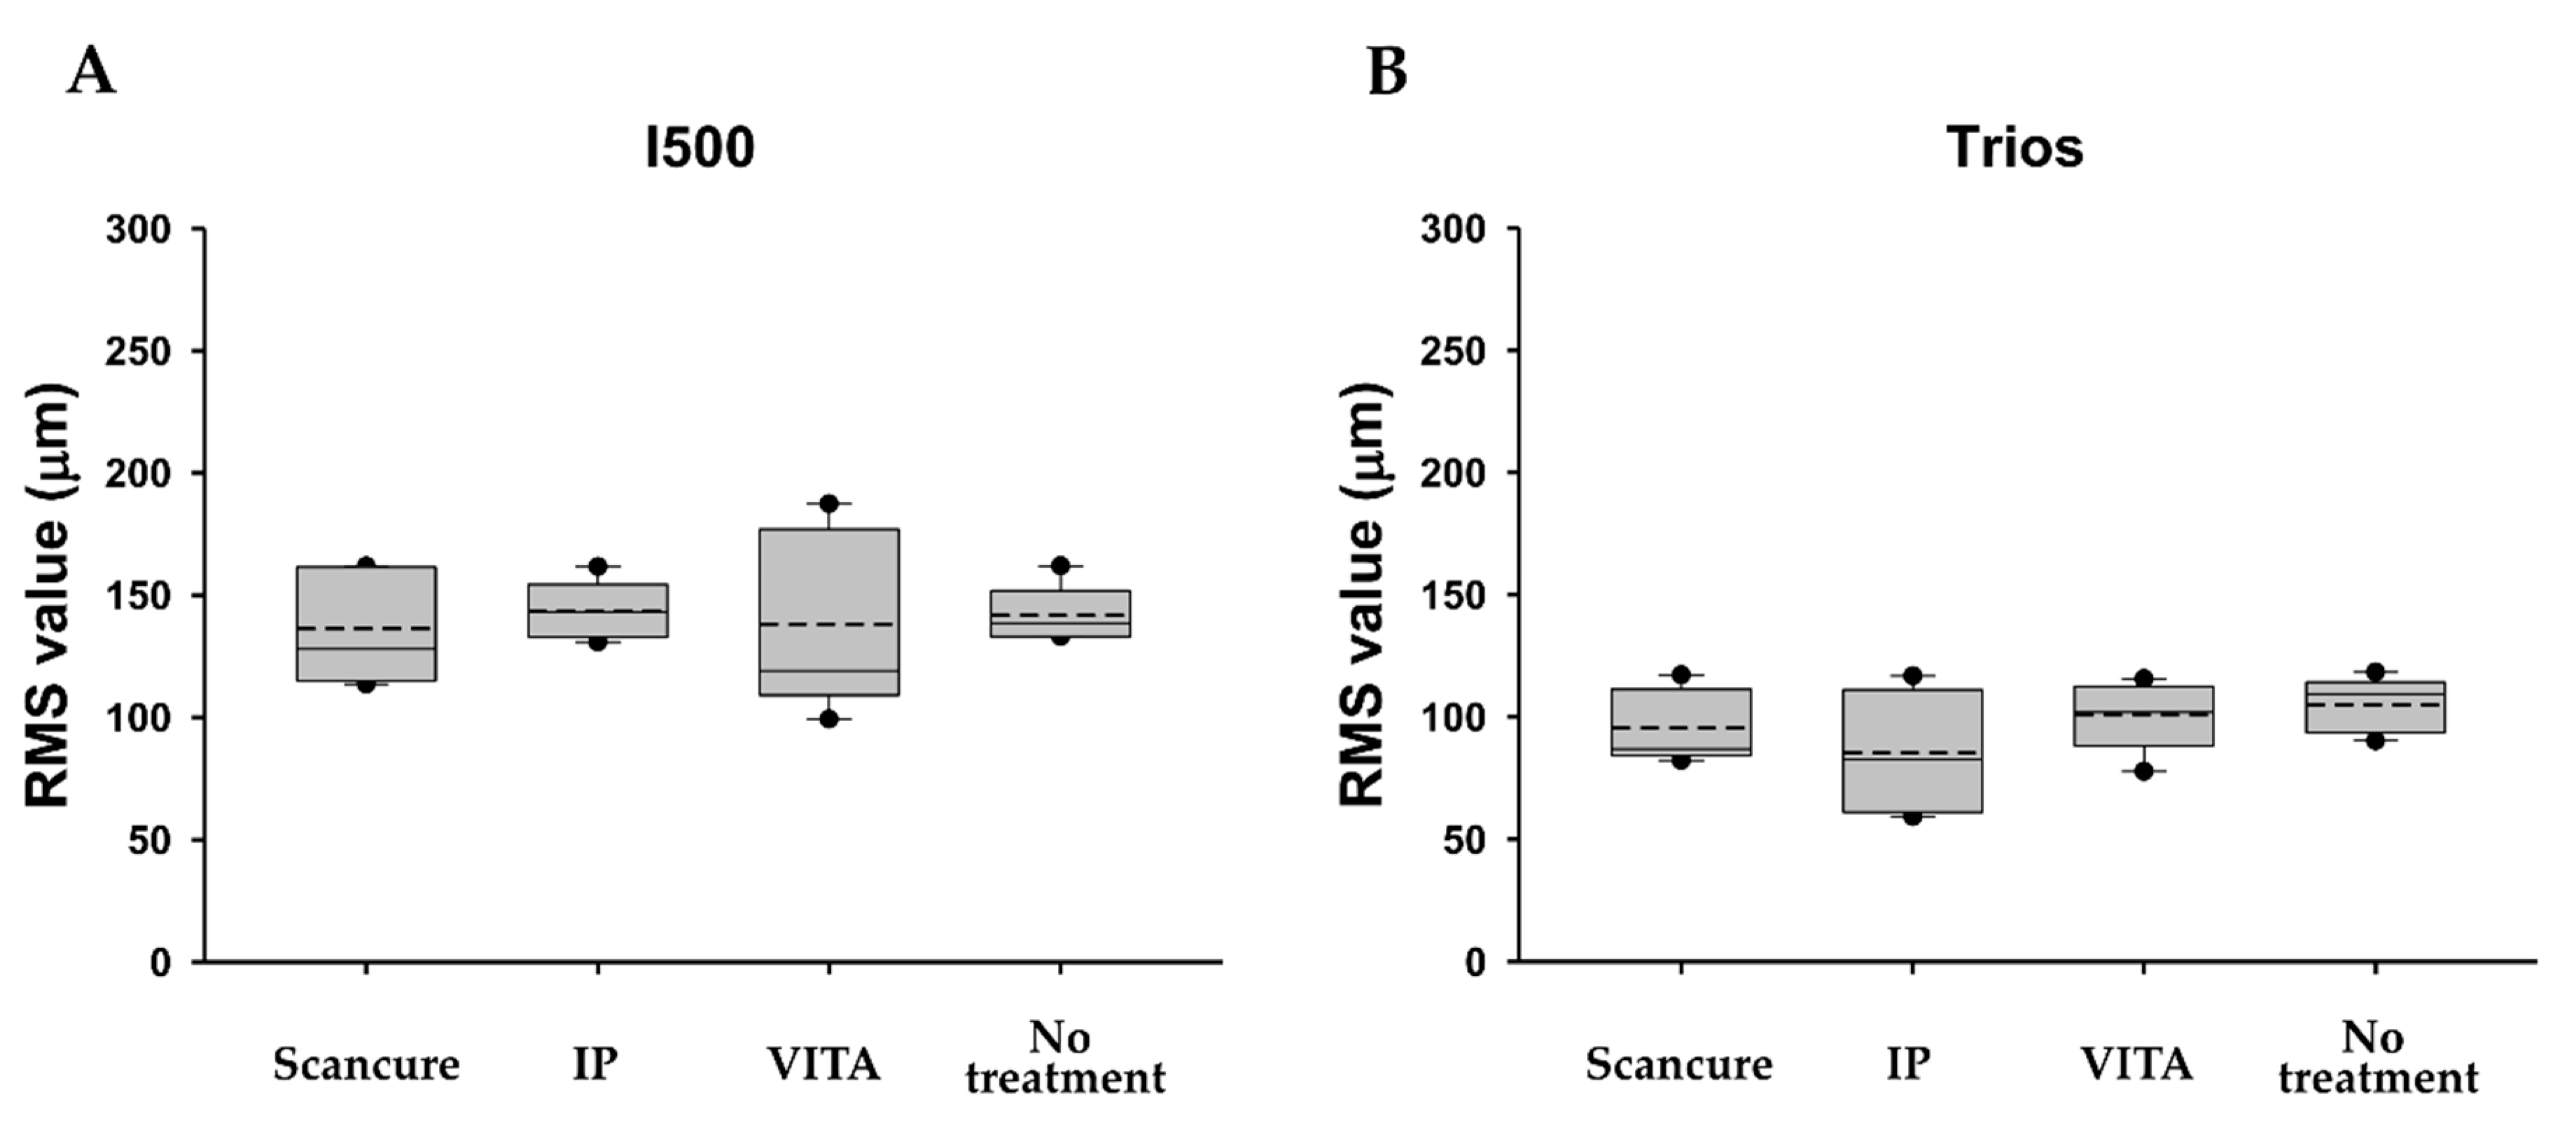
3.1.1. Trueness
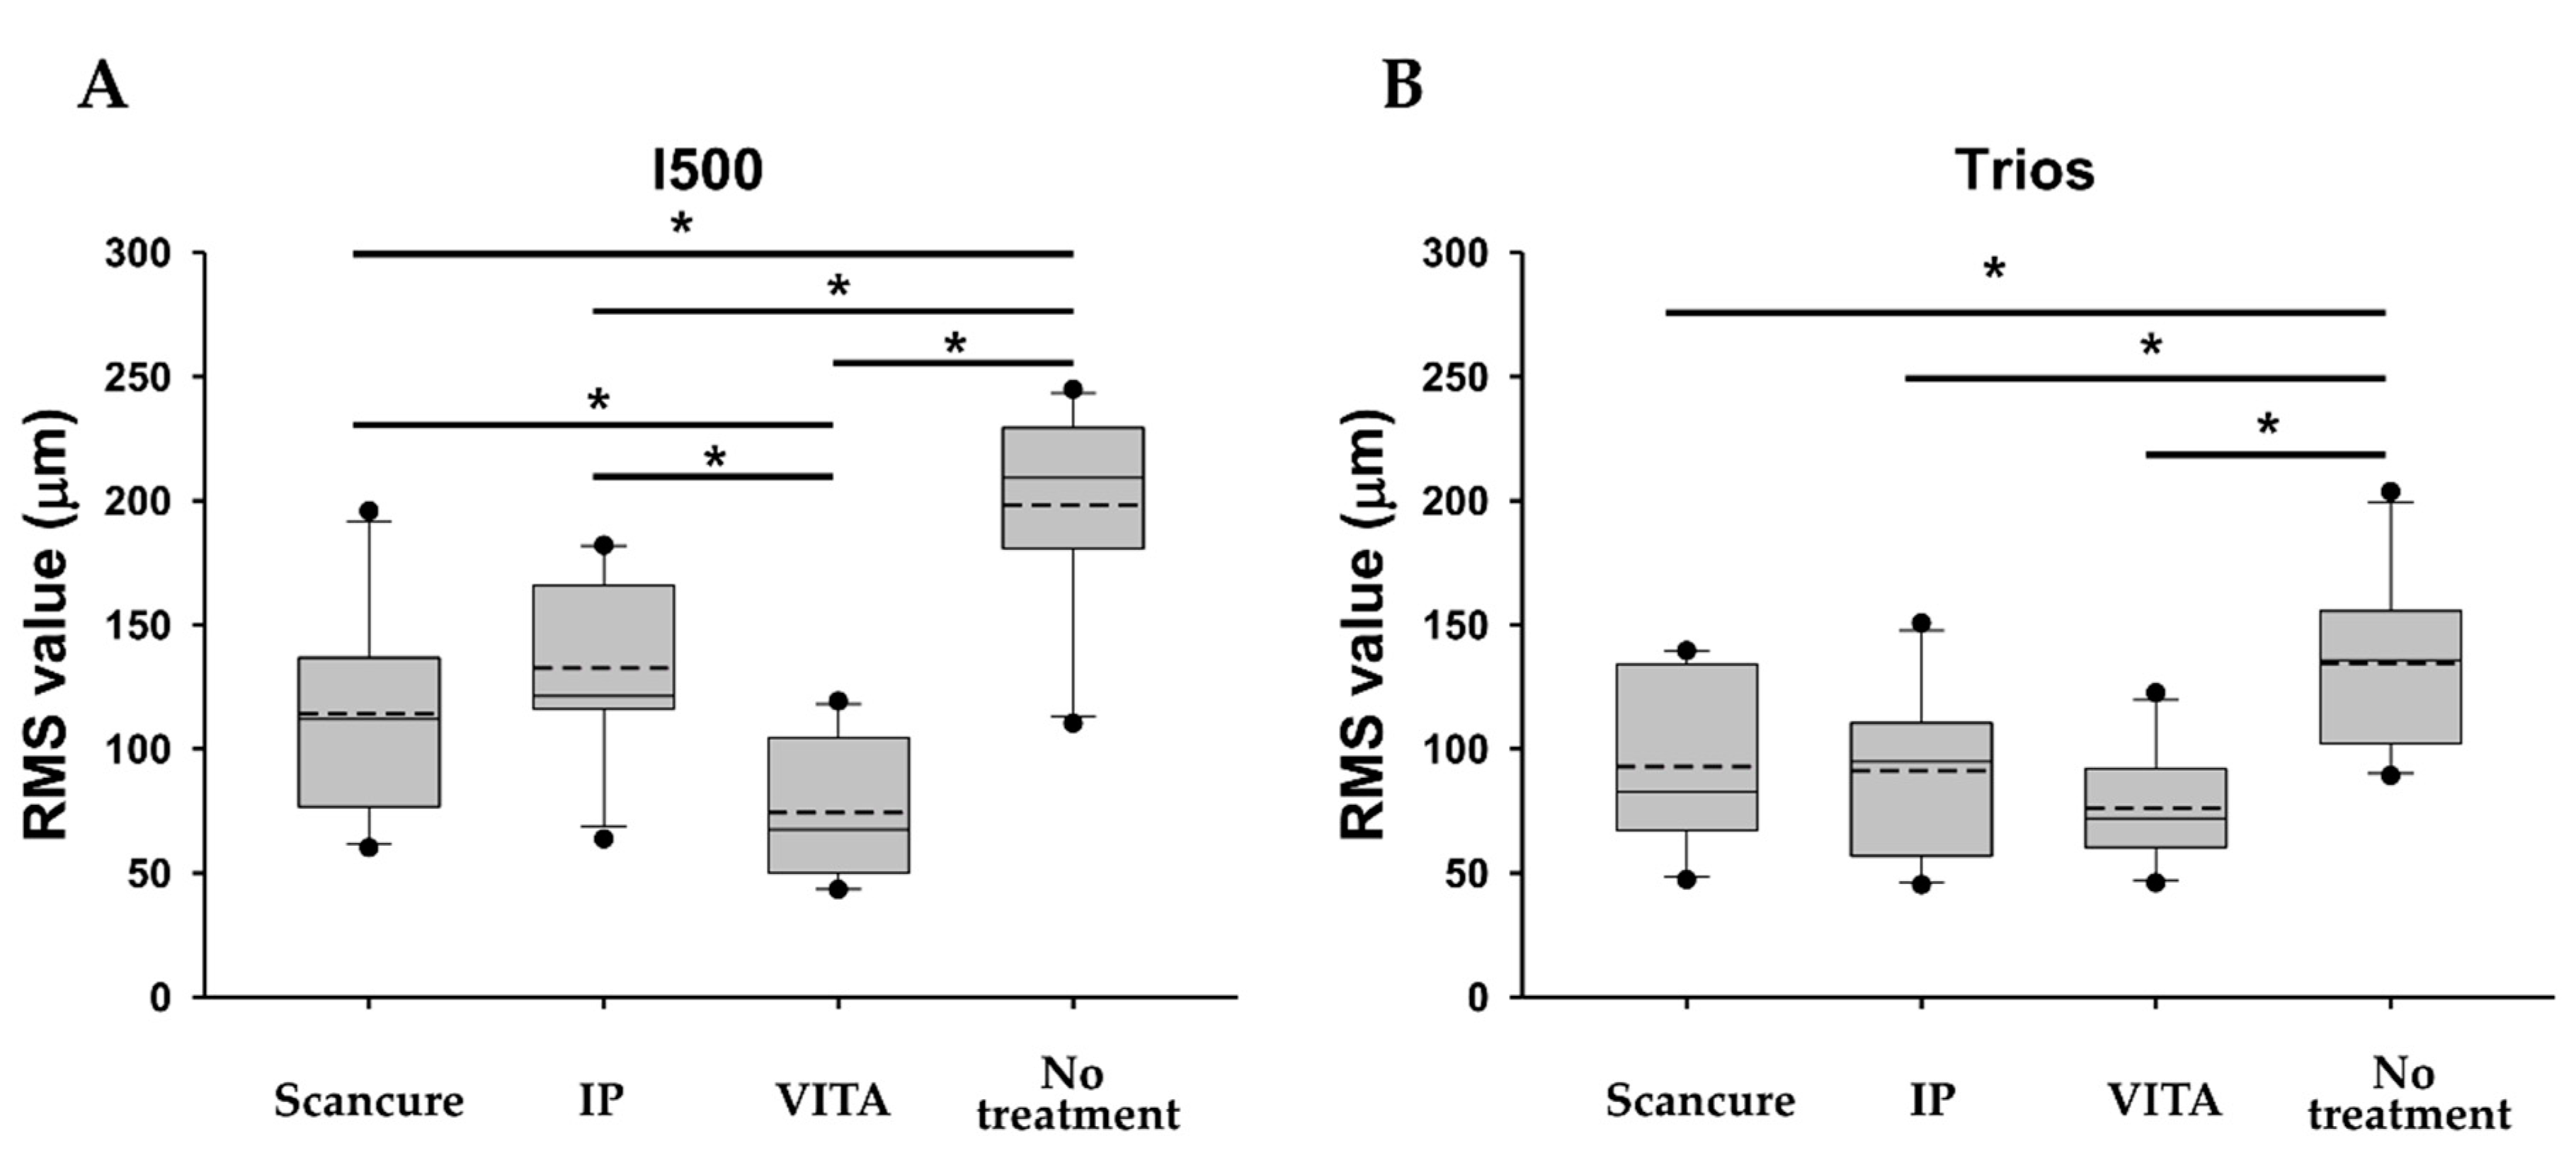
3.1.2. Precision
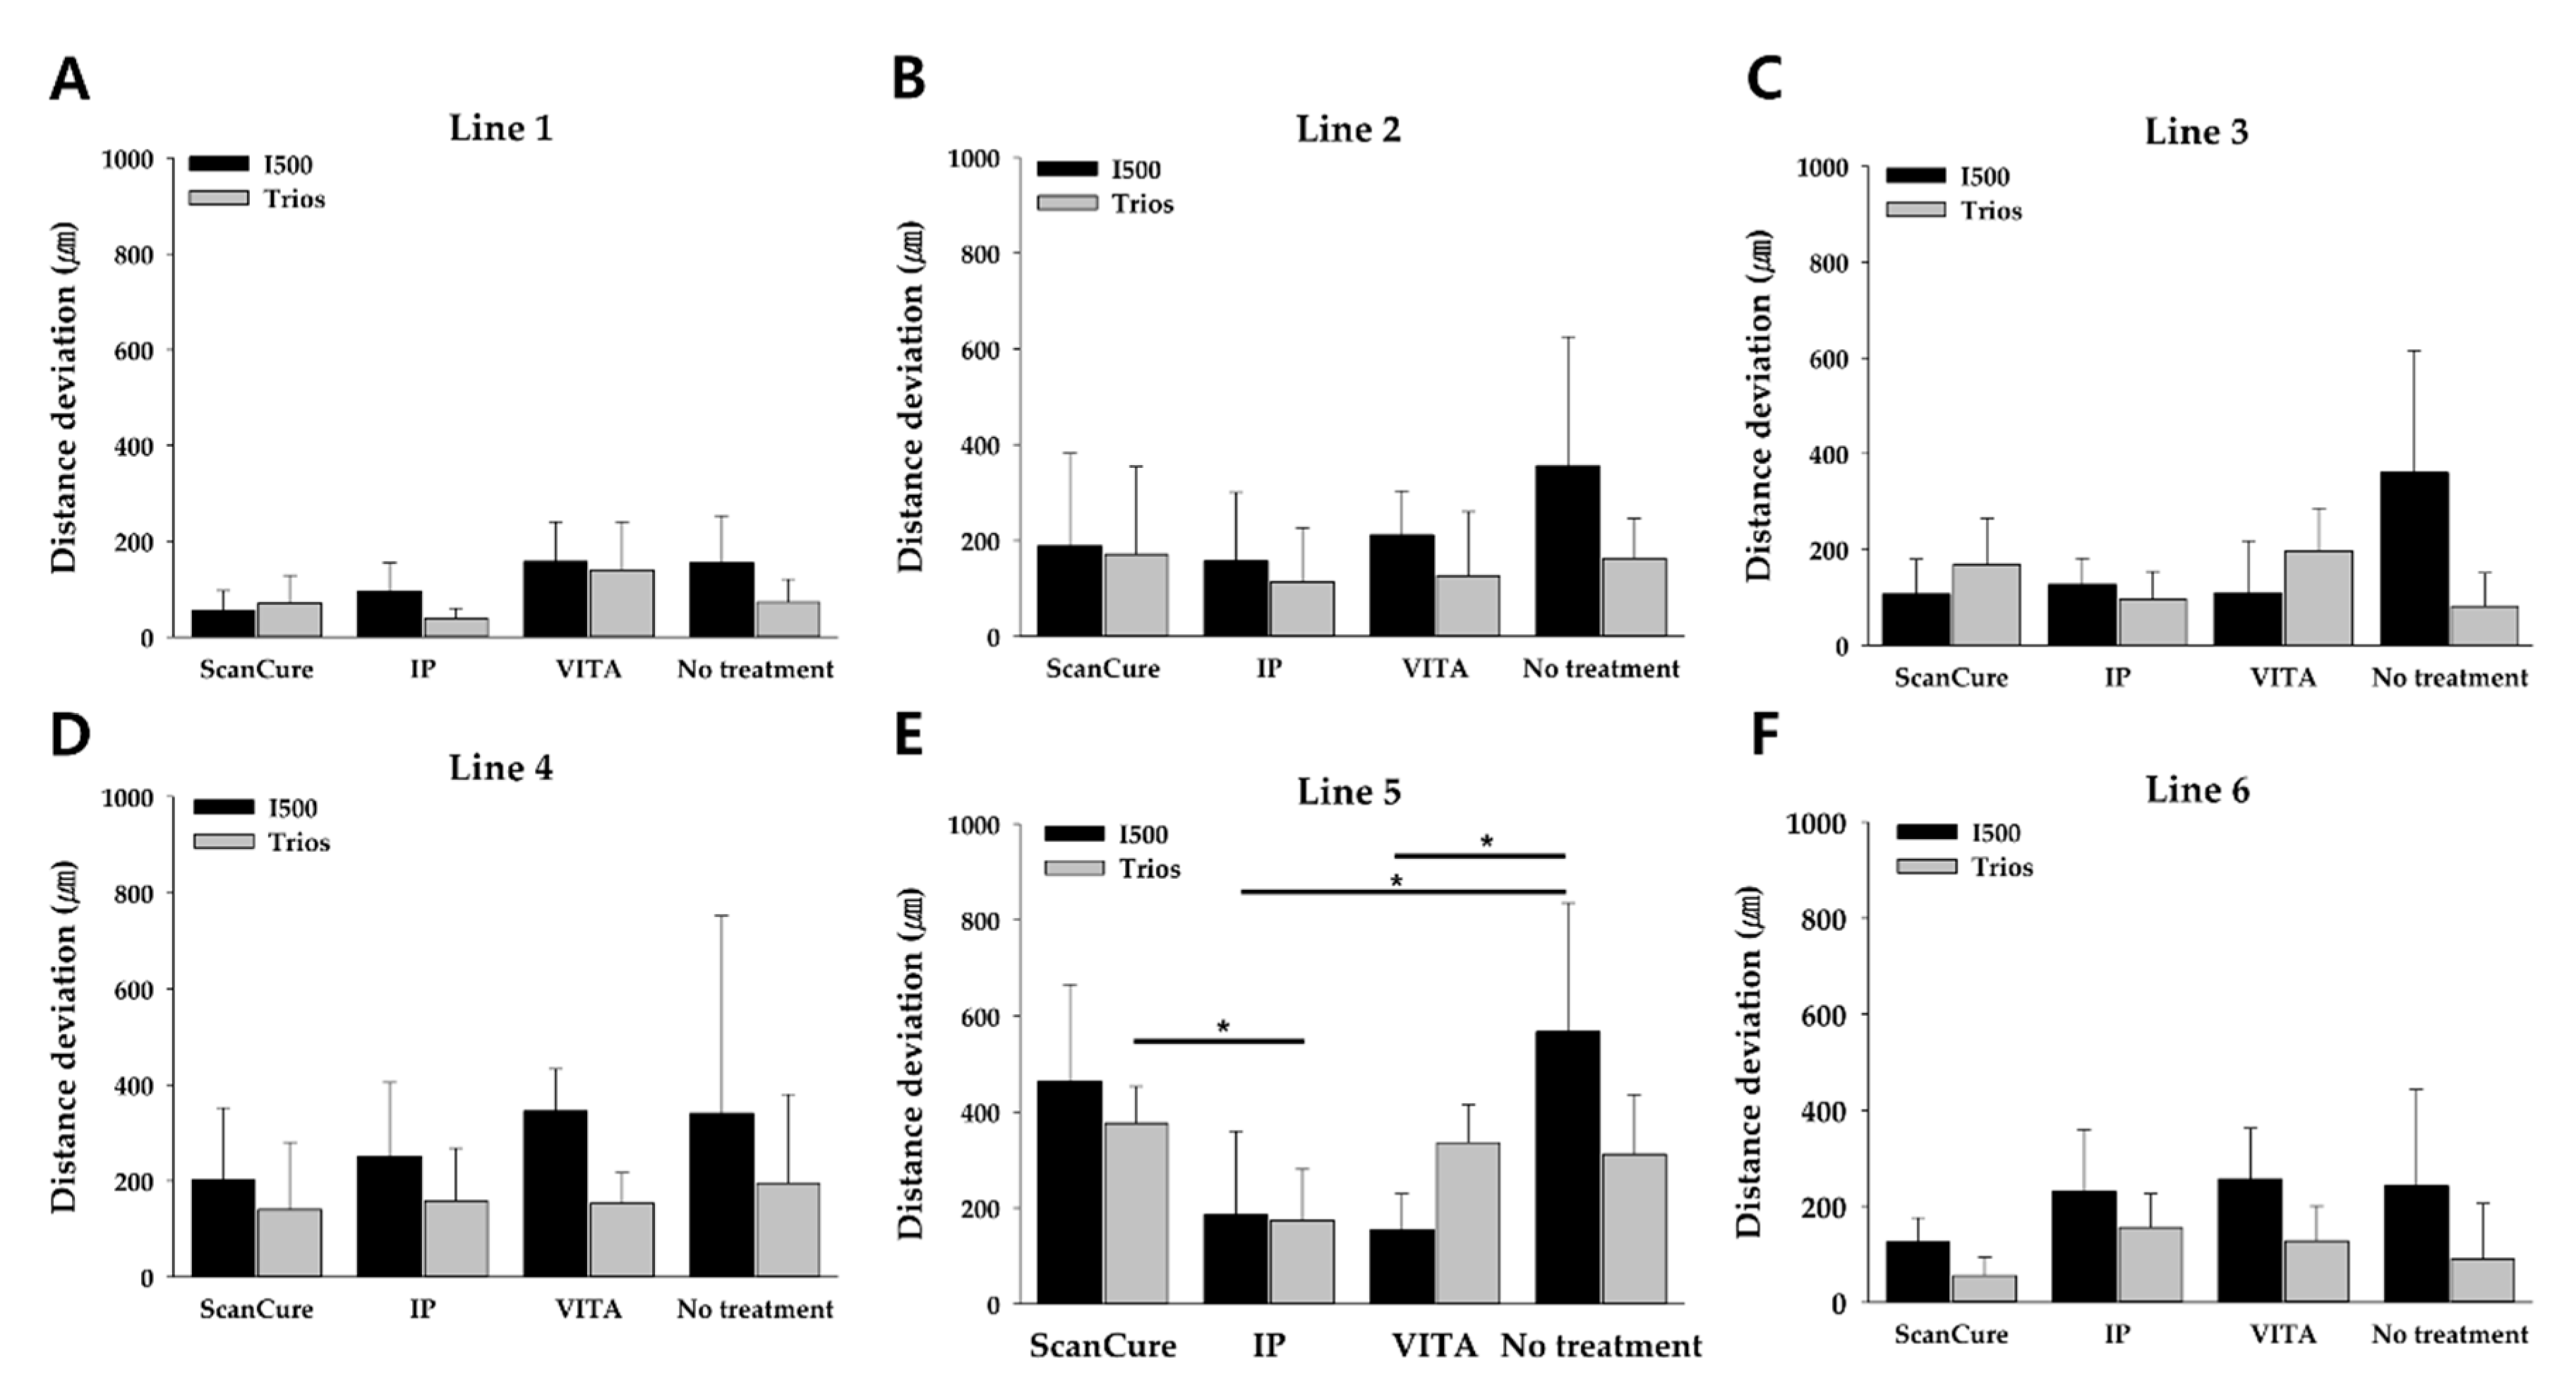
3.2. Two-Dimensional Analysis
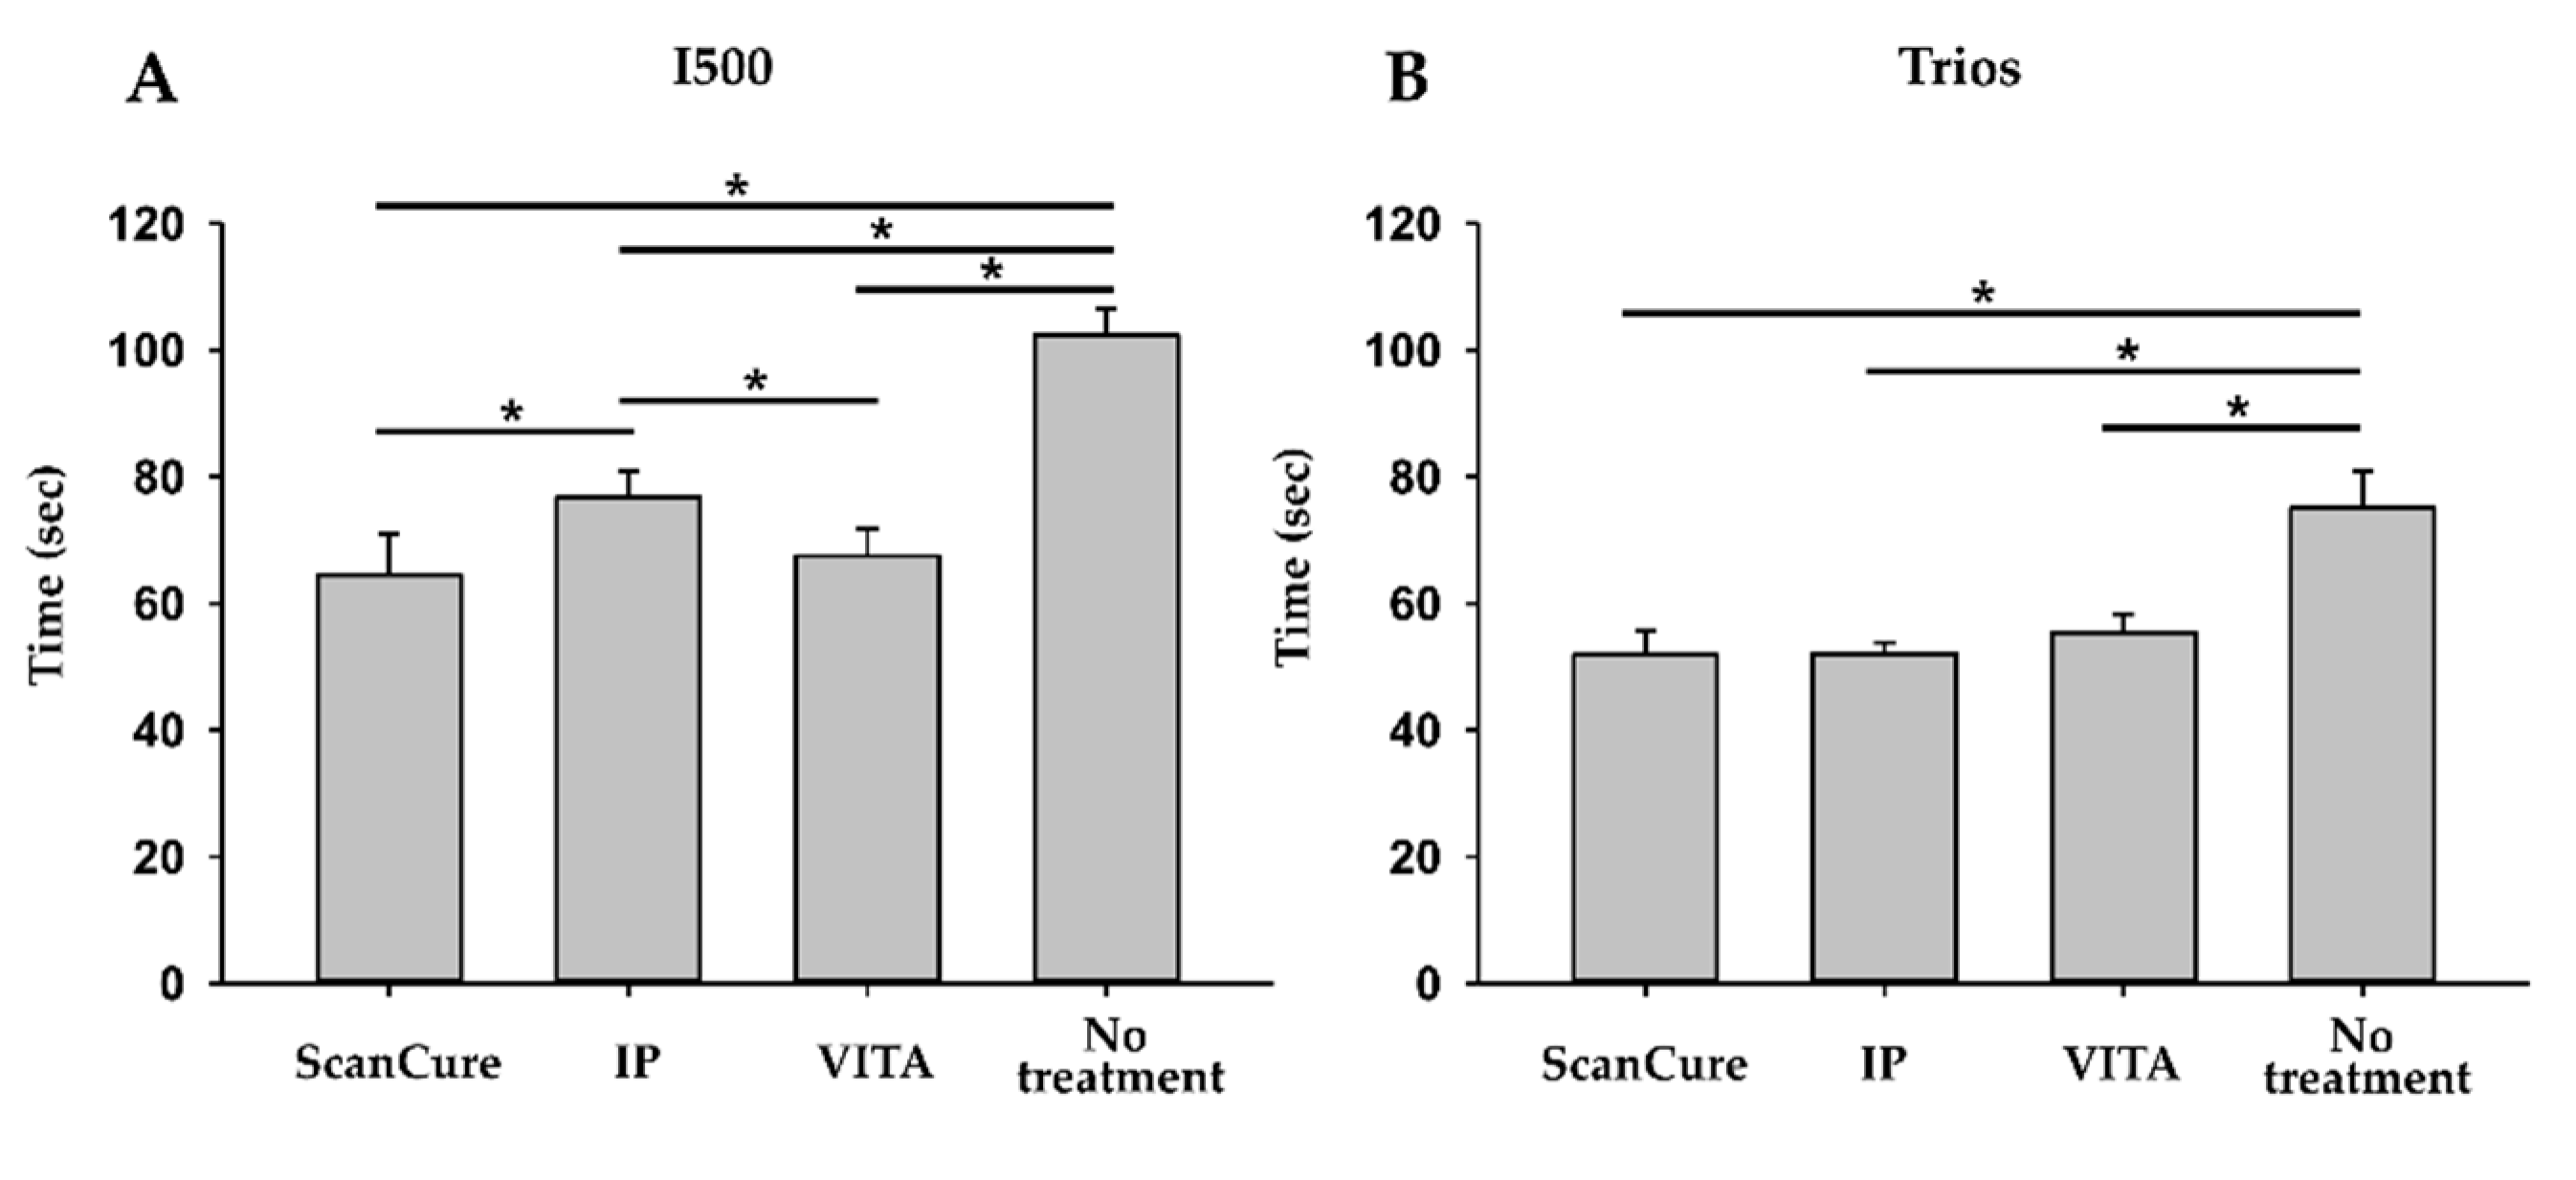
3.3. Scanning Time Analysis
4. Discussion
5. Conclusions
- In the 3D analysis, the RMS values (precision, n = 10) of the scanning-aid material-applied groups were significantly lower than those of the no-treatment group. The application of scanning-aid materials might affect the precision of scanned data rather than trueness.
- In the 2D analysis, the longest scan distance, line 5, showed the largest distance deviation, which meant that the scanned data were less accurate as the scan distance was longer, as in the full-arch case.
- When the scanning-aid agents were applied in the full-arch model, the scanning time was shortened compared with the no-treatment group, with a statistically significant difference.
- Consequently, in real clinical environments with limitations such as intraoral saliva, tongue, etc., the application of scanning-aid materials can reduce working time and more efficiently obtain the full-arch scanned image.
Author Contributions
Funding
Institutional Review Board Statement
Informed Consent Statement
Data Availability Statement
Conflicts of Interest
References
- Ender, A.; Zimmermann, M.; Attin, T.; Mehl, A. In vivo precision of conventional and digital methods for obtaining quadrant dental impressions. Clin. Oral Investig. 2016, 20, 1495–1504. [Google Scholar] [CrossRef] [PubMed] [Green Version]
- Chochlidakis, K.M.; Papaspyridakos, P.; Geminiani, A.; Chen, C.-J.; Feng, I.J.; Ercoli, C. Digital versus conventional impressions for fixed prosthodontics: A systematic review and meta-analysis. J. Prosthet. Dent. 2016, 116, 184–190. [Google Scholar] [CrossRef] [PubMed]
- Schmidt, A.; Klussmann, L.; Wöstmann, B.; Schlenz, M.A. Accuracy of Digital and Conventional Full-Arch Impressions in Patients: An Update. J. Clin. Med. 2020, 9, 688. [Google Scholar] [CrossRef] [Green Version]
- Passos, L.; Meiga, S.; Brigagão, V.; Street, A. Impact of different scanning strategies on the accuracy of two current intraoral scanning systems in complete-arch impressions: An in vitro study. Int. J. Comput. Dent. 2019, 22, 307–319. [Google Scholar] [PubMed]
- Sfondrini, M.F.; Gandini, P.; Malfatto, M.; Di Corato, F.; Trovati, F.; Scribante, A. Computerized casts for orthodontic purpose using powder-free intraoral scanners: Accuracy, execution time, and patient feedback. BioMed Res. Int. 2018. [Google Scholar] [CrossRef] [Green Version]
- Jemt, T.; Hjalmarsson, L. In vitro measurements of precision of fit of implant-supported frameworks. A comparison between “virtual” and “physical” assessments of fit using two different techniques of measurements. Clin. Implant Dent. Relat. Res. 2012, 14, 175–182. [Google Scholar] [CrossRef] [PubMed]
- Grünheid, T.; McCarthy, S.D.; Larson, B.E. Clinical use of a direct chairside oral scanner: An assessment of accuracy, time, and patient acceptance. Am. J. Orthod. Dentofac. Orthop. 2014, 146, 673–682. [Google Scholar] [CrossRef]
- Keul, C.; Güth, J.F. Accuracy of full-arch digital impressions: An in vitro and in vivo comparison. Clin. Oral Investig. 2020, 24, 735–745. [Google Scholar] [CrossRef]
- Chochlidakis, K.; Papaspyridakos, P.; Tsigarida, A.; Romeo, D.; Chen, Y.W.; Natto, Z.; Ercoli, C. Digital Versus Conventional Full-Arch Implant Impressions: A Prospective Study on 16 Edentulous Maxillae. J. Prosthodont. 2020, 29, 281–286. [Google Scholar] [CrossRef]
- Yuzbasioglu, E.; Kurt, H.; Turunc, R.; Bilir, H. Comparison of digital and conventional impression techniques: Evaluation of patients’ perception, treatment comfort, effectiveness and clinical outcomes. BMC Oral Health 2014, 14, 10. [Google Scholar] [CrossRef] [Green Version]
- Amin, S.; Weber, H.P.; Finkelman, M.; El Rafie, K.; Kudara, Y.; Papaspyridakos, P. Digital vs. conventional full-arch implant impressions: A comparative study. Clin. Oral Implant. Res. 2017, 28, 1360–1367. [Google Scholar] [CrossRef]
- Ender, A.; Mehl, A. In-vitro evaluation of the accuracy of conventional and digital methods of obtaining full-arch dental impressions. Quintessence Int. 2015, 46, 9–17. [Google Scholar] [CrossRef] [PubMed]
- Jeong, I.D.; Lee, J.J.; Jeon, J.H.; Kim, J.H.; Kim, H.Y.; Kim, W.C. Accuracy of complete-arch model using an intraoral video scanner: An in vitro study. J. Prosthet. Dent. 2016, 115, 755–759. [Google Scholar] [CrossRef] [PubMed]
- Andriessen, F.S.; Rijkens, D.R.; Van Der Meer, W.J.; Wismeijer, D.W. Applicability and accuracy of an intraoral scanner for scanning multiple implants in edentulous mandibles: A pilot study. J. Prosthet. Dent. 2014, 111, 186–194. [Google Scholar] [CrossRef] [PubMed]
- Ender, A.; Mehl, A. Accuracy of complete-arch dental impressions: A new method of measuring trueness and precision. J. Prosthet. Dent. 2013, 109, 121–128. [Google Scholar] [CrossRef] [Green Version]
- Burde, A.V.; Dudea, D.; Cuc, S.; Moldovan, M.; Campian, R.S. Three-dimensional Evaluations of the Coating Thickness of Two Optical Conditioning Scanning Sprays. Mater. Plast. 2016, 53, 65–67. [Google Scholar]
- Dehurtevent, M.; Robberecht, L.; Béhin, P. Influence of dentist experience with scan spray systems used in direct CAD/CAM impressions. J. Prosthet. Dent. 2015, 113, 17–21. [Google Scholar] [CrossRef]
- Rupf, S.; Berger, H.; Buchter, A.; Harth, V.; Ong, M.F.; Hannig, M. Exposure of patient and dental staff to fine and ultrafine particles from scanning spray. Clin. Oral Investig. 2015, 19, 823–830. [Google Scholar] [CrossRef]
- Oh, H.S.; Lim, Y.J.; Kim, B.; Kim, W.H.; Kim, M.J.; Kwon, H.B. Influence of Applied Liquid-Type Scanning-Aid Material on the Accuracy of the Scanned Image: An In Vitro Experiment. Materials 2020, 13, 2034. [Google Scholar] [CrossRef]
- Kim, J.H.; Kim, K.B.; Kim, S.H.; Kim, W.C.; Kim, H.Y.; Kim, J.H. Quantitative evaluation of common errors in digital impression obtained by using an LED blue light in-office CAD/CAM system. Quintessence Int. 2015, 46, 401–407. [Google Scholar] [CrossRef] [PubMed]
- Li, H.; Lyu, P.; Wang, Y.; Sun, Y. Influence of object translucency on the scanning accuracy of a powder-free intraoral scanner: A laboratory study. J. Prosthet. Dent. 2017, 117, 93–101. [Google Scholar] [CrossRef]
- Treesh, J.C.; Liacouras, P.C.; Taft, R.M.; Brooks, D.I.; Raiciulescu, S.; Ellert, D.O.; Grant, G.T.; Ye, L. Complete-arch accuracy of intraoral scanners. J. Prosthet. Dent. 2018, 120, 382–388. [Google Scholar] [CrossRef] [PubMed]
- Gimenez-Gonzalez, B.; Hassan, B.; Özcan, M.; Pradíes, G. An In Vitro Study of Factors Influencing the Performance of Digital Intraoral Impressions Operating on Active Wavefront Sampling Technology with Multiple Implants in the Edentulous Maxilla. J. Prosthodont. 2017, 26, 650–655. [Google Scholar] [CrossRef] [PubMed]
- Latham, J.; Ludlow, M.; Mennito, A.; Kelly, A.; Evans, Z.; Renne, W. Effect of scan pattern on complete-arch scans with 4 digital scanners. J. Prosthet. Dent. 2020, 123, 85–95. [Google Scholar] [CrossRef] [PubMed] [Green Version]
- Resende, C.C.D.; Barbosa, T.A.Q.; Moura, G.F.; do Nascimento Tavares, L.; Rizzante, F.A.P.; George, F.M.; Neves, F.F.D.; Mendonça, G. Influence of operator experience, scanner type, and scan size on 3D scans. J. Prosthet. Dent. 2021, 125, 294–299. [Google Scholar] [CrossRef]
- Kurbad, A. The optical conditioning of Cerec preparations with scan spray. Int. J. Comput. Dent. 2000, 3, 269–279. [Google Scholar] [PubMed]


| Trueness | ScanCure (µm) | IP (µm) | VITA (µm) | No Treatment (µm) |
|---|---|---|---|---|
| I500 | 136.18 ± 23.69 | 143.48 ± 11.99 | 138.18 ± 36.98 | 141.70 ± 11.89 |
| Trios | 95.68 ± 15.03 | 85.44 ± 25.38 | 100.78 ± 14.43 | 105.02 ± 11.25 |
| Precision | ScanCure (µm) | IP (µm) | VITA (µm) | No Treatment (µm) |
|---|---|---|---|---|
| I500 | 114 ± 40.8 | 133 ± 35.7 | 74.3 ± 27.9 | 198 ± 42.5 |
| Trios | 92.9 ± 34.2 | 91.3 ± 32.5 | 76.1 ± 22.4 | 134 ± 34.7 |
| Type | ScanCure | IP | VITA | No Treatment | ||
|---|---|---|---|---|---|---|
| Line 1 | I500 | Avg. | 55.16 | 95.40 | 157.58 | 154.88 |
| S.D. | 41.83 | 59.57 | 83.84 | 98.28 | ||
| Trios | Avg. | 70.66 | 38.84 | 139.56 | 72.54 | |
| S.D. | 57.94 | 21.05 | 100.97 | 48.36 | ||
| Line 2 | I500 | Avg. | 188.58 | 157.20 | 211.78 | 355.84 |
| S.D. | 193.26 | 142.96 | 91.67 | 269.72 | ||
| Trios | Avg. | 170.84 | 113.60 | 125.96 | 162.44 | |
| S.D. | 183.41 | 112.84 | 134.07 | 83.44 | ||
| Line 3 | I500 | Avg. | 107.06 | 126.94 | 109.98 | 360.26 |
| S.D. | 72.93 | 54.42 | 107.71 | 254.92 | ||
| Trios | Avg. | 169.28 | 96.18 | 197.40 | 81.08 | |
| S.D. | 96.01 | 57.43 | 88.87 | 69.84 | ||
| Line 4 | I500 | Avg. | 201.56 | 251.38 | 345.20 | 340.66 |
| S.D. | 150.86 | 154.03 | 88.44 | 411.30 | ||
| Trios | Avg. | 140.24 | 158.06 | 152.54 | 194.90 | |
| S.D. | 139.90 | 109.60 | 64.20 | 185.61 | ||
| Line 5 | I500 | Avg. | 463.60 | 186.08 | 154.74 | 567.10 |
| S.D. | 202.13 | 174.05 | 74.49 | 268.21 | ||
| Trios | Avg. | 376.74 | 174.34 | 336.56 | 312.26 | |
| S.D. | 76.91 | 106.81 | 79.00 | 124.06 | ||
| Line 6 | I500 | Avg. | 125.24 | 230.44 | 257.00 | 242.12 |
| S.D. | 50.77 | 129.20 | 105.14 | 200.91 | ||
| Trios | Avg. | 55.52 | 155.46 | 127.18 | 90.02 | |
| S.D. | 38.28 | 71.14 | 73.14 | 115.53 | ||
| Time | n | ScanCure (s) | IP (s) | VITA (s) | No Treatment (s) |
|---|---|---|---|---|---|
| I500 | 5 | 64.55 ± 5.75 | 76.75 ± 3.65 | 67.48 ± 3.81 | 102.37 ± 3.76 |
| Trios | 5 | 51.86 ± 3.40 | 52.39 ± 1.63 | 55.43 ± 2.60 | 75.03 ± 5.19 |
Publisher’s Note: MDPI stays neutral with regard to jurisdictional claims in published maps and institutional affiliations. |
© 2021 by the authors. Licensee MDPI, Basel, Switzerland. This article is an open access article distributed under the terms and conditions of the Creative Commons Attribution (CC BY) license (https://creativecommons.org/licenses/by/4.0/).
Share and Cite
Oh, H.-S.; Lim, Y.-J.; Kim, B.; Kim, M.-J.; Kwon, H.-B.; Baek, Y.-W. Influence of Scanning-Aid Materials on the Accuracy and Time Efficiency of Intraoral Scanners for Full-Arch Digital Scanning: An In Vitro Study. Materials 2021, 14, 2340. https://doi.org/10.3390/ma14092340
Oh H-S, Lim Y-J, Kim B, Kim M-J, Kwon H-B, Baek Y-W. Influence of Scanning-Aid Materials on the Accuracy and Time Efficiency of Intraoral Scanners for Full-Arch Digital Scanning: An In Vitro Study. Materials. 2021; 14(9):2340. https://doi.org/10.3390/ma14092340
Chicago/Turabian StyleOh, Hyun-Su, Young-Jun Lim, Bongju Kim, Myung-Joo Kim, Ho-Beom Kwon, and Yeon-Wha Baek. 2021. "Influence of Scanning-Aid Materials on the Accuracy and Time Efficiency of Intraoral Scanners for Full-Arch Digital Scanning: An In Vitro Study" Materials 14, no. 9: 2340. https://doi.org/10.3390/ma14092340