Improvement of DC Breakdown Strength of the Epoxy/POSS Nanocomposite by Tailoring Interfacial Electron Trap Characteristics

 ,
,
Abstract
:
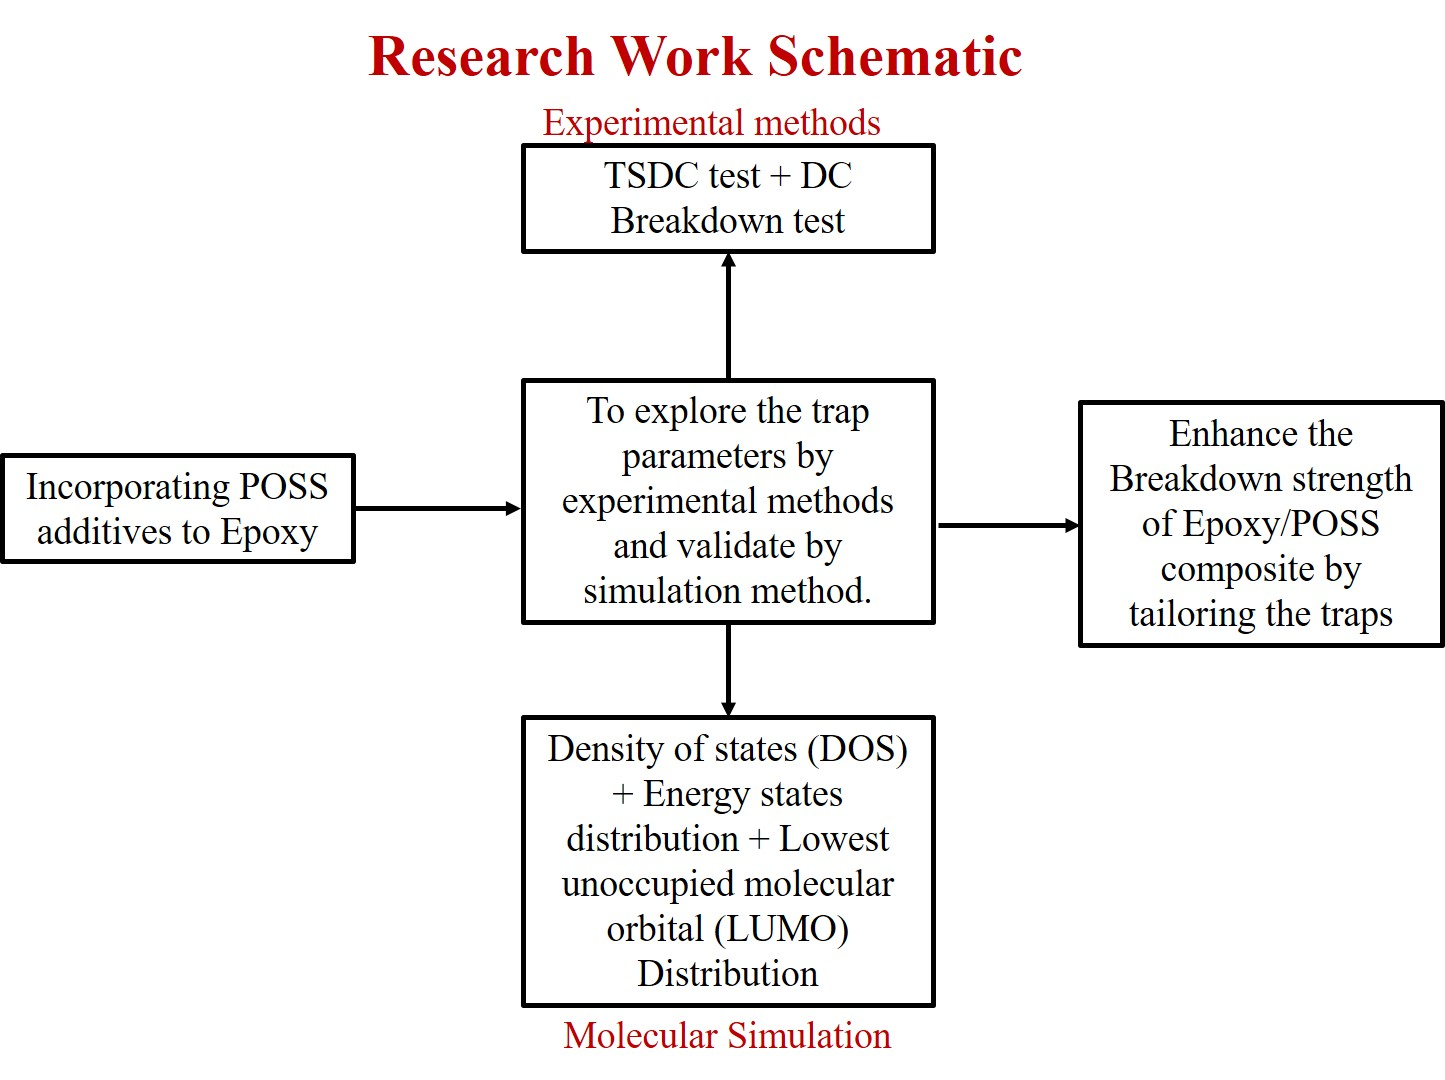
1. Introduction
2. Materials and Experimental Methods
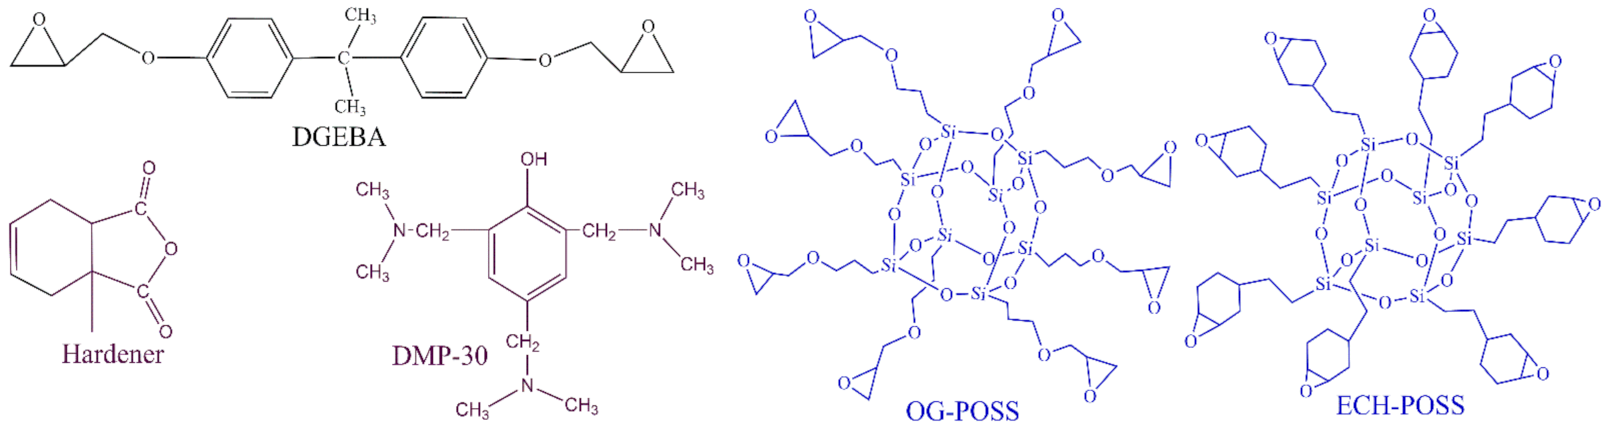
2.1. Materials
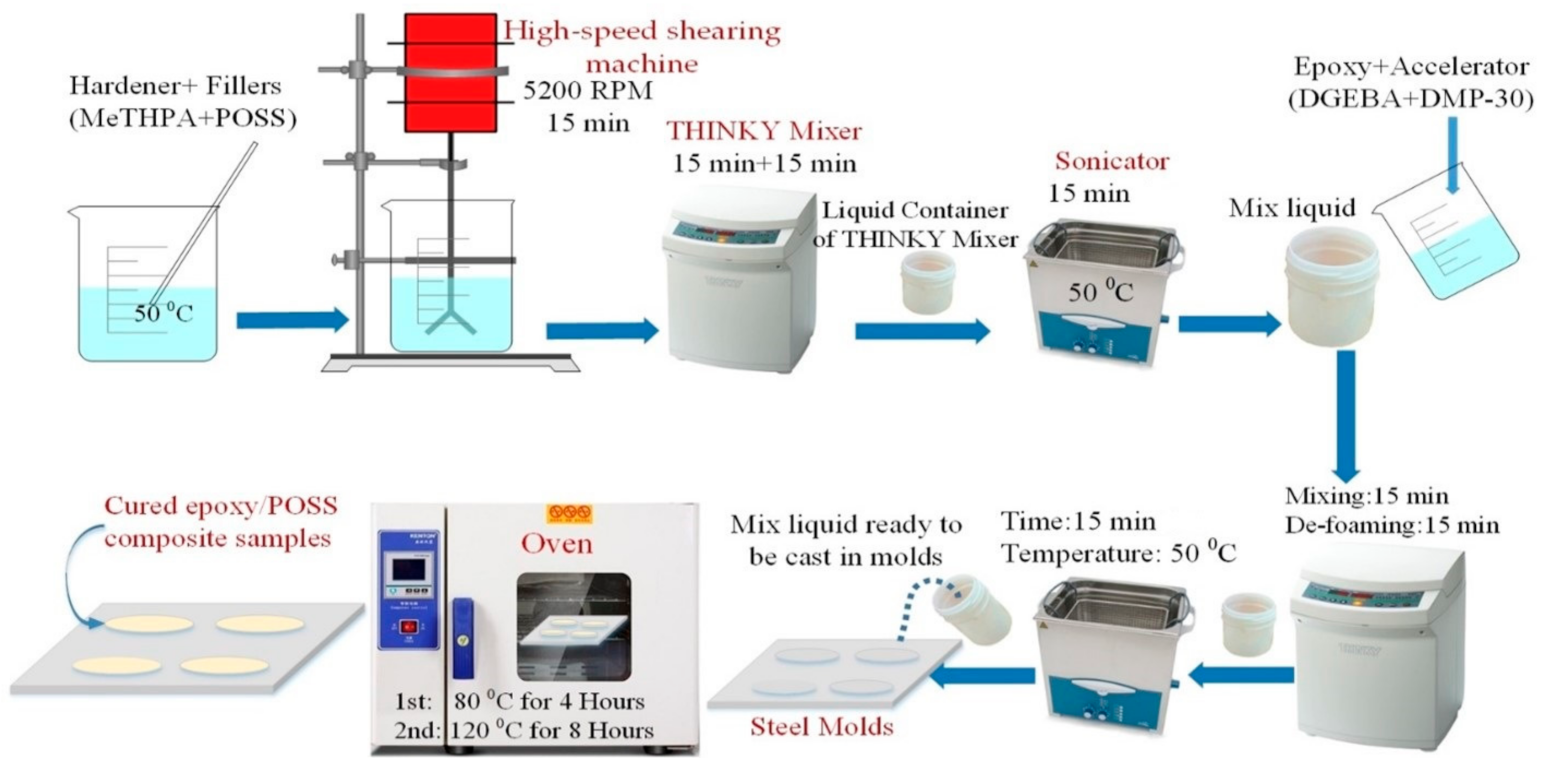
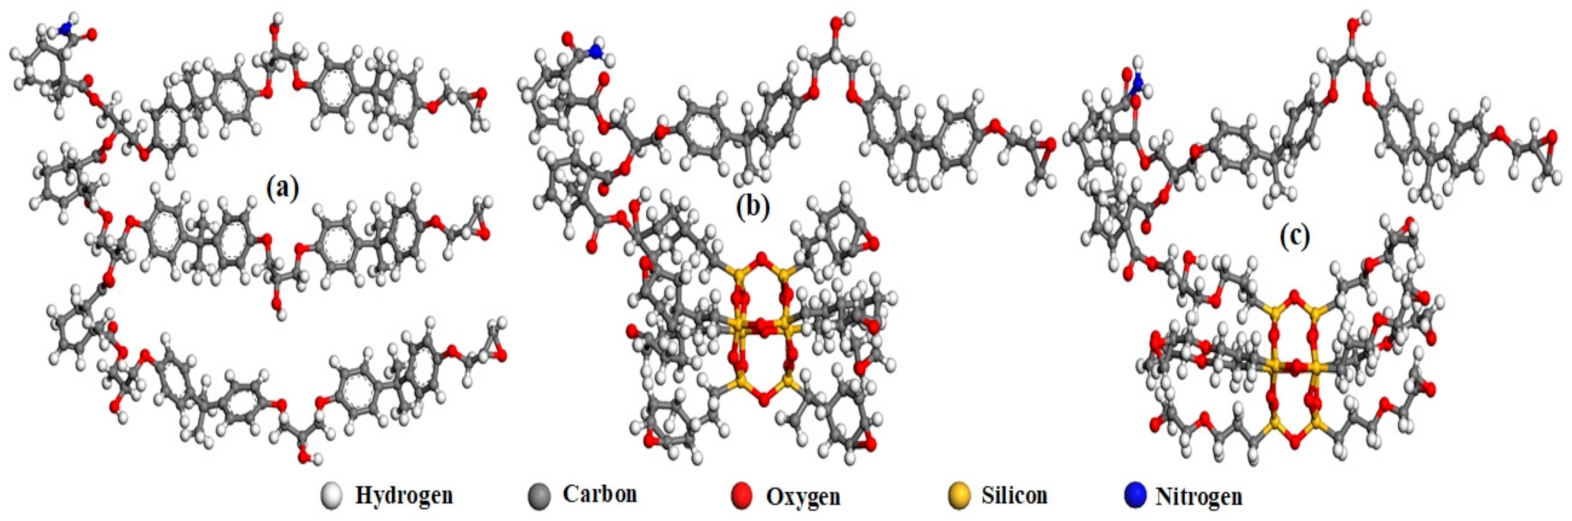
2.2. Preparation of Epoxy/POSS Composites
2.3. Breakdown Test
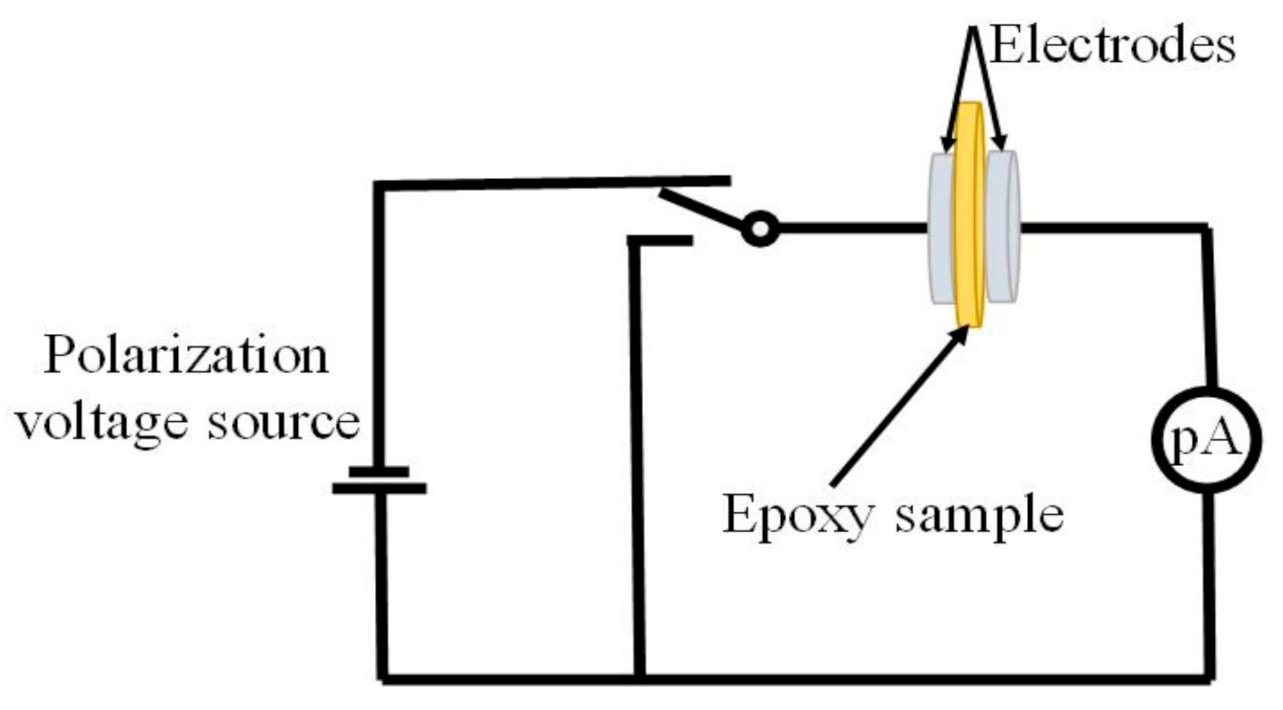
2.4. TSDC Experiment
2.5. Molecular Modeling and Simulation
2.5.1. Schematics of Chemical Reaction
2.5.2. Quantum Chemical Calculation (DFT Method)
3. Results
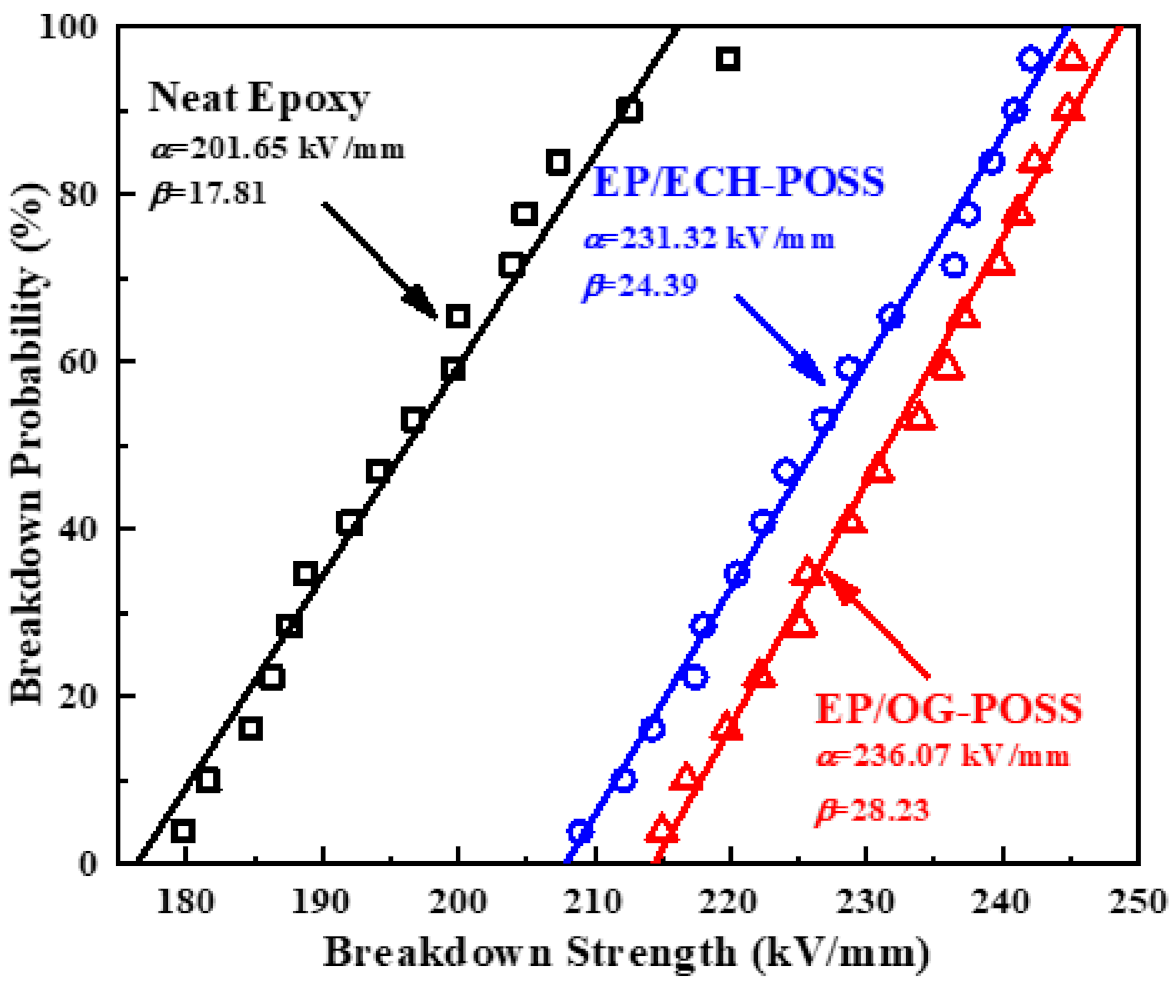
3.1. DC Breakdown Strength
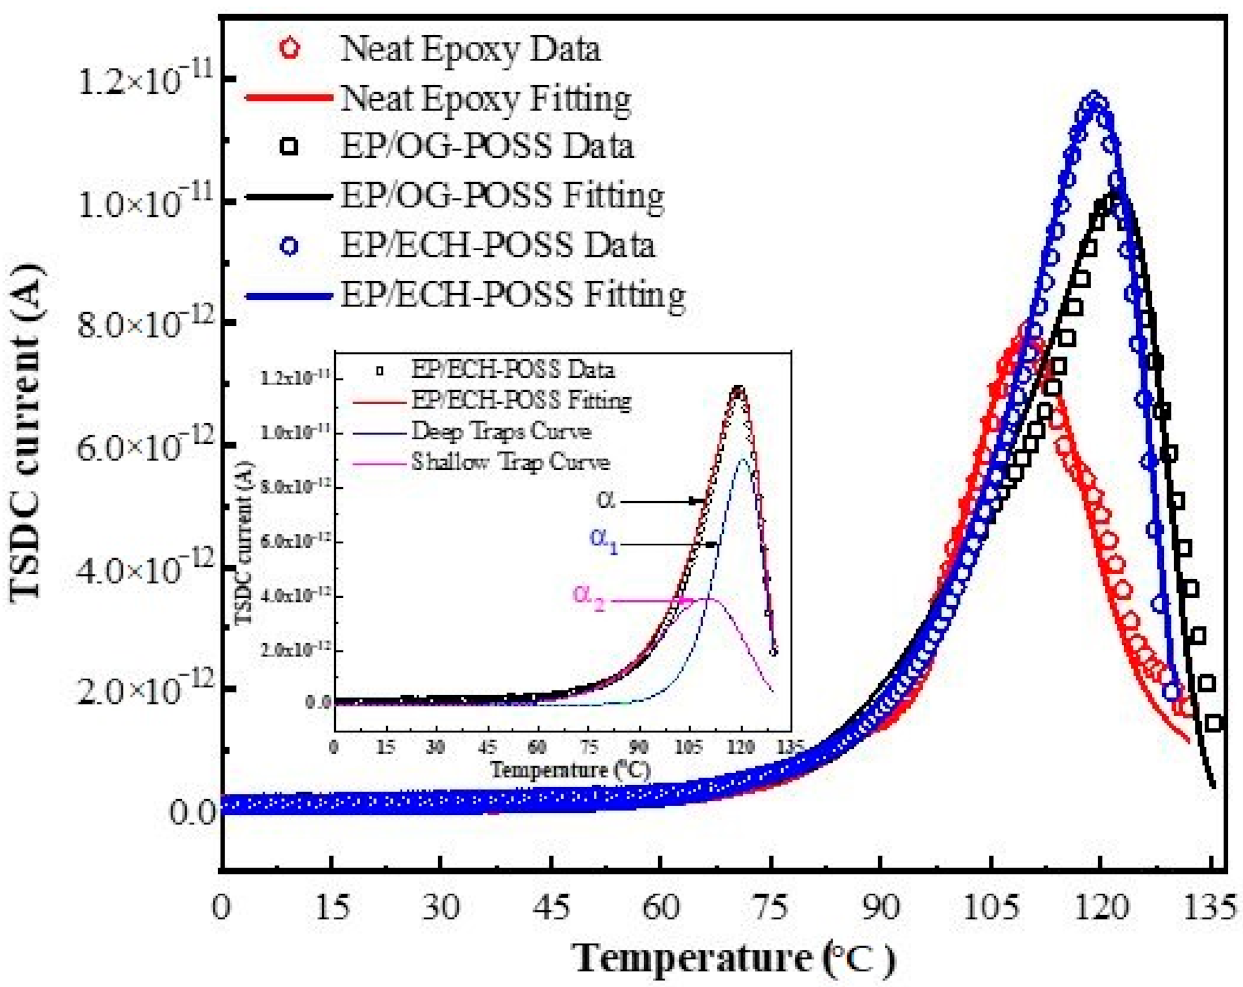
3.2. Trap Characterization by TSDC
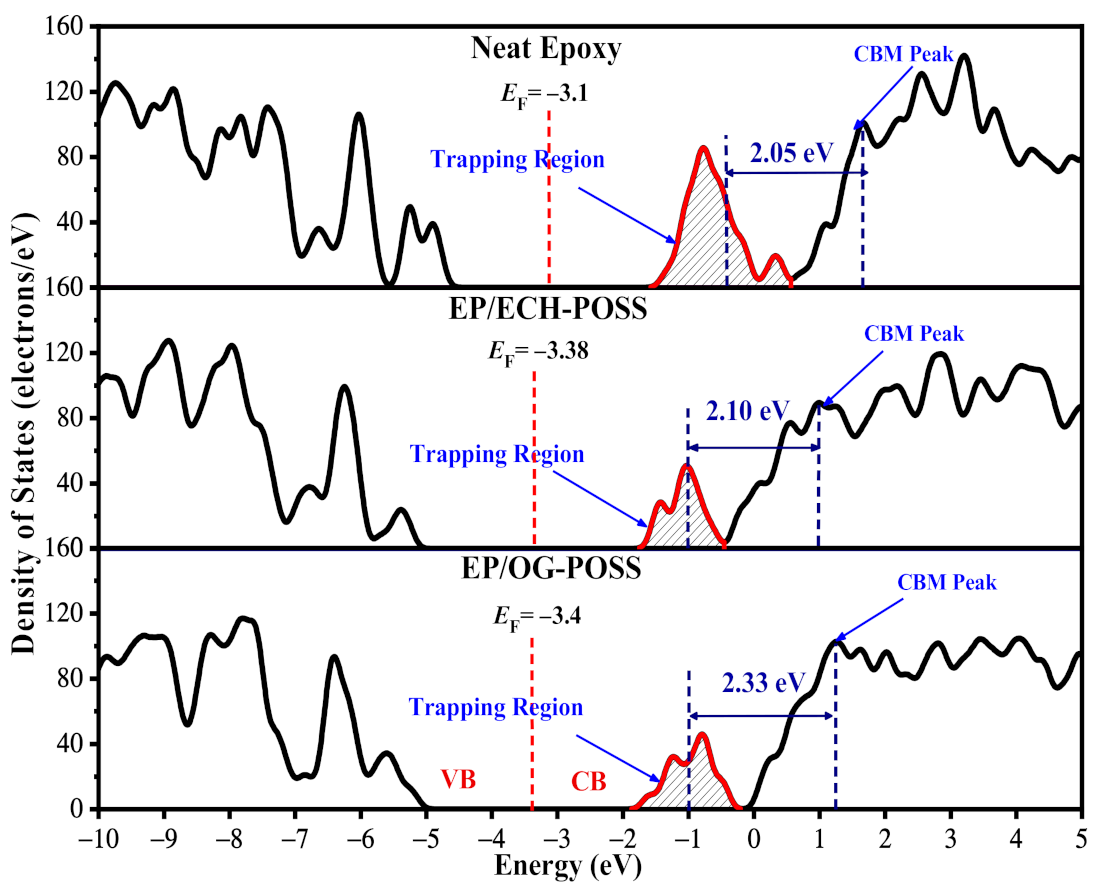
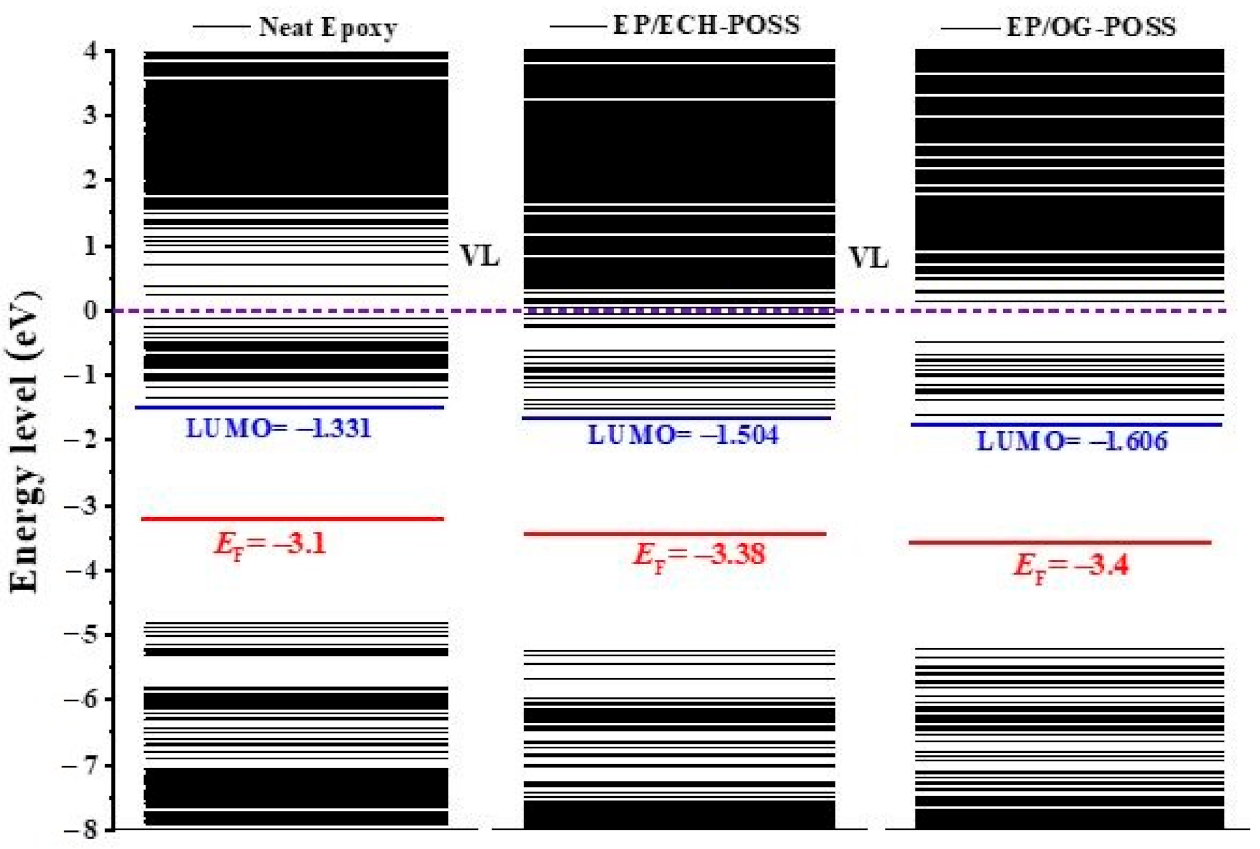
3.3. Density of States (DOS) and Energy Level Distribution
4. Discussion
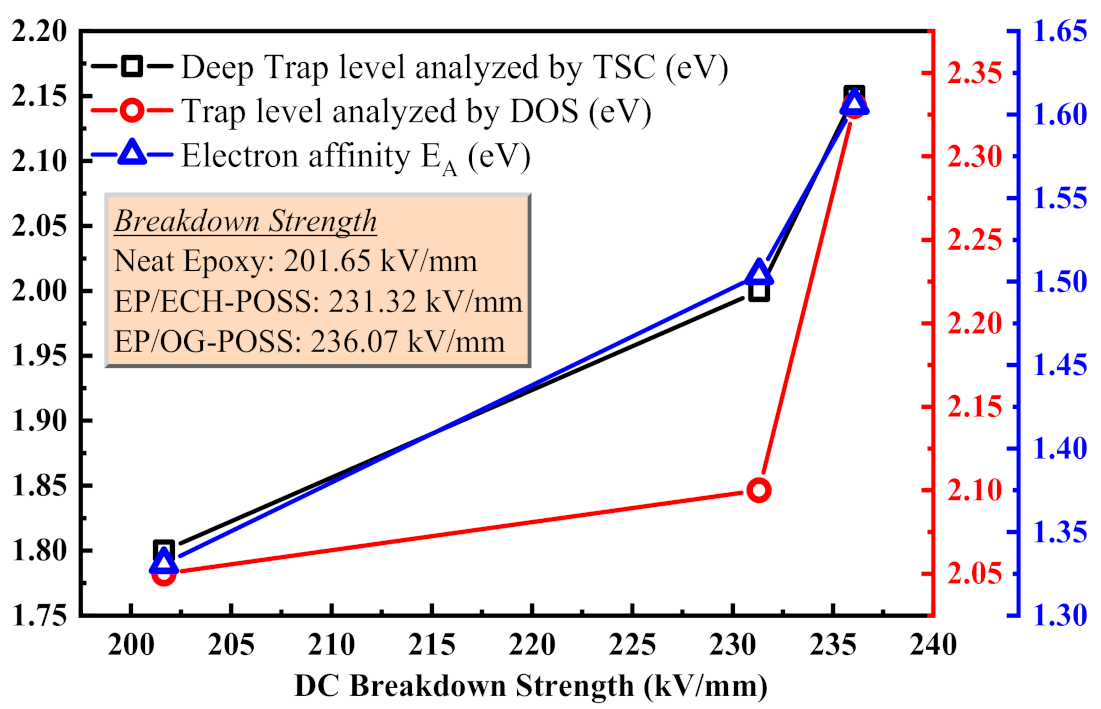
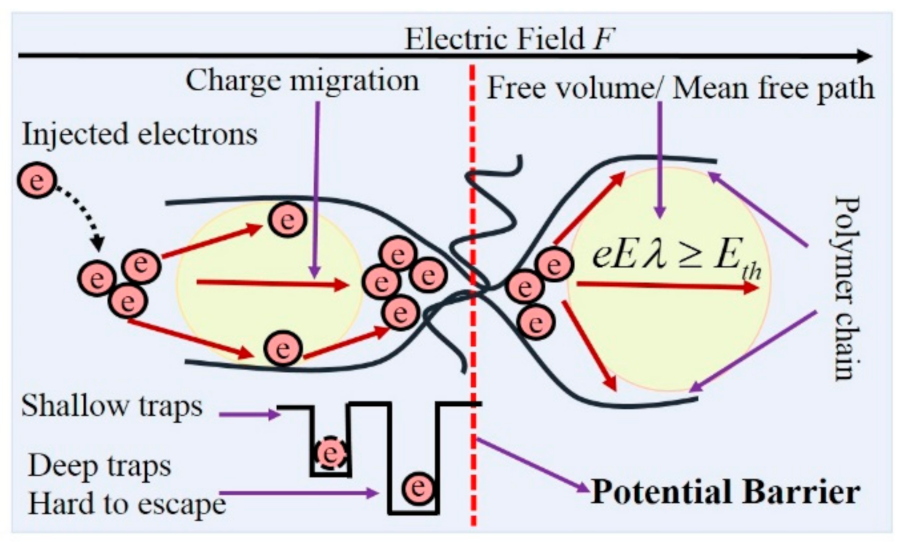
4.1. Relationship between DC Breakdown and Traps
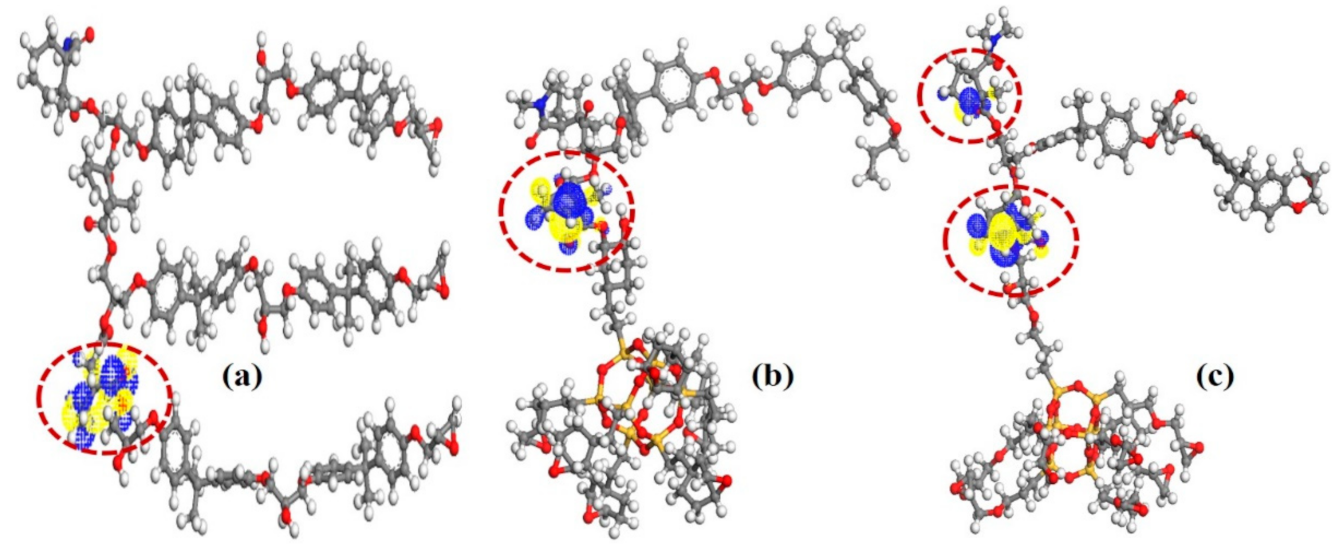
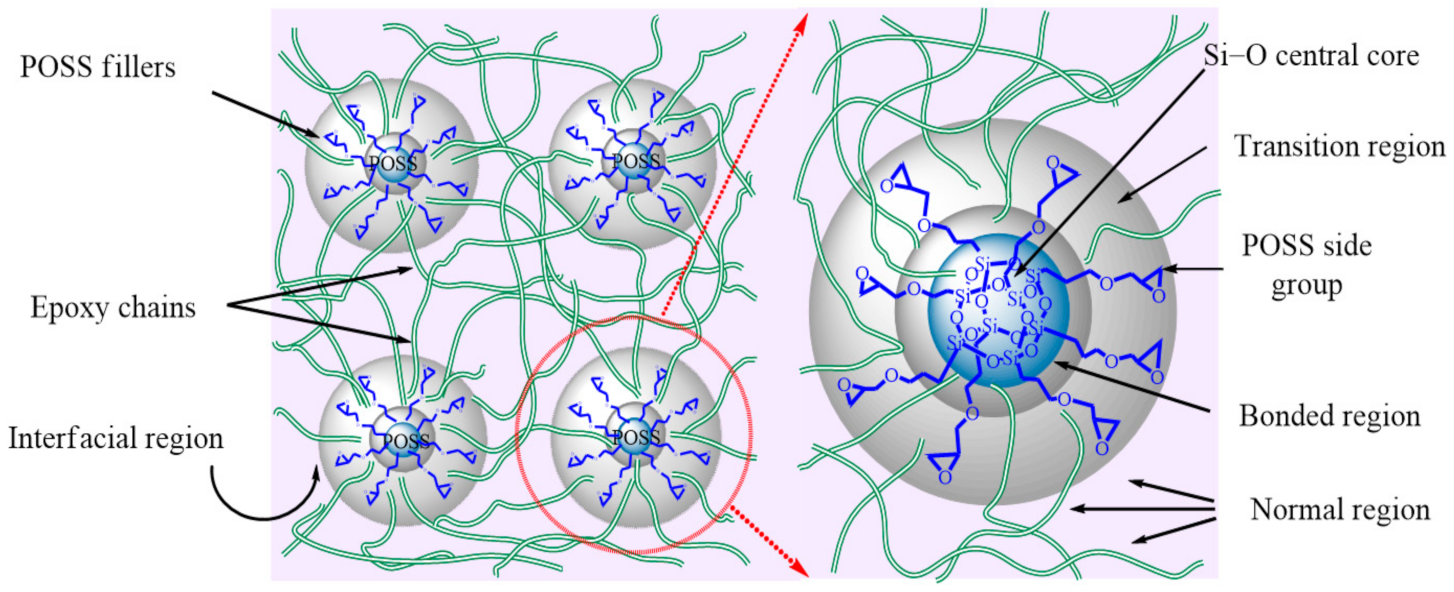
4.2. Origin of Traps Introduced by POSS Nanofillers
4.3. The Effect of Traps on the DC Breakdown Performance
5. Conclusions
- Incorporation of OG-POSS and ECH-POSS nanofillers to epoxy matrix successfully increases the deep trap level and breakdown strength, the DC breakdown strength of EP/OG-POSS, and EP/ECH-POSS increases 17% and 15% compared to neat epoxy.
- A positive relationship has been established between DC breakdown strength and trap parameters, i.e., deep trap level and electron affinity (EA).
- Traps originated from the interfacial bonded region of EP/POSS. The depth of the trap level has a positive correlation with the electronegativity of atoms in the side groups of POSS. The greater the electronegativity of polymeric composite, the larger would be the trap depth.
- The increment in deep trap level and density suppresses the charge injection and transport process in the dielectric material, restraining the carriers from hopping over the potential barrier and further improves the DC breakdown strength.
Author Contributions
Funding
Institutional Review Board Statement
Informed Consent statement
Data Availability statement
Conflicts of Interest
References
- Tanaka, T.; Montanari, G.C.; Mulhaupt, R. Polymer nanocomposites as dielectrics and electrical insulation-perspectives for processing technologies, material characterization and future applications. IEEE Trans. Dielectr. Electr. Insul. 2004, 11, 763–784. [Google Scholar] [CrossRef]
- Li, S.; Yin, G.; Bai, S.; Li, J. A new potential barrier model in epoxy resin nanodielectrics. IEEE Trans. Dielectr. Electr. Insul. 2011, 18, 1535–1543. [Google Scholar] [CrossRef]
- Lewis, T.J. Interfaces are the dominant feature of dielectrics at the nanometric level. IEEE Trans. Dielectr. Electr. Insul. 2004, 11, 739–753. [Google Scholar] [CrossRef]
- Tanaka, T.; Kozako, M.; Fuse, N.; Ohki, Y. Proposal of a multi-core model for polymer nanocomposite dielectrics. IEEE Trans. Dielectr. Electr. Insul. 2005, 12, 669–681. [Google Scholar] [CrossRef]
- Teyssedre, G.; Laurent, C. Charge transport modeling in insulating polymers: From molecular to macroscopic scale. IEEE Trans. Dielectr. Electr. Insul. 2005, 12, 857–875. [Google Scholar] [CrossRef]
- Qu, G.; Cui, H.; Zhu, Y.; Yang, L.; Li, S. Substantial Improvement of the Dielectric Strength of Cellulose − Liquid Composites: Effects of Traps at the Nanoscale Interface. ACS, J. Phys. Chem. Lett. 2020, 11, 1881–1889. [Google Scholar] [CrossRef] [PubMed]
- Li, S.; Xie, D.; Qu, G.; Yang, L.; Min, D.; Cheng, Y. Tailoring interfacial compatibility and electrical breakdown properties in polypropylene based composites by surface functionalized POSS. Appl. Surf. Sci. 2019, 478, 451–458. [Google Scholar] [CrossRef]
- Tan, D.Q. The search for enhanced dielectric strength of polymer-based dielectrics: A focused review on polymer nanocomposites. J. Appl. Polym. Sci. 2020, 137, 1–32. [Google Scholar] [CrossRef]
- Wang, W.; Min, D.; Li, S. Understanding the conduction and breakdown properties of polyethylene nanodielectrics: Effect of deep traps. IEEE Trans. Dielectr. Electr. Insul. 2016, 23, 564–572. [Google Scholar] [CrossRef]
- Li, S.; Min, D.; Wang, W.; Chen, G. Linking traps to dielectric breakdown through charge dynamics for polymer nanocomposites. IEEE Trans. Dielectr. Electr. Insul. 2016, 23, 2777–2785. [Google Scholar] [CrossRef]
- Wang, W.; Li, S. Improvement of Dielectric Breakdown Performance by Surface Modification in Polyethylene/TiO2 Nanocomposites. Materials 2019, 12, 3346. [Google Scholar] [CrossRef] [Green Version]
- Tang, Y.; Ge, G.; Li, Y.; Huang, L. Effect of Al2O3 with Different Nanostructures on the Insulating Properties of Epoxy-Based Composites. Materials 2020, 13, 4235. [Google Scholar] [CrossRef] [PubMed]
- Wang, S.; Yu, S.; Li, J.; Li, S. Effects of Functionalized Nano-TiO2 on the Molecular Motion in Epoxy Resin-Based Nanocomposites. Materials 2020, 13, 163. [Google Scholar] [CrossRef] [PubMed] [Green Version]
- Li, C.; Hu, J.; Lin, C.; He, J. The control mechanism of surface traps on surface charge behavior in alumina-filled epoxy composites. J. Phys. D Appl. Phys. 2016, 49, 445304. [Google Scholar] [CrossRef]
- Pan, G.-T.; Chong, S.; Yang, T.C.-K.; Yang, Y.-L.; Arjun, N. Surface Modification of Amorphous SiO2 Nanoparticles by Oxygen-Plasma and Nitrogen-Plasma Treatments. Chem. Eng. Commun. 2016, 203, 1666–1670. [Google Scholar] [CrossRef]
- Sánchez, C.C.; Wåhlander, M.; Taylor, N.; Fogelström, L.; Malmström, E.; Wähler, M. Novel Nanocomposites of Poly(lauryl methacrylate)-Grafted Al2O3 Nanoparticles in LDPE. ACS Appl. Mater. Interfaces 2015, 7, 25669–25678. [Google Scholar] [CrossRef]
- Kalia, S. Polymer/POSS Nanocomposites and Hybrid Materials; Springer Series on Polymer and Composite Materials; Springer: Cham, Switzerland, 2018. [Google Scholar] [CrossRef]
- Du, B.; Su, J.; Tian, M.; Han, T.; Li, J. Understanding Trap Effects on Electrical Treeing Phenomena in EPDM/POSS Composites. Sci. Rep. 2018, 8, 1–11. [Google Scholar] [CrossRef]
- Heid, T.; West, N.S.; Canada, H.C.; Fréchette, M.; Blvd, L.; David, E. Nanostructured Epoxy/POSS Composites: Enhanced Materials for High Voltage Insulation Applications. IEEE Trans. Dielectr. Electr. Insul. 2014, 22, 1594–1604. [Google Scholar]
- IEEE Standards. IEEE Spectrum; IEEE: Piscataway, NJ, USA, 1976; Volume 13, p. 92. [Google Scholar]
- Lei, Q.-Q.; Wang, X.; Fan, Y. A new method of auto-separating thermally stimulated current. J. Appl. Phys. 1992, 72, 4254–4257. [Google Scholar] [CrossRef]
- Chen, Y.; Cheng, Y.; Wu, K.; Nelson, J.K.; Dissado, L.A.; Li, S. Flashover Characteristic of Epoxy Composites Filled With Different Micro-Inorganic Oxide Particles Under Nanosecond Pulse in Vacuum. IEEE Trans. Plasma Sci. 2008, 37, 195–203. [Google Scholar] [CrossRef]
- Delley, B. An all-electron numerical method for solving the local density functional for polyatomic molecules. J. Chem. Phys. 1990, 92, 508–517. [Google Scholar] [CrossRef]
- Perdew, J.P.; Burke, K.; Ernzerhof, M. Generalized Gradient Approximation Made Simple. Phys. Rev. Lett. 1996, 77, 3865. [Google Scholar] [CrossRef] [PubMed] [Green Version]
- Inada, Y.; Orita, H.; Accelrys, K. Efficiency of Numerical Basis Sets for Predicting the Binding Energies of Hydrogen Bonded Complexes: Evidence of Small Basis Set Superposition Error Compared to Gaussian Basis Sets. J. Comput. Chem. 2007, 29, 225–232. [Google Scholar]
- Grimme, S.; Chemie, T.O.; Münster, O. Semi empirical GGA-Type Density Functional Constructed with a Long-Range Dispersion Correction. J. Comput. Chem. 2006, 27, 1787–1799. [Google Scholar] [CrossRef]
- Wang, W.; Takada, T.; Tanaka, Y.; Li, S. Trap-controlled charge decay and quantum chemical analysis of charge transfer and trapping in XLPE. IEEE Trans. Dielectr. Electr. Insul. 2017, 24, 3144–3153. [Google Scholar] [CrossRef]
- Dissado, L.A.; Fothergill, J.C. Electrical Degradation and Breakdown in Polymers; The Institution of Engineering and Technology: London, UK, 1992. [Google Scholar] [CrossRef] [Green Version]
- Do Nascimento, E.; Ramos, A.; Windmoller, D.; Rodrigo, P.R.; Juanes, R.T.; Greus, A.R.; Borrás, V.A.; Coelho, L.A.F. Breakdown, free-volume and dielectric behavior of the nanodielectric coatings based on epoxy/metal oxides. J. Mater. Sci. Mater. Electron. 2016, 27, 9240–9254. [Google Scholar] [CrossRef]


| Sample Code | Sample Ingredients |
|---|---|
| Neat epoxy | Epoxy (DGEBA + MeTHPA + DMP-30) |
| EP/OG-POSS | Epoxy+OG-POSS 2.5% |
| EP/ECH-POSS | Epoxy+ECH-POSS 2.5% |
| α Peak1 (α1) | α Peak2 (α2) | |||||
|---|---|---|---|---|---|---|
| Samples | Trap Energy/eV | Qd (nC) | Tm1 (°C) | Trap Energy/eV | Qs (nC) | Tm2 (°C) |
| Neat | 1.8 | 1.12 × 10⁻⁹ | 108 | 0.95 | 1.58 × 10⁻⁹ | 96 |
| EP/ECH-POSS | 2 | 8.11 × 10⁻⁹ | 124 | 0.96 | 6.74 × 10⁻⁹ | 116 |
| EP/OG-POSS | 2.15 | 6.69 × 10⁻⁹ | 127 | 0.956 | 6.83 × 10⁻⁹ | 116 |
Publisher’s Note: MDPI stays neutral with regard to jurisdictional claims in published maps and institutional affiliations. |
© 2021 by the authors. Licensee MDPI, Basel, Switzerland. This article is an open access article distributed under the terms and conditions of the Creative Commons Attribution (CC BY) license (http://creativecommons.org/licenses/by/4.0/).
Share and Cite
Aslam, F.; Li, Z.; Qu, G.; Feng, Y.; Li, S.; Li, S.; Mao, H. Improvement of DC Breakdown Strength of the Epoxy/POSS Nanocomposite by Tailoring Interfacial Electron Trap Characteristics. Materials 2021, 14, 1298. https://doi.org/10.3390/ma14051298
Aslam F, Li Z, Qu G, Feng Y, Li S, Li S, Mao H. Improvement of DC Breakdown Strength of the Epoxy/POSS Nanocomposite by Tailoring Interfacial Electron Trap Characteristics. Materials. 2021; 14(5):1298. https://doi.org/10.3390/ma14051298
Chicago/Turabian StyleAslam, Farooq, Zhen Li, Guanghao Qu, Yang Feng, Shijun Li, Shengtao Li, and Hangyin Mao. 2021. "Improvement of DC Breakdown Strength of the Epoxy/POSS Nanocomposite by Tailoring Interfacial Electron Trap Characteristics" Materials 14, no. 5: 1298. https://doi.org/10.3390/ma14051298