Hydrogen Embrittlement at Cleavage Planes and Grain Boundaries in Bcc Iron—Revisiting the First-Principles Cohesive Zone Model


Abstract
:
1. Introduction
2. Methodology
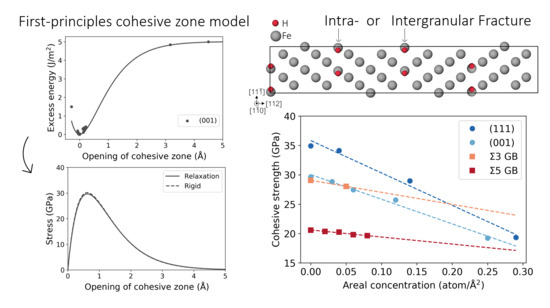
2.1. First-Principles Cohesive Zone Model
2.1.1. Effect of Relaxation of Atomic Positions
- (i)
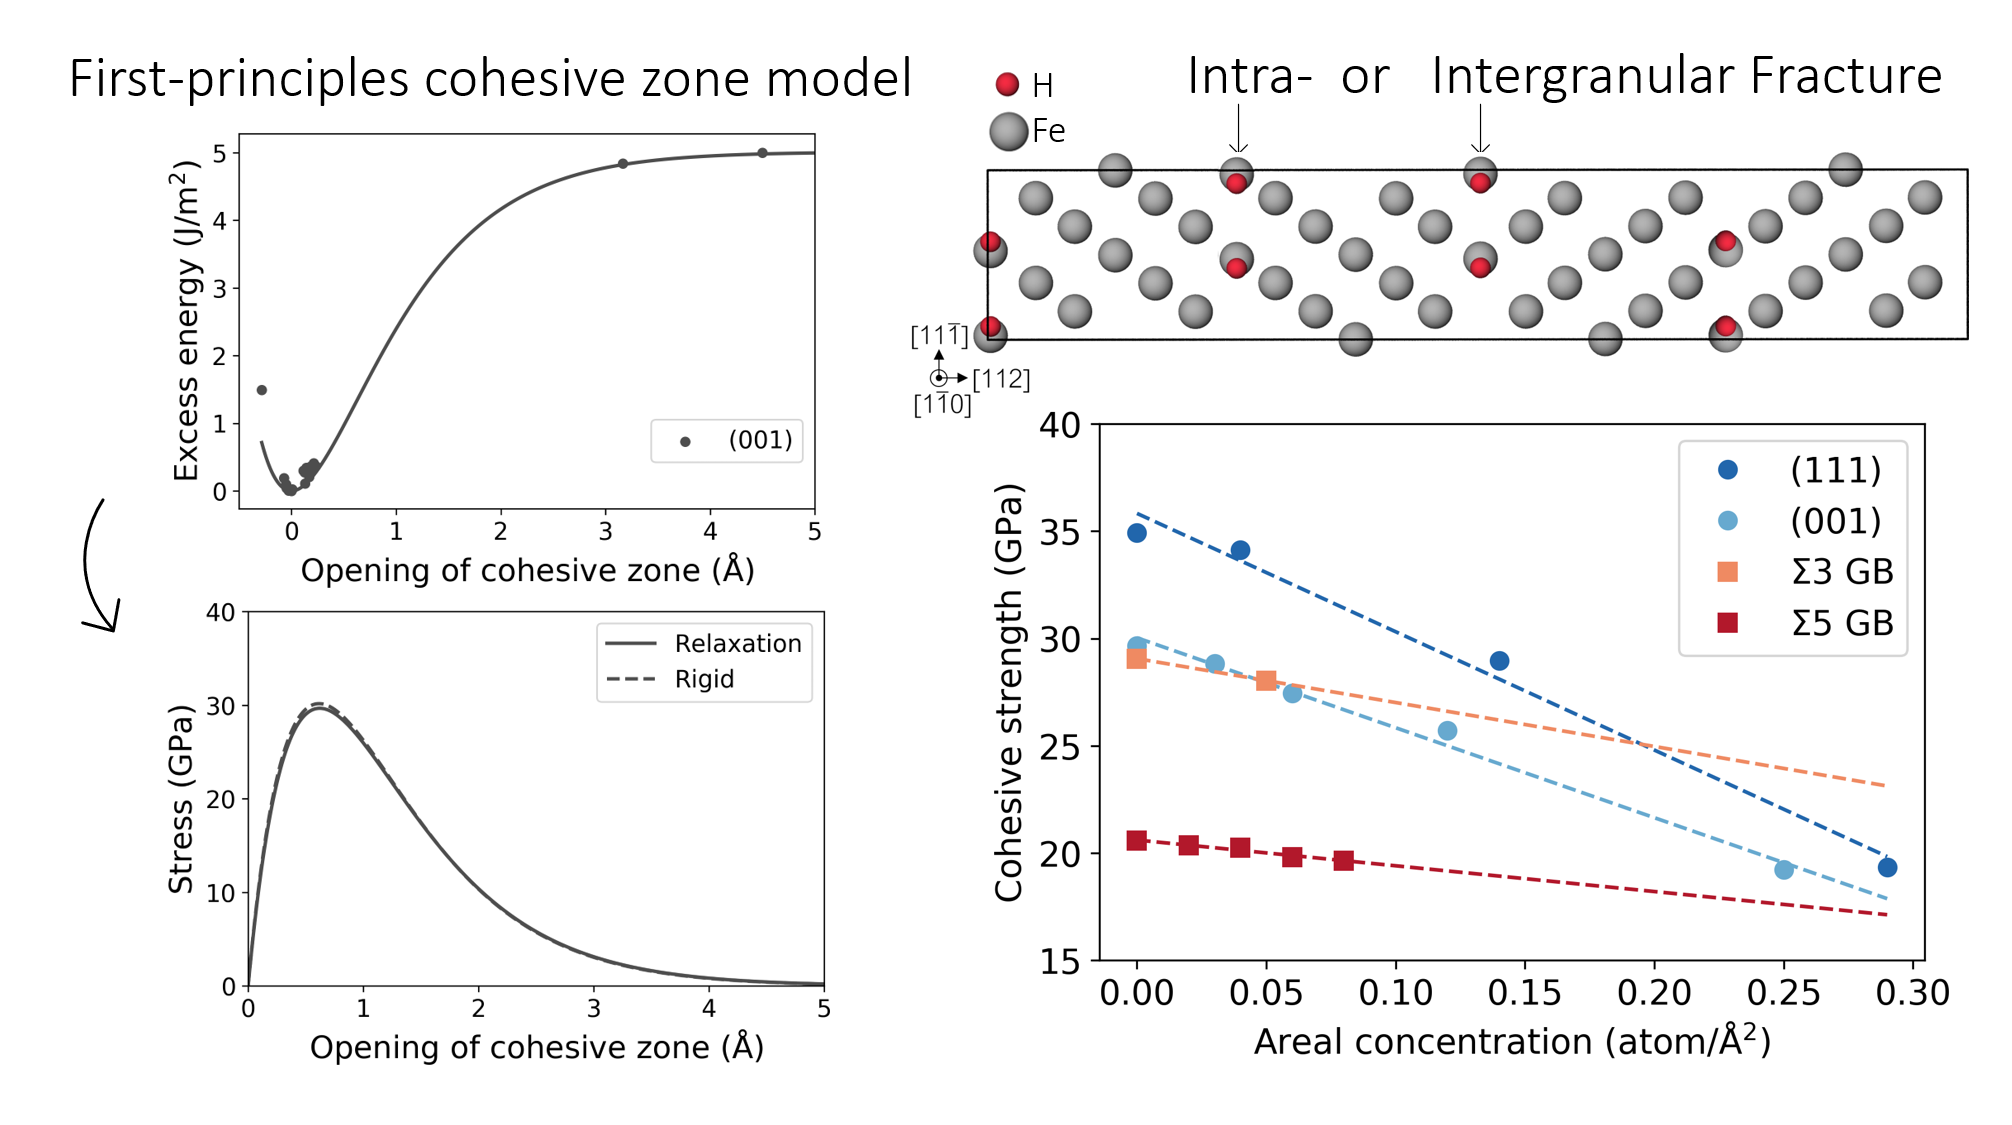
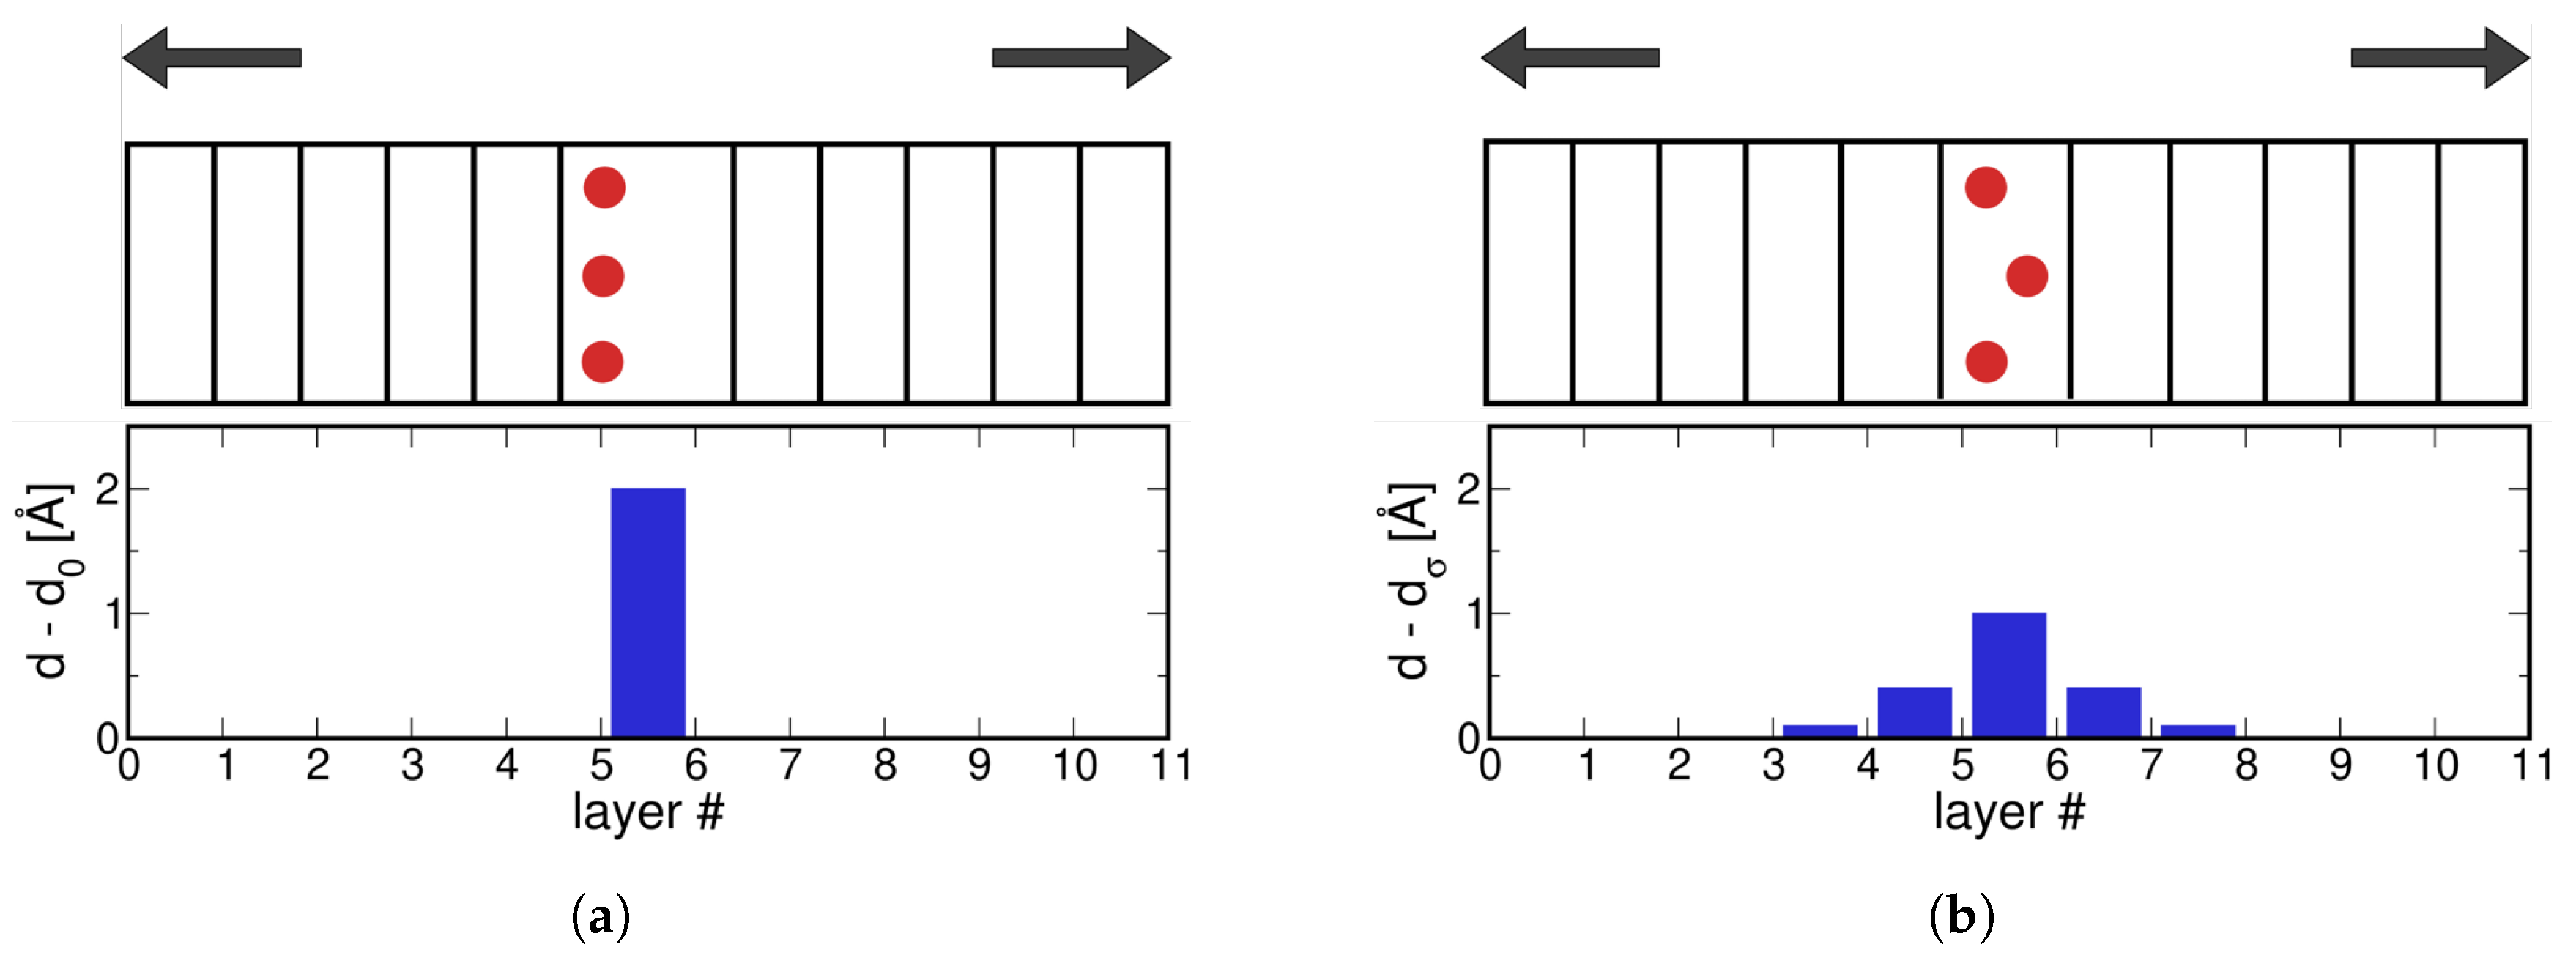
- rigid grain shifts (RGS): displacement is concentrated between two blocks of atoms or “grains” defining the cleavage plane (due to periodic boundary conditions, two cleavage planes or cohesive zones are created in a GB supercell). The energy is obtained after a rigid calculation with fixed atomic coordinates.
- (ii)
- rigid grain shifts with subsequent relaxation (RGSrel): using the same procedure as in previous case but allowing the relaxation of the atomic positions at each displacement. This relaxation releases elastic energy.
2.1.2. Universal Binding Energy Relationship (UBER)
2.1.3. Excess Quantities
2.1.4. Stress and Interplanar Distance
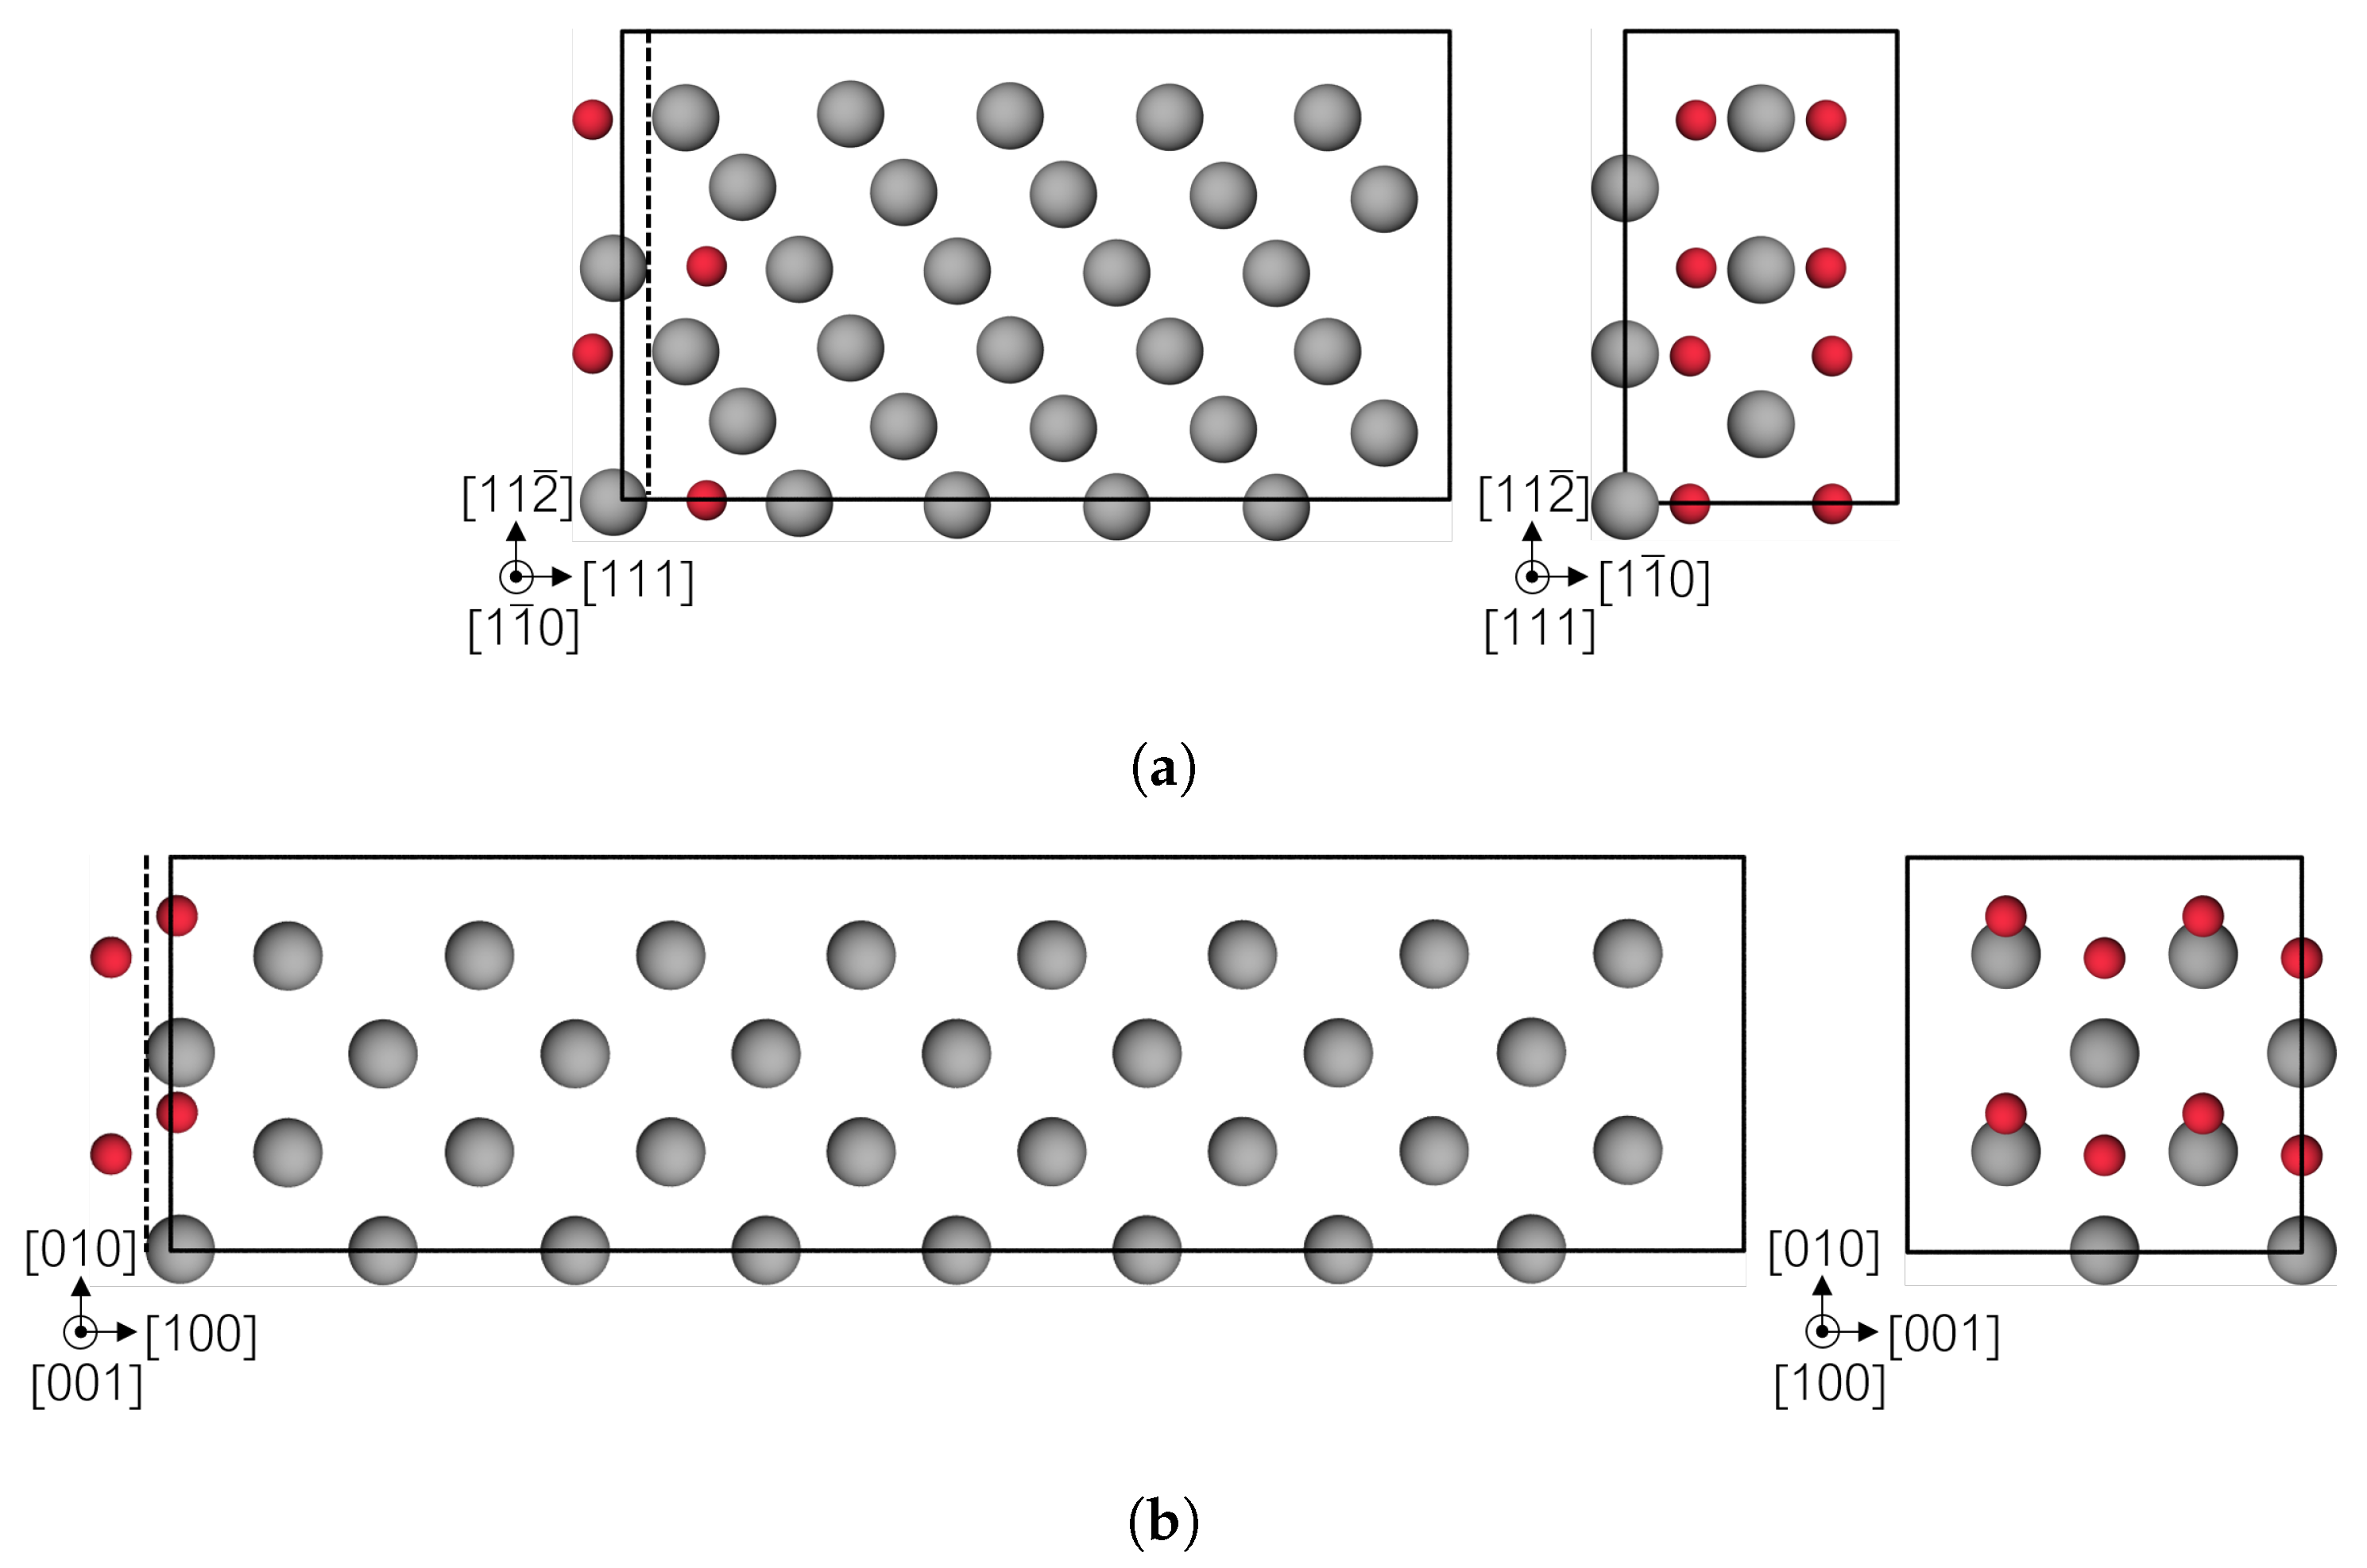
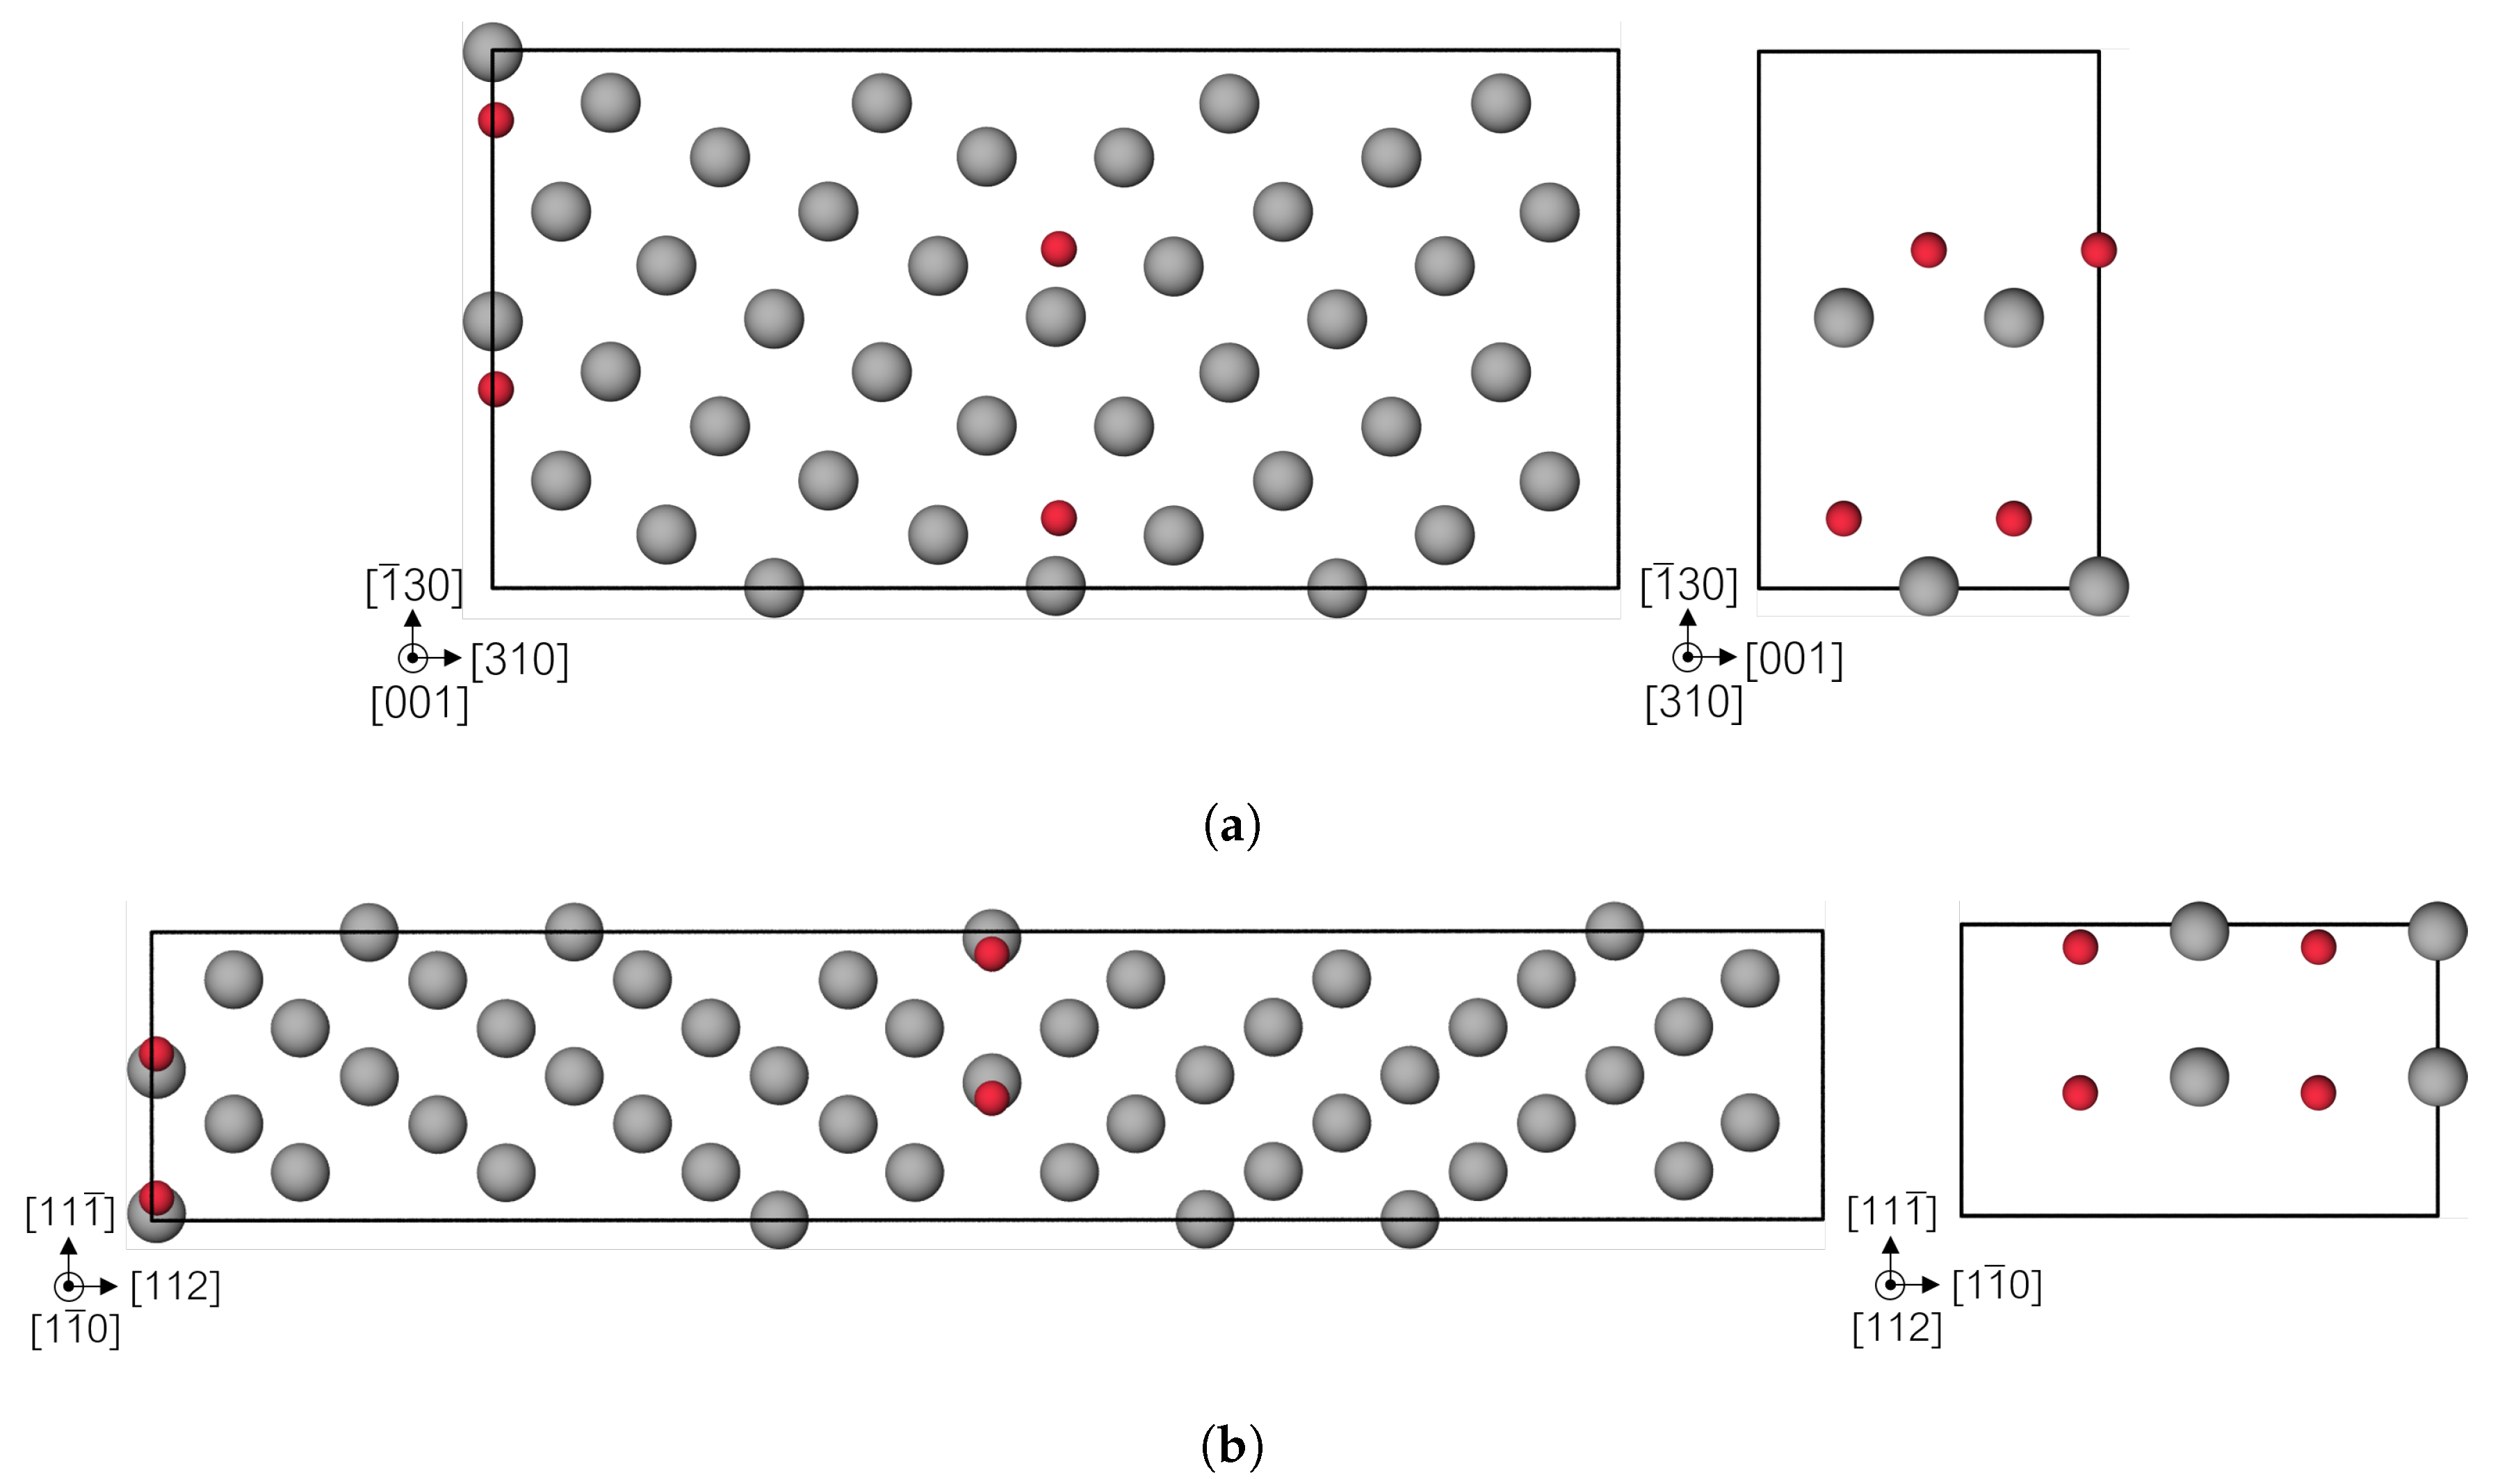
2.2. Simulation Cell Construction
2.3. Computational Details
3. Results
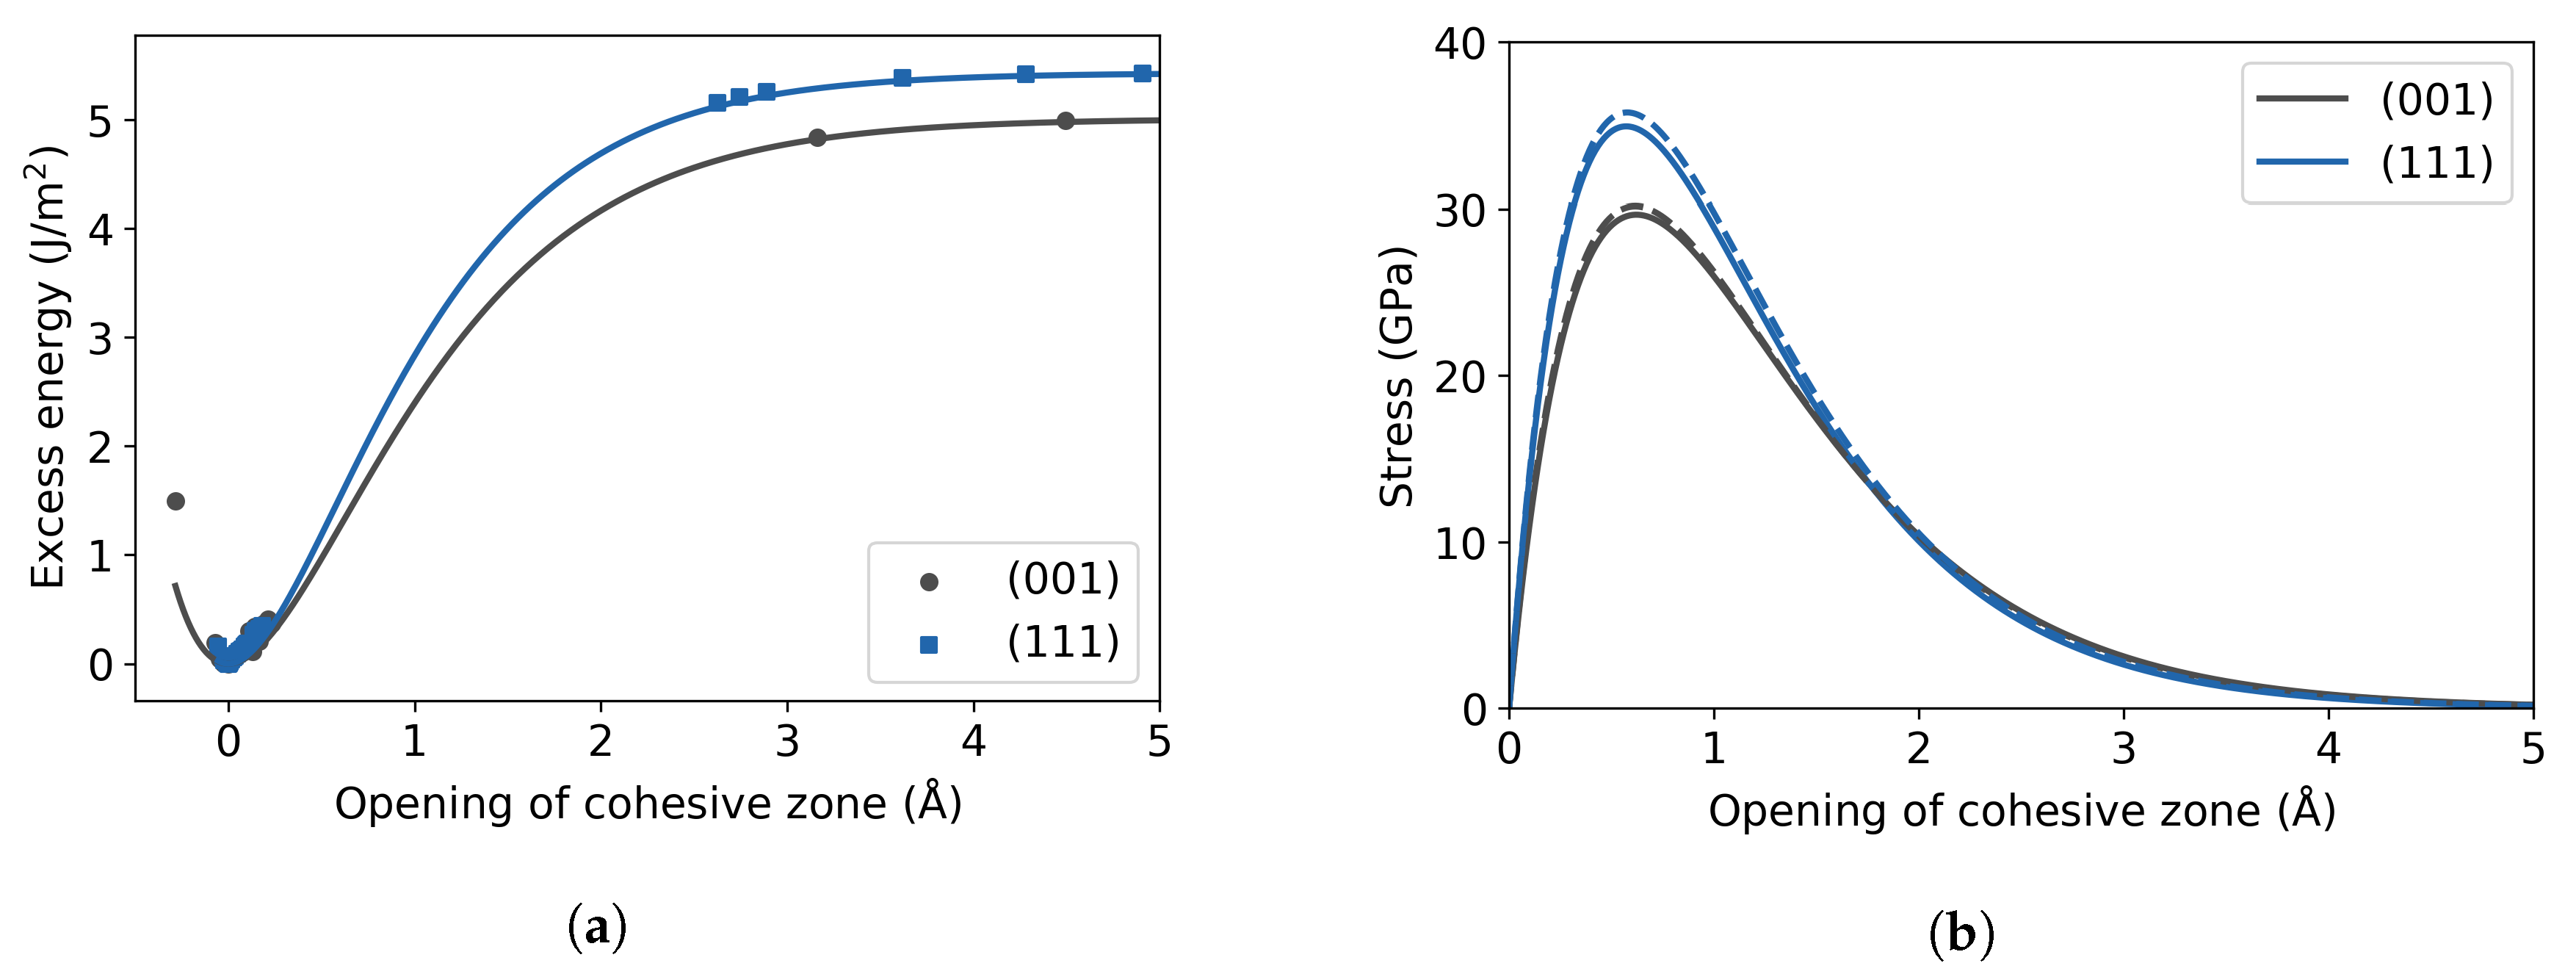
3.1. Pure Fe Bulk
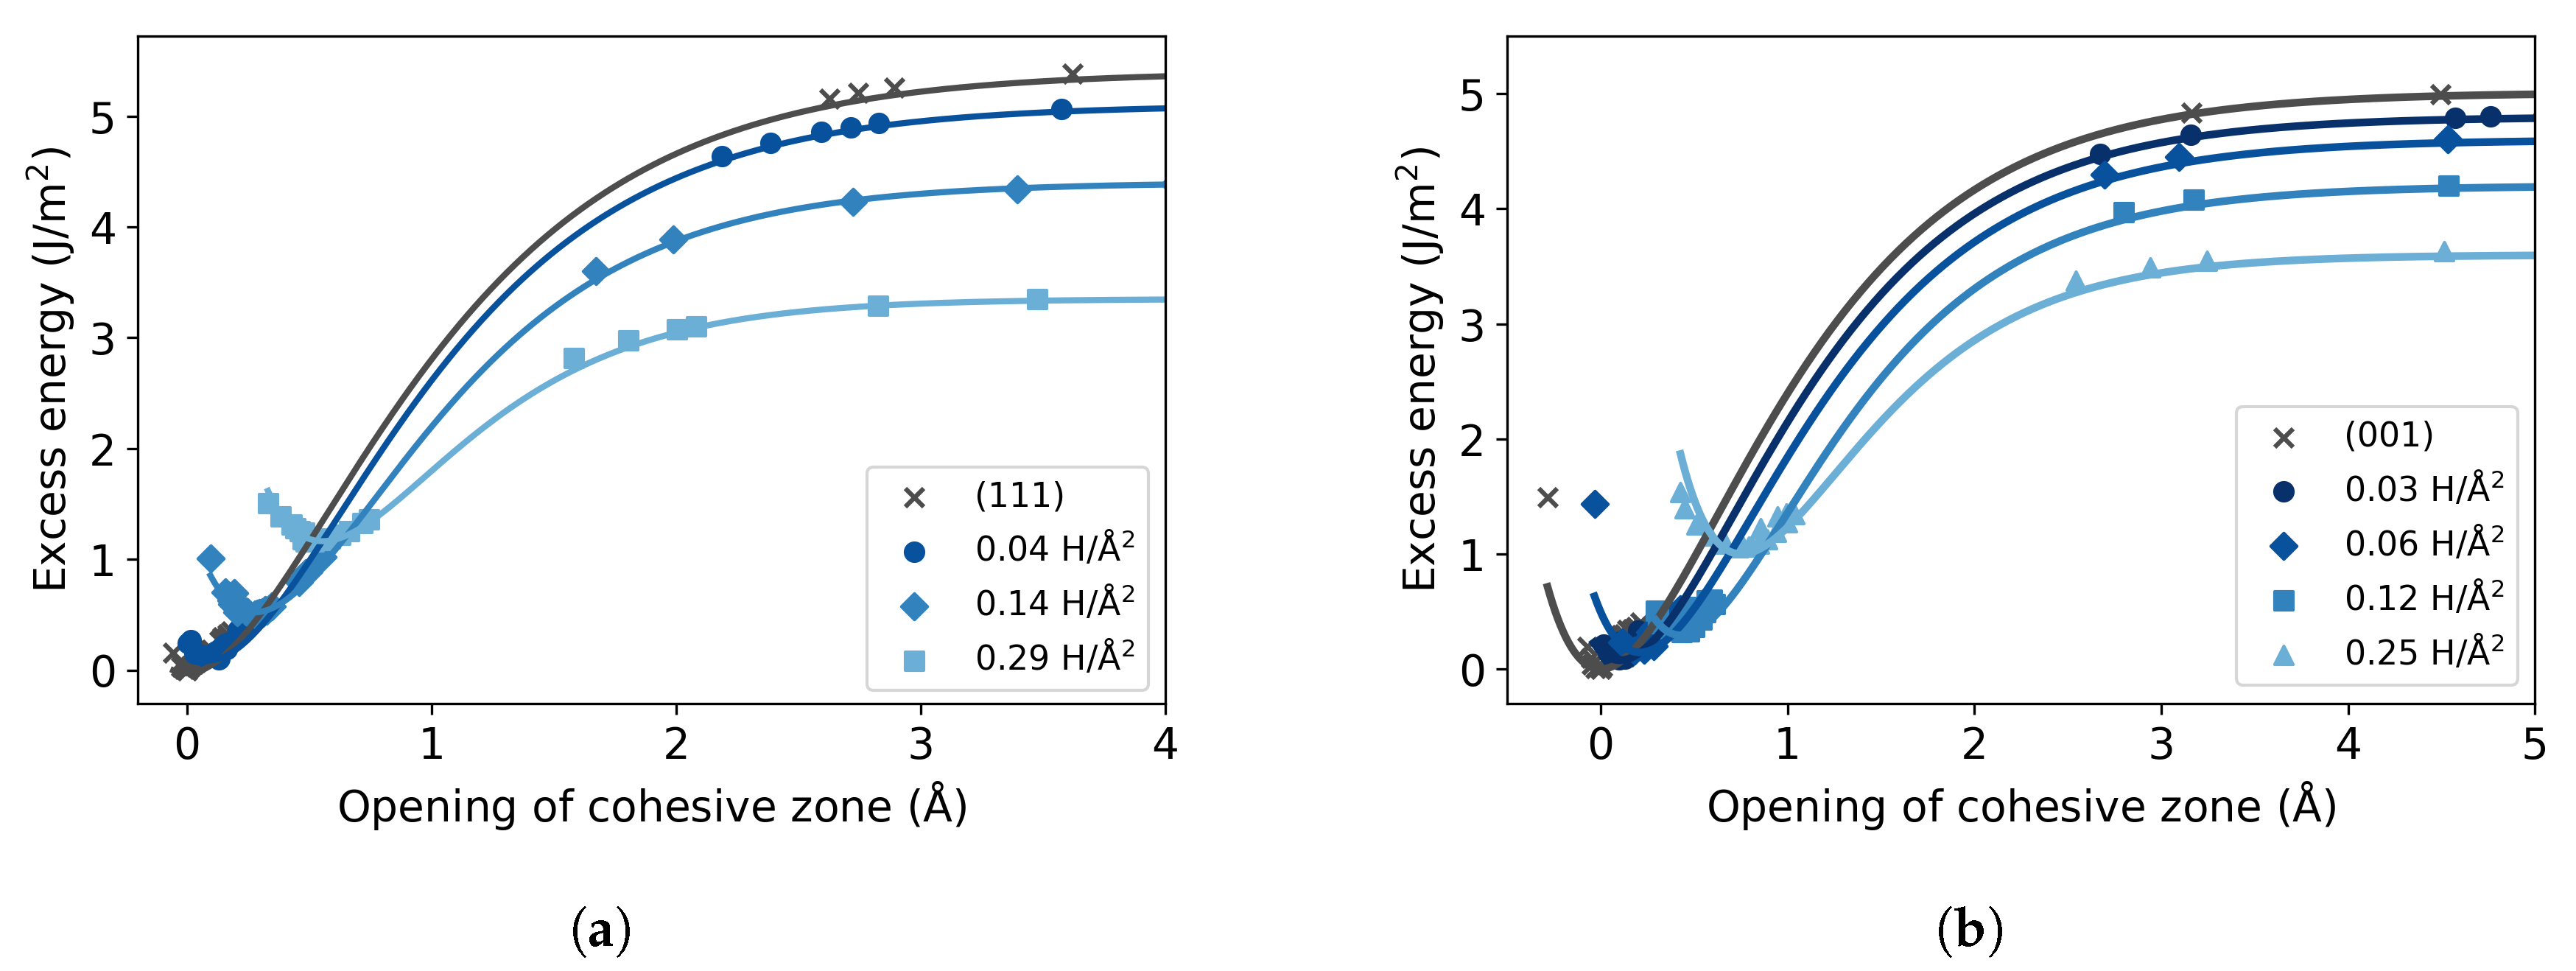
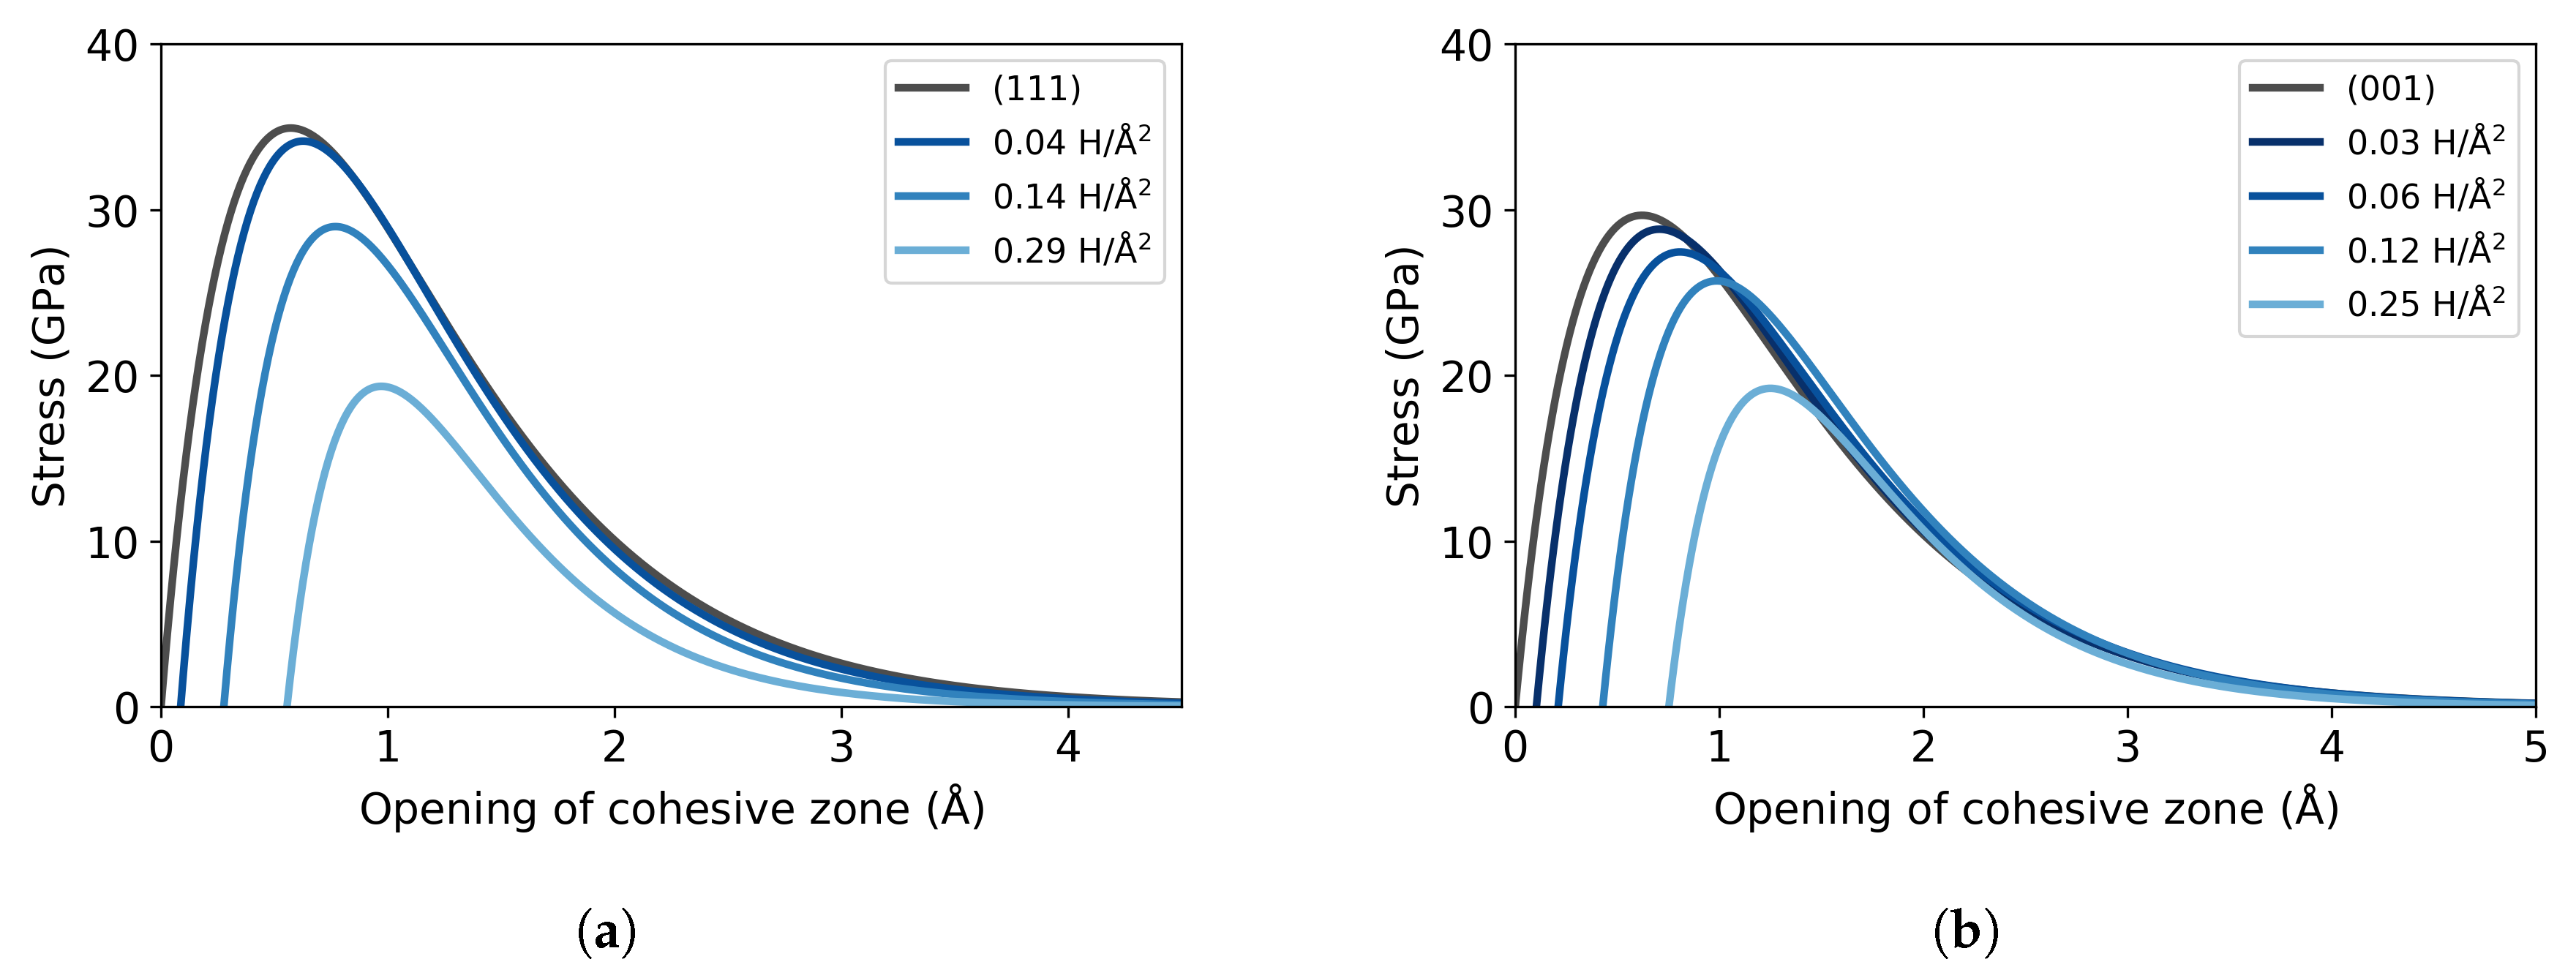
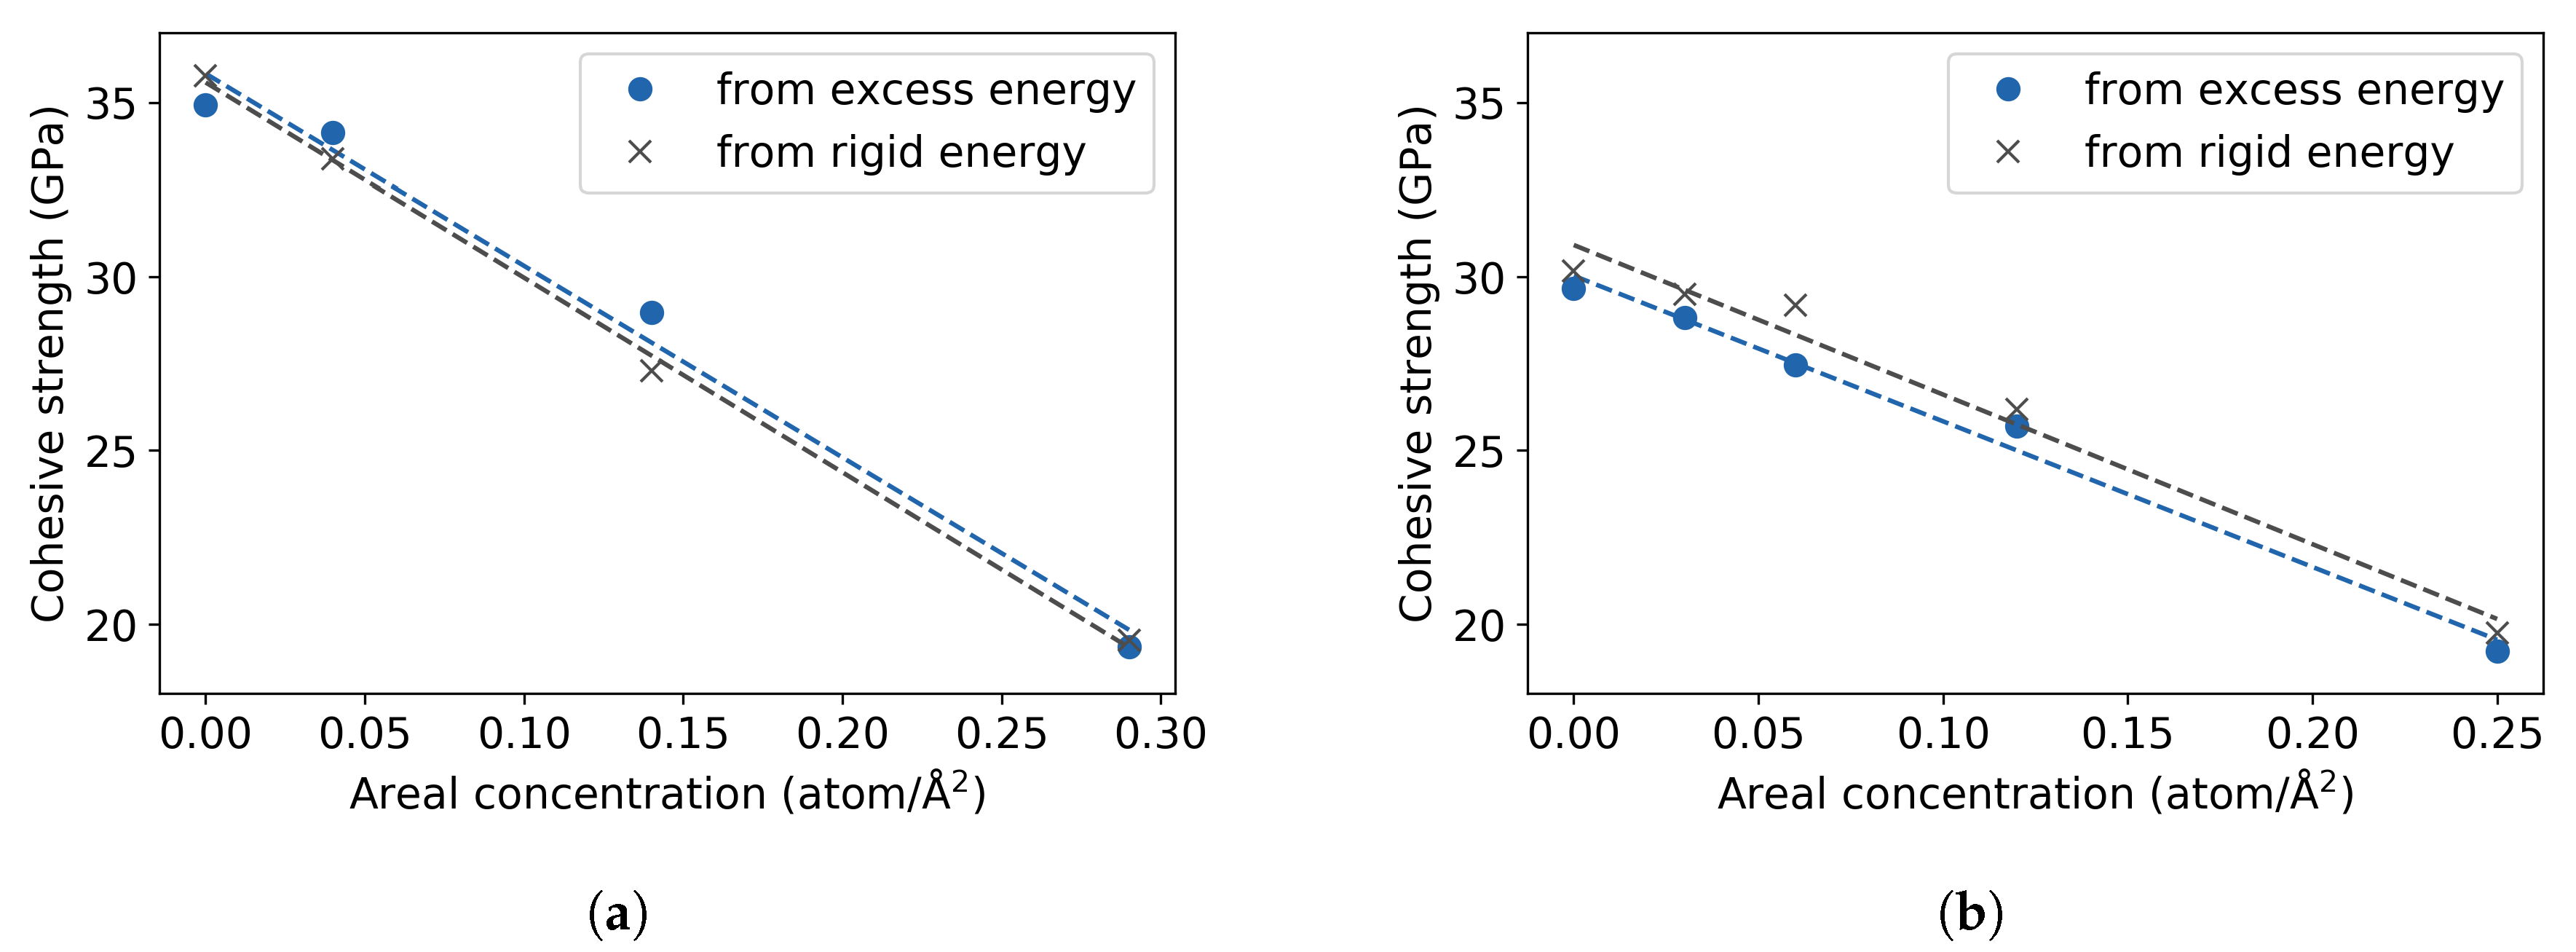
3.2. Fe with H Impurities
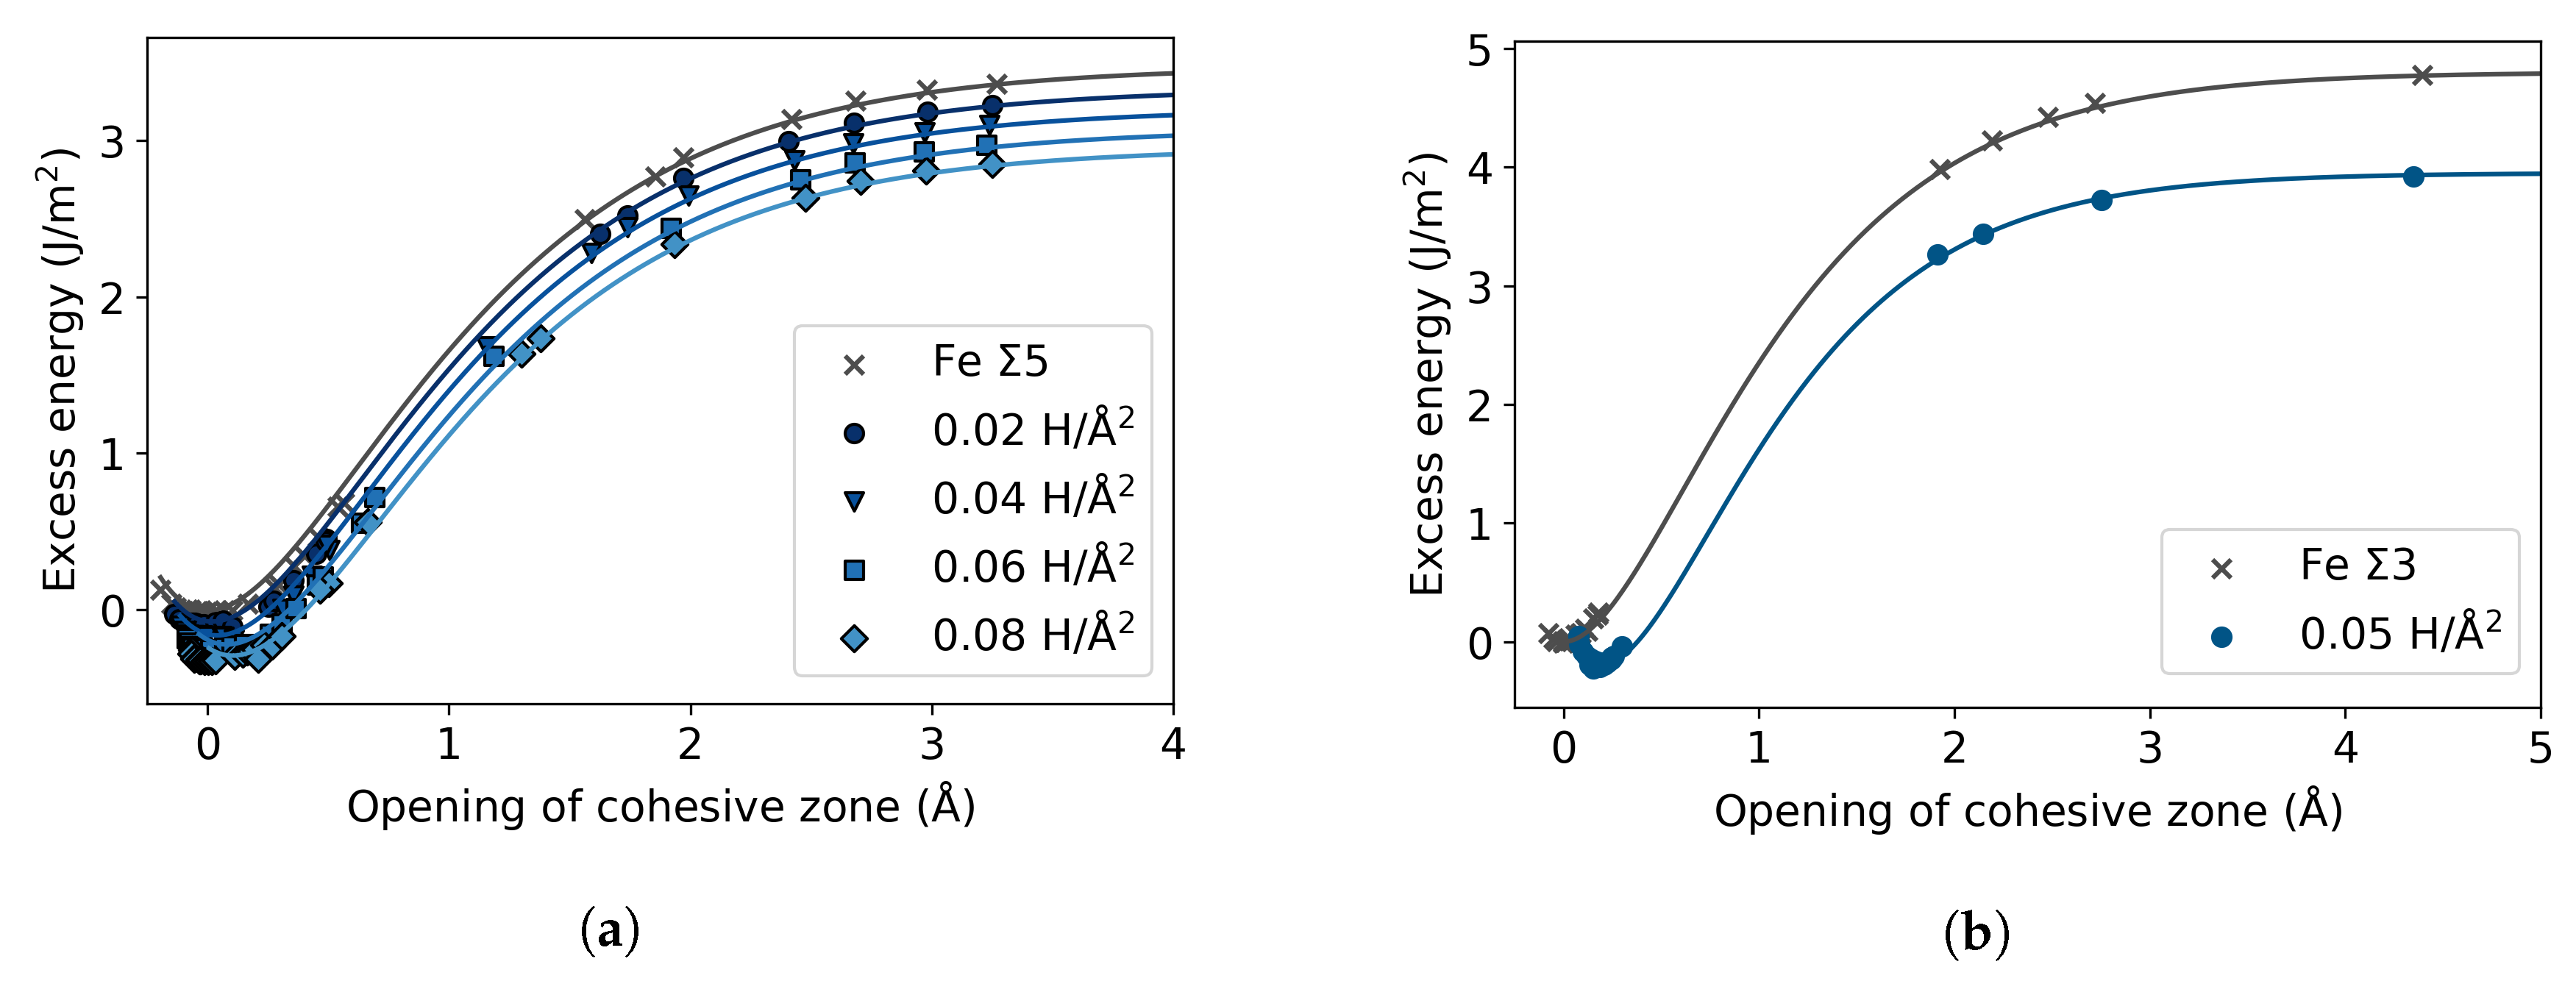
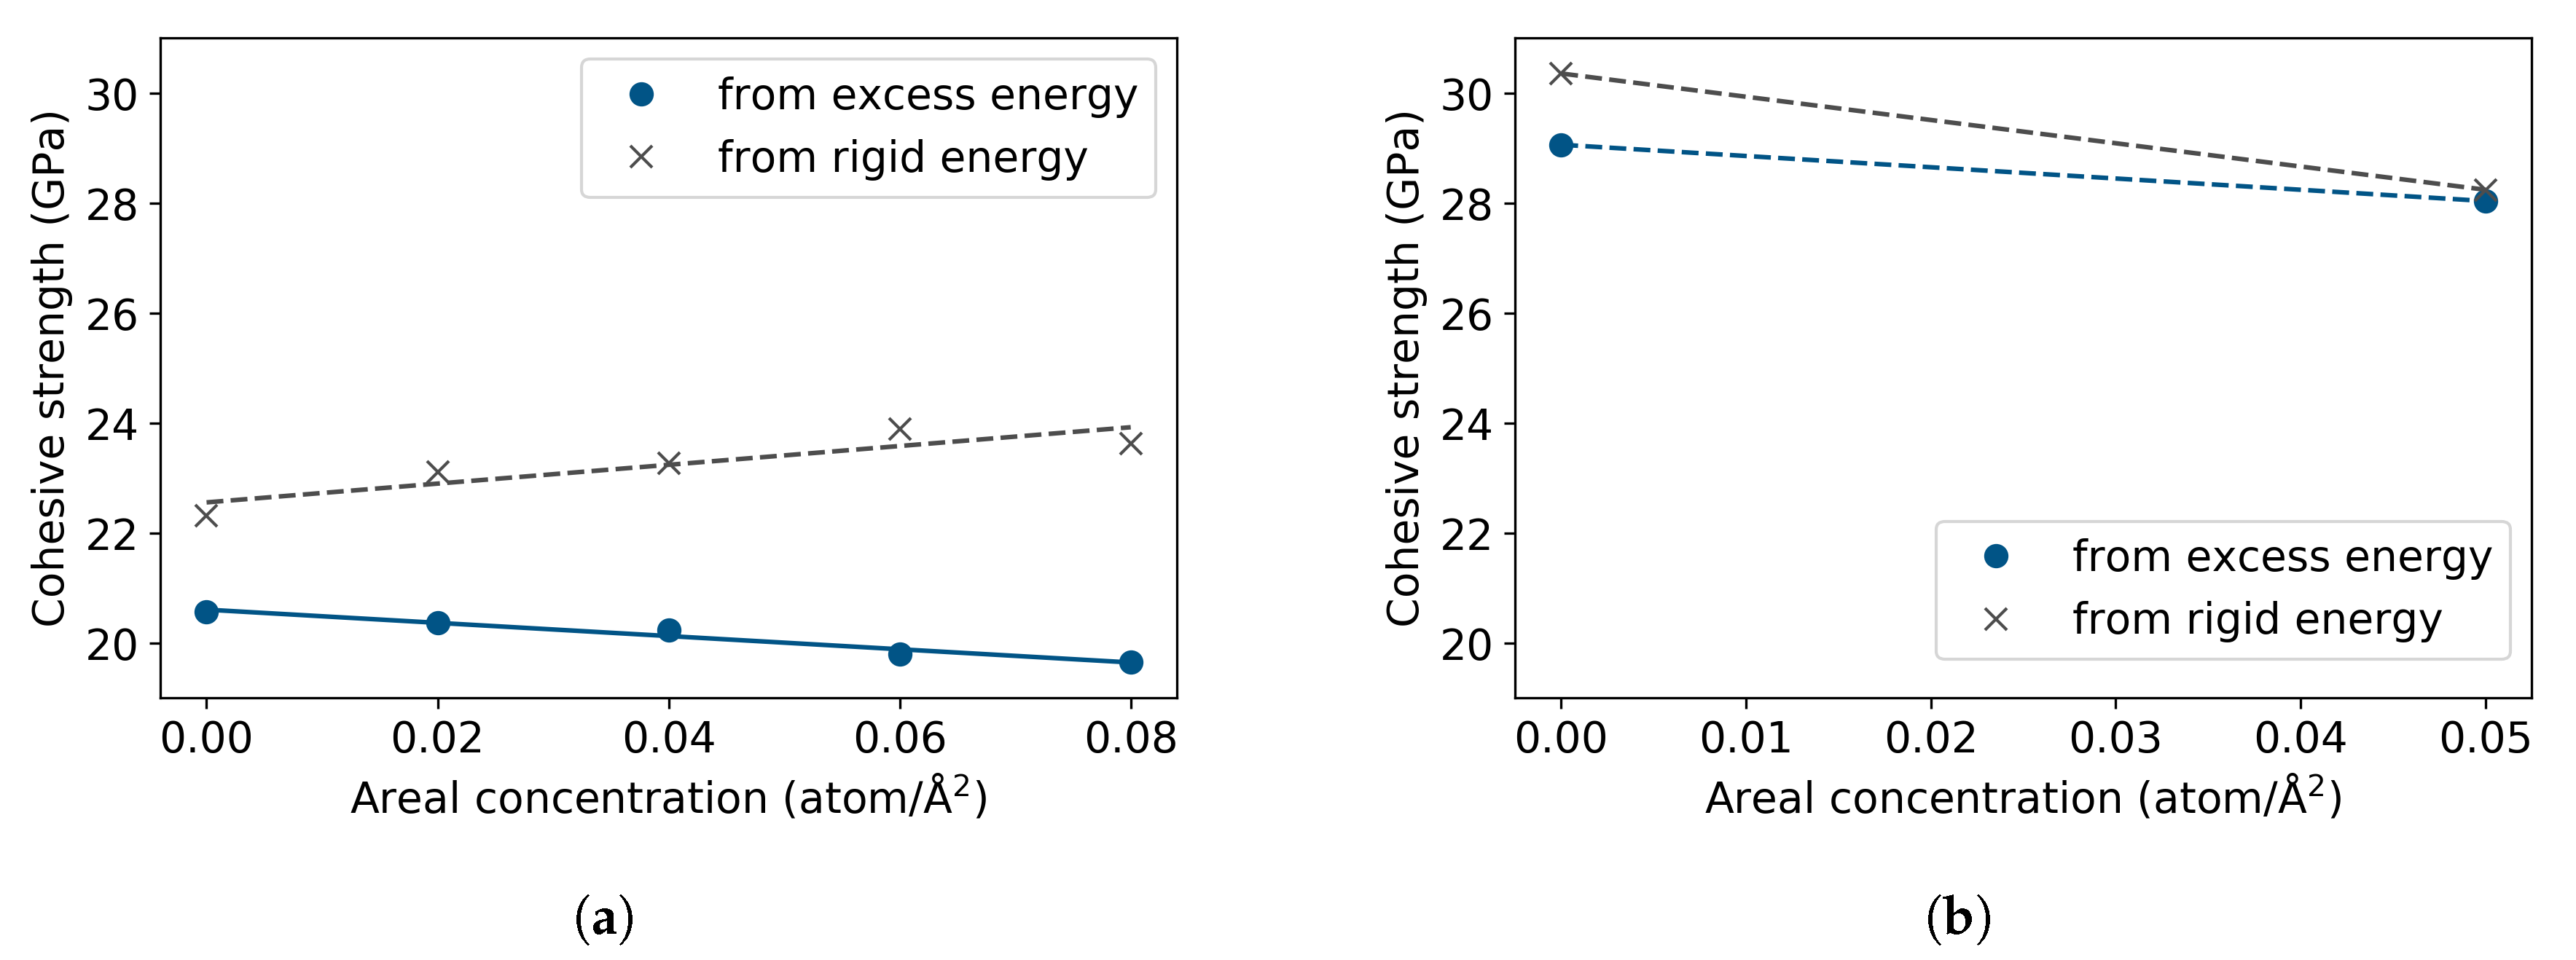
3.3. Fe Grain Boundaries with H Segregation
4. Discussion
5. Conclusions
Author Contributions
Funding
Acknowledgments
Conflicts of Interest
References
- Lynch, S. Hydrogen embrittlement phenomena and mechanisms. Corros. Rev. 2012, 30, 105–123. [Google Scholar] [CrossRef]
- Du, Y.A.; Ismer, L.; Rogal, J.; Hickel, T.; Neugebauer, J.; Drautz, R. First-principles study on the interaction of H interstitials with grain boundaries in α- and γ-Fe. Phys. Rev. B 2011, 84, 1–13. [Google Scholar] [CrossRef]
- Katzarov, I.H.; Paxton, A.T. Hydrogen embrittlement II. Analysis of hydrogen-enhanced decohesion across (111) planes in α-Fe. Phys. Rev. Mater. 2017, 1, 033603. [Google Scholar] [CrossRef] [Green Version]
- Tahir, A.; Janisch, R.; Hartmaier, A. Hydrogen embrittlement of a carbon segregated Σ5(310)[001] symmetrical tilt grain boundary in α-Fe. Mater. Sci. Eng. A 2014, 612, 462–467. [Google Scholar] [CrossRef]
- Momida, H.; Asari, Y.; Nakamura, Y.; Tateyama, Y.; Ohno, T. Hydrogen-enhanced vacancy embrittlement of grain boundaries in iron. Phys. Rev. B 2013, 88, 144107. [Google Scholar] [CrossRef]
- Psiachos, D.; Hammerschmidt, T.; Drautz, R. Ab initio study of the modification of elastic properties of α-iron by hydrostatic strain and by hydrogen interstitials. Acta Mater. 2011, 59, 4255–4263. [Google Scholar] [CrossRef] [Green Version]
- Rice, J.R.; Wang, J.S. Embrittlement of interfaces by solute segregation. Mater. Sci. Eng. A 1989, 107, 23–40. [Google Scholar] [CrossRef]
- Geng, W.T.; Freeman, A.J.; Olson, G.B. Influence of alloying additions on grain boundary cohesion of transition metals: First-principles determination and its phenomenological extension. Phys. Rev. B 2001, 63, 165415. [Google Scholar] [CrossRef]
- Yuasa, M.; Hakamada, M.; Chino, Y.; Mabuchi, M. First-principles Study of Hydrogen-induced Embrittlement in Fe Grain Boundary with Cr Segregation. ISIJ Int. 2015, 55, 1131–1134. [Google Scholar] [CrossRef] [Green Version]
- Tian, Z.X.; Yan, J.X.; Xiao, W.; Geng, W.T. Effect of lateral contraction and magnetism on the energy release upon fracture in metals: First-principles computational tensile tests. Phys. Rev. B 2009, 79, 144114. [Google Scholar] [CrossRef]
- Zhou, X.; Marchand, D.; McDowell, D.L.; Zhu, T.; Song, J. Chemomechanical Origin of Hydrogen Trapping at Grain Boundaries in fcc Metals. Phys. Rev. Lett. 2016, 116, 075502. [Google Scholar] [CrossRef] [PubMed] [Green Version]
- Barenblatt, G. Equilibrium cracks formed during brittle fracture rectilinear cracks in plane plates. J. Appl. Math. Mec. 1959, 23, 1009–1029. [Google Scholar] [CrossRef]
- Enrique, R.A.; Van der Ven, A. Decohesion models informed by first-principles calculations: The ab initio tensile test. J. Mech. Phys. Solids 2017, 107, 494–508. [Google Scholar] [CrossRef]
- Nguyen, O.; Ortiz, M. Coarse-graining and renormalization of atomistic binding relations and universal macroscopic cohesive behavior. J. Mech. Phys. Solids 2002, 50, 1727–1741. [Google Scholar] [CrossRef] [Green Version]
- Van der Ven, A.; Ceder, G. Impurity-induced van der Waals transition during decohesion. Phys. Rev. B 2003, 67, 060101. [Google Scholar] [CrossRef] [Green Version]
- Van der Ven, A.; Ceder, G. The thermodynamics of decohesion. Acta Mater. 2004, 52, 1223–1235. [Google Scholar] [CrossRef]
- Möller, J.; Bitzek, E.; Janisch, R.; ul Hassan, H.; Hartmaier, A. Fracture ab initio: A force-based scaling law for atomistically informed continuum models. J. Mater. Res. 2018, 33, 3750–3761. [Google Scholar] [CrossRef] [Green Version]
- Hirth, J.P.; Rice, J.R. On the thermodynamics of adsorption at interfaces as it influences decohesion. Metall. Trans. A 1980, 11, 1501–1511. [Google Scholar] [CrossRef] [Green Version]
- Mishin, Y.; Sofronis, P.; Bassani, J. Thermodynamic and kinetic aspects of interfacial decohesion. Acta Mater. 2002, 50, 3609–3622. [Google Scholar] [CrossRef]
- Hohenberg, P.; Kohn, W. Inhomogeneous Electron Gas. Phys. Rev. 1964, 136, B864–B871. [Google Scholar] [CrossRef] [Green Version]
- Kohn, W.; Sham, L.J. Self-consistent equations including exchange and correlation effects. Phys. Rev. 1965, 140, A1133–A1138. [Google Scholar] [CrossRef] [Green Version]
- Andric, P.; Curtin, W.A. Atomistic modeling of fracture. Model. Simul. Mater. Sci. Eng. 2019, 27, 013001. [Google Scholar] [CrossRef]
- Černý, M.; Šesták, P.; Rěhák, P.; Všianská, M.; Šob, M. Atomistic approaches to cleavage of interfaces. Model. Simul. Mater. Sci. Eng. 2019, 27, 035007. [Google Scholar] [CrossRef]
- Rose, J.H.; Smith, J.R.; Ferrante, J. Universal features of bonding in metals. Phys. Rev. B 1983, 28, 1835–1845. [Google Scholar] [CrossRef]
- Elsner, B.A.M.; Müller, S. Size effects and strain localization in atomic-scale cleavage modeling. J. Phys. Condens. Matter. 2015, 27, 345002. [Google Scholar] [CrossRef] [PubMed]
- Čák, M.; Šob, M.; Hafner, J. First-principles study of magnetism at grain boundaries in iron and nickel. Phys. Rev. B 2008, 78, 054418. [Google Scholar] [CrossRef]
- Hristova, E.; Janisch, R.; Drautz, R.; Hartmaier, A. Solubility of carbon in α-iron under volumetric strain and close to the Σ5(310)[001] grain boundary: Comparison of DFT and empirical potential methods. Comput. Mater. Sci. 2011, 50, 1088–1096. [Google Scholar] [CrossRef]
- Bhattacharya, S.K.; Tanaka, S.; Shiihara, Y.; Kohyama, M. Ab initio perspective of the <110> symmetrical tilt grain boundaries in bcc Fe: Application of local energy and local stress. J. Mater. Sci. 2014, 49, 3980–3995. [Google Scholar] [CrossRef]
- Scheiber, D.; Pippan, R.; Puschnig, P.; Romaner, L. Ab initio calculations of grain boundaries in bcc metals. Model. Simul. Mater. Sci. Eng. 2016, 24, 035013. [Google Scholar] [CrossRef]
- Wang, J.; Madsen, G.K.H.; Drautz, R. Grain boundaries in bcc-Fe: A density-functional theory and tight-binding study. Model. Simul. Mater. Sci. Eng. 2018, 26, 025008. [Google Scholar] [CrossRef]
- Subramanyam, A.; Azócar Guzmán, A.; Vincent, S.; Hartmaier, A.; Janisch, R. Ab initio study of the combined effects of alloying elements and H on grain boundary cohesion in ferritic steels. Metals 2019, 9, 291. [Google Scholar] [CrossRef] [Green Version]
- Huang, X.; Janisch, R. Partitioning of interstitial segregants during decohesion: A DFT case study of the Σ3 symmetric tilt grain boundary in ferritic steel. Materials 2019, 12, 2971. [Google Scholar] [CrossRef] [Green Version]
- Ochs, T.; Beck, O.; Elsässer, C.; Meyer, B. Symmetrical tilt grain boundaries in body-centred cubic transition metals: An ab initio local-density-functional study. Philos. Mag. A 2000, 80, 351–372. [Google Scholar] [CrossRef]
- Kresse, G.; Hafner, J. Ab initio molecular dynamics for open-shell transition metals. Phys. Rev. B 1993, 48, 13115–13118. [Google Scholar] [CrossRef] [PubMed]
- Kresse, G.; Furthmüller, J. Efficient iterative schemes for ab initio total-energy calculations using a plane-wave basis set. Phys. Rev. B 1996, 54, 11169–11186. [Google Scholar] [CrossRef]
- Blöchl, P.E. Projector augmented-wave method. Phys. Rev. B 1994, 50, 17953–17979. [Google Scholar] [CrossRef] [Green Version]
- Kresse, G.; Joubert, D. From ultrasoft pseudopotentials to the projector augmented-wave method. Phys. Rev. B 1999, 59, 1758–1775. [Google Scholar] [CrossRef]
- Perdew, J.P.; Burke, K.; Ernzerhof, M. Generalized gradient approximation made simple. Phys. Rev. Lett. 1996, 77, 3865–3868. [Google Scholar] [CrossRef] [Green Version]
- Pack, J.D.; Monkhorst, H.J. Special points for Brillouin-zone integrations. Phys. Rev. B 1977, 16, 1748–1749. [Google Scholar] [CrossRef]
- Methfessel, M.; Paxton, A.T. High-precision sampling for Brillouin-zone integration in metals. Phys. Rev. B 1989, 40, 3616–3621. [Google Scholar] [CrossRef] [Green Version]
- Spencer, M.J.; Hung, A.; Snook, I.K.; Yarovsky, I. Further studies of iron adhesion: (111) surfaces. Surf. Sci. 2002, 515, L464–L468. [Google Scholar] [CrossRef]
- Allen, N.P.; Hopkins, B.E.; McLennan, J.E.; Bullard, E.C. The tensile properties of single crystals of high-purity iron at temperatures from 100 to −253 °C. Proc. R. Soc. A 1956, 234, 221–246. [Google Scholar] [CrossRef]
- Friák, M.; Sob, M.; Vitek, V. Ab initio calculation of tensile strength in iron. Philos. Mag. 2003, 83, 3529–3537. [Google Scholar] [CrossRef]
- Clatterbuck, D.M.; Chrzan, D.C.; Morris, J.W. The inherent tensile strength of iron. Philos. Mag. Lett. 2002, 82, 141–147. [Google Scholar] [CrossRef]
- Rycroft, C.H. VORO++: A three-dimensional Voronoi cell library in C++. Chaos 2009, 19, 041111. [Google Scholar] [CrossRef] [Green Version]


| GB Structure | γGB (J/m2) | Excess Length (Å) |
|---|---|---|
| Σ5(310)[001] | 1.58 | 0.31 |
| Σ3(112)[10] | 0.43 | 0.16 |
| Structure | ΔEcohesive (J/m2) | ΔEchem (J/m2) | ΔEmech (J/m2) |
|---|---|---|---|
| (001) | −0.28 | −0.19 | −0.09 |
| (111) | −0.22 | −0.18 | −0.04 |
| Σ3(112)[10] | −0.68 | −0.57 | −0.11 |
| Σ5(310)[001] | −0.15 | −0.16 | 0.01 |
Publisher’s Note: MDPI stays neutral with regard to jurisdictional claims in published maps and institutional affiliations. |
© 2020 by the authors. Licensee MDPI, Basel, Switzerland. This article is an open access article distributed under the terms and conditions of the Creative Commons Attribution (CC BY) license (http://creativecommons.org/licenses/by/4.0/).
Share and Cite
Guzmán, A.A.; Jeon, J.; Hartmaier, A.; Janisch, R. Hydrogen Embrittlement at Cleavage Planes and Grain Boundaries in Bcc Iron—Revisiting the First-Principles Cohesive Zone Model. Materials 2020, 13, 5785. https://doi.org/10.3390/ma13245785
Guzmán AA, Jeon J, Hartmaier A, Janisch R. Hydrogen Embrittlement at Cleavage Planes and Grain Boundaries in Bcc Iron—Revisiting the First-Principles Cohesive Zone Model. Materials. 2020; 13(24):5785. https://doi.org/10.3390/ma13245785
Chicago/Turabian StyleGuzmán, Abril Azócar, Jeongwook Jeon, Alexander Hartmaier, and Rebecca Janisch. 2020. "Hydrogen Embrittlement at Cleavage Planes and Grain Boundaries in Bcc Iron—Revisiting the First-Principles Cohesive Zone Model" Materials 13, no. 24: 5785. https://doi.org/10.3390/ma13245785