Thermal Decomposition of Nanostructured Bismuth Subcarbonate

1
School of Minerals Processing and Bioengineering, Central South University, Changsha 410083, China
2
Key Laboratory for Mineral Materials and Application of Hunan Province, Central South University, Changsha 410083, China
*
Author to whom correspondence should be addressed.
Materials 2020, 13(19), 4287; https://doi.org/10.3390/ma13194287
Submission received: 31 August 2020
/
Revised: 19 September 2020
/
Accepted: 23 September 2020
/
Published: 25 September 2020
Abstract
:Nanostructured (BiO)2CO3 samples were prepared, and their thermal decomposition behaviors were investigated by thermogravimetric analysis under atmospheric conditions. The method of preparation and Ca2+ doping could affect the morphologies of products and quantity of defects, resulting in different thermal decomposition mechanisms. The (BiO)2CO3 nanoplates decomposed at 300–500 °C with an activation energy of 160–170 kJ/mol. Two temperature zones existed in the thermal decomposition of (BiO)2CO3 and Ca-(BiO)2CO3 nanowires. The first one was caused by the decomposition of (BiO)4(OH)2CO3 impurities and (BiO)2CO3 with surface defects, with an activation energy of 118–223 kJ/mol, whereas the second one was attributed to the decomposition of (BiO)2CO3 in the core of nanowires, with an activation energy of 230–270 kJ/mol for the core of (BiO)2CO3 nanowires and 210–223 kJ/mol for the core of Ca-(BiO)2CO3 nanowires. Introducing Ca2+ ions into (BiO)2CO3 nanowires improved their thermal stability and accelerated the decomposition of (BiO)2CO3 in the decomposition zone.
1. Introduction
Ternary bismuth-containing compounds have attracted remarkable attention owing to their desirable properties [1,2,3,4,5,6,7]. In particular, (BiO)2CO3 has a typical Sillén structure and very high stability at oxidizing environments, wherein the Bi–O layers and CO32− layers are intergrown with a plane of the CO32− group orthogonal to the Bi–O layer [8]. Given its unique layered structure, suitable band gap, and high stability, (BiO)2CO3 is a promising candidate for photocatalysts [9,10,11], antimicrobial agents [12], cholesterol biosensors [13], and humidity sensors [14]. However, (BiO)2CO3 has a considerably high density, resulting in a relatively lower specific surface area than other photocatalysts or antimicrobial agents. Thus, uniformly dispersing (BiO)2CO3 during its practical application and ensuring sufficient contact with targets are difficult. Moreover, the band gap of (BiO)2CO3, which depends on its morphology and size distribution, is the most important parameter in the photocatalytic field [15]. The smaller the size, the narrower the band gap. For instance, (BiO)2CO3 nanotubes with an average diameter of 7 nm possess a band gap of 3.00 eV, whereas (BiO)2CO3 nanoplates with a thickness of 70–80 nm have a band gap of 3.39 eV [16]. The most common method of increasing specific surface area and decreasing band gap is to prepare nanoscale (BiO)2CO3 materials. Zhao et al. reported that the BET specific surface area and band gap of (BiO)2CO3 powders vary along the (BiO)2CO3 morphologies [17]. For example, the BET specific surface area and band gap of sponge-like microspheres are 43.99 m2/g and 2.87 eV, respectively; however, the corresponding values for plate-like microspheres are 38.86 m2/g and 3.34 eV.
Nanomaterials generally possess poor thermal stability compared to their bulk counterparts because of their high specific surface area, quantities of active sites, and large velocity of mass and heat transfer presented at the reaction interface. Thermal performance is an important property for practical storage and application of nanomaterials [18]. Investigating the thermal stability and thermal decomposition kinetics is important for the deeper understanding of the Bi2O2CO3 structure and its practical application. Recently, studies about the thermal treatment of Bi2O2CO3 have been reported. For instance, Pan’s work found that Bi2O2CO3 nanoflowers decomposed to form Bi2O3/Bi2O2.33@Bi2O2CO3 composites slowly in air [19]. Another work showed that the α-Bi2O3/(BiO)2CO3 heterojunction nanoplate could be obtained by in situ thermal treatment of (BiO)2CO3 nanoplates [20]. Moreover, β- and α-phase porous Bi2O3 microspheres have been synthesized by thermal treatment of Bi2O2CO3 microspheres in an air atmosphere [21]. However, the thermal decomposition kinetics of nanostructured (BiO)2CO3 is rarely reported.
The present work aimed to investigate the effect of structure, preparation method, and doping on the thermal performance and decomposition kinetics of nanostructured (BiO)2CO3. Thus, (BiO)2CO3 samples were prepared, and their thermal decomposition behaviors were investigated in detail by thermogravimetric analysis under atmospheric conditions.
2. Materials and Methods
2.1. Materials
Na2CO3, NaCl, and CaCl2 (Analytical grade, Xilong Chemical Co., Ltd., Guangdong, China), were used without further purification. β-Bi2O3 powders were obtained from Changde Fine Chemical Co. Ltd. (Hunan, China).
2.2. Preparation and Characterization of Bismuth Carbonate
In a typical synthesis procedure of (BiO)2CO3 nanowires (marked as BCO), NaCl (2.338 g) and Na2CO3 (0.212 g) were dissolved in 70 mL of deionized water. The pH of the solution was adjusted to 3.0 using 1 M HCl solution, and then β-Bi2O3 powders (0.932 g) were added into the solution. The mixture was then transferred into a 100 mL Teflon-lined stainless-steel autoclave, magnetically stirred at 160 °C for 6 h, and subsequently cooled to room temperature. Products were collected by filtration, washed with deionized water and ethanol several times, and dried overnight at 60 °C. Ca–(BiO)2CO3 nanowires (marked as Ca–BCO) were prepared through adding 0.022 g of CaCl2 during the synthesis of (BiO)2CO3 nanowires. For comparison, (BiO)2CO3 nanoplates (marked as C–BCO) were prepared using Bi(NO3)3∙5H2O and Na2CO3 in the following procedure: Bi(NO3)3∙5H2O (0.96 g) was first dissolved in dilute HNO3 (1 M, 5 mL) under continuous stirring. Once the above solution became clear, it was added dropwise to an aqueous solution of Na2CO3 (0.2 M, 50 mL), and plenty of white precipitates formed. The suspension was further stirred for 30 min at 55 °C. The products were collected, washed with deionized water, and dried overnight at 60 °C.
The crystal phase and composition of as-prepared products were analyzed using an X-ray powder diffractometer (XRD: D/max 2550, Rigaku, Tokyo, Japan) with Cu-Kα irradiation (λ = 0.1548 nm) at a scanning step of 10°/min at 10–70° (2θ). Field emission scanning electron microscopy (FE-SEM: FEI Nova NanoSEM 230, with an accelerating voltage of 10 kV), transmission electron microscopy (TEM), and high-resolution TEM (HRTEM) were used to characterize the morphology, structure, and grain size of the obtained products. The thermal stability was examined through thermogravimetric (TG) analysis using a Netzsch STA 449C thermo-analyzer (Netzsch, Selb, Germany) with heating rates of 5, 10, 15, and 20 °C/min from 40 to 700 °C under atmospheric conditions.
2.3. Thermal Decomposition Kinetics Model
Thermal decomposition kinetics of all samples was studied based on the TG data. Equation (1) is the basic kinetics equation [22].
where A and Ea are the pre-exponential factor and the apparent activation energy, respectively, T is the temperature, α is the extent of conversion, n is the reaction order, β is the heating rate, and R is the gas constant.
Obviously, Equation (1) does not have an analytical solution independently. Many works have been done to obtain reasonable kinetic parameters, including differential methods and integral methods. Among a number of differential methods, the widest used one is the Kissinger equation [23,24,25]. In this case, the activation energy is calculated from the Tmax where the maximum decomposition rate occurs at different heating rates. The maximum decomposition rate occurs when dα/dt = 0. Thus, differentiating Equation (1) with respect to time and equating the resulting expression to zero lead to the following equation:
Kissinger assumed the product of = 1 and that it is independent of the heating rate. In such a case, the logarithmic expression of Equation (2) can be written:
Thus, the activation energy can be computed from the linear dependence of ln(β/Tmax2) on 1/Tmax at various heating rates.
Among all the integral methods, the relative accurate approximation by Murray and White yields the Kissinger–Akahira–Sunose equation [22,26]:
where C is a constant at a given conversion, α. Thus, at a given heating rate β, one can find a particular α and a corresponding temperature T. At a given α, by varying β, one can find the corresponding T that is a function of β. Hence, if a plot of ln(β/T2) versus 1/Tα is linear, the activation energy Ea can be calculated from the slope of Ea/R.
3. Results
3.1. Characterization of (BiO)2CO3 Samples
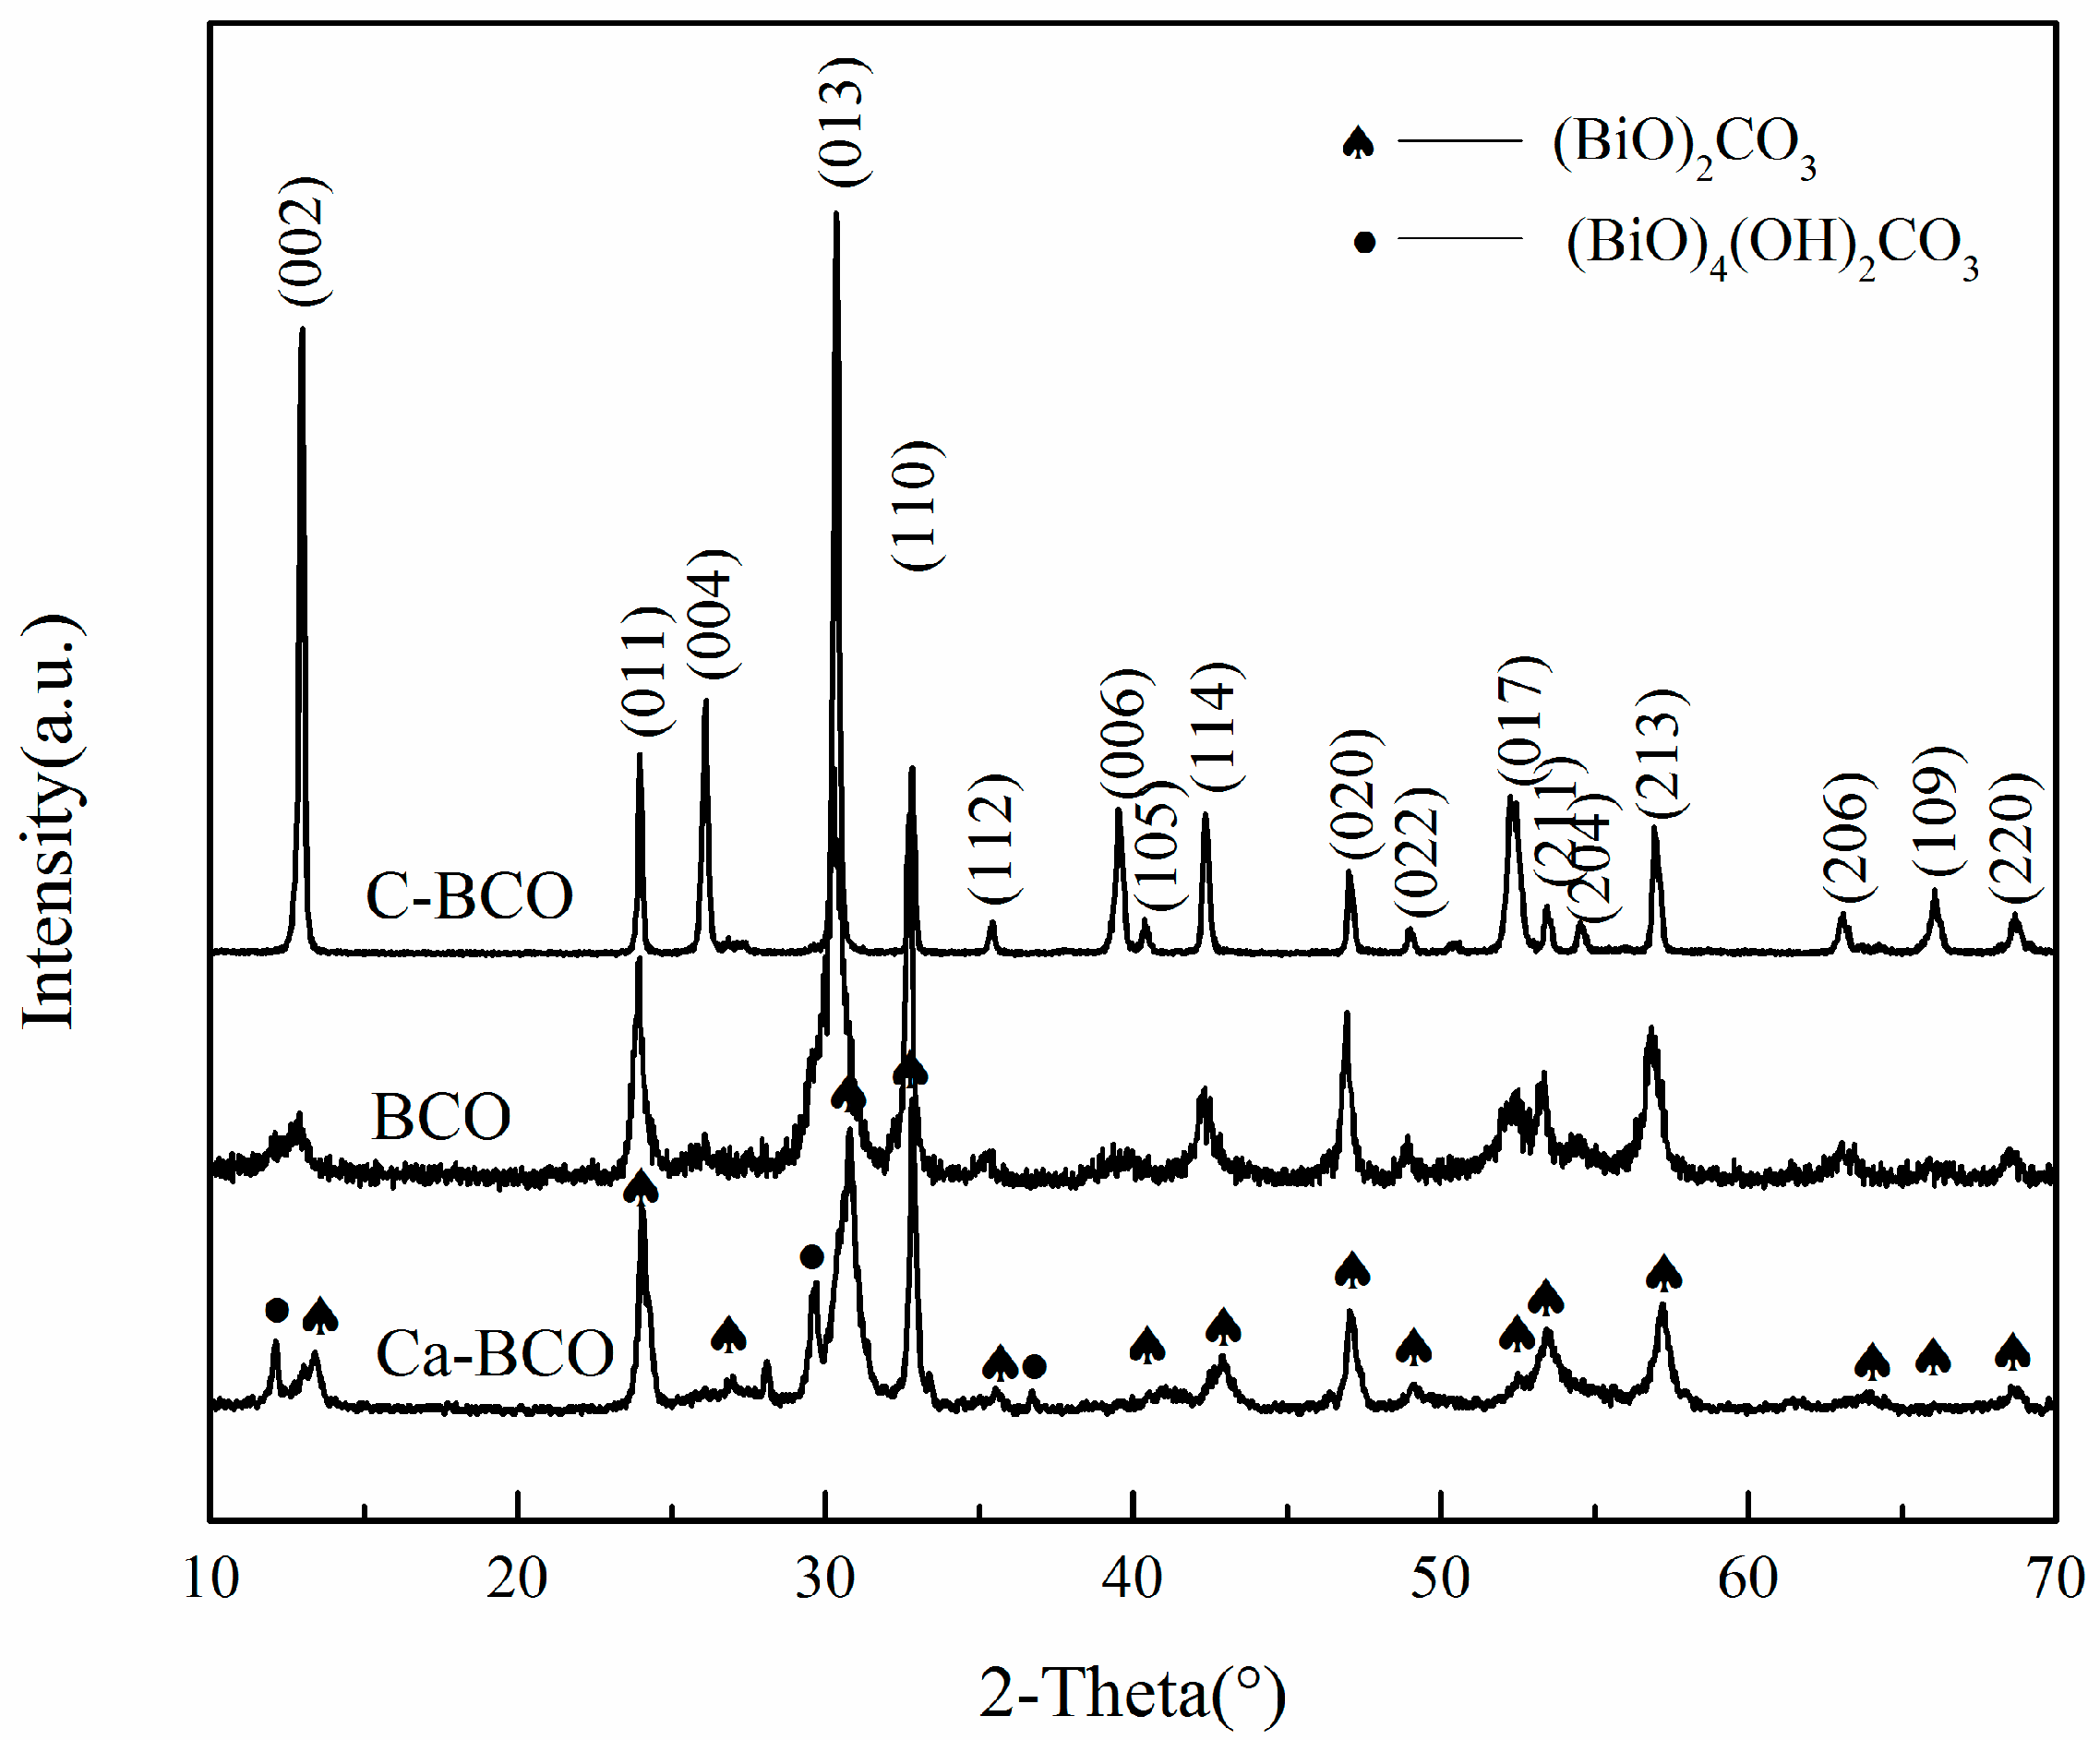
Figure 1 shows the XRD patterns of the as-prepared (BiO)2CO3 nanoplates, nanowires, and Ca–(BiO)2CO3 nanowires. All diffraction peaks of the (BiO)2CO3 sample obtained from Bi(NO3)3∙5H2O (marked C–BCO) could be readily indexed to an orthorhombic (BiO)2CO3 with cell parameters a = 3.865 Å, b = 3.862 Å, and c = 13.675 Å (ICDD Card No. 97–009–4740). No peaks of impurities were observed, indicating the high phase purity of products. As for (BiO)2CO3 nanowires without the addition of CaCl2, all the main diffraction peaks could also be indexed to (BiO)2CO3 (marked as BCO). However, the diffraction intensity was much weaker than that of C–BCO, suggesting that the as-prepared nanowires had a poor crystallinity. Two additional peaks were ascribed to the (BiO)4(OH)2CO3 phase emerged at 2θ ≈ 12.2 and 29.7 (ICDD Card No. 00–038–0579) [27]. Moreover, the (002), (004), and (006) crystallographic planes of the as-prepared product presented broader diffraction peaks compared to the counterparts of C–BCO, which could result from a smaller size along the c-axis. By contrast, when CaCl2 was added in the reaction solution, additional diffraction peaks belonging to (BiO)4(OH)2CO3 at 2θ = 12.208, 29.718, and 36.788 (marked as solid circles) were clearly observed in addition to characteristic peaks of the pure (BiO)2CO3 phase. In addition, (002), (011), and (013) crystallographic planes ascribed to orthorhombic (BiO)2CO3 shifted to a high angle, suggesting that their corresponding d-value decreased and lattice distortion occurred because Ca2+ ions were introduced into the (BiO)2CO3 crystal.
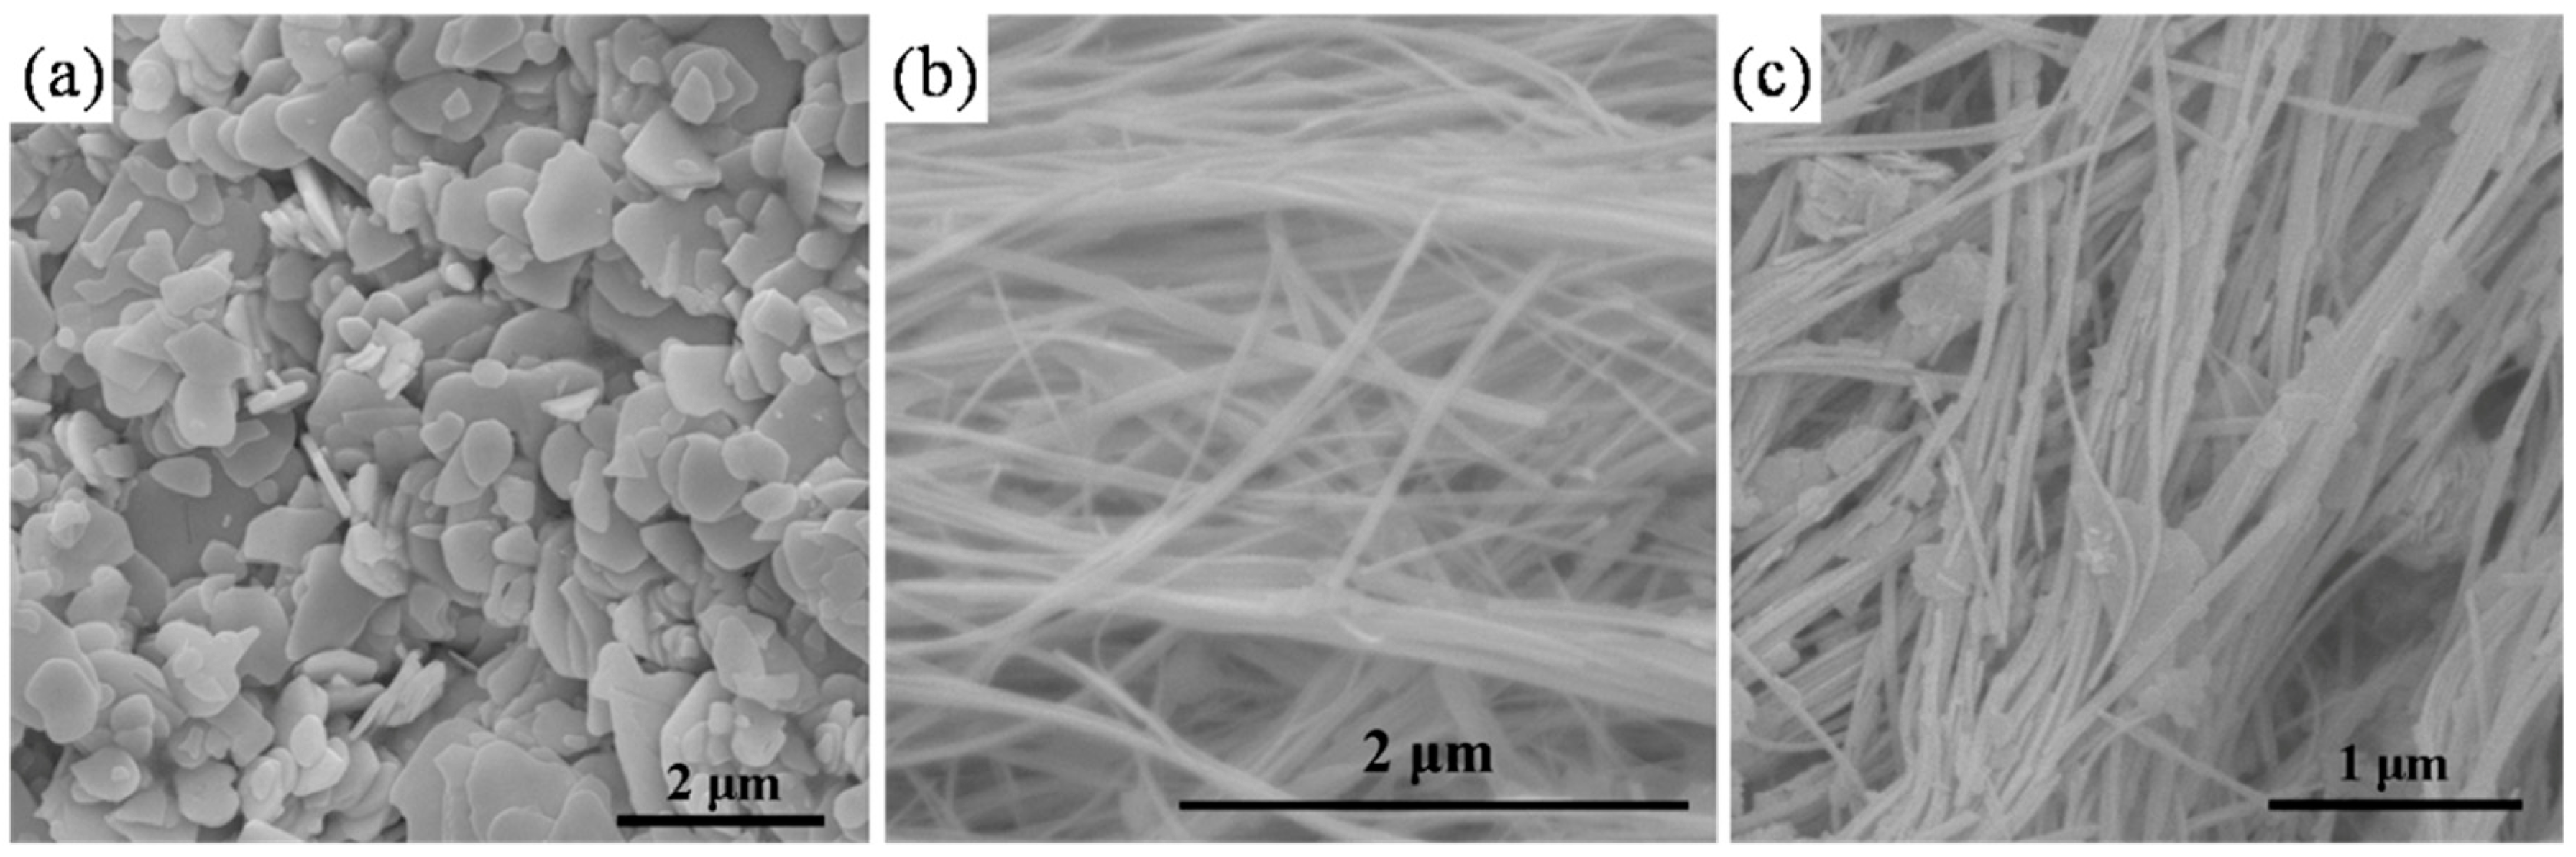
The morphologies of the obtained samples were characterized by SEM (shown in Figure 2). Figure 2a shows that nanoplates obtained from Bi(NO3)3∙5H2O were of different size ranges, 0.5–1.5 μm in width and approximately 100 nm in thickness. Figure 2b, on the other hand, shows that the pure (BiO)2CO3 samples from the hydrothermal method were wire-like nanostructures with a length of tens of micrometers. When Ca2+ ions were added into the synthesis system, the main morphologies of Ca–(BiO)2CO3 remained as a wire-like shape, along with a few nanoplates (Figure 2c).
3.2. Thermal Decomposition Characteristics of Nanostructured (BiO)2CO3
Characteristic temperatures of all samples at every heating rate were determined from the TG and DTG (derivative thermogravimetric analysis) curves (TG–DTG curves are shown in Figures S1–S3). The extrapolated onset temperature of decomposition was obtained by extrapolating the slope of the DTG curve down to the zero level of the DTG axis. The peak temperature was determined using the DTG peak where the maximum decomposition rate was obtained. Obvious differences were presented among the TG-DTG curves of C-BCO, BCO, and Ca-BCO. Two mass loss zones appeared in TG curves of BCO and Ca-BCO while one mass loss zone existed on that of C-BCO. Table 1 lists TG results of three samples.
Results showed that the peak temperature increased with increasing heating rate (Table 1). Only one mass loss range between approximately 320 and 520 °C existed on each TG–DTG curve of C–BCO, indicating that the phase transformation from (BiO)2CO3 to Bi2O3 occurred according to the mass loss of 8.33%, which was 8.62% theoretically. The decomposition equation is as follows:
For the as-prepared BCO and Ca–BCO, each one has two similar and independent mass loss zones. The first zone between approximately 200 and 380 °C was caused by the decomposition of (BiO)4(OH)2CO3 impurities and defects on the surface of nanowires. The second zone occurred between approximately 380 and 600 °C because of the decomposition reaction of (BiO)2CO3 in the core of nanowires. When the temperature exceeded 600 °C, the residual weight changed slightly. The thermal decomposition route was summarized in the following reaction sequence [28,29]:
Comparing the peak temperature of C–BCO with those of BCO and Ca–BCO in the second mass loss zone at the same heating rate, the peak temperature was found to increase in the order of C–BCO < BCO < Ca–BCO, indicating an improvement in the thermal stability of nanostructured (BiO)2CO3. Given that C-BCO was prepared by a co-precipitation method under 55 °C, while BCO and Ca-BCO were prepared by a hydrothermal method under 160 °C, it is believed that the high temperature and pressure are beneficial to the formation of stable (BiO)2CO3. Correspondingly, the peak temperature of BCO is lower than that of Ca–BCO in the first mass loss zone, indicating that introducing Ca2+ ions improved the stability of surface (BiO)2CO3 nanowires.
3.3. Thermal Decomposition Kinetics
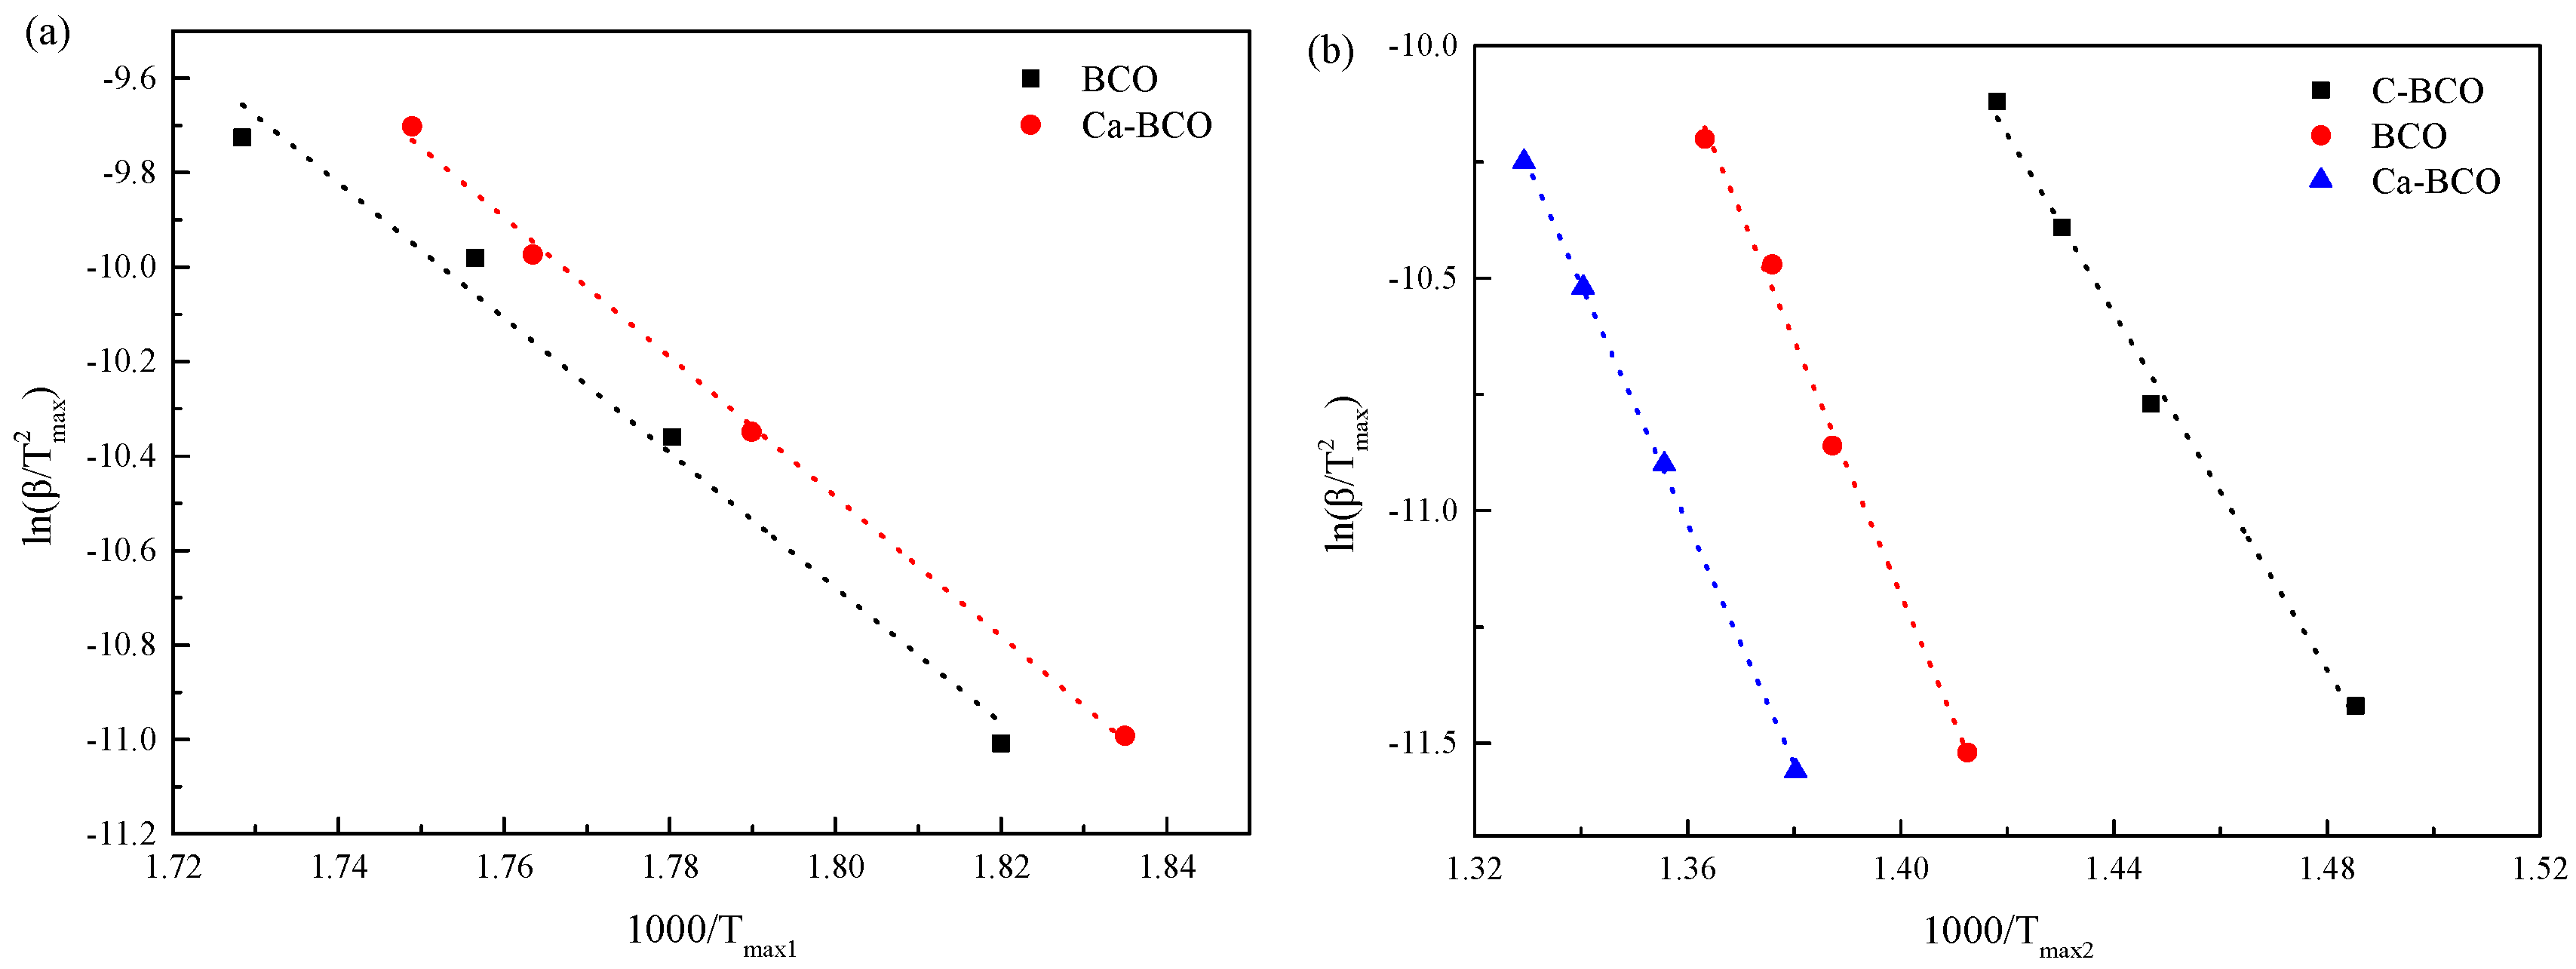
Figure 3 shows the plots based on Kissinger’s method for the first mass loss zones of as-prepared nanowires (Figure 3a), and the main mass loss zones of three nanostructured (BiO)2CO3 samples (Figure 3b). The slopes of dotted lines drawn through these plots equal Ea/R such that activation energies Ea were determined. The calculated apparent energies are listed in Table 2.
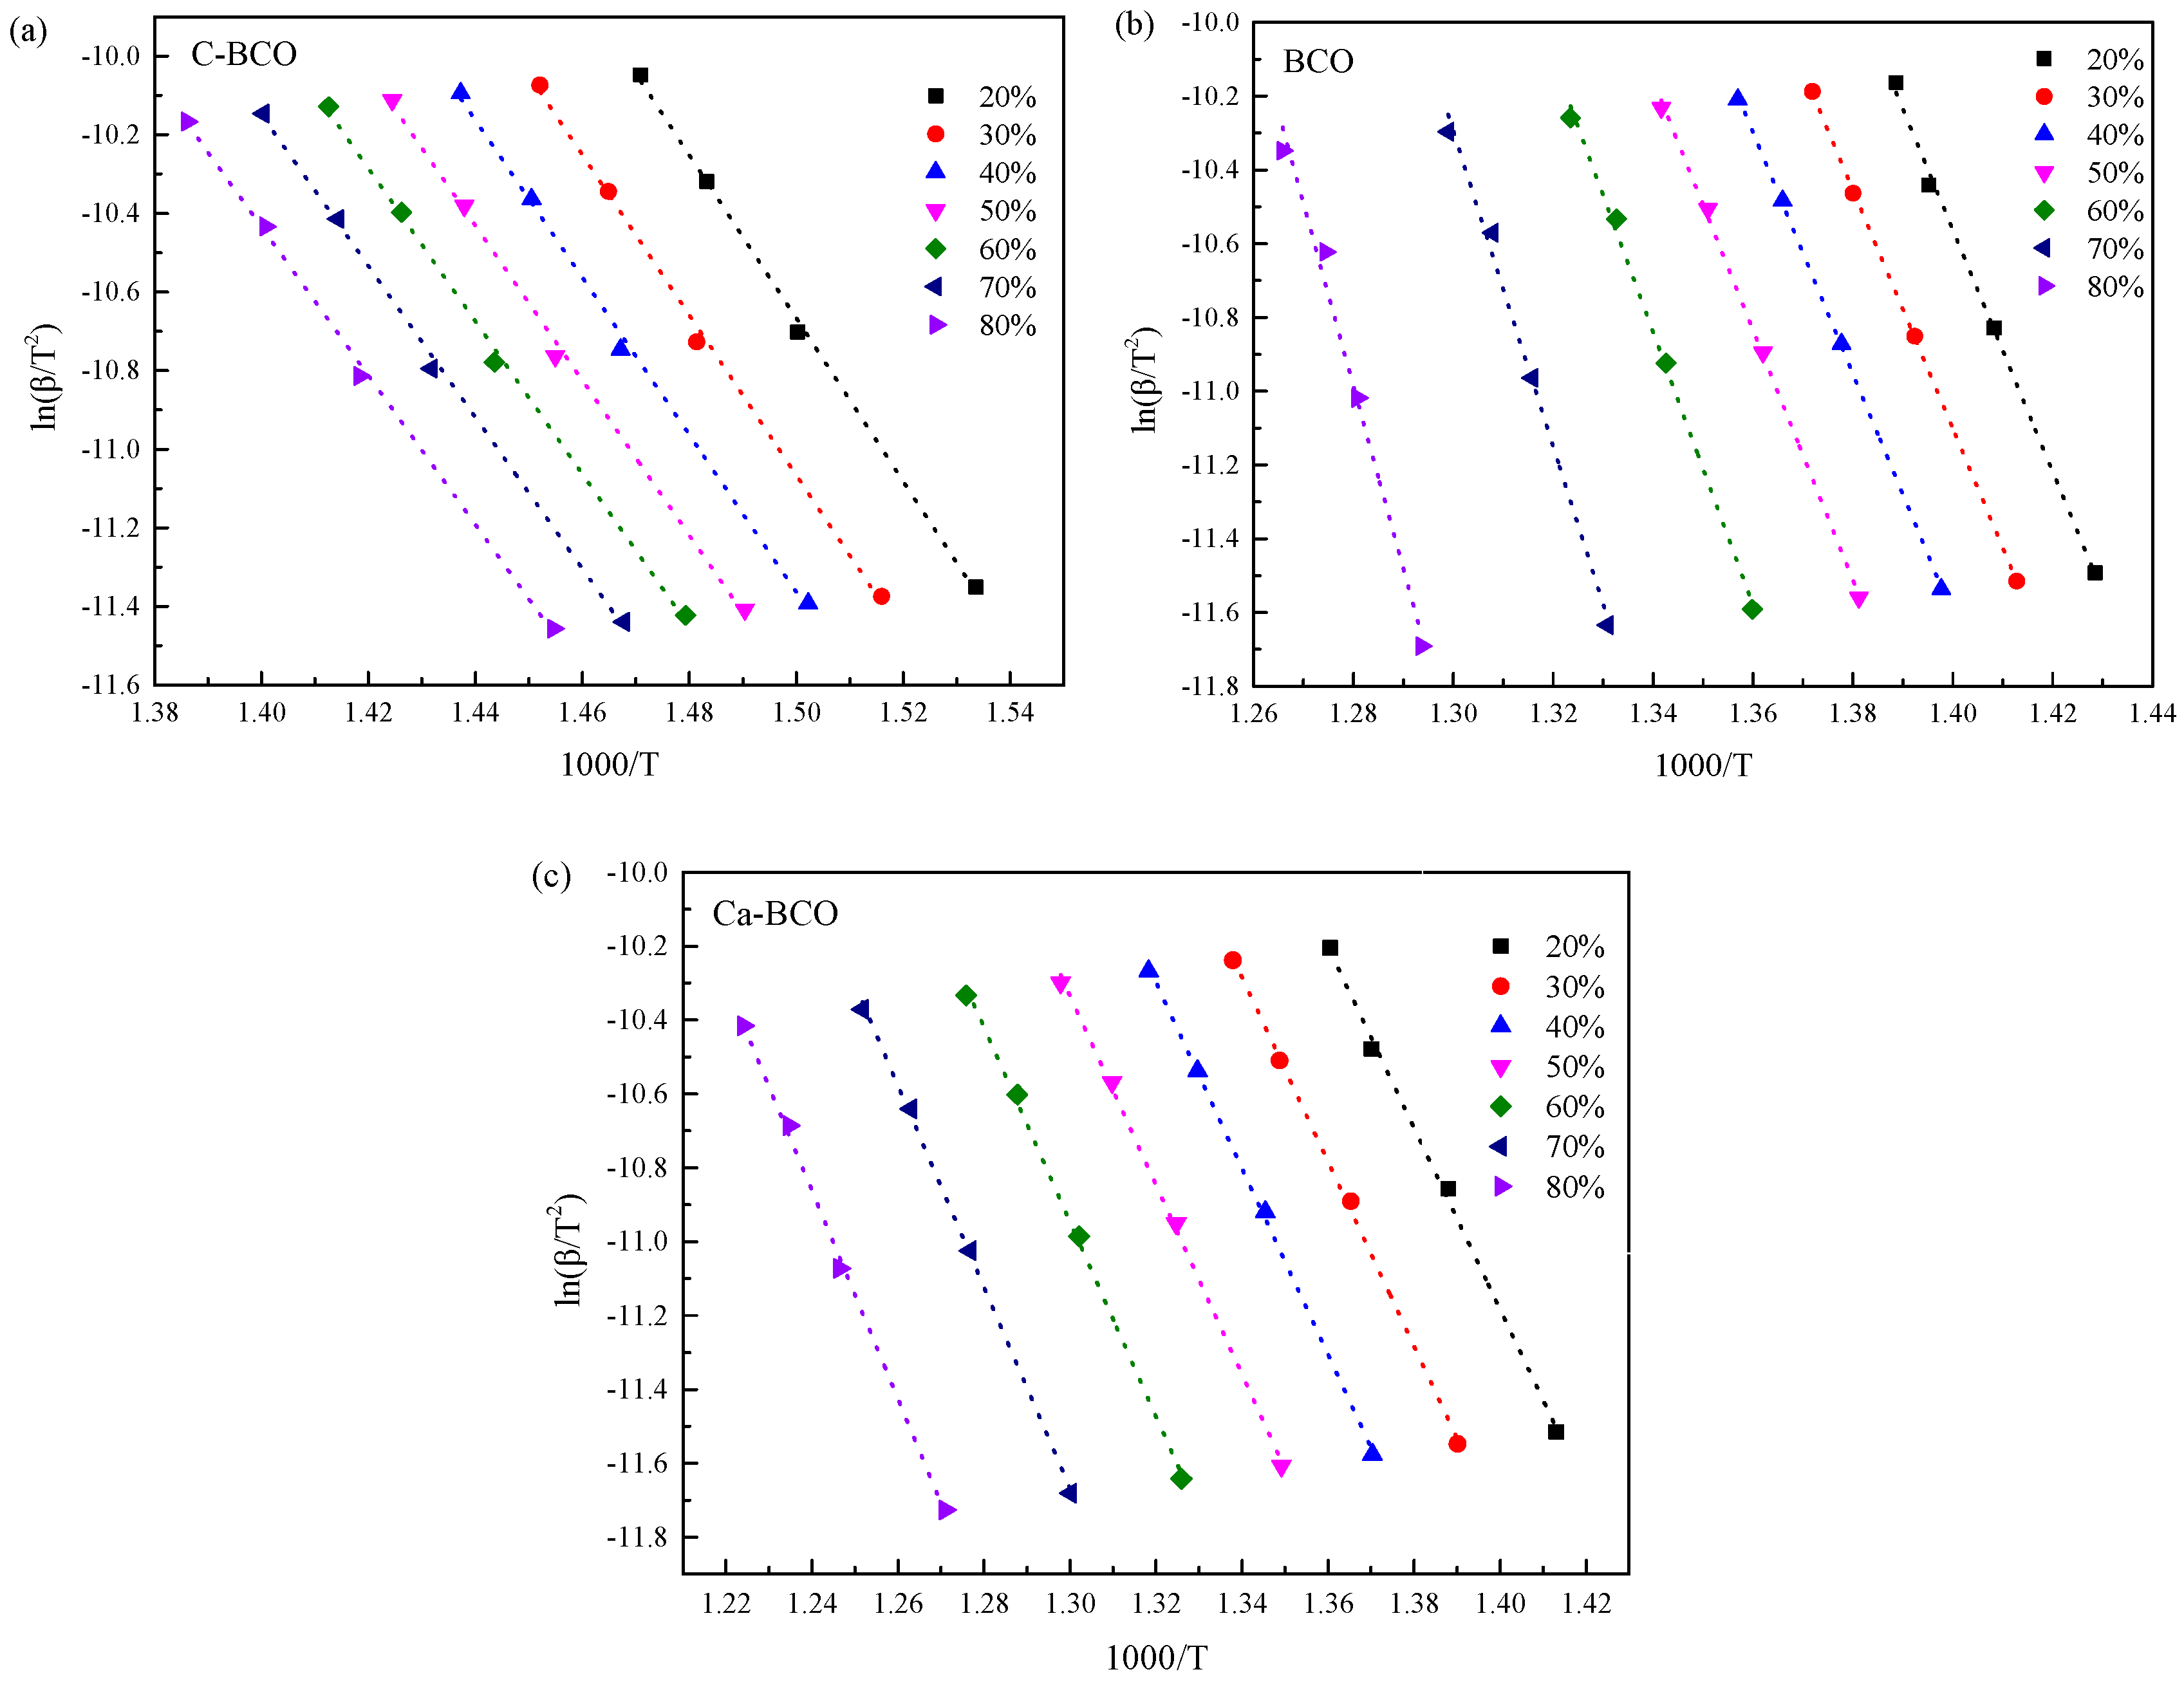
Considering that Kissinger’s method is a special case in determining Ea, it may not display the overall trend of Ea. The activation energies of thermal decomposition for nanostructured (BiO)2CO3 samples were also studied using the Kissinger–Akahira–Sunose method. ln(β/T2) was plotted against 1000/T for the first mass loss zone and the main mass loss zone according to Equation (4) in Figure 4 and Figure 5, respectively, to obtain Ea. Each fitted line in Figure 4 and Figure 5 should be straight and parallel to each other in order to give a constant activation energy Ea. However, all curves in Figure 4 are approximately parallel with each other, but are not straight lines, especially for the lower conversions. This behavior indicates that the as-prepared samples underwent a complicated thermal decomposition process. On the one hand, the aforementioned XRD results demonstrated that (BiO)4(OH)2CO3 impurities emerged in the as-prepared BCO and Ca-BCO samples, which decomposed into Bi4O5CO3 and H2O between 230 and 325 °C, and then Bi4O5CO3 decomposed into Bi2O3 and CO2 [26]. On the other hand, the surface defects of (BiO)2CO3 nanowires (shown on the HRTEM image in Figure S4, Supporting Information) make them more active, resulting in a lower temperature limit for decomposition reaction. By contrast, Figure 5 showed that the data points in the second mass loss zone can be approximately fitted to straight lines with negative slopes, and are nearly parallel to each other under different conversion rates. This finding demonstrated that the main mass loss of BCO and Ca-BCO was caused by the decomposition of (BiO)2CO3 in the cores of nanowires with a single decomposition reaction mechanism. Ea could be calculated and averaged from the slopes. Results for Ea are shown in Table 3.
Table 3 shows that the calculated apparent activation energy of C–BCO decreased from 178.49 to 157.42 kJ/mol when the conversion rate increased from 20 to 80%. The apparent activation energies of BCO and Ca–BCO increased from 246.71 to 334.49 kJ/mol and 204.02 to 234.47 kJ/mol, respectively. The values of C–BCO and Ca–BCO obtained using the Kissinger–Akahira–Sunose methods are comparable to those calculated by Kissinger’s methods, but the former is quite higher than the latter, especially at a high conversion rate. Different kinetic analysis methods are complimentary, as suggested by the ICTAC Kinetics Project [22]. Therefore, an appropriate apparent activation energy range should be obtained by combining all observations in Table 2 and Table 3, as well as Figure 3 and Figure 5. Consequently, a general activation energy range of 160–170 kJ/mol was suggested for C–BCO, 230–270 kJ/mol for BCO, and 210–223 kJ/mol for Ca–BCO. The calculated apparent activity energies of as-prepared nanowires were interestingly higher than those of as-prepared nanoplates in the decomposition range, indicating that the core of as-prepared nanowires was more stable than as-prepared nanoplates. This behavior might benefit from the hydrothermal process similar to the geological mineralization of bismutite. Given that C–BCO was prepared through the metathetical reaction between (BiO)NO3 and Na2CO3 solution at 55 °C, the total reaction time was relatively short. The rate of nucleation was so fast that intrinsic defects existed in (BiO)2CO3. For the nanowires, the hydrothermal process provided a homogeneous reaction environment for nucleation and growth of (BiO)2CO3 and guaranteed a high crystallinity similar to geological mineralization of bismutite. For Ca-BCO, doped Ca2+ ions distorted the lattice of (BiO)2CO3 and altered its lattice energy, resulting in a lower apparent activation energy compared to BCO [30]. These results were consistent with that of XRD. HRTEM images (Figure S4) clearly confirmed that the defects of BCO were located at the surface, whereas the stacking defects of Ca–BCO were located at the inner space due to the addition of Ca2+. Introducing Ca2+ ions into (BiO)2CO3 nanowires could improve the thermal stability of nanowires in terms of decomposition temperature. However, the decomposition activation energy of Ca–BCO was smaller than that of BCO. Distortion from doped Ca2+ ions in nanowires should thus accelerate the decomposition of (BiO)2CO3.
4. Conclusions
The effects of morphology and doped ions on the thermal stability of nanostructured (BiO)2CO3 were studied. Two decomposition zones existed in the TG curves of (BiO)2CO3 and Ca-doped (BiO)2CO3 nanowires prepared by hydrothermal synthesis, whereas only one decomposition zone was detected for the (BiO)2CO3 nanoplates from the metathetical reaction. Results show that structure, doped ions, and synthesis method had a significant effect on the thermal stability of nanostructured (BiO)2CO3. The decomposition temperature of nanostructured (BiO)2CO3 increased in the following order: Surface (BiO)2CO3 nanowires with defects < (BiO)2CO3 nanoplates < core of (BiO)2CO3 nanowires < core of Ca–(BiO)2CO3 nanowires. Kinetic analysis demonstrated that the apparent activation energies of the decomposition of surface (BiO)2CO3 nanowires with defects, (BiO)2CO3 nanoplates, core of (BiO)2CO3 nanowires, and core of Ca–(BiO)2CO3 nanowires were 118–123, 160–170, 230–270, and 210–223 kJ/mol, respectively. Doping of Ca2+ in (BiO)2CO3 nanowires improved the decomposition of (BiO)2CO3.
Supplementary Materials
The following are available online at https://www.mdpi.com/1996-1944/13/19/4287/s1, Figure S1: TG-DTG curves of (BiO)2CO3 nanoplates, Figure S2: TG-DTG curves of (BiO)2CO3 nanowires, Figure S3: TG-DTG curves of Ca-(BiO)2CO3 nanowires, Figure S4: TEM and HRTEM images of (BiO)2CO3 nanowires (a,b) and Ca-(BiO)2CO3 nanowires(c,d).
Author Contributions
Conceptualization, S.J. and K.C.; methodology, S.S.; validation, S.S., S.J. and K.C.; formal analysis, S.S. and K.C.; investigation, S.S. and K.C.; resources, S.J. and K.C.; data curation, S.S.; writing—original draft preparation, S.S.; writing—review and editing, K.C.; supervision, S.J. and K.C. All authors have read and agreed to the published version of the manuscript.
Funding
This research received no external funding.
Conflicts of Interest
The authors declare no conflict of interest.
References
- Li, J.; Zhang, L.; Li, Y.; Yu, Y. Synthesis and internal electric field dependent photoreactivity of Bi3O4Cl single-crystalline nanosheets with high {001} facet exposure percentages. Nanoscale 2014, 6, 167–171. [Google Scholar] [CrossRef]
- Zhang, X.; Guo, T.; Wang, X.; Wang, Y.; Fan, C.; Zhang, H. Facile composition-controlled preparation and photocatalytic application of BiOCl/Bi2O2CO3 nanosheets. Appl. Catal. B Environ. 2014, 150-151, 486–495. [Google Scholar] [CrossRef]
- Zhou, Y.; Grunwaldt, J.-D.; Krumeich, F.; Zheng, K.; Chen, G.; Stötzel, J.; Frahm, R.; Patzke, G.R. Hydrothermal Synthesis of Bi6S2O15 Nanowires: Structural, in situ EXAFS, and Humidity-Sensing Studies. Small 2010, 6, 1173–1179. [Google Scholar] [CrossRef]
- Li, Y.; Liu, J.; Huang, X.; Li, G. Hydrothermal synthesis of Bi2WO6 uniform hierarchical microspheres. Cryst. Growth Des. 2007, 7, 1350–1355. [Google Scholar] [CrossRef]
- Shimodaira, Y.; Kato, H.; Kobayashi, H.; Kudo, A. Photophysical properties and photocatalytic activities of bismuth molybdates under visible light irradiation. J. Phys. Chem. B 2006, 110, 17790–17797. [Google Scholar] [CrossRef]
- Cui, P.; Wang, J.; Wang, Z.; Chen, J.; Xing, X.; Wang, L.; Yu, R. Bismuth oxychloride hollow microspheres with high visible light photocatalytic activity. Nano Res. 2016, 9, 593–601. [Google Scholar] [CrossRef]
- Chen, Y.-S.; Manser, J.S.; Kamat, P.V. All solution-processed lead halide perovskite-BiVO4 tandem assembly for photolytic solar fuels production. J. Am. Chem. Soc. 2015, 137, 974–981. [Google Scholar] [CrossRef] [PubMed] [Green Version]
- Grice, J.D. A solution to the crystal structures of bismutite and beyerite. Can. Mineral 2002, 40, 693–698. [Google Scholar] [CrossRef]
- Peng, S.; Li, L.; Tan, H.; Wu, Y.; Cai, R.; Yu, H.; Huang, X.; Zhu, P.; Ramakrishna, S.; Srinivasan, M.; et al. Monodispersed Ag nanoparticles loaded on the PVP-assisted synthetic Bi2O2CO3 microspheres with enhanced photocatalytic and supercapacitive performances. J. Mater. Chem. A 2013, 1, 7630–7638. [Google Scholar] [CrossRef]
- Dong, F.; Zheng, A.; Sun, Y.; Fu, M.; Jiang, B.; Wing-Kei, H.; Lee, S.C.; Wu, Z. One-pot template-free synthesis, growth mechanism and enhanced photocatalytic activity of monodisperse (BiO)2CO3 hierarchical hollow microspheres self-assembled with single-crystalline nanosheets. Cryst. Eng. Comm. 2012, 14, 3534–3544. [Google Scholar] [CrossRef]
- Zhou, Y.; Zhao, Z.; Wang, F.; Cao, K.; Dmitry, E.; Doronkin, D.E.; Dong, F.; Grunwaldt, J.D. Facile synthesis of surface N-doped Bi2O2CO3: Origin of visible light photocatalytic activity and in situ DRIFTS studies. J. Hazard. Mater. 2016, 307, 163–172. [Google Scholar] [CrossRef] [PubMed]
- Chen, R.; So, M.H.; Yang, J.; Deng, F.; Che, C.M.; Sun, H. Fabrication of bismuth subcarbonate nanotube arrays from bismuth citrate. Chem. Commun. 2006, 21, 2265–2267. [Google Scholar] [CrossRef]
- Umar, A.; Ahmad, R.; Kumar, R.; Ahmed, A.; Ibrahim, A.A.; Baskoutas, S. Bi2O2CO3 nanoplates: Fabrication and characterization of highly sensitive and selective cholesterol biosensor. J. Alloy. Compd. 2016, 683, 433–438. [Google Scholar] [CrossRef]
- Zhou, Y.; Wang, H.; Sheng, M.; Zhang, Q.; Zhao, Z.; Lin, Y.; Liu, H.; Greta, R.; Patzke, G.R. Environmentally friendly room temperature synthesis and humidity sensing applications of nanostructured Bi2O2CO3. Sens. Actuators B Chem. 2013, 188, 1312–1318. [Google Scholar] [CrossRef]
- Selvamani, T.; Asiri, A.M.; Al-Youbi, A.O.; Anandan, S. Emergent synthesis of bismuth subcarbonate nanomaterials with various morphologies towards photocatalytic activities—An overview. Mater. Sci. Forum 2013, 764, 169–193. [Google Scholar] [CrossRef]
- Liu, Y.; Wang, Z.; Huang, B.; Yang, K.; Zhang, X.; Qin, X.; Dai, Y. Preparation, electronic structure, and photocatalytic properties of Preparation, electronic structure, and photocatalytic properties of Bi2O2CO3 nanosheet. Appl. Surf. Sci. 2010, 257, 172–175. [Google Scholar] [CrossRef]
- Zhao, T.; Zai, J.; Xu, M.; Zhou, Q.; Su, Y.; Wang, K.; Qian, X. Hierarchical Bi2O2CO3 microspheres with improved visible-light-driven photocatalytic activity. CrystEng Comm 2011, 13, 4010–4017. [Google Scholar] [CrossRef]
- Savag, T.; Rao, A.M. Thermal properties of nanomaterials and nanocomposites. In Thermal Conductivity; Physics of Solids and Liquids; Tritt, T.M., Ed.; Springer: Boston, MA, USA, 2004. [Google Scholar]
- Bian, Y.; Ma, Y.; Shang, Y.; Tan, P.; Pan, J. Self-integrated β-Bi2O3/Bi2O2.33@Bi2O2CO3 ternary composites: Formation mechanism and visible light photocatalytic activity. Appl. Surf. Sci. 2018, 430, 613–624. [Google Scholar] [CrossRef]
- Huang, Y.; Wang, W.; Zhang, Q.; Cao, J.; Huang, R.J.; Ho, W.; Lee, S.C. In situ fabrication of α-Bi2O3/(BiO)2CO3 nanoplate heterojunctions with tunable optical property and photocatalytic activity. Sci. Rep. 2016, 6, 23435. [Google Scholar] [CrossRef] [Green Version]
- Zhu, G.; Lian, J.; Hojamberdiev, M.; Que, W. Facile fabrication of porous Bi2O3 microspheres by thermal treatment of Bi2O2CO3 microspheres and its photocatalysis properties. J. Clust. Sci. 2013, 24, 829–841. [Google Scholar] [CrossRef]
- Vyazovkin, S.; Burnham, A.K.; Criado, J.M.; Pérez-Maqueda, L.A.; Popescu, C.; Sbirrazzuoli, N. ICTAC Kinetics Committee recommendations for performing kinetic computations on thermal analysis data. Thermochim. Acta. 2011, 520, 1–19. [Google Scholar]
- Kissigner, H.E. Variation of peak temperature with heating rate in differential thermal analysis. J. Res. Natl. Bur. Stand. 1956, 57, 217–221. [Google Scholar]
- Cheng, H.K.F.; Chong, M.F.; Liu, E.; Zhou, K.; Li, L. Thermal decomposition kinetics of multiwalled carbon nanotube/polypropylene nanocomposites. J. Therm. Anal. Calorim. 2014, 117, 63–71. [Google Scholar]
- Kissigner, H.E. Reaction kinetics in differential thermal analysis. Anal. Chem. 1957, 29, 1702–1706. [Google Scholar]
- Akahira, T.; Sunose, T. Method of determining activation deterioration constant of electrical insulation materials. Res. Report Chiba Inst. Technol Sci. Technol. 1971, 16, 22–31. [Google Scholar]
- Taylor, P.; Sunder, S.; Lopata, V.J. Structure, spectra, and stability of solid bismuth carbonates. Can. J. Chem. 1984, 62, 2863–2873. [Google Scholar]
- Valencia, K.; López, A.; Hernández-Gordillo, A.; Zanella, R.; Rodil, S.E. Stabilized β-Bi2O3 nanoparticles from (BiO)4CO3(OH)2 precursor and their photocatalytic properties under blue light. Ceram. Int. 2018, 44, 22329–22338. [Google Scholar]
- Cai, G.; Xu, L.; Wei, B.; Che, J.; Gao, H.; Sun, W. Facile synthesis of β-Bi2O3/Bi2O2CO3 nanocomposite with high visible-light photocatalytic activity. Mater. Lett. 2014, 120, 1–4. [Google Scholar]
- Matskevich, N.I.; Wolf, T.; Adelmann, P.; Semerikova, A.N.; Gelfond, N.V.; Zolotova, E.S.; Matskevich, M.Y. Enthalpy of formation and lattice energy of bismuth perrhenate doped by neodymium and indium oxides. Thermochim. Acta 2017, 658, 63–67. [Google Scholar]
Figure 1.
XRD patterns of as-synthesized (BiO)2CO3 nanoplates (C-BCO), as-synthesized (BiO)2CO3 nanowires (BCO), and as-synthesized Ca-(BiO)2CO3 nanowires (Ca-BCO).
Figure 1.
XRD patterns of as-synthesized (BiO)2CO3 nanoplates (C-BCO), as-synthesized (BiO)2CO3 nanowires (BCO), and as-synthesized Ca-(BiO)2CO3 nanowires (Ca-BCO).

Figure 2.
SEM images of C-BCO (a), BCO (b), and Ca-BCO nanowires (c).

Figure 3.
Plots of ln(β/Tmax2) versus 1000/Tmax of (BiO)2CO3 samples for the first mass loss zone (a) and the main mass loss zone (b) based on Kissinger’s method.
Figure 3.
Plots of ln(β/Tmax2) versus 1000/Tmax of (BiO)2CO3 samples for the first mass loss zone (a) and the main mass loss zone (b) based on Kissinger’s method.

Figure 4.
Plots of ln(β/T2) versus 1000/T at various mass losses of the first mass loss zone for as-prepared (BiO)2CO3 nanowires (a) and Ca-(BiO)2CO3 nanowires (b) based on the Kissinger–Akahira–Sunose method.
Figure 4.
Plots of ln(β/T2) versus 1000/T at various mass losses of the first mass loss zone for as-prepared (BiO)2CO3 nanowires (a) and Ca-(BiO)2CO3 nanowires (b) based on the Kissinger–Akahira–Sunose method.

Figure 5.
Plots of ln(β/T2) versus 1000/T at various conversions of the main mass loss zone for C-BCO (a), as-prepared BCO nanowires (b), and Ca-BCO nanowires (c) based on the Kissinger–Akahira–Sunose method.
Figure 5.
Plots of ln(β/T2) versus 1000/T at various conversions of the main mass loss zone for C-BCO (a), as-prepared BCO nanowires (b), and Ca-BCO nanowires (c) based on the Kissinger–Akahira–Sunose method.


Table 1.
Thermogravimetric (TG) results of the samples obtained from different heating rates.
| Sample | β/°C·min−1 | 1st Mass Loss Zone/°C | Peak Temperature/°C | Mass Loss/% | 2nd Mass Loss Zone/°C | Peak Temperature/°C | Mass Loss/% |
|---|---|---|---|---|---|---|---|
| C-BCO | 5 | 320.1–514.6 | 400.0 | 8.26 | |||
| 10 | 324.9–543.9 | 417.9 | 8.33 | ||||
| 15 | 327.5–551.0 | 432.0 | 8.36 | ||||
| 20 | 328.0–563.5 | 436.0 | 8.40 | ||||
| BCO | 5 | 193.3–367.8 | 276.3 | 1.47 | 367.8–624.8 | 434.8 | 4.23 |
| 10 | 205.9–383.8 | 288.6 | 1.39 | 383.8–625.9 | 447.7 | 4.04 | |
| 15 | 211.2–387.2 | 296.2 | 1.41 | 387.2–635.2 | 453.7 | 4.10 | |
| 20 | 215.4–394.9 | 315.4 | 1.43 | 394.9–641.9 | 460.4 | 4.07 | |
| Ca-BCO | 5 | 209.3–341.3 | 271.8 | 0.80 | 341.3–621.8 | 451.3 | 5.10 |
| 10 | 211.5–355.5 | 285.6 | 0.81 | 355.5–637.0 | 464.6 | 5.13 | |
| 15 | 217.4–379.4 | 293.9 | 1.03 | 379.4–641.9 | 472.9 | 5.03 | |
| 20 | 213.6–368.6 | 297.6 | 0.69 | 368.6–650.6 | 479.1 | 5.07 |
Table 2.
Apparent activation energies of nanostructured (BiO)2CO3 samples based on the Kissinger’s method.
Table 2.
Apparent activation energies of nanostructured (BiO)2CO3 samples based on the Kissinger’s method.
| Samples | 1st Weight-Loss Zone | 2nd Weight-Loss Zone | ||
|---|---|---|---|---|
| Ea/kJ/mol | R2 | Ea/kJ/mol | R2 | |
| C-BCO | 159.48 | 0.99123 | ||
| BCO | 118.69 | 0.9773 | 226.77 | 0.99363 |
| Ca-BCO | 122.84 | 0.9970 | 213.89 | 0.99928 |
Table 3.
Apparent activation energy of nanostructured (BiO)2CO3 samples calculated by Kissinger–Akahira–Sunose’s methods in a range of α = 20–80%.
Table 3.
Apparent activation energy of nanostructured (BiO)2CO3 samples calculated by Kissinger–Akahira–Sunose’s methods in a range of α = 20–80%.
| Conversion Rate/% | C-BCO | BCO | Ca-BCO | |||
|---|---|---|---|---|---|---|
| Ea/kJ/mol | R2 | Ea/kJ/mol | R2 | Ea/kJ/mol | R2 | |
| 20 | 178.49 | 0.99794 | 246.71 | 0.99848 | 204.02 | 0.99699 |
| 30 | 169.32 | 0.9965 | 249.88 | 0.99914 | 207.59 | 0.99864 |
| 40 | 166.37 | 0.99656 | 253.81 | 0.99797 | 209.37 | 0.99905 |
| 50 | 163.72 | 0.99692 | 262.43 | 0.99618 | 213.22 | 0.9982 |
| 60 | 161.53 | 0.99729 | 276.72 | 0.99457 | 219.15 | 0.9977 |
| 70 | 159.92 | 0.99749 | 293.11 | 0.99522 | 226.79 | 0.99846 |
| 80 | 157.42 | 0.99784 | 334.49 | 0.99375 | 234.47 | 0.9975 |
| Average | 164.39 ± 4.94 | 257.91 ± 10.78 * | 216.37 ± 6.84 | |||
* The average apparent activity energy of as-prepared (BiO)2CO3 nanowires was calculated based on α = 20–60%.
© 2020 by the authors. Licensee MDPI, Basel, Switzerland. This article is an open access article distributed under the terms and conditions of the Creative Commons Attribution (CC BY) license (http://creativecommons.org/licenses/by/4.0/).
Share and Cite
MDPI and ACS Style
Sheng, S.; Jin, S.; Cui, K. Thermal Decomposition of Nanostructured Bismuth Subcarbonate. Materials 2020, 13, 4287. https://doi.org/10.3390/ma13194287
AMA Style
Sheng S, Jin S, Cui K. Thermal Decomposition of Nanostructured Bismuth Subcarbonate. Materials. 2020; 13(19):4287. https://doi.org/10.3390/ma13194287
Chicago/Turabian StyleSheng, Su, Shengming Jin, and Kuixin Cui. 2020. "Thermal Decomposition of Nanostructured Bismuth Subcarbonate" Materials 13, no. 19: 4287. https://doi.org/10.3390/ma13194287
Note that from the first issue of 2016, this journal uses article numbers instead of page numbers. See further details here.