Article

Structural, Optical and Electrical Properties of HfO2 Thin Films Deposited at Low-Temperature Using Plasma-Enhanced Atomic Layer Deposition

1
Department of Materials Science and Engineering, Chungnam National University, Daejeon 34134, Korea
2
Department Materials and Energy Measurement Center, Korea Research Institute of Standards and Science (KRISS), Daejeon 34113, Korea
*
Author to whom correspondence should be addressed.
Materials 2020, 13(9), 2008; https://doi.org/10.3390/ma13092008
Submission received: 13 March 2020 / Revised: 17 April 2020 / Accepted: 23 April 2020 / Published: 25 April 2020
(This article belongs to the Special Issue Atomic Layer Deposition Technique in Material Science)

Abstract

:
HfO2 was deposited at 80–250 °C by plasma-enhanced atomic layer deposition (PEALD), and properties were compared with those obtained by using thermal atomic layer deposition (thermal ALD). The ALD window, i.e., the region where the growth per cycle (GPC) is constant, shifted from high temperatures (150–200 °C) to lower temperatures (80–150 °C) in PEALD. HfO2 deposited at 80 °C by PEALD showed higher density (8.1 g/cm3) than those deposited by thermal ALD (5.3 g/cm3) and a smooth surface (RMS Roughness: 0.2 nm). HfO2 deposited at a low temperature by PEALD showed decreased contaminants compared to thermal ALD deposited HfO2. Values of refractive indices and optical band gap of HfO2 deposited at 80 °C by PEALD (1.9, 5.6 eV) were higher than those obtained by using thermal ALD (1.7, 5.1 eV). Transparency of HfO2 deposited at 80 °C by PEALD on polyethylene terephthalate (PET) was high (> 84%). PET deposited above 80 °C was unable to withstand heat and showed deformation. HfO2 deposited at 80 °C by PEALD showed decreased leakage current from 1.4 × 10⁻² to 2.5 × 10⁻⁵ A/cm2 and increased capacitance of approximately 21% compared to HfO2 using thermal ALD. Consequently, HfO2 deposited at a low temperature by PEALD showed improved properties compared to HfO2 deposited by thermal ALD.

1. Introduction

The semiconductor industry has developed rapidly, and electronic devices have been scaled down. However, scaled-down devices can show many problems, such as direct tunneling, high gate leakage current and poor reliability [1,2]. Therefore, HfO2 has been studied to replace conventional SiO2 as a high-κ material because of its advantages, such as high density, good ductility and corrosion resistance, as well as its high-k [3,4]. HfO2 has mainly been deposited by thermal atomic layer deposition (thermal ALD) because this method produces thin films that are pinhole-free, high density and have low contaminants levels (Carbon, Nitrogen); this process also allows excellent thickness control [5,6,7,8].
Recently, as the importance of wearable devices has increased, low-temperature deposition of HfO2 thin films has been required [9,10]. However, HfO2 thin films normally must be deposited at around 200 °C because the metal–organic precursors used as sources during the ALD process fully decompose at high temperatures [11]. Many methods have been studied to lower the deposition temperature of HfO2 in ALD [12,13,14,15,16]. However, in those studies, HfO2 thin films deposited at low temperatures had problems, such as a high level of carbon impurities (5.15%–8.9% carbon impurity in HfO2 thin films deposited at 150 °C) or low density (3.7 g/cm3 when deposited at 30 °C, 4.1 g/cm3 at 50 °C, 4.8 g/cm3 at 80 °C and 5.3 g/cm3 at 100 °C); these problems cause high leakage current and poor reliability in electronic devices [12,13,14].
Using plasma to produce oxygen radicals with high reactivity can solve these problems, and plasma has been used in other low-temperature deposition processes [17]. Consequently, plasma-enhanced atomic layer deposition (PEALD) can be used to decompose a source at a lower temperature by making atomic oxygen radicals using O2 gas as a reactant; this is in contrast to the conventional thermal ALD process, which uses O3 as a reactant. In the previous studies, it was found that the electrochemical oxidation potential, a measure of the sensitivity of the oxidation reaction, of atomic oxygen radicals (2.42 V) is higher than that of O3 (2.08 V) [18,19,20]. In the ALD process, electrochemical oxidation potential of the reactants indicates the ligand-decomposing power [21,22,23,24]. Higher oxidation potential of reactants enables the low-temperature processes because less thermal energy is required for source decomposition [16].
In this study, HfO2 thin films were deposited by PEALD at 80 °C, and their variable properties, such as film structures, surface morphology and surface components, were compared with thin films deposited by using thermal ALD and PEALD at various temperatures (80, 150 and 250 °C). Moreover, values of densities, refractive index, optical bandgap determined by Tauc plot and transmittance of HfO2 deposited at 80 °C by thermal ALD and PEALD were compared. In our study, the HfO2 deposited at a low temperature (80 °C) by PEALD showed a low carbon ratio (3.5%) and high film density (8.1 g/cm3). Finally, electrical characteristics, such as capacitance–voltage (C–V) curve, current–voltage (I–V) and fixed-charge density (Qf) of HfO2 deposited at 80, 150 and 250 °C were analyzed, using an MOS capacitor. The HfO2 thin films deposited at a low temperature (80 °C), using PEALD, showed improved structural, chemical, optical and electrical properties, without any degradation.

2. Materials and Methods

Using an automated ALD system (iCV d300, ISAC Research,Daejeon, Korea), HfO2 thin films were fabricated on doped (ρ ~ 15 Ω·cm) p-type Si (100) wafers. Substrates were cleaned for 10 min with acetone, 10 min with ethanol and 10 min with IPA in an ultrasonic generator; they were immediately dried by blowing argon over the sample. The substrates were loaded at different temperatures, in a range of 80–250 °C. The main pump was an MVP-90 (WOOSUNG VACUUM PUMP, Jeju, Korea), and the base pressure was 10 mtorr. An ISP-90 (ANEST IWATA Corporation, Yokohama, Japan) was used as a by-pass pump for constant flow. In this experiment, direct plasma was used; the plasma power was fixed at 150 W, using a 13.56 MHz RF power supply (REX2-3K, RF Power Tech, Anyang, Korea). Tetrakis(ethylmethylamino) hafnium (TEMAH-99.999% purity from UP Chemical, Pyungtaek, Korea) was used as a precursor. High-purity O3 and O2 were used as oxidants. O3 was produced from O2 by an ozone generator (LAB-II, Ozonetech, Daejeon, Korea). Ar gas, used as a carrier gas and purge gas, also had a purity of 99.999%. TEMAH precursor canister was maintained at 75 °C. The precursor flow line and the chamber were also maintained at 80 °C, to prevent condensation and clogging.
The thickness of the HfO2 thin films was measured by using a Reflectometer (ST2000, K-MAC, Daejeon, Korea) and Spectroscopic Ellipsometry (SE, M2000D, J.A. WOOLLAM CO, Lincoln, NE, USA). In addition, the film structures and density in HfO2 were examined by Grazing Incidence X-ray diffraction and X-ray reflectivity, respectively (GIXRD, MXD10, Rigaku, Tokyo, Japan, Cu Kα radiation). The root mean square (RMS) roughness values of the HfO2 films (50 nm) were obtained by Atomic Force Microscope (AFM, XE7, Park Systems Suwon, Korea) images and scanned at 2 µm × 2 µm size. The chemical bonding states and components were examined by using X-ray photoelectron spectroscopy (XPS, K-Alpha+, Thermo Fisher Scientific Waltham, MA, USA) To remove carbon- and nitrogen-contaminant layers from air, approximately 7 to 10 nm of the HfO2 films was removed via Ar etching, at 1 keV, for 30 s [25,26]. Refractive index and absorption coefficient of HfO2 (50 nm) were extracted from the Ellipsometry (SE, M2000D, J.A. WOOLLAM CO, Lincoln, NE, USA) data. The transmittance of HfO2 (50 nm) at 550 nm on the PET substrate (ST510, DuPont Teijin Films, Wilmington, DE, USA) was measured in a range from 190 to 1100 nm, which was measured in the normal incidence of light by UV-vis spectroscopy (HP 8453, Agilent, Santa Clara, CA, USA). To measure the electrical properties (I–V and C–V), MOS capacitors were fabricated. Cu/Ti top electrodes were deposited on HfO2/p-Si, using an E-beam evaporator (KVET—C500200, Korea Vacuum, Gimpo, Korea). Cu/Ti circular electrodes were patterned, using a shadow mask. Electrical properties, as indicated by the I–V and C–V curves, were measured by using a Manual Probe Station (SUMMIT 11862B, Cascade, Beaverton, OR, USA). The C–V curve was obtained at 1 MHz in the range of −7 to +7 V, and the I–V curve was obtained from −2 to 2 V.

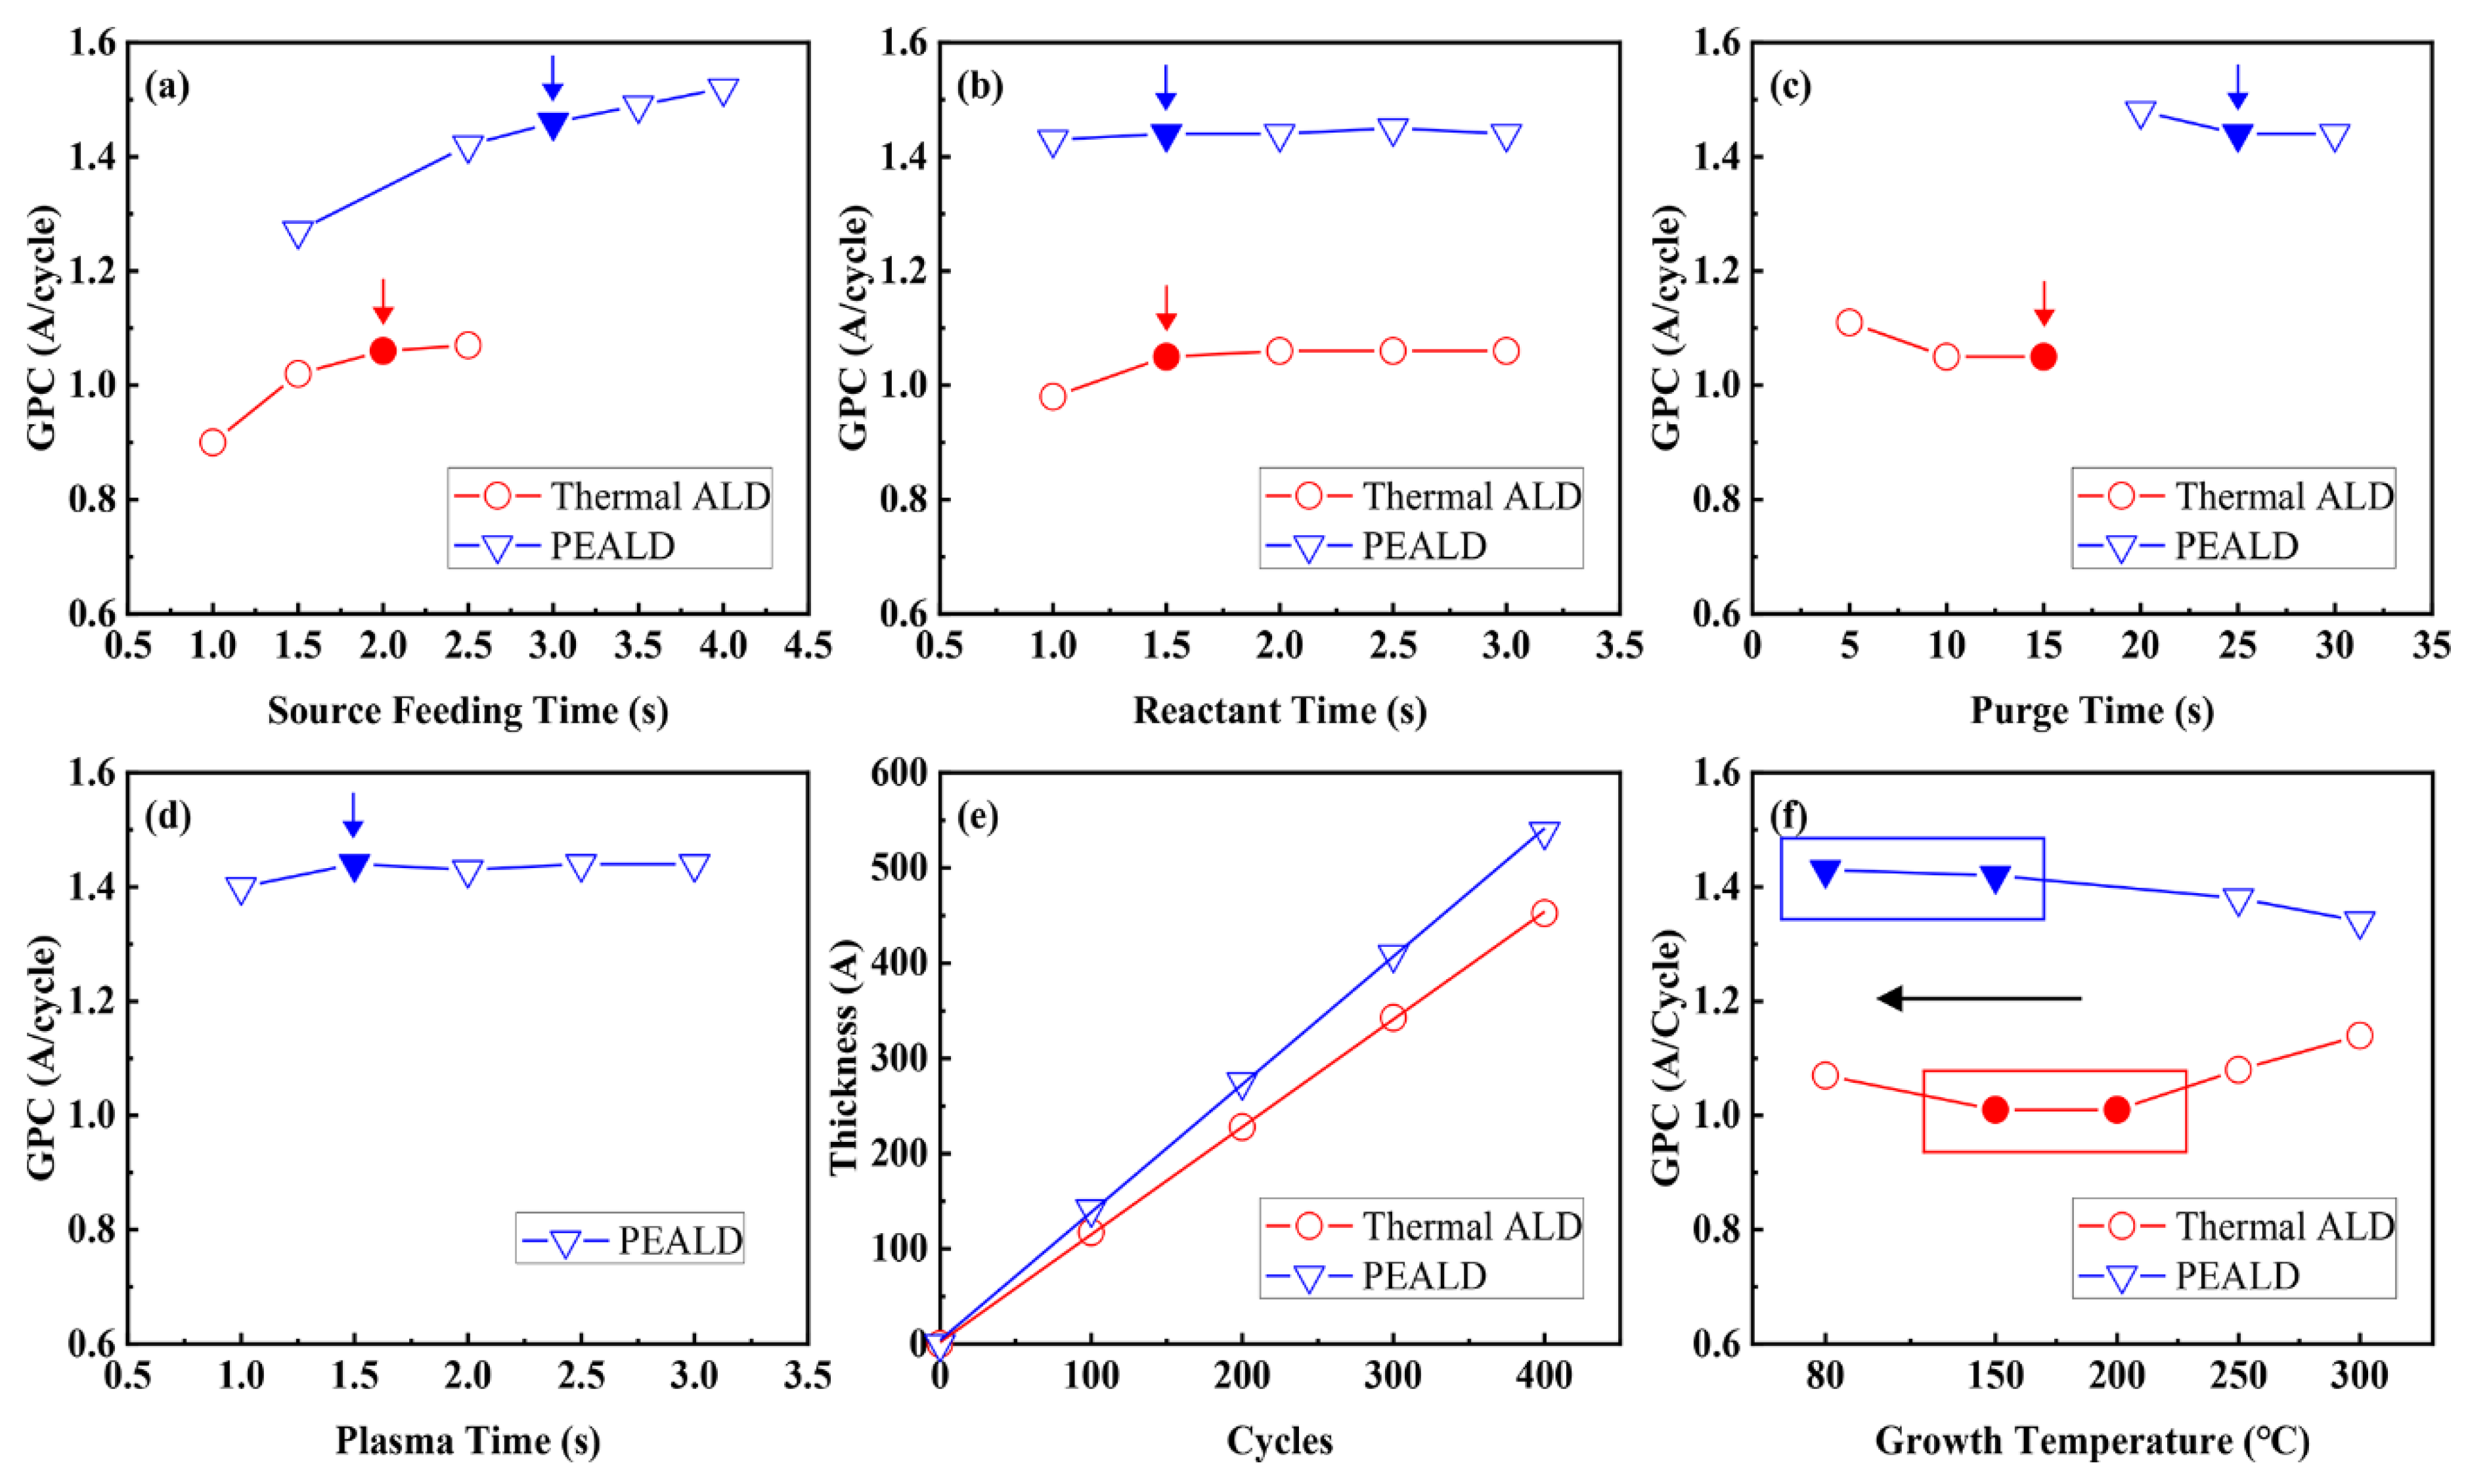
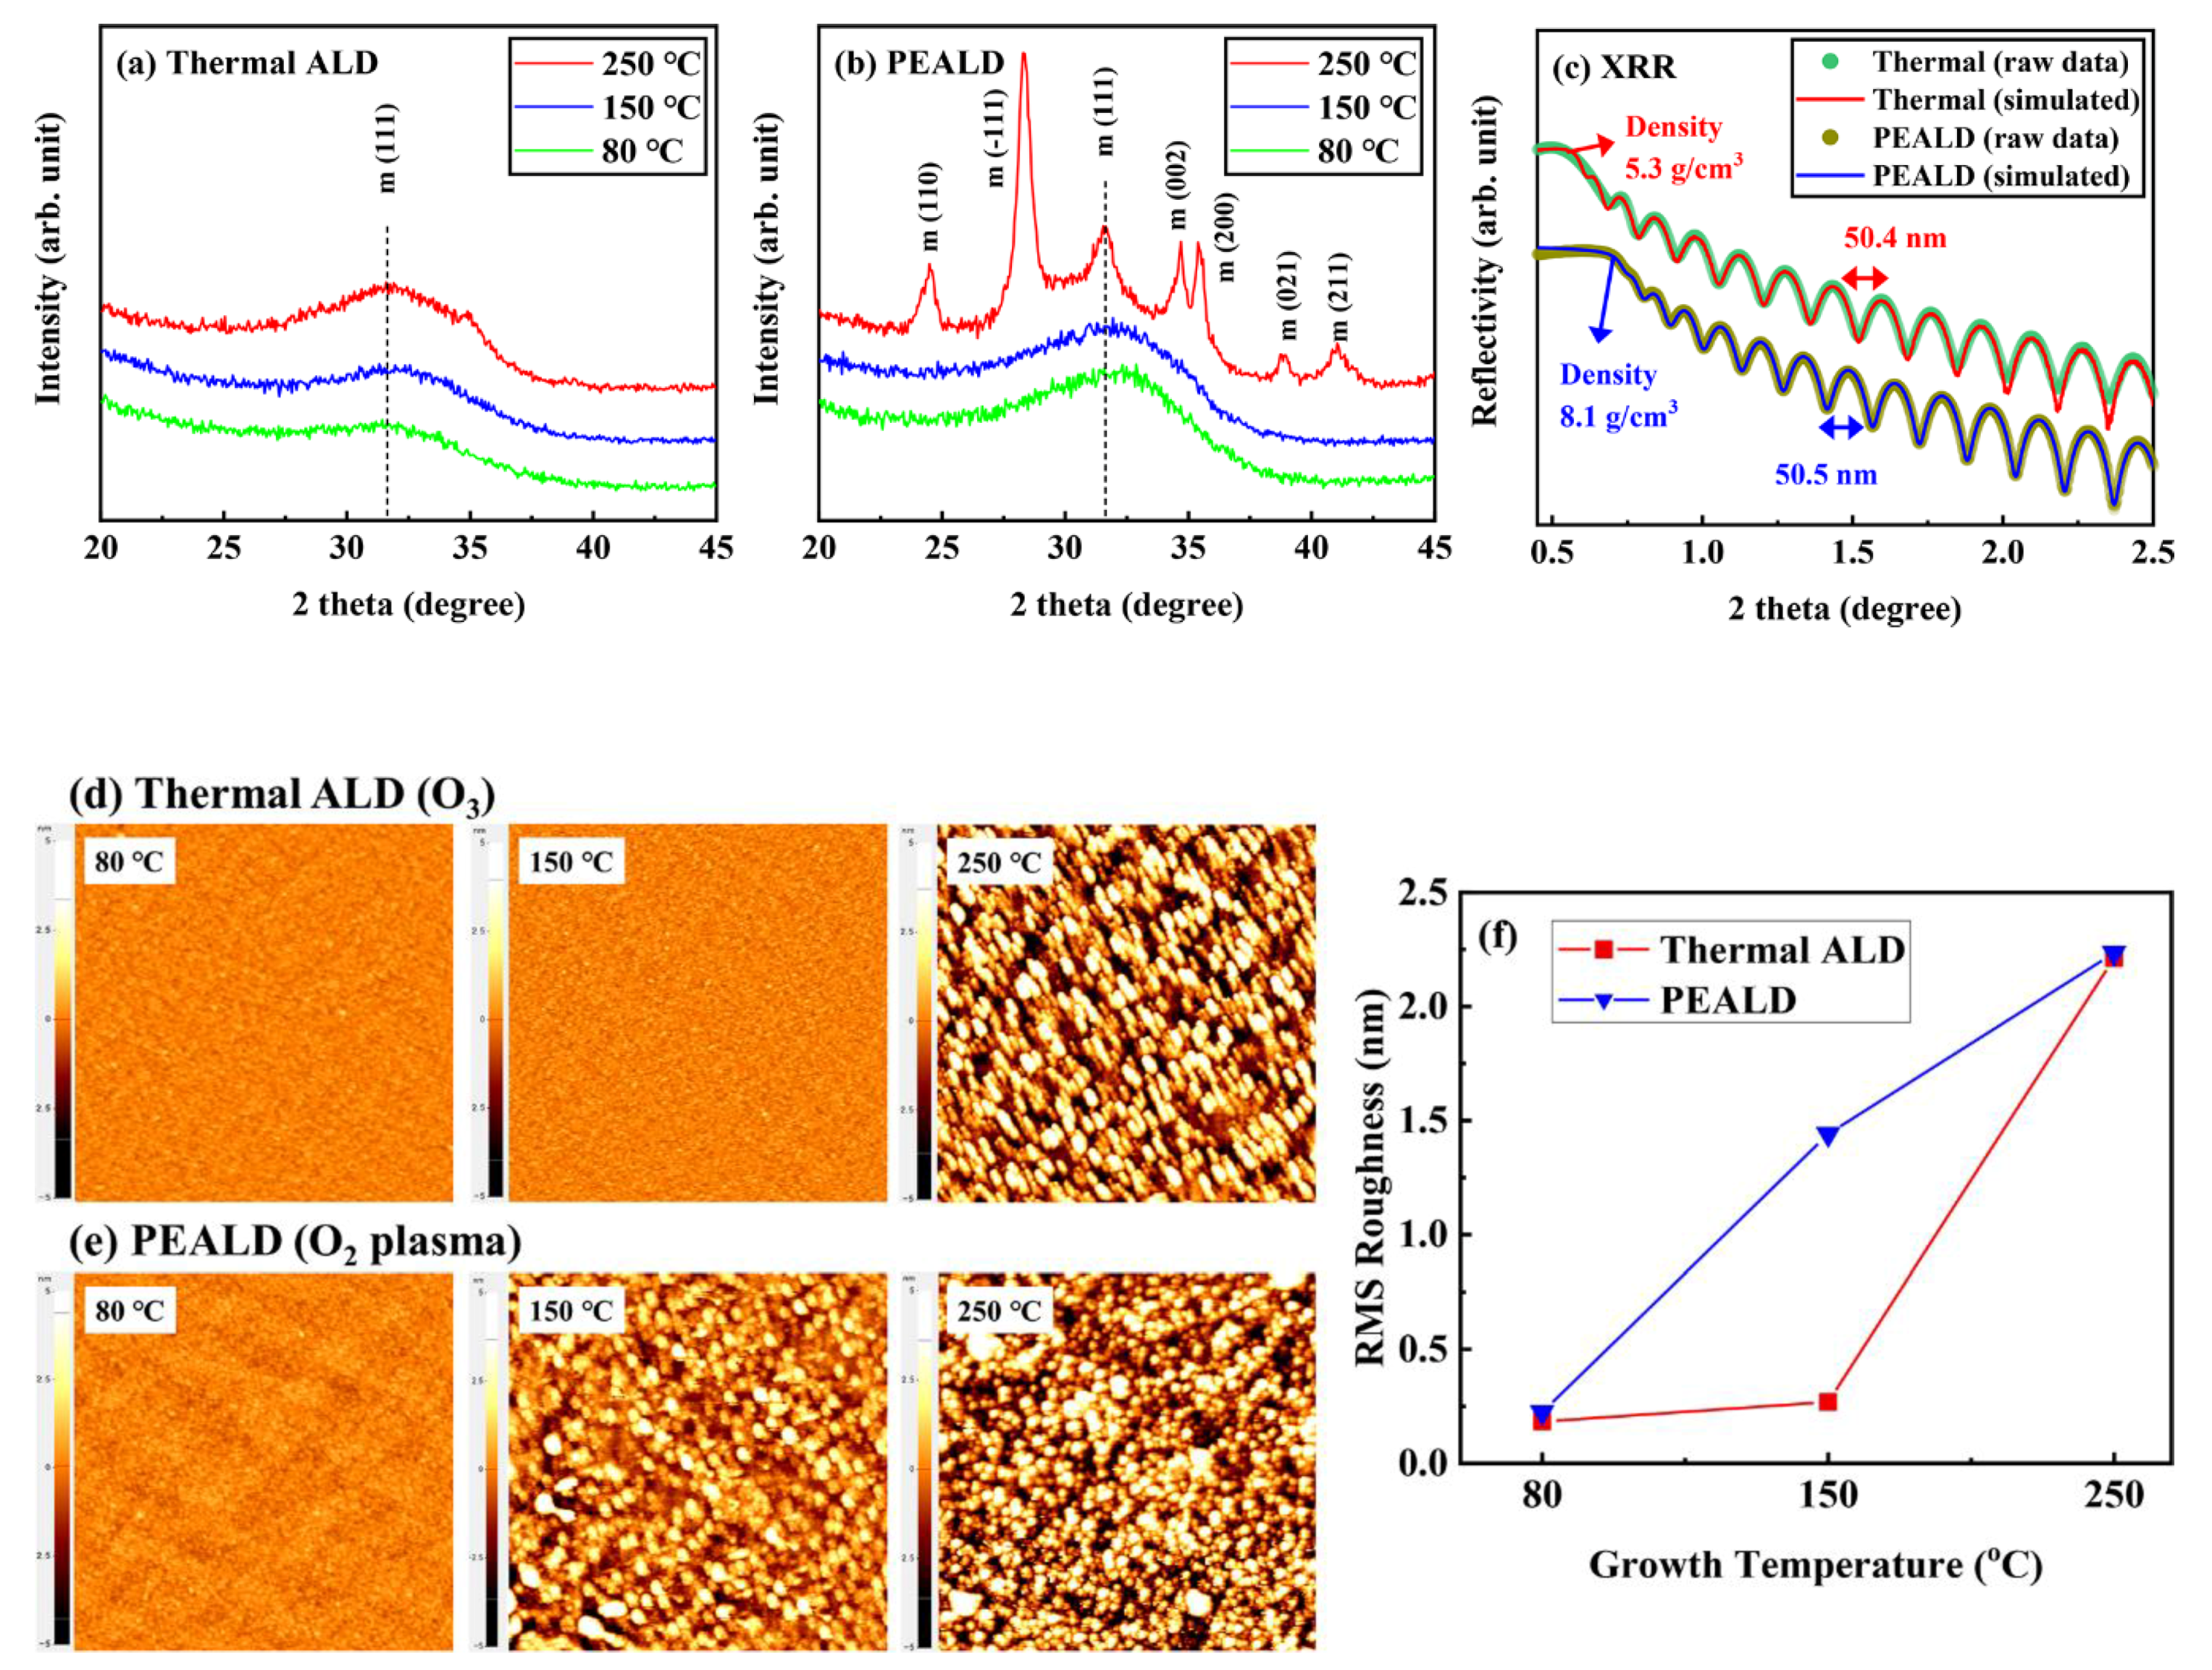
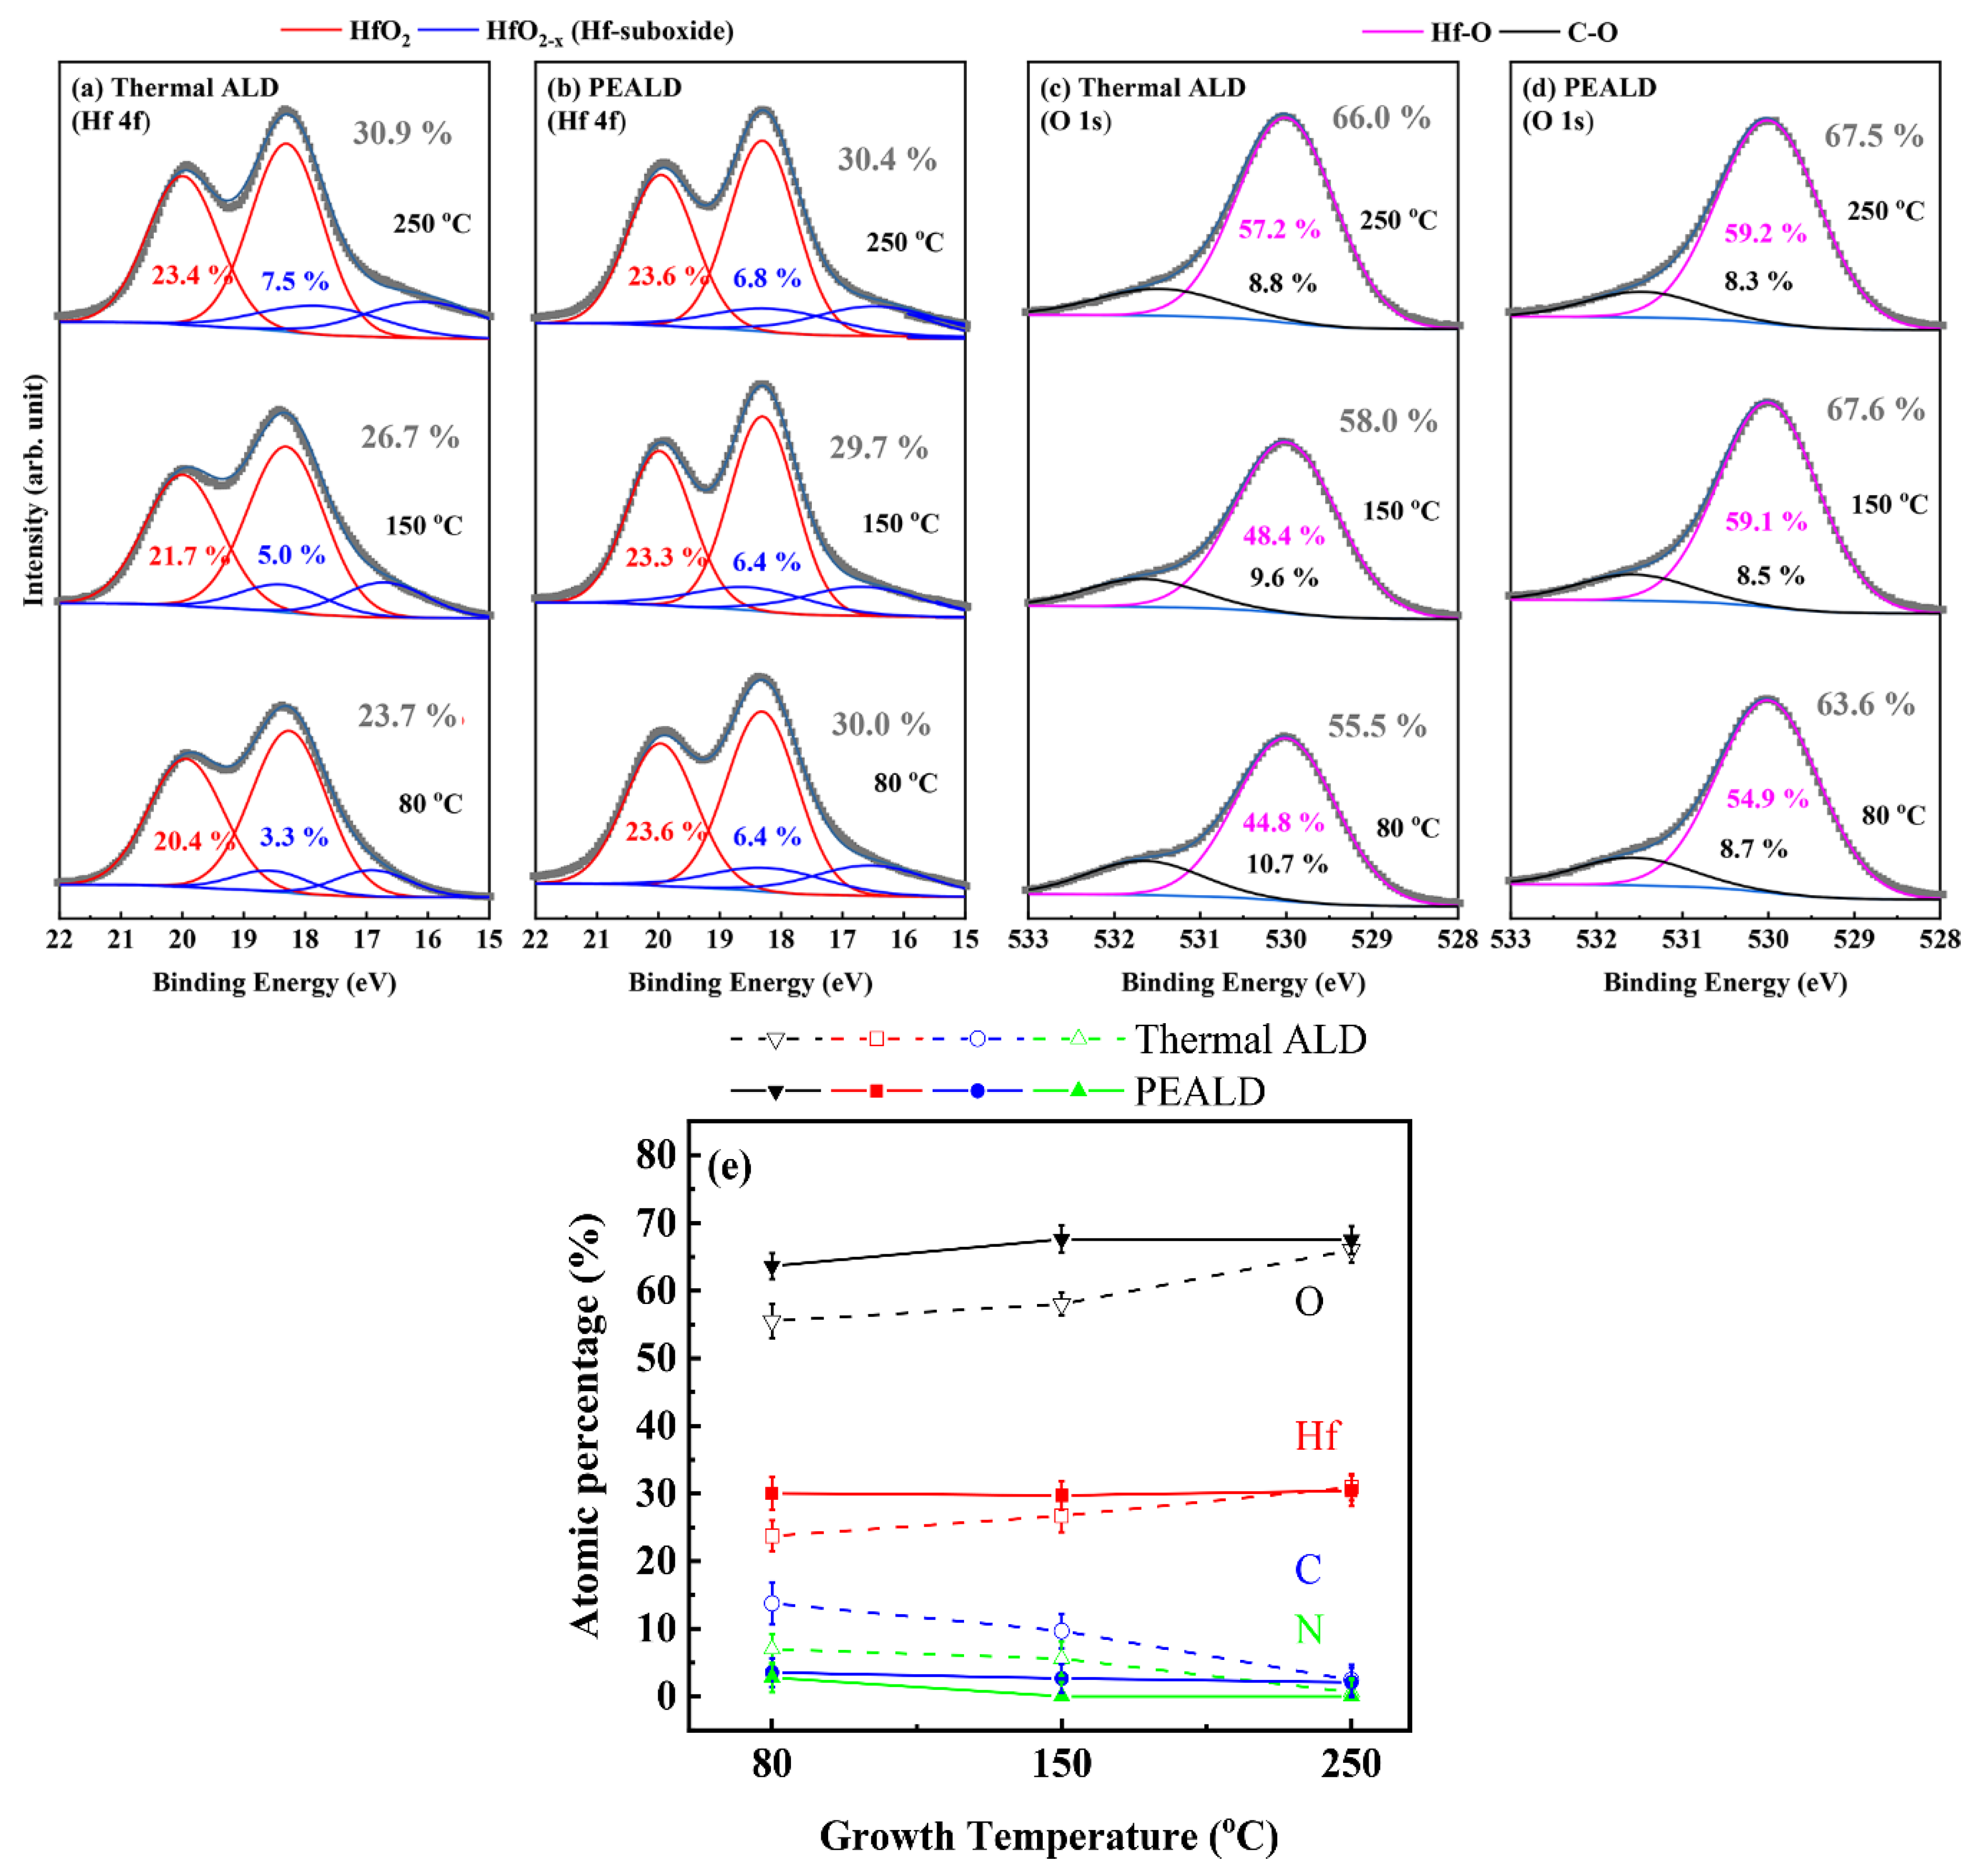
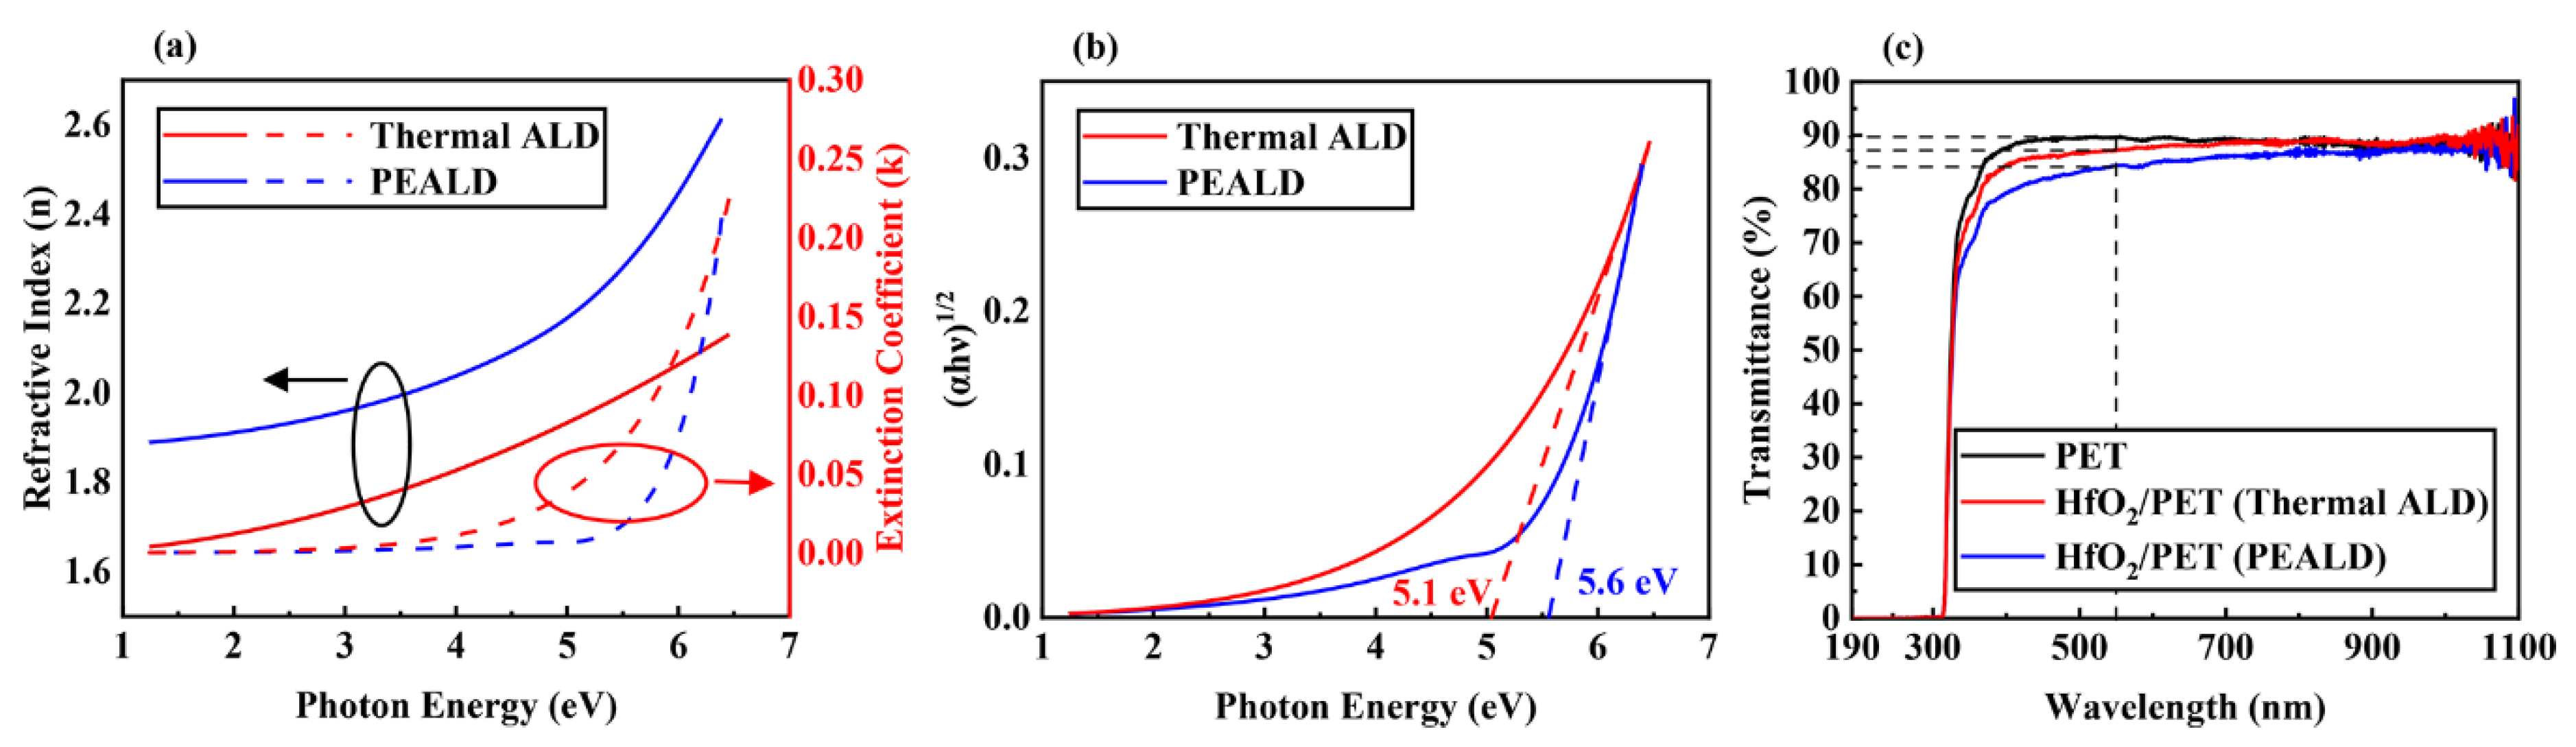
3. Results and Discussion

To show the experimental conditions of HfO2 thin films deposited at 80 °C, Figure 1a–d provides growth per cycle (GPC) curves for each step time; these were measured by using a reflectometer, because the process is easier and simpler than ellipsometry.
GPC curves, which changed according to the feeding and purge times, were clearly saturated at the same time with sufficient feeding and purge times. The experimental periods were determined according to these saturation times, as indicated by the arrows in Figure 1a–d. The thermal ALD cycle for HfO2 deposition consisted of 2 s source feeding, 15 s Ar purging, 1.5 s O3 reactant feeding and 15 s Ar purging. Additionally, the PEALD cycle for HfO2 deposition consisted of 3 s source feeding, 25 s Ar purging, 1.5 s O2 reactant feeding, a 1.5 s O2 plasma-on state and 25 s Ar purging. Since direct plasma was used in the experiment, O2 plasma was used for a relatively short time compared with remote plasma. Figure 1e shows the thickness increase with the deposition cycle; resulting values were obtained by ellipsometry, to measure the thicknesses of the thin films, because the reflectometer has difficulty accurately measuring thicknesses under 100 nm. The HfO2 thickness increased linearly as the cycle increased, without a growth delay problem; GPC values were similar to those obtained from using the reflectometer.
Figure 1f shows the GPC of HfO2 thin film according to the deposition temperatures of the thermal ALD and PEALD processes. The temperature section in which GPC shows constant temperature is called the ALD window and is a problem-free deposition region. The region between 150 and 200 °C is the ALD window in thermal ALD. In PEALD, the ALD window shifted to lower temperatures (80–150 °C) from high temperatures (150–200 °C) because of the high reactivity of O2 plasma; this allowed more stable low-temperature deposition. When thin films were deposited at 80 °C, using thermal ALD, GPC increased and exhibited condensation because of the insufficient thermal energy. Above 250 °C in thermal ALD, because of source decomposition due to high thermal energy, the GPC increased as the temperature increased. Conversely, in PEALD, GPC decreased, and desorption occurred in a manner different from that in thermal ALD [27]. The reason for this is that, as the temperature rose, increased ion energy of the plasma promoted etching of the HfO2 thin film and caused desorption [28].
Figure 2a,b shows the XRD pattern of HfO2 when deposited by thermal ALD and PEALD [29].
XRD patterns of HfO2 deposited at 80–250 °C by thermal ALD showed a broad peak at 2θ = 32°, indicating a dominantly amorphous structure HfO2 thin film [30]. Moreover, HfO2 deposited at 80–150 °C by PEALD also had an amorphous structure, but HfO2 deposited at 250 °C by PEALD contained a polycrystalline structure. This means that the crystallization of HfO2 thin film deposited by PEALD started at a lower temperature than that of HfO2 deposited by thermal ALD [31]. Figure 2c shows the thickness and density of HfO2 deposited at 80 °C, obtained from a period and critical angle of reflectivity oscillation pattern, as measured by XRR. Thickness was measured and found to be approximately 50 nm for both thermal ALD and PEALD samples, and density increased in PEALD from 5.3 to 8.1 g/cm3. This means that the HfO2 thin film deposited by PEALD at a low temperature was denser than that deposited to the same thickness by thermal ALD. Figure 2d–f provides root mean square (RMS) roughness and morphology images of HfO2 deposited according to temperature (80–250 °C) in thermal ALD and PEALD. In the PEALD samples, there was no difference of roughness compared to the thermal ALD samples, and the HfO2 thin film was still flat at 80 °C (0.2 nm). Additionally, no large particles were seen when HfO2 was deposited at a low temperature. As the temperature rose, the roughness of the thin film rapidly increased due to the formation of crystallite [32].
Figure 3a,b shows XPS results for Hf 4f formed by thermal ALD and PEALD, respectively.
The deconvoluted Hf 4f spectra show the doublet of peaks at binding energy of 18.31 and 19.99 eV, which is associated with HfO2 [33]. Moreover, at binding energy lower than those of the 4f doublet, the suboxide peaks are located at 16.93 and 18.63 eV, and they are associated with HfO2−x. The atomic concentration of hafnium in HfO2 thin film deposited at a low temperature by thermal ALD was the lowest at 23.7%, because many defects, such as carbon, nitrogen and hydroxyl groups (−OH), were located in the HfO2 thin films. Conversely, the atomic concentration of hafnium in HfO2 deposited at 80 °C by PEALD was high, at 30.0%, due to the low level of contaminants, similar to the sample deposited at 250 °C by thermal ALD. Figure 3c,d shows the XPS results for O 1 s after thermal ALD and PEALD. O 1 s peaks are deconvoluted into two components, a signal associated with HfO2 at 530.03 eV and an additional peak associated with carbon and oxygen at 531.68 eV [33]. The C–O peaks represent impurity carbon defects combined with oxygen, which can reduce the performance and efficiency of electronic devices [34,35]. According to these results, as the deposition temperature increased from 80 to 250 °C in both the thermal ALD and PEALD processes, the ratio of the C–O peaks showed a tendency to decrease. Furthermore, in the PEALD process, the ratio of C–O peaks was reduced compared with thermal ALD at all temperatures. In particular, at 80 °C in PEALD, C–O peaks decreased more than at 250 °C in thermal ALD. The atomic concentration of oxygen in HfO2 was similar, except for the thin film deposited at a low temperature by thermal ALD. As mentioned previously for elemental Hf, the presence of many contaminants can lower the atomic concentration of oxygen in thin films.
Figure 3e shows surface component percentages of O, Hf, C and N in the HfO2 thin films. Carbon and nitrogen inside the film act as defects, causing a decrease of density or degradation of properties. At a low temperature, HfO2 deposited through thermal ALD had high ratios of carbon (13.8%) and nitrogen (7.0%) because of incomplete source decomposition. Conversely, in the case of thin films deposited through PEALD, both carbon (3.5%) and nitrogen (2.8%) ratios were low, even at low temperatures. This suggests that, in PEALD, because the precursor was decomposed more by O2 plasma than by O3, the number of inner defects was lower than in thermal ALD at a low temperature.
Figure 4a shows refractive index (n) and extinction coefficient (k) as a function of the photon energy (eV) of HfO2 films (50 nm) deposited at 80 °C.
Using ellipsometry, values of n and k were calculated from the real and imaginary parts of the complex dielectric function (ε = ε1 + iε2), respectively [36]. The n values of the HfO2 are associated with the density of HfO2 thin films [37,38]. Since the HfO2 film deposited by PEALD had less carbon content and a lower O/Hf ratio than that obtained from using thermal ALD, it is expected that the HfO2 film deposited by PEALD has a higher density than that deposited by using thermal ALD. Therefore, the n value of the HfO2 deposited with PEALD was higher than that of HfO2 deposited with thermal ALD in all photon energy ranges. Figure 4b shows optical-band-gap values obtained from using the absorption coefficient (α = 4πk/λ) of HfO2 thin films (50 nm) deposited at 80 °C. The band gap of HfO2 thin film in the previous studies were typically between 5.6 and 5.7 eV [39,40]. However, the band gap of HfO2 deposited by thermal ALD was lower at 5.1 eV. When HfO2 was deposited by PEALD, the optical band gap increased to 5.6 eV. If the optical band gap is small, HfO2 thin films cannot function properly as insulators. Optical band gap was plotted by using the Tauc method, as described in Equation (1) [41]:
( α h ν ) 1 / 2 = A ( h ν E g )
where α(= 4πκ/λ) is the absorption coefficient, h is Planck’s constant, ν is photon frequency, A is a proportionality constant and Eg is the optical band gap.
Figure 4c shows the transmittance of HfO2 (50 nm) deposited at 80 °C on PET substrate. The transmittance of HfO2 deposited by PEALD was high (>84%) in the visible region (89.7% for bare PET substrate, 87.2% after thermal ALD and 84.3% for PEALD at wavelength of 550 nm). The transmittance decreased slightly for PEALD compared to thermal ALD because the HfO2 film deposited by PEALD was denser [42]. When HfO2 was deposited at more than 80 °C on PET substrate, PET could not endure the heat, and deformation occurred.
Figure 5a,b shows C–V curves of HfO2 deposited by thermal ALD and PEALD, respectively.
Capacitance of HfO2 deposited at 80 °C by PEALD increased from 444.9 to 540.1 nF/cm2, an approximately 21% increase. The dielectric constant (κ-value) of HfO2 deposited at 80 °C in PEALD (12.6) was higher than those of samples deposited by thermal ALD (8.7). Since the native oxide was not etched on the Si substrate, the κ-value was calculated by considering the native oxide thickness (~3 nm) [43,44]. Moreover, the κ-value of HfO2 thin film was calculated from the value of CHfO2, using the following formula, Equation (2):
1 C HfO 2 = 1 C ox 1 C SiO 2
where CHfO2 and CSiO2 are the capacitance of HfO2 and SiO2, respectively. Cox is the overall capacitance of the MOS capacitor.
There was no significant improvement at temperatures other than 80 °C. Figure 5c,d shows I–V curves of HfO2 deposited by thermal ALD and PEALD. Leakage currents at negative voltage in PEALD were reduced overall compared to those for thermal ALD. Significantly, at 80 °C, the leakage current decreased from 1.4 × 10⁻² A/cm2 to 2.5 × 10⁻⁵ A/cm2 at −2 V, which was lower than that of HfO2 deposited at 250 °C by thermal ALD. Because HfO2 films deposited by PEALD at a low temperature were denser, contaminants in the thin films were reduced [45]. Because we used an NMOS capacitor with a p-type Si substrate, a depletion layer formed at the interface when the voltage was positive. For this sample, almost no current flowed, because the capacitor was in an inversion state.
Figure 5e shows the flat band voltage (Vfb) and fixed charge density (Qf), extracted from the C–V curves in Figure 5a,b. Vfb of HfO2 deposited by PEALD at 80 °C was lower than those of sample formed by thermal ALD. Qf of HfO2 deposited at 80 °C by PEALD decreased about 90%, from 9.5 × 10¹² to 1.0 × 10¹², the lowest value in all temperature ranges (80–250 °C). Vfb and Qf showed almost identical values at all temperatures, except 80 °C. Qf has a (+) charge and is distributed at the interface between Si and the HfO2 thin film, which puts the device into a (+) state and makes it to work at higher voltage. This suggests that, at low temperatures of around 80 °C, capacitors using HfO2 deposited by PEALD will have better electrical properties than those using HfO2 deposited by thermal ALD. However, the Qf value of HfO2 deposited by PEALD tended to increase as the temperature increased. This means that, as the deposition temperature rose, the substrate was damaged by increased plasma ion energy during deposition [46,47].

4. Conclusions

In this study, HfO2 thin films deposited at a low temperature (80 °C), using PEALD with O2 plasma, showed improved properties compared to films deposited by using thermal ALD. The ALD window shifted from high temperatures (150–200 °C) to low temperatures (80–150 °C) when using PEALD, allowing stable deposition at a low temperature. HfO2 deposited by low-temperature PEALD showed a flat surface and higher density than films deposited by thermal ALD. Moreover, HfO2 deposited at 80 °C by PEALD showed a decreased presence of contaminants, such as carbon and nitrogen, compared to films deposited by thermal ALD. HfO2 thin films deposited by PEALD showed an increased refractive index, improved optical band gap (5.6 eV) and high transparency of ~84%. Denser and lower-contaminant HfO2 thin films deposited by PEALD contributed to capacitance improvement of about 21%, low leakage current of 2.5 × 10⁻⁵ A/cm2 and the lowest fixed charge density (1.0 × 10¹²). As a result, due to the higher decomposition power of O2 plasma, HfO2 thin films deposited at a low temperature by PEALD showed improved properties compared to those of films deposited by thermal ALD.

Author Contributions

K.-M.K. and J.S.J. performed the experiments; K.-M.K. and N.-K.C. analyzed the data; S.-G.Y. and N.-K.C. contributed material and experimental tools; K.-M.K., J.-Y.Y. and N.-K.C. wrote the paper. All authors have read and agreed to the published version of the manuscript.

Funding

This research was supported by Characterization Platform for Advanced Materials and Development of Reliability Measurement Technology for Hydrogen Refueling Station funded by Korea Research Institute of Standards and Science (KRISS–2020–GP2020-0011, KRISS–2020–GP2020-0007).

Conflicts of Interest

The authors declare no competing financial interests.

References

  1. Masuda, H.; Nakai, M.; Kubo, M. Characteristics and limitation of scaled-down MOSFET’s due to two-dimensional field effect. IEEE Trans. Electron Devices 1979, 26, 980–986. [Google Scholar] [CrossRef]
  2. Han, D.; Kang, J.; Lin, C.; Han, R. Reliability characteristics of high-K gate dielectrics HfO2 in metal-oxide semiconductor capacitors. Microelectron. Eng. 2003, 66, 643–647. [Google Scholar] [CrossRef]
  3. Gusev, E.P.; D’Emic, C.P. Charge detrapping in HfO2 high-κ gate dielectric stacks. Appl. Phys. Lett. 2003, 83, 5223–5225. [Google Scholar] [CrossRef]
  4. Nakajima, K.; Joumori, S.; Suzuki, M.; Kimura, K.; Osipowicz, T.; Tok, K.L.; Zheng, J.Z.; See, A.; Zhang, B.C. Strain profiling of HfO2/Si(001) interface with high-resolution Rutherford backscattering spectroscopy. Appl. Phys. Lett. 2003, 83, 296–298. [Google Scholar] [CrossRef] [Green Version]
  5. An, J.-K.; Chung, N.-K.; Kim, J.-T.; Hahm, S.-H.; Lee, G.; Lee, S.; Lee, T.; Park, I.-S.; Yun, J.-Y. Effect of Growth Temperature on the Structural and Electrical Properties of ZrO2 Films Fabricated by Atomic Layer Deposition Using a CpZr[N(CH3)2]3/C7H8 Cocktail Precursor. Materials 2018, 11, 386. [Google Scholar] [CrossRef] [PubMed] [Green Version]
  6. He, W. ALD: Atomic Layer Deposition—Precise and Conformal Coating for Better Performance. In Handbook of Manufacturing Engineering and Technology; Springer: London, UK, 2015; pp. 2959–2996. ISBN 9781447146704. [Google Scholar]
  7. Johnson, R.W.; Hultqvist, A.; Bent, S.F. A brief review of atomic layer deposition: From fundamentals to applications. Mater. Today 2014, 17, 236–246. [Google Scholar] [CrossRef]
  8. Vähä-Nissi, M.; Pitkänen, M.; Salo, E.; Sievänen-Rahijärvi, J.; Putkonen, M.; Harlin, A. Atomic layer deposited thin barrier films for packaging. Cellul. Chem. Technol. 2015, 49, 575–585. [Google Scholar]
  9. Zou, M.; Ma, Y.; Yuan, X.; Hu, Y.; Liu, J.; Jin, Z. Flexible devices: From materials, architectures to applications. J. Semicond. 2018, 39, 011010. [Google Scholar] [CrossRef]
  10. Huang, S.; Liu, Y.; Zhao, Y.; Ren, Z.; Guo, C.F. Flexible Electronics: Stretchable Electrodes and Their Future. Adv. Funct. Mater. 2019, 29, 1805924. [Google Scholar] [CrossRef]
  11. Oh, N.K.; Kim, J.-T.; Ahn, J.-K.; Kang, G.; Kim, S.Y.; Yun, J.-Y. The Effects of Thermal Decomposition of Tetrakis-ethylmethylaminohafnium (TEMAHf) Precursors on HfO2 Film Growth using Atomic Layer Deposition. Appl. Sci. Converg. Technol. 2016, 25, 56–60. [Google Scholar] [CrossRef]
  12. Niu, G.; Kim, H.-D.; Roelofs, R.; Perez, E.; Schubert, M.A.; Zaumseil, P.; Costina, I.; Wenger, C. Material insights of HfO2-based integrated 1-transistor-1-resistor resistive random access memory devices processed by batch atomic layer deposition. Sci. Rep. 2016, 6, 28155. [Google Scholar] [CrossRef] [PubMed] [Green Version]
  13. Fan, J.; Liu, H.; Kuang, Q.; Gao, B.; Ma, F.; Hao, Y. Physical properties and electrical characteristics of H2O-based and O3-based HfO2 films deposited by ALD. Microelectron. Reliab. 2012, 52, 1043–1049. [Google Scholar] [CrossRef]
  14. Kim, J.H.; Park, T.J.; Kim, S.K.; Cho, D.-Y.; Jung, H.-S.; Lee, S.Y.; Hwang, C.S. Chemical structures and electrical properties of atomic layer deposited HfO2 thin films grown at an extremely low temperature (≤ 100 °C) using O3 as an oxygen source. Appl. Surf. Sci. 2014, 292, 852–856. [Google Scholar] [CrossRef]
  15. Richter, C.; Schenk, T.; Schroeder, U.; Mikolajick, T. Film properties of low temperature HfO2 grown with H2O, O3, or remote O2 -plasma. J. Vac. Sci. Technol. A Vac. Surf. Film. 2014, 32, 01A117. [Google Scholar] [CrossRef]
  16. Xiao, Z.; Kisslinger, K.; Chance, S.; Banks, S. Comparison of Hafnium Dioxide and Zirconium Dioxide Grown by Plasma-Enhanced Atomic Layer Deposition for the Application of Electronic Materials. Crystals 2020, 10, 136. [Google Scholar] [CrossRef] [Green Version]
  17. Chen, Z.; Wang, H.; Wang, X.; Chen, P.; Liu, Y.; Zhao, H.; Zhao, Y.; Duan, Y. Low-temperature remote plasma enhanced atomic layer deposition of ZrO2/zircone nanolaminate film for efficient encapsulation of flexible organic light-emitting diodes. Sci. Rep. 2017, 7, 1–9. [Google Scholar] [CrossRef] [Green Version]
  18. Barrera-Díaz, C.; Cañizares, P.; Fernández, F.J.; Natividad, R.; Rodrigo, M.A. Electrochemical Advanced Oxidation Processes: An Overview of the Current Applications to Actual Industrial Effluents. J. Mex. Chem. Soc. 2017, 58, 256–275. [Google Scholar] [CrossRef] [Green Version]
  19. Poyatos, J.M.; Muñio, M.M.; Almecija, M.C.; Torres, J.C.; Hontoria, E.; Osorio, F. Advanced Oxidation Processes for Wastewater Treatment: State of the Art. Water. Air. Soil Pollut. 2010, 205, 187–204. [Google Scholar] [CrossRef]
  20. Rodríguez, A.; Rosal, R.; Perdigón-Melón, J.A.; Mezcua, M.; Agüera, A.; Hernando, M.D.; Letón, P.; Fernández-Alba, A.R.; García-Calvo, E. Ozone-Based Technologies in Water and Wastewater Treatment. In Emerging Contaminants from Industrial and Municipal Waste; Springer: Berlin/Heidelberg, Germany, 2008; pp. 127–175. ISBN 9783540792093. [Google Scholar]
  21. Profijt, H.B.; Potts, S.E.; van de Sanden, M.C.M.; Kessels, W.M.M. Plasma-Assisted Atomic Layer Deposition: Basics, Opportunities, and Challenges. J. Vac. Sci. Technol. A Vac. Surf. Film. 2011, 29, 050801. [Google Scholar] [CrossRef] [Green Version]
  22. Provine, J.; Schindler, P.; Torgersen, J.; Kim, H.J.; Karnthaler, H.-P.; Prinz, F.B. Atomic layer deposition by reaction of molecular oxygen with tetrakisdimethylamido-metal precursors. J. Vac. Sci. Technol. A Vac. Surf. Film. 2016, 34, 01A138. [Google Scholar] [CrossRef] [Green Version]
  23. Fang, G.Y.; Xu, L.N.; Cao, Y.Q.; Wang, L.G.; Wu, D.; Li, A.D. Self-catalysis by aminosilanes and strong surface oxidation by O2 plasma in plasma-enhanced atomic layer deposition of high-quality SiO2. Chem. Commun. 2015, 51, 1341–1344. [Google Scholar] [CrossRef] [PubMed]
  24. Becker, M.; Sierka, M. Atomistic simulations of plasma-enhanced atomic layer deposition. Materials 2019, 12, 2605. [Google Scholar] [CrossRef] [PubMed] [Green Version]
  25. Hoflund, G.B. Application of novel O- and H-atom sources in molecular beam epitaxy. J. Vac. Sci. Technol. B Microelectron. Nanom. Struct. 1998, 16, 1446. [Google Scholar] [CrossRef]
  26. Khanuja, M.; Sharma, H.; Mehta, B.R.; Shivaprasad, S.M. XPS depth-profile of the suboxide distribution at the native oxide/Ta interface. J. Electron Spectros. Relat. Phenom. 2009, 169, 41–45. [Google Scholar] [CrossRef]
  27. Knoops, H.C.M.; Potts, S.E.; Bol, A.A.; Kessels, W.M.M. Atomic Layer Deposition. In Handbook of Crystal Growth; Elsevier: Amsterdam, The Netherlands, 2015; pp. 1101–1134. ISBN 9780444633040. [Google Scholar]
  28. Chae, H.; Sawin, H.H. Plasma Kinetic Study of Silicon-Dioxide Removal with Fluorocompounds in a Plasma-Enhanced Chemical Vapor Deposition Chamber. J. Korean Phys. Soc. 2007, 51, 978. [Google Scholar] [CrossRef]
  29. Cho, D.-Y.; Jung, H.S.; Yu, I.-H.; Yoon, J.H.; Kim, H.K.; Lee, S.Y.; Jeon, S.H.; Han, S.; Kim, J.H.; Park, T.J.; et al. Stabilization of Tetragonal HfO2 under Low Active Oxygen Source Environment in Atomic Layer Deposition. Chem. Mater. 2012, 24, 3534–3543. [Google Scholar] [CrossRef]
  30. Kondaiah, P.; Shaik, H.; Mohan Rao, G. Studies on RF magnetron sputtered HfO2 thin films for microelectronic applications. Electron. Mater. Lett. 2015, 11, 592–600. [Google Scholar] [CrossRef]
  31. Luo, X.; Li, Y.; Yang, H.; Liang, Y.; He, K.; Sun, W.; Lin, H.-H.; Yao, S.; Lu, X.; Wan, L.; et al. Investigation of HfO2 Thin Films on Si by X-ray Photoelectron Spectroscopy, Rutherford Backscattering, Grazing Incidence X-ray Diffraction and Variable Angle Spectroscopic Ellipsometry. Crystals 2018, 8, 248. [Google Scholar] [CrossRef] [Green Version]
  32. Blaschke, D.; Munnik, F.; Grenzer, J.; Rebohle, L.; Schmidt, H.; Zahn, P.; Gemming, S. A correlation study of layer growth rate, thickness uniformity, stoichiometry, and hydrogen impurity level in HfO2 thin films grown by ALD between 100 °C and 350 °C. Appl. Surf. Sci. 2020, 506, 144188. [Google Scholar] [CrossRef]
  33. Chourasia, A.R.; Hickman, J.L.; Miller, R.L.; Nixon, G.A.; Seabolt, M.A. X-Ray Photoemission Study of the Oxidation of Hafnium. Int. J. Spectrosc. 2009, 2009, 1–6. [Google Scholar] [CrossRef] [Green Version]
  34. Sopori, B.; Rupnowski, P.; Shet, S.; Budhraja, V.; Call, N.; Johnston, S.; Seacrist, M.; Shi, G.; Chen, J.; Deshpande, A. Influence of defects and defect distributions in multicrystalline silicon on solar cell performance. In Proceedings of the 35th IEEE Photovoltaic Specialists Conference, Honolulu, HI, USA, 20–25 June 2010. [Google Scholar]
  35. Coufová, P.; Novák, J.; Hlasivcová, N. Hydroxyl as a Defect of the Perovskite BaTiO3 Lattice. J. Chem. Phys. 1966, 45, 3171–3174. [Google Scholar] [CrossRef]
  36. Cho, Y.J.; Nguyen, N.V.; Richter, C.A.; Ehrstein, J.R.; Lee, B.H.; Lee, J.C. Spectroscopic ellipsometry characterization of high- k dielectric HfO2 thin films and the high-temperature annealing effects on their optical properties. Appl. Phys. Lett. 2002, 80, 1249–1251. [Google Scholar] [CrossRef] [Green Version]
  37. Nam, T.; Park, Y.J.; Lee, H.; Oh, I.-K.; Ahn, J.-H.; Cho, S.M.; Kim, H.; Lee, H.-B.-R. A composite layer of atomic-layer-deposited Al2O3 and graphene for flexible moisture barrier. Carbon N. Y. 2017, 116, 553–561. [Google Scholar] [CrossRef]
  38. Hu, B.; Yao, M.; Xiao, R.; Chen, J.; Yao, X. Optical properties of amorphous Al2O3 thin films prepared by a sol–gel process. Ceram. Int. 2014, 40, 14133–14139. [Google Scholar] [CrossRef]
  39. Cheynet, M.C.; Pokrant, S.; Tichelaar, F.D.; Rouvière, J.-L. Crystal structure and band gap determination of HfO2 thin films. J. Appl. Phys. 2007, 101, 054101. [Google Scholar] [CrossRef] [Green Version]
  40. Liu, C.; Chor, E.F.; Tan, L.S. Enhanced device performance of AlGaN/GaN HEMTs using HfO2 high- k dielectric for surface passivation and gate oxide. Semicond. Sci. Technol. 2007, 22, 522–527. [Google Scholar] [CrossRef]
  41. Viezbicke, B.D.; Patel, S.; Davis, B.E.; Birnie, D.P. Evaluation of the Tauc method for optical absorption edge determination: ZnO thin films as a model system. Phys. Status Solidi 2015, 252, 1700–1710. [Google Scholar] [CrossRef]
  42. Moreira, L.; Ponce, L.; De Posada, E.; Flores, T. Er:YAG polycrystalline ceramics: Use of SiO2 and B2O3 as sintering additives and their effects on the optical and structural properties. Rev. Cuba. Fis. 2017, 34, 125–132. [Google Scholar]
  43. Taouririt, T.E.; Meftah, A.; Sengouga, N. Effect of the interfacial (low-k SiO2 vs high-k Al2O3) dielectrics on the electrical performance of a-ITZO TFT. Appl. Nanosci. 2018, 8, 1865–1875. [Google Scholar] [CrossRef]
  44. Rahman, M.M.; Kim, J.-G.; Kim, D.-H.; Kim, T.-W. Characterization of Al Incorporation into HfO2 Dielectric by Atomic Layer Deposition. Micromachines 2019, 10, 361. [Google Scholar] [CrossRef] [Green Version]
  45. Zhou, L.; Lu, X.; Chen, L.; Ouyang, X.; Liu, B.; Xu, J.; Tang, H. Leakage Current by Poole–Frenkel Emission in Pt Schottky Contacts on () β-Ga2O3 Grown by Edge-Defined Film-Fed Growth. Ecs J. Solid State Sci. Technol. 2019, 8, Q3054–Q3057. [Google Scholar] [CrossRef]
  46. Wang, Z. Detection of and Protection against Plasma Charging Damage in Modern IC Technology. Ph.D. Thesis, University of Twente, Enschede, The Netherlands, 2004. [Google Scholar]
  47. Park, H.B.; Cho, M.; Park, J.; Hwang, C.S.; Lee, J.-C.; Oh, S.-J. Effects of plasma nitridation of Al2O3 interlayer on thermal stability, fixed charge density, and interfacial trap states of HfO2 gate dielectric films grown by atomic layer deposition. J. Appl. Phys. 2003, 94, 1898–1903. [Google Scholar] [CrossRef]
Figure 1. (ad) GPC values of HfO2 deposited at 80 °C by thermal ALD and PEALD as functions of precursor exposure time, reactant exposure time, purge time and plasma exposure time. (e) Thickness values as a function of ALD cycles with thermal ALD and PEALD. (f) ALD windows as functions of deposition temperature with thermal ALD (150–200 °C) and PEALD (80–150 °C).
Materials 13 02008 g001
Figure 2. (a,b) XRD pattern in HfO2 thin films (50 nm) deposited at 80–250 °C by thermal ALD and PEALD, measured by GIXRD. (c) Density of HfO2 thin films (50 nm) formed at 80 °C by thermal ALD and PEALD, measured by XRR. (d,e) AFM topography images of HfO2 thin films (50 nm) deposited by thermal ALD and PEALD. (f) Root mean square (RMS) roughness of HfO2 by growth temperatures (80–250 °C).
Materials 13 02008 g002
Figure 3. (a,b) Hf 4f and (c,d) O 1s spectra of HfO2 thin films (50 nm) on Si substrate fabricated by thermal ALD and PEALD. Gray dotted lines and blue solid lines are sum of the spectra before fitting and sum of the deconvoluted peaks after fitting, respectively. (e) Surface component percentages of O, Hf, C and N in HfO2 thin films (50 nm). The error bars represent the standard deviations.
Materials 13 02008 g003
Figure 4. (a) Refractive index (n), extinction coefficient (k) and (b) optical bandgap values extracted using the Tauc method for HfO2 films (50 nm) formed at 80 °C, using thermal ALD and PEALD, as measured by ellipsometry. (c) Transmittance of HfO2 thin films (50 nm) deposited at 80 °C by thermal ALD and PEALD on PET substrate.
Materials 13 02008 g004
Figure 5. (a,b) C–V and (c,d) I–V curves of HfO2 (10 nm) MOS capacitors fabricated, using thermal ALD and PEALD. (e) Flat band voltage and fixed charge density of HfO2 (10 nm) MOS capacitor according to growth temperature (80–250 °C).
Materials 13 02008 g005

