Investigating the Effect of Aggregate Characteristics on the Macroscopic and Microscopic Fracture Mechanisms of Asphalt Concrete at Low-Temperature


Abstract
:1. Introduction
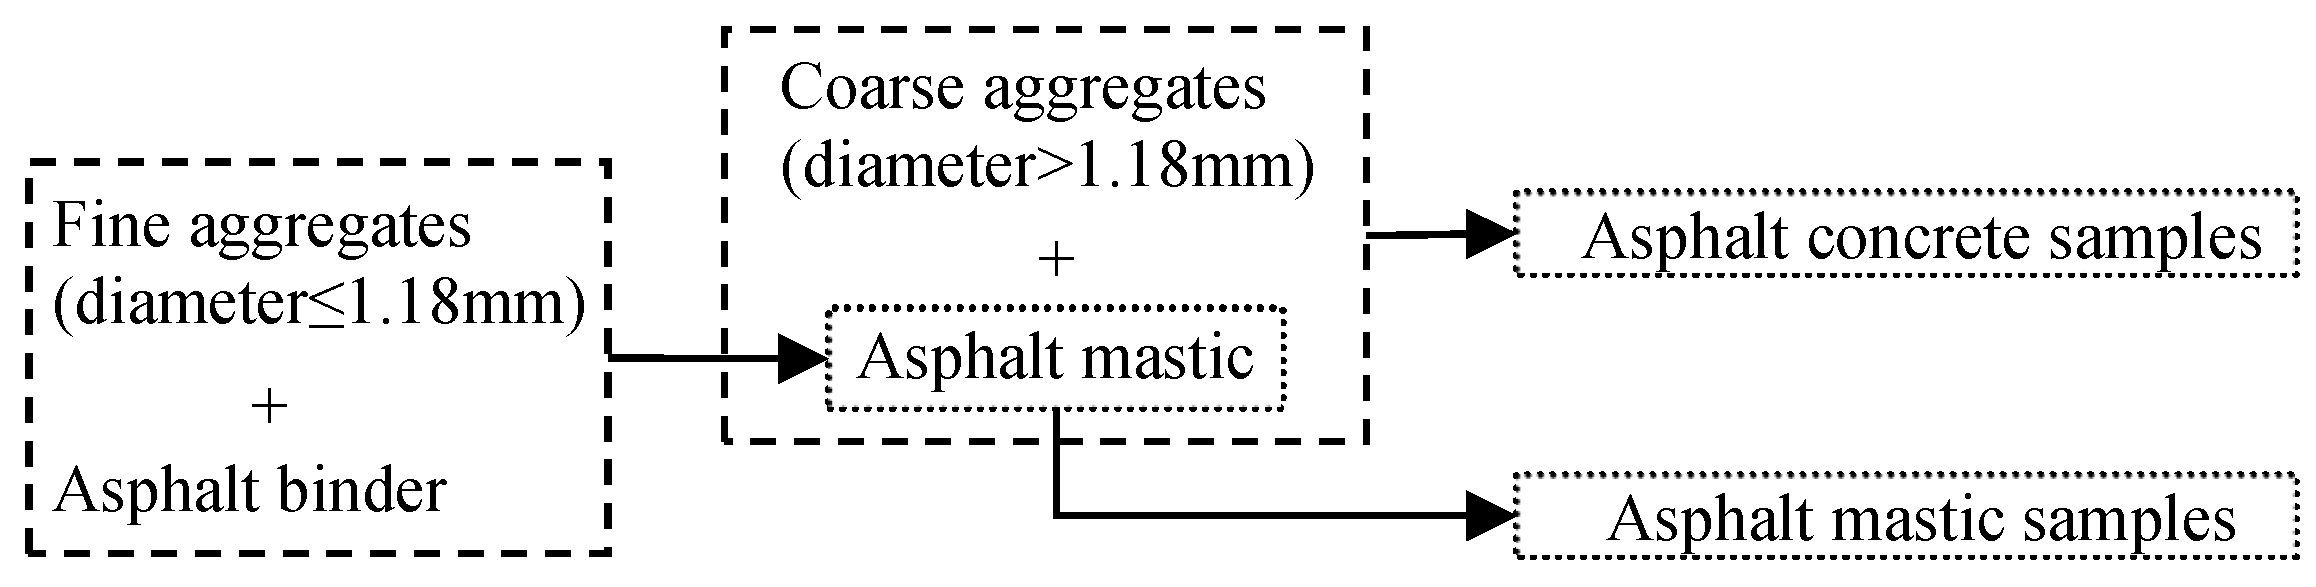
2. Materials
3. Laboratory Test and Discussion
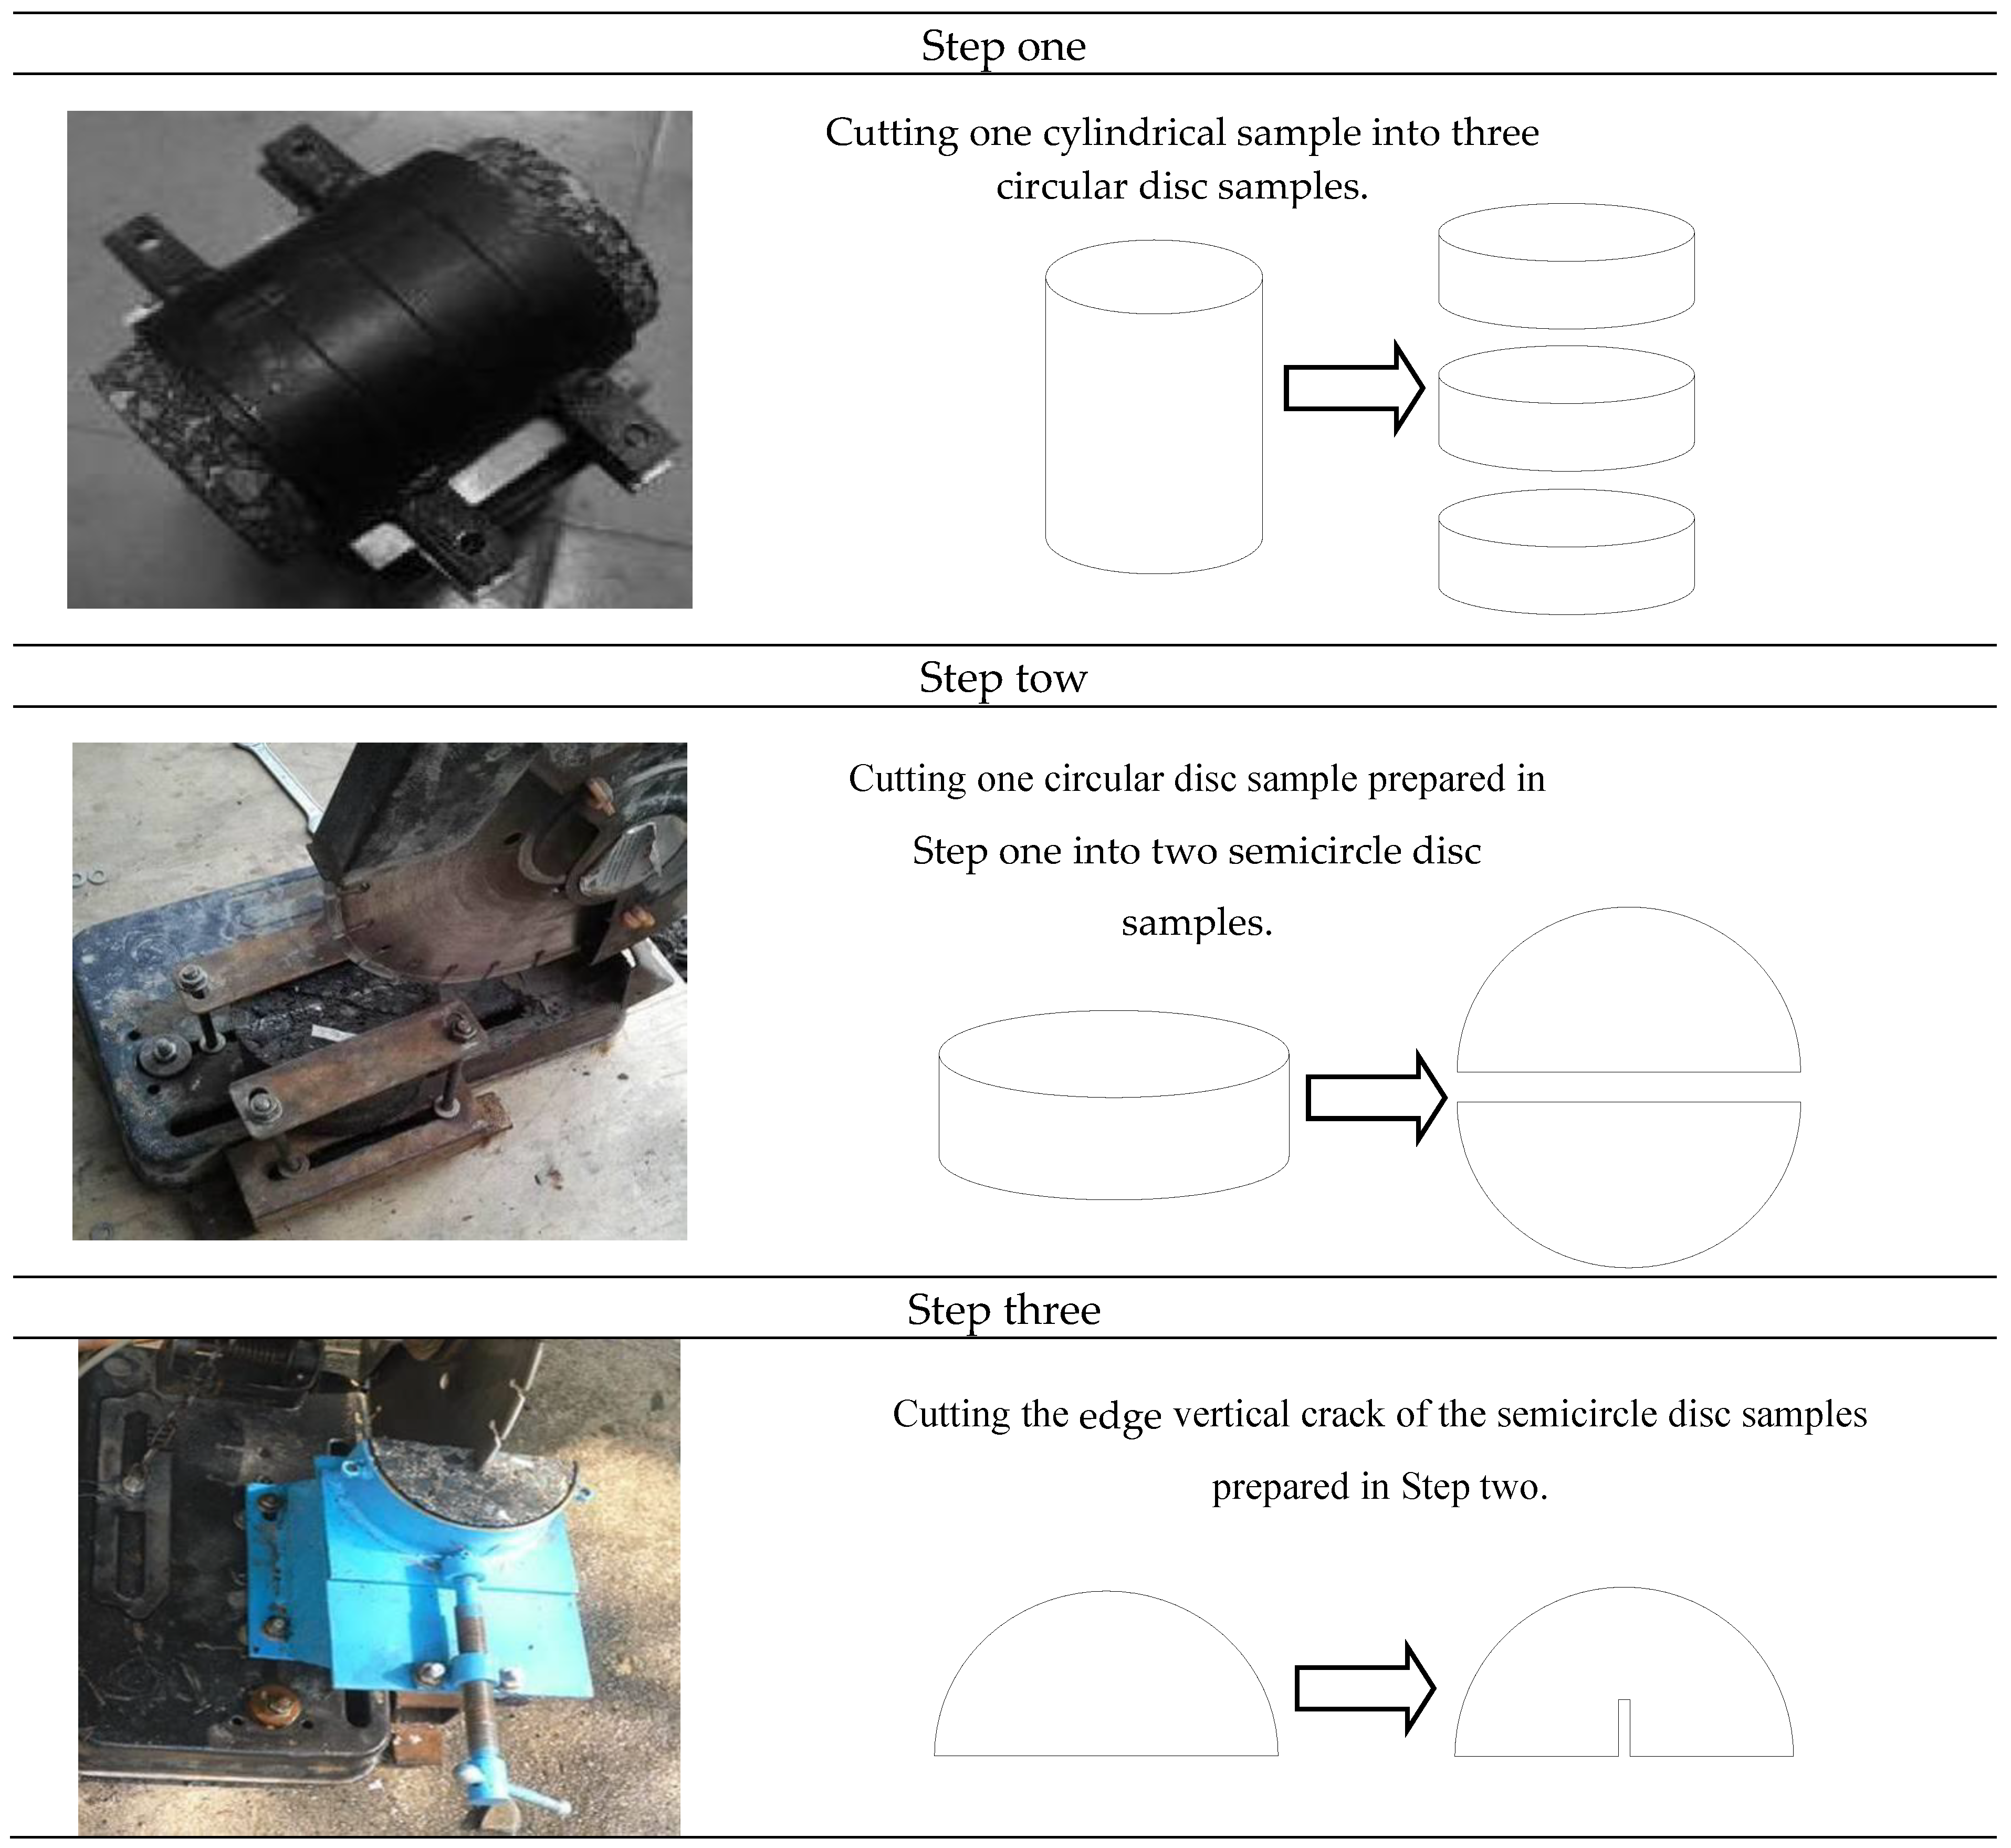
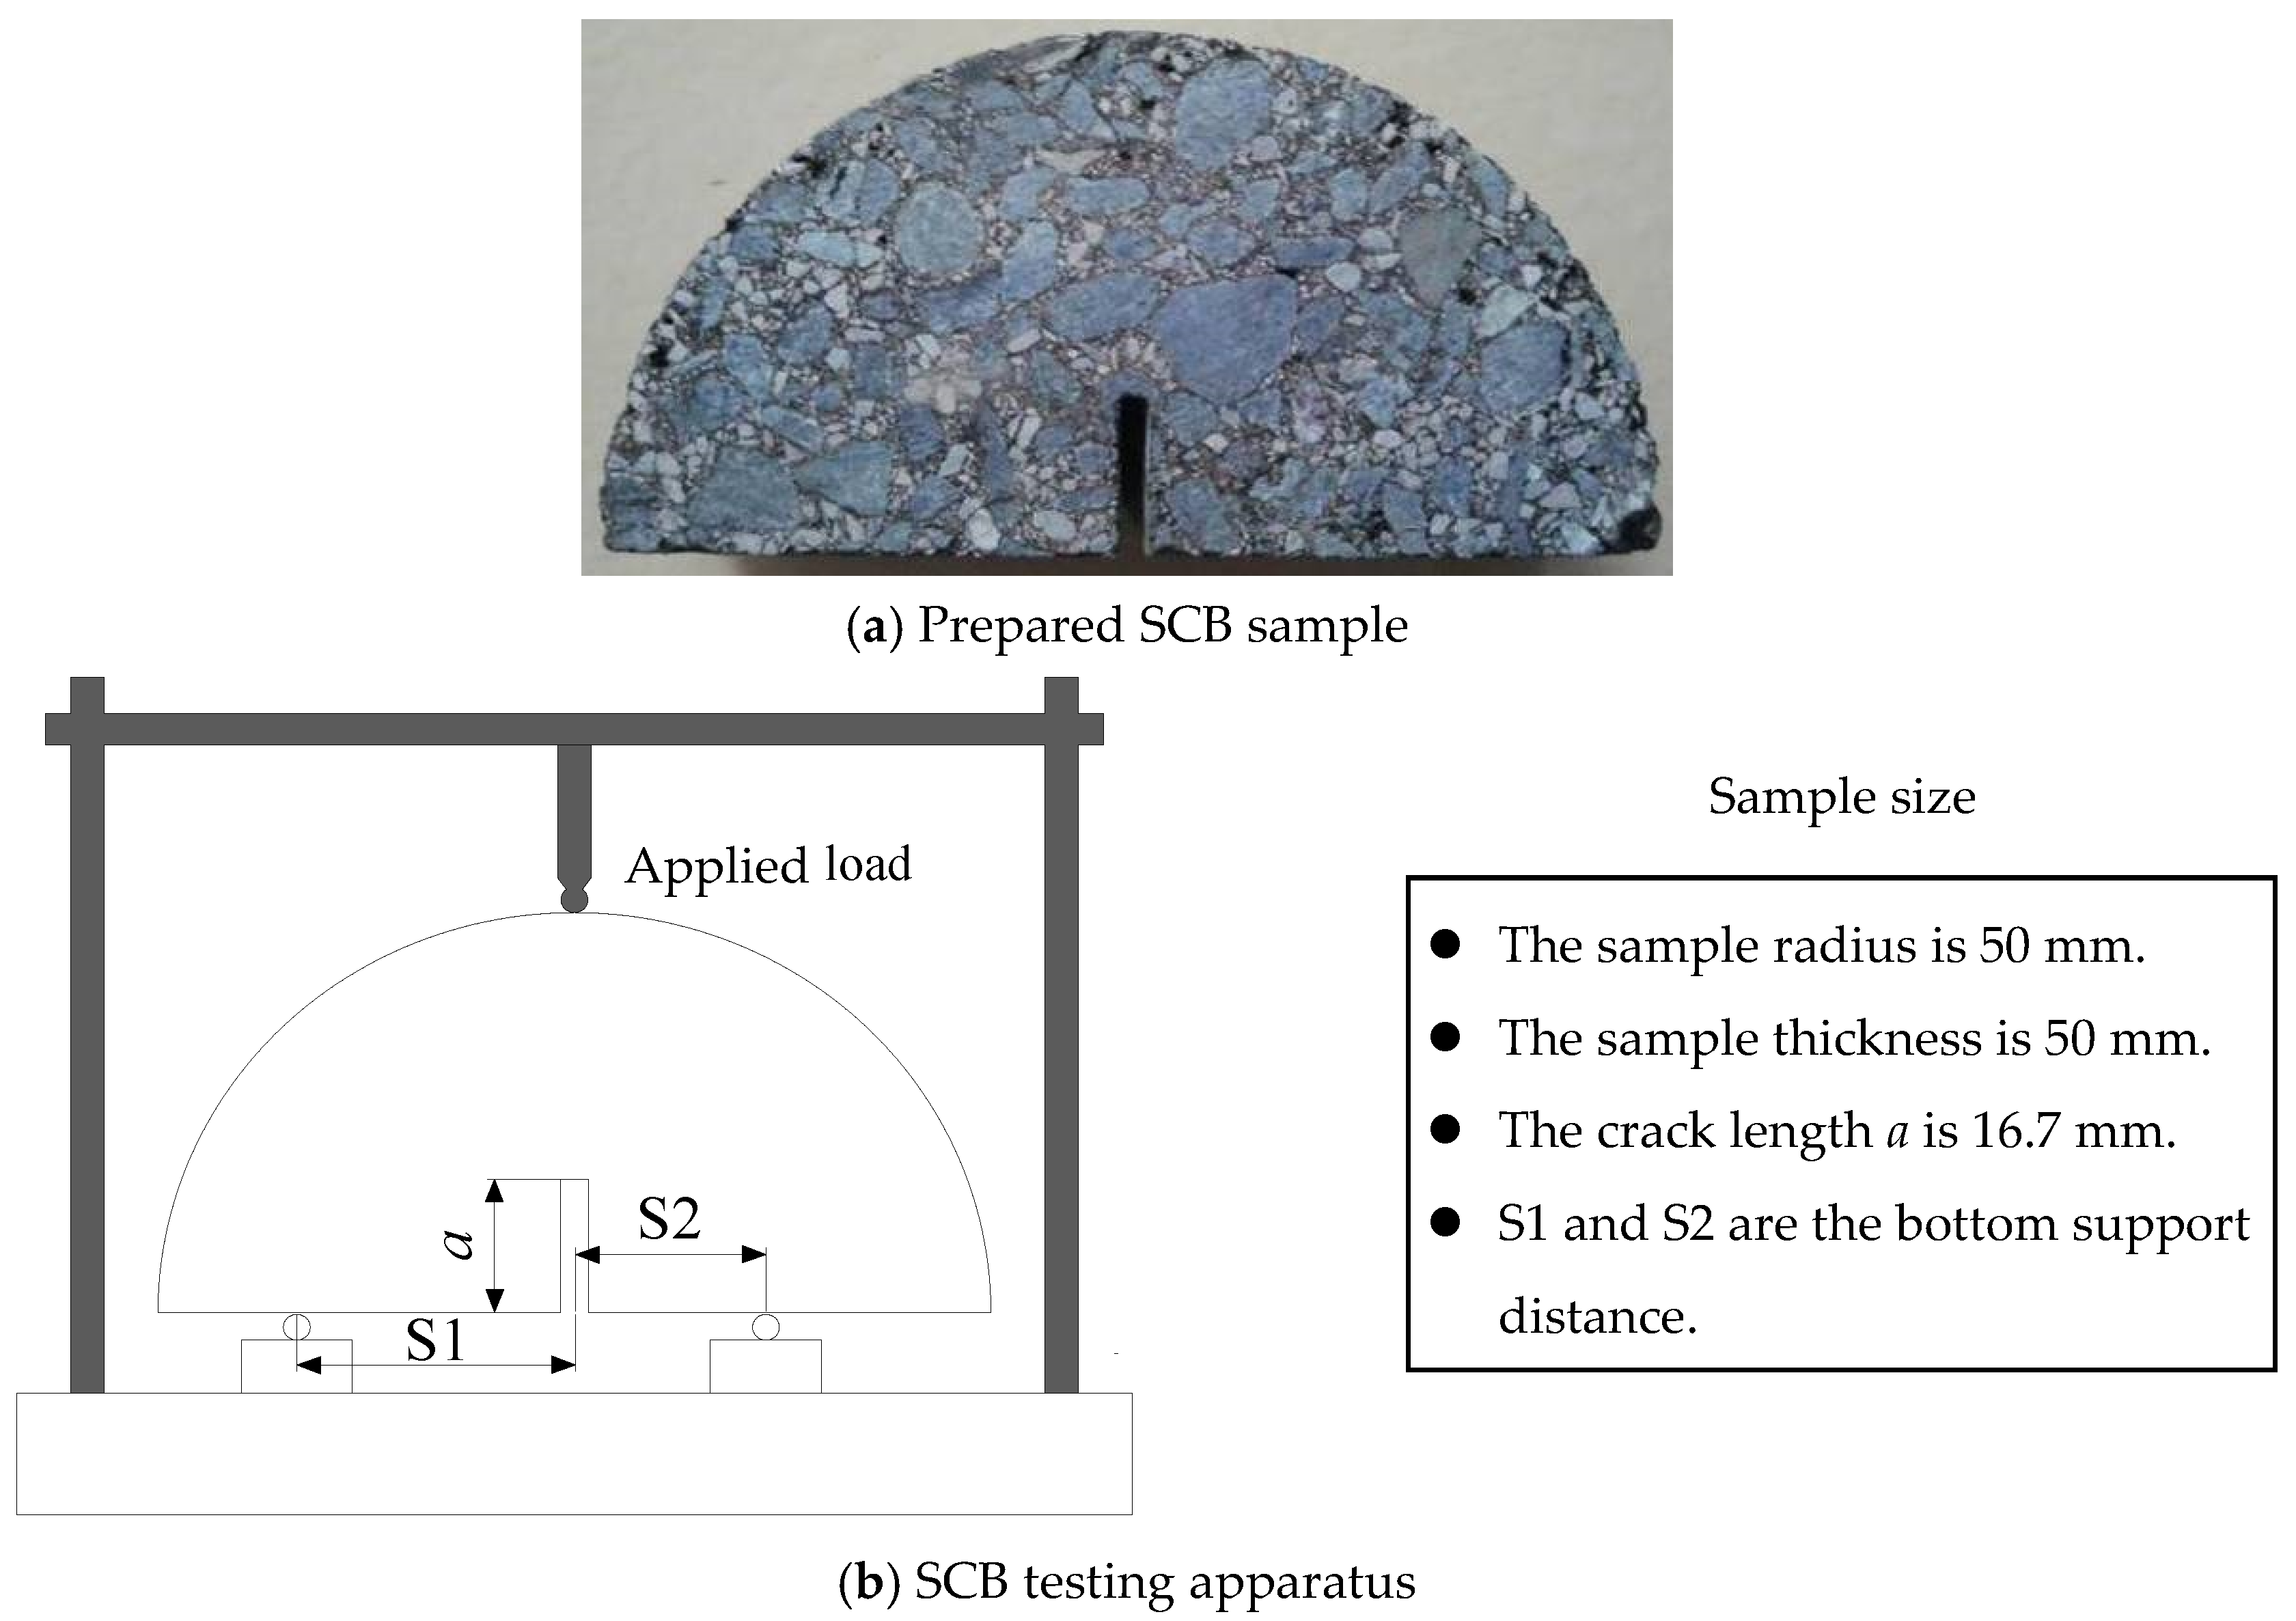
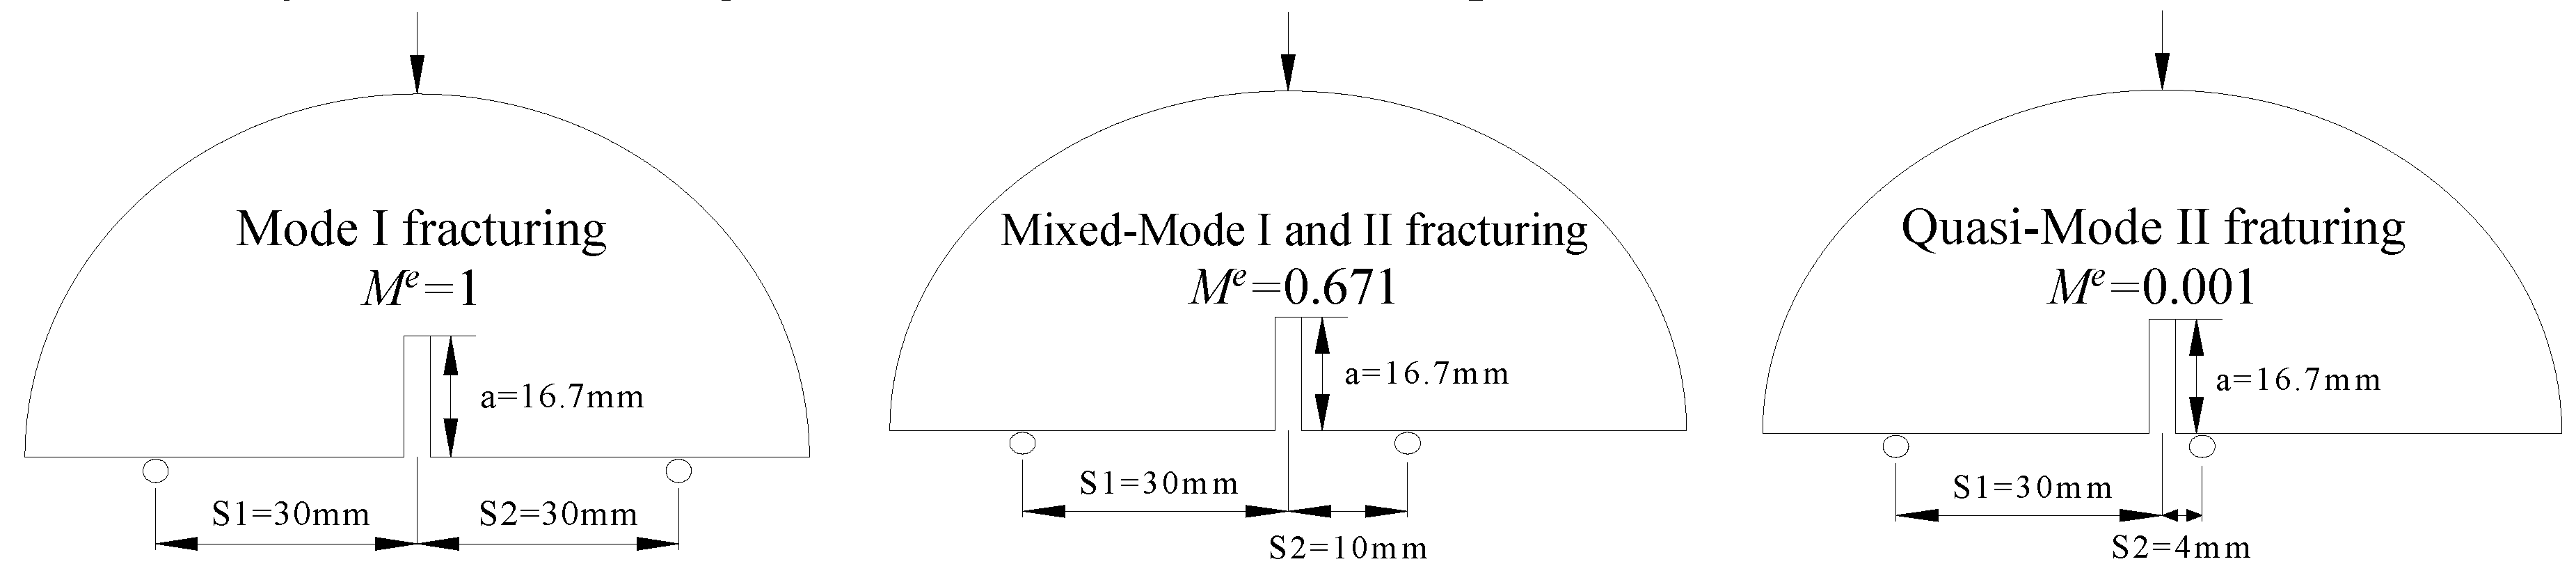
3.1. Laboratory Test
3.2. Test Results and Discussion
- (1)
- The fracture toughness and the crack extended time, at the same temperature, are increased with the increasing coarse aggregate content. The previous works [27,33,34] indicate that there is the optimal percentage of the aggregates in asphalt concrete. When the aggregate content is lower than the optimal percentage, the fracture resistance of asphalt concrete is negatively affected with the decreased aggregate content. This is because the aggregate skeleton structure is weakened gradually with the decreasing coarse aggregate content, and the fracture resistance drops accordingly. The cracks will occur more easily and extend faster.
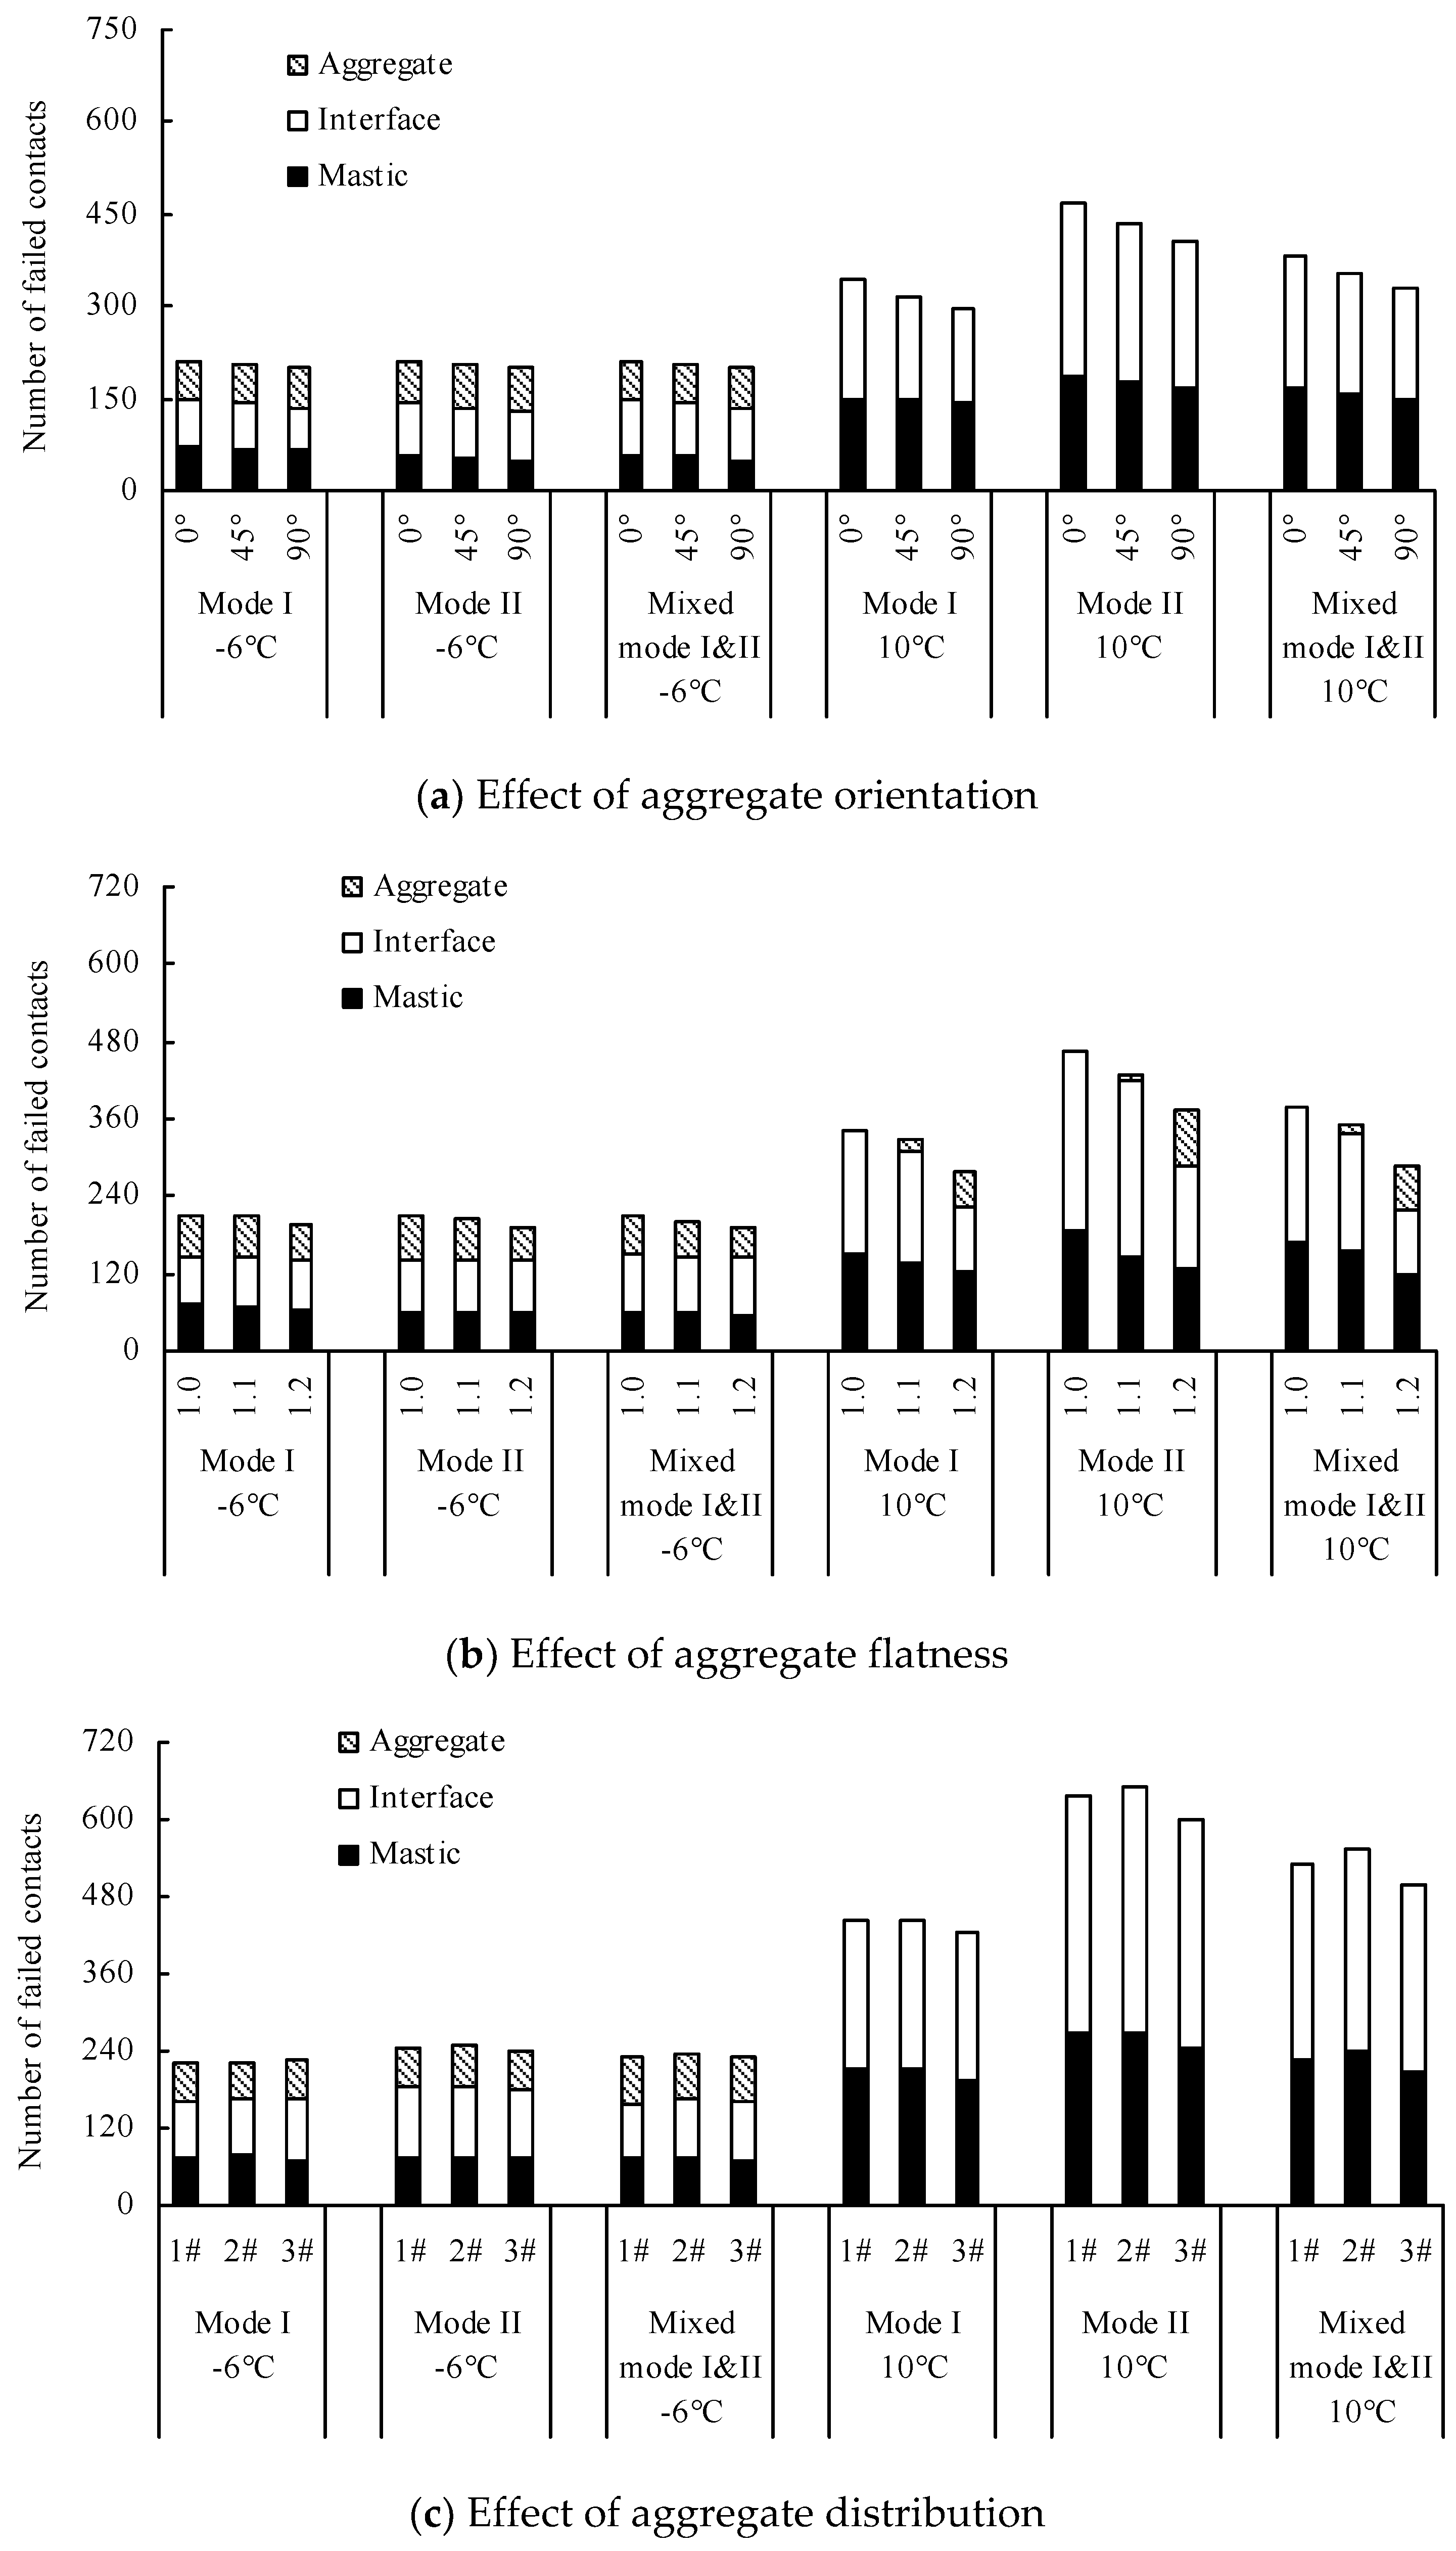
- (2)
- The total crack length in the asphalt concrete, the crack length in the aggregates, and the crack length in the aggregate/mastic interface diminishes with the decreasing coarse aggregate content, while the crack length in the mastic increases. This is because the stiffness of the coarse aggregate is much higher than that of the asphalt mastic, and the crack can be obstructed by the coarse aggregate ahead of its tip. Accompanying the decrease in the coarse aggregate content, cracks pass the mastic directly and easily, and do not have to bypass the coarse aggregate. The crack complexity is also weakened.
- (3)
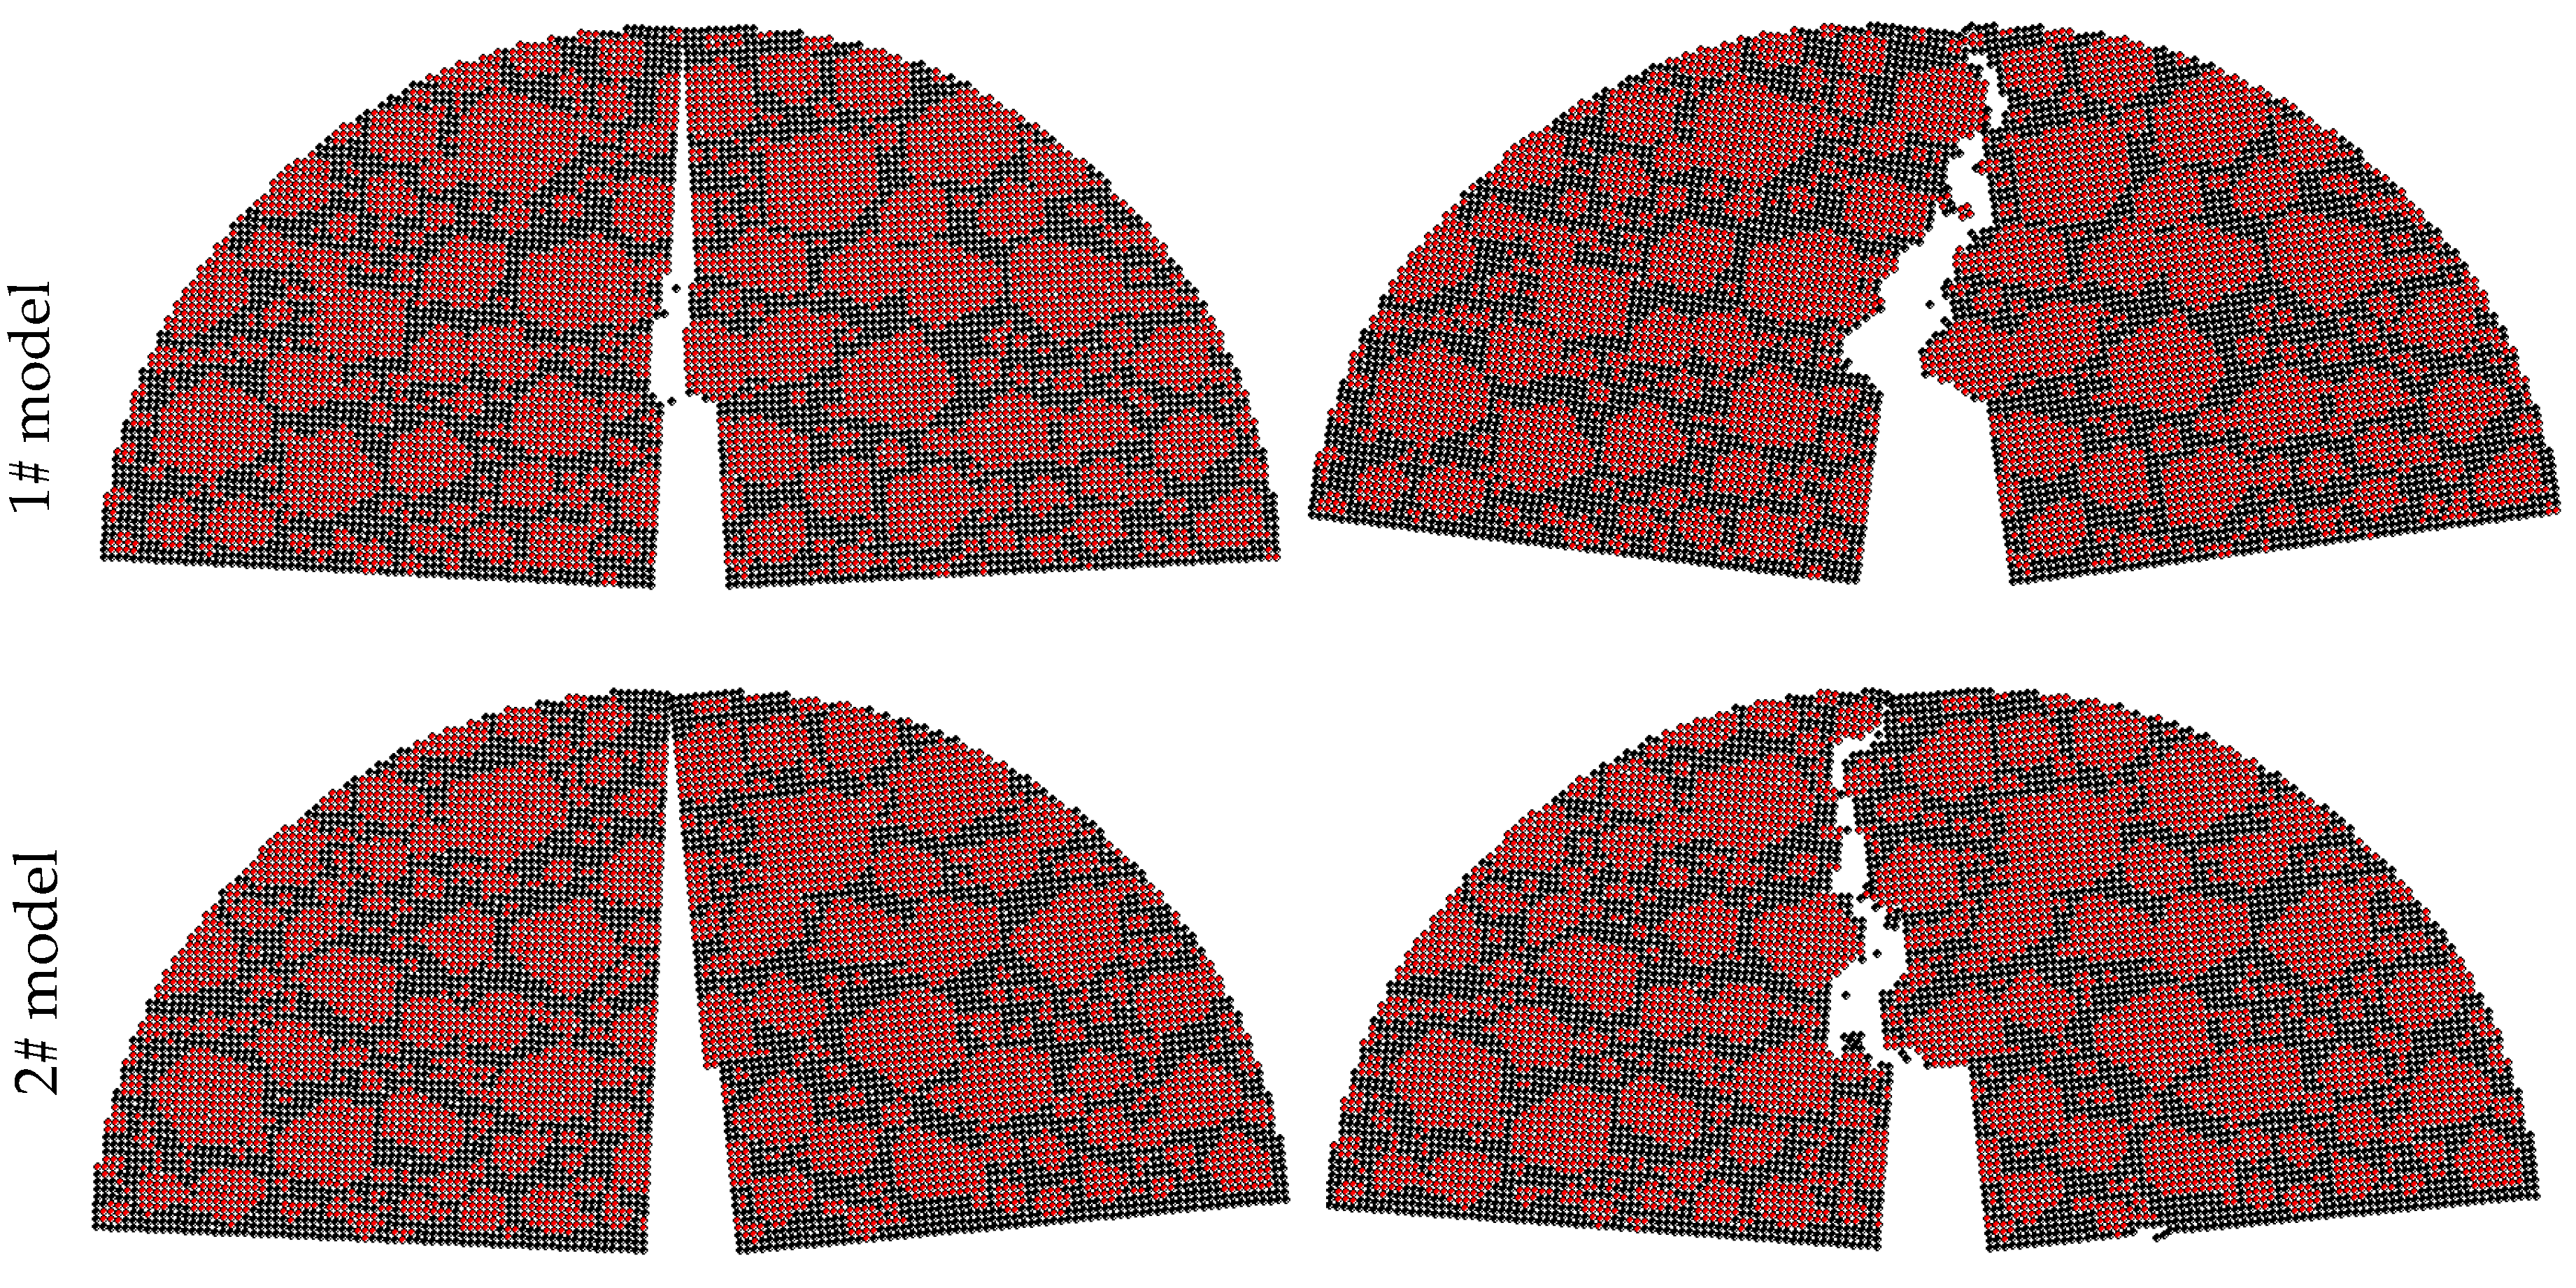
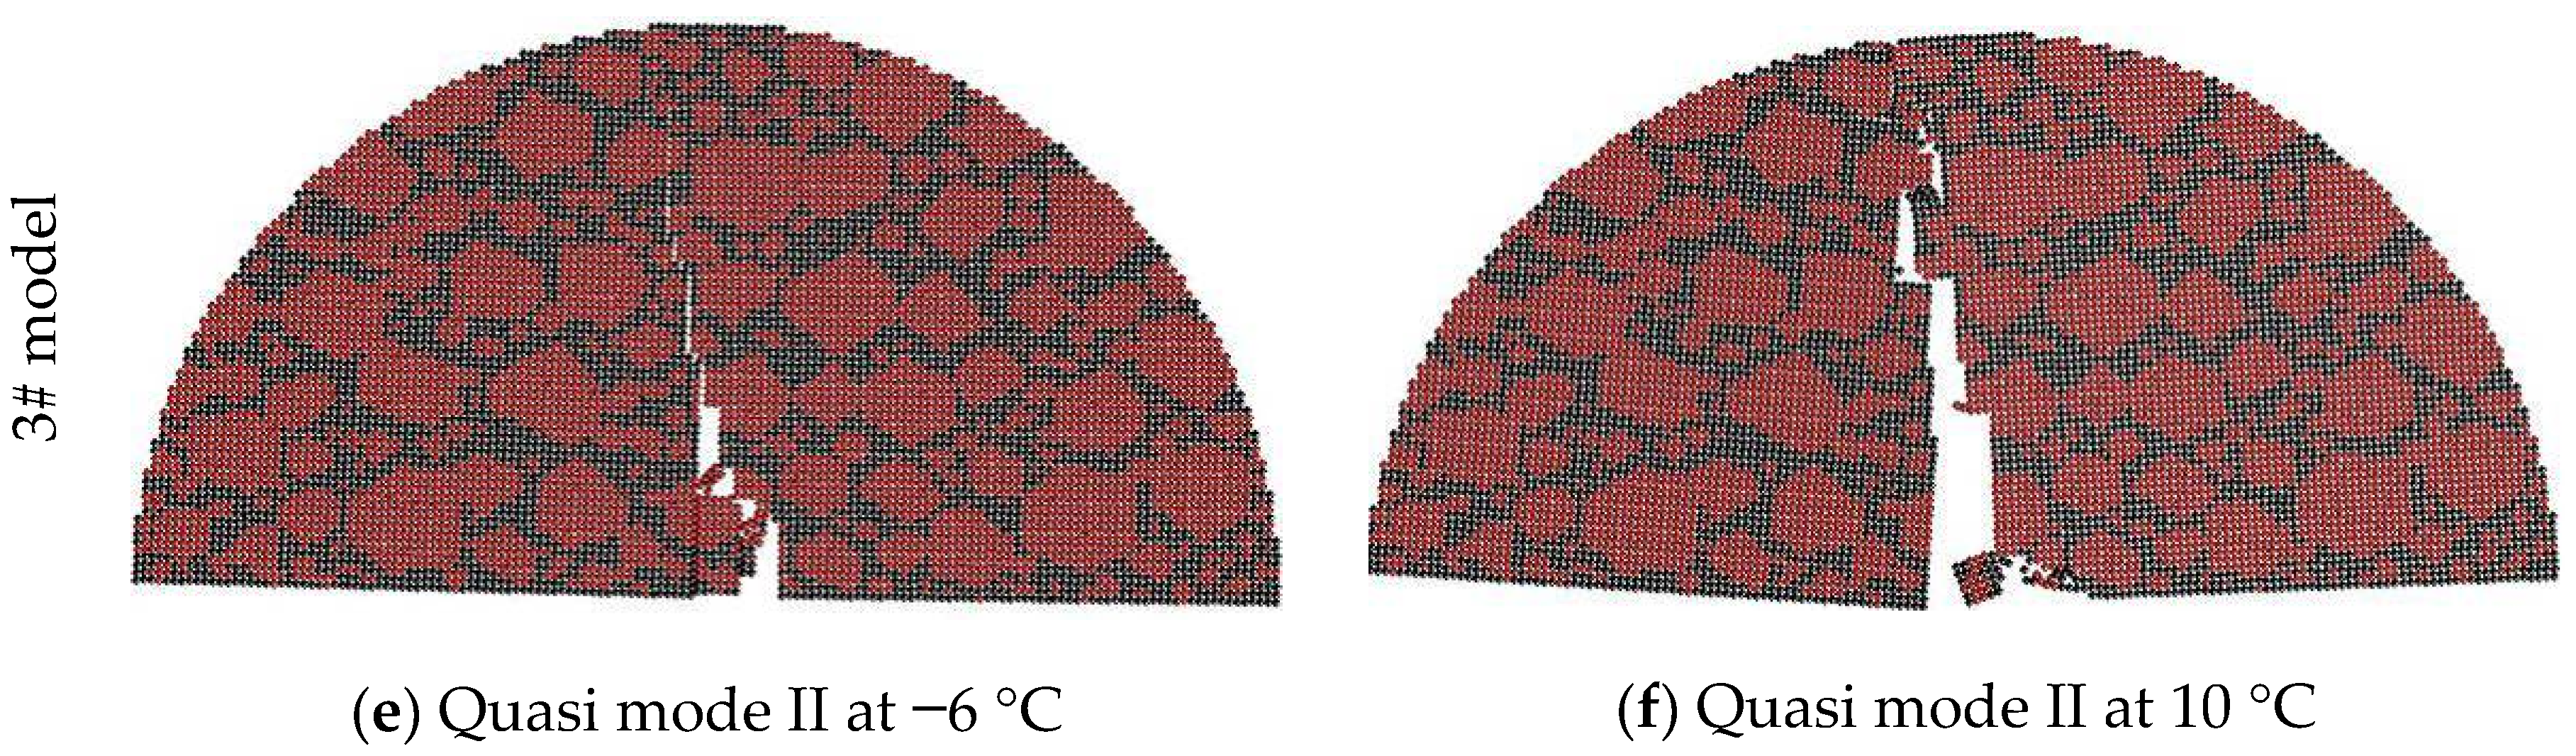
- The effect of the coarse aggregate content on the crack distribution in Quasi-Mode II is more significant than that in other fracturing modes, particularly at 10 °C, showing that the coarse aggregate content influences the crack resistance of asphalt concrete more sensitively in shear loading conditions and at a higher temperature.
- (4)
- The crack distribution has less difference between −6 °C and 0 °C, and it is different from that at 10 °C. Moreover, according to the previous studies [1,23], the low-temperature cracks of asphalt concrete present the elastic—brittle characteristics when the temperature is lower than 0 °C, which will be changed significantly when the temperature is higher than 5 °C because the effect of viscoelasticity provided by asphalt mastic is gradually increased. Hence, −6 °C and 10 °C are selected in the following study.
4. DEM Simulation and Discussion
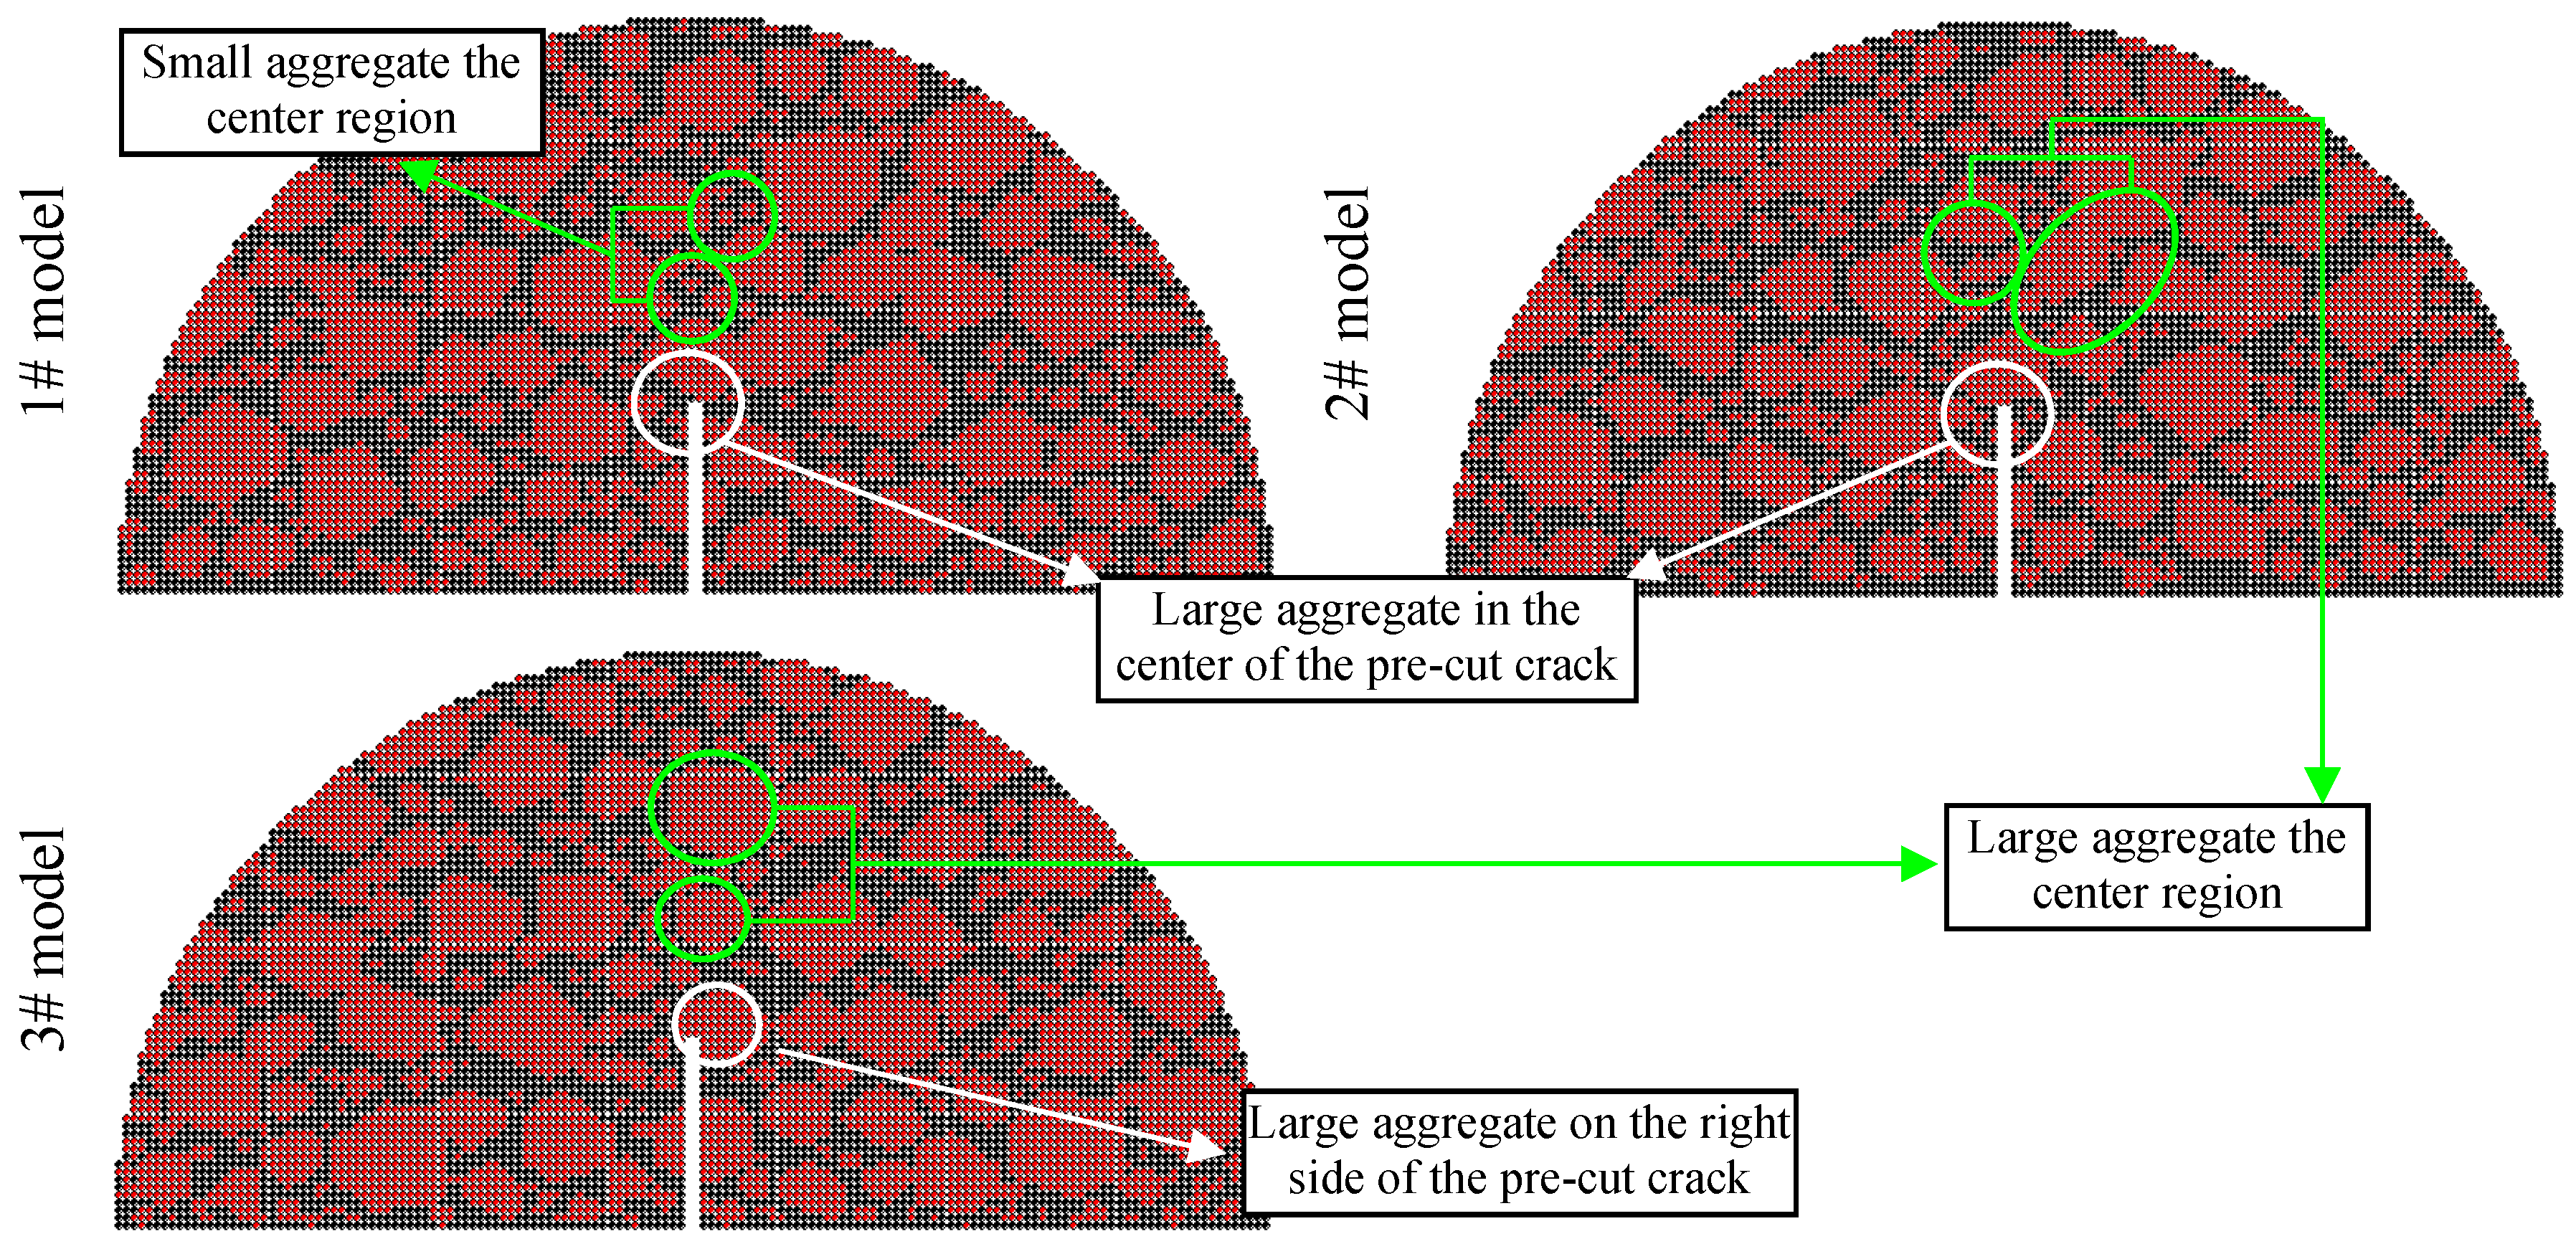
4.1. Simulation Preparation
4.2. Simulation Plan
4.3. Simulation Results and Discussion
4.3.1. Fracture Properties
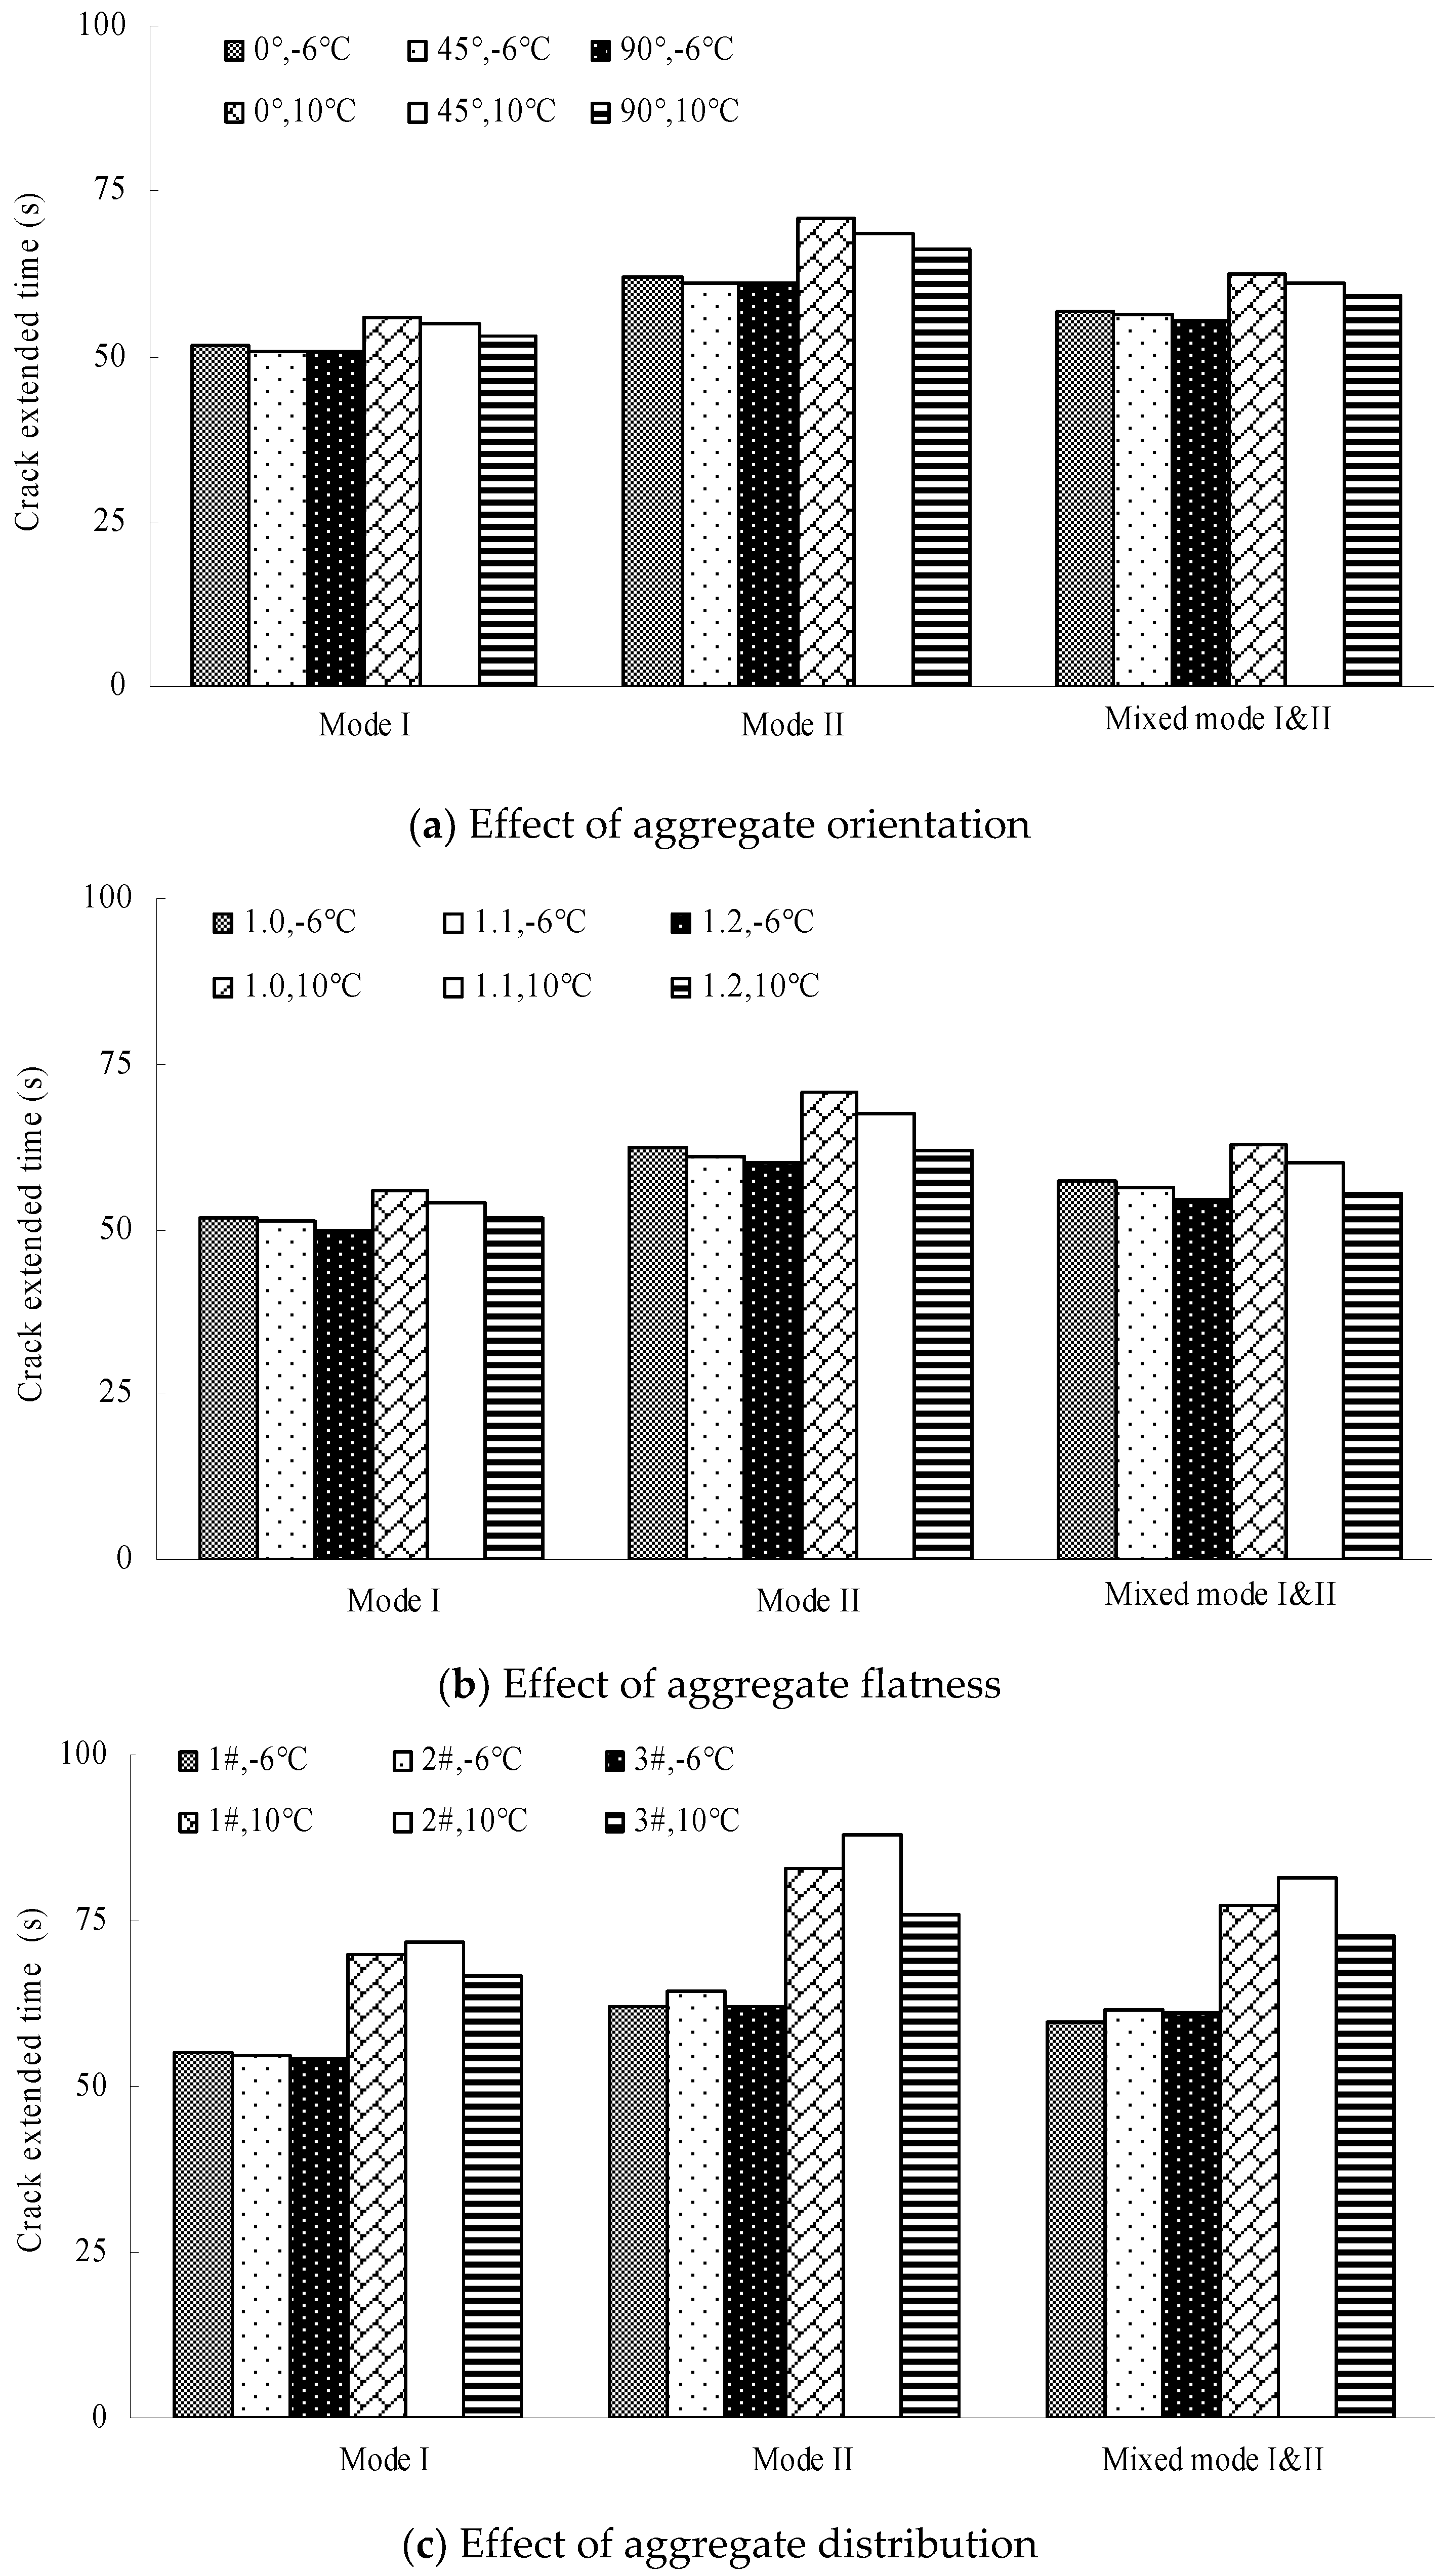
- (1)
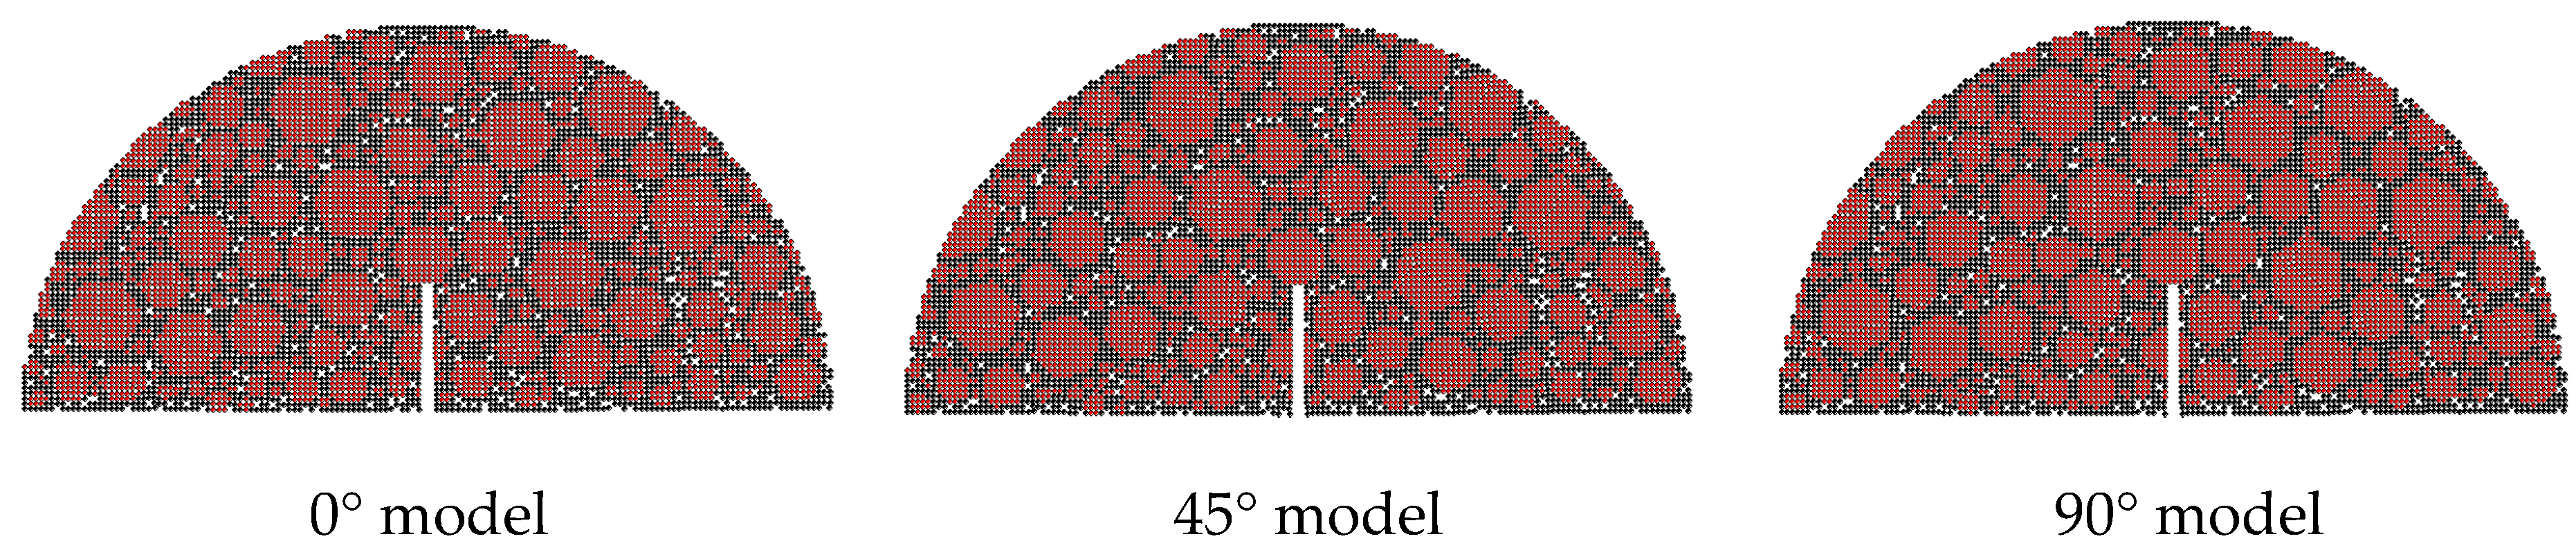
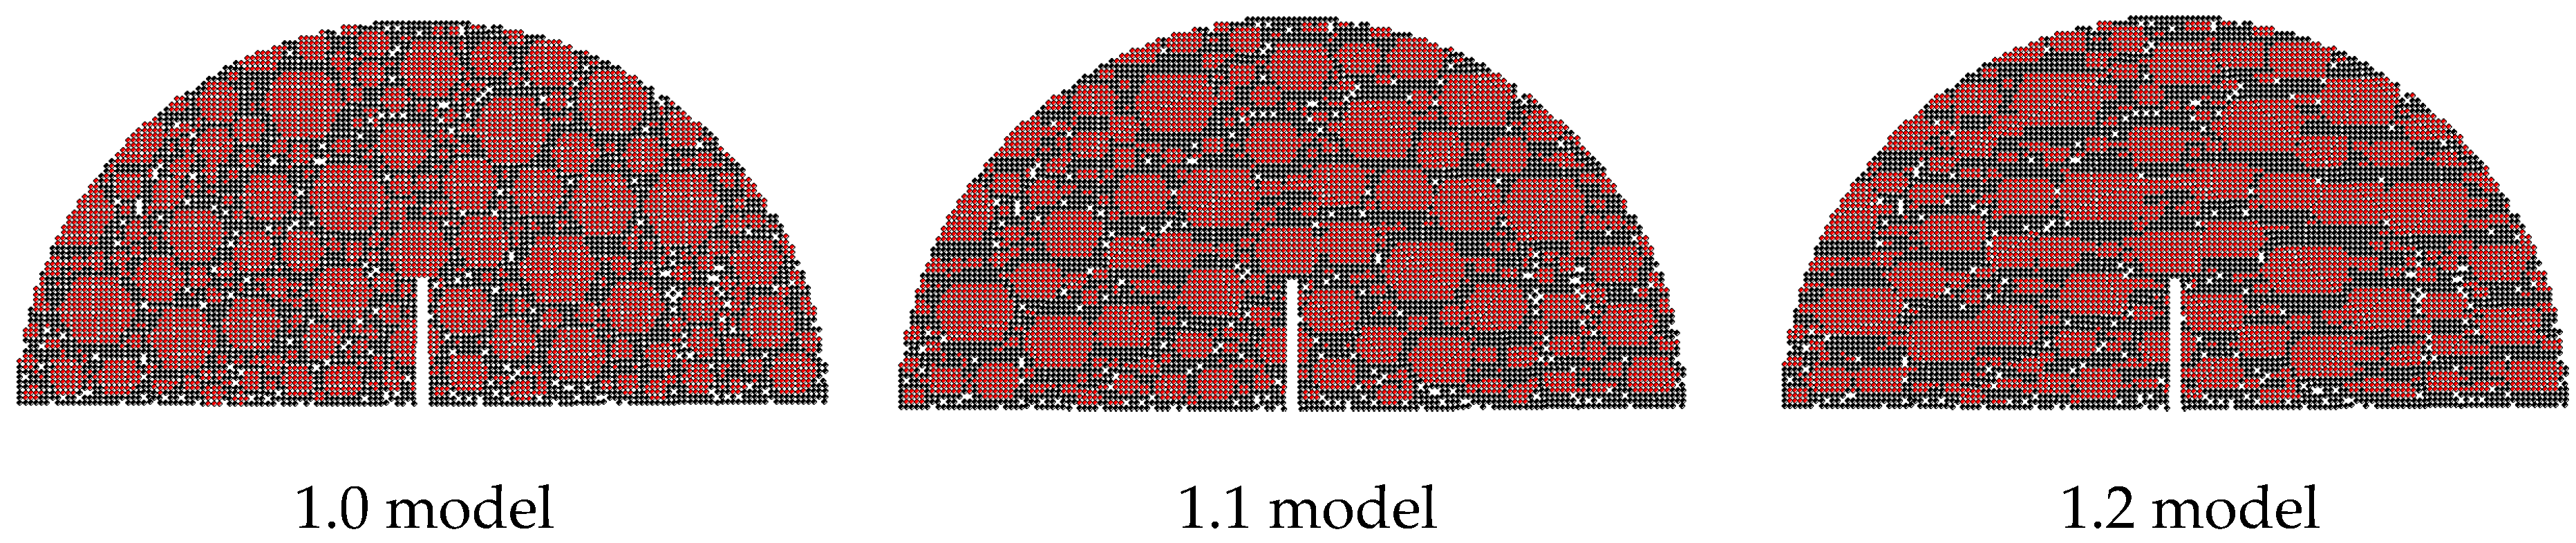
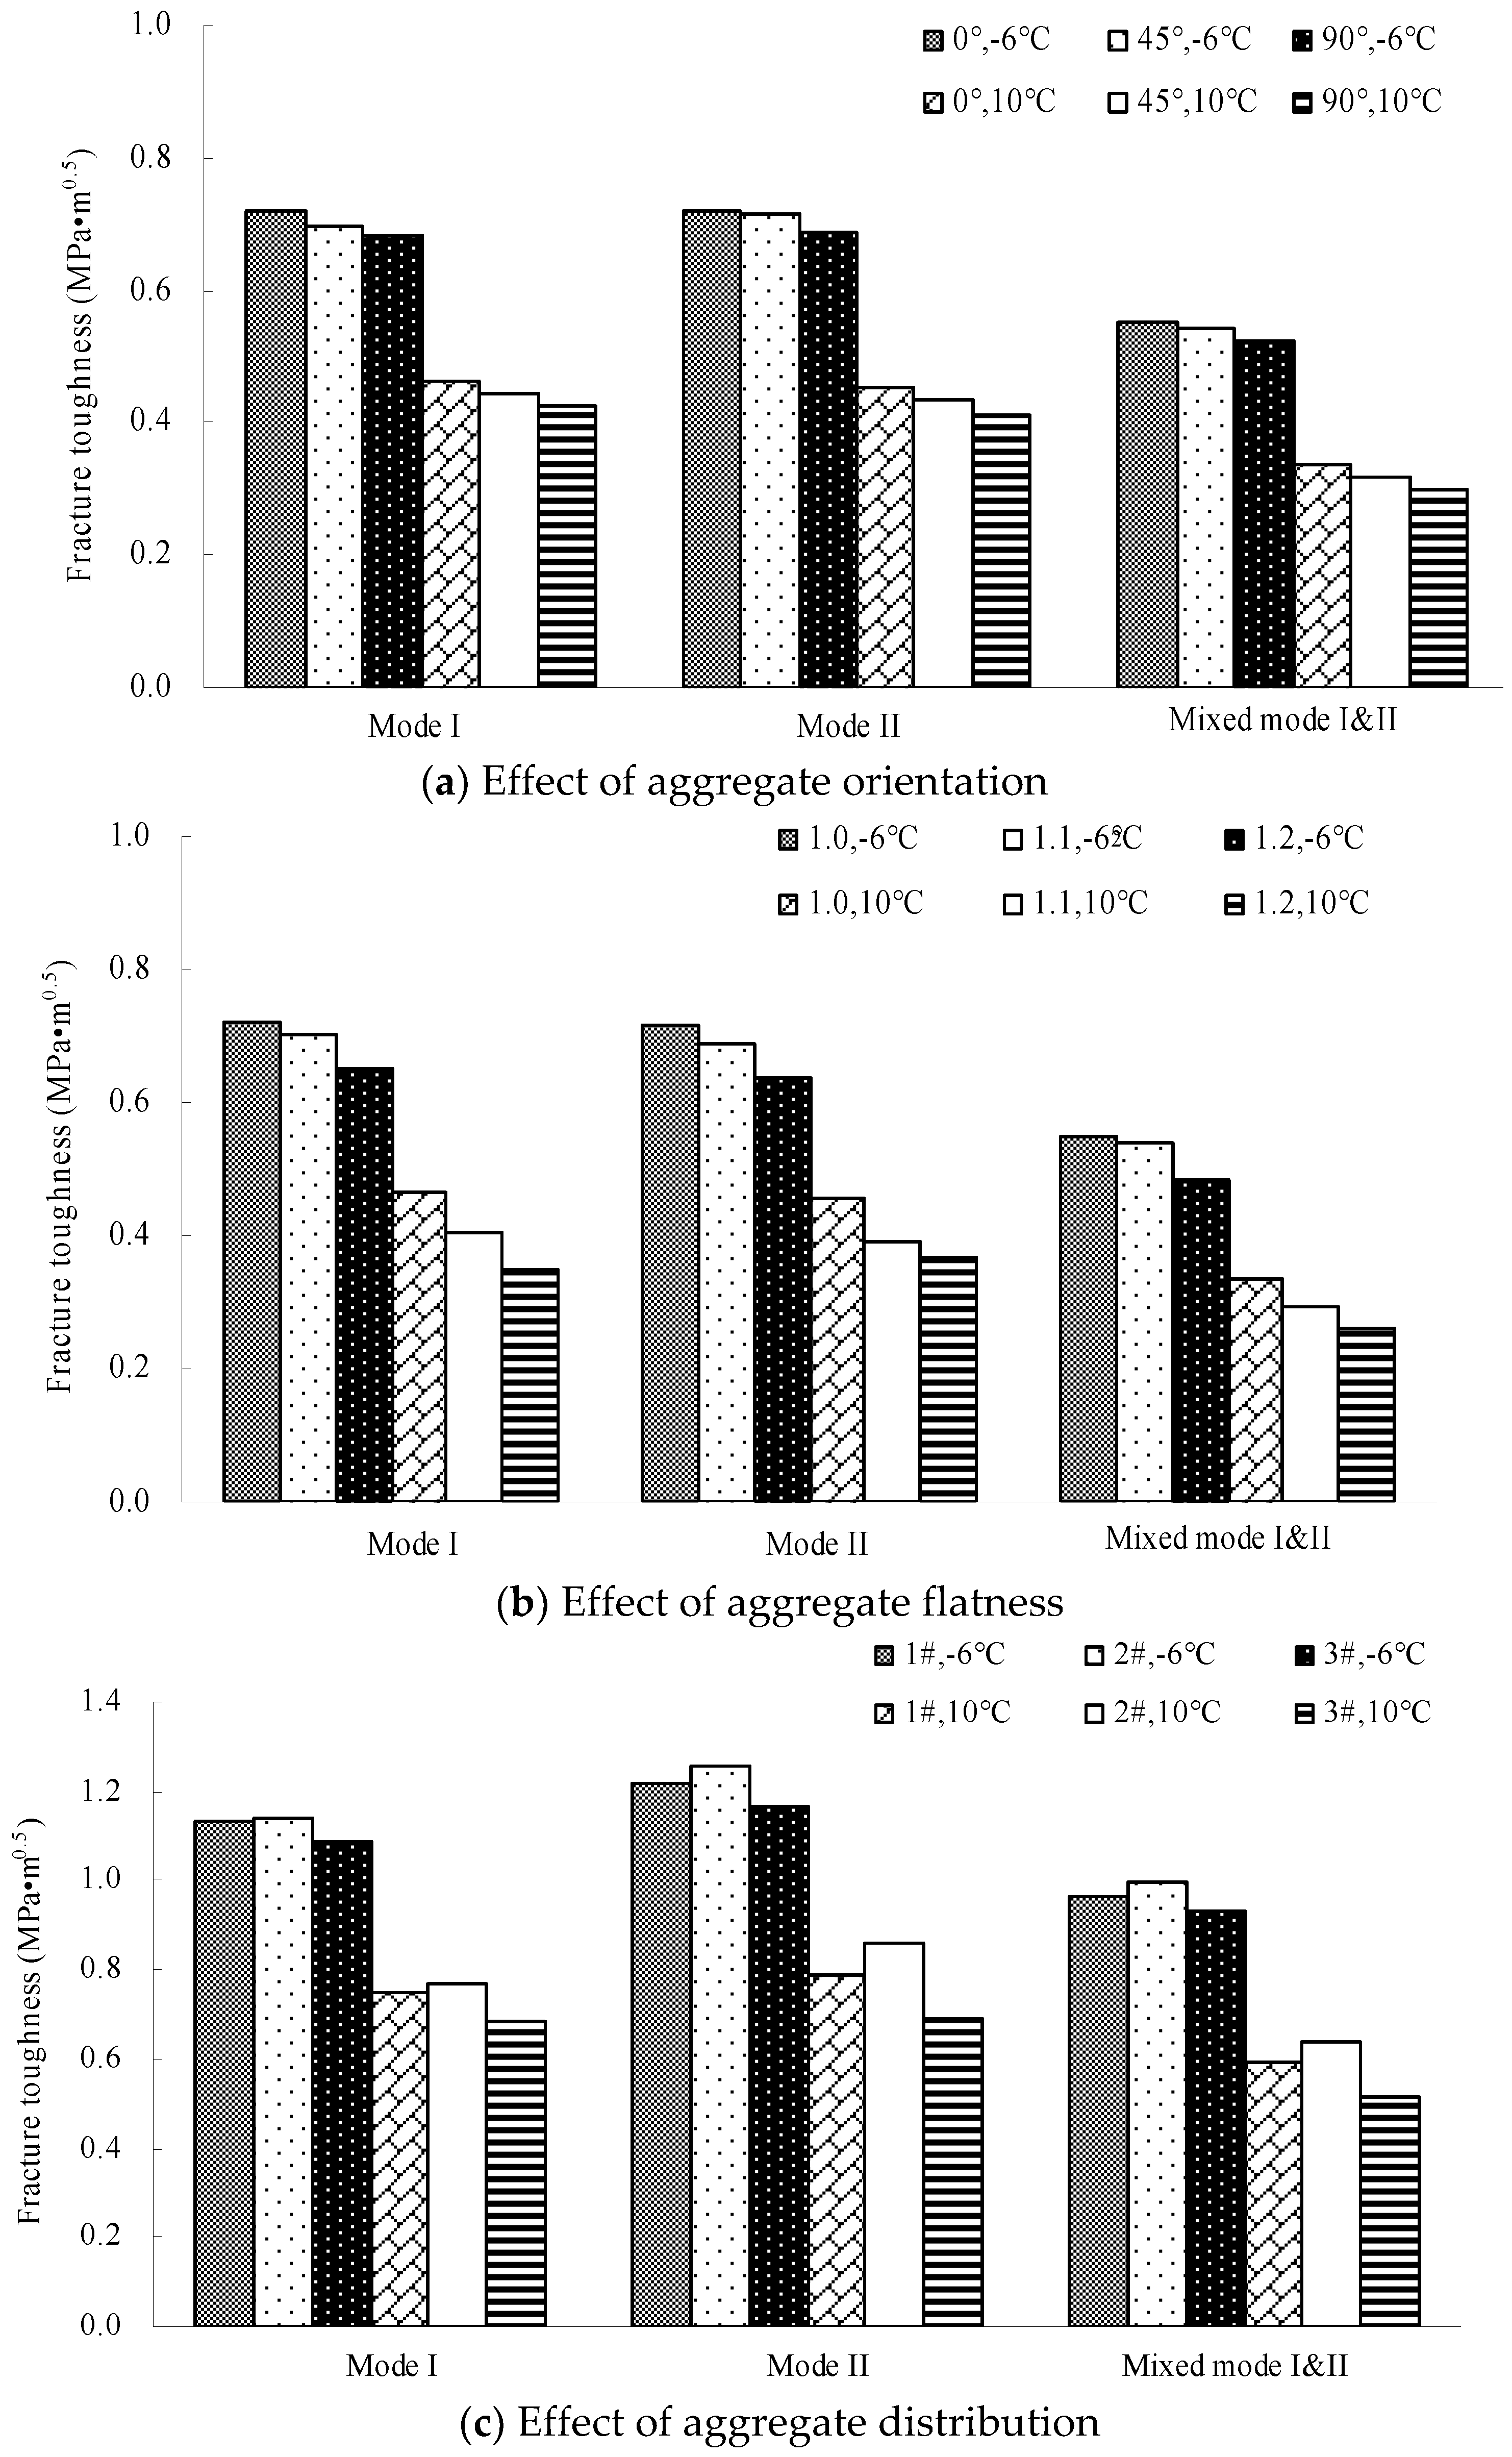
- The fracture toughness and the crack extended time reduced with the increase of aggregate orientation and aggregate flatness at the same temperature, indicating that the increase of the orientation angle and flatness bring about a negative effect on the fracture properties. This is due to the following: (a) the cracking speed is faster with the increasing aggregate orientation because the crack path that bypasses the coarse aggregates is shortened accordingly, and (b) the crack resistance of the coarse aggregates is reduced with the increase of the aggregate flatness because the aggregates become thinner. Moreover, the effect of the aggregate flatness on the fracture properties is more significant than that of the aggregate orientation.
- (2)
- The effect of the aggregate orientation on the fracture properties is approximately linear, while that of the aggregate flatness is nonlinear. The effect degree elevates gradually with the increasing flatness. The reason is that the decay rate of the crack resistance of aggregates is increased with the decrease of the aggregate thickness. Additionally, the effect of the aggregate characteristics at 10 °C is more significant than that at −6 °C, particularly for the aggregate flatness, due to the difference between aggregates and mastics at different temperatures.
- (3)
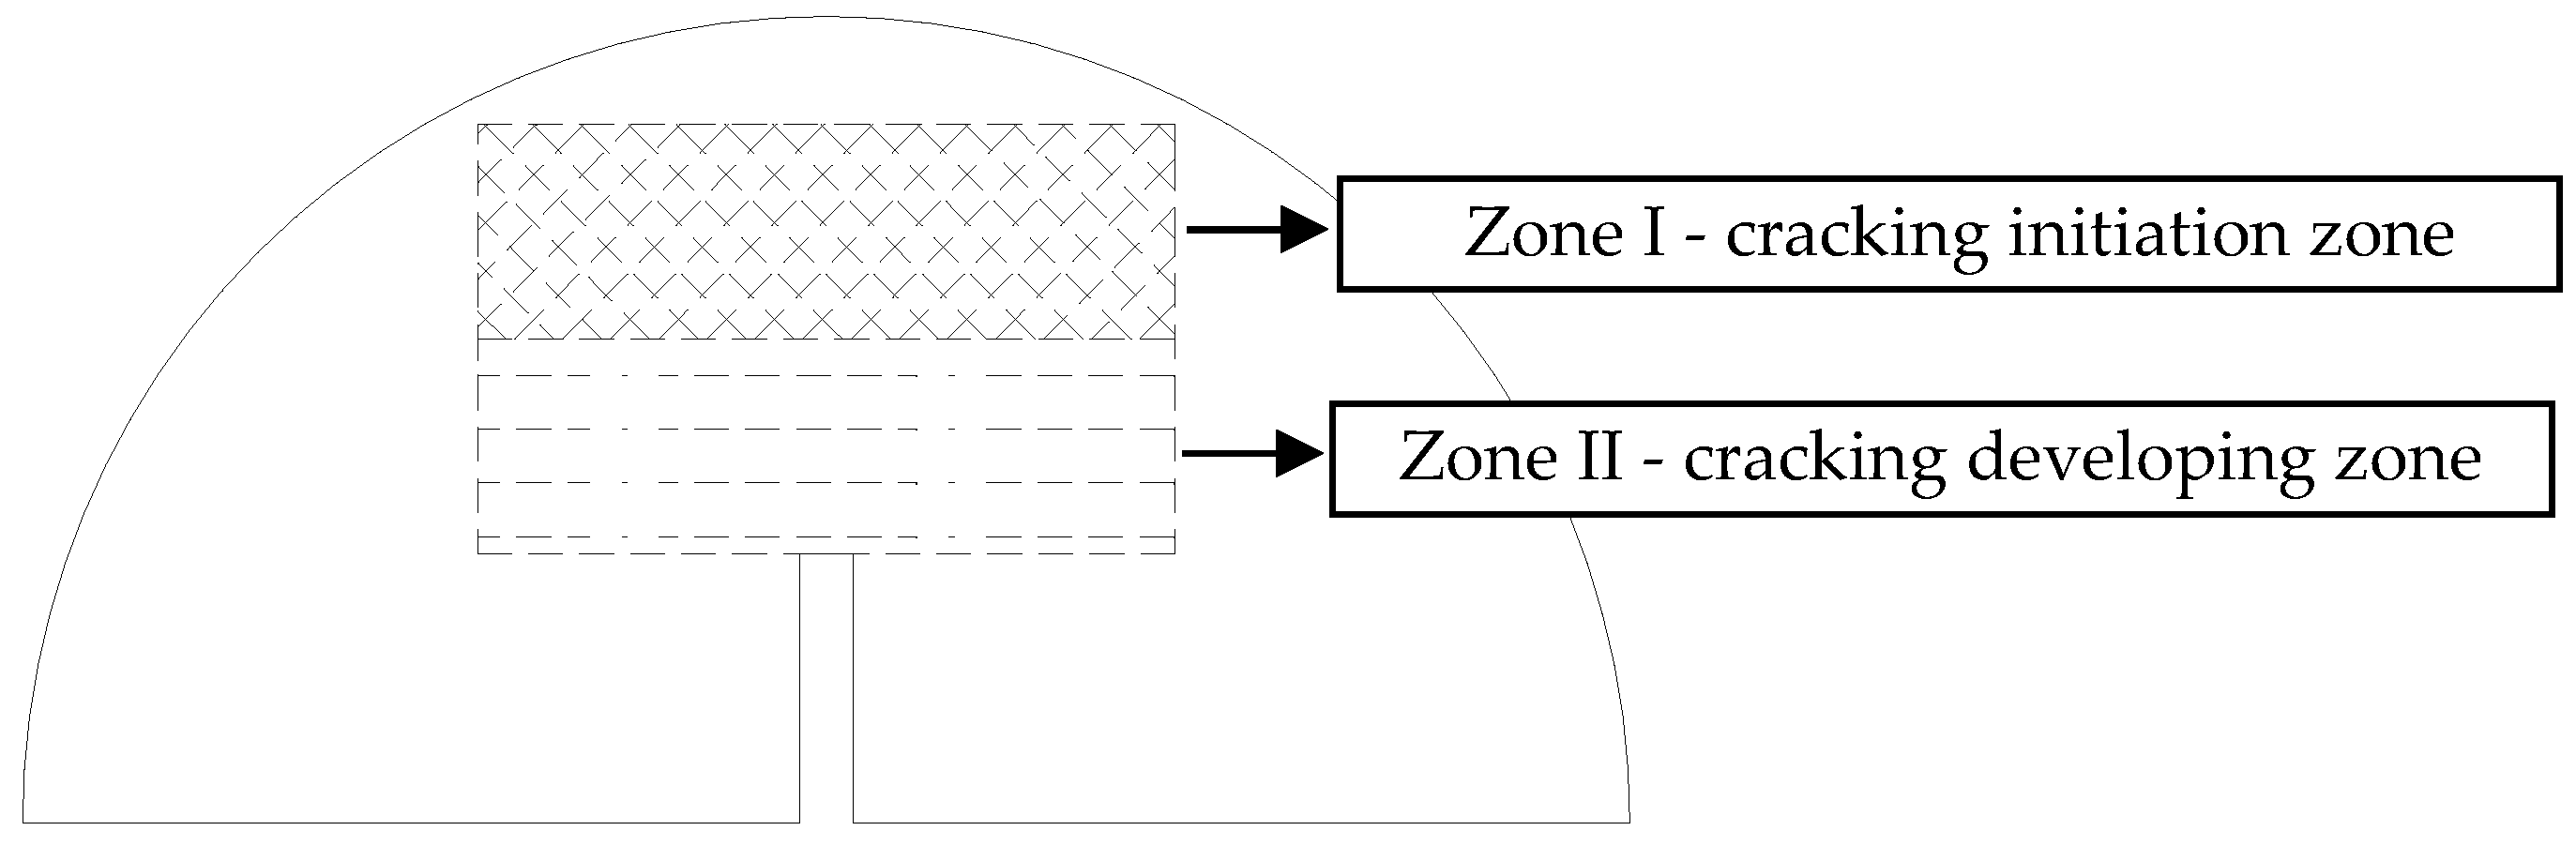
- The effect of the aggregate characteristics on the fracture properties in Quasi-Mode II fracturing is the most significant, particularly at 10 °C. It also illustrates that the effect of the aggregate characteristics on the cracking resistance is more sensitive under the shear loading conditions, due to the loading sensitivity of asphalt concrete under the shear loading conditions. Additionally, it can be found that: F2# > F1# > F3# and C2# > C1# > C3#, which shows an obvious correlation between the aggregate distribution in Zone I and the fracture properties.
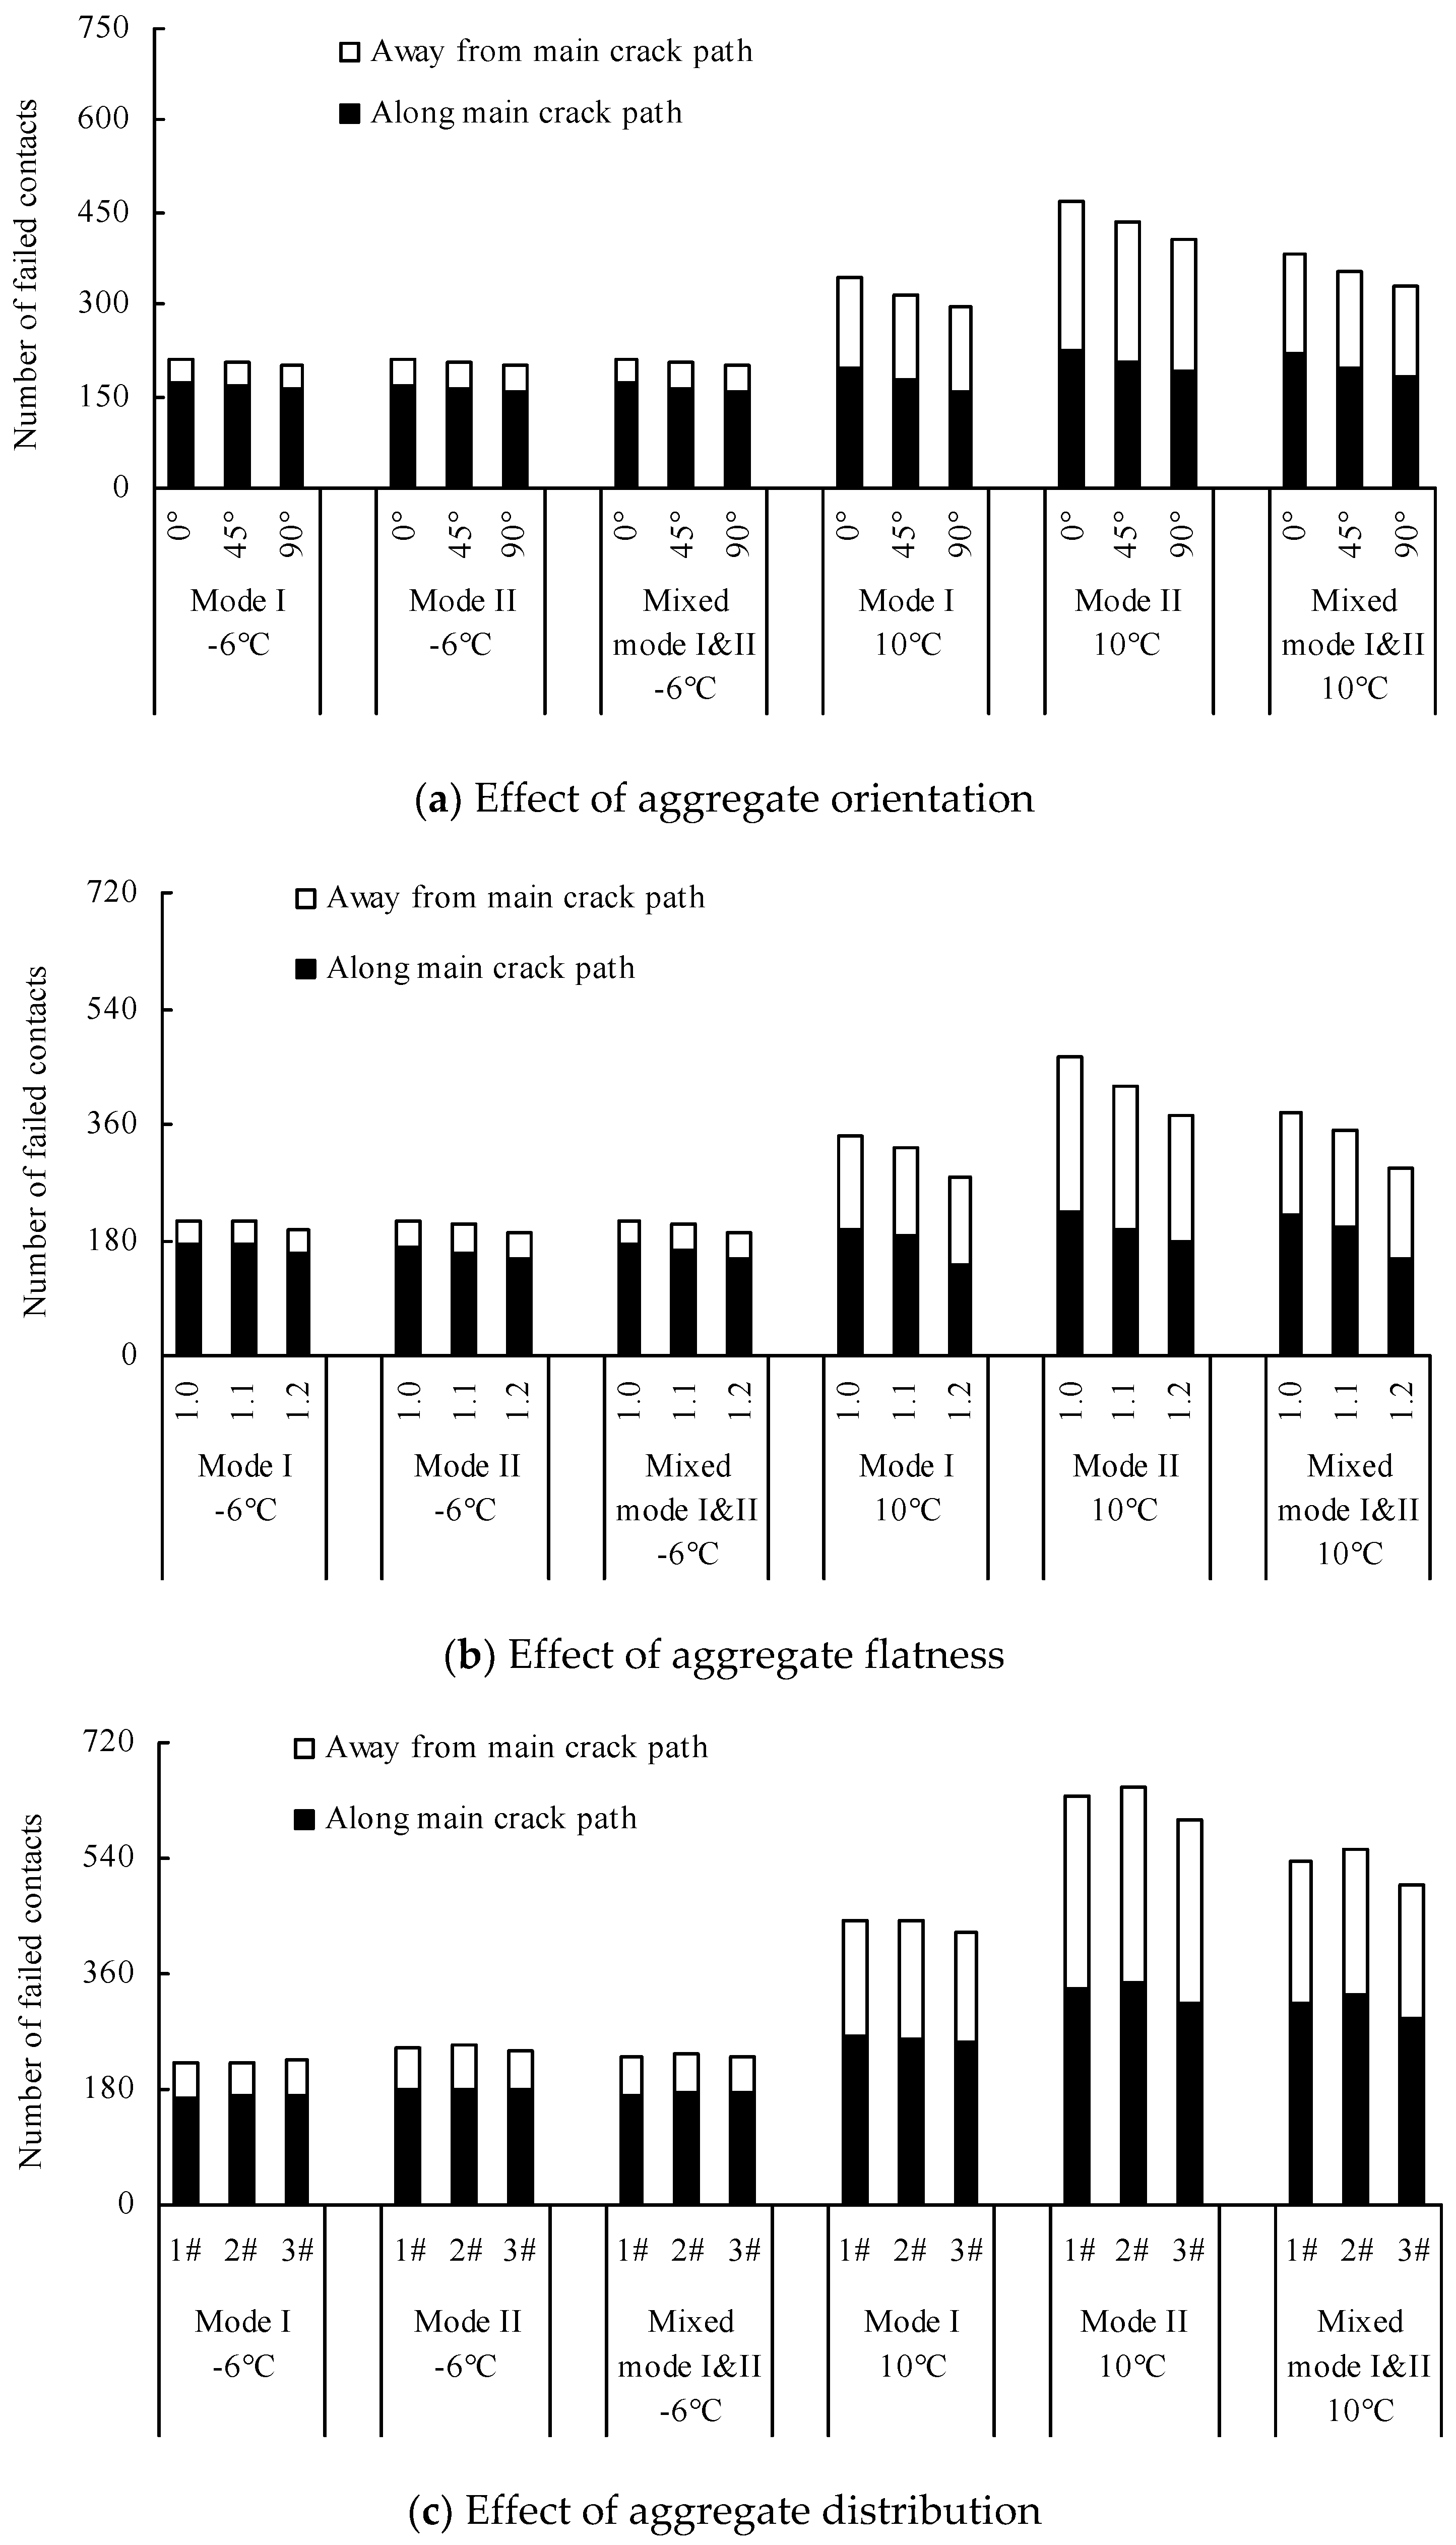
4.3.2. Crack Propagation
5. Conclusions
Author Contributions
Funding
Conflicts of Interest
References
- Pirmohammad, S.; Ayatollahi, M.R. Fracture resistance of asphalt concrete under different loading modes and temperature conditions. Constr. Build. Mater. 2014, 53, 235–242. [Google Scholar] [CrossRef]
- Pirmohammad, S.; Ayatollahi, M.R. Asphalt concrete resistance against fracture at low temperatures under different modes of loading. Cold Reg. Sci. Technol. 2015, 110, 149–159. [Google Scholar] [CrossRef]
- Ameri, M.; Mansourian, A.; Khavas, M.H.; Aliha, M.R.M.; Ayatollahi, M.R. Cracked asphalt pavement under traffic loading—A 3D finite element analysis. Eng. Fract. Mech. 2011, 78, 1817–1826. [Google Scholar] [CrossRef]
- Aliha, M.R.M.; Behbahani, H.; Fazaeli, H.; Rezaifar, M.H. Study of characteristic specification on mixed mode fracture toughness of asphalt mixtures. Constr. Build. Mater. 2014, 54, 623–635. [Google Scholar] [CrossRef]
- Aliha, M.R.M. On predicting mode ii fracture toughness (KIIc) of hot mix asphalt mixtures using the strain energy density criterion. Theor. Appl. Fract. Mech. 2018, 99, 36–43. [Google Scholar] [CrossRef]
- Tan, Y.Q.; Zhang, L.; Guo, M.; Shan, L.Y. Investigation of the deformation properties of asphalt mixtures with DIC technique. Constr. Build. Mater. 2013, 37, 581–590. [Google Scholar] [CrossRef]
- Prowell, B.D.; Zhang, J.; Brown, E.R. Aggregate Properties and the Performance of Superpave Designed Hot Mix Asphalt; NCHRP No. 539; Transportation Research Board, National Research Council: Washington, DC, USA, 2005. [Google Scholar]
- Cheung, L.W.; Dawson, A.R. Effects of Particle and Mix Characteristics on Performance of Some Granular Materials; Transportation Research Record, Transportation Research Board: Washington, DC, USA, 2002; pp. 90–98. [Google Scholar] [CrossRef]
- Ameri, M.; Mansourian, A.; Pirmohammad, S.; Aliha, M.R.M.; Ayatollahi, M.R. Mixed mode fracture resistance of asphalt concrete mixtures. Eng. Fract. Mech. 2012, 93, 153–167. [Google Scholar] [CrossRef]
- Su, X.; Yang, Z.; Liu, G. Monte Carlo simulation of complex cohesive fracture in random heterogeneous quasi-brittle materials: A 3D study. Int. J. Solids Struct. 2010, 47, 2336–2345. [Google Scholar] [CrossRef]
- Pirmohammad, S.; Hojjati, M.M. A new mixed mode i/ii fracture test specimen: Numerical and experimental studies. Theor. Appl. Fract. Mech. 2018, 97, 204–214. [Google Scholar] [CrossRef]
- Elena, R.; Bjorn, B.; Antonio, M.; Gabriele, T. The effect of polymer modification on hot mix asphalt fracture at tensile loading conditions. Int. J. Pavement Eng. 2010, 11, 403–413. [Google Scholar] [CrossRef]
- Tan, Y.Q.; Guo, M. Study on the phase behavior of asphalt mastic. Constr. Build. Mater. 2013, 47, 311–317. [Google Scholar] [CrossRef]
- Ayatollahi, M.R.; Pirmohammad, S. Temperature effects on brittle fracture in cracked asphalt concretes. Struct. Eng. Mech. 2013, 45, 19–32. [Google Scholar] [CrossRef]
- Pirmohammad, S.; Kiani, A. Impact of temperature cycling on fracture resistance of asphalt concretes. Comput. Concr. 2016, 17, 541–551. [Google Scholar] [CrossRef]
- Yang, S.; Braham, A.F. Influence of binder grade, gradation, temperature and loading rate on R-curve of asphalt concrete. Constr. Build. Mater. 2017, 154, 780–790. [Google Scholar] [CrossRef]
- Farzampour, A. Temperature and humidity effects on behavior of grouts. Adv. Concr. Constr. 2017, 5, 659–669. [Google Scholar] [CrossRef]
- Farzampour, A. Compressive Behavior of Concrete under Environmental Effects; IntechOpen: London, UK, 2019; Available online: http://hdl.handle.net/10919/88837 (accessed on 1 April 2019).
- Xia, C.; Lv, S.; You, L.; Chen, D.; Li, Y.; Zheng, J. Unified strength model of asphalt mixture under various loading modes. Materials 2019, 12, 889. [Google Scholar] [CrossRef] [PubMed]
- Yin, A.; Yang, X.; Yang, S.; Jiang, W. Multiscale fracture simulation of three point bending asphalt mixture beam considering material heterogeneity. Eng. Fract. Mech. 2011, 78, 2414–2428. [Google Scholar] [CrossRef]
- Mahmoud, E.; Masad, E.; Nazarian, S. Discrete element analysis of the influences of aggregate properties and internal structure on fracture in asphalt concrete. J. Mater. Civ. Eng. 2010, 22, 10–20. [Google Scholar] [CrossRef]
- Yin, A.; Yang, X.; Zeng, G.; Gao, H. Fracture simulation of pre-cracked heterogeneous asphalt mixture beam with movable three-point bending load. Constr. Build. Mater. 2014, 65, 232–242. [Google Scholar] [CrossRef]
- Yin, A.; Yang, X.; Zeng, G.; Gao, H. Experimental and numerical investigation of fracture behavior of asphalt mixture under direct shear loading. Constr. Build. Mater. 2015, 86, 21–32. [Google Scholar] [CrossRef]
- Wang, H.; Wang, J.; Chen, J. Micromechanical analysis of asphalt mixture fracture with adhesive and cohesive failure. Eng. Fract. Mech. 2014, 132, 104–119. [Google Scholar] [CrossRef]
- Gao, H.; Yang, X.; Zhang, C. Experimental and numerical analysis of three-point bending fracture of pre-notched asphalt mixture beam. Constr. Build. Mater. 2015, 90, 1–10. [Google Scholar] [CrossRef]
- Ren, W.; Yang, Z.; Sharma, R.; Zhang, C.; Withers, P.J. Two-dimensional X-ray ct image based meso-scale fracture modelling of concrete. Eng. Fract. Mech. 2015, 133, 24–39. [Google Scholar] [CrossRef]
- Chen, J.; Pan, T.; Huang, X. Discrete element modeling of asphalt concrete cracking using a user-defined three-dimensional micromechanical approach. J. Wuhan Univ. Technol. Mater. Sci. Ed. 2011, 26, 1215–1221. [Google Scholar] [CrossRef]
- Ren, J.; Sun, L. Generalized Maxwell viscoelastic contact model-based discrete element method for characterizing low-temperature properties of asphalt concrete. J. Mater. Civ. Eng. 2016, 28, 04015122. [Google Scholar] [CrossRef]
- Liu, Y.; Dai, Q.; You, Z. Viscoelastic model for discrete element simulation of asphalt mixtures. J. Eng. Mech. 2009, 135, 324–333. [Google Scholar] [CrossRef]
- Aliha, M.R.M.; Ayatollahi, M.R.; Akbardoost, J. Typical upper bound-lower bound mixed mode fracture resistance envelopes for rock material. Rock Mech. Rock Eng. 2012, 45, 65–74. [Google Scholar] [CrossRef]
- Ren, J.; Sun, L. Characterizing air void effect on fracture of asphalt concrete at low-temperature using discrete element method. Eng. Fract. Mech. 2017, 170, 23–43. [Google Scholar] [CrossRef]
- Ayatollahi, M.R.; Aliha, M.R.M.; Saghafi, H. An improved semi-circular bend specimen for investigating mixed mode brittle fracture. Eng. Fract. Mech. 2011, 78, 110–123. [Google Scholar] [CrossRef]
- Amparano, F.E.; Xi, Y.; Roh, Y.S. Experimental study on the effect of aggregate content on fracture behavior of concrete. Eng. Fract. Mech. 2000, 67, 65–84. [Google Scholar] [CrossRef]
- Peng, Y.; Chen, X.; Ying, L.; Chen, Y.; Zhang, L. Mesoscopic numerical simulation of fracture process and failure mechanism of concrete based on convex aggregate model. Adv. Mater. Sci. Eng. 2019, 5, 5234327. [Google Scholar] [CrossRef]
- Sun, L.; Ren, J.; Zhang, S. Fracture characteristics of asphalt concrete in mixed-loading mode at low-temperature based on discrete-element method. J. Mater. Civ. Eng. 2018, 30, 04018321. [Google Scholar] [CrossRef]
- Kim, H.; Buttlar, W.G. Discrete fracture modeling of asphalt concrete. Int. J. Solids Struct. 2009, 46, 2593–2604. [Google Scholar] [CrossRef] [Green Version]
- Kim, H.; Wagoner, M.P.; Buttlar, W.G. Micromechanical fracture modeling of asphalt concrete using a single-edge notched beam test. Mater. Struct. 2009, 42, 677–689. [Google Scholar] [CrossRef]
- Yang, X.; Dai, Q.; You, Z.; Wang, Z. Integrated experimental-numerical approach for estimating asphalt mixture induction healing level through discrete element modeling of a single-edge notched beam test. J. Mater. Civ. Eng. 2015, 27, 04014259. [Google Scholar] [CrossRef]


| 25 °C Penetration (0.1 mm) | Softening Point (°C) | 10 °C Ductility (cm) | 15 °C Ductility (cm) | 60 °C Viscosity (Pa.s) |
|---|---|---|---|---|
| 64.5 | 55.5 | 32.1 | >100 | 299 |
| Materials | Pass Percent (%) through the Following Sieve Size | |||||||||
|---|---|---|---|---|---|---|---|---|---|---|
| 16 mm | 13.2 mm | 9.5 mm | 4.75 mm | 2.36 mm | 1.18 mm | 0.6 mm | 0.3 mm | 0.15 mm | 0.075 mm | |
| Asphalt concrete | 100 | 87 | 70 | 40 | 28 | 24 | 18 | 11 | 8 | 7 |
| Asphalt mastic | -- | -- | -- | -- | -- | 100 | 75 | 46 | 33 | 29 |
| Coarse aggregate | 100 | 83 | 61 | 22 | 5 | -- | -- | -- | -- | -- |
| No. | ||||||||||||
|---|---|---|---|---|---|---|---|---|---|---|---|---|
| No.1 | 50.5% | 38.5% | 8.1% | 16.4% | 19.7% | 34.2% | 0% | 0% b | 4% | 0% b | 49.5% | 57.5% |
| No.2 | 61.6% | 51.4% | 6.3% | 15.3% | 38.4% | 44.6% | ||||||
| No.3 | 72.6% | 64.2% | 4.5% | 10.9% | 27.4% | 31.8% |
| T (°C) | Aggregate Content | Fracturing Modes | Fracture Toughness (MP·m0.5) | Peak Load (kN) | Crack Extended Time (s) | |||
|---|---|---|---|---|---|---|---|---|
| AV | SD | AV | SD | AV | SD | |||
| −6 | No.1 | Mode I | 0.681 | 0.101 | 4.51 | 0.38 | 50.0 | 2.11 |
| Quasi-Mode II | 0.664 | 0.066 | 6.71 | 0.62 | 61.2 | 3.07 | ||
| Mixed-Mode | 0.557 | 0.046 | 8.46 | 0.97 | 54.9 | 1.67 | ||
| No.2 | Mode I | 0.808 | 0.082 | 5.35 | 0.21 | 51.2 | 3.55 | |
| Quasi-Mode II | 0.823 | 0.099 | 8.31 | 0.77 | 62.8 | 5.01 | ||
| Mixed-Mode | 0.667 | 0.021 | 10.14 | 1.12 | 57.0 | 2.11 | ||
| No.3 | Mode I | 0.893 | 0.086 | 5.91 | 0.57 | 52.5 | 3.36 | |
| Quasi-Mode II | 0.898 | 0.148 | 9.07 | 1.49 | 66.4 | 3.90 | ||
| Mixed-Mode | 0.735 | 0.022 | 11.17 | 0.33 | 59.3 | 3.08 | ||
| 0 | No.1 | Mode I | 0.555 | 0.111 | 3.67 | 0.76 | 52.3 | 2.77 |
| Quasi-Mode II | 0.548 | 0.067 | 5.53 | 0.26 | 64.5 | 3.16 | ||
| Mixed-Mode | 0.451 | 0.012 | 6.86 | 0.81 | 57.1 | 1.89 | ||
| No.2 | Mode I | 0.661 | 0.051 | 4.37 | 0.44 | 54.3 | 3.33 | |
| Quasi-Mode II | 0.667 | 0.034 | 6.73 | 0.50 | 67.3 | 1.77 | ||
| Mixed-Mode | 0.529 | 0.048 | 8.04 | 0.35 | 59.3 | 2.91 | ||
| No.3 | Mode I | 0.721 | 0.068 | 4.77 | 0.71 | 56.7 | 3.97 | |
| Quasi-Mode II | 0.736 | 0.011 | 7.44 | 0.62 | 73.8 | 4.01 | ||
| Mixed-Mode | 0.595 | 0.099 | 9.05 | 0.11 | 63.4 | 3.88 | ||
| 10 | No.1 | Mode I | 0.409 | 0.110 | 2.71 | 0.27 | 56.1 | 2.22 |
| Quasi-Mode II | 0.396 | 0.067 | 4.00 | 0.34 | 70.1 | 4.84 | ||
| Mixed-Mode | 0.311 | 0.089 | 4.73 | 0.51 | 60.6 | 3.77 | ||
| No.2 | Mode I | 0.508 | 0.034 | 3.36 | 0.44 | 58.0 | 3.92 | |
| Mode II | 0.500 | 0.051 | 5.05 | 0.30 | 72.1 | 5.81 | ||
| Mixed-Mode | 0.393 | 0.022 | 5.98 | 0.21 | 62.3 | 4.11 | ||
| No.3 | Mode I | 0.604 | 0.029 | 4.00 | 0.51 | 60.7 | 2.19 | |
| Quasi-Mode II | 0.616 | 0.031 | 6.22 | 0.46 | 77.8 | 4.99 | ||
| Mixed-Mode | 0.473 | 0.055 | 7.20 | 0.49 | 66.4 | 3.60 | ||
| T (°C) | Aggregate Content | Fracturing Modes | Crack Length (mm) That Occurred in Aggregate | Crack Length (mm) That Occurred in Mastic | Crack Length (mm) That Occurred in Interface | |||
|---|---|---|---|---|---|---|---|---|
| AVG | SD | AVG | SD | AVG | SD | |||
| −6 | No.1 | Mode I | 6.0 | 0.81 | 13.9 | 1.09 | 10.7 | 1.07 |
| Quasi mode II | 3.7 | 0.11 | 13.5 | 2.01 | 12.0 | 2.11 | ||
| Mixed mode | 5.4 | 0.62 | 12.2 | 0.97 | 13.1 | 1.02 | ||
| No.2 | Mode I | 8.2 | 1.10 | 12.6 | 1.23 | 12.4 | 1.68 | |
| Quasi mode II | 5.8 | 0.76 | 12.9 | 2.09 | 13.8 | 1.31 | ||
| Mixed mode | 7.3 | 0.81 | 11.4 | 1.62 | 14.7 | 1.99 | ||
| No.3 | Mode I | 9.1 | 1.31 | 12.0 | 1.79 | 13.8 | 2.12 | |
| Quasi mode II | 8.5 | 1.78 | 12.4 | 3.07 | 15.1 | 2.88 | ||
| Mixed mode | 8.9 | 0.90 | 10.9 | 1.02 | 16.3 | 1.69 | ||
| 0 | No.1 | Mode I | 4.8 | 0.38 | 15.7 | 2.89 | 10.9 | 1.26 |
| Quasi mode II | 3.1 | 0.26 | 16.5 | 2.11 | 11.2 | 1.91 | ||
| Mixed mode | 4.4 | 0.21 | 15.1 | 3.03 | 10.7 | 1.87 | ||
| No.2 | Mode I | 6.6 | 0.33 | 15.1 | 2.91 | 13.1 | 1.61 | |
| Quasi mode II | 4.8 | 0.51 | 15.7 | 1.99 | 14.4 | 2.19 | ||
| Mixed mode | 5.9 | 0.29 | 14.8 | 3.66 | 13.3 | 2.87 | ||
| No.3 | Mode I | 7.3 | 0.12 | 14.6 | 2.67 | 14.7 | 1.82 | |
| Quasi mode II | 6.8 | 0.46 | 15.1 | 1.61 | 16.6 | 1.66 | ||
| Mixed mode | 6.9 | 0.15 | 14.1 | 2.22 | 15.8 | 2.71 | ||
| 10 | No.1 | Mode I | 0.2 | -- | 23.4 | 3.07 | 12.0 | 1.26 |
| Quasi mode II | 0.2 | 23.9 | 1.89 | 12.4 | 1.06 | |||
| Mixed mode | 0.3 | 24.7 | 5.15 | 11.1 | 1.88 | |||
| No.2 | Mode I | 0.1 | 21.3 | 2.17 | 16.4 | 1.78 | ||
| Mode II | 0.5 | 22.7 | 3.93 | 18.7 | 3.71 | |||
| Mixed mode | 0.2 | 23.0 | 4.66 | 16.5 | 2.62 | |||
| No.3 | Mode I | 0.7 | 20.9 | 4.00 | 18.7 | 2.33 | ||
| Quasi mode II | 0.6 | 21.6 | 3.72 | 22.7 | 4.10 | |||
| Mixed mode | 0.1 | 22.1 | 2.24 | 19.2 | 3.82 | |||
| Modeling Step | Modeling Procedure |
|---|---|
| Step One: built the numerical sample without aggregate, mastic and void | (a) Set test sample size (b) Create uniformly sized balls |
| Step Two: built the numerical sample without void | (a) Set gradation and asphalt mastic content (b) Randomly create polygon characteristics for coarse aggregates (c) Create ball clusters in the numerical sample prepared in step one according to (b) |
| Step Three: finalize the numerical sample | (a) Set porosity (b) Randomly create void distribution and size (c) Delete balls in the numerical sample prepared in step two according to (b) |
| Step Four: Give the contact models to the corresponding contacts in the numerical sample prepared in Step Three | |
| T (°C) | Sample Type | Fracturing Mode | Average Error (%) | ||||
|---|---|---|---|---|---|---|---|
| Fracture Toughness | Crack Extended Time | Crack Length in Aggregate | Crack Length in Mastic | Crack Length in Interface | |||
| −6 | No.1 | Mode I | 1.17 | 2.61 | 1.54 | 2.91 | 2.98 |
| Quasi mode II | 2.26 | 3.27 | 2.57 | 3.20 | 1.14 | ||
| Mixed mode | 2.54 | 2.01 | 1.42 | 2.19 | 3.63 | ||
| No.2 | Mode I | 3.63 | 2.80 | 2.68 | 3.71 | 3.94 | |
| Quasi mode II | 3.39 | 4.17 | 5.61 | 5.71 | 3.05 | ||
| Mixed mode | 2.40 | 6.04 | 2.67 | 4.67 | 2.49 | ||
| No.3 | Mode I | 4.81 | 2.73 | 3.61 | 4.19 | 4.55 | |
| Quasi mode II | 3.19 | 4.44 | 2.40 | 3.89 | 3.57 | ||
| Mixed mode | 2.93 | 3.69 | 3.58 | 4.73 | 3.01 | ||
| 10 | No.1 | Mode I | 1.89 | 2.81 | -- | 3.24 | 3.15 |
| Quasi mode II | 2.15 | 3.23 | 4.84 | 3.97 | |||
| Mixed mode | 2.00 | 3.19 | 4.26 | 3.12 | |||
| No.2 | Mode I | 3.66 | 3.97 | 2.69 | 3.13 | ||
| Mode II | 4.93 | 4.02 | 6.16 | 4.90 | |||
| Mixed mode | 3.50 | 5.38 | 3.48 | 6.66 | |||
| No.3 | Mode I | 4.35 | 4.02 | 4.05 | 3.98 | ||
| Quasi mode II | 4.62 | 5.68 | 4.30 | 4.69 | |||
| Mixed mode | 3.91 | 4.45 | 3.55 | 4.07 | |||
| Model | Zone I | Zone II | Other Zone | ||||||
|---|---|---|---|---|---|---|---|---|---|
| Orientation | Flatness | Content | Orientation | Flatness | Content | Orientation | Flatness | Content | |
| 0° model | 0° | 1.0 | No.3 | 0° | 1.0 | No.3 | 0° | 1.0 | No.3 |
| 45° model | 45° | 45° | 45° | ||||||
| 90° model | 90° | 90° | 90° | ||||||
| 1.0 model | 0° | 1.0 | No.3 | 0° | 1.0 | No.3 | 0° | 1.0 | No.3 |
| 1.1 model | 1.1 | 1.1 | 1.1 | ||||||
| 1.2 model | 1.2 | 1.2 | 1.2 | ||||||
| 1# model | Random | Random | No.3 | Random | Random | No.2 | Random | Random | No.3 |
| 2# model | No.3 | No.3 | |||||||
| 3# model | No.2 | No.3 | |||||||
| Temperature | Fracture Loading Mode | F0°/F45° | F0°/F90° | F1.0/F1.1 | F1.0/F1.2 | F1#/F2# | F1#/F3# |
|---|---|---|---|---|---|---|---|
| −6 °C | Mode I | 1.03 | 1.06 | 1.03 | 1.11 | 0.99 | 1.04 |
| Quasi-Mode II | 1.01 | 1.04 | 1.05 | 1.12 | 0.97 | 1.04 | |
| Mixed-Mode I and II | 1.01 | 1.05 | 1.02 | 1.13 | 0.97 | 1.04 | |
| 10 °C | Mode I | 1.05 | 1.09 | 1.14 | 1.32 | 0.97 | 1.10 |
| Quasi mode II | 1.04 | 1.10 | 1.16 | 1.24 | 0.92 | 1.14 | |
| Mixed mode I&II | 1.06 | 1.12 | 1.15 | 1.28 | 0.93 | 1.15 |
| Temperature | Fracture Loading Mode | C0°/C45° | C0°/C90° | C1.0/C1.1 | C1.0/C1.2 | C1#/C2# | C1#/C3# |
|---|---|---|---|---|---|---|---|
| −6 °C | Mode I | 1.02 | 1.01 | 1.01 | 1.03 | 1.01 | 1.02 |
| Quasi mode II | 1.02 | 1.02 | 1.02 | 1.04 | 0.96 | 1.00 | |
| Mixed mode I&II | 1.01 | 1.03 | 1.02 | 1.05 | 0.97 | 0.98 | |
| 10 °C | Mode I | 1.02 | 1.05 | 1.04 | 1.08 | 0.98 | 1.05 |
| Quasi mode II | 1.03 | 1.07 | 1.05 | 1.15 | 0.94 | 1.09 | |
| Mixed mode I&II | 1.03 | 1.06 | 1.05 | 1.13 | 0.95 | 1.06 |
© 2019 by the authors. Licensee MDPI, Basel, Switzerland. This article is an open access article distributed under the terms and conditions of the Creative Commons Attribution (CC BY) license (http://creativecommons.org/licenses/by/4.0/).
Share and Cite
Xu, Y.; Jiang, Y.; Xue, J.; Ren, J. Investigating the Effect of Aggregate Characteristics on the Macroscopic and Microscopic Fracture Mechanisms of Asphalt Concrete at Low-Temperature. Materials 2019, 12, 2675. https://doi.org/10.3390/ma12172675
Xu Y, Jiang Y, Xue J, Ren J. Investigating the Effect of Aggregate Characteristics on the Macroscopic and Microscopic Fracture Mechanisms of Asphalt Concrete at Low-Temperature. Materials. 2019; 12(17):2675. https://doi.org/10.3390/ma12172675
Chicago/Turabian StyleXu, Yinshan, Yingjun Jiang, Jinshun Xue, and Jiaolong Ren. 2019. "Investigating the Effect of Aggregate Characteristics on the Macroscopic and Microscopic Fracture Mechanisms of Asphalt Concrete at Low-Temperature" Materials 12, no. 17: 2675. https://doi.org/10.3390/ma12172675