The Effect of the Length and Distribution of Implants for Fixed Prosthetic Reconstructions in the Atrophic Posterior Maxilla: A Finite Element Analysis


Abstract
:1. Introduction
2. Materials and Methods
2.1. Model Design
- Model 1: Two implants supporting a three-unit distal cantilever prosthesis (M1) (Figure 1a)
- Model 2: Two implants supporting a three-unit conventional fixed partial denture (M2) (Figure 1b)
- Model 3: Three implants supporting three connected crowns (M3) (Figure 1c)
- Model 4: Two implants supporting two connected crowns (M4) (Figure 1d)
2.2. Material Properties
2.3. Interface Conditions
2.4. Element and Nodes
2.5. Constraints and Loads
2.6. Finite Element Analysis
3. Results
3.1. Evaluation of the Models
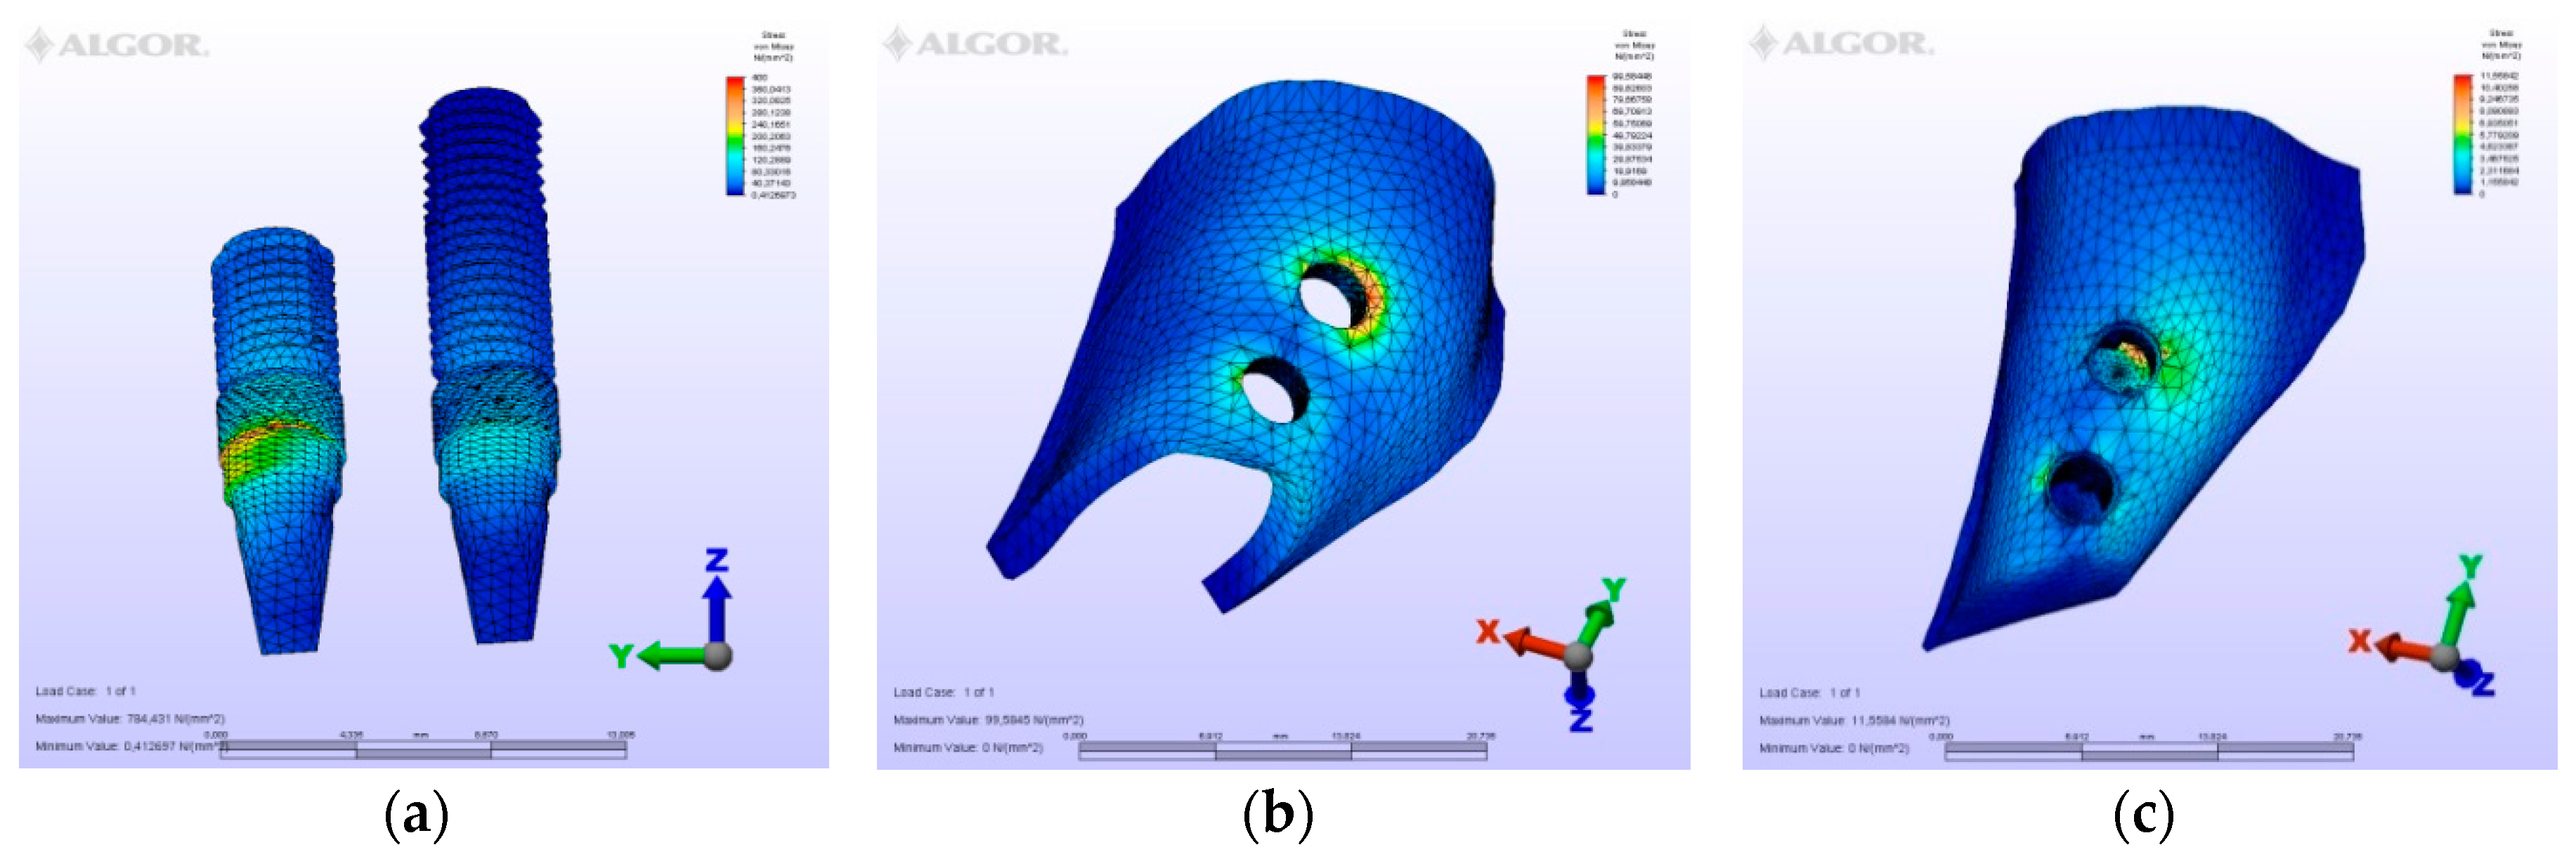
3.1.1. M1 Model
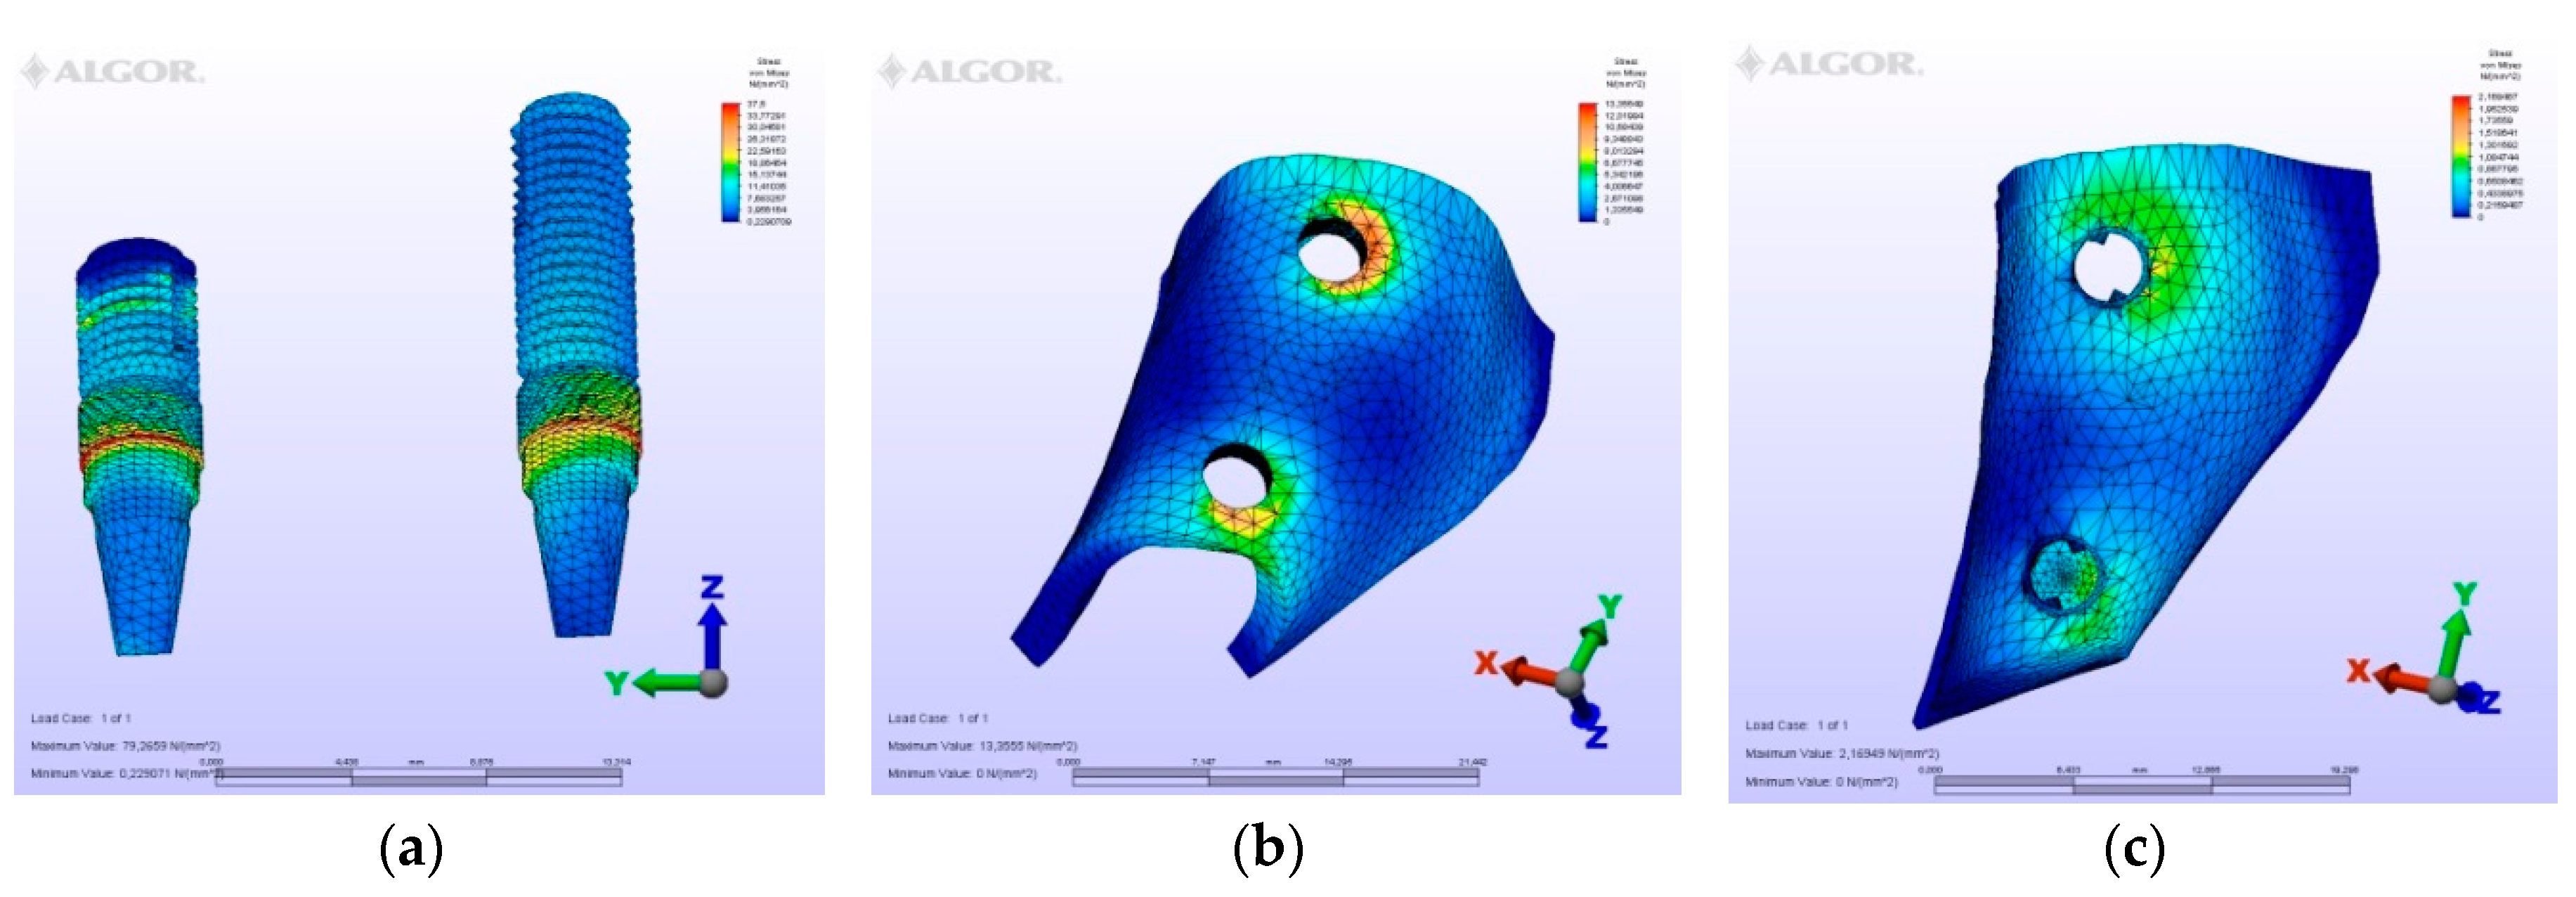
3.1.2. M2 Model
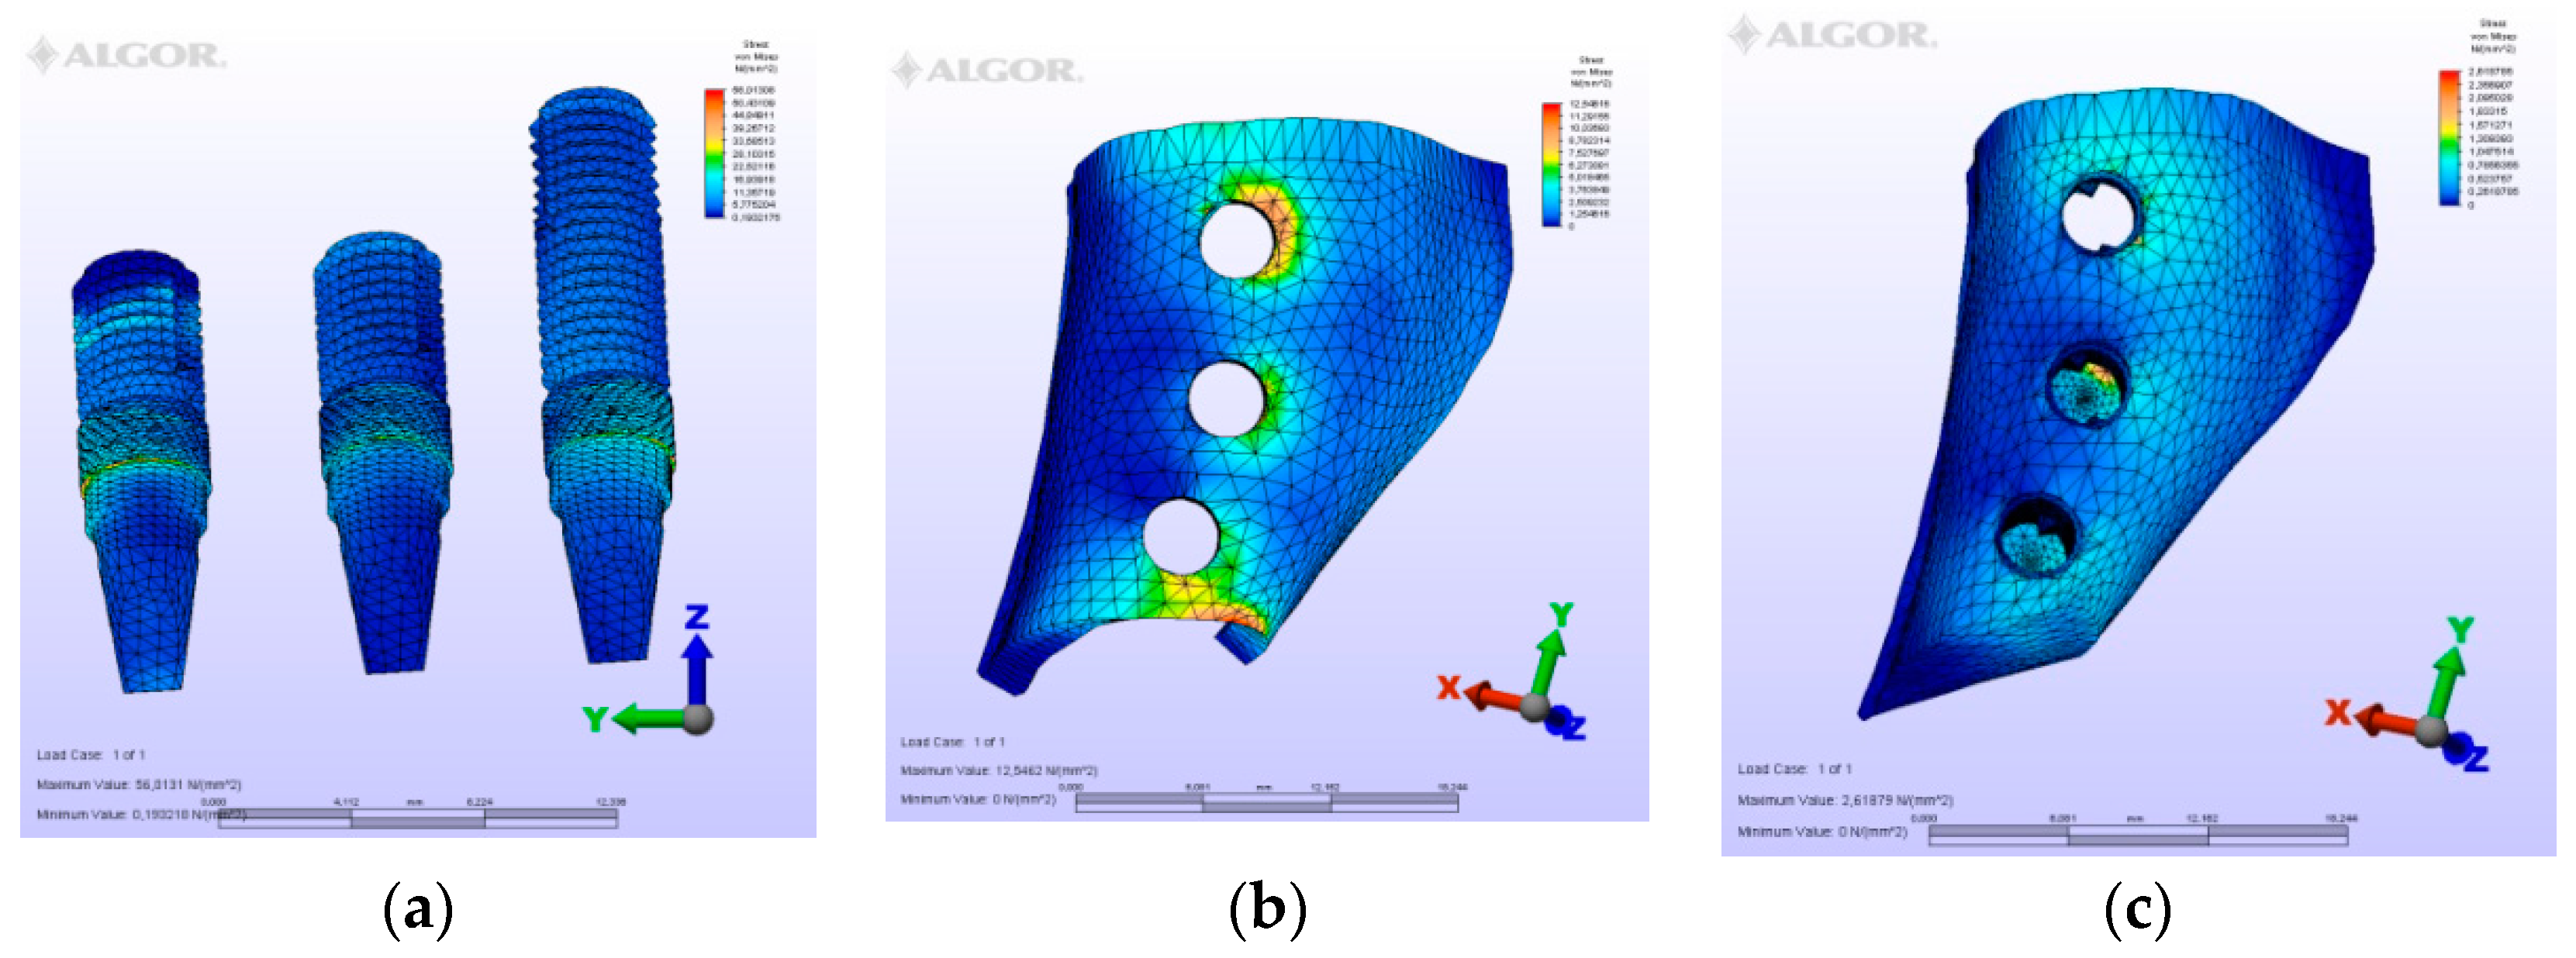
3.1.3. M3 Model
3.1.4. M4 Model
3.2. Evaluation of von Mises Stresses Occurring in Implants
3.3. Comparison of Models
3.4. Evaluation of Displacements Occurring in Bone
4. Discussion
5. Conclusions
Author Contributions
Funding
Conflicts of Interest
References
- Brune, A.; Stiesch, M.; Eisenburger, M.; Greuling, A. The effect of different occlusal contact situations on peri-implant bone stress—A contact finite element analysis of indirect axial loading. Mater. Sci. Eng. C Mater. Biol. Appl. 2019, 99, 367–373. [Google Scholar] [CrossRef] [PubMed]
- Segal, P.; Makhoul, A.; Eger, M.; Lucchina, A.G.; Winocur, E.; Mijiritsky, E. Preliminary study to evaluate marginal bone loss in cases of 2-and 3-implant supported fixed partial prostheses of the posterior mandible. J. Craniofac. Surg. 2018, 4, 1068–1072. [Google Scholar] [CrossRef] [PubMed]
- Mohanty, R.; Sudan, P.S.; Dharamsi, A.M.; Mokashi, R.; Misurya, A.L.; Kayahan, P. Risk assessment in long -term survival rates of dental implants: A prospective clinical study. J. Contemp. Dent. Pract. 2018, 19, 587–590. [Google Scholar] [PubMed]
- Hingsammer, L.; Pommer, B.; Hunger, S.; Stehrer, R.; Watzek, G.; Insua, A. Influence of Implant Length and Associated Parameters Upon Biomechanical Forces in Finite Element Analyses: A Systematic Review. Implant. Dent. 2019, 28, 296–305. [Google Scholar] [CrossRef] [PubMed]
- Brånemark, P.I.; Svensson, B.; van Steenberghe, D. Ten-year survival rates of fixed prostheses on four or six implants ad modum Brånemark in full edentulism. Clin. Oral Implant. Res. 1995, 6, 227–231. [Google Scholar] [CrossRef]
- Misch, C.E. Dental Implant Prosthetics, 2nd ed.; Mosby: St. Louis, MO, USA, 2014; pp. 705–733. [Google Scholar]
- Takahashi, Y.; Watanabe, T.; Limura, A.; Takahashi, O. A Study of the Maxillary Sinus Volume in Elderly Persons Using Japanese Cadavers. Okajimas Folia Anat. Jpn. 2016, 93, 21–27. [Google Scholar] [CrossRef] [Green Version]
- Suresh, K.S.; Masarat, J.; Anil, K. Measurements of maxillary sinus volume and dimensions by computed tomography scan for gender determination. J. Anat. Soc. India 2014, 63, 36–42. [Google Scholar]
- Goiato, M.C.; dos Santos, D.M.; Santiago, J.F., Jr.; Moreno, A.; Pellizzer, E.P. Longevity of dental implants in type IV bone: A systematic review. Int. J. Oral Maxillofac. Surg. 2014, 43, 1108–1116. [Google Scholar] [CrossRef]
- Oikarinen, K.; Raustia, A.M.; Hartikainen, M. General and local contradictions for endosteal implants, an epidermiological panoramic radiographic study in 65-year old subjects. Community Dent. Oral Epidemiol. 1995, 23, 114–118. [Google Scholar] [CrossRef]
- Mohan, N.; Wolf, J.; Dym, H. Maxillary sinus augmentation. Dent. Clin. N. Am. 2015, 59, 375–388. [Google Scholar] [CrossRef]
- Tatum, H. Maxillary and sinus implant reconstruction. Dent. Clin. N. Am. 1986, 30, 207–229. [Google Scholar] [PubMed]
- Lemos, C.A.; Ferro-Alves, M.L.; Okamoto, R.; Mendonça, M.R.; Pellizzer, E.P. Short dental implants versus standard dental implants placed in the posterior jaws: A systematic review and meta-analysis. J. Dent. 2016, 47, 8–17. [Google Scholar] [CrossRef] [PubMed] [Green Version]
- Taschieri, S.; Lolato, A.; Testori, T.; Francetti, L.; Del Fabbro, M. Short dental implants as compared to maxillary sinus augmentation procedure for the rehabilitation of edentulous posterior maxilla: Three-year results of a randomized clinical study. Clin. Implant. Dent. Relat. Res. 2018, 20, 9–20. [Google Scholar] [CrossRef] [PubMed]
- Maló, P.S.; de Araújo Nobre, M.A.; Lopes, A.V.; Ferro, A.S. Retrospective cohort clinical investigation of a dental implant with a narrow diameter and short length for the partial rehabilitation of extremely atrophic jaws. J. Oral Sci. 2017, 59, 357–363. [Google Scholar] [CrossRef] [PubMed] [Green Version]
- Alqutaibi, A.Y.; Altaib, F. Short dental implant is considered as a reliable treatment option for patients with atrophic posterior maxilla. J. Evid. Based Dent. Pract. 2016, 16, 173–175. [Google Scholar] [CrossRef]
- Hingsammer, L.; Watzek, G.; Pommer, B. The influence of crown-to-implant ratio on marginal bone levels around splinted short dental implants: A radiological and clinical short term analysis. Clin. Implant. Dent. Relat. Res. 2017, 19, 1090–1098. [Google Scholar] [CrossRef] [PubMed]
- Gastaldi, G.; Felice, P.; Pistilli, R.; Barausse, C.; Trullenque-Eriksson, A.; Esposito, M. Short implants as an alternative to crestal sinus lift: A 3-year multicenter randomised controlled trial. Eur. J. Oral Implantol. 2017, 10, 391–400. [Google Scholar]
- Küçükkurt, S.; Alpaslan, G.; Kurt, A. Biomechanical comparison of sinus floor elevation and alternative treatment methods for dental implant placement. Comput. Methods Biomech. Biomed. Eng. 2017, 20, 284–293. [Google Scholar] [CrossRef] [PubMed]
- Goiato, M.C.; de Medeiros, R.A.; Sônego, M.V.; de Lima, T.M.; Pesqueira, A.A.; Dos Santos, D.M. Stress distribution on short implants with different designs: A photoelastic analysis. J. Med. Eng. Technol. 2017, 41, 115–121. [Google Scholar] [CrossRef]
- Bölükbaşı, N.; Yeniyol, S. Number and localization of the implants for the fixed prosthetic reconstructions: On the strain in the anterior maxillary region. Med. Eng. Phys. 2015, 37, 431–445. [Google Scholar] [CrossRef]
- Schrotenboer, J.; Tsao, Y.P.; Kinariwala, V.; Wang, H.L. Effect of microthreads and platform switching on crestal bone stress levels: A finite element analysis. J. Periodontol. 2008, 79, 2166–2172. [Google Scholar] [CrossRef] [PubMed]
- Wheeler, R.C. An Atlas of Tooth Form, 4th ed.; Saunders: Philadelphia, PA, USA, 1969; p. 26. [Google Scholar]
- Koolstra, J.H.; van Eijden, T.M.; Weijs, W.A.; Naeije, M.A. Three dimensional mathematical model of the human masticatory system predicting maximum possible bite forces. J. Biomech. 1988, 21, 563–576. [Google Scholar] [CrossRef]
- Okeson, J.P. Management of Temporomandibular Disorders and Occlusion, 7th ed.; Mosby: St. Louis, MO, USA, 2012; p. 46. [Google Scholar]
- Sato, Y.; Teixeira, E.R.; Shindoi, N.; Wadamoto, M.; Akagawa, Y. Effect of bone length on stres distribution in implant finite element analysis. J. Dent. Res. 1997, 76, 2517. [Google Scholar]
- Tian, K.; Chen, J.; Han, L.; Yang, J.; Huang, W.; Wu, D. Angled abutment result in incerased or descreasded stress on surrounding bone of single-unit dental implants: A finite element analysis. Med. Eng. Phys. 2012, 334, 1526–1531. [Google Scholar] [CrossRef] [PubMed]
- Tepper, G.; Haas, R.; Zechner, W.; Krach, W.; Watzek, G. Three-dimensional finite element analysis of implant stability in atrophic posterior maxilla. Clin. Oral Implants Res. 2002, 13, 657–665. [Google Scholar] [CrossRef] [PubMed]
- İplikçioğlu, H.; Akça, K. Comparative evaluation of the effect of diameter, length and number of implants supporting three-unit fixed partial prostheses on stress distribution in the bone. J. Dent. 2002, 30, 41–46. [Google Scholar] [CrossRef]
- Skalak, R. Biomechanical considerations in osseointegrated prosthesis. J. Prosthet. Dent. 1983, 49, 843–848. [Google Scholar] [CrossRef]
- De Souza Batista, V.E.; Verri, F.R.; Almeida, D.A.; Santiago Junior, J.F.; Lemos, C.A.; Pellizzer, E.P. Finite element analysis of implant-supported prosthesis with pontic and cantilever in the posterior maxilla. Comput. Methods Biomech. Biomed. Eng. 2017, 20, 663–670. [Google Scholar] [CrossRef]


| Material | Young’s Modulus (Gpa) | Poisson’s Ratio |
|---|---|---|
| Titanium | 110 | 0.35 |
| Cortical Bone | 13.7 | 0.3 |
| Trabecular Bone (D3) | 1.37 | 0.3 |
| Cr-Co Alloy | 218 | 0.33 |
| Feldspatic Porcelain | 82.8 | 0.35 |
| Model no | Vertical Force | Horizontal Force | Oblique Force |
|---|---|---|---|
| Model 1 | 127.32 | 97.76 | 360.91 |
| Model 2 | 79.28 | 58.34 | 242.23 |
| Model 3 | 59.28 | 44.56 | 185.68 |
| Model 4 | 33.88 | 20.72 | 105.45 |
| Loading type | Vertical Force | Horizontal Force | Oblique Force | |||
|---|---|---|---|---|---|---|
| Model no | Minimum Principle Stress | Maximum Principle Stress | Minimum Principle Stress | Maximum Principle Stress | Minimum Principle Stress | Maximum Principle Stress |
| Model 1 | 28.37 | 23.67 | 23.18 | 19.99 | 79.16 | 67.48 |
| Model 2 | 16.59 | 16.48 | 13.03 | 13.17 | 50.77 | 56.82 |
| Model 3 | 12.20 | 12.49 | 9.34 | 8.55 | 39.79 | 45.57 |
| Model 4 | 6.05 | 5.51 | 4.59 | 4.93 | 19.88 | 23.52 |
| Loading type | Vertical Force | Horizontal Force | Oblique Force | |||
|---|---|---|---|---|---|---|
| Model no | Minimum Principle Stress | Maximum Principle Stress | Minimum Principle Stress | Maximum Principle Stress | Minimum Principle Stress | Maximum Principle Stress |
| Model 1 | 15.88 | 3.99 | 9.79 | 2.95 | 25.34 | 9.77 |
| Model 2 | 10.19 | 2.35 | 5.44 | 1.87 | 14.98 | 5.88 |
| Model 3 | 6.77 | 1.89 | 3.73 | 1.25 | 10.37 | 3.55 |
| Model 4 | 2.49 | 1.18 | 1.23 | 0.69 | 4.79 | 2.35 |
| Model No | Vertical Force | Horizontal Force | Oblique Force |
|---|---|---|---|
| Model 1 | 0.00724 | 0.00295 | 0.01998 |
| Model 2 | 0.00374 | 0.00183 | 0.01542 |
| Model 3 | 0.00302 | 0.00148 | 0.01205 |
| Model 4 | 0.00182 | 0.00111 | 0.00595 |
© 2019 by the authors. Licensee MDPI, Basel, Switzerland. This article is an open access article distributed under the terms and conditions of the Creative Commons Attribution (CC BY) license (http://creativecommons.org/licenses/by/4.0/).
Share and Cite
Cenkoglu, B.G.; Balcioglu, N.B.; Ozdemir, T.; Mijiritsky, E. The Effect of the Length and Distribution of Implants for Fixed Prosthetic Reconstructions in the Atrophic Posterior Maxilla: A Finite Element Analysis. Materials 2019, 12, 2556. https://doi.org/10.3390/ma12162556
Cenkoglu BG, Balcioglu NB, Ozdemir T, Mijiritsky E. The Effect of the Length and Distribution of Implants for Fixed Prosthetic Reconstructions in the Atrophic Posterior Maxilla: A Finite Element Analysis. Materials. 2019; 12(16):2556. https://doi.org/10.3390/ma12162556
Chicago/Turabian StyleCenkoglu, Brunilda Gashi, Nilufer Bolukbasi Balcioglu, Tayfun Ozdemir, and Eitan Mijiritsky. 2019. "The Effect of the Length and Distribution of Implants for Fixed Prosthetic Reconstructions in the Atrophic Posterior Maxilla: A Finite Element Analysis" Materials 12, no. 16: 2556. https://doi.org/10.3390/ma12162556