Welding Temperature Distribution and Residual Stresses in Thick Welded Plates of SA738Gr.B Through Experimental Measurements and Finite Element Analysis

 ,
,
Abstract
:1. Introduction
2. Experimental Procedure
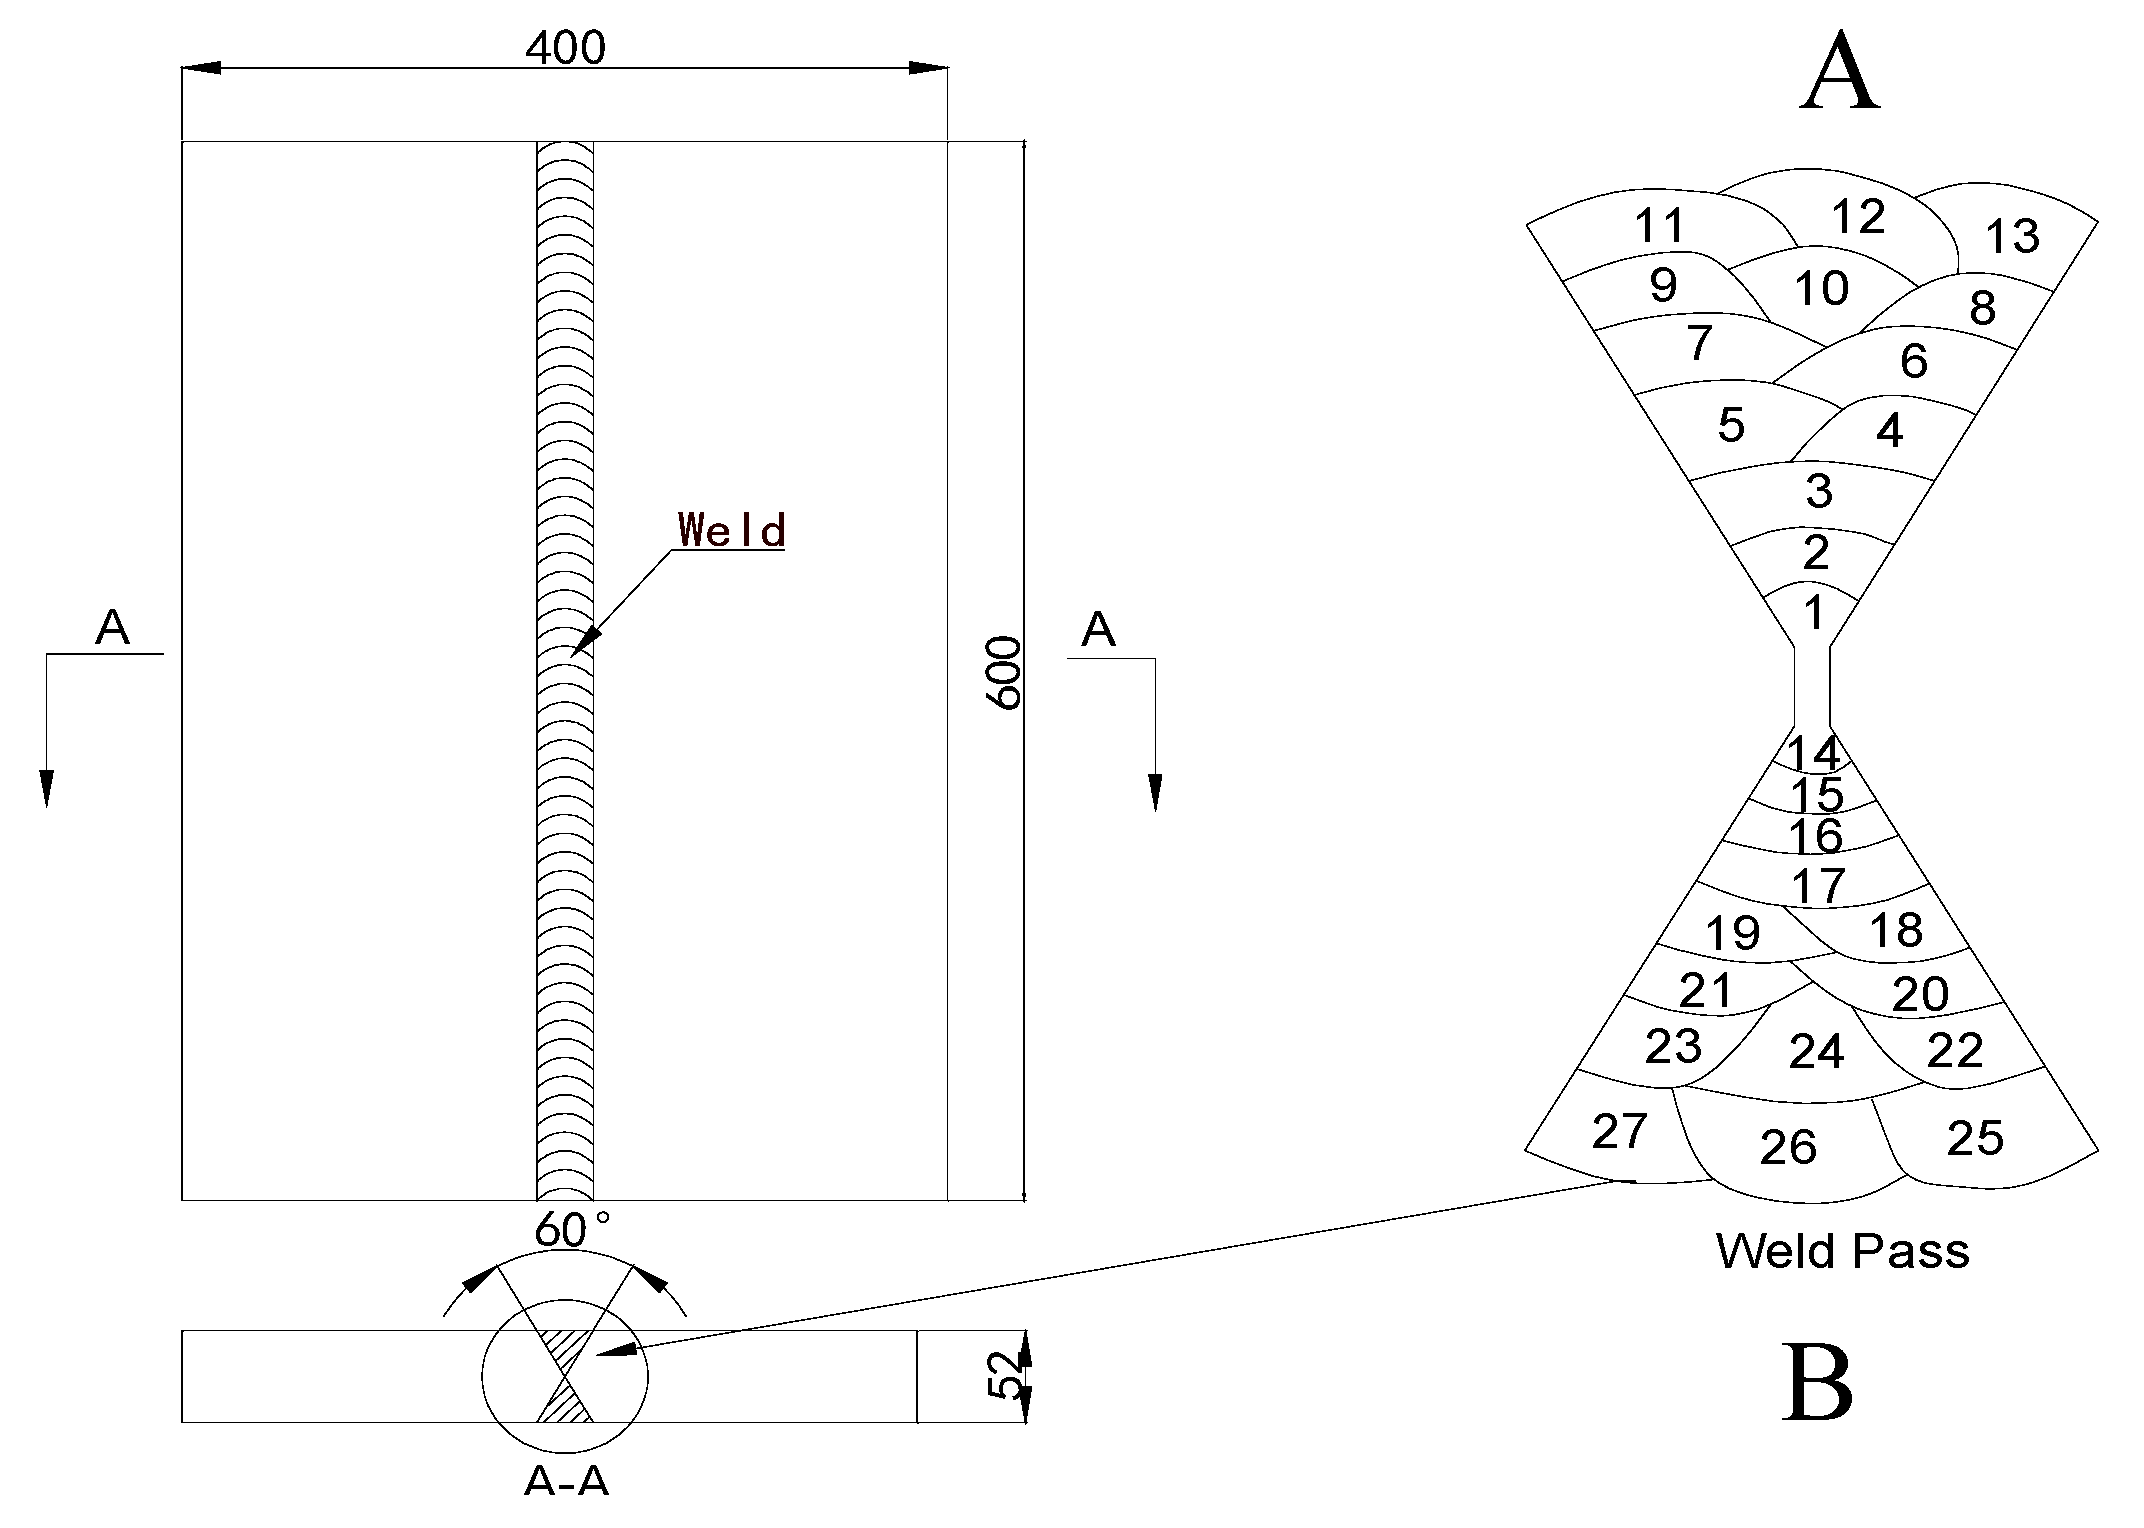
2.1. Welding Process
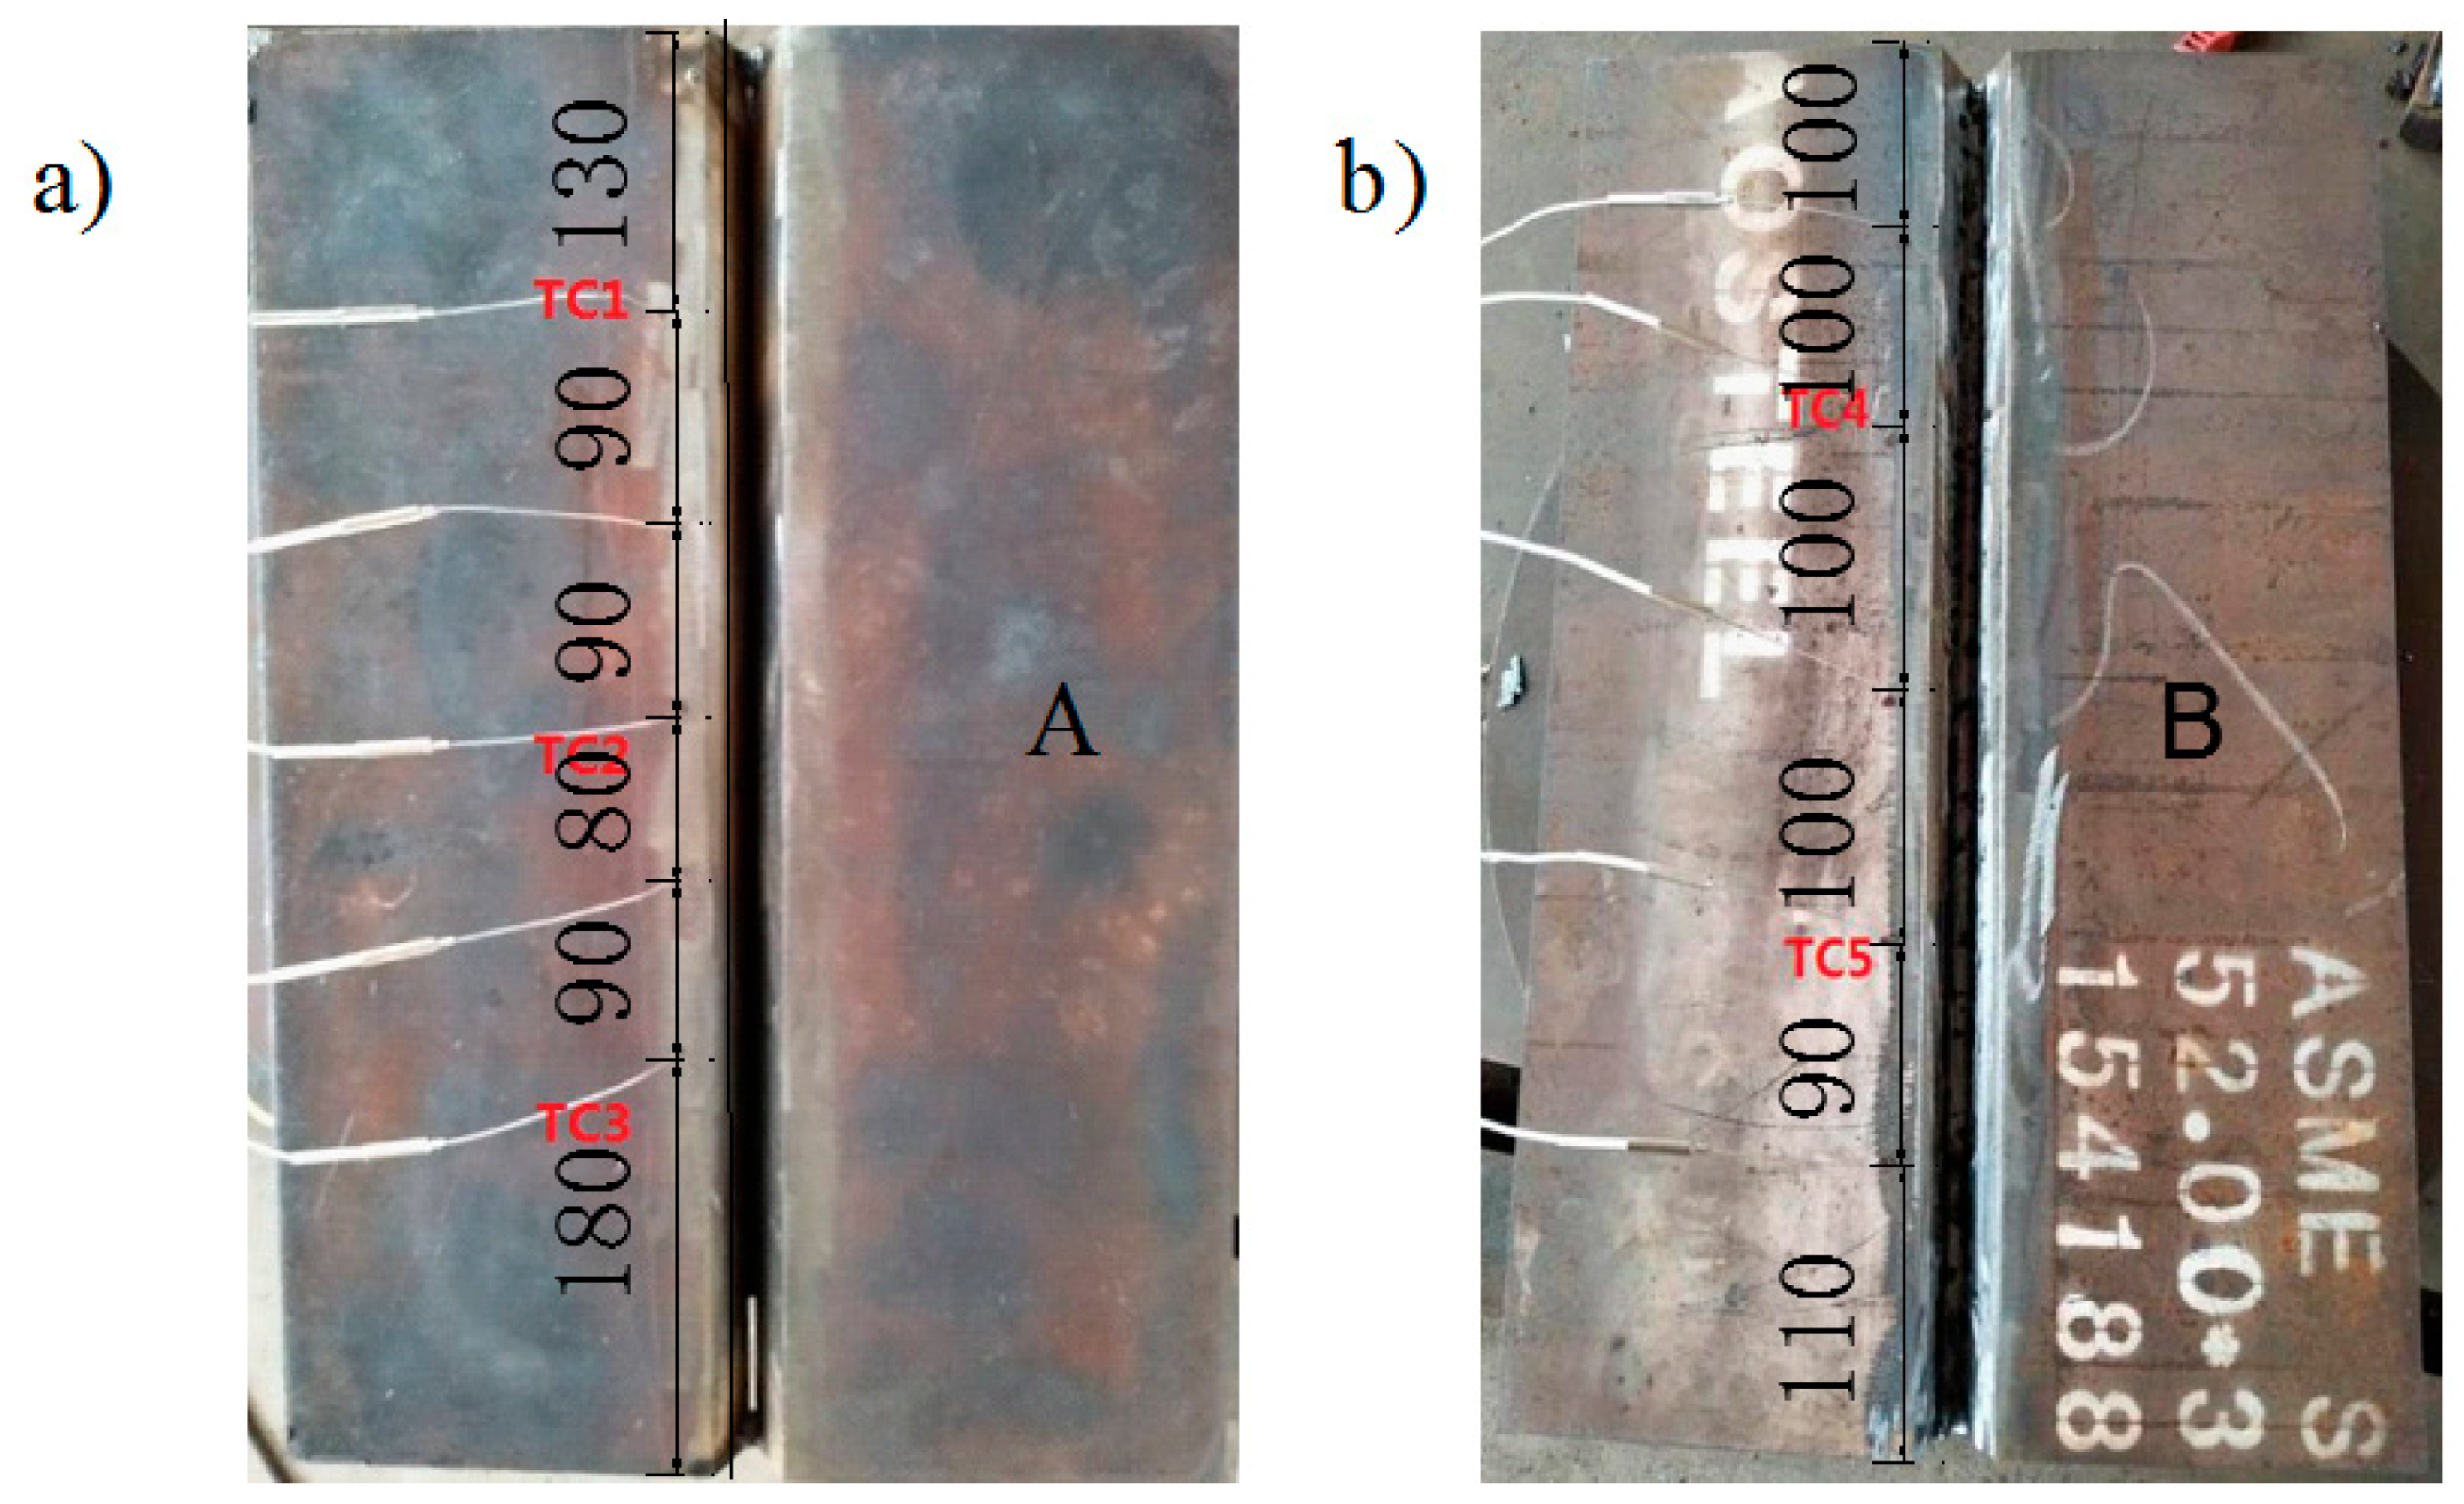
2.2. Welding Temperature Field Measurement
2.3. Residual Stress Measurement
3. FE Modelling
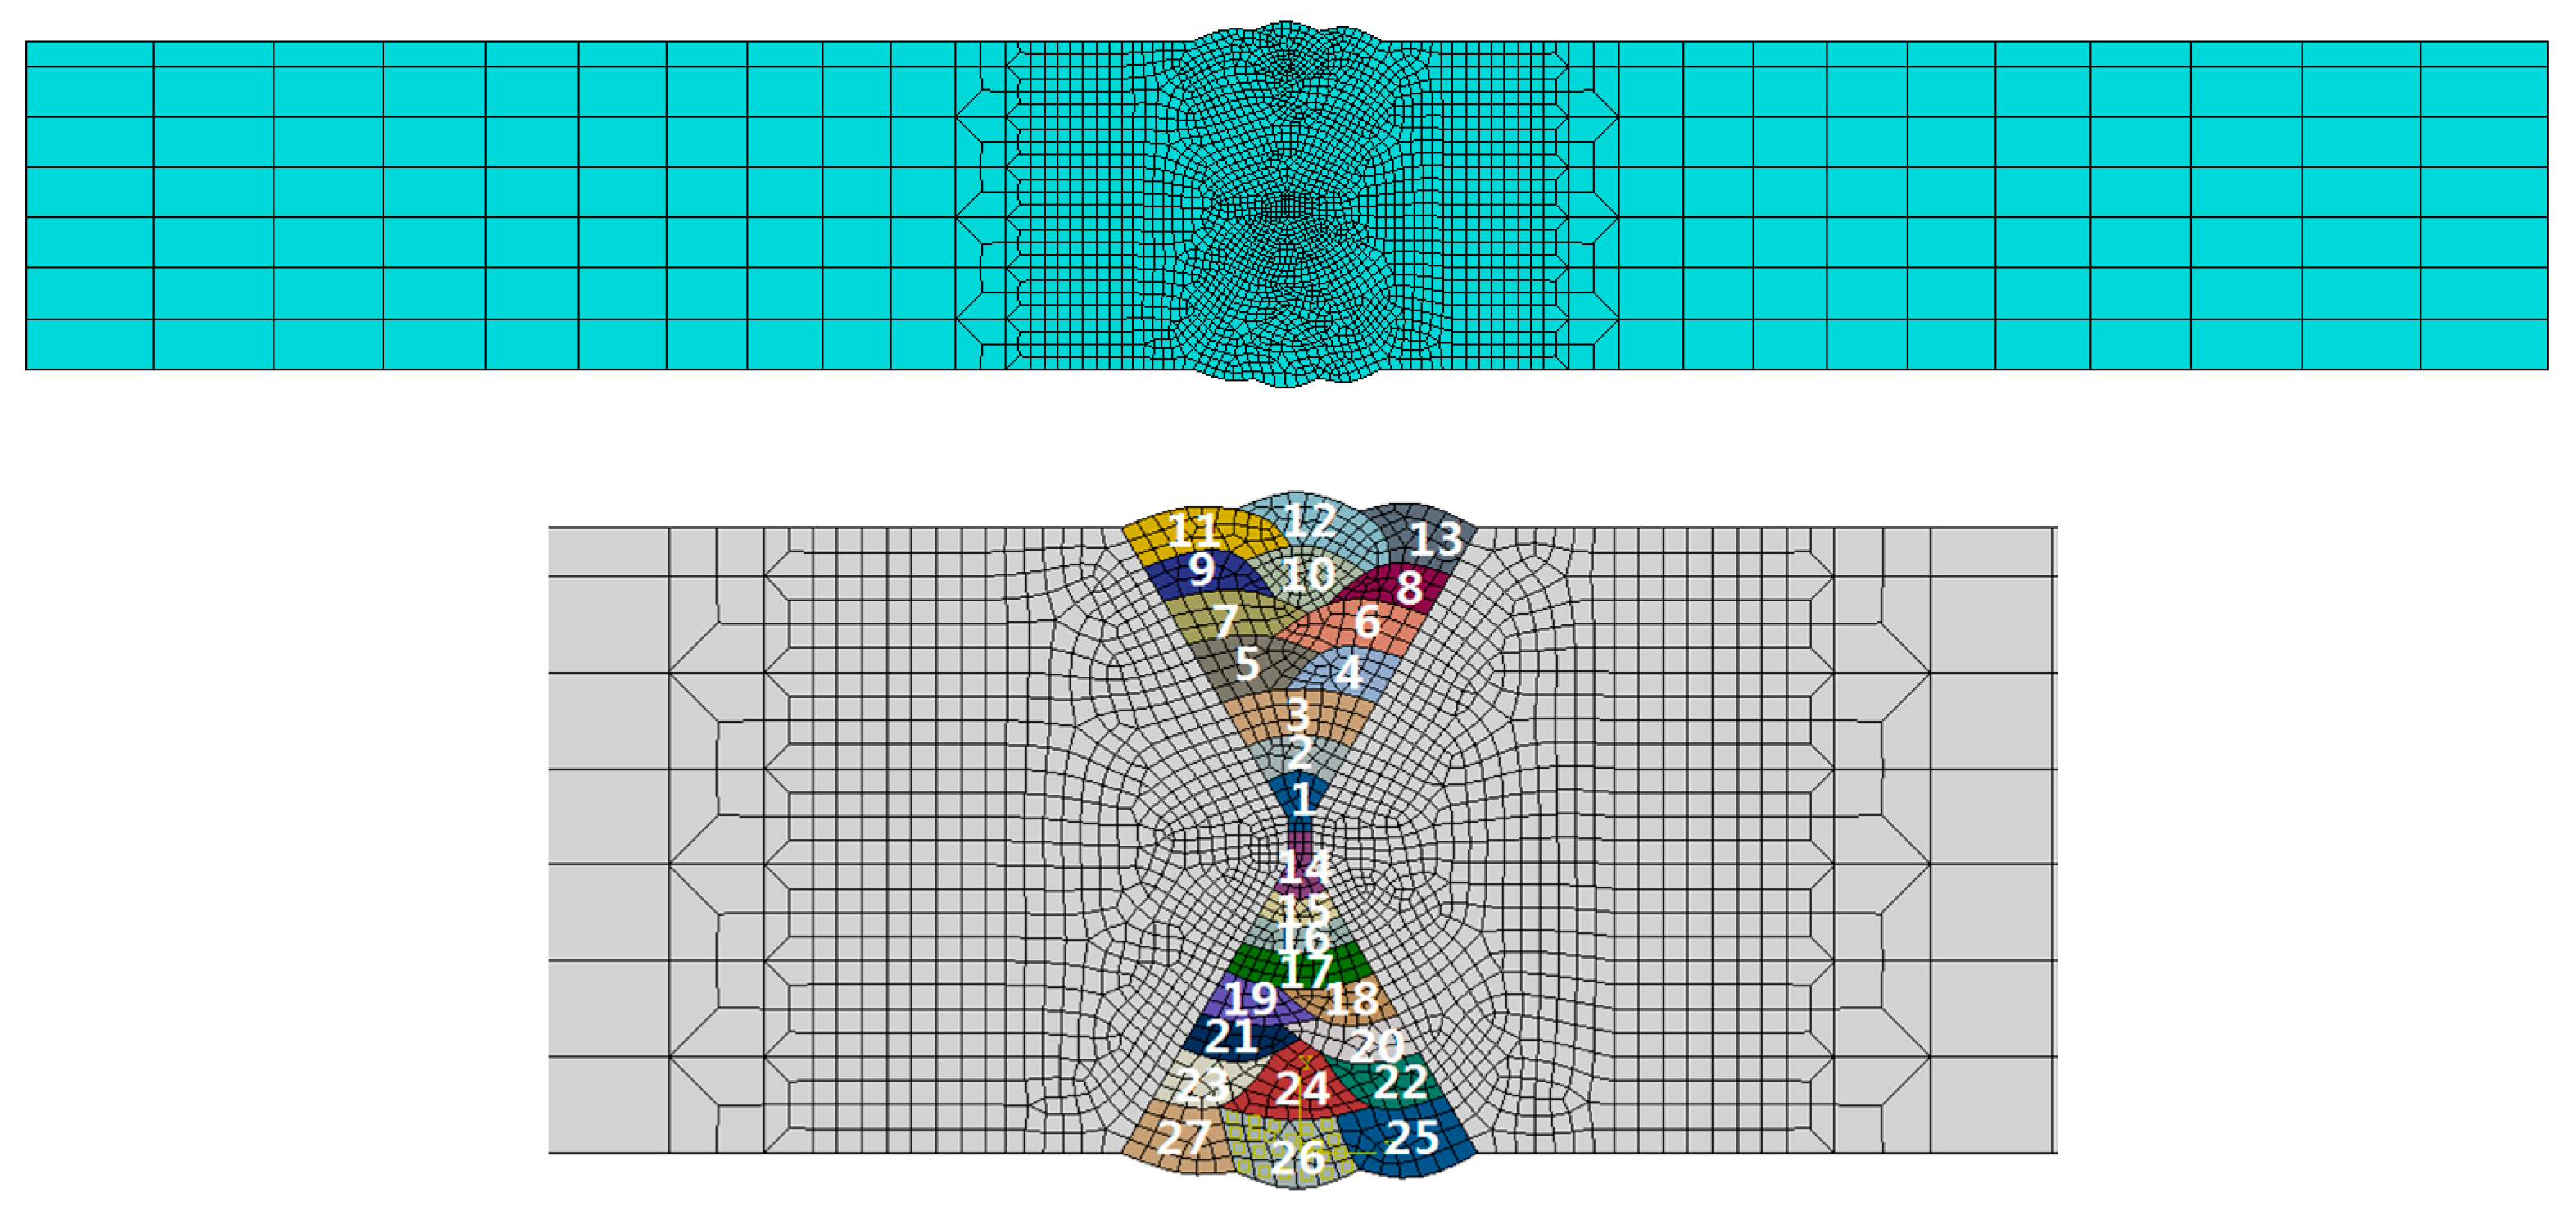
3.1. FE Mesh
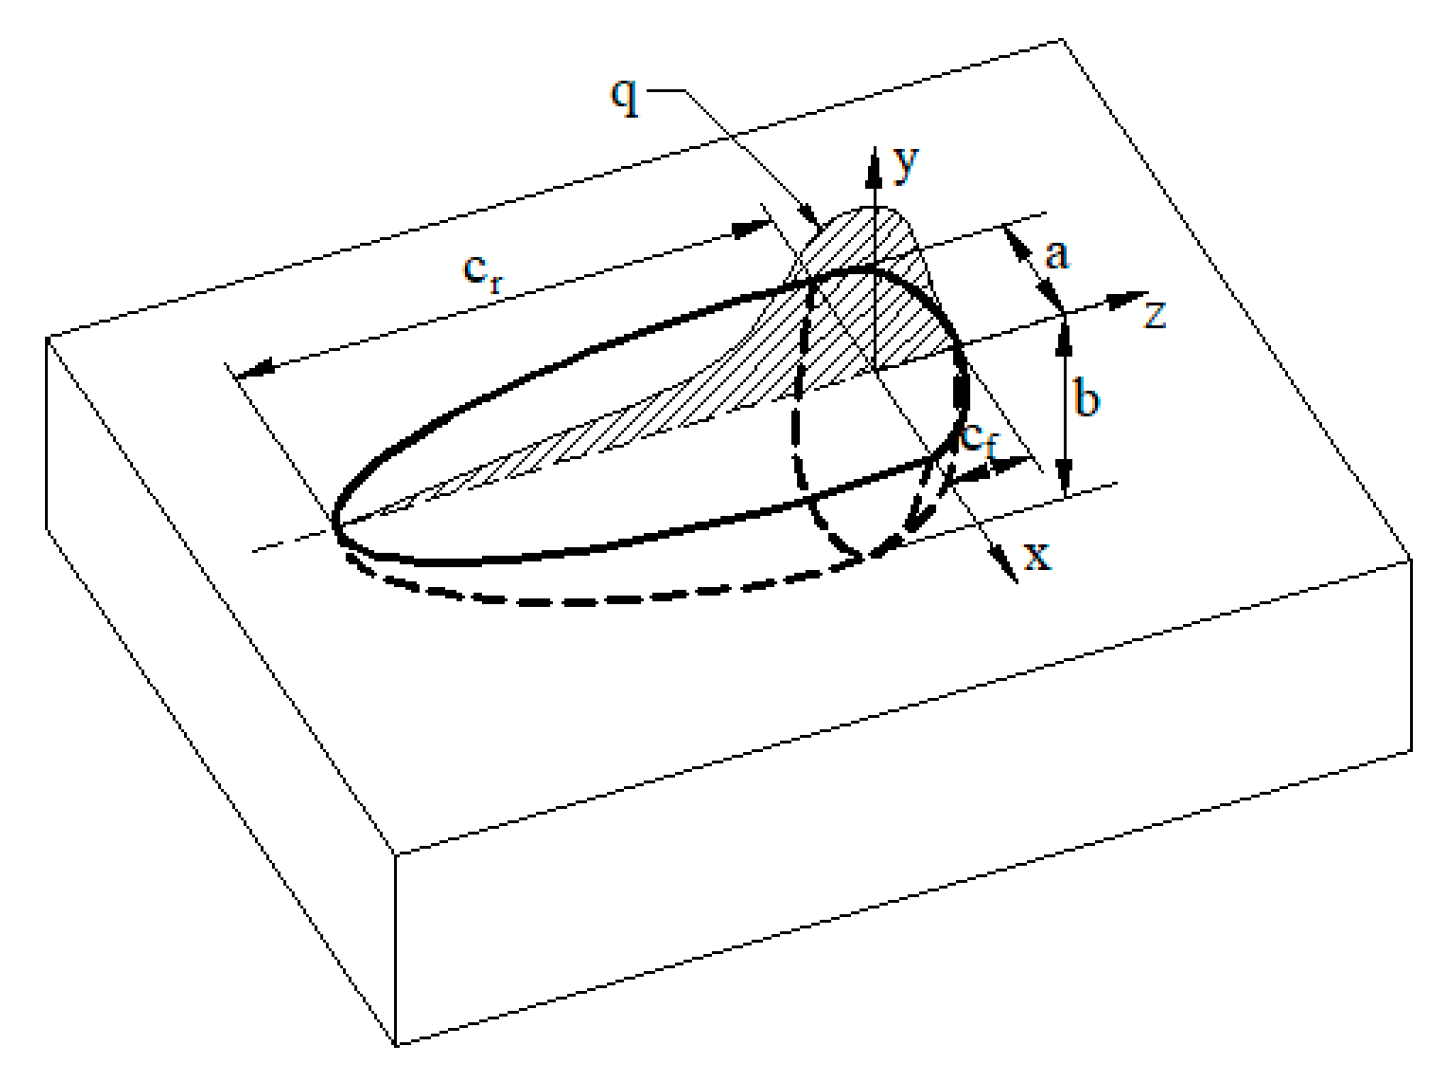
3.2. Thermal Analysis
3.3. Mechanical Analysis
- Welded parts under Von Mises yield criterion;
- The behavior in the plastic zone of the welding part is subject to the plastic flow rule and isotropic hardening rule;
- Elastic-plastic strain and thermal strain are inseparable;
- Thermal properties and stresses/strains related to temperature change linearly in small time increments.
4. Results and Discussion
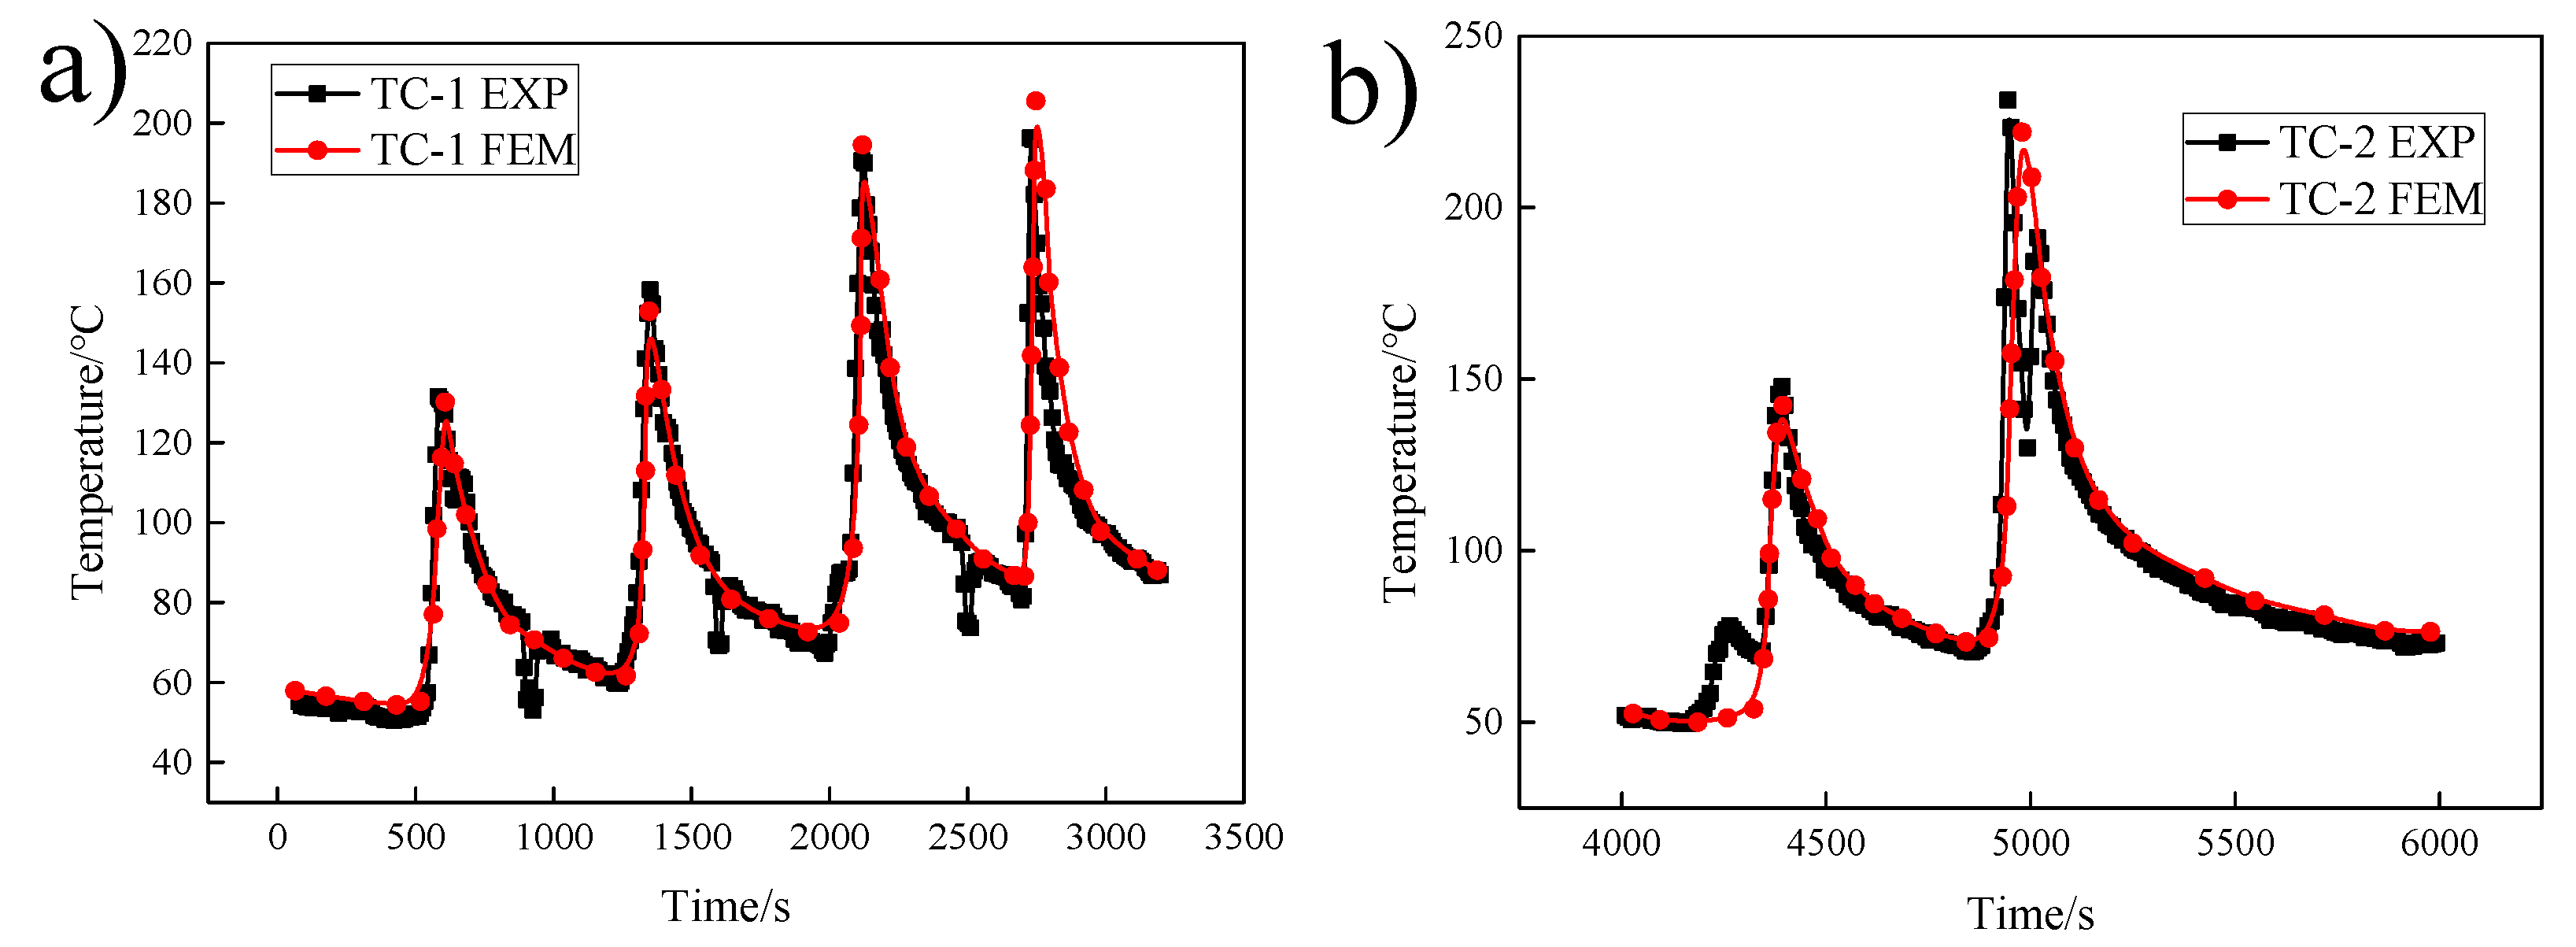
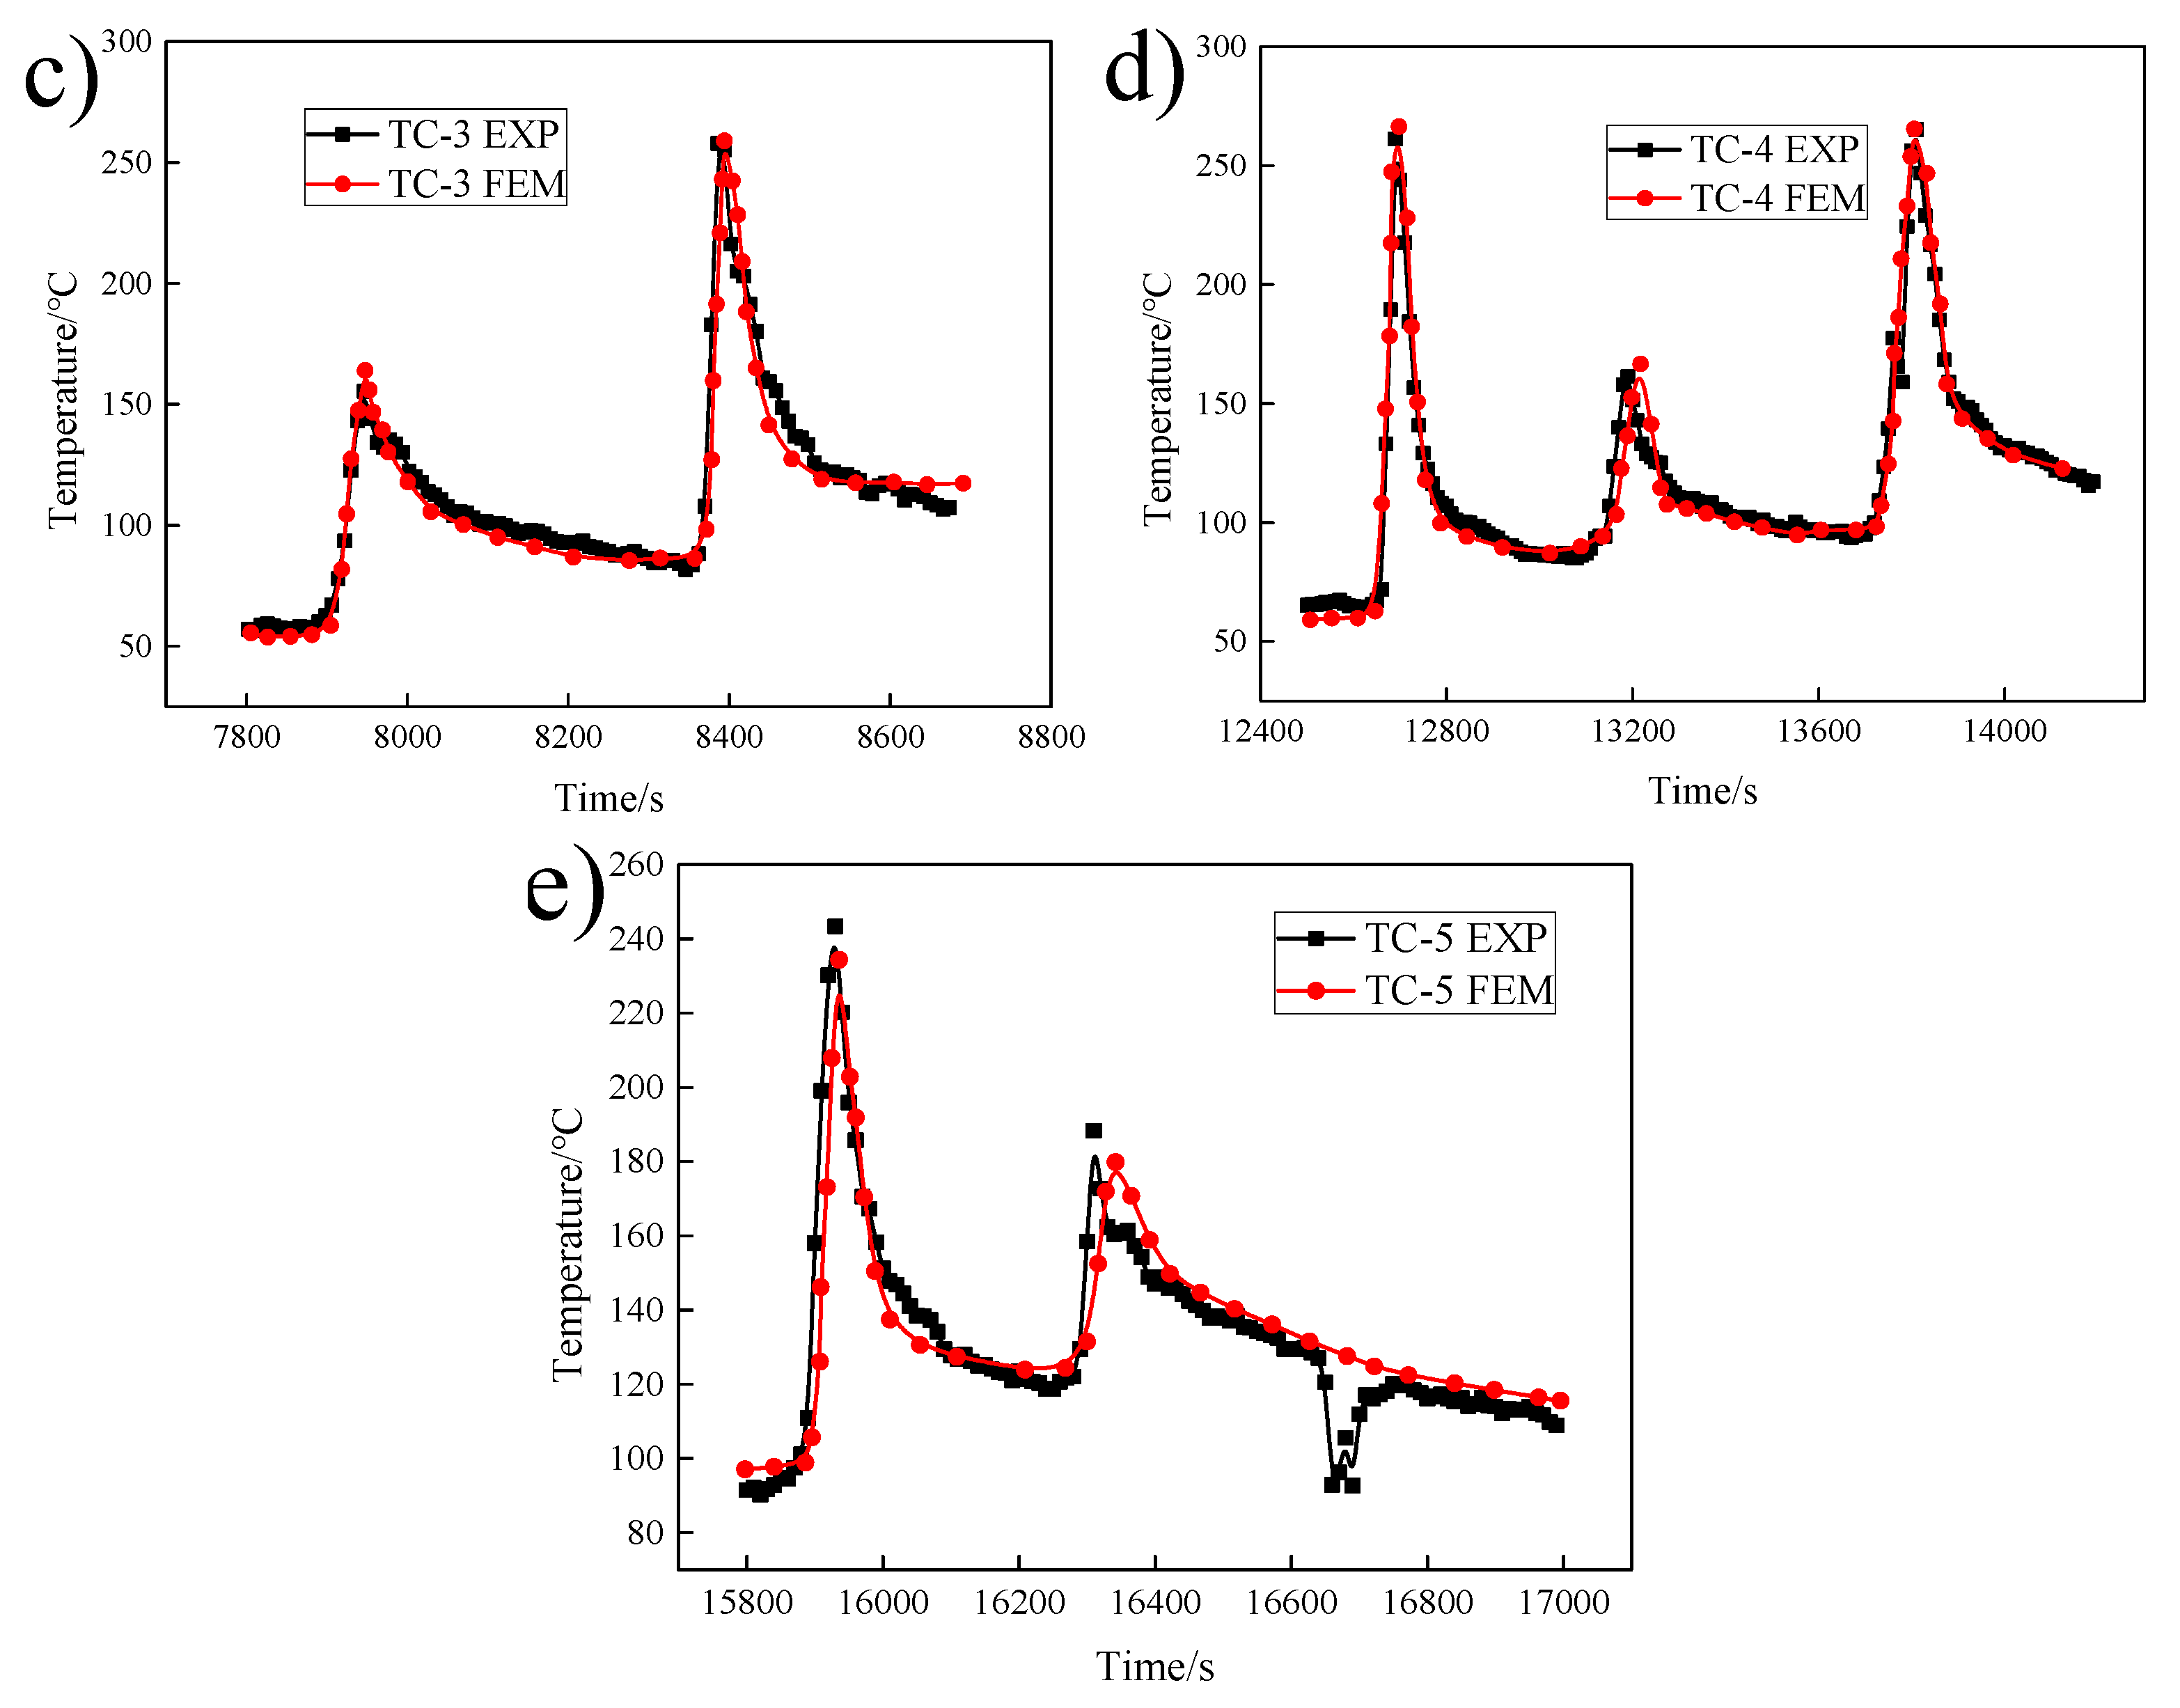
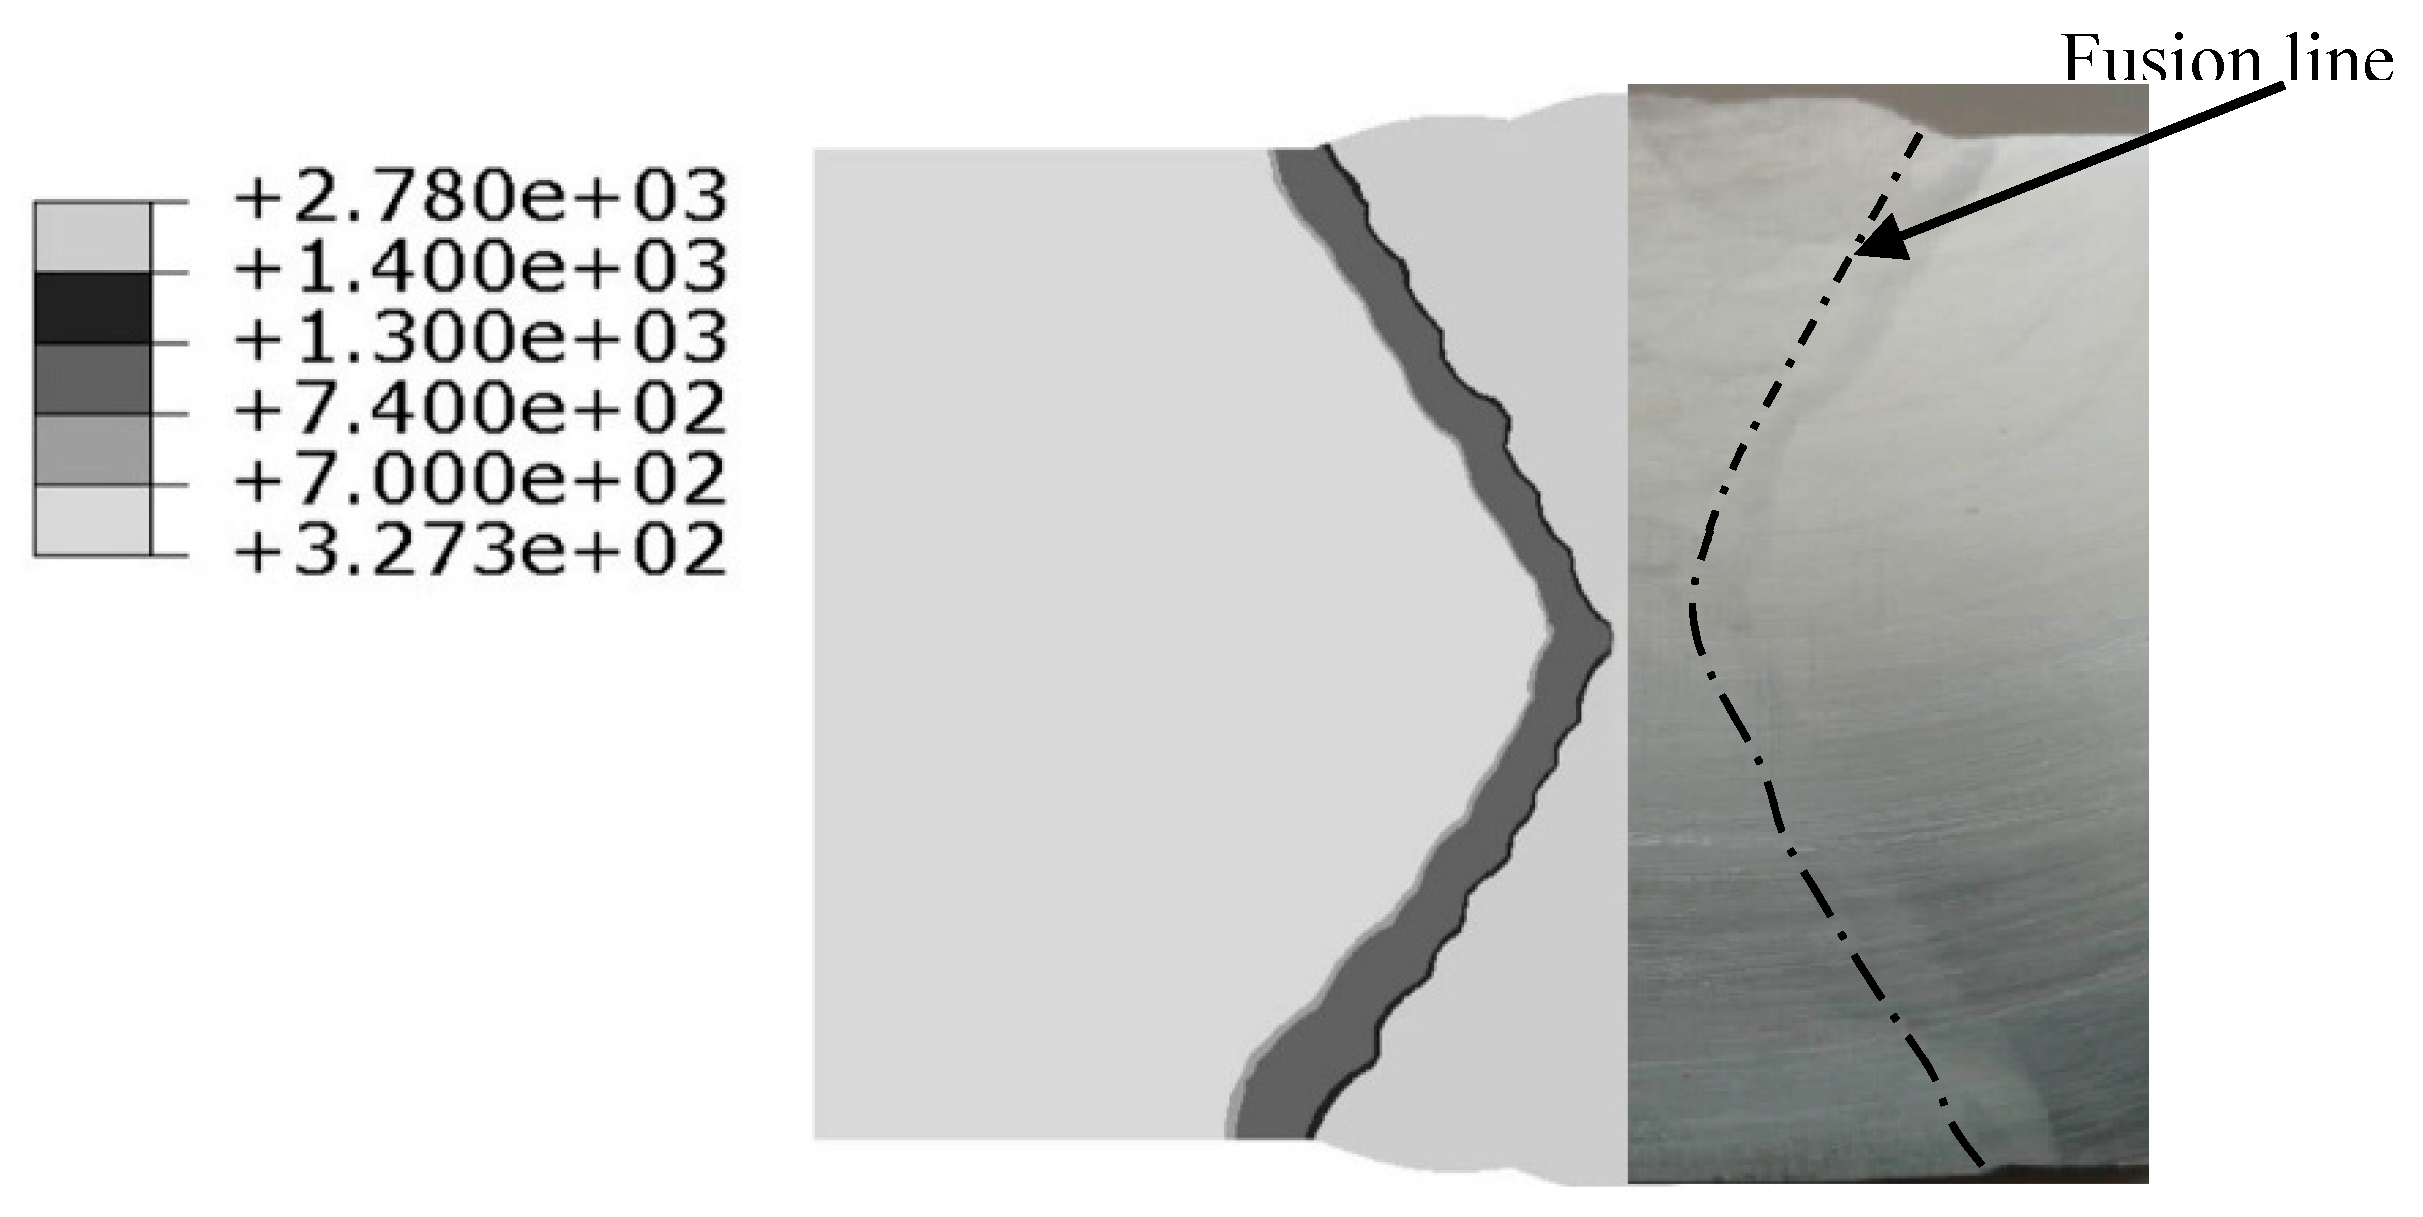
4.1. Results of Welding Temperature Field
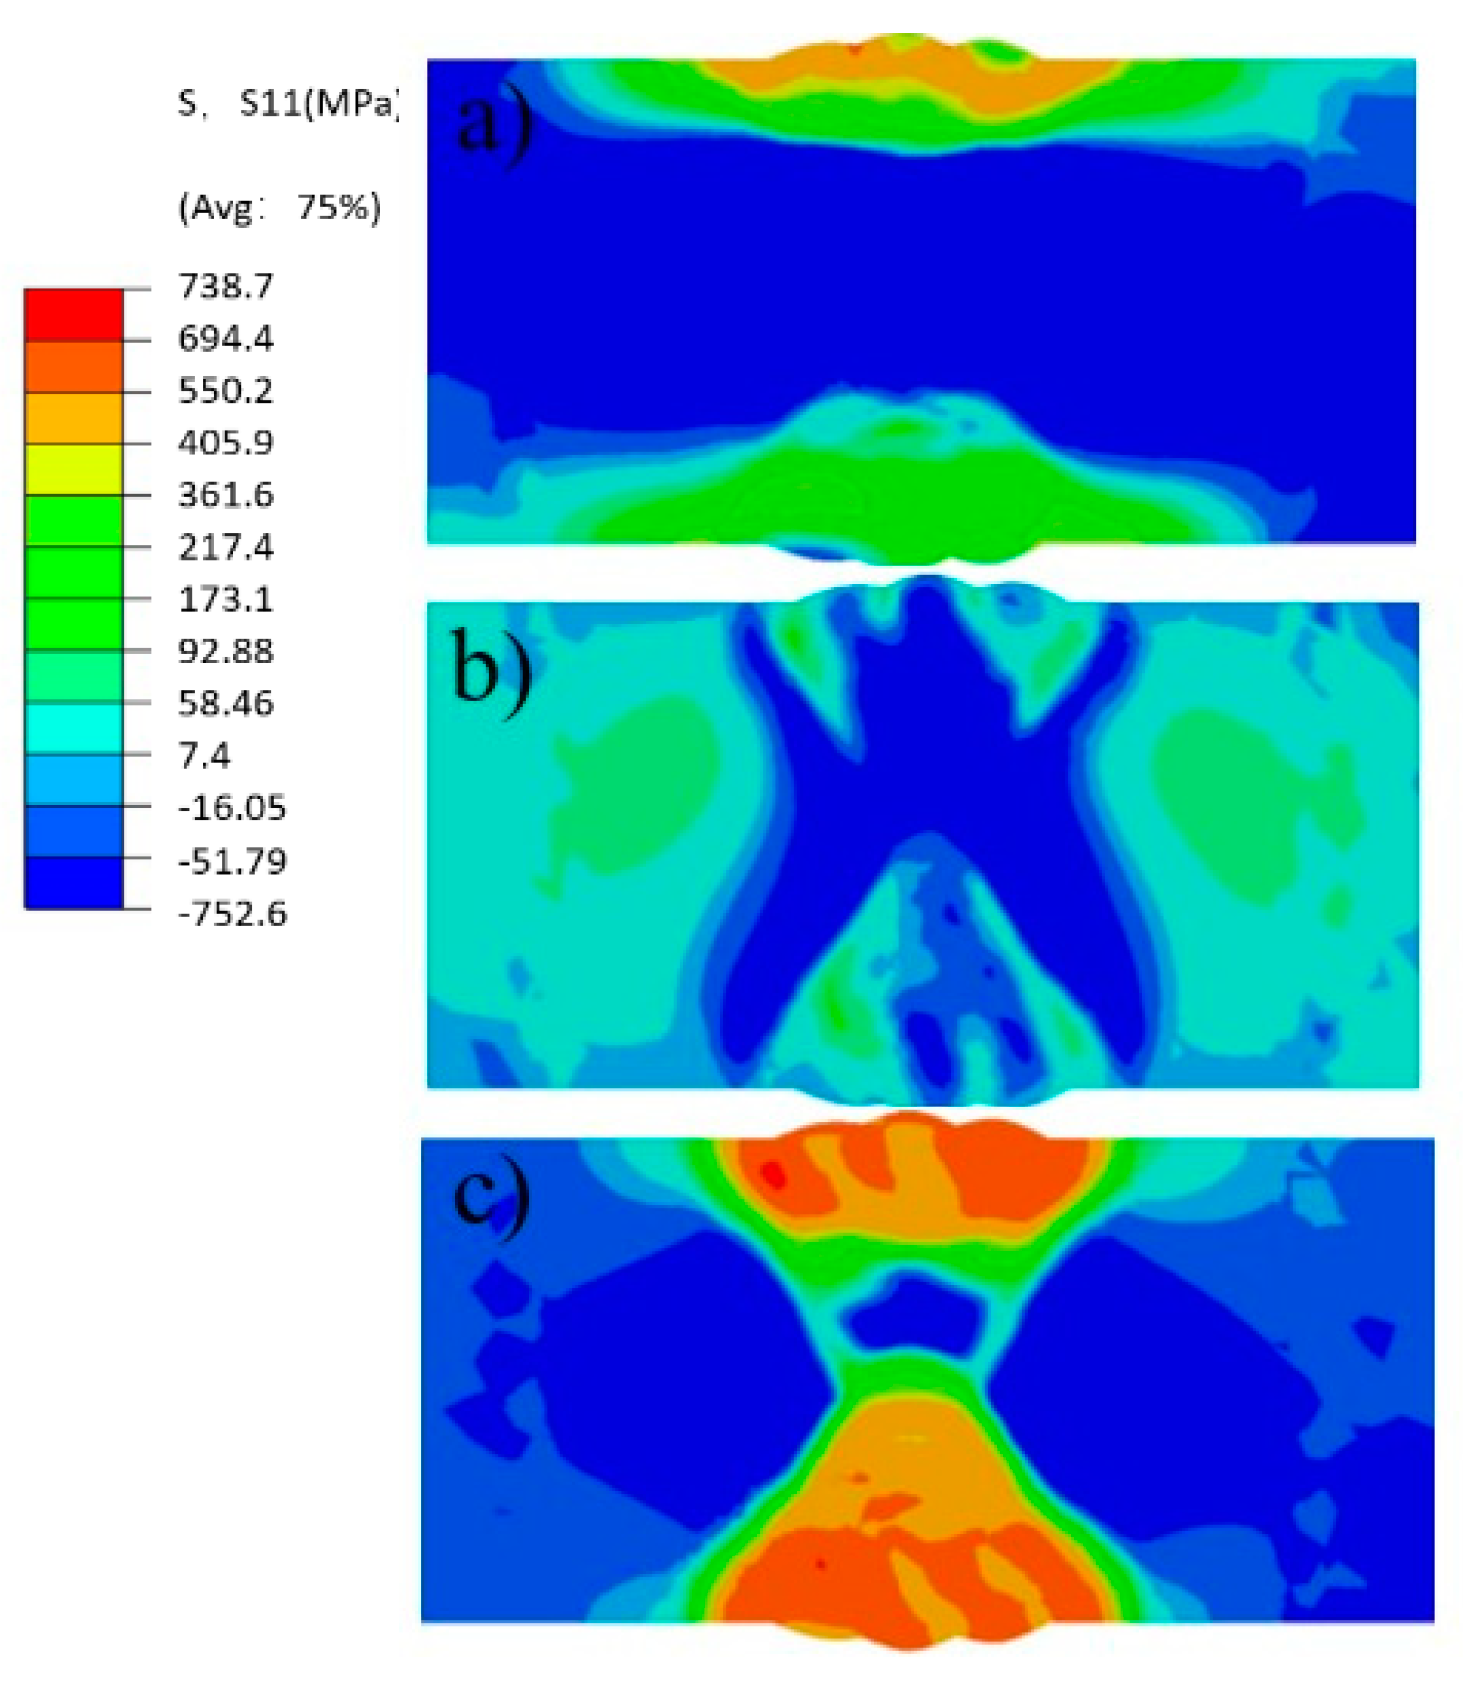
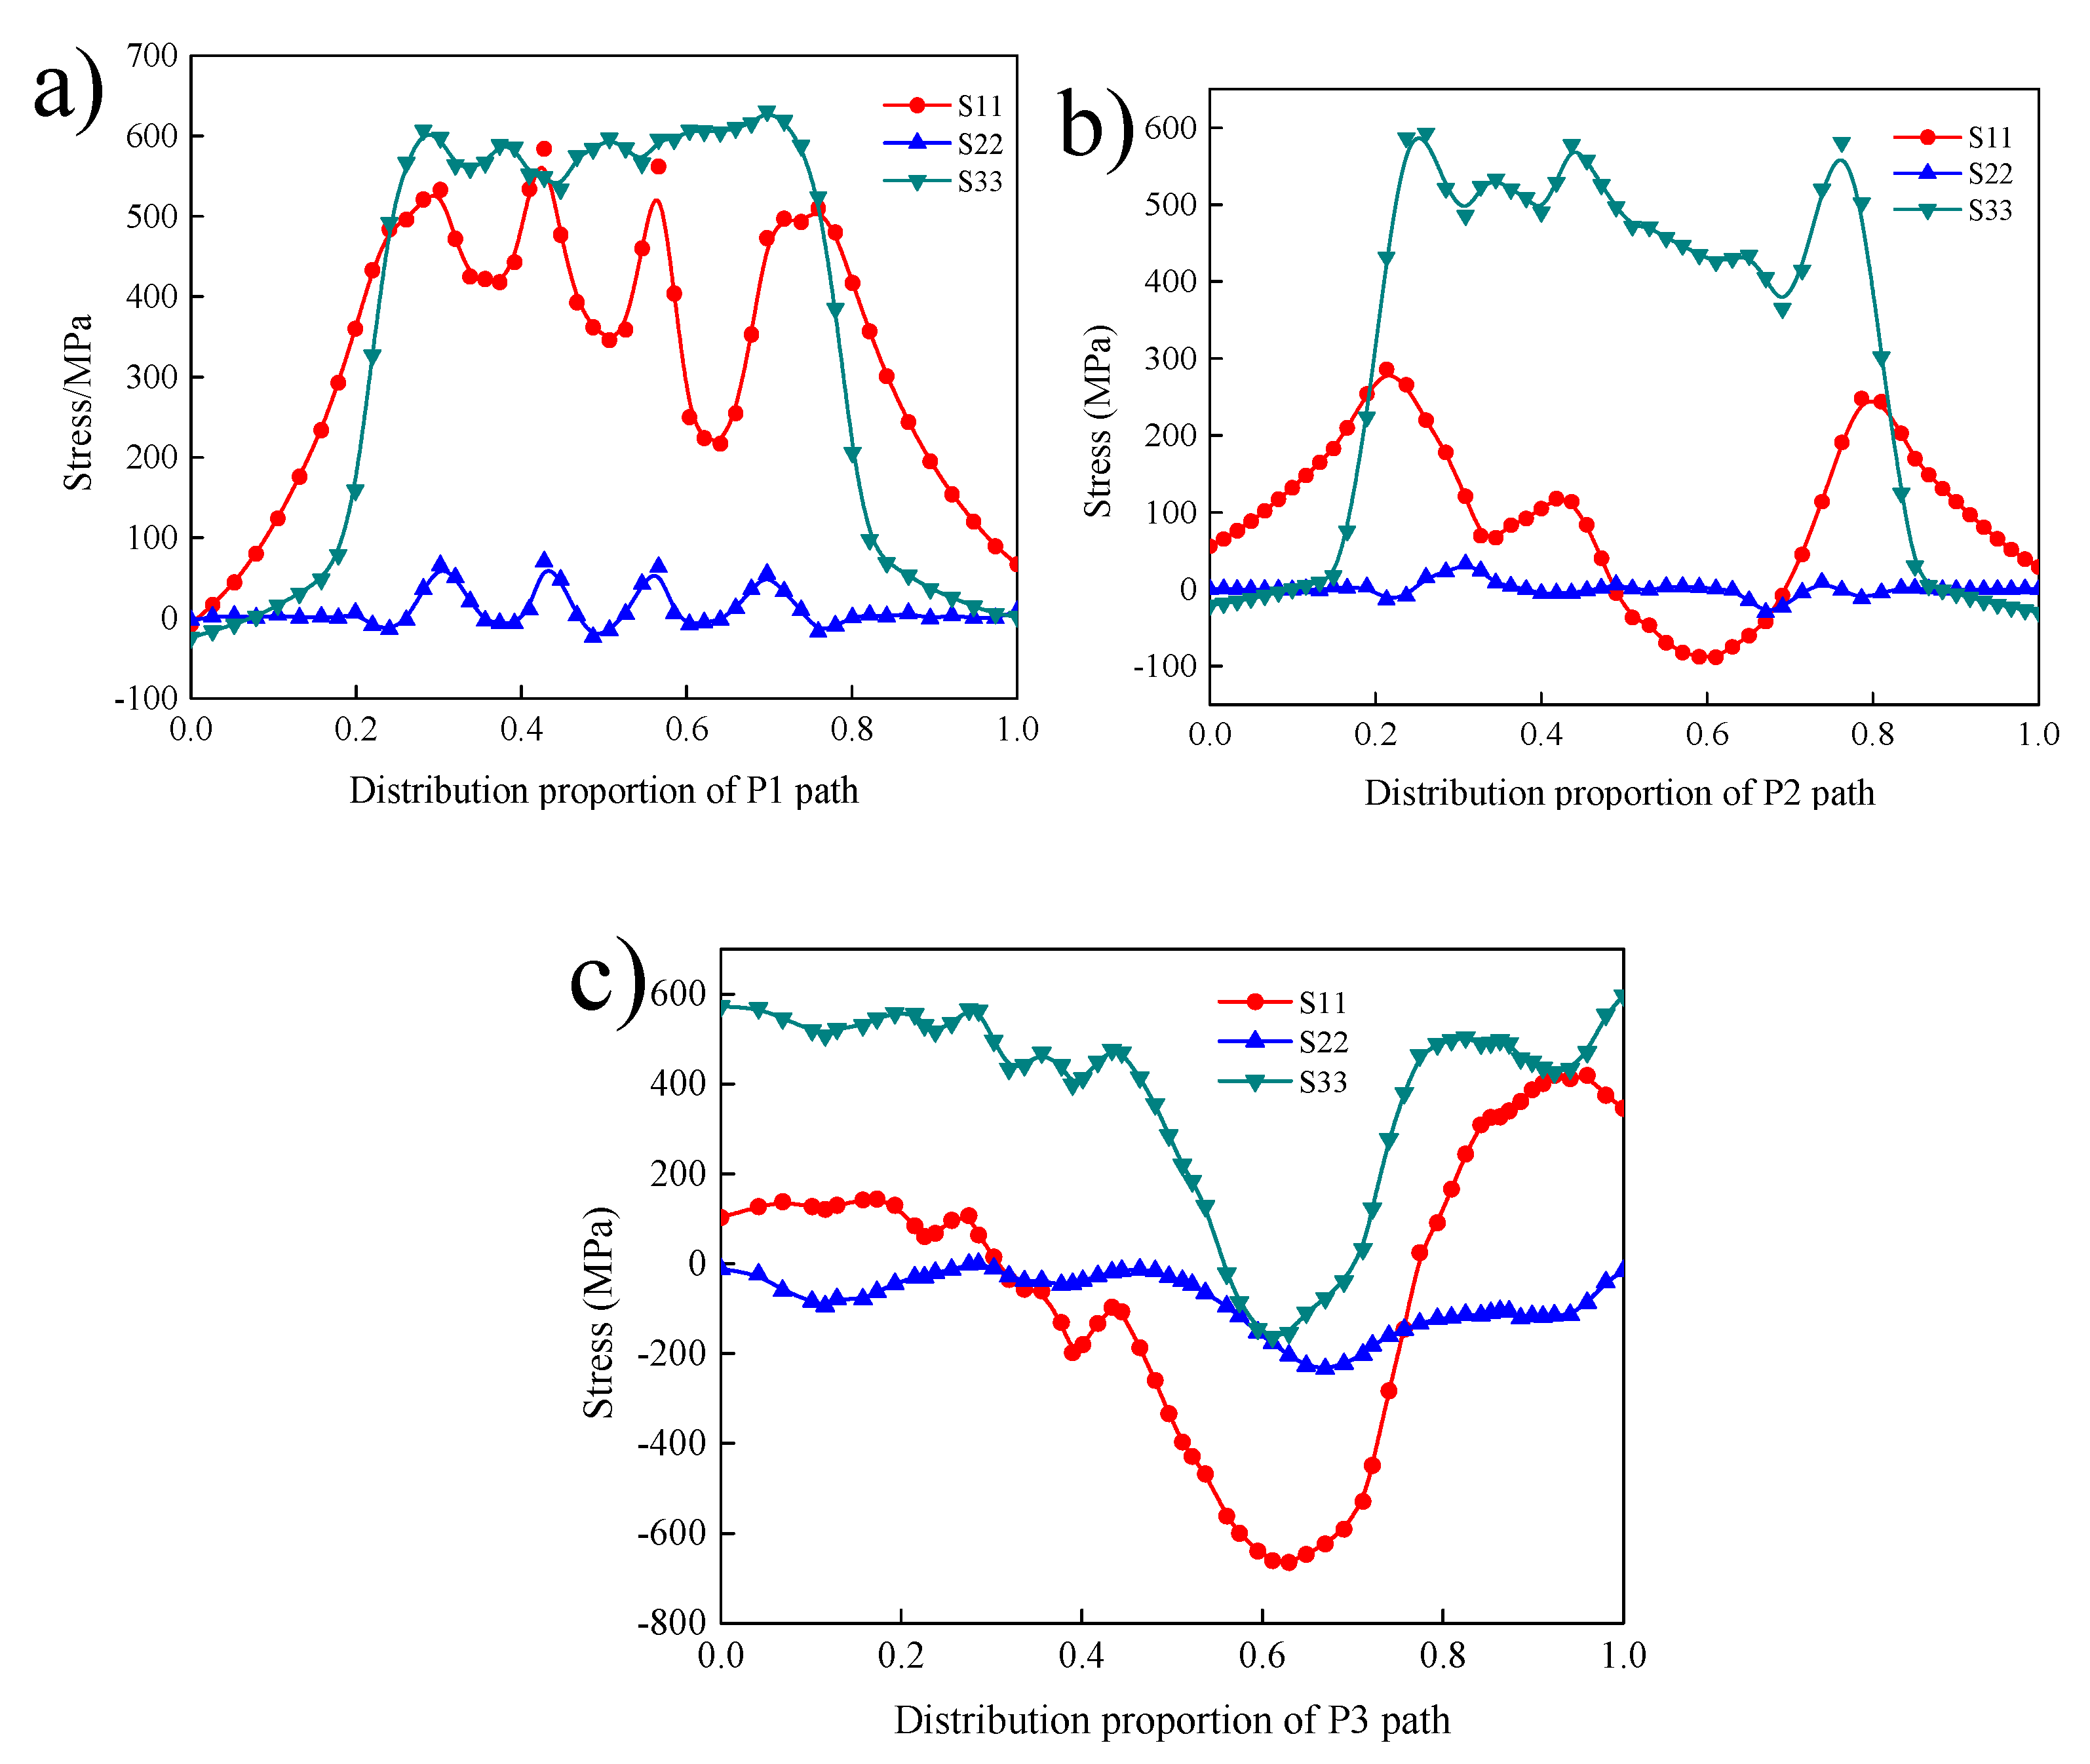
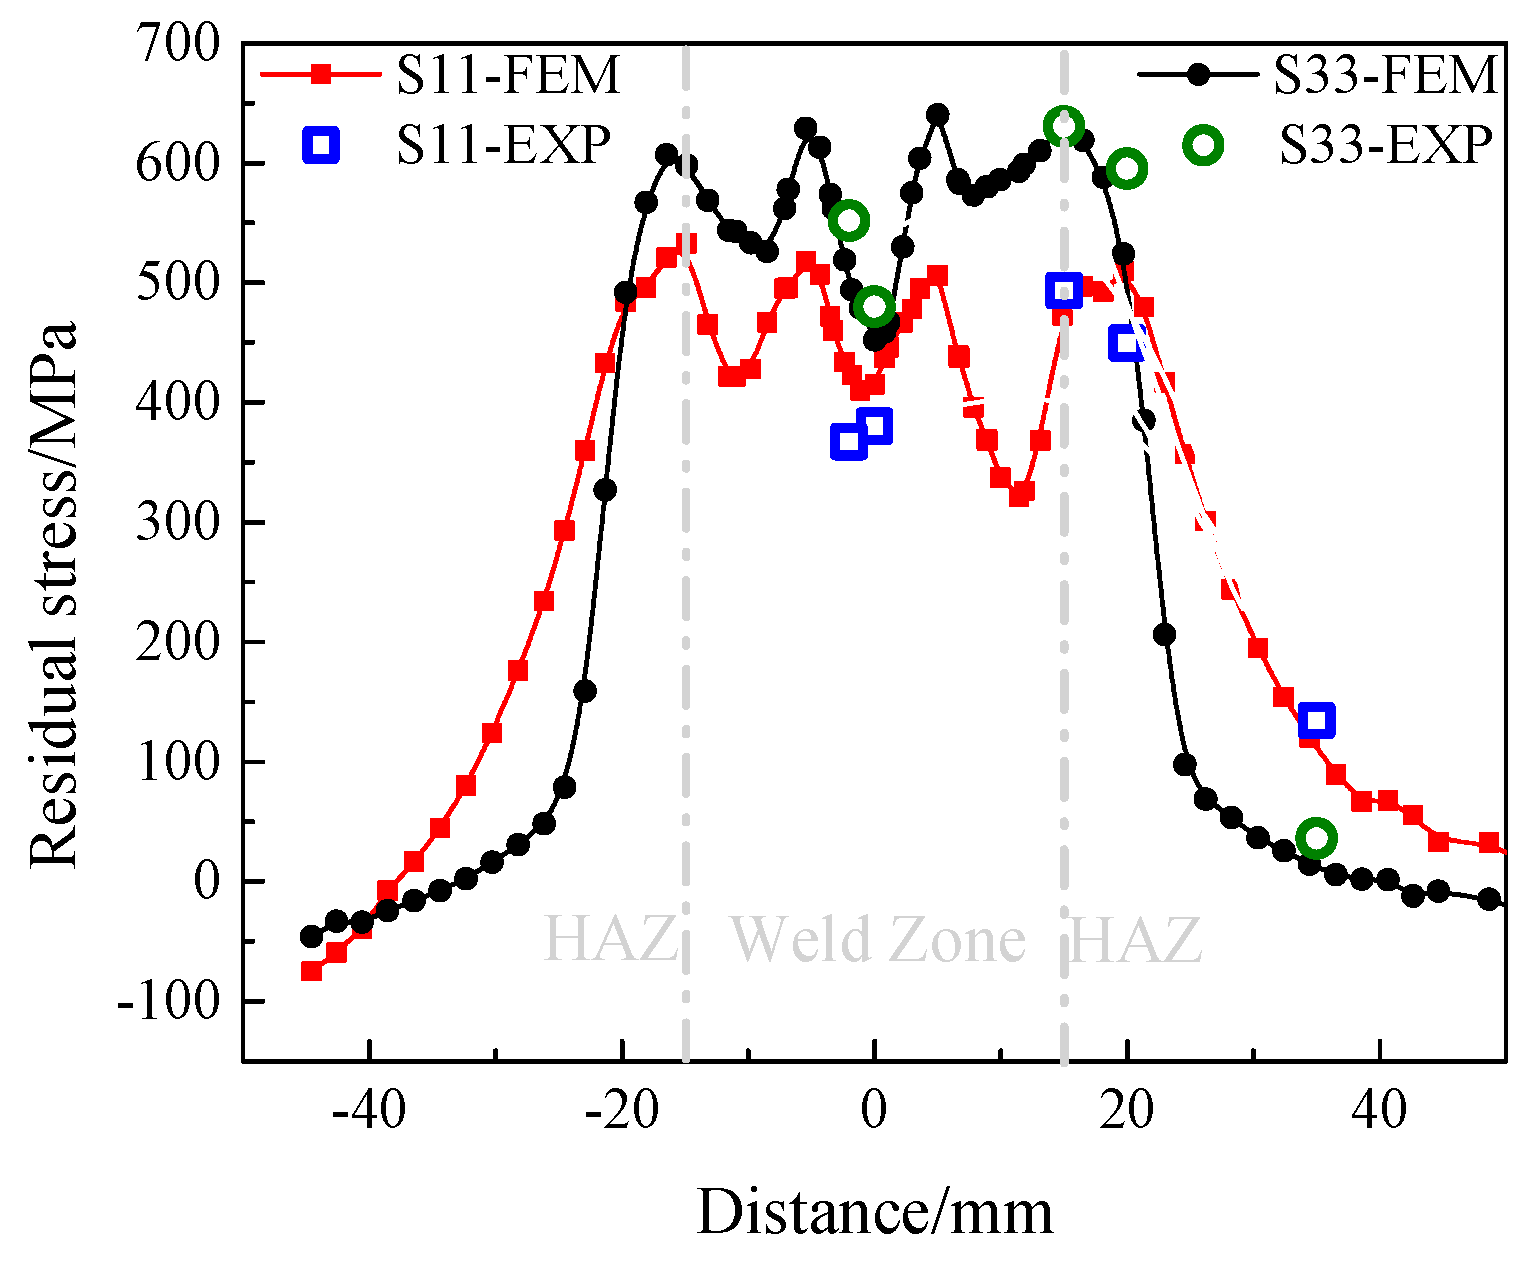
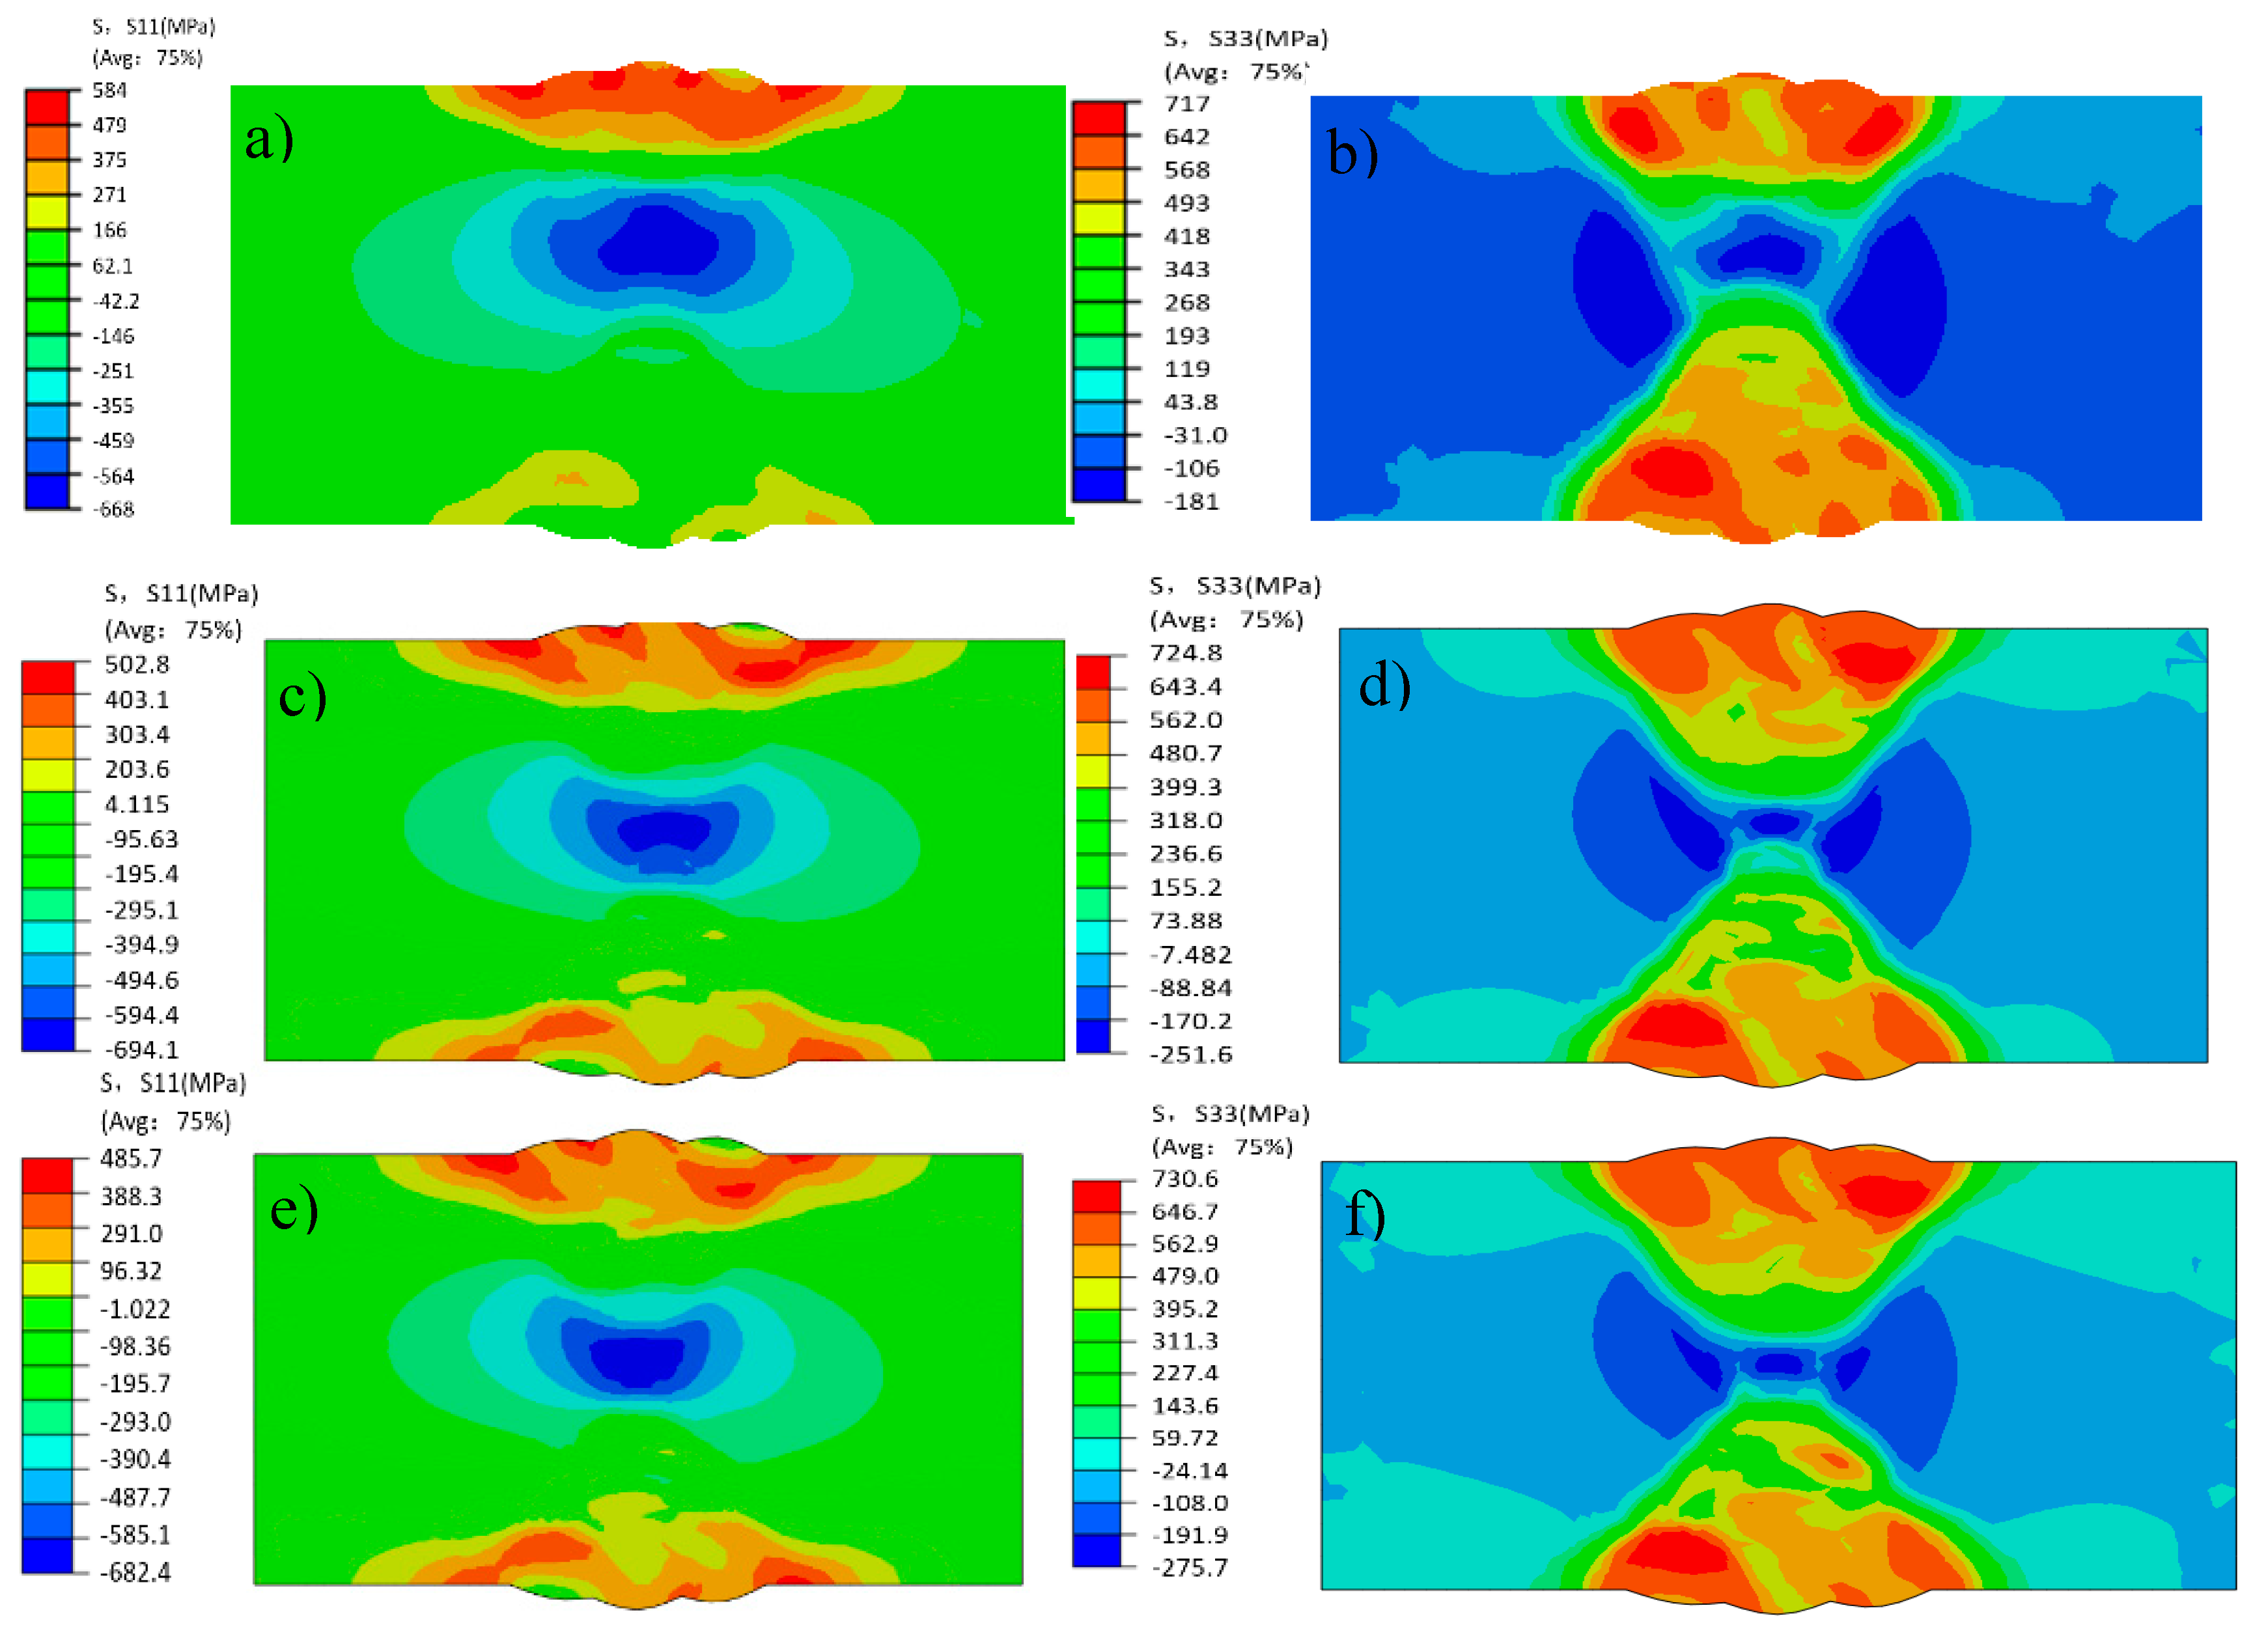
4.2. Welding Stress Field Results
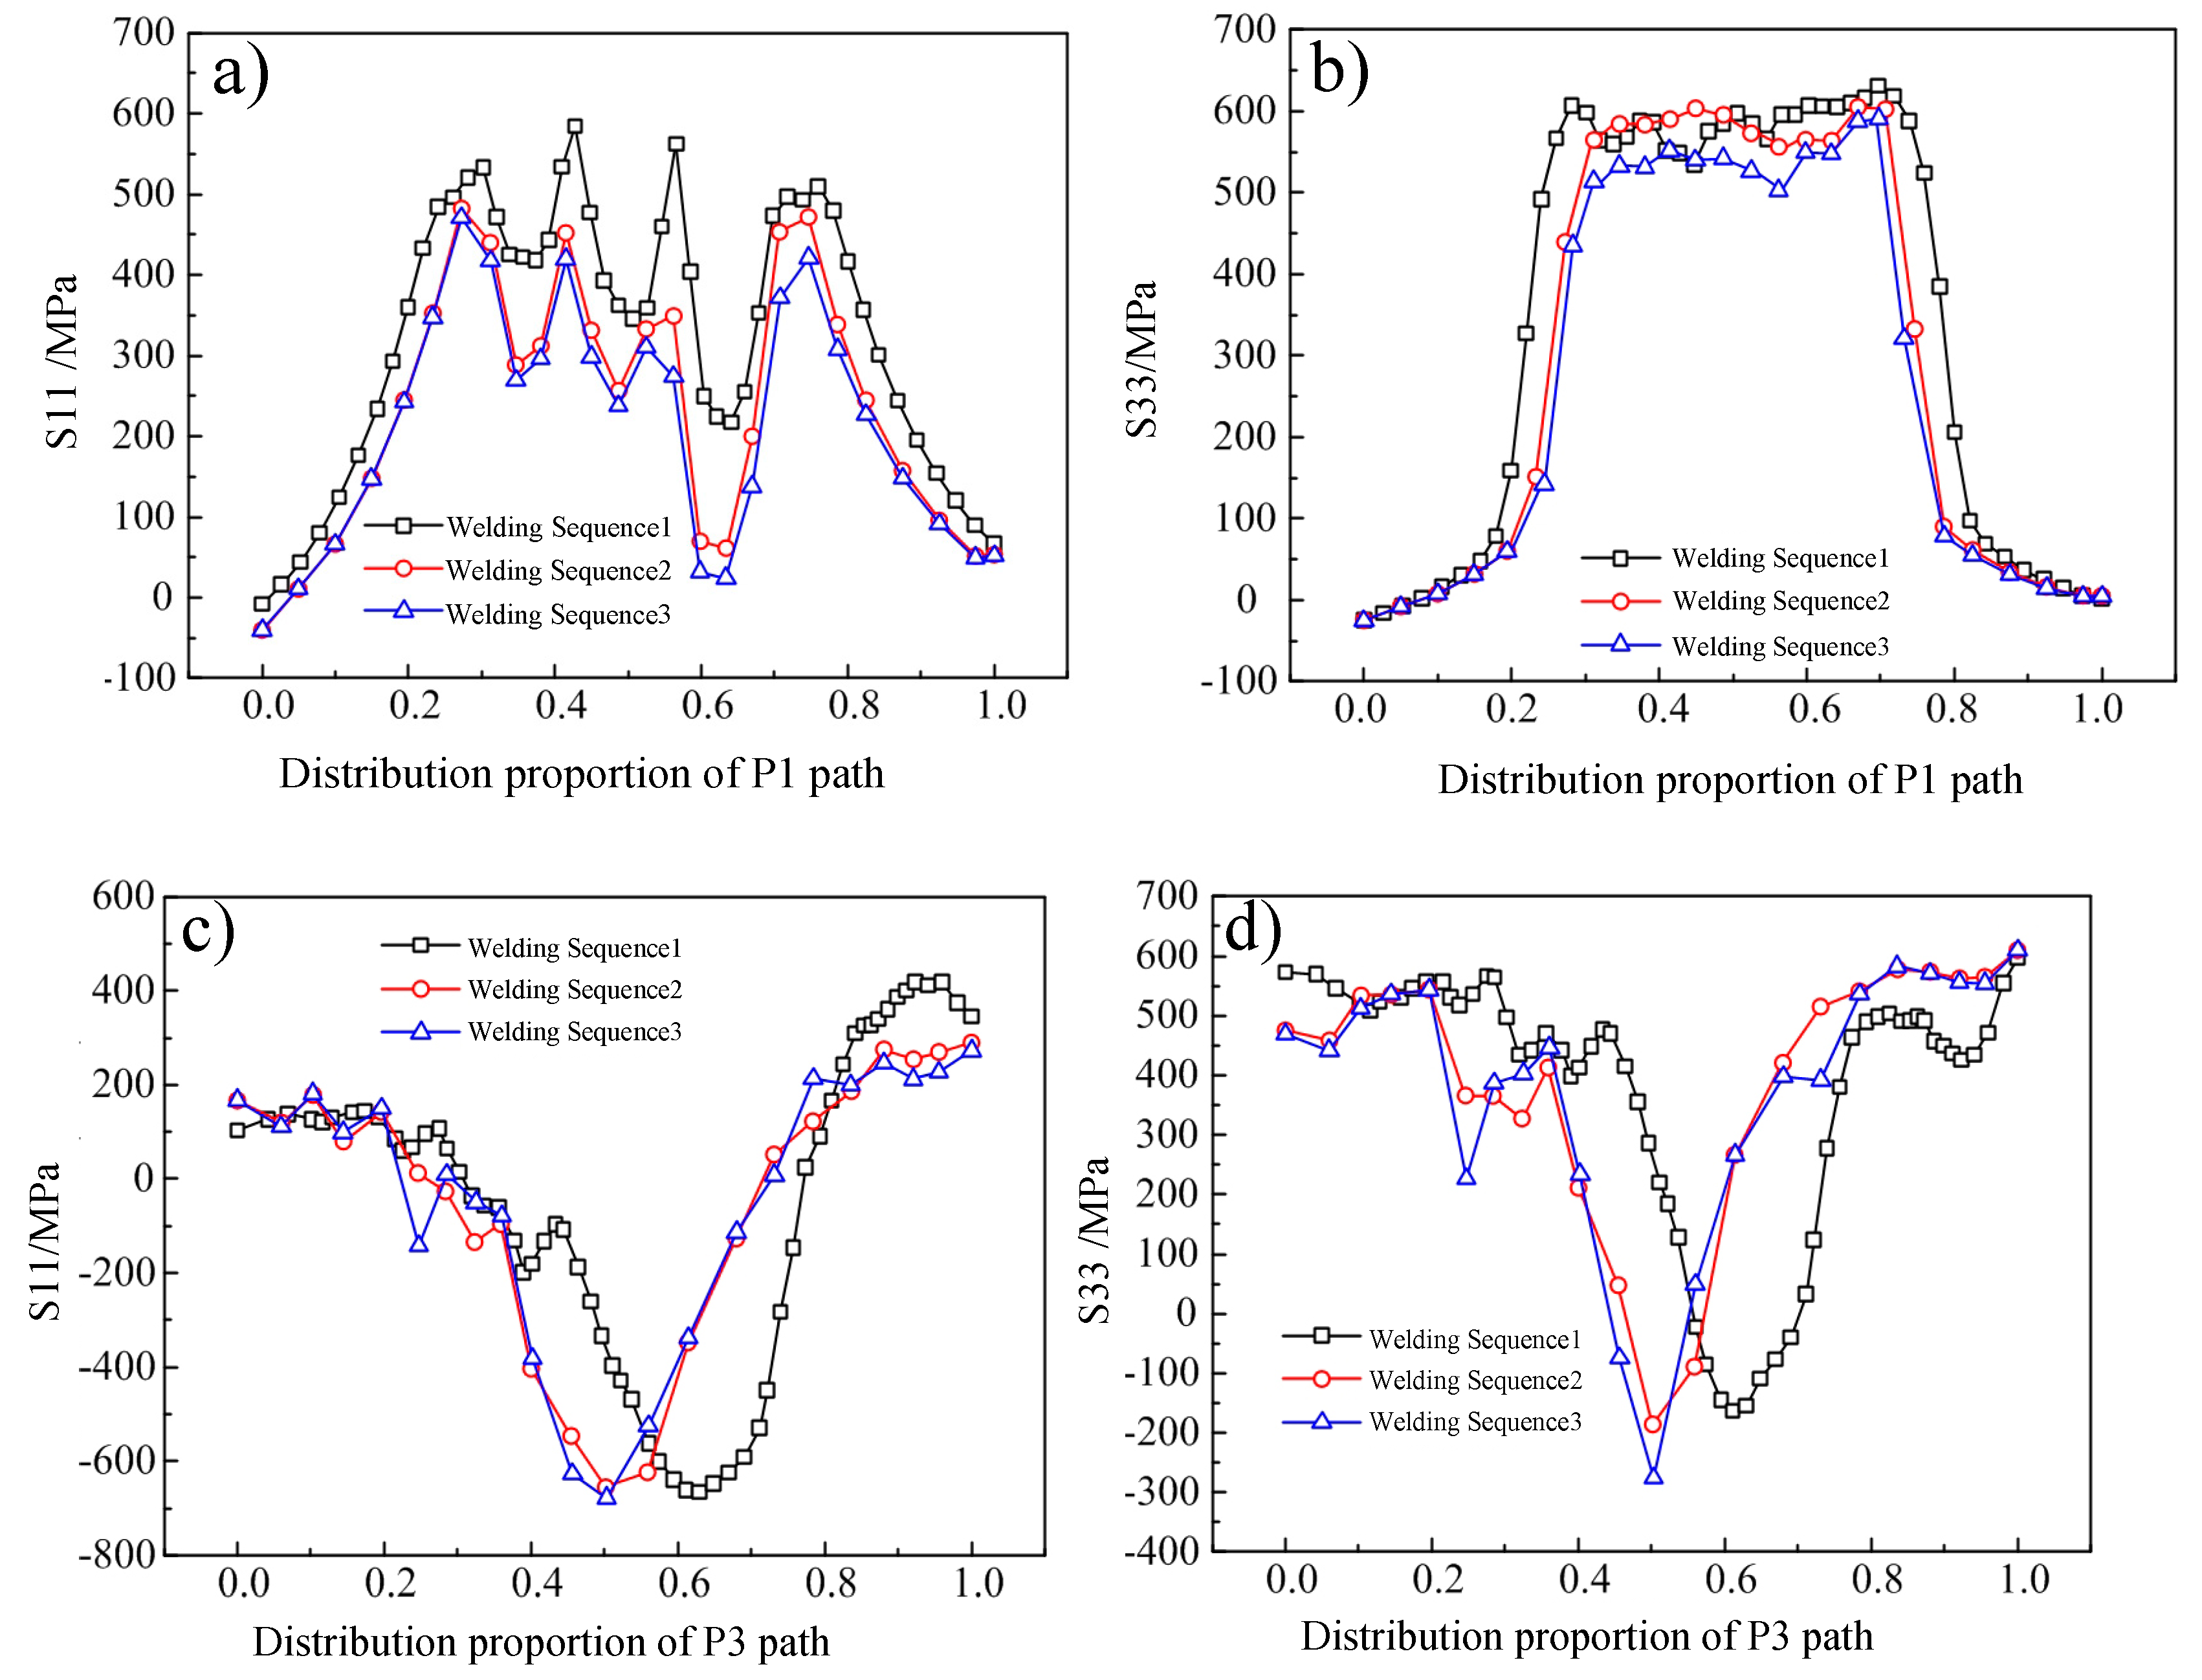
4.3. Effect of Welding Sequence on Residual Stress
5. Conclusions
- (1)
- The accuracy of the temperature field of the model was verified by comparing the thermal cycle curve with the heat affected zone.
- (2)
- Through numerical simulation and analysis, it is found that the normal residual stress S22 changes little, which cannot be deduced from subsequent analysis. The transverse stress S11 is large on the surface of the weld and is largely tensile. The longitudinal stress S33 is larger at the centre of the weld and is largely compressive.
- (3)
- The difference between FEM and experimental results (in terms of residual stress) is within 12.5%, demonstrating that the FE model is reliable.
- (4)
- The sequence of welding passes directly affects the distribution of welding residual stress. From welding sequence 1 to welding sequence 3, transverse stress S11 changed significantly, decreasing by 14% and 17% respectively.
- (5)
- In the welding process, the number of reversals should be increased as much as possible to reduce the welding residual stress.
Author Contributions
Funding
Acknowledgments
Conflicts of Interest
References
- Mohtadi-Bonab, M.A.; Szpunar, J.A.; Collins, L.; Stankievech, R. Evaluation of hydrogen induced cracking behavior of API X70 pipeline steel at different heat treatments. Int. J. Hydrogen Energy 2013, 39, 6076–6088. [Google Scholar] [CrossRef]
- Akhshik, S.; Behzad, M.; Rajabi, M. CFD-DEM approach to investigate the effect of drill pipe rotation on cuttings transport behavior. J. Pet. Sci. Eng. 2015, 127, 229–244. [Google Scholar] [CrossRef]
- Portelette, L.; Roux, J.; Robin, V.; Feulvarch, E. A gaussian surrogate model for residual stresses induced by orbital multi-pass tig welding. Comput. Struct. 2017, 183, 27–37. [Google Scholar] [CrossRef]
- Song, S.; Dong, P.; Pei, X. A full-feld residual stress estimation scheme for fitness-forservice assessment of pipe girth welds: Part I–identifcation of key parameters. Int. J. Press. Vessel. Pip. 2015, 126, 58–70. [Google Scholar] [CrossRef]
- Song, S.; Dong, P.; Pei, X. A full-feld residual stress estimation scheme for ftness-forservice assessment of pipe girth welds: Part II–a shell theory based implementation. Int. J. Press. Vesesl. Pip. 2015, 128, 8–17. [Google Scholar] [CrossRef]
- Bui, T.Q.; Vo, D.Q.; Zhang, C.; Nguyen, D.D. A consecutive-interpolation quadrilateral element (CQ4): Formulation and applications. Finite Elem. Anal. Des. 2014, 84, 14–31. [Google Scholar]
- Anca, A.; Cardona, A.; Risso, J.; Fachinotti, V. Finite element modeling of welding processes. Appl. Math. Model 2011, 35, 688–707. [Google Scholar] [CrossRef]
- Nguyen, M.N.; Bui, T.Q.; Truong, T.T.; Trinh, N.A.; Singh, I.V.; Yu, T.; Doan, D.H. Enhanced nodal gradient 3D consecutive-interpolation tetrahedral element (CTH4) for heat transfer analysis. Int. J. Heat Mass Transf. 2016, 103, 14–27. [Google Scholar] [CrossRef]
- Deng, D.; Liang, W.; Murakawa, H. Determination of welding deformation in filletwelded joint by means of numerical simulation and comparison with experimental measurements. J. Mater. Process. Technol. 2007, 183, 219–225. [Google Scholar] [CrossRef]
- Lee, C.H.; Chang, K.H. Three-dimensional finite element simulation of residual stresses in circumferential welds of steel pipe diameter effects. Mater. Sci. Eng. A 2008, 487, 210–218. [Google Scholar] [CrossRef]
- Deng, D. FEM prediction of welding residual stress and distortion in carbon steel considering phase transformation effects. Mater. Des. 2009, 30, 359–366. [Google Scholar] [CrossRef]
- Gannon, L.; Liu, Y.; Pegg, N.; Smith, M. Effect of welding sequence on residual stress and distortion in flat-bar stiffened plates. Mar. Struct. 2010, 23, 385–404. [Google Scholar] [CrossRef]
- Long, H.; Gery, D.; Carlier, A.; Maropoulos, P.G. Prediction of welding distortion in butt joint of thin plates. Mater. Des. 2009, 30, 4126–4135. [Google Scholar] [CrossRef]
- Wang, J. Welding Numerical Simulation Technology and Its Application; Shanghai Jiao Tong University Press: Shanghai, China, 2003; pp. 9–24. [Google Scholar]
- Marenić, E.; Skozrit, I.; Tonković, Z. On the calculation of stress intensity factors and J-integrals using the submodeling technique. J. Press. Vesesl Technol. 2010, 132, 41203–41212. [Google Scholar] [CrossRef]
- Perić, M.; Stamenković, D.; Milković, V. Comparison of residual stresses in buttwelded plates using software packages Abaqus and Ansys. Sci. Tech. Rev. 2010, 60, 22–26. [Google Scholar]
- Peric, M.; Tonkovic, Z.; Karšaj, I. Numerical analysis of residual stresses in welding process using a shell/3D modeling technique. In Proceedings of the International Conference on Advances in Welding Science and Technology for Construction, Energy and Transportation Systems (AWST-2010), Istanbul, Turkey, 15–16 July 2010. [Google Scholar]
- Attarha, M.J.; Sattari-Far, I. Study on welding temperature distribution in thin welded plates through experimental measurements and finite element simulation. J. Mater. Process. Technol. 2011, 211, 668–694. [Google Scholar] [CrossRef]
- Wang, S.; Goldak, J.; Zhou, J.; Tchernov, S.; Downey, D. Simulation on thermal cycle of a welding process by space-time convection-diffusion finite element analysis. Int. J. Therm. Sci. 2009, 48, 936–947. [Google Scholar] [CrossRef]
- Barsoum, Z.; Lundbäck, A. Simplified FE welding simulation of fillet welds–3D effects on formation residual stresses. Eng. Fail. Anal. 2009, 16, 2281–2289. [Google Scholar] [CrossRef]
- Teng, T.L.; Fung, C.P.; Chang, P.H.; Yang, W.C. Analysis of residual stresses and distortions in T-Joint fillet welds. Int. J. Press. Vessel. Pip. 2001, 78, 523–538. [Google Scholar] [CrossRef]
- ASME. Specification for Pressure Vessel Plates, Heat-Treated, Carbon-Manganese-Silicon Steel, for Moderate and Lower Temperature Service, section Ⅱ, division A, PART 2. In ASME Boiler and Pressure Vessel Code; American Society of Mechanical Engineers: New York, NY, USA, 2017. [Google Scholar]
- GB/T24179-2009, Metallic Materials-Residual Stress Determination-The Indentation Strain-gage Method, (2009). Available online: http://www.antpedia.com/standard/5903623.html (accessed on 30 July 2019).
- Tenga, T.L.; Linb, C. Effect of welding conditions on residual stresses due to buttwelds. Int. J. Press. Vessel. Pip. 1998, 75, 857–864. [Google Scholar] [CrossRef]
- Yaghi, A.H.; Hyde, T.H.; Becker, A.A.; Williams, J.A.; Sun, W. Residual stress simulation in welded sections of P91 pipes. J. Mater. Process. Technol. 2005, 167, 480–487. [Google Scholar] [CrossRef]
- Brickstad, B.; Josefson, B.L. A parametric study of residual stresses inmulti-pass but-welded stainless steel pipes. Int. J. Press. Vessel. Pip. 1998, 75, 11–25. [Google Scholar] [CrossRef]
- Goldak, J.; Chakravarti, A.; Bibby, M. A new finite element model for welding heat source. Metall. Trans. B 1984, 15, 299–305. [Google Scholar] [CrossRef]
- Dassault Systemes. ABAQUS Documentation, release 14; Dassault Systemes: Providence, RI, USA, 2006. [Google Scholar]
- Jiang, W.; Xu, X.; Gong, J.; Tu, S. Influence of repair length on residual stress in the repair weld of a clad plate. Nucl. Eng. Des. 2012, 246, 211–219. [Google Scholar] [CrossRef]
- Ueda, Y.; Murakawa, H. Applications of computer and numerical analysis techniques in welding research. Mater. Des. 1985, 6, 103–111. [Google Scholar] [CrossRef] [Green Version]
- Sun, J.; Liu, X.; Tong, Y.; Deng, D. A comparative study on welding temperature fields, residual stress distributions and deformations induced by laser beam welding and CO2 gas arc welding. Mater. Des. 2014, 63, 519–530. [Google Scholar] [CrossRef]


| C | Si | Mn | P | S | Cr | Ni | Mo | V | Cu | Al | Nb | |
|---|---|---|---|---|---|---|---|---|---|---|---|---|
| SA738GR.B | 0.11 | 0.3 | 1.44 | 0007 | 0.002 | 0.18 | 0.51 | 0.2 | 0.04 | 0.02 | 0.028 | 0.02 |
| E9018-G-H4 | 0.064 | 0.22 | 1.19 | 0.0084 | 0.0067 | 0.086 | 1.53 | 0.39 | / | 0.027 | /· | / |
| Weld Pass | Electric Current/A | Voltage/V | Welding Time/s | Weld Pass | Electric Current /A | Voltage/V | Welding Time/s |
|---|---|---|---|---|---|---|---|
| 1 | 179 | 28.3 | 406 | 15 | 179 | 28.3 | 315 |
| 2 | 179 | 29.2 | 306 | 16 | 180 | 28.5 | 398 |
| 3 | 179 | 28.7 | 180 | 17 | 179 | 28.7 | 330 |
| 4 | 179 | 28.2 | 313 | 18 | 179 | 27.5 | 371 |
| 5 | 179 | 28.5 | 274 | 19 | 179 | 29.2 | 320 |
| 6 | 179 | 29.3 | 334 | 20 | 179 | 28.4 | 374 |
| 7 | 180 | 30.3 | 358 | 21 | 179 | 28.2 | 339 |
| 8 | 179 | 29.1 | 393 | 22 | 180 | 28.8 | 373 |
| 9 | 179 | 28.2 | 329 | 23 | 179 | 28.5 | 373 |
| 10 | 179 | 27.3 | 371 | 23 | 179 | 27.6 | 381 |
| 11 | 179 | 27.4 | 372 | 25 | 180 | 27.3 | 317 |
| 12 | 179 | 26.9 | 241 | 26 | 179 | 27.5 | 314 |
| 13 | 180 | 27.5 | 193 | 27 | 179 | 29.1 | 316 |
| 14 | 179 | 28.2 | 270 |
| TC1 | TC2 | TC3 | TC4 | TC5 | |||||||||
|---|---|---|---|---|---|---|---|---|---|---|---|---|---|
| Weld pass | 1 | 2 | 3 | 4 | 8 | 9 | 10 | 11 | 16 | 17 | 18 | 20 | 21 |
| EXP (°C) | 145 | 163 | 186 | 193 | 150 | 239 | 170 | 258 | 262 | 157 | 252 | 242 | 187 |
| FEM (°C) | 143 | 160 | 183 | 197 | 147 | 234 | 173 | 261 | 267 | 163 | 257 | 235 | 178 |
© 2019 by the authors. Licensee MDPI, Basel, Switzerland. This article is an open access article distributed under the terms and conditions of the Creative Commons Attribution (CC BY) license (http://creativecommons.org/licenses/by/4.0/).
Share and Cite
Yang, X.; Yan, G.; Xiu, Y.; Yang, Z.; Wang, G.; Liu, W.; Li, S.; Jiang, W. Welding Temperature Distribution and Residual Stresses in Thick Welded Plates of SA738Gr.B Through Experimental Measurements and Finite Element Analysis. Materials 2019, 12, 2436. https://doi.org/10.3390/ma12152436
Yang X, Yan G, Xiu Y, Yang Z, Wang G, Liu W, Li S, Jiang W. Welding Temperature Distribution and Residual Stresses in Thick Welded Plates of SA738Gr.B Through Experimental Measurements and Finite Element Analysis. Materials. 2019; 12(15):2436. https://doi.org/10.3390/ma12152436
Chicago/Turabian StyleYang, Xiaoyu, Guizhen Yan, Yanfei Xiu, Zhongwei Yang, Gang Wang, Wei Liu, Shaohua Li, and Wenchun Jiang. 2019. "Welding Temperature Distribution and Residual Stresses in Thick Welded Plates of SA738Gr.B Through Experimental Measurements and Finite Element Analysis" Materials 12, no. 15: 2436. https://doi.org/10.3390/ma12152436