Microwave-Leaching of Copper Smelting Dust for Cu and Zn Extraction
by
 ,
,
Behrouz Sabzezari
1, 
Seyed Mohammad Javad Koleini
1,*,
Sina Ghassa
2,*,
Behzad Shahbazi
1 and
Saeed Chehreh Chelgani
3,*
1
Department of Mining Engineering, Tarbiat Modares University, Tehran 14115-11, Iran
2
School of Mining, College of Engineering, University of Tehran, Tehran 16846-13114, Iran
3
Minerals and Metallurgical Engineering, Dept. of Civil, Environmental and Natural Resources Engineering, Luleå University of Technology, SE-971 87 Luleå, Sweden
*
Authors to whom correspondence should be addressed.
Materials 2019, 12(11), 1822; https://doi.org/10.3390/ma12111822
Submission received: 20 May 2019
/
Revised: 2 June 2019
/
Accepted: 3 June 2019
/
Published: 5 June 2019
(This article belongs to the Special Issue Mineral Processing for Advanced Material Applications)
Abstract
:Industrial wastes may contain high concentrations of valuable metals. Extraction and recovery of these metals have several economic and environmental advantages. Various studies showed positive effects of microwaves as a pretreatment method before the leaching of minerals. However, there are empty rooms for exploring simultaneous microwave and leaching (microwave-leaching) of industrial waste material for the production of valuable metals. This investigation examined the microwave-leaching method to extract copper and zinc from a copper-smelter dust (CSD). The results of microwave-leaching mechanism were compared with conventional heating leaching based on kinetics modelling. The final Cu recovery in the conventional heating and microwave irradiation was 80.88% and 69.83%, respectively. Kinetic studies indicated that the leaching reactions follow diffusion across the product layer. Based on X-ray powder diffraction (XRD) analyses, during conventional experiments sulfate; components formed with high intensity as an ash layer which prevents reagent access to the solid surface and decreases the Cu dissolution. While the sulfate components did not detect in the microwave-leaching residuals which means that microwave irradiation helped to decrease the ash layer formation. Taking all mentioned results into consider it can be concluded that microwave-leaching can be considered as an efficient method for extraction of valuable metals from waste materials.
1. Introduction
By decreasing the primary metals resources (ores) and increasing costs of the metals production from minerals, recovery of metals from secondary resources has become a necessity. Secondary metals resources are divided into two main groups: urban and industrial wastes. Extraction of metals from urban wastes include; printed circuit boards [1], batteries [2], magnets [3], liquid crystal displays (LCDs) [4] and etc., was studied in several investigations. Although urban wastes may contain high concentrations of different metals, their extractions can typically be difficult due to their complexity in the collection and sorting. On the other hand, the huge amount of industrial wastes such as slags, catalyst, fly ash, melting dusts and mine tails [5] were produced daily which can be used as an important source for metals production.
Pyrometallurgical production of copper from mineral concentrates usually contains four steps: melting, converting, refining and electrorefining. A huge amount of dust has been produced during the melting stage as a result of the gas cleaning process [6]. This industrial waste typically contains high concentrations of copper, zinc, lead, iron, arsenic, cadmium and silicon. In one hand, reproduction of these metals can have economic benefits and on the other hand save the environment. Due to high metals concentration and sample complexity, hydrometallurgical methods suggested for recovery of metals from these industrial wastes [7,8,9].
As an electromagnetic wave with 0.3 to 300 GHz frequency, the microwave has numerous applications in industries and daily life. These special waves are using extensively in communication, navigation, radar astronomy, spectroscopy, and heating. Since various studies demonstrated that the temperature is an influential parameter in leaching [10,11,12], microwave can be used to provide required heat for leaching. Microwave can increase the temperature of materials in the noncontact system in a short time. The microwave energy adsorption is depended on dielectric constant and dielectric loss factor [13]. Therefore, different materials may have a different temperature in microwave heating, unlike convection heating [14].
Various investigations indicated the positive effect of microwaves as a pretreatment technique on leaching kinetics of minerals [15,16] and wastes [17,18]. This method also was used for metals extraction from CSD in few studies. For instance, Xia and Picklesi (2000) investigated the effect of influence parameters on metals extraction from electric arc furnace dust, using microwave energy. [19]. In other study, Turan et al. invested the microwave leaching behavior of blended slag (mixture of converter and flash furnace slag) in presence of H2O2 and CH3COOH as oxidation agents. They showed that a mixture of CH3COOH (concentration 4 mol/L) and H2O2 (concentration 4 mol/L) increase the copper recovery to its maximum (95%).
However, the leaching mechanism under microwave irradiation (microwave-leaching) is vague and the topic of controversy between researchers. For instance, Wen et al. (2017) reported that activation energy of chalcopyrite leaching is affected significantly by microwave heating compared to the conventional heating [14]. They showed that boiling point increase in microwave system which leads to an increase in interfacial reaction temperature and Cu recovery from chalcopyrite. On the other hand, it was reported that extraction of metals increases in microwave-leaching due to the high heating energy which is produced during microwave irradiation. Based on this hypothesis, the microwave heating rate is significantly higher than conventional heating which significantly increases the leaching kinetics [20,21]. Therefore, there is a high potential to use this technique (microwave-leaching) for extraction of metals from industrial wastes.
The main aim of this investigation is to examine microwave-leaching method to recover valuable metals (copper and zinc) from a copper smelter dust. The effect of different parameters (H2SO4 concentration, solid content, oxidant concentration, microwave power and leaching time) and their interactions were studied by using central composite design (CCD) to find an optimum condition. For comparison purposes, the microwave-leaching mechanism was investigated and compared with conventional heating leaching at optimum conditions based on kinetics modelling.
2. Materials and methods
2.1. Sample Preparation and Characterization
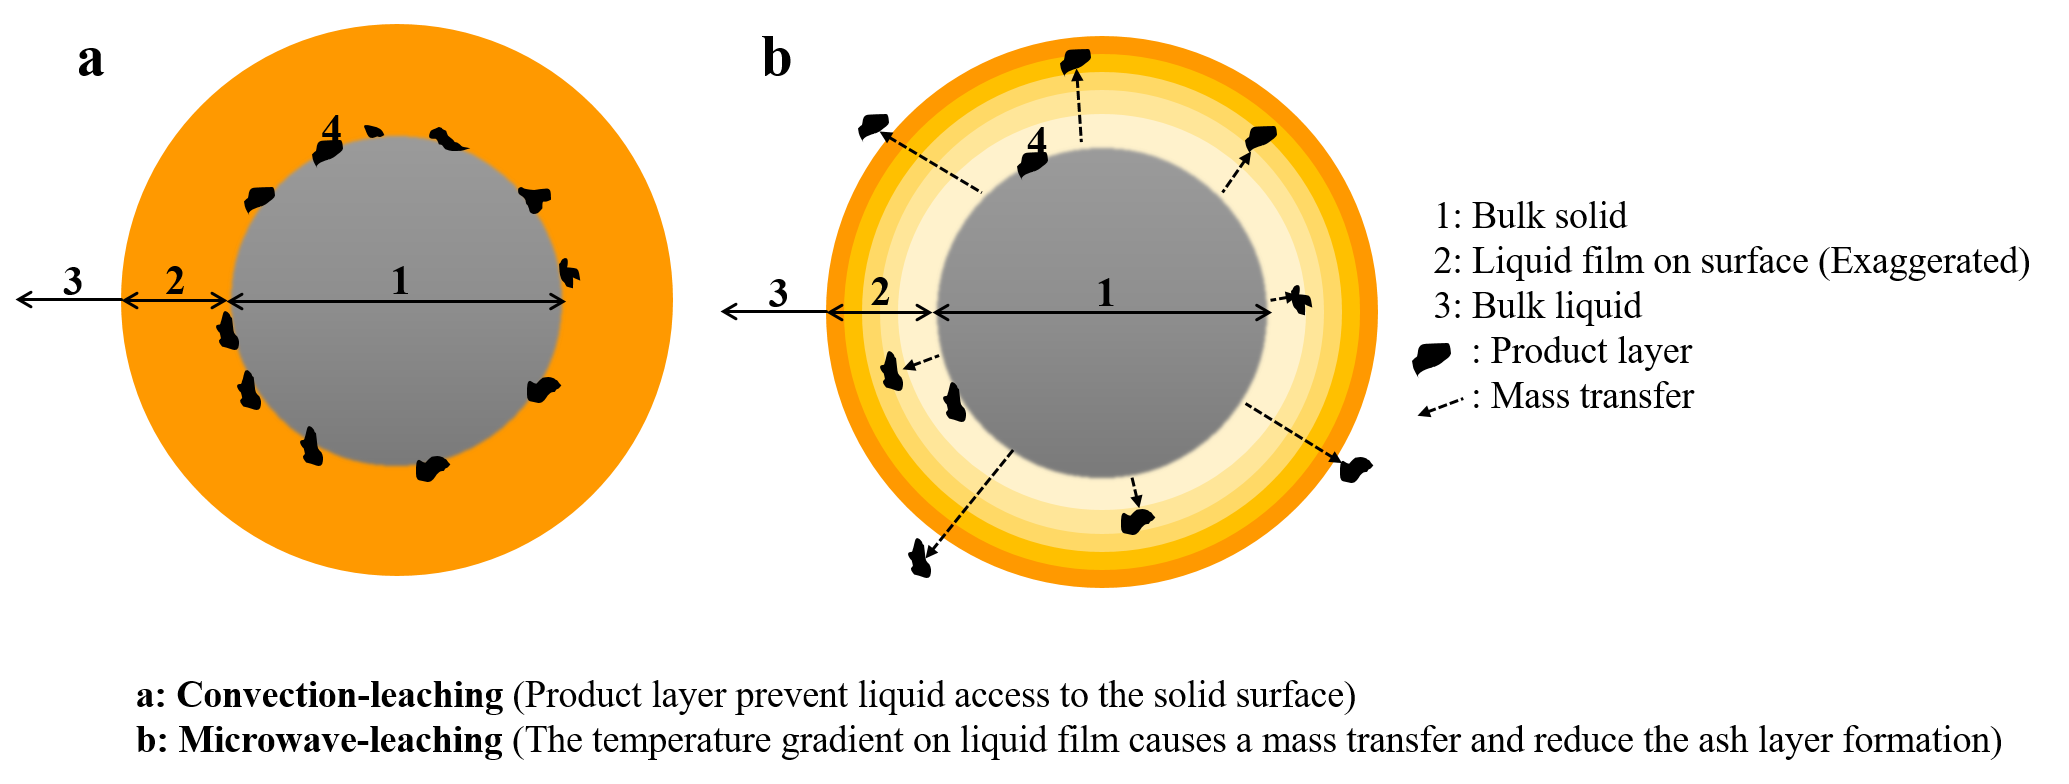
To provide a representative sample, 50-kg copper smelting dust (CSD) was collected during several weeks from a copper smelting plant in Tehran, Iran. To make the sample dry (the CSD contained 0.28% moisture), it was heated for 24 h at 100 °C. The size distribution analysis indicated that the d80 of the sample is 150 μm (Figure 1).
X-ray powder diffraction (XRD, D8-Advance, Bruker axs, USA) analyses (Figure 2) showed that the source of copper in the samples are chalcocite (Cu2S), cuprite (Cu2O) and native copper (Cu). The CSD also contained zincite (ZnO) and anglesite (PbSO4).
0.5g CSD was digested in hot HNO3 in a sand bath and analyzed with an atomic absorption spectrometer (Varian-AA240, Australia). The copper and zinc concentrations were 65.52% and 4.15%, respectively (the mean of 6 times analysis). Other metals concentrations were analyzed with X-ray fluorescence (XRF, TX2000, GNR, Italy) and atomic absorption spectrometer (ASS) (Table 1).
2.2. Reactor
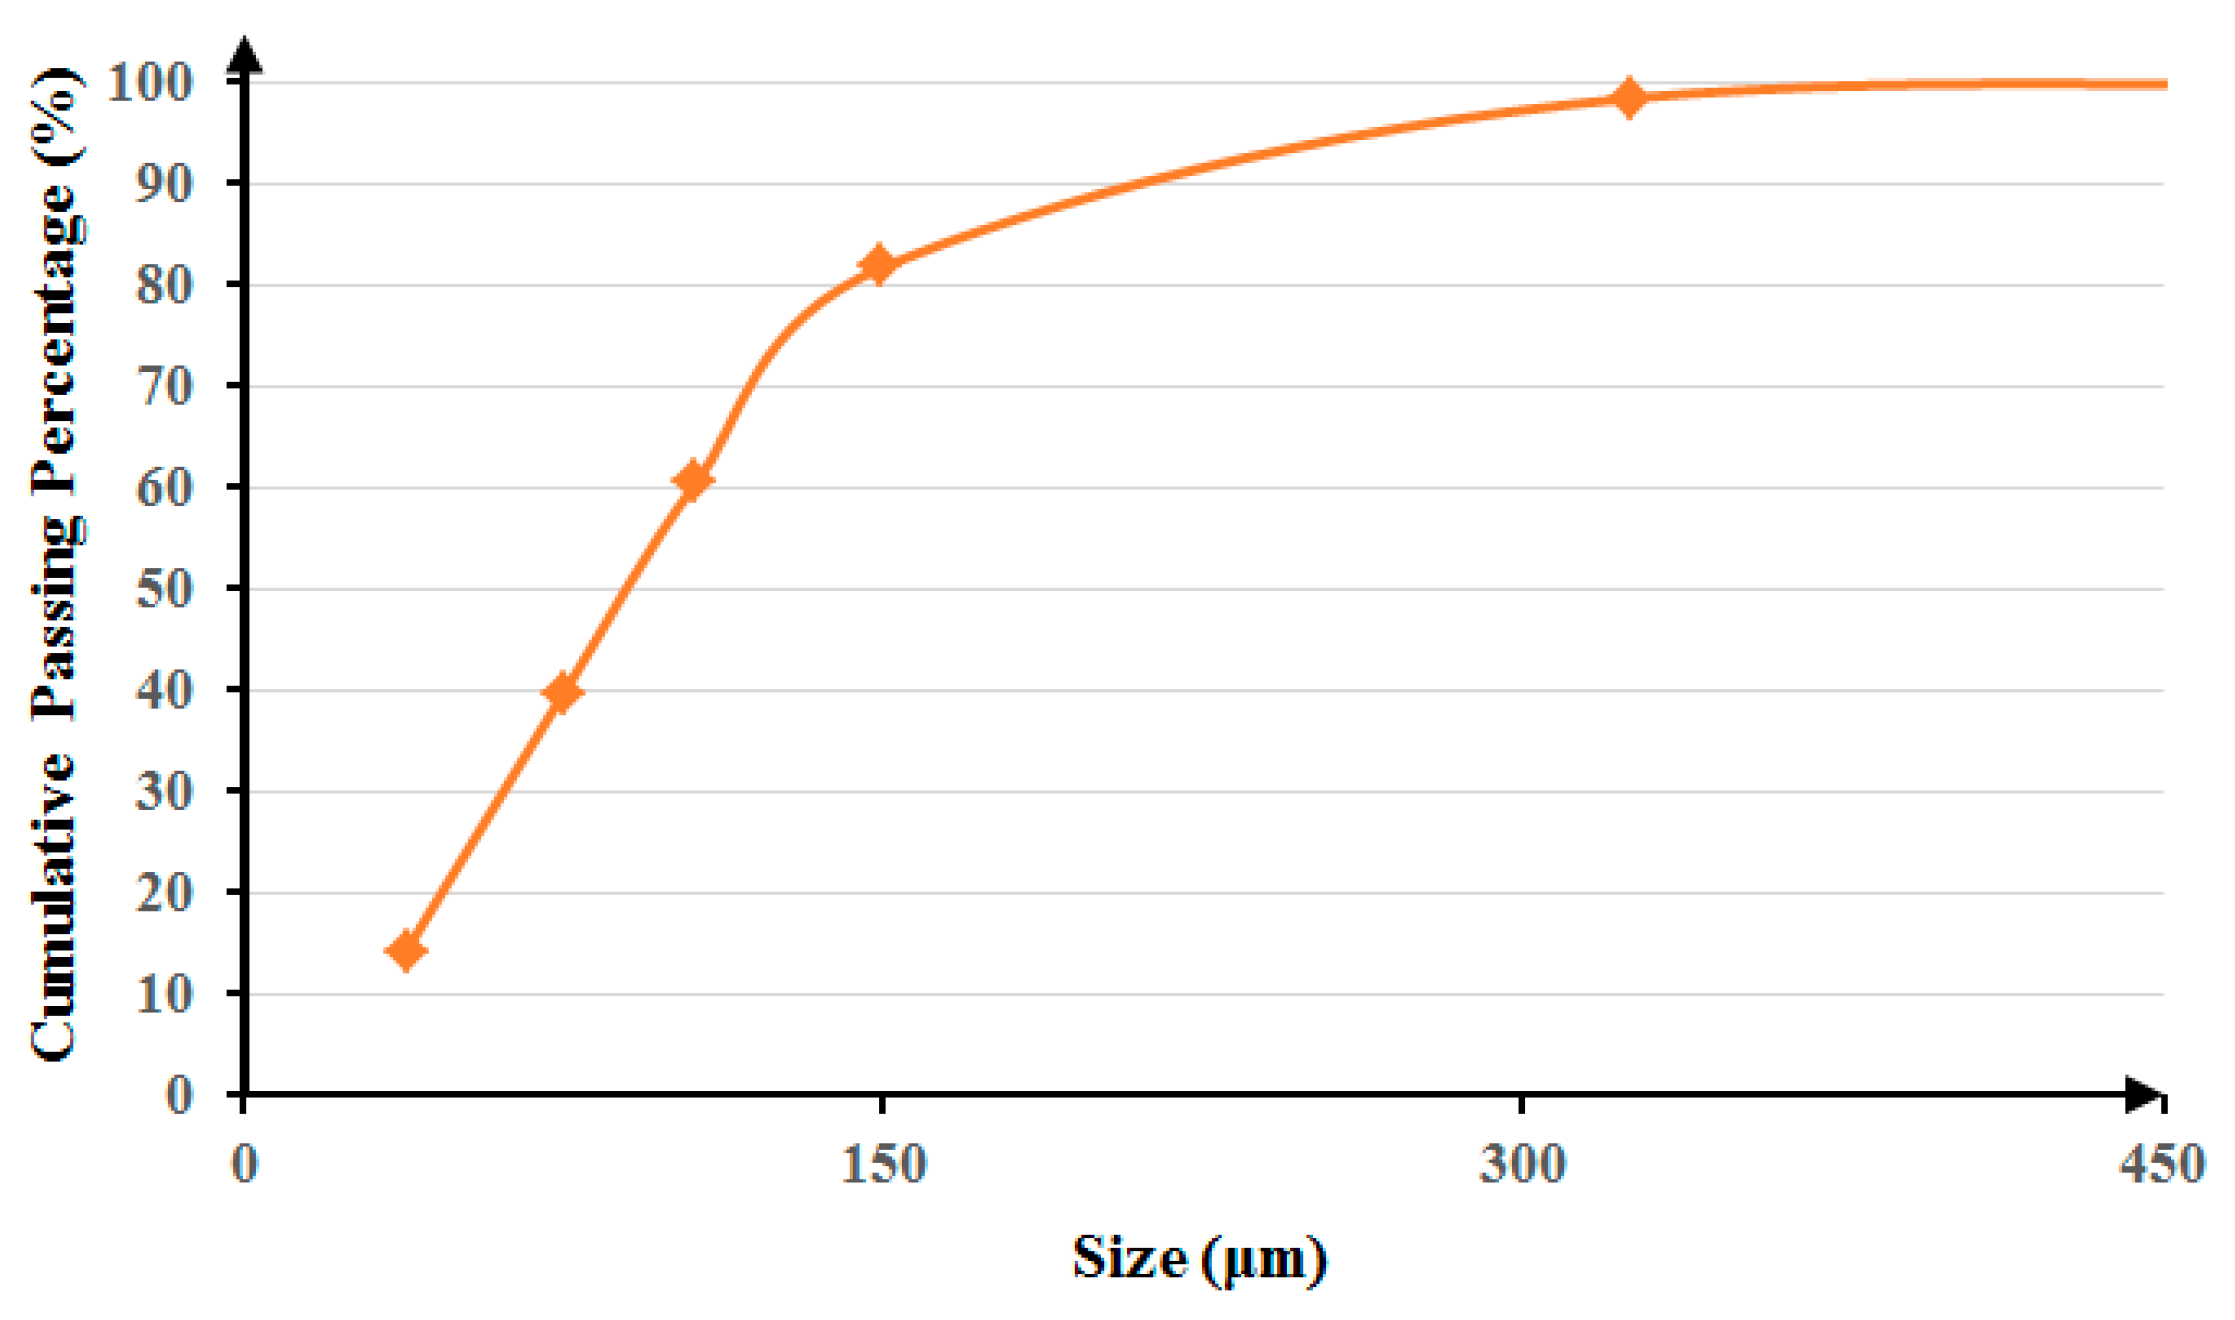
The microwave was radiated during the leaching process. A reactor heart (a Teflon cylinder with 8 cm inside diameter and 11 cm height) was located inside a SAMSUNG-ME6194ST microwave (Klang, Malesia) with power control (from 100 to 1000 W). The microwave capacity was 54 L with a triple wave distribution system. The Teflon was selected because this material has no wave adsorption and waves transfer without any drop. The cylinder had a completely sealed cap to avoid evaporation, with three holes for sampling, entering mixer (Rhymebus, Taiwan) and reflux condenser. Two holes also made on top of the microwave for entering mixer and condenser (Figure 3).
2.3. Leaching Procedure
2.3.1. Oxidant Presentation
The sulfide minerals (such as chalcocite) have a very low solubility on sulfuric acid. Thus, it would be essential to use an oxidant for increasing recovery of metals. Nitric acid (HNO3) was selected as an oxidizing agent for the CSD dissolution. To clarify the effect of oxidation agent, two tests without any oxidant were performed at 150 and 300 g/L sulfuric acid concertation and results compared with two tests with 10 and 30 g/L HNO3. All tests were performed in 5% pulp density, 300 rpm agitation rate, 300 mL leaching reagent with 150 g/L H2SO4 and 1000 W microwave power. Processing time was set on 30 min for all tests. The Cu and Zn recoveries were calculated by analyzing Cu content in the pregnant leach solution (PLS) after each test.
2.3.2. Leaching Experiments
Response surface methodology (RSM) and central composite design (CCD) were employed to study the effect of leaching parameters (acid concentration, pulp density, oxidant concentration, microwave power and leaching time) on copper and zinc dissolution. RSM is a statistical experimental design method for process modelling and optimization. The effect of each parameter and their interaction can be determined by RSM with minimum number of experiments [22]. The results of experiments are achieved from CCD can be described according to the following equation [23]:
where Y is the response, b0 is constant coefficient, and bi, bj, and bij are linear, quadratic and interaction coefficients. Xi and Xj are the coded value of independent parameters. XiXj and Xi2 show the interaction and quadratic terms. Analysis of variance (ANOVA) can be used to validate a mathematical model based on null-hypothesis. The higher F-value and lower p-value (indexes which are calculated based on Fisher test) indicate more significant model. In general, 32 microwave-leaching experiments were designed. The investigated parameters and their levels were listed in Table 2.
CCD was developed by Box and Wilson in the 1950s [24] and used extensively for chemical process optimization in recent decades [25,26]. This experiment design consists three following parts: (1) a full factorial design, (2) a star design in which experimental points are at α distance from its center and (3) center point [27]. This means that CCD can investigate the effect of parameters in 5 levels. Typically, the center point is repeated several times to predict the errors and experiment repeatability. The center point test (acid concentration = 150 g/L, pulp density = 15%, oxidant concentration = 20 g/L, microwave power = 600 W and leaching time = 10.5 min) was repeated 6 times to determine the experiments repeatability. The recovery of copper and zinc extraction were selected as responses.
2.3.3. Kinetics Study
Kinetics modelling is a strong tool to clarify the leaching mechanism. Generally, the leaching process contains two main steps in series: (1) the escape of solute molecules from the solid surface, (2) the diffusion of these molecules toward the bulk liquid phase [11]. In other words, the leaching process is controlled by chemical or diffusion parameters or combinations of these two mechanisms. Different kinetics models have been developed based on this idea. The kinetics models which are common for description of leaching mechanism have been listed in Table 3.
Thus, kinetics study was performed to determine the leaching mechanisms in presence and absence of microwave radiation. The microwave-leaching kinetics test carried out at the optimum conditions based on leaching experiment results. Process followed for 10 min and 7 samples withdrawn from the reactor at different intervals. Furthermore, the kinetics tests examined for non-microwave-leaching tests at 90 °C, to explore the leaching mechanism in the absence of microwave. For these tests, a Teflon reactor located in a water-bath (N-Biotek) to control the temperature. All other conditions for these two kinetic tests were completely the same. Different kinetics models (Table 3) have been fitted to the provided data to identify the leaching mechanism.
3. Results and Discussion
3.1. Oxidant Presentation
Oxidizing agents can be added directly to the leaching reactor. To show the effect of oxidizing agent on Cu extraction, four pre-tests were carried out (Table 4). The copper recovery in tests without oxidizing agent is negligible. Increasing the sulfuric acid concertation from 150 to 300 (g/L) slightly improves the Cu recovery. On the other hand, addition of nitric acid significantly increases the Cu recovery. Increasing the nitric acid concertation shows an improvement in the Cu dissolution. Therefore, the HNO3 concentration should be investigated as one of the effective parameters on the leaching process.
3.2. Process Optimization
For the process optimization, the effect of five parameters (H2SO4 concertation, solid content, microwave power, oxidizing agent concertation and process time) and their interactions have been investigated by using CCD of RSM. Responses of various microwave-leaching conditions based on CCD have been shown in Table 5.
3.2.1. Copper Extraction
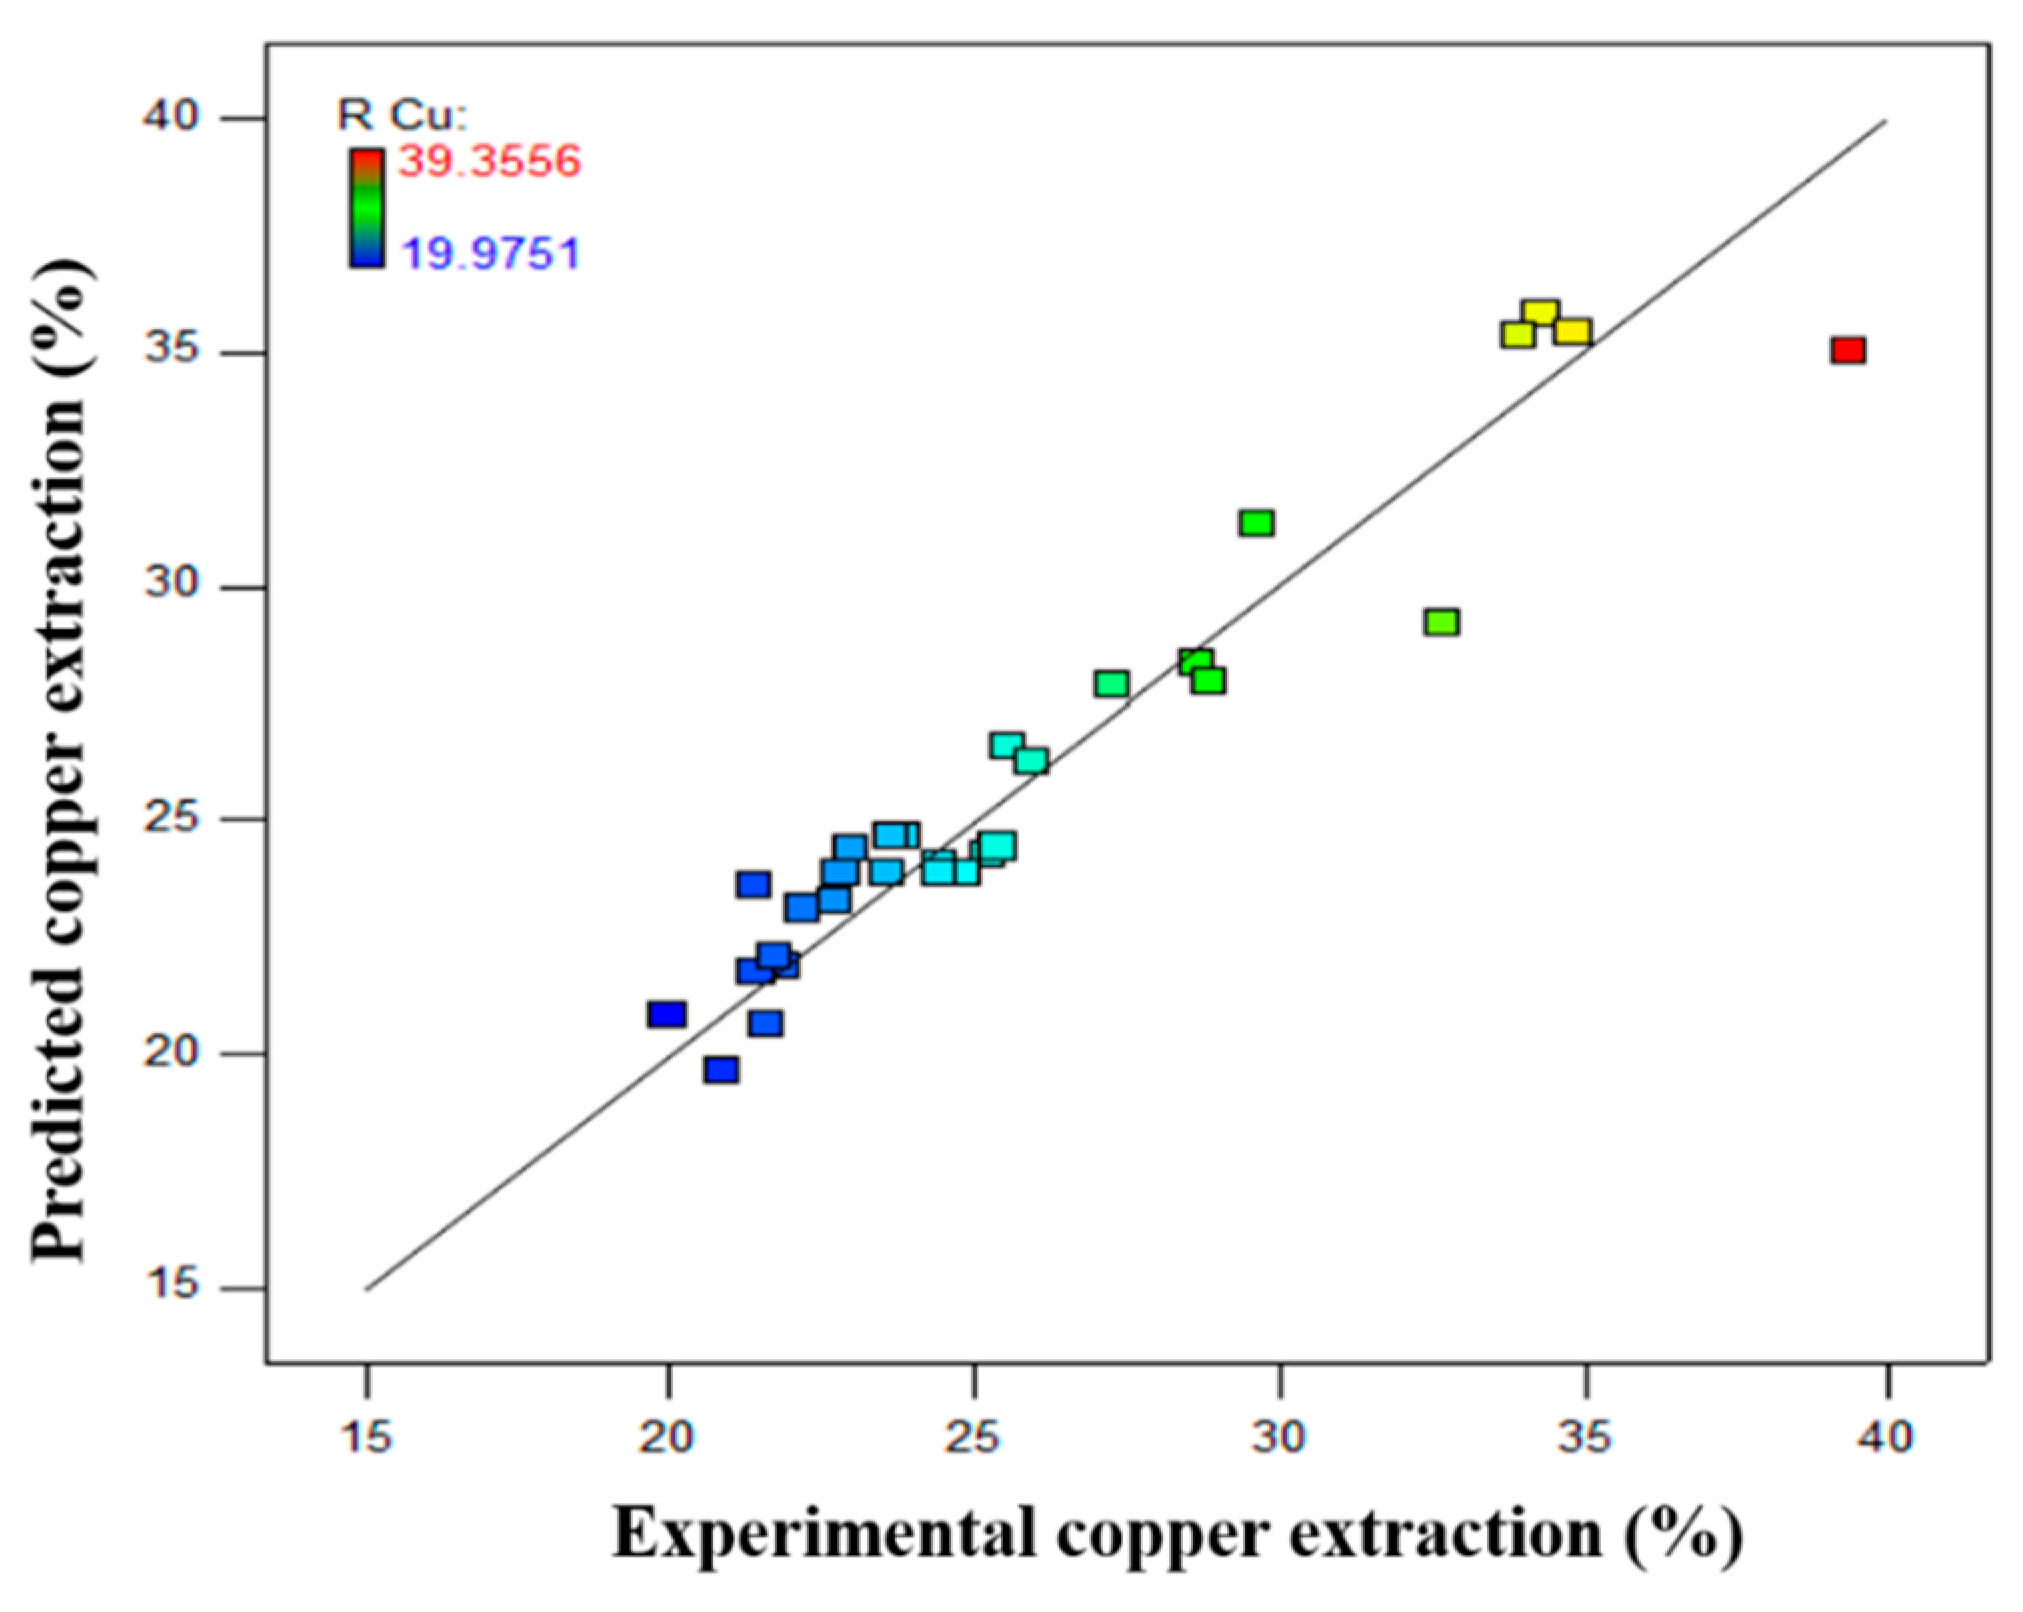
The copper recovery rate in function of five mentioned parameters have been modeled and expressed in Equation (2). The variance analysis (ANOVA) carried out to determine the model accuracy (Table 6). ANOVA is a statistical tool to specify the significance of data based on Fisher ratio of variances [26,36] by calculation of F and p values [37]. The F-value should be maximized and p-value should be minimized to achieve a significant statistical model. The suggested model (Equation (2)) is completely significant with high F-value (26.15) and low p-value (less than 0.0001) which means that there is only 0.01% chance that model responses occur due to the noise [38]. The model coefficient of determination (R2) is 0.9150 which shows well agreement between predicted and actual data. Adequate precision shows a signal-to-noise ratio of 18.784.
The predicted data generated from Equation (2) versus the data achieved from experiments (actual data) have been shown in Figure 4. The accuracy of the correlation between predicted and actual data confirms due to the position of the points on both sides of the 45° line [39]. As mentioned, the center point test repeated six times to calculate the error and determined the tests repeatability. The calculated pure error was 9.987 × 10⁻⁶ which shows a negligible error in the experiments. Lack of fit is an index to compare the residual and pure error from the replicated design points. The higher level of the p-value for lack of fit indicates higher tests repeatability and should be not-significate (higher than 0.005). The lack of fit for the suggested model (Equation (2)) is 0.1324 which is “not-significant”. Therefore, experiments have a high repeatability rate.
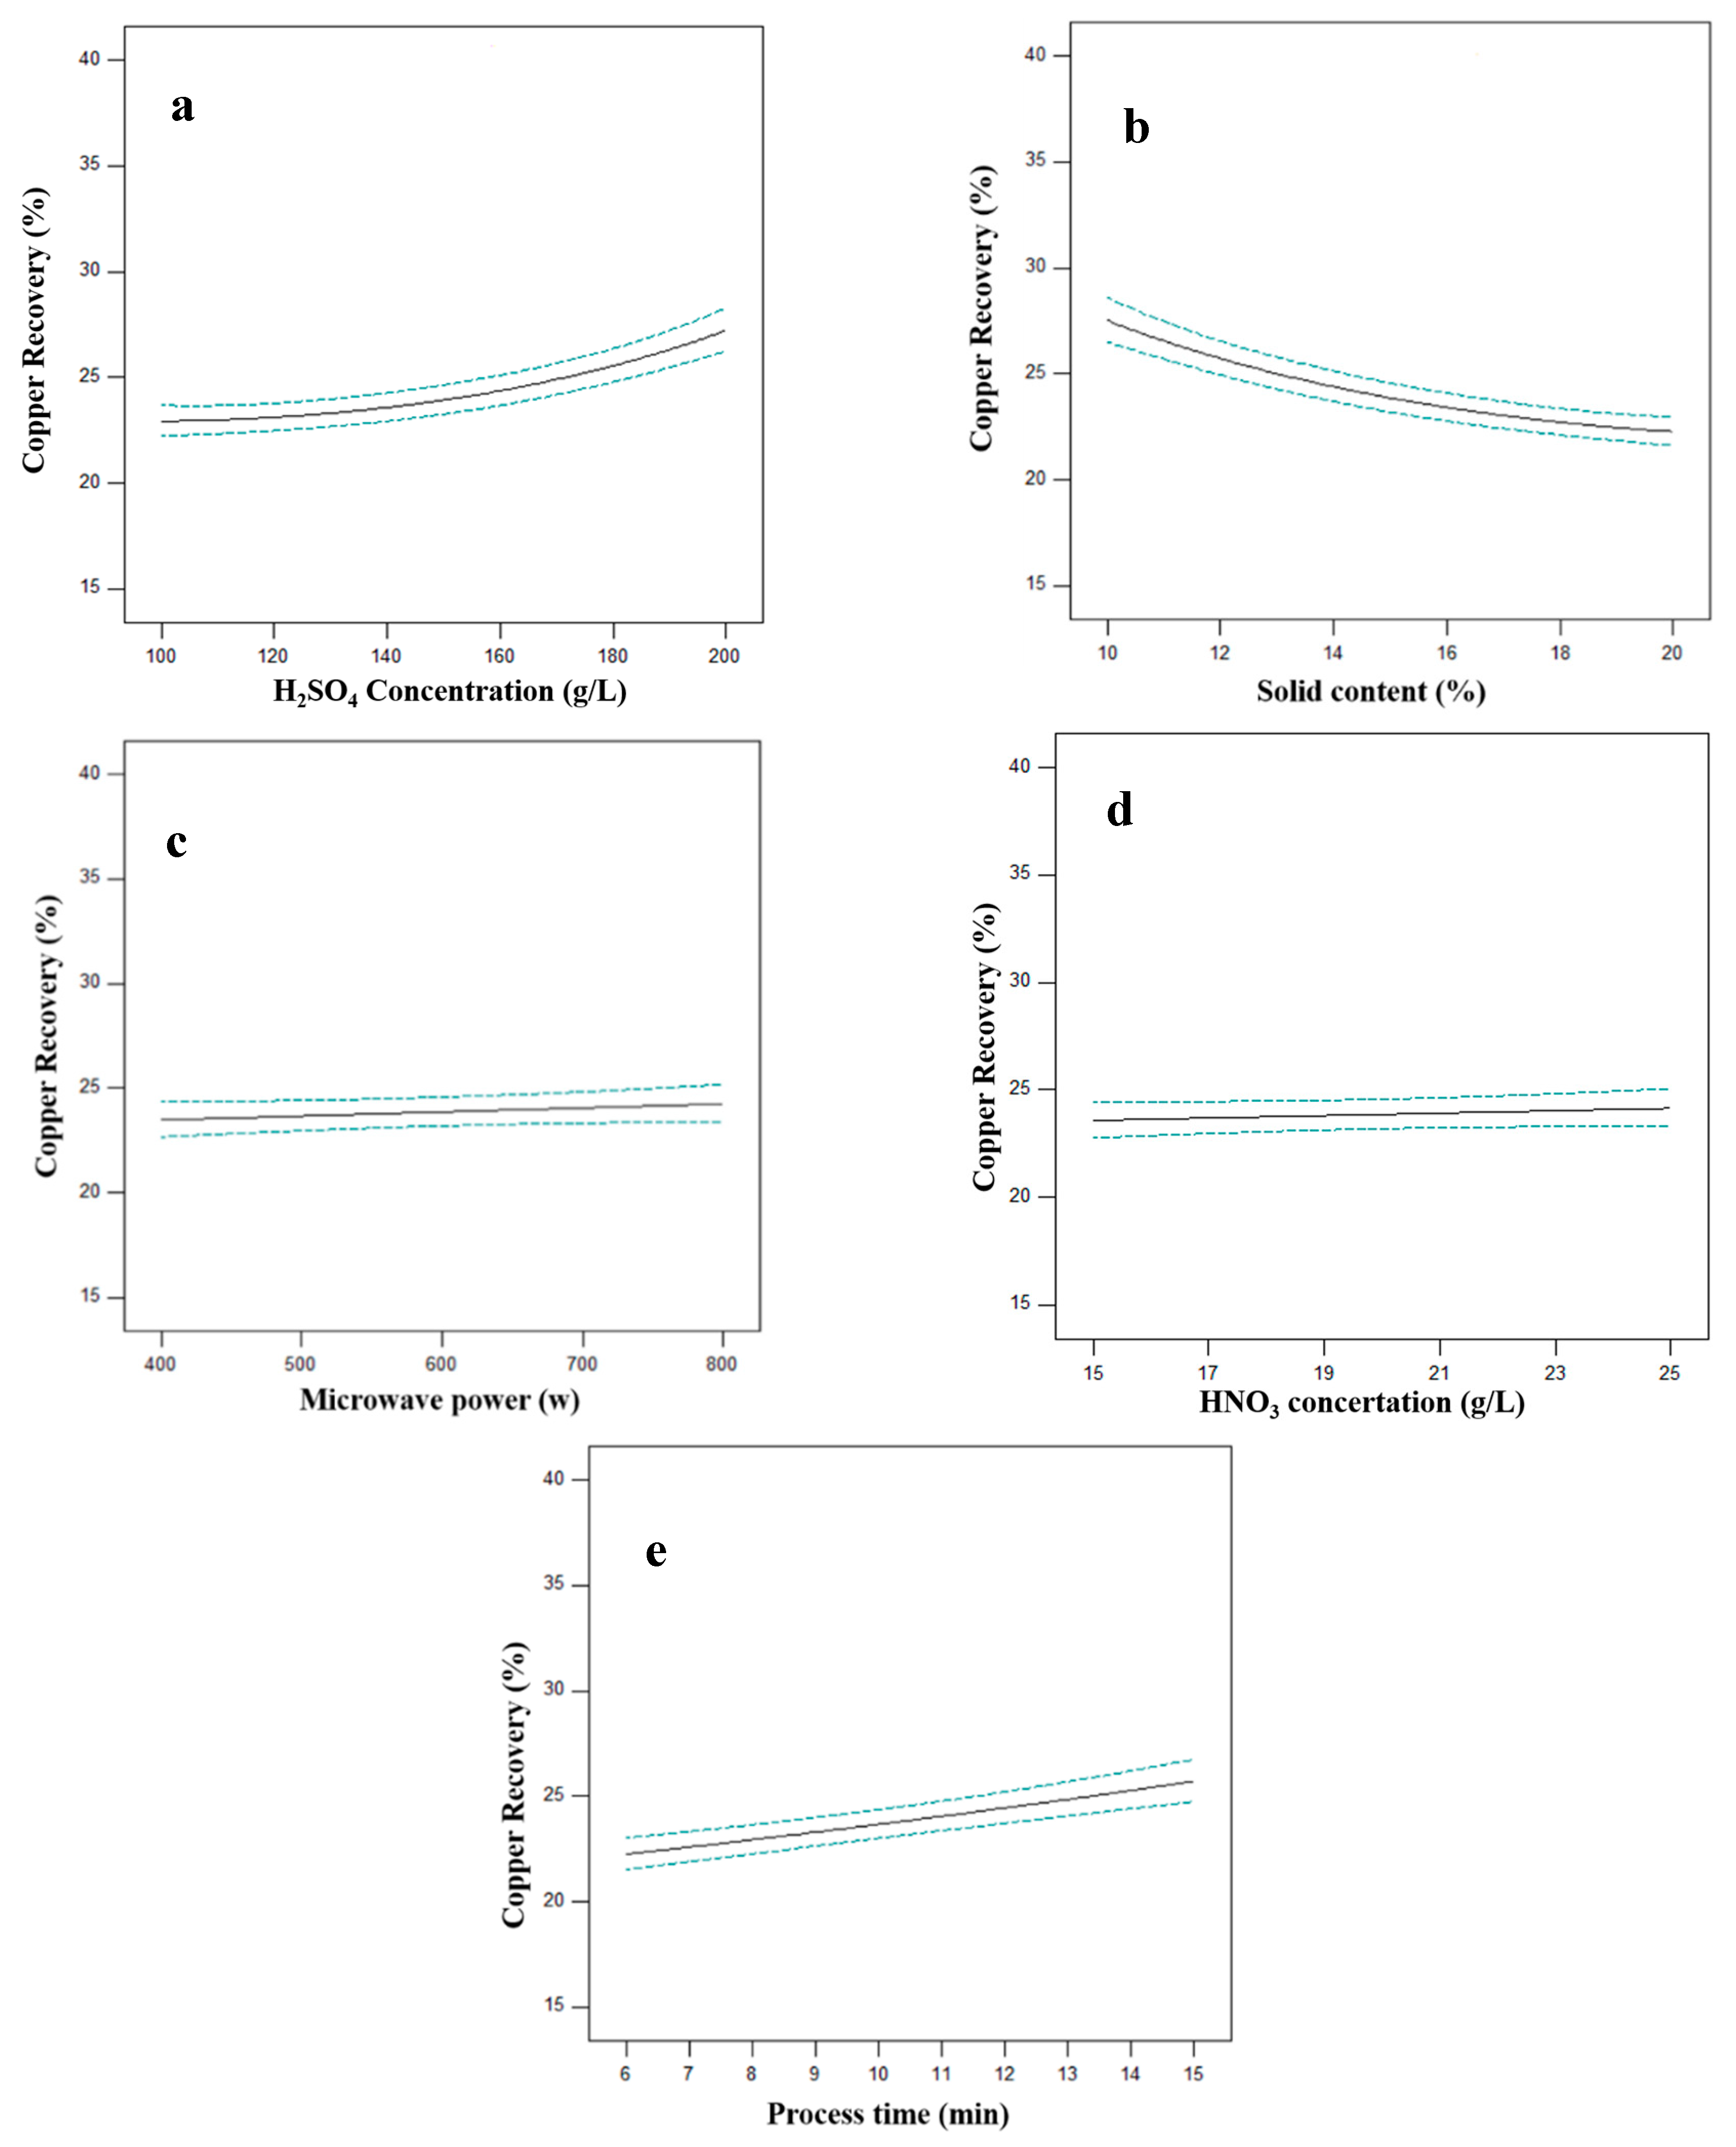
The effects of parameters on copper recovery were depicted in Figure 5. In this diagram, a parameter changed while all other parameters held at their center levels. In general, the effect of each parameter can increase by increasing in diagram slope. According to Figure 5c,d, microwave power and oxidizing agent concentration have a negligible effect on copper recovery, at the selected interval. This means that by increasing in these parameters the energy and chemicals consumption will increase without any significant improvement in the extraction of Cu from CSD. On the other hand, sulfuric acid concertation, solid content and processing time have a meaningful influence on copper dissolution. The acid concertation and leaching time have a direct effect on process efficiency which means their increase can improve the Cu recovery (Figure 5a,e). While increasing solid content, the copper recovery shows a decrease (Figure 5b). In fact, by increasing the pulp density (in constant leaching reagent concentration) the acid diffusion to particles surface will decrease which cause a decline in metals dissolution.
The ANOVA also can be used to determine the importance of parameters. The parameters with higher F-value and lower p-value have a more significant effect on a model [40]. With a p-value lower than 0.0001, acid sulfuric concentration, solid content and process time have a more significant effect on copper recovery.
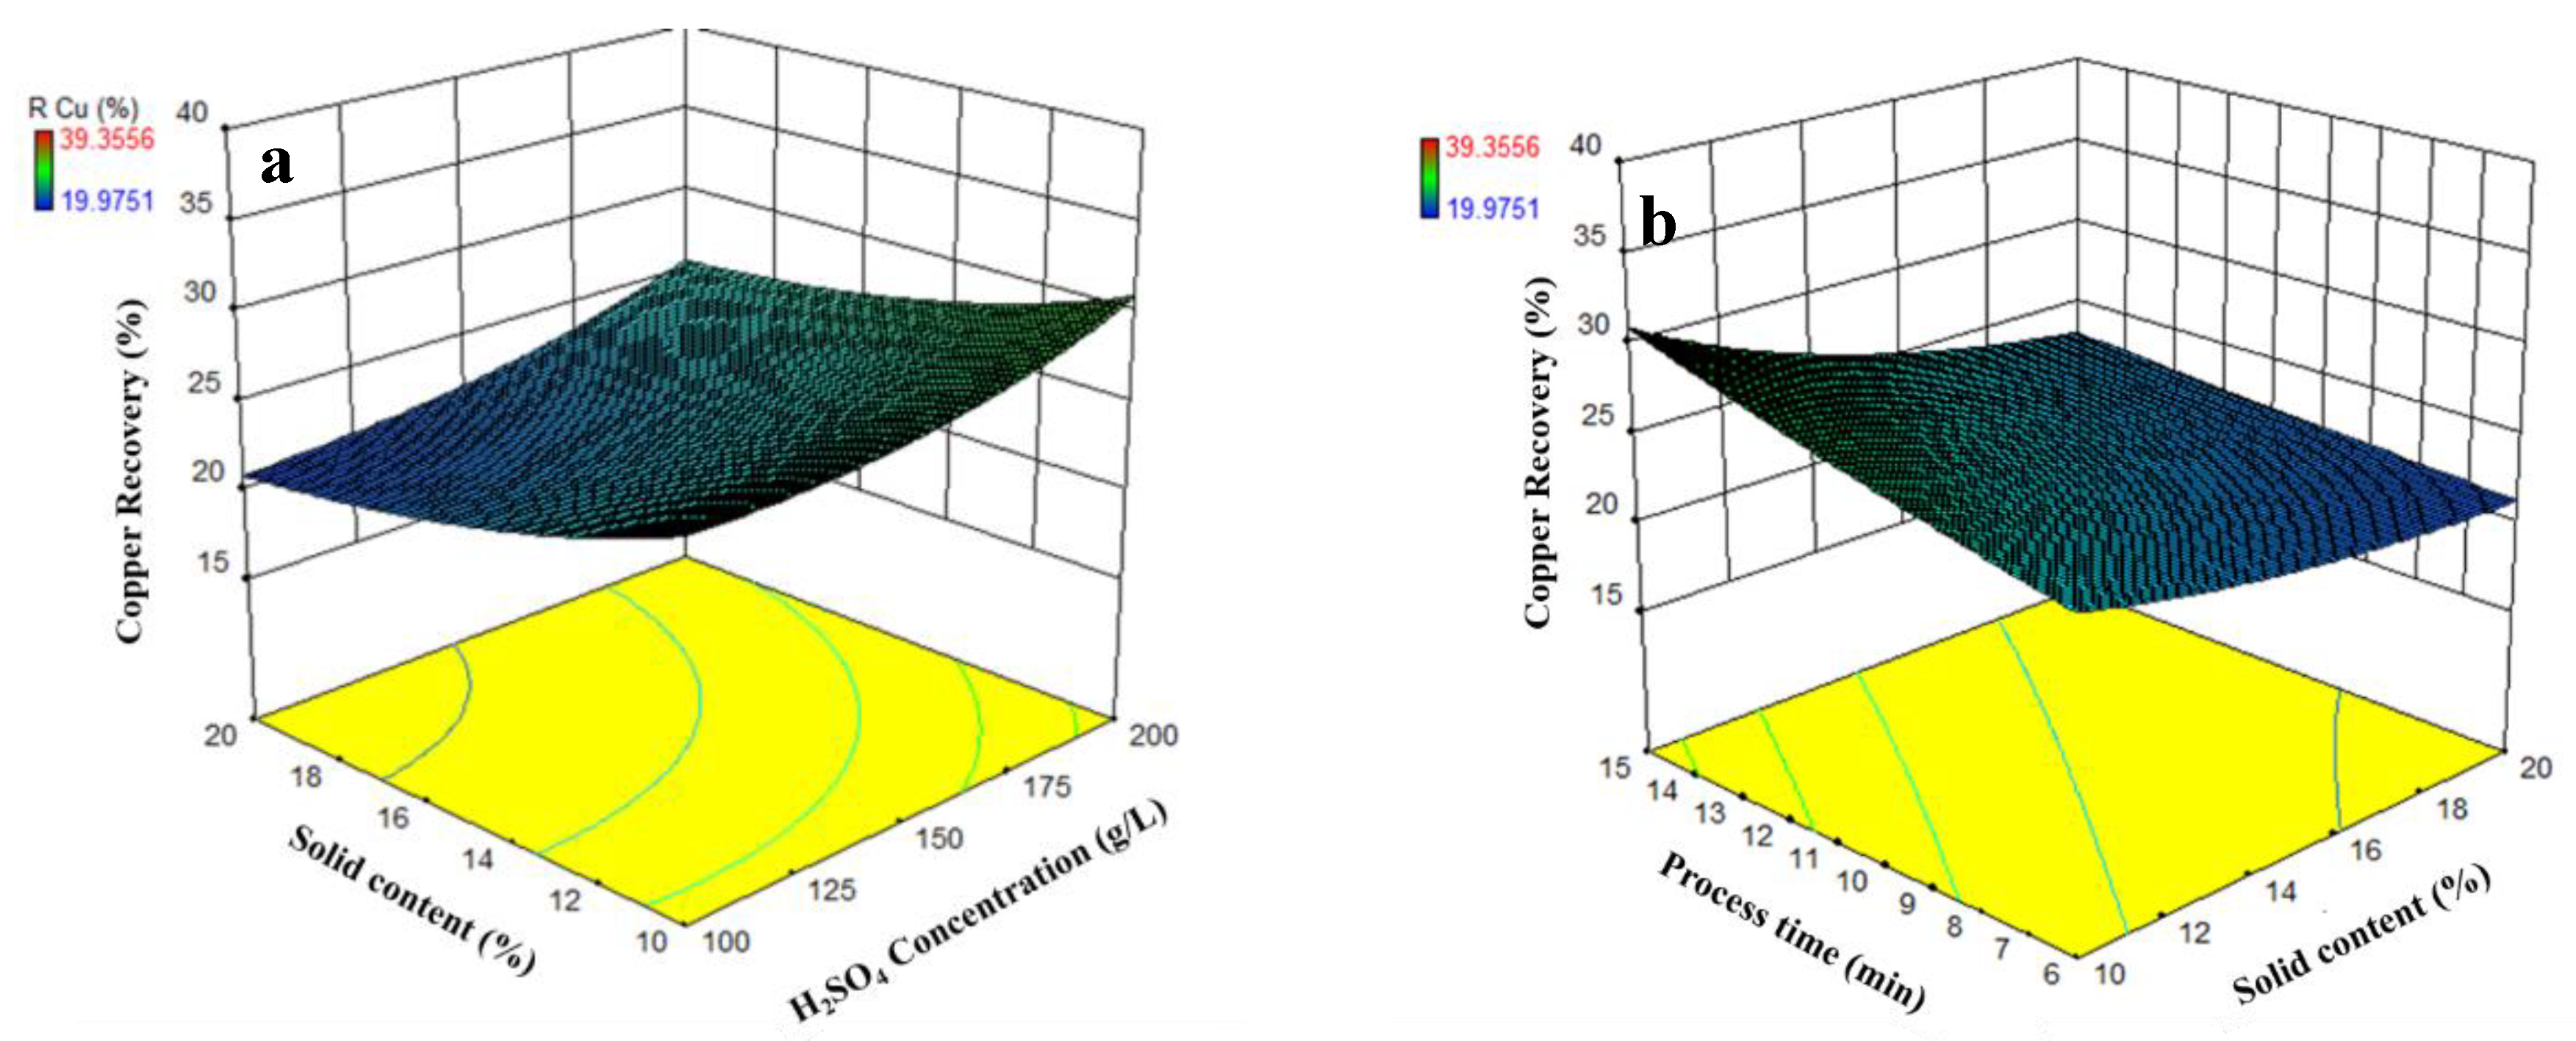
According to Equation (2) and Table 6, there are sulfuric acid concentration-solid content and solid content-process time interactions. The interactions between parameters are shown in Figure 6. These results indicate that increasing the H2SO4 concentration and decreasing solid content simultaneously lead to a higher copper recovery. In addition, the highest Cu recovery occurs by increasing the leaching time and decreasing solid content. During the leaching process, the chemical reagent should diffuse to the particles surface and react to dissolve the metals. This means that metals recovery is dependent on reagent concentration and particles surface (which is a function of solid content) [41]. By increasing the H2SO4 concentration and decreasing copper smelting dust in leaching environment a higher amount of acid can diffuse to the unit of CSD surface, which improve the leaching efficiency. This reason also can be used to explain the interaction of time and solid content. The specific surface area will increase by increasing in solid content and this cause an increase in reaction time. Therefore, higher time requires for reaction in higher pulp density.
Based on Equation (2), the optimum condition to achieve the highest Cu recovery is H2SO4 250 (g/L), solid content 5 (%), microwave power 1000 (W), HNO3 10 (g/L) and leaching time 10 (min). It should be noted that nitric acid concertation has no effect on Cu recovery in the selected intervals. Therefore, its optimum condition selected in its lowest concertation (10 g/L) to decrease the chemical consumption and corrosion.
3.2.2. Zinc Extraction
The effects of five mentioned parameters also have been investigated in zinc dissolution. Equation (3) has been suggested to predict Zn recovery. The analysis of variance for the suggested model is reported in Table 7. This model is significant with p-value = 0.001. The adequate precision for this model is 7.772. The adequate precision for the model is higher than 4 (the minimum required amount). The lack of fit for this model is not-significant which shows that repeatability of experiments for zinc extraction.
The effects of each parameter on Zn recovery are shown in Figure 7. As mentioned, the effect of parameters also can be determined by ANOVA. According to Table 3 and Figure 7, the HNO3 concentration has the highest effect on zinc dissolution. The nitric acid concentration has a higher effect on Zn recovery compare to sulfuric acid concentration. It should be noted that nitric acid does not act as an oxidizing agent for ZnO because zincite is an oxide component and does not need any oxidizer for dissolution. This means that HNO3 act as a leaching agent for ZnO. With F-value 0.32 microwave power has a negligible effect on zinc leaching. Therefore, ZnO dissolution is chemical leaching rather than microwave leaching. The extending leaching time also has no influence on zinc leaching improvement. Despite the copper composition, the zinc present in the sample in the form of oxide component which is highly soluble in acid [42] with high leaching kinetics. In fact, almost all ZnO dissolved in the first minute of the process.
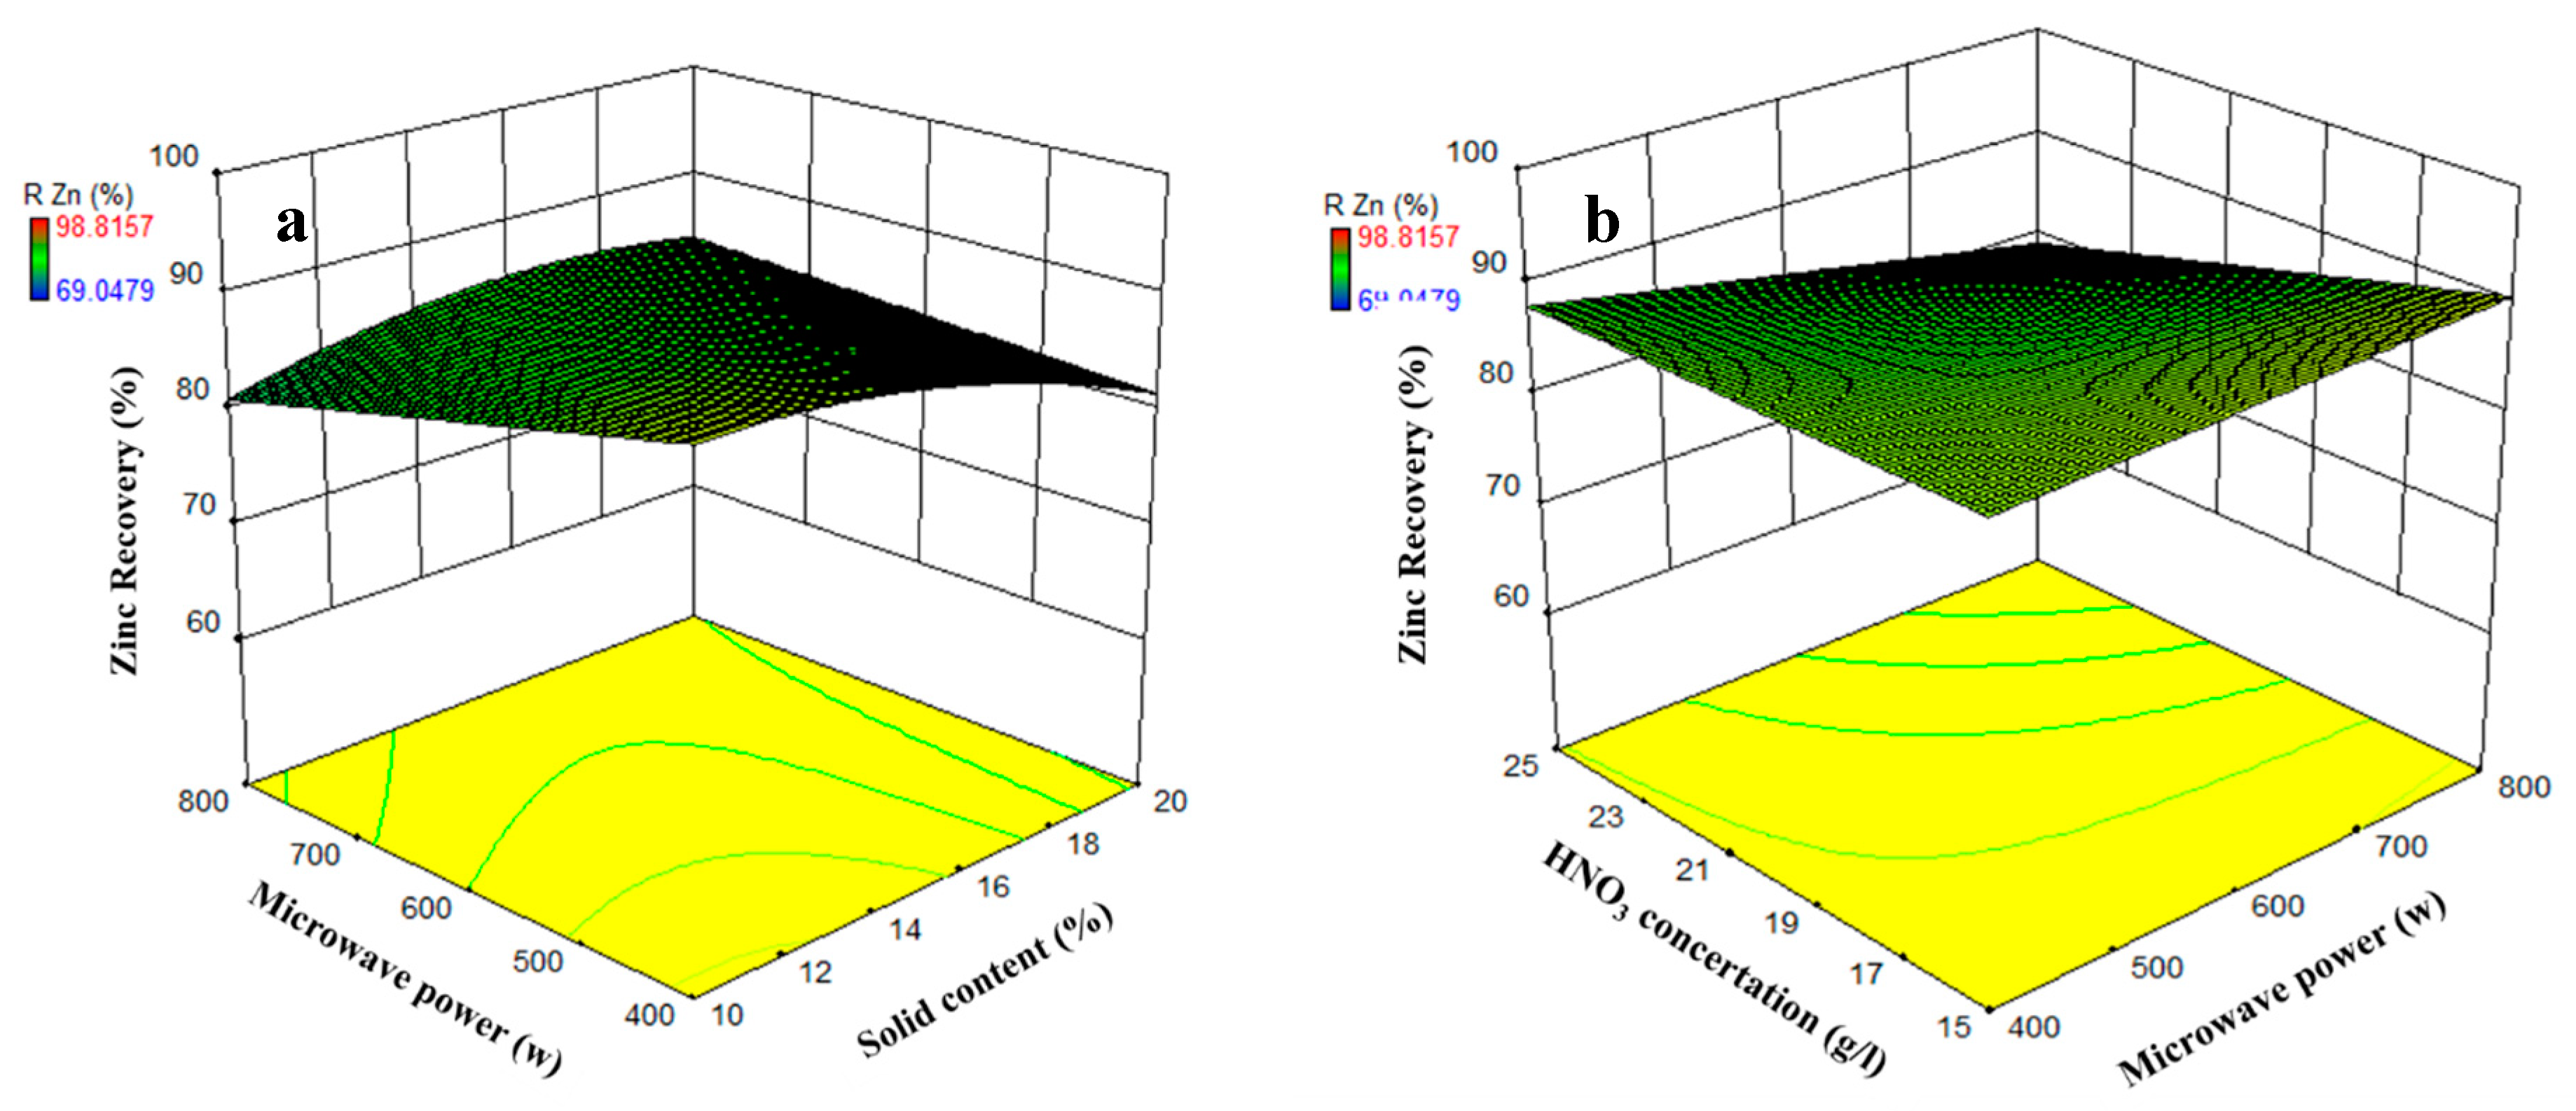
Among all interactions between parameters, just microwave power-solid content and microwave power-HNO3 concertation interactions are meaningful (with a p-value lower than 0.05). The effects of these interactions on Zn recovery are shown in Figure 8. The zinc recovery becomes its maximum amount by minimizing microwave power and solid content, simultaneously (Figure 8a). On the other hand, the Zn recovery will be minimized by maximizing the microwave power and minimizing nitric acid concertation (Figure 8b). The drawn surfaces (Figure 8b) have a slight curve that shows the minor effect of detected interactions.
The optimum H2SO4 and HNO3 concentrations for Zn dissolution is 150 g/L and 10 g/L, respectively. The microwave power and pulp density should fix on 1000 W and 25% to achieve the highest Zn recovery in the highest capacity (due to high solid content). The time also has no effect on Zn leaching process in the selected period, which means that optimum leaching time can be selected at 6 min. As mentioned, ZnO dissolves in acid with high kinetics due to its oxide composition.
3.3. Kinetics Study
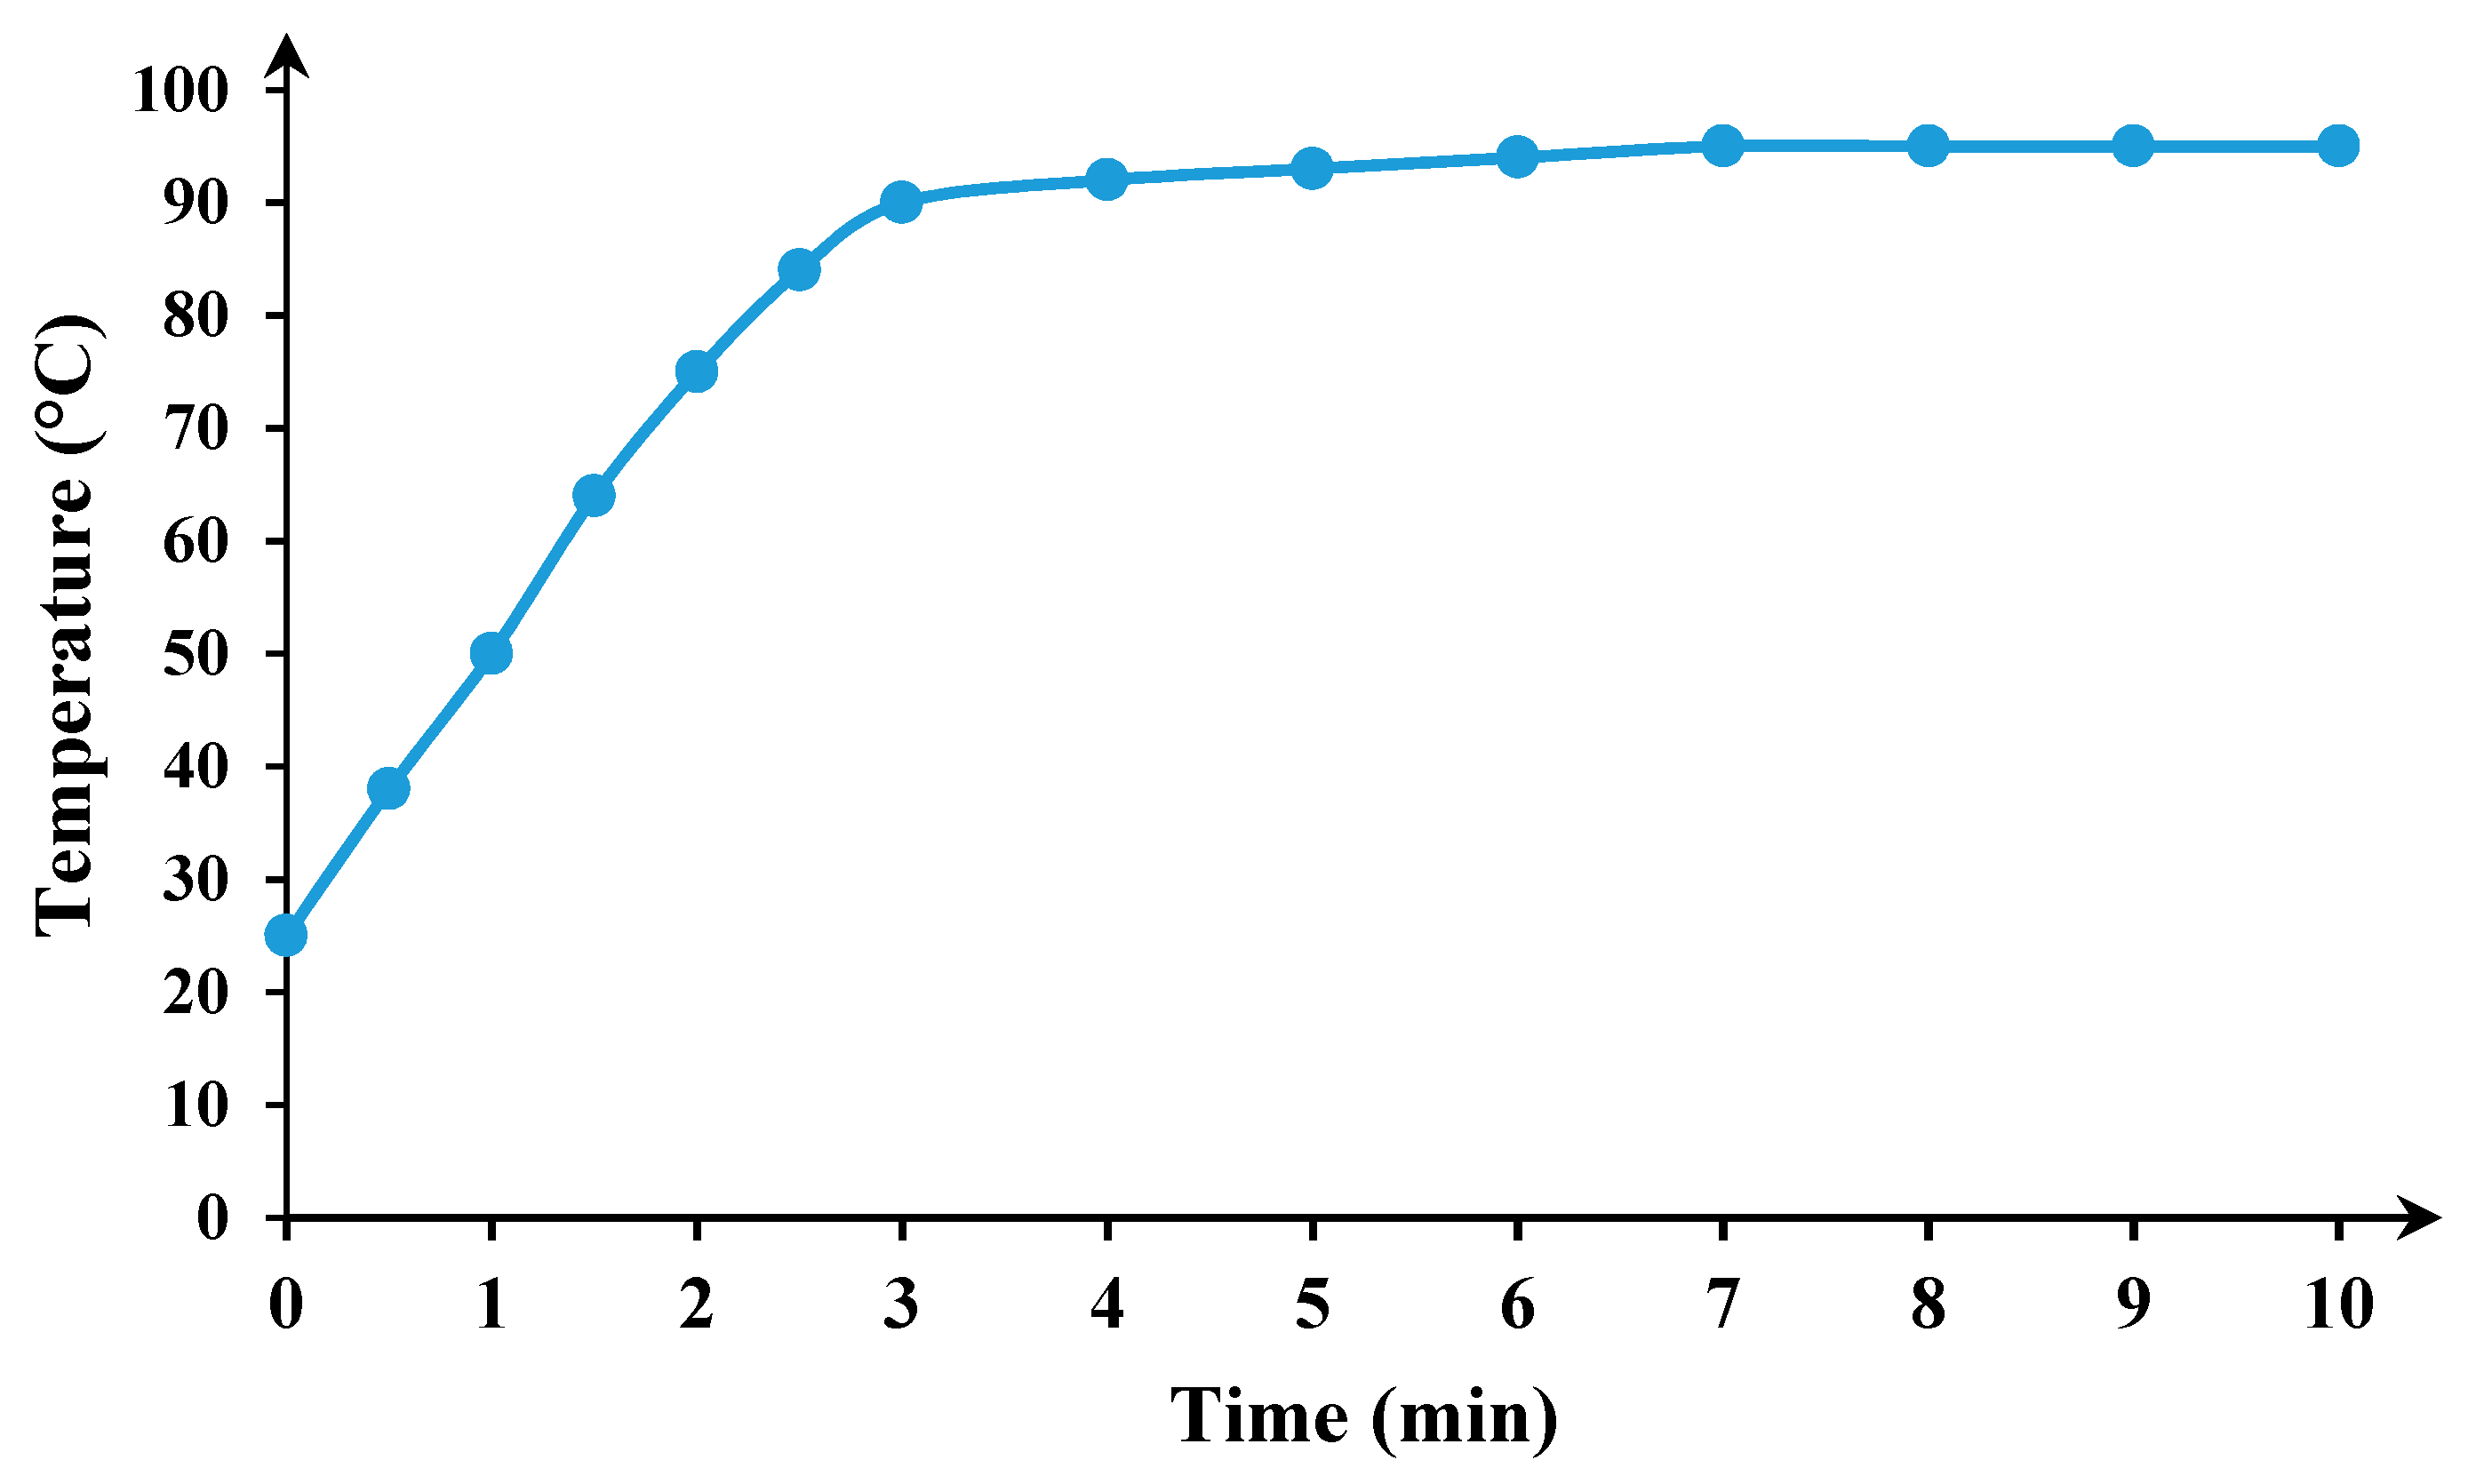
As mentioned above, Zn dissolution occurs quite quickly; thus, sampling for the kinetic study assessment is not possible. However, the kinetic study carried out to determine the Cu leaching mechanism from CSD, in the presence and absence of microwave irradiation. For comparison purposes, it would be essential to operate the experiments in the same condition. Therefore, all conditions include leaching and oxidizing agent concentrations, solid content and process time sat on optimum conditions achieved from the optimization section. To find the temperature during microwave leaching, the leaching liquid temperature was measured for 1000 W microwave power. Figure 9 shows the temperature fluctuations during 10-min irradiation. According to this diagram, the liquid temperature started from ~25 °C (room temperature) and reached its highest level (~90 °C) in 3 min. To provide similar conditions, non-microwave leaching test also carried out in a water bath at a temperature of 90 °C.
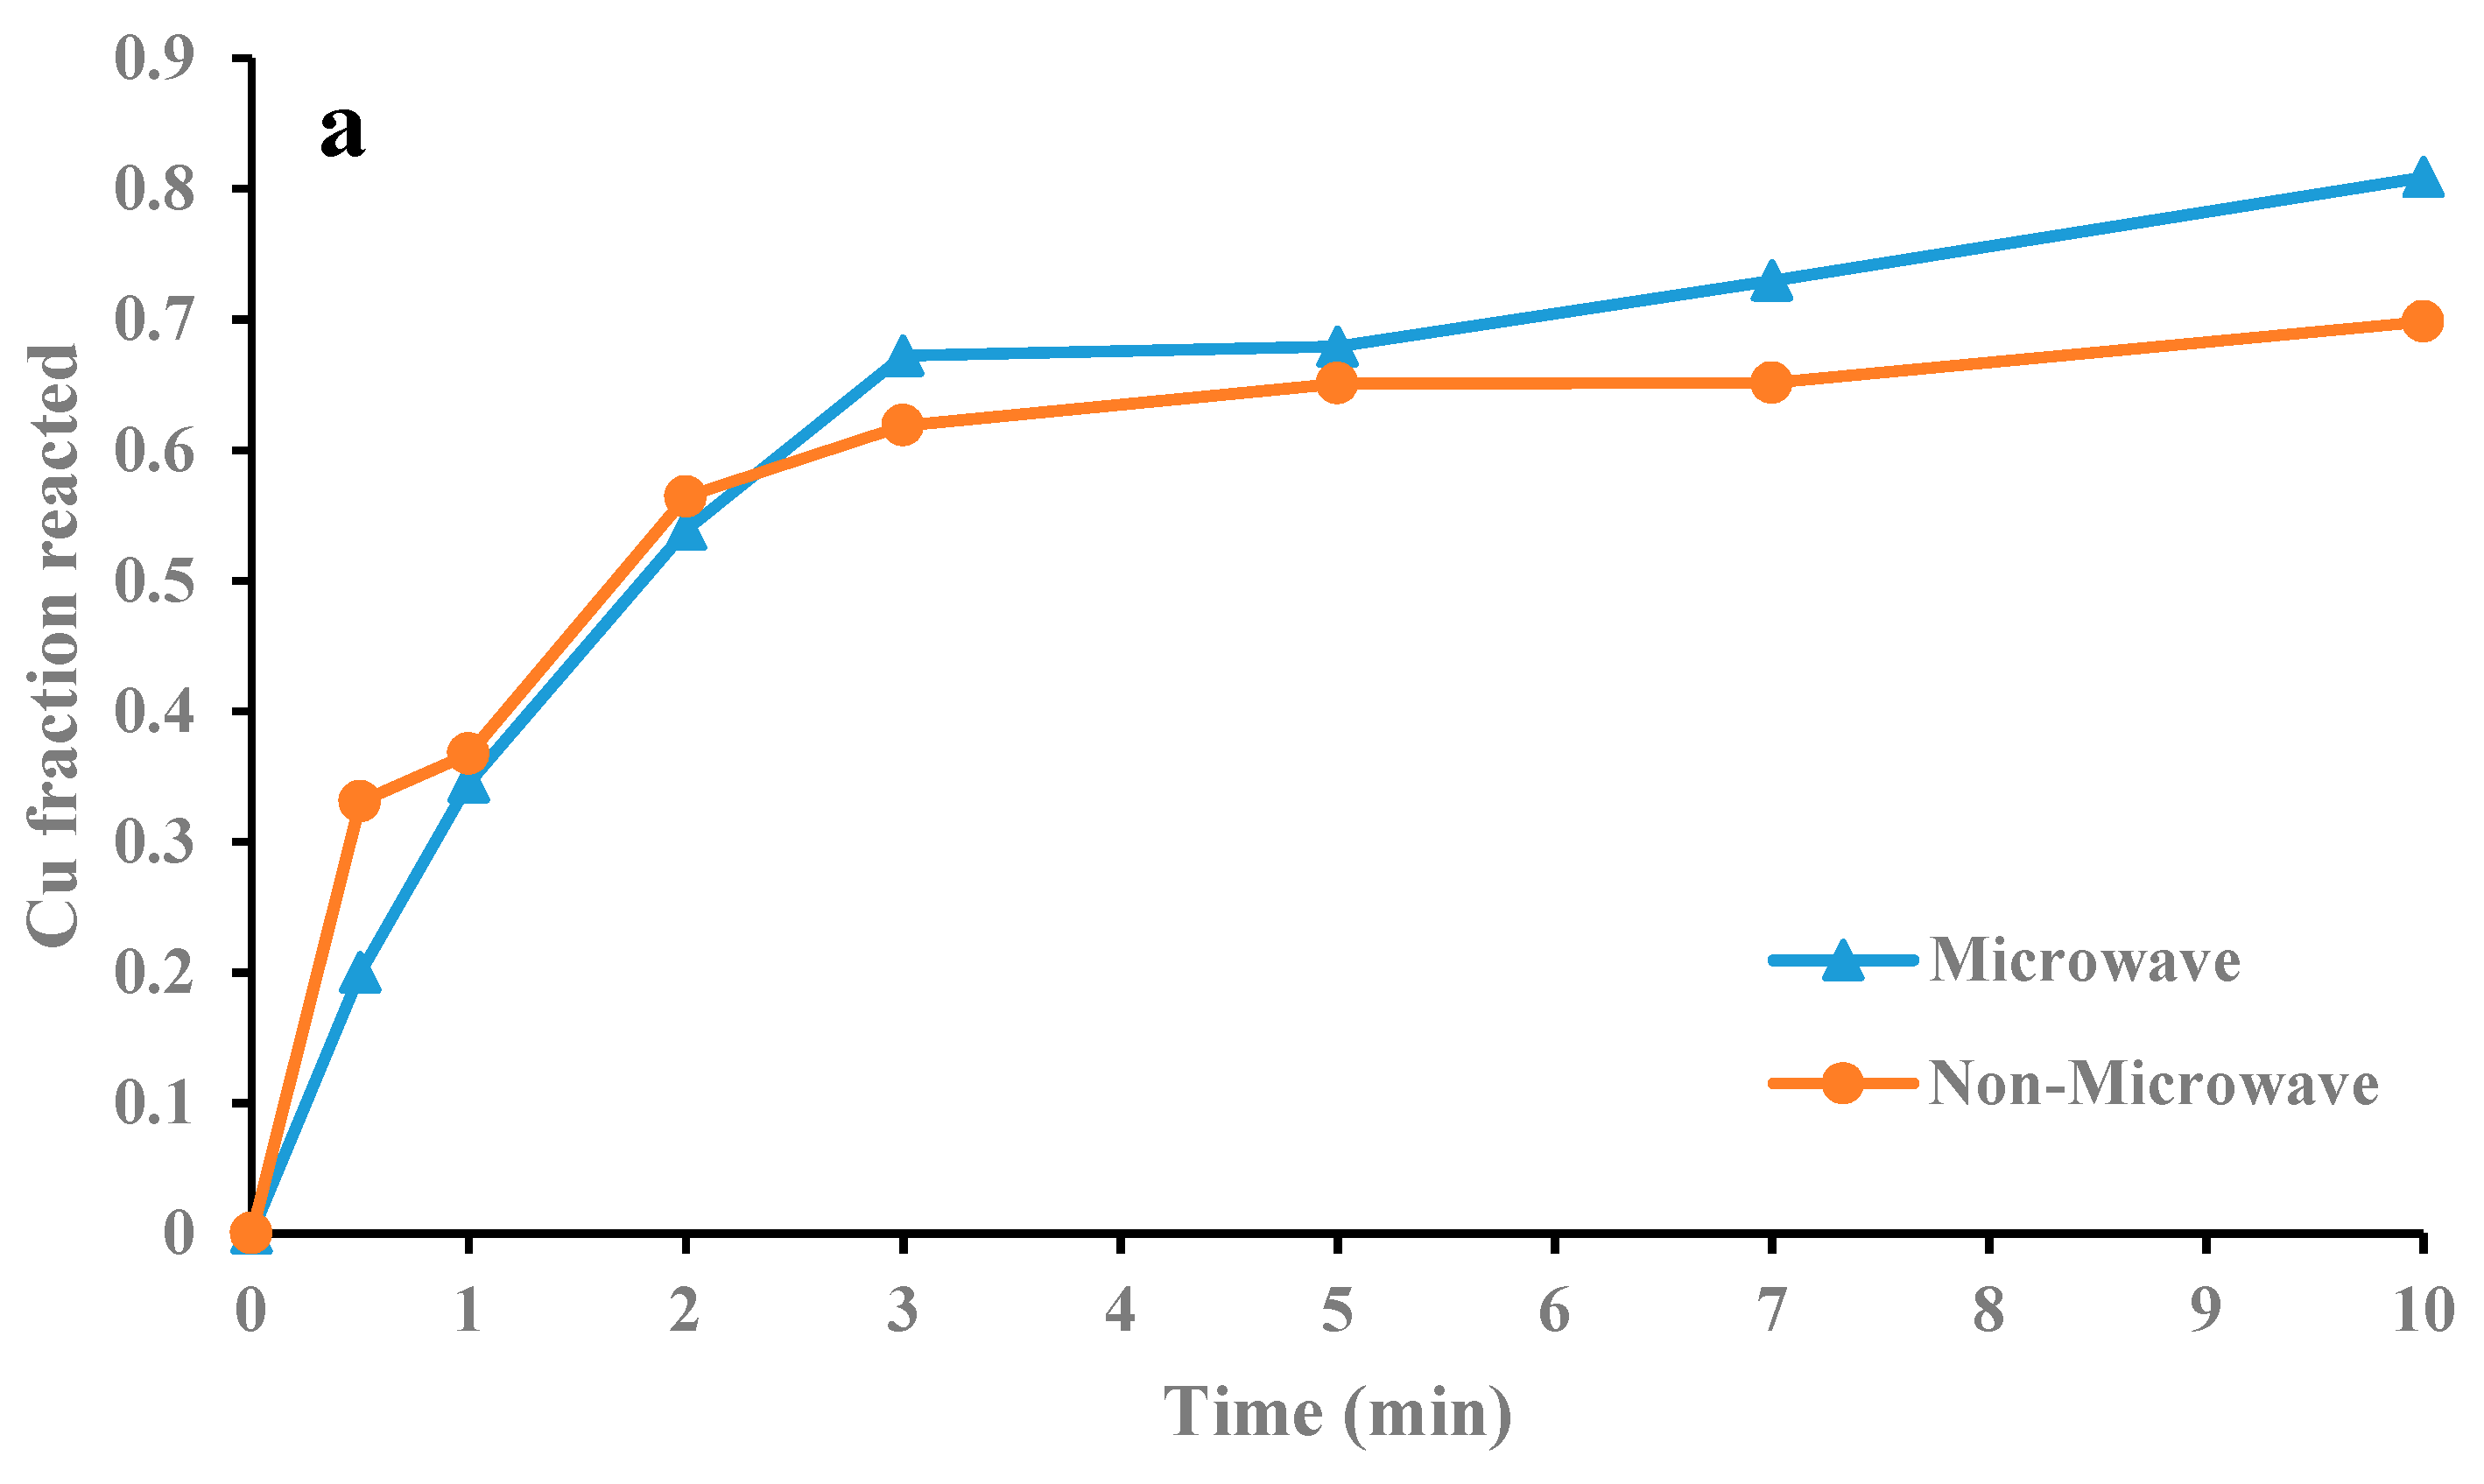
Figure 10a shows the Cu recovery in the microwave and non-microwave leaching. The final Cu recovery from CSD after 10 min in the absence and presence of microwave irradiation is 80.88% and 69.83%, respectively. The copper dissolution in non-microwave leaching is higher in the first 3 min; however, for microwave-leaching experiment Cu dissolution increases after this period. The non-microwave leaching was carried out in the water bath and the reaction temperature was constant during the process. On the other hand, the temperature reaches its highest level after 3 min (Figure 9). After this initial step, the Cu dissolution in the microwave-leaching experiment starts to increase (compare to non-microwave leaching).
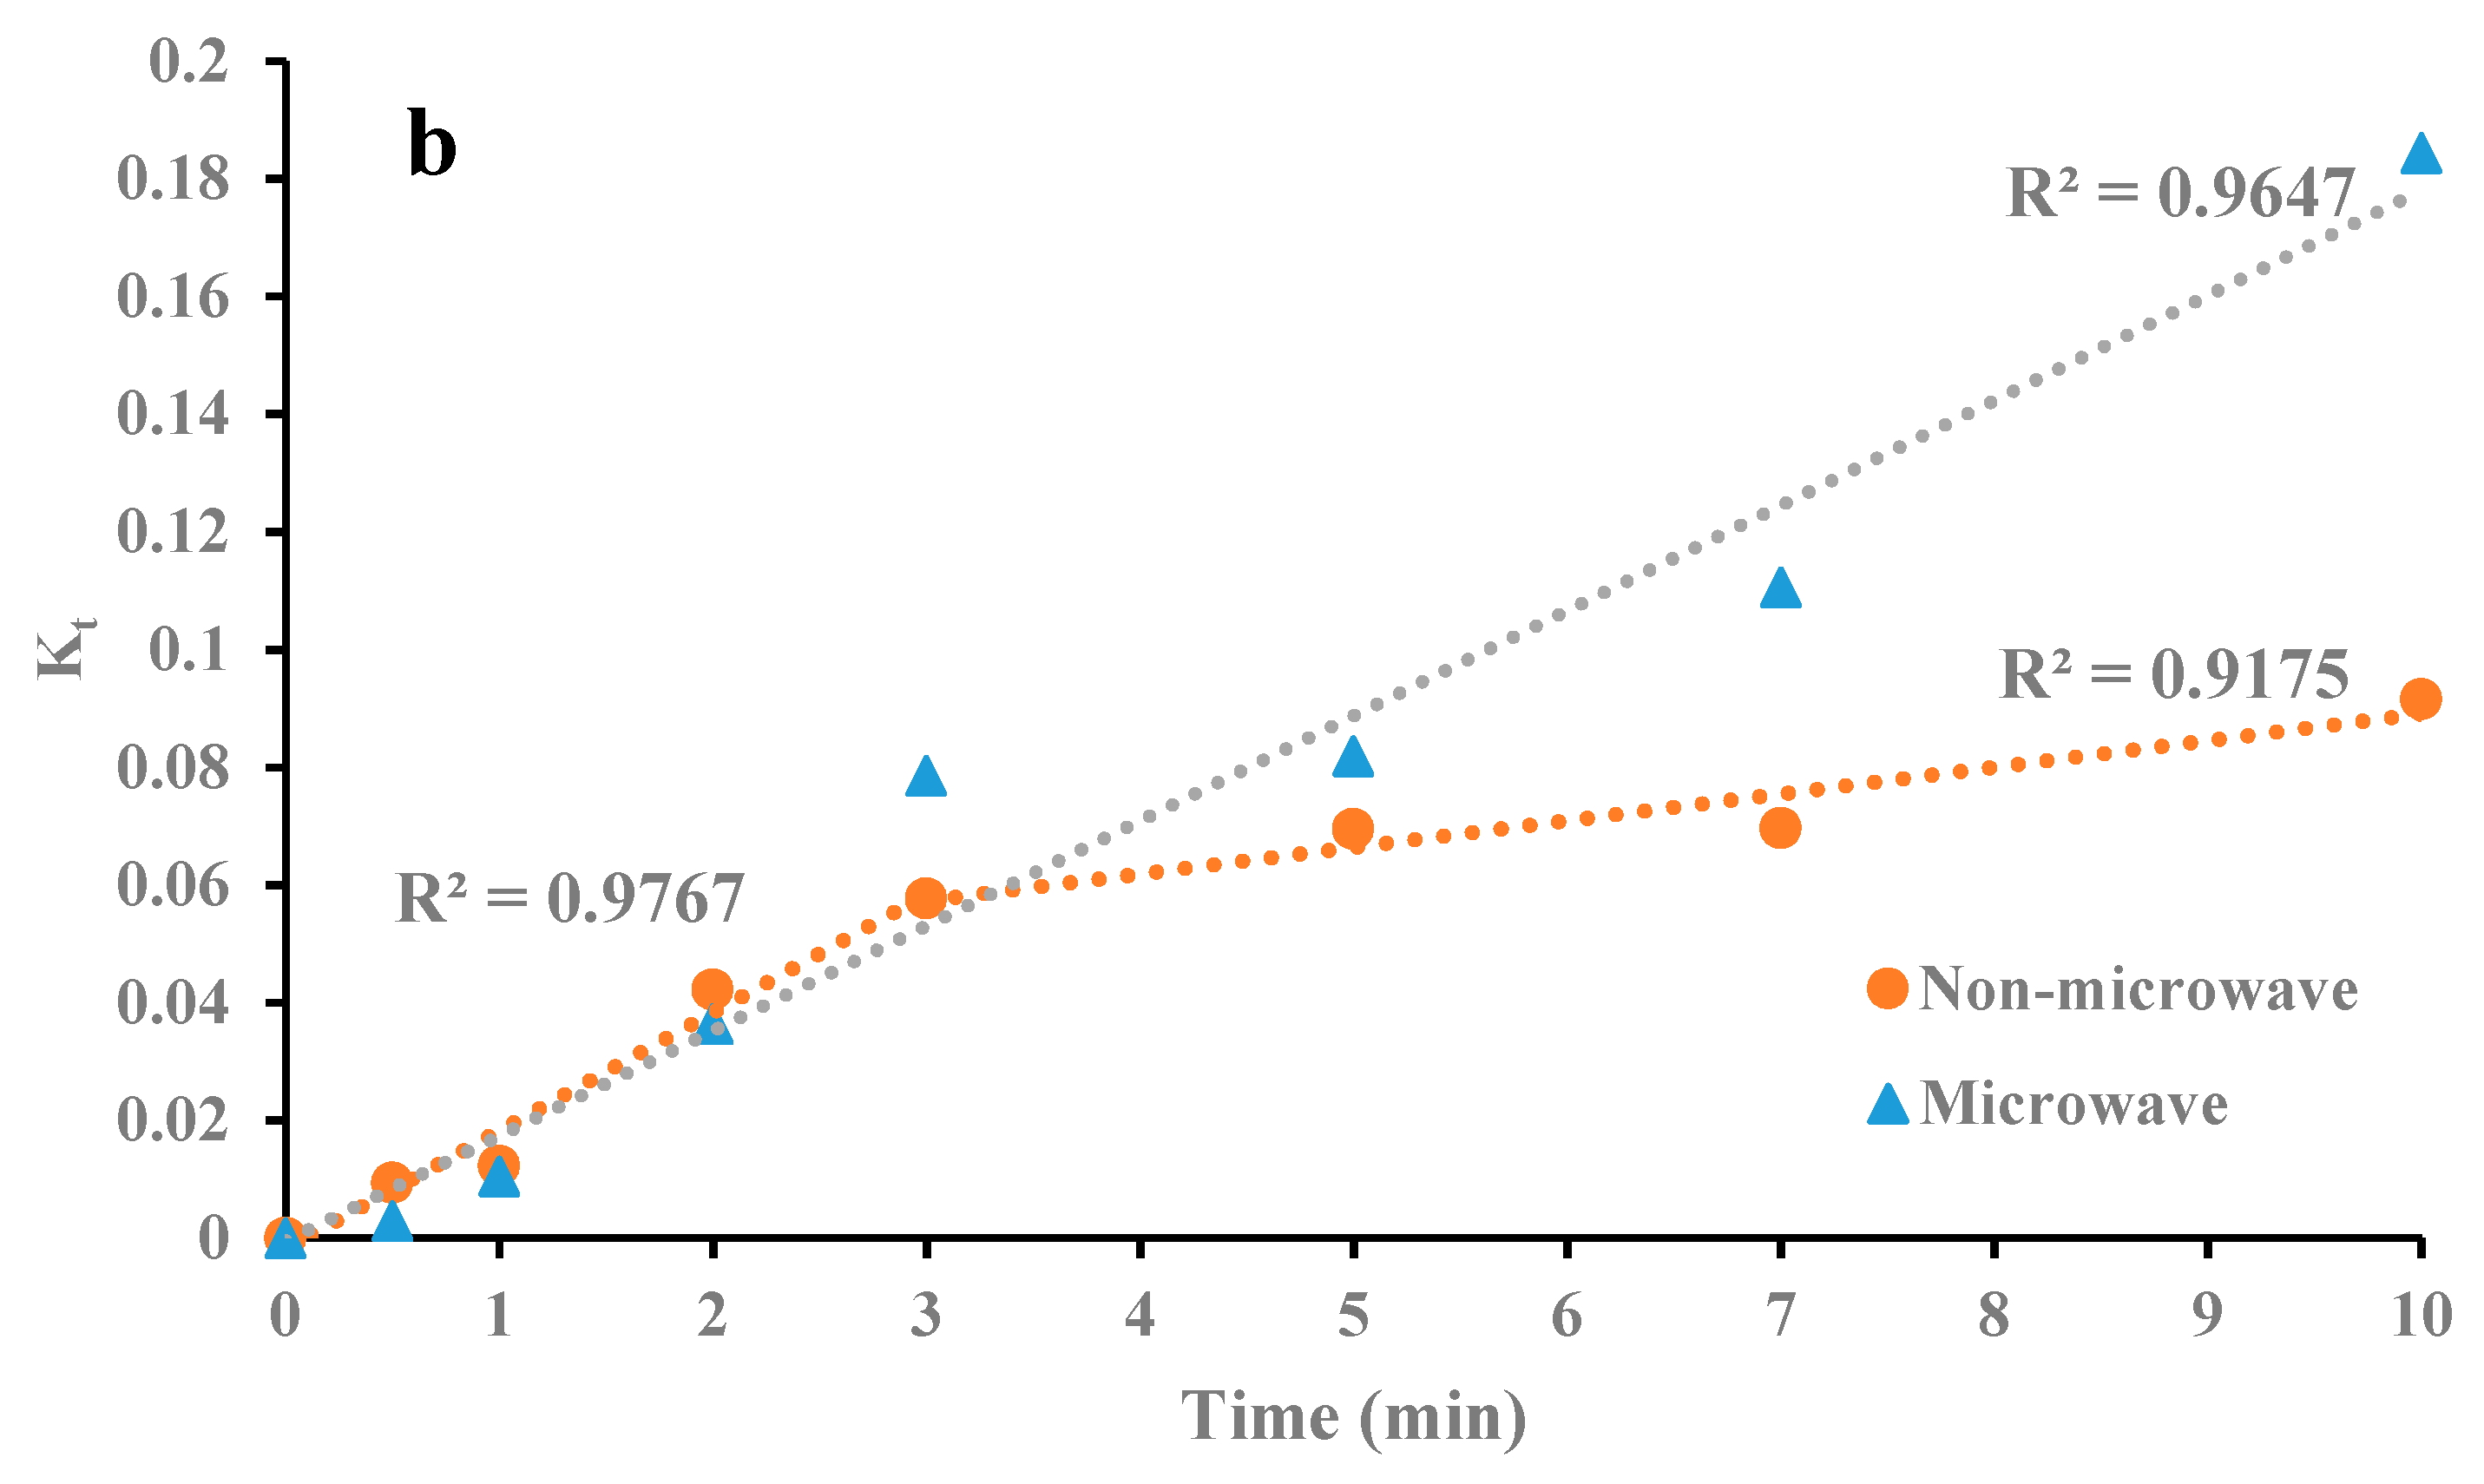
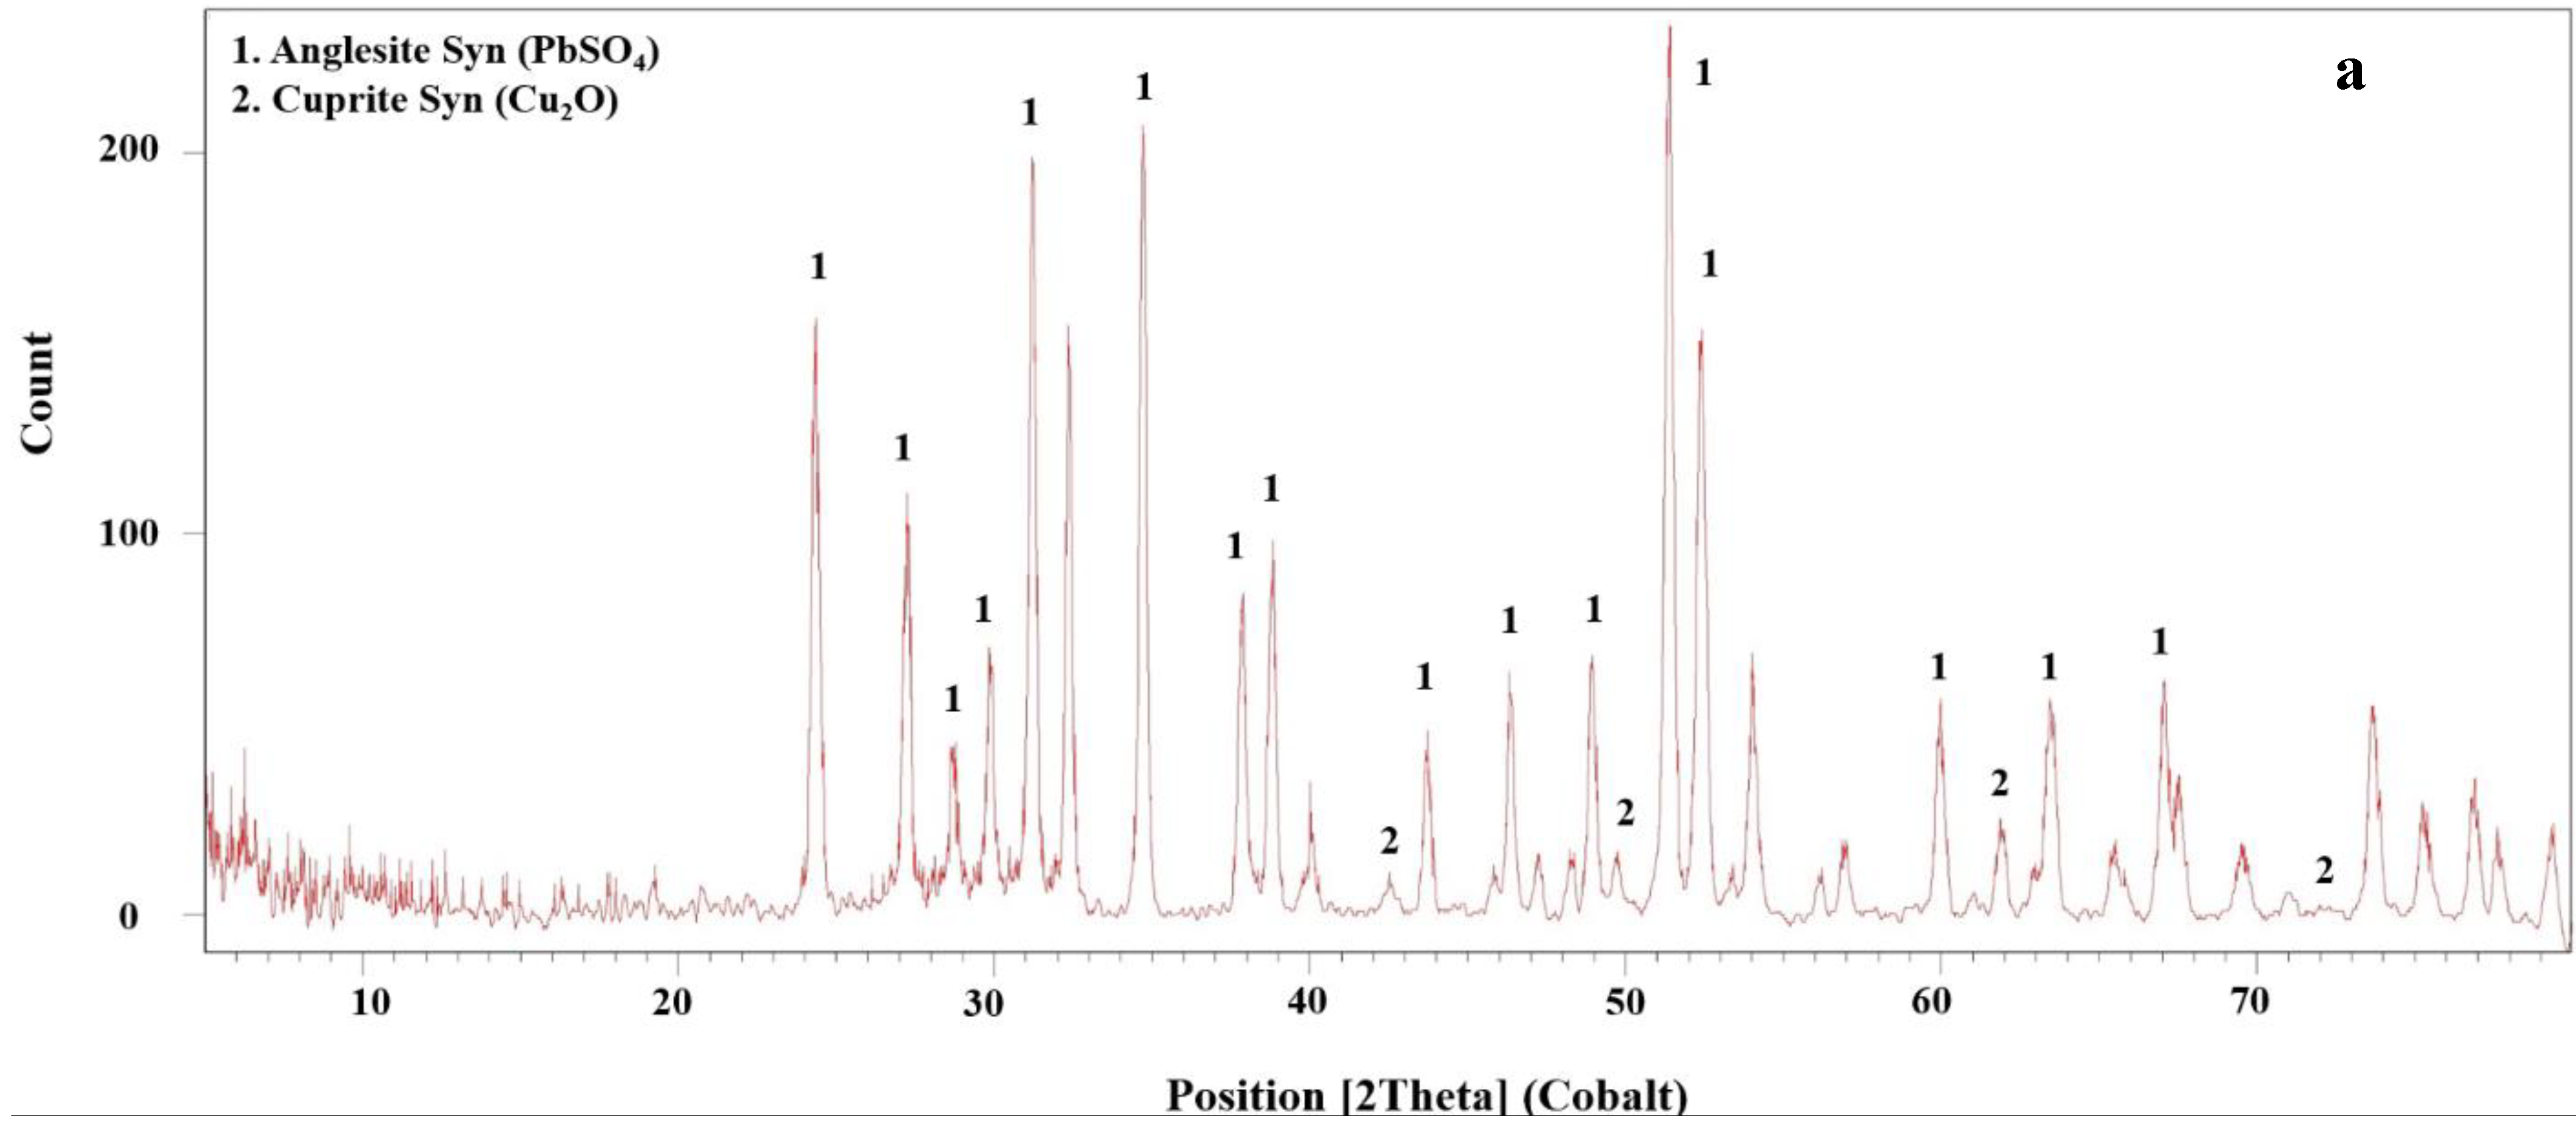
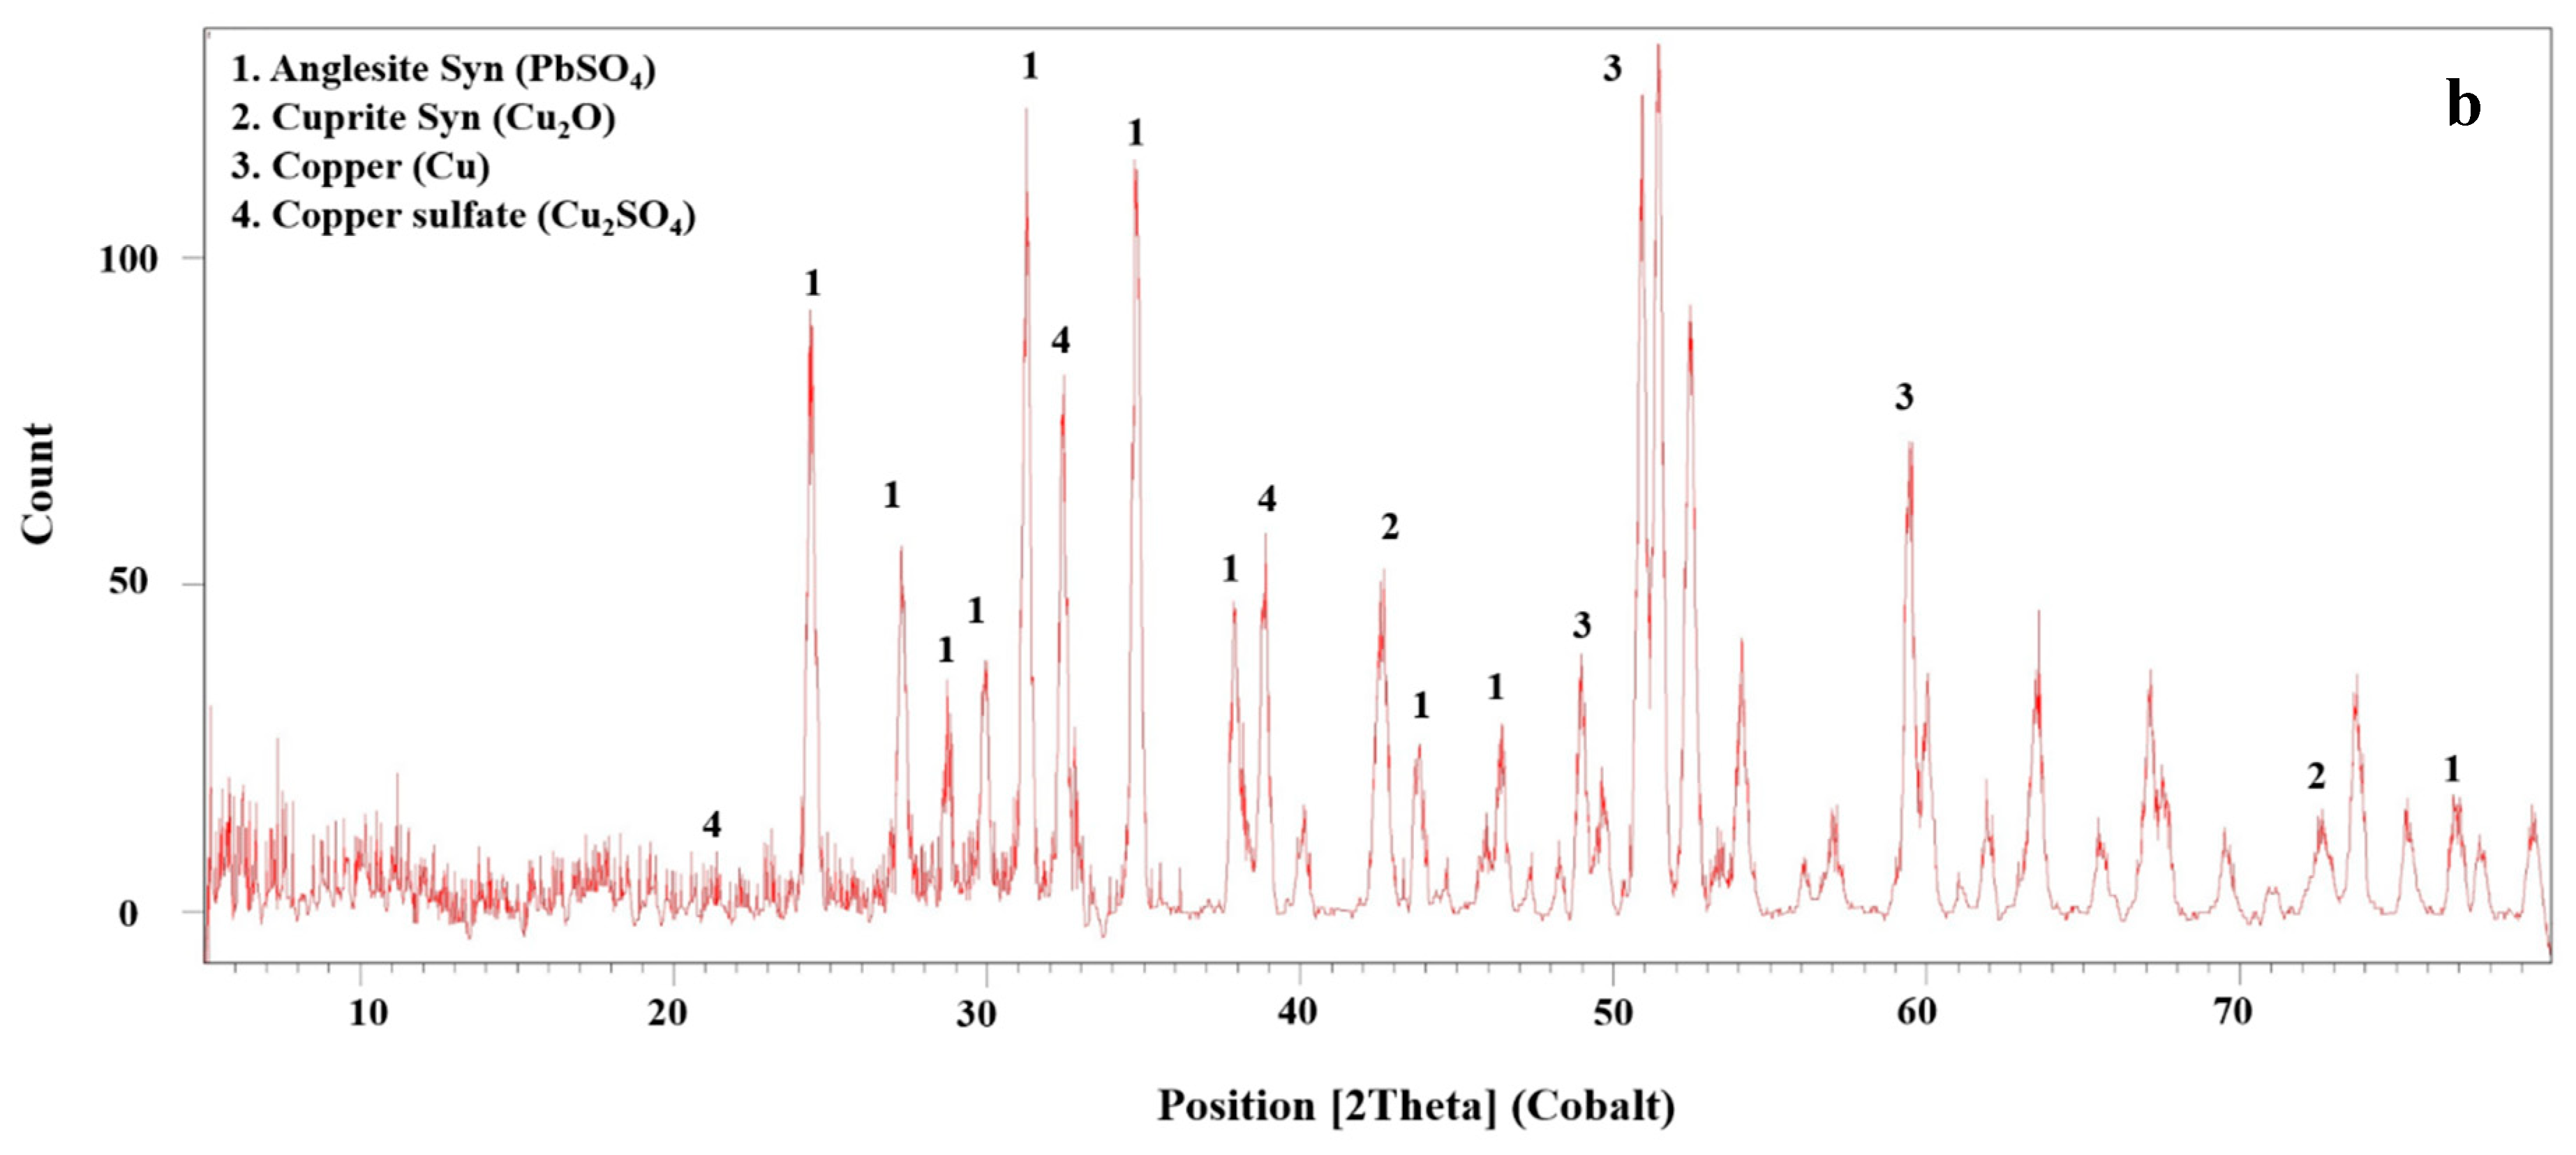
Different kinetics models (Table 3) have been fitted to data to find the best mechanism to describe the leaching process. The model was the best-fitted model for data achieved from both microwave and non-microwave leaching (Figure 10b). This model shows that the leaching reaction follows interfacial transfer and diffusion across the product layer [32]. The kinetics modelling indicated that non-microwave leaching follows two stops. Although both septs are fitted to the above mentioned equation, the reaction speeds for different steps are varied. The reaction kinetics for the first 3 min is high and drops due to the formation of the product layer. Leaching residuals are analyzed by the XRD to determine the composition of the product layer during leaching (Figure 11). The microwave-leaching residual contains Cu2O; while the non-microwave leaching residual contains Cu2SO4, Cu2O, and metallic Cu. The Cu2O intensity in microwave-leaching residual is very low; therefore, the quantity of this component is not significant. The sulfate component intensity, on the other hand is high for non-microwave leaching. According to the kinetics modeling and XRD results, the formation of sulfate components limited Cu dissolution for non-microwave leaching experiments. The leaching reagent should diffuse across this product layer to access the surface of particles for leaching.
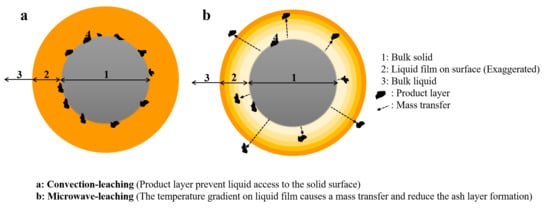
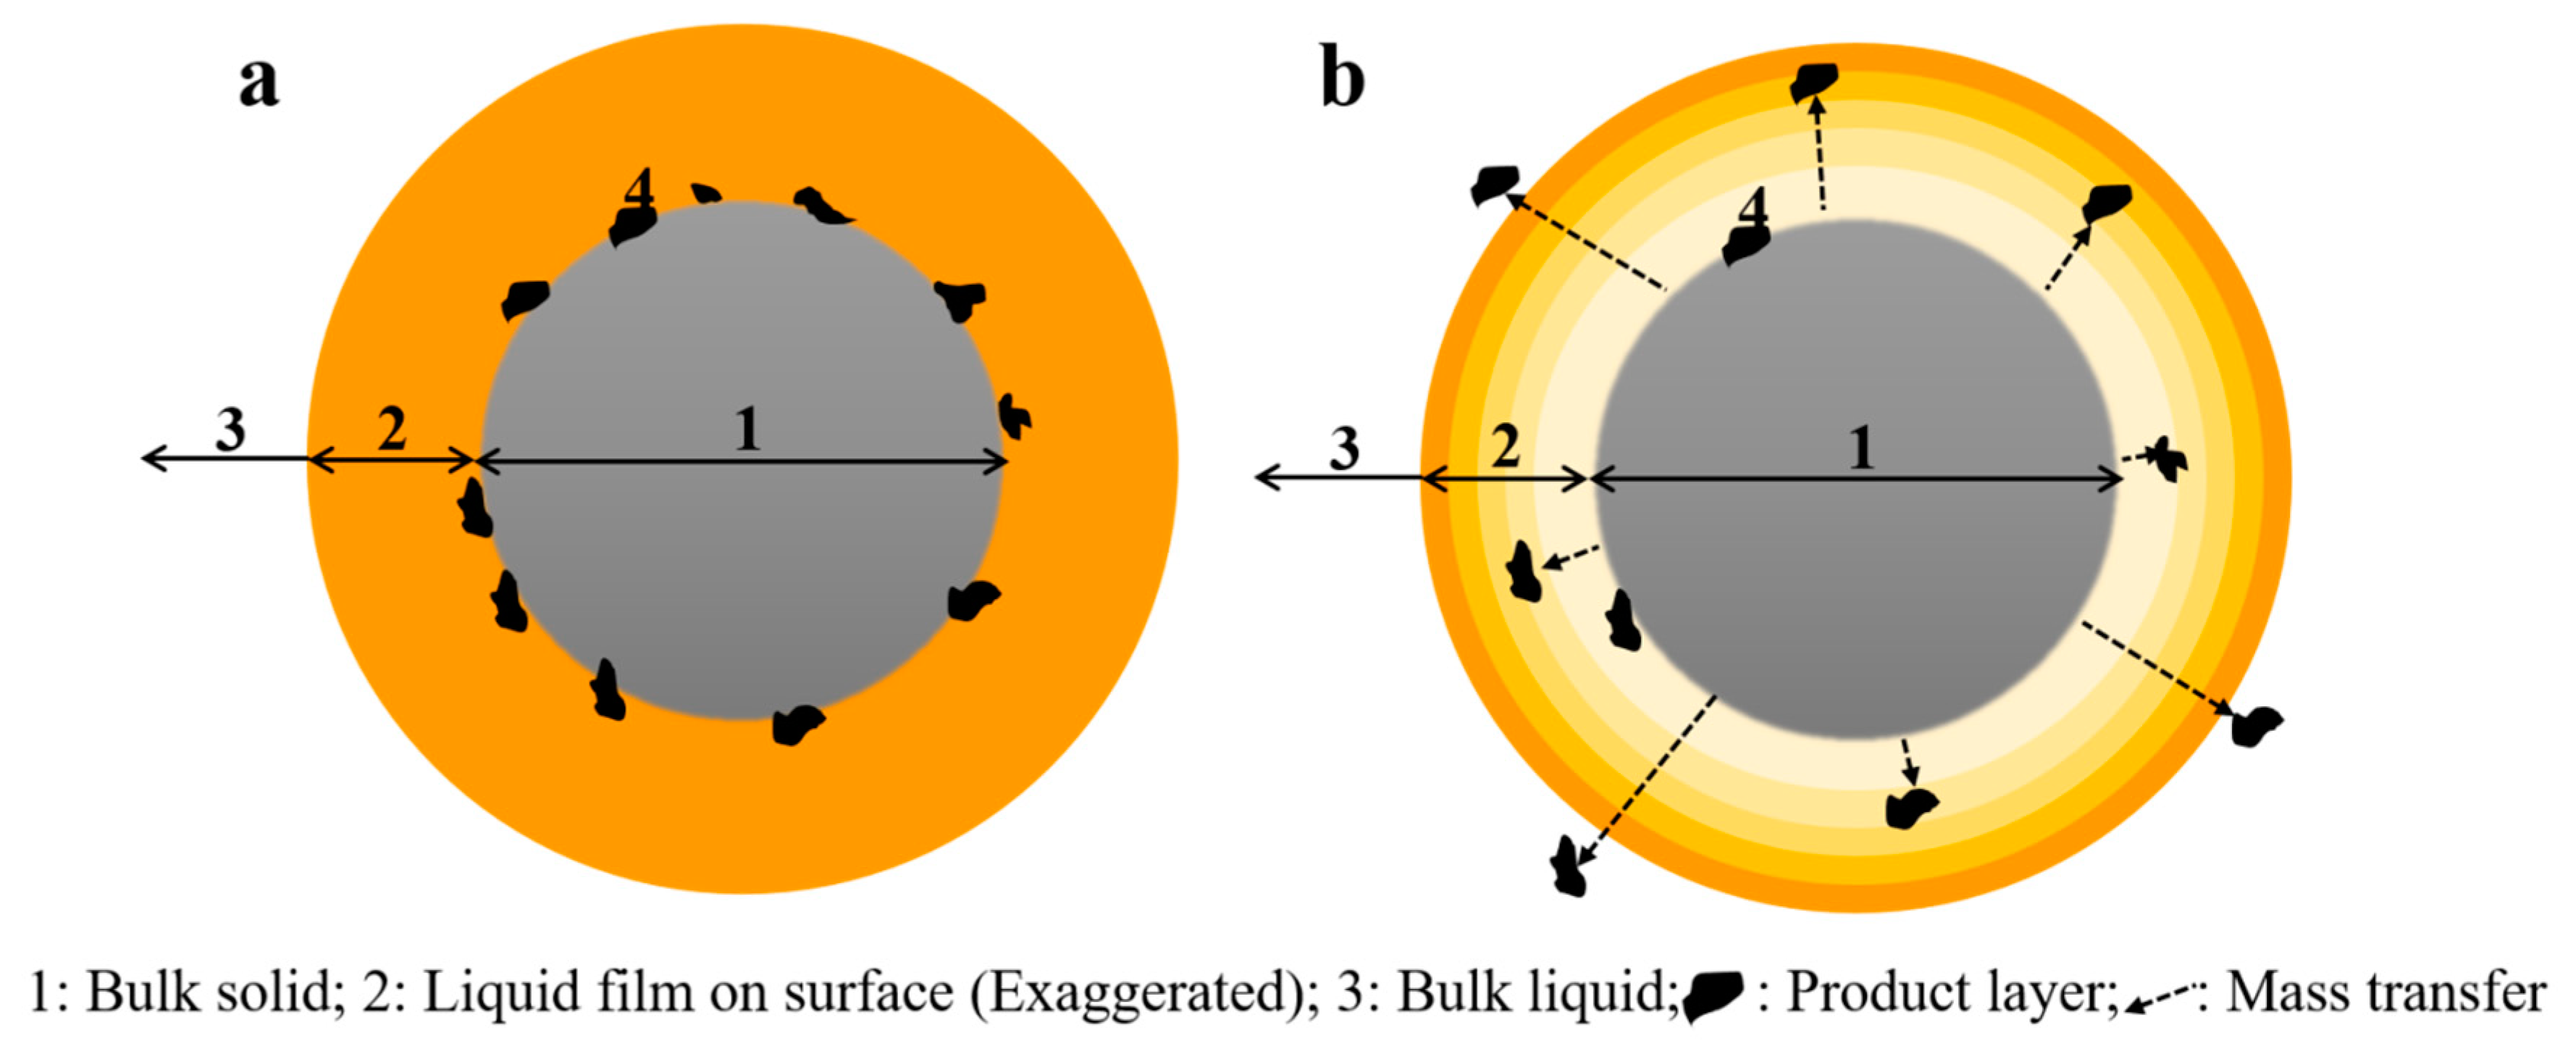
The ability of materials for microwave energy adsorption is dependent on dielectric properties [43]. Therefore, microwave adsorptions for solid and liquid are quite different and increasing temperature for these two phases has to be varied. These variations make a thermal gradient in the solid-liquid boundary (liquid film). This thermal gradient causes a mass transfer in particles surface and avoids ash layer formation. Therefore, the leaching kinetics increase in microwave-leaching due to higher reagent diffusion to the surface by decreasing the ash layer formation (Figure 12).
Two additional experiments without agitation also carried out to clarify the leaching mechanism, in the presence and absence of microwave irradiation. The Cu recovery under microwave irradiation was 63.99%; while its recovery was 23.44 in absence of microwave. These tests also show the positive effect of microwave irradiation on leaching kinetics. The microwave power increases interactions between molecules, produce heat and improve the kinetic energy [16]. The lead sulfate (anglesite) determines in both microwave and non-microwave leaching residual. With a Ksp = 1.62 × 10⁻⁸ [44,45], PbSO4 remained unreacted in the sample during the leaching process.
4. Conclusions
Leaching under microwave irradiation (microwave-leaching) was examined for Cu and Zn extraction for copper smelting dust (CSD) to produce valuable metals and reduce environmental problems of this waste component. The high efficiency, fast kinetic and low waste of energy are the most important advantages of this method compared to the traditional methods. Response surface methodology (RSM) and central composite design (CCD) were used to design various experiments based on leaching parameters (acid concentration, pulp density, oxidant concentration, microwave power and leaching time) and find optimum conditions for copper and zinc extraction. CCD results indicated that microwave power and oxidizing agent concentration do not show a significant effect on copper extraction while there is a correlation between sulfuric acid concertation, solid content, processing time and copper dissolution, in selected intervals. In other words, increasing the H2SO4 concentration and decreasing solid content simultaneously can increase copper recovery. Moreover, the highest Cu extraction occurred by increasing the leaching time and decreasing solid content. The optimum condition to receive the highest Cu recovery was: H2SO4 250 g/L, solid content 5%, microwave power 1000 W, HNO3 10 g/L and leaching time 10 min. For Zn recovery, the HNO3 concentration has the highest effect. HNO3 which used as an oxidant for Cu recovery acted as a leaching agent for ZnO. Zinc oxides immediately dissolve in the acids, and the Zn recovery reached its maximum percentage when at H2SO4 150 g/L, HNO3 10 g/L, microwave power of 1000 W and pulp density of 25%.
To better understand the mechanisms of Cu leaching from CSD and for comparison purposes, various kinetics models are fitted to the data resulted from experiment design, in the absence and presence of microwave. The final Cu recovery from CSD in the absence and presence of microwave irradiation was 80.88% and 69.83%, respectively. Kinetics studies demonstrated that non-microwave leaching follows two steps: (1) High Cu dissolution rate (in first 3 min), (2) low Cu dissolution rate (after first 3 min) due to the formation of a product layer. Moreover, they indicated that the leaching reaction follows interfacial transfer and diffusion across the product layer. XRD analysis showed that microwave-leaching residual contains low concertation of Cu2O, while non-microwave leaching residual contains a high concentration of Cu2SO4. In other words, the sulfate component intensity was high on the surface of particles for non-microwave leaching which decreased Cu dissolution for non-microwave leaching experiments. While microwave irradiation decreases the ash layer formation and increases the Cu dissolution.
Author Contributions
S.M.J.K. and B.S. (Behzad Shahbazi) supervised and S.C.C. co-supervised B.S. (Behrouz Sabzezari). B.S. (Behrouz Sabzezari) performed the experiments and analyzed samples. B.S. (Behrouz Sabzezari) and S.G. assessed experimental results. S.G., B.S. (Behrouz Sabzezari) and S.C.C. wrote the manuscript.
Funding
This research received no external funding.
Conflicts of Interest
The authors declare no conflict of interest.
References
- Jeon, S.; Tabelin, C.B.; Takahashi, H.; Park, I.; Ito, M.; Hiroyoshi, N. Interference of coexisting copper and aluminum on the ammonium thiosulfate leaching of gold from printed circuit boards of waste mobile phones. Waste Manag. 2018, 81, 148–156. [Google Scholar] [CrossRef] [PubMed]
- Meng, Q.; Zhang, Y.; Dong, P. Use of electrochemical cathode-reduction method for leaching of cobalt from spent lithium-ion batteries. J. Clean. Prod. 2018, 180, 64–70. [Google Scholar] [CrossRef]
- Önal, M.A.R.; Aktan, E.; Borra, C.R.; Blanpain, B.; Van Gerven, T.; Guo, M. Recycling of NdFeB magnets using nitration, calcination and water leaching for REE recovery. Hydrometallurgy 2017, 167, 115–123. [Google Scholar] [CrossRef]
- Zhang, K.; Li, B.; Wu, Y.; Wang, W.; Li, R.; Zhang, Y.-N. Recycling of indium from waste LCD: A promising non-crushing leaching with the aid of ultrasonic wave. Waste Manag. 2017, 64, 236–243. [Google Scholar] [CrossRef] [PubMed]
- Asghari, M.; Noaparast, M.; Shafaie, S.Z.; Ghassa, S.; Chehreh, S. Recovery of coal particles from a tailing dam for environmental protection and economical beneficiations. Int. J. Coal Sci. Technol. 2018, 5, 253–263. [Google Scholar] [CrossRef] [Green Version]
- Fujisawa, V. Recirculation of Chilean Copper Smelting Dust with High Arsenic Content to the Smelting Process. Mater. Trans. 2008, 49, 2112–2118. [Google Scholar] [Green Version]
- Helbig, T.; Gilbricht, S.; Lehmann, F.; Daus, B.; Kelly, N.; Haseneder, R. Oxidative leaching of a sulfidic flue dust of former copper shale processing with focus on rhenium. Miner. Eng. 2018, 128, 168–178. [Google Scholar] [CrossRef]
- Liu, W.; Fu, X.; Yang, T.; Zhang, D.; Chen, L. Oxidation leaching of copper smelting dust by controlling potential. Trans. Nonferrous Met. Soc. China 2018, 28, 1854–1861. [Google Scholar] [CrossRef]
- Mohagheghi, M.; Askari, M. Copper recovery from reverberatory furnace flue dust. Int. J. Miner. Process. 2016, 157, 205–209. [Google Scholar] [CrossRef]
- Li, T.; Zhang, Y.; Zhang, B.; Zhang, J.; Qin, W. Selective leaching of arsenic from enargite concentrate using alkaline leaching in the presence of pyrite. Hydrometallurgy 2018, 181, 143–147. [Google Scholar] [CrossRef]
- Ghassa, S.; Noaparast, M.; Shafaei, S.Z.; Abdollahi, H.; Gharabaghi, M.; Boruomand, Z. A study on the zinc sulfide dissolution kinetics with biological and chemical ferric reagents. Hydrometallurgy 2017, 171, 362–373. [Google Scholar] [CrossRef]
- Torres, R.; Segura-Bailón, B.; Lapidus, G.T. Effect of temperature on copper, iron and lead leaching from e-waste using citrate solutions. Waste Manag. 2018, 71, 420–425. [Google Scholar] [CrossRef] [PubMed]
- Haque, K.E. Microwave energy for mineral treatment processes—A brief review. Int. J. Miner. Process. 1999, 57, 1–24. [Google Scholar] [CrossRef]
- Wen, T.; Zhao, Y.; Xiao, Q.; Ma, Q.; Kang, S.; Li, H.; Song, S. Effect of microwave-assisted heating on chalcopyrite leaching of kinetics, interface temperature and surface energy. Results Phys. 2017, 7, 2594–2600. [Google Scholar] [CrossRef]
- Yang, K.; Li, S.; Zhang, L.; Peng, J.; Chen, W.; Xie, F.; Ma, A. Microwave roasting and leaching of an oxide-sulphide zinc ore. Hydrometallurgy 2016, 166, 243–251. [Google Scholar] [CrossRef]
- Bayca, S.U. Microwave radiation leaching of colemanite in sulfuric acid solutions. Sep. Purif. Technol. 2013, 105, 24–32. [Google Scholar] [CrossRef]
- Sadeghi, M.; Vanpeteghem, G.; Neto, I.F.F.; Soares, H. Selective leaching of Zn from spent alkaline batteries using environmentally friendly approaches. Waste Manag. 2017, 60, 696–705. [Google Scholar] [CrossRef]
- Suriapparao, D.V.; Batchu, S.; Jayasurya, S.; Vinu, R. Selective production of phenolics from waste printed circuit boards via microwave assisted pyrolysis. J. Clean. Prod. 2018, 197, 525–533. [Google Scholar] [CrossRef]
- Xia, D.K.; Picklesi, C.A. Microwave caustic leaching of electric arc furnace dust. Miner. Eng. 2000, 13, 79–94. [Google Scholar] [CrossRef]
- Turan, M.D.; Sari, Z.A.; Miller, J.D. Leaching of blended copper slag in microwave oven. Trans. Nonferrous Met. Soc. China 2017, 27, 1404–1410. [Google Scholar] [CrossRef]
- Zhai, X.; Fu, Y.; Zhang, X.; Ma, L.; Xie, F. Intensification of sulphation and pressure acid leaching of nickel laterite by microwave radiation. Hydrometallurgy 2009, 99, 189–193. [Google Scholar] [CrossRef]
- Turan, M.D.; Arslanoğlu, H.; Altundoğan, H.S. Optimization of the leaching conditions of chalcopyrite concentrate using ammonium persulfate in an autoclave system. J. Taiwan Inst. Chem. Eng. 2015, 50, 49–55. [Google Scholar] [CrossRef]
- Ha, V.H.; Lee, J.; Huynh, T.H.; Jeong, J.; Pandey, B.D. Optimizing the thiosulfate leaching of gold from printed circuit boards of discarded mobile phone. Hydrometallurgy 2014, 149, 118–126. [Google Scholar] [CrossRef]
- Bruns, R.E.; Scarminio, I.S.; Neto, B.B. Statistical Design—Chemometrics; Elsevier: Amsterdam, The Netherlands, 2006. [Google Scholar]
- Karimifard, S.; Alavi Moghaddam, M.R. Application of response surface methodology in physicochemical removal of dyes from wastewater: A critical review. Sci. Total Environ. 2018, 640–641, 772–797. [Google Scholar] [CrossRef] [PubMed]
- Mirazimi, S.M.J.; Rashchi, F.; Saba, M. Vanadium removal from roasted LD converter slag: Optimization of parameters by response surface methodology (RSM). Sep. Purif. Technol. 2013, 116, 175–183. [Google Scholar] [CrossRef]
- Bezerra, M.A.; Santelli, R.E.; Oliveira, E.P.; Villar, L.S.; Escaleira, L.A. Response surface methodology (RSM) as a tool for optimization in analytical chemistry. Talanta 2008, 76, 965–977. [Google Scholar] [CrossRef]
- Levenspiel, O. Chemical Reaction Engineering. Ind. Eng. Chem. Res. 1999, 38, 4140–4143. [Google Scholar] [CrossRef]
- Padilla, R.; Pavez, P.; Ruiz, M.C. Kinetics of copper dissolution from sulfidized chalcopyrite at high pressures in H2SO4–O2. Hydrometallurgy 2008, 91, 113–120. [Google Scholar] [CrossRef]
- İkiz, D.; Gülfen, M.; Aydın, A.O. Dissolution kinetics of primary chalcopyrite ore in hypochlorite solution. Miner. Eng. 2006, 19, 972–974. [Google Scholar] [CrossRef]
- Aydogan, S.; Aras, A.; Canbazoglu, M. Dissolution kinetics of sphalerite in acidic ferric chloride leaching. Chem. Eng. J. 2005, 114, 67–72. [Google Scholar] [CrossRef]
- Dickinson, C.F.; Heal, G.R. Solid–liquid diffusion controlled rate equations. Thermochim. Acta 1999, 340–341, 89–103. [Google Scholar] [CrossRef]
- Dreisinger, D.; Abed, N. A fundamental study of the reductive leaching of chalcopyrite using metallic iron part I: kinetic analysis. Hydrometallurgy 2002, 66, 37–57. [Google Scholar] [CrossRef]
- Gao, G.; Li, D.; Zhou, Y.; Sun, X.; Sun, W. Kinetics of high-sulphur and high-arsenic refractory gold concentrate oxidation by dilute nitric acid under mild conditions. Miner. Eng. 2009, 22, 111–115. [Google Scholar] [CrossRef]
- Sokić, M.D.; Marković, B.; Živković, D. Kinetics of chalcopyrite leaching by sodium nitrate in sulphuric acid. Hydrometallurgy 2009, 95, 273–279. [Google Scholar] [CrossRef]
- Lazic, Z.R. Design of Experiments in Chemical Engineering; John Wiley & Sons: Hoboken, NJ, USA, 2004. [Google Scholar]
- Golpayegani, M.H.; Abdollahi, A.A. Optimization of operating parameters and kinetics for chloride leaching of lead from melting furnace slag. Trans. Nonferrous Met. Soc. China 2017, 27, 2704–2714. [Google Scholar] [CrossRef]
- Montgomery, D.C. Design and Analysis of Experiments, 6th ed.; John Wiley & Sons: New York, NY, USA, 2005. [Google Scholar]
- Heydarian, A.; Mousavi, S.M.; Vakilchap, F.; Baniasadi, M. Application of a mixed culture of adapted acidophilic bacteria in two-step bioleaching of spent lithium-ion laptop batteries. J. Power Sources 2018, 378, 19–30. [Google Scholar] [CrossRef]
- Arshadi, M.; Mousavi, S.M. Simultaneous recovery of Ni and Cu from computer-printed circuit boards using bioleaching: Statistical evaluation and optimization. Bioresour. Technol. 2014, 174, 233–242. [Google Scholar] [CrossRef] [PubMed]
- Habashi, F. Textbook of Hydrometallurgy, 2nd ed.; Metallurgie Extractive Quebec: Quebec City, QC, Canada, 1999. [Google Scholar]
- Coelho, F.E.B.; Balarini, J.C.; Araújo, E.M.R.; Miranda, T.L.S.; Peres, A.E.C.; Martins, A.H. Roasted zinc concentrate leaching: Population balance modeling and validation. Hydrometallurgy 2018, 175, 208–217. [Google Scholar] [CrossRef]
- Stott, P.E.; Zaikov, G.E. Chemical and Biochemical Physics, Kinetics and Thermodynamics; Nova Science Publishers: New York, NY, USA, 2008. [Google Scholar]
- Ye, M.; Li, G.; Yan, P.; Ren, J.; Zheng, L.; Han, D.; Sun, S.; Huang, S. Removal of metals from lead-zinc mine tailings using bioleaching and followed by sulfide precipitation. Chemosphere 2017, 185, 1189–1196. [Google Scholar] [CrossRef]
- Ghassa, S.; Abdollahi, H.; Najafi, E.; Boroumand, Z.; Panda, S.; Akcil, A. A Comparative Assessment on the Effect of Different Supplemental Iron Sources on the Bio-dissolution of Zn, Pb, Cd, and As from a High-grade Zn-Pb Ore. Min. Metall. Explor. 2019, 36, 363–1374. [Google Scholar] [CrossRef]
Figure 1.
Copper smelter flue dust size distribution.

Figure 2.
XRD diffractogram of copper smelter flue dust.

Figure 3.
The microwave-leaching set-up (1: microwave chamber; 2: Teflon reactor; 3: controller; 4: mixer; 5: condenser reflux).
Figure 3.
The microwave-leaching set-up (1: microwave chamber; 2: Teflon reactor; 3: controller; 4: mixer; 5: condenser reflux).

Figure 4.
Predicted vs. actual plots for copper recovery.

Figure 5.
Effect of sulfuric acid concentration (a), solid content (b), microwave power (c), HNO3 concentration (d) and process time (e) on Cu recovery (other parameters are held at center level).
Figure 5.
Effect of sulfuric acid concentration (a), solid content (b), microwave power (c), HNO3 concentration (d) and process time (e) on Cu recovery (other parameters are held at center level).

Figure 6.
The solid content-H2SO4 concentration (a) and process time-solid content (b) interactions (other parameters are held at center).
Figure 6.
The solid content-H2SO4 concentration (a) and process time-solid content (b) interactions (other parameters are held at center).

Figure 7.
Effect of sulfuric acid concentration (a), solid content (b), microwave power (c), HNO3 concentration (d) and process time (e) on Zn recovery (other parameters are held at center level).
Figure 7.
Effect of sulfuric acid concentration (a), solid content (b), microwave power (c), HNO3 concentration (d) and process time (e) on Zn recovery (other parameters are held at center level).

Figure 8.
The Microwave power-solid content (a) and HNO3 concentration-microwave power (b) interactions (other parameters are held at center level).
Figure 8.
The Microwave power-solid content (a) and HNO3 concentration-microwave power (b) interactions (other parameters are held at center level).

Figure 9.
Leaching agent temperature fluctuation during microwave irradiation with 1000 W power.

Figure 10.
Copper extraction (a) and plot of Kt versus time for copper leaching in presence and absence of microwave irradiation (b).
Figure 10.
Copper extraction (a) and plot of Kt versus time for copper leaching in presence and absence of microwave irradiation (b).


Figure 11.
XRD diffractogram for microwave leaching (a) and non-microwave leaching (b) residuals.


Figure 12.
Product layer covers the surface and prevent liquid access to surface in convection-leaching (a); The temperature gradient on liquid film causes a mass transfer and reduce the ash layer formation in microwave-leaching (b).
Figure 12.
Product layer covers the surface and prevent liquid access to surface in convection-leaching (a); The temperature gradient on liquid film causes a mass transfer and reduce the ash layer formation in microwave-leaching (b).


Table 1.
Chemical composition of copper smelting dust.
| SO3 (%) | Pb (%) | SiO2 (%) | Na2O (%) | Al2O3 (%) | Fe2O (%) | CaO (%) | As (%) | Cl (%) |
| 14.69 | 13.13 | 7.56 | 6.55 | 2.73 | 2.25 | 1.41 | 0.92 | 0.77 |
| K2O (%) | Sn (%) | Sb (%) | Bi (%) | Ni (%) | I (%) | Ag (ppm) | Cd (ppm) | Co (ppm) |
| 0.52 | 0.38 | 0.29 | 0.23 | 0.13 | 0.11 | 84.80 * | 55.65 * | 33.40 * |
* Measured with AAS.
Table 2.
The examined parameters and their level.
| Parameter | Levels | ||||
|---|---|---|---|---|---|
| 1 | 2 | 3 | 4 | 5 | |
| H2SO4 concentration (g/L) | 50 | 100 | 150 | 200 | 250 |
| Solid content (%) | 5 | 10 | 15 | 20 | 25 |
| Oxidant concentration (g/L) | 10 | 15 | 20 | 25 | 30 |
| Microwave power (W) | 200 | 400 | 600 | 800 | 1000 |
| Leaching time (min) | 1.5 | 6 | 10.5 | 15 | 19.5 |
Table 3.
Kinetics models suggested for leaching process (X = fraction reacted, Kt = kinetic constant, t = time).
Table 3.
Kinetics models suggested for leaching process (X = fraction reacted, Kt = kinetic constant, t = time).
| Model | Mechanism | References |
|---|---|---|
| Chemical reaction control | [28] | |
| Diffusion control | [28] | |
| Surface chemical reaction by shrinking core model | [29] | |
| Diffusion through product layer | [30] | |
| Diffusion through a porous product layer by shrinking core model | [31] | |
| Interfacial transfer and diffusion across the product layer | [32] | |
| Diffusion of hydrogen ions through a product layer by shrinking core model | [33] | |
| Mixed control model by shrinking core model (diffusion control; chemical reaction control) | [34] | |
| Mixed control model (surface reaction control; and diffusion through sulfur layer) | [35] | |
| Mixed control model based on reactant concentrations | [36] |
Table 4.
Effect of oxidizing agent on copper recovery from CSD.
| No. | H2SO4 Concertation (g/L) | Oxidizing Agent | Oxidizing Agent Concertation (g/L) | Cu Recovery (%) |
|---|---|---|---|---|
| 1 | 150 | - | - | 17.97 |
| 2 | 300 | - | - | 22.24 |
| 3 | 150 | HNO3 | 10 | 76.77 |
| 4 | 150 | HNO3 | 30 | 90.36 |
Table 5.
Central composite experimental design and response values.
| Run | Sulfuric Acid Concentration (g/L) | Solid Content (%) | Microwave Power (W) | HNO3 Concertation (g/L) | Process Time (min) | Rcu (%) | Rzn (%) |
|---|---|---|---|---|---|---|---|
| A | B | C | D | E | - | - | |
| 1 | 100 | 10 | 400 | 15 | 15 | 32.70 | 98.82 |
| 2 | 200 | 10 | 400 | 15 | 6 | 25.55 | 80.37 |
| 3 | 100 | 20 | 400 | 15 | 6 | 20.88 | 84.16 |
| 4 | 200 | 20 | 400 | 15 | 15 | 25.92 | 80.96 |
| 5 | 100 | 10 | 800 | 15 | 6 | 25.23 | 85.28 |
| 6 | 200 | 10 | 800 | 15 | 15 | 34.29 | 81.11 |
| 7 | 100 | 20 | 800 | 15 | 15 | 21.84 | 87.08 |
| 8 | 200 | 20 | 800 | 15 | 6 | 23.85 | 88.33 |
| 9 | 100 | 10 | 400 | 25 | 6 | 24.41 | 86.36 |
| 10 | 200 | 10 | 400 | 25 | 15 | 33.94 | 88.81 |
| 11 | 100 | 20 | 400 | 25 | 15 | 21.42 | 76.69 |
| 12 | 200 | 20 | 400 | 25 | 6 | 22.99 | 74.99 |
| 13 | 100 | 10 | 800 | 25 | 15 | 29.66 | 69.73 |
| 14 | 200 | 10 | 800 | 25 | 6 | 28.63 | 70.66 |
| 15 | 100 | 20 | 800 | 25 | 6 | 21.60 | 70.37 |
| 16 | 200 | 20 | 800 | 25 | 15 | 28.87 | 70.76 |
| 17 | 50 | 15 | 600 | 20 | 10.5 | 21.40 | 69.05 |
| 18 | 250 | 15 | 600 | 20 | 10.5 | 39.35 | 74.91 |
| 19 | 150 | 5 | 600 | 20 | 10.5 | 34.82 | 78.51 |
| 20 | 150 | 25 | 600 | 20 | 10.5 | 21.73 | 74.94 |
| 21 | 150 | 15 | 200 | 20 | 10.5 | 22.18 | 86.16 |
| 22 | 150 | 15 | 1000 | 20 | 10.5 | 23.61 | 89.74 |
| 23 | 150 | 15 | 600 | 10 | 10.5 | 22.68 | 85.50 |
| 24 | 150 | 15 | 600 | 30 | 10.5 | 25.38 | 89.58 |
| 25 | 150 | 15 | 600 | 20 | 1.5 | 19.97 | 86.39 |
| 26 | 150 | 15 | 600 | 20 | 19.5 | 27.27 | 86.51 |
| 27 | 150 | 15 | 600 | 20 | 10.5 | 24.62 | 89.57 |
| 28 | 150 | 15 | 600 | 20 | 10.5 | 24.68 | 82.82 |
| 29 | 150 | 15 | 600 | 20 | 10.5 | 24.84 | 88.07 |
| 30 | 150 | 15 | 600 | 20 | 10.5 | 24.43 | 81.85 |
| 31 | 150 | 15 | 600 | 20 | 10.5 | 22.80 | 87.04 |
| 32 | 150 | 15 | 600 | 20 | 10.5 | 23.56 | 84.88 |
Table 6.
Analysis of variance for copper recovery.
| Source | Sum of Squares | Degree of Freedom | Mean Square | F-Value | p-Value | Explanation |
|---|---|---|---|---|---|---|
| Model | 1.111 × 10⁻³ | 9 | 1.235 × 10⁻⁴ | 26.15 | <0.0001 | Significant |
| A | 2.858 × 10⁻⁴ | 1 | 2.858 × 10⁻⁴ | 60.55 | <0.0001 | |
| B | 4.362 × 10⁻⁴ | 1 | 4.362 × 10⁻⁴ | 92.39 | <0.0001 | |
| C | 1.092 × 10⁻⁵ | 1 | 1.092 × 10⁻⁵ | 2.31 | 0.1425 | |
| D | 5.879 × 10⁻⁶ | 1 | 5.879 × 10⁻⁶ | 1.25 | 0.2765 | |
| E | 2.187 × 10⁻⁴ | 1 | 2.187 × 10⁻⁴ | 46.32 | <0.0001 | |
| BC | 1.562 × 10⁻⁵ | 1 | 1.562 × 10⁻⁵ | 3.31 | 0.0825 | |
| CD | 1.986 × 10⁻⁵ | 1 | 1.986 × 10⁻⁵ | 4.21 | 0.0523 | |
| A2 | 7.701 × 10⁻⁵ | 1 | 7.701 × 10⁻⁵ | 16.31 | 0.0005 | |
| B2 | 4.885 × 10⁻⁵ | 1 | 4.885 × 10⁻⁵ | 10.35 | 0.0040 | |
| Residual | 4.721 × 10⁻⁴ | 22 | 4.721 × 10⁻⁶ | |||
| Lack of Fit | 9.387 × 10-−5 | 17 | 9.387 × 10⁻⁵ | 2.76 | 0.1324 | Not-significant |
| Pure Error | 9.987 × 10⁻⁶ | 5 | 9.987 × 10⁻⁶ | |||
| Total | 1.215 × 10⁻³ | 31 |
Table 7.
Analysis of variance for zinc recovery.
| Source | Sum of Squares | Degree of Freedom | Mean Square | F-Value | p-Value | Explanation |
|---|---|---|---|---|---|---|
| Model | 1105.92 | 9 | 122.88 | 5 | 0.001 | Significant |
| A | 4.84 | 1 | 4.84 | 0.2 | 0.6615 | |
| B | 50.82 | 1 | 50.82 | 2.07 | 0.1644 | |
| C | 68.90 | 1 | 68.90 | 2.81 | 1081 | |
| D | 201.55 | 1 | 201.55 | 8.21 | 0.0090 | |
| E | 7.79 | 1 | 7.79 | 0.32 | 0.5790 | |
| BC | 139.94 | 1 | 139.94 | 5.70 | 0.0260 | |
| CD | 114.61 | 1 | 114.61 | 4.67 | 0.0419 | |
| A2 | 379.85 | 1 | 379.85 | 15.47 | 0.0007 | |
| B2 | 169.10 | 1 | 169.10 | 6.88 | 0.0155 | |
| Residual | 540.35 | 22 | 24.56 | |||
| Lack of Fit | 494.19 | 17 | 29.07 | 3.15 | 0.1045 | Not-significant |
| Pure Error | 46.17 | 5 | 9.23 | |||
| Total | 1646.27 | 31 |
© 2019 by the authors. Licensee MDPI, Basel, Switzerland. This article is an open access article distributed under the terms and conditions of the Creative Commons Attribution (CC BY) license (http://creativecommons.org/licenses/by/4.0/).
Share and Cite
MDPI and ACS Style
Sabzezari, B.; Koleini, S.M.J.; Ghassa, S.; Shahbazi, B.; Chehreh Chelgani, S. Microwave-Leaching of Copper Smelting Dust for Cu and Zn Extraction. Materials 2019, 12, 1822. https://doi.org/10.3390/ma12111822
AMA Style
Sabzezari B, Koleini SMJ, Ghassa S, Shahbazi B, Chehreh Chelgani S. Microwave-Leaching of Copper Smelting Dust for Cu and Zn Extraction. Materials. 2019; 12(11):1822. https://doi.org/10.3390/ma12111822
Chicago/Turabian StyleSabzezari, Behrouz, Seyed Mohammad Javad Koleini, Sina Ghassa, Behzad Shahbazi, and Saeed Chehreh Chelgani. 2019. "Microwave-Leaching of Copper Smelting Dust for Cu and Zn Extraction" Materials 12, no. 11: 1822. https://doi.org/10.3390/ma12111822
Note that from the first issue of 2016, this journal uses article numbers instead of page numbers. See further details here.