1. Introduction
Due to their physicochemical properties, wide-gap semiconductor metal oxides, such as SnO
2, ZnO, WO
3, In
2O
3, are widely used as materials for resistive-type gas sensors. Among them, tin dioxide has the greatest practical application. SnO
2 is a wide-gap n-type semiconductor (
Eg = 3.6 eV at 300 K [
1]) which is effectively used to detect toxicity reducing gases CO, H
2S, NH
3, as well as volatile organic compounds (VOCs). The main requirements for the sensor material are selectivity, high sensitivity and thermal stability. The latter property is extremely important for the long-term operation of the sensor, as well as for measurements in a dynamic temperature mode (frequently used in e-nose devices), which allows an increase of the sensor signal due to more effective desorption of the products of the redox reaction from the surface of the semiconductor oxide [
2,
3,
4,
5]. In order to avoid sintering the nanoparticles of the sensor material when operating in such temperature conditions, it is necessary to carry out post-synthetic annealing at a temperature exceeding the expected maximum operating temperature during sensor functioning. However, the specific surface area of inorganic materials decreases by ~30%–40% with an increase in heat treatment temperature for every 100 °C [
6,
7]. It is possible to prevent aggregation and the sintering of nanoparticles by synthesizing SnO
2 in a polymer matrix, or using surfactants [
8,
9], as well as with the addition of metal oxides (Mn, Mg, Co, Ni, Zn, Ca, Ba, V, Cu, etc.) and non-metals (P, B, S). A uniform distribution of such modifiers over tin dioxide surface reduces the surface energy at SnO
2 grain boundaries and prevent the growth of particles during heat treatment [
10,
11,
12]. However, the introduction of the second component inevitably leads to a change in the type and concentration of active centers on the surface of SnO
2, which affects the sensor properties. To reduce the likelihood of side reactions, it is preferable to select a modifier with low own catalytic activity. This requirement is met by amorphous SiO
2, which is also characterized by high thermal stability (Tamman temperature is 714 °C) [
13]. In a number of studies on the synthesis of SnO
2/SiO
2 composites of various morphologies, a decrease in the growth rate and stabilization of SnO
2 microstructure parameters, as well as an increase in the sensor signal to acetone, ethanol, and CO in dry and moist air were observed [
14,
15,
16,
17,
18,
19,
20,
21]. The decisive factor in the synthesis of such composites is the selection of the optimal Si:Sn ratio. Since silicon dioxide is a dielectric, its excessive content can lead to a disruption of the intergranular conductivity of SnO
2.
The aims of this work were to synthesize SnO
2/SiO
2 nanocomposites that are resistant to sintering during long-term high-temperature annealing, to determine the Si:Sn ratio optimal for sensor measurements, to study the effect of silicon dioxide on the microstructure parameters and the active sites on the tin dioxide surface; and, finally, to reveal the influence of these parameters on the sensor properties of SnO
2/SiO
2 nanocomposites in CO detection in dry and humid air. The latter is of particular interest, since our previous work showed the efficiency of using SiO
2 layer as a passive filter to reduce the negative effect of humidity on the SnO
2 sensor properties toward CO [
22].
3. Results and Discussion
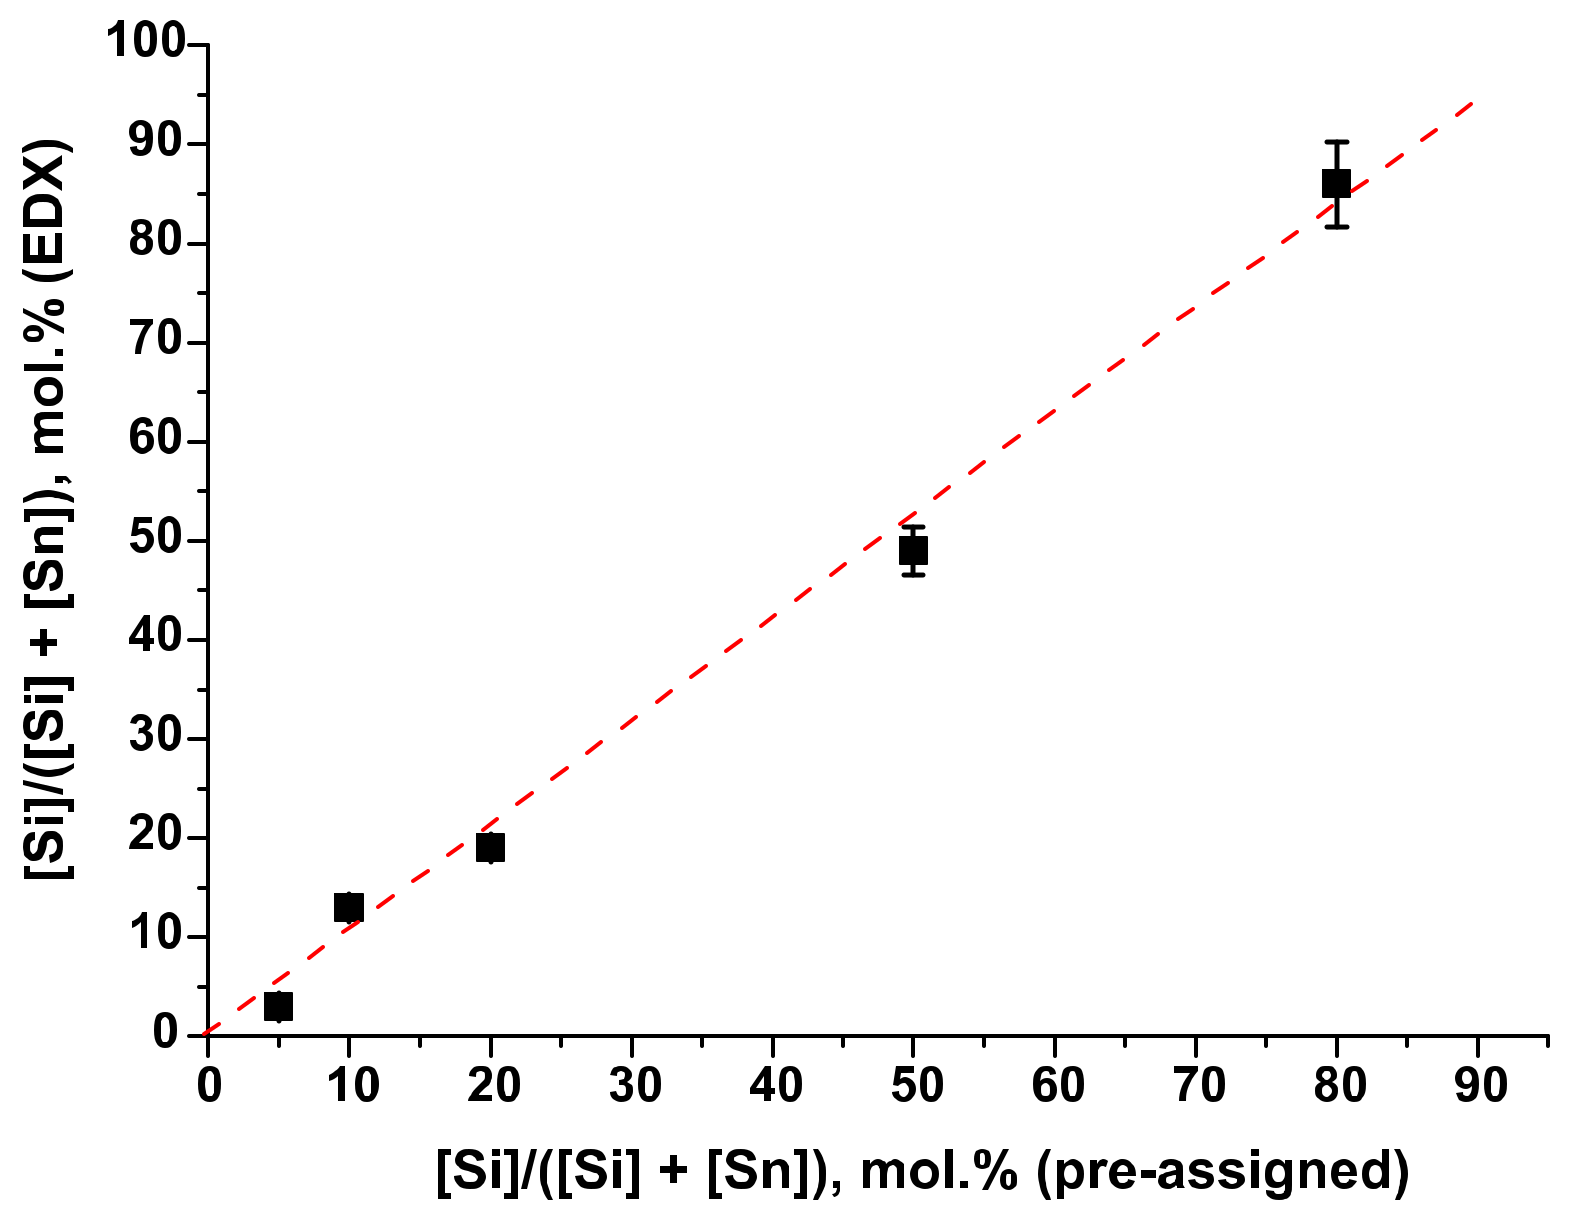
The composition of SnO
2/SiO
2 samples determined by the EDX method is in good agreement with the Si/Sn ratio pre-assigned during the synthesis (
Figure 2,
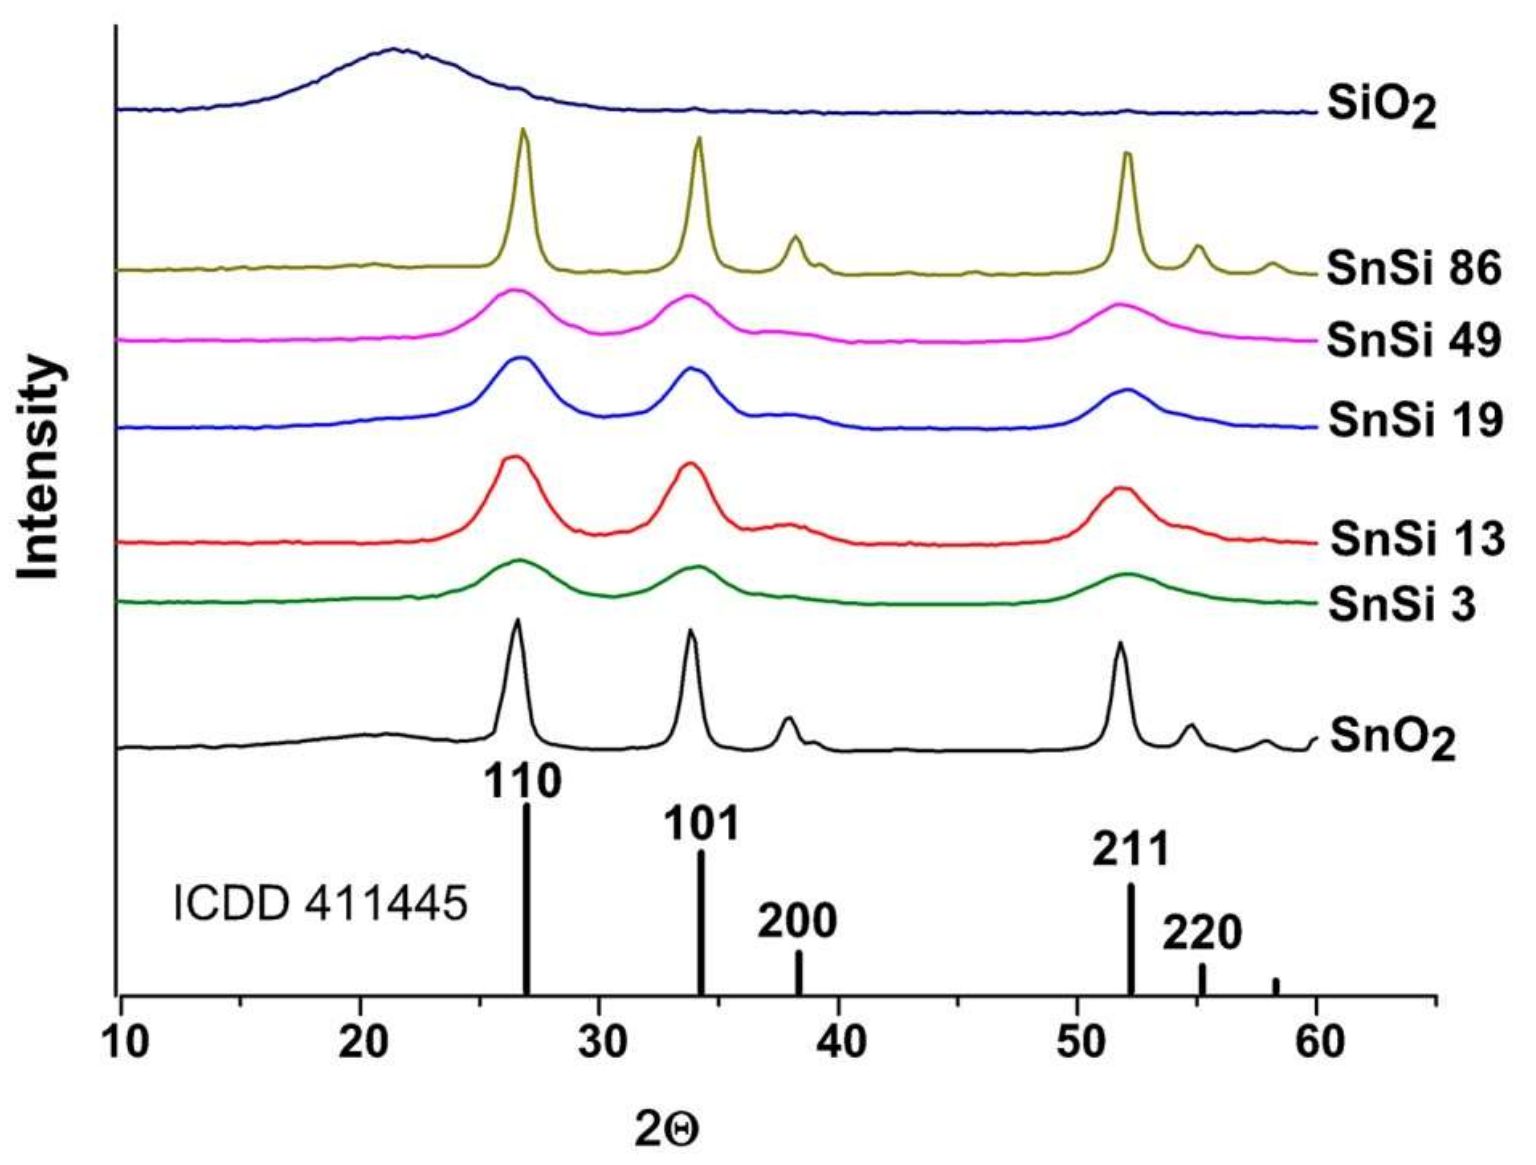
Table 1). X-ray diffraction patterns of SnO
2/SiO
2 nanocomposites (SnSi3–SnSi86 samples) contain only reflections corresponding to the SnO
2 phase with a cassiterite structure (ICDD 41-1445). Silicon dioxide obtained by the hydrothermal method is X-ray amorphous (
Figure 3). Crystalline phases of tin silicates are not formed under synthesis conditions. When silicon is introduced into nanocomposites, the diffraction reflections of the tin dioxide phase are broadened, which indicates a decrease in the size of the SnO
2 crystal grains. Under isothermal annealing, the presence of impurities on the surface of growing crystallites slows down their growth rate due to the so-called Smith-Zener diffusion drag [
23], according to which the maximum crystal grain size is determined by the volume fraction and particle size of another phase (including amorphous) segregated on the surface growing crystallites.
Since the key stages in the interaction of the sensor material with the gas being determined are adsorption and redox reactions on the surface of the semiconductor oxide, the high value of the specific surface area is the most important characteristic of the sample. With an increase in the annealing temperature from 300 to 600 °C, the specific surface area of SnO
2 decreases from 90–100 to 15–20 m
2/g, respectively [
24]. At the same time a high annealing temperature allows one to obtain thermally stable sensor materials for which long-term measurements don’t lead to sintering and coarsening of nanoparticles. The tendency to a sharp decrease in the specific surface area of pure SnO
2 is also retained in the case of hydrothermal treatment of the oxide before annealing.
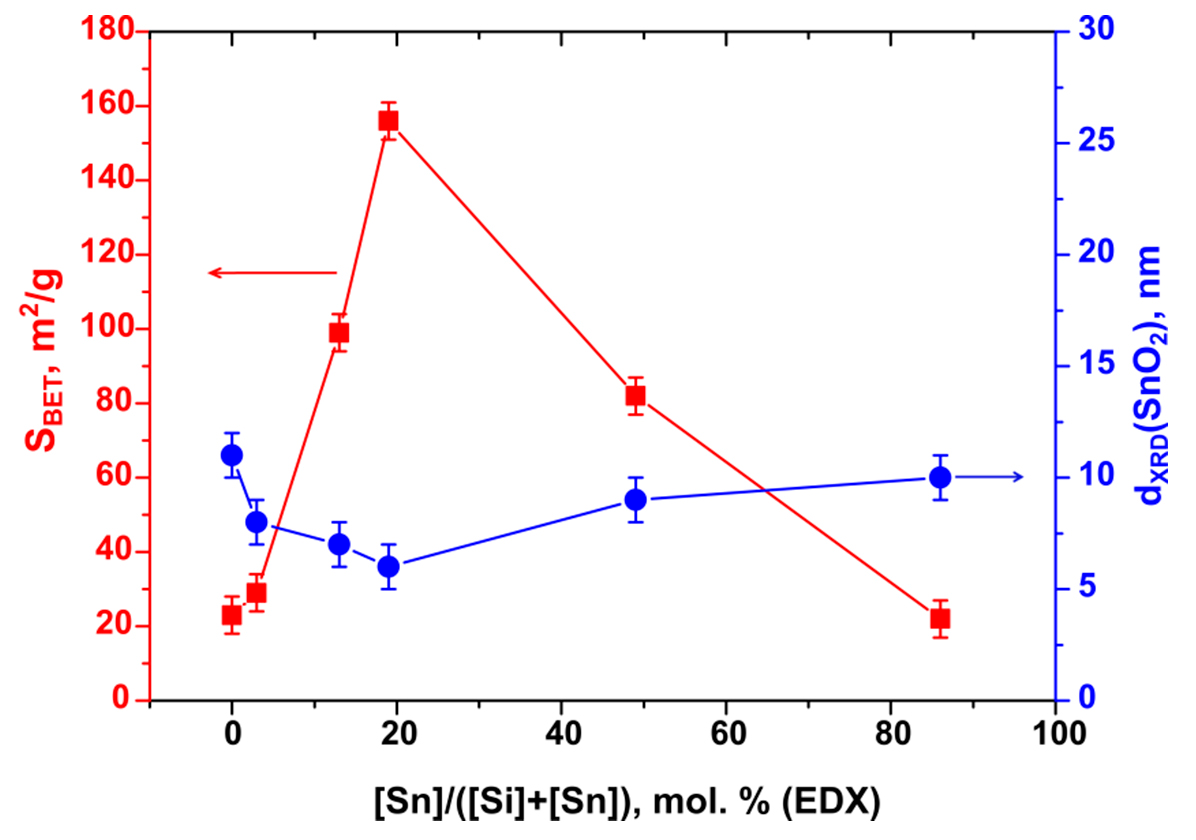
From the SnO
2 crystallite size calculated by Sherer formula it can be concluded that the addition of SiO
2 reduces the growth rate of tin dioxide nanocrystals at high annealing temperature. With the growth of silicon content in SnO
2/SiO
2 composites up to [Si]/([Sn] + [Si]) = 19 mol.%, an increase in the specific surface area is observed. With a further increase in [Si]/([Sn] + [Si]) ratio to 49 and 86 mol.% specific surface area of nanocomposites decreases sharply and in the latter case is almost equal to the value obtained for pure SnO
2 (
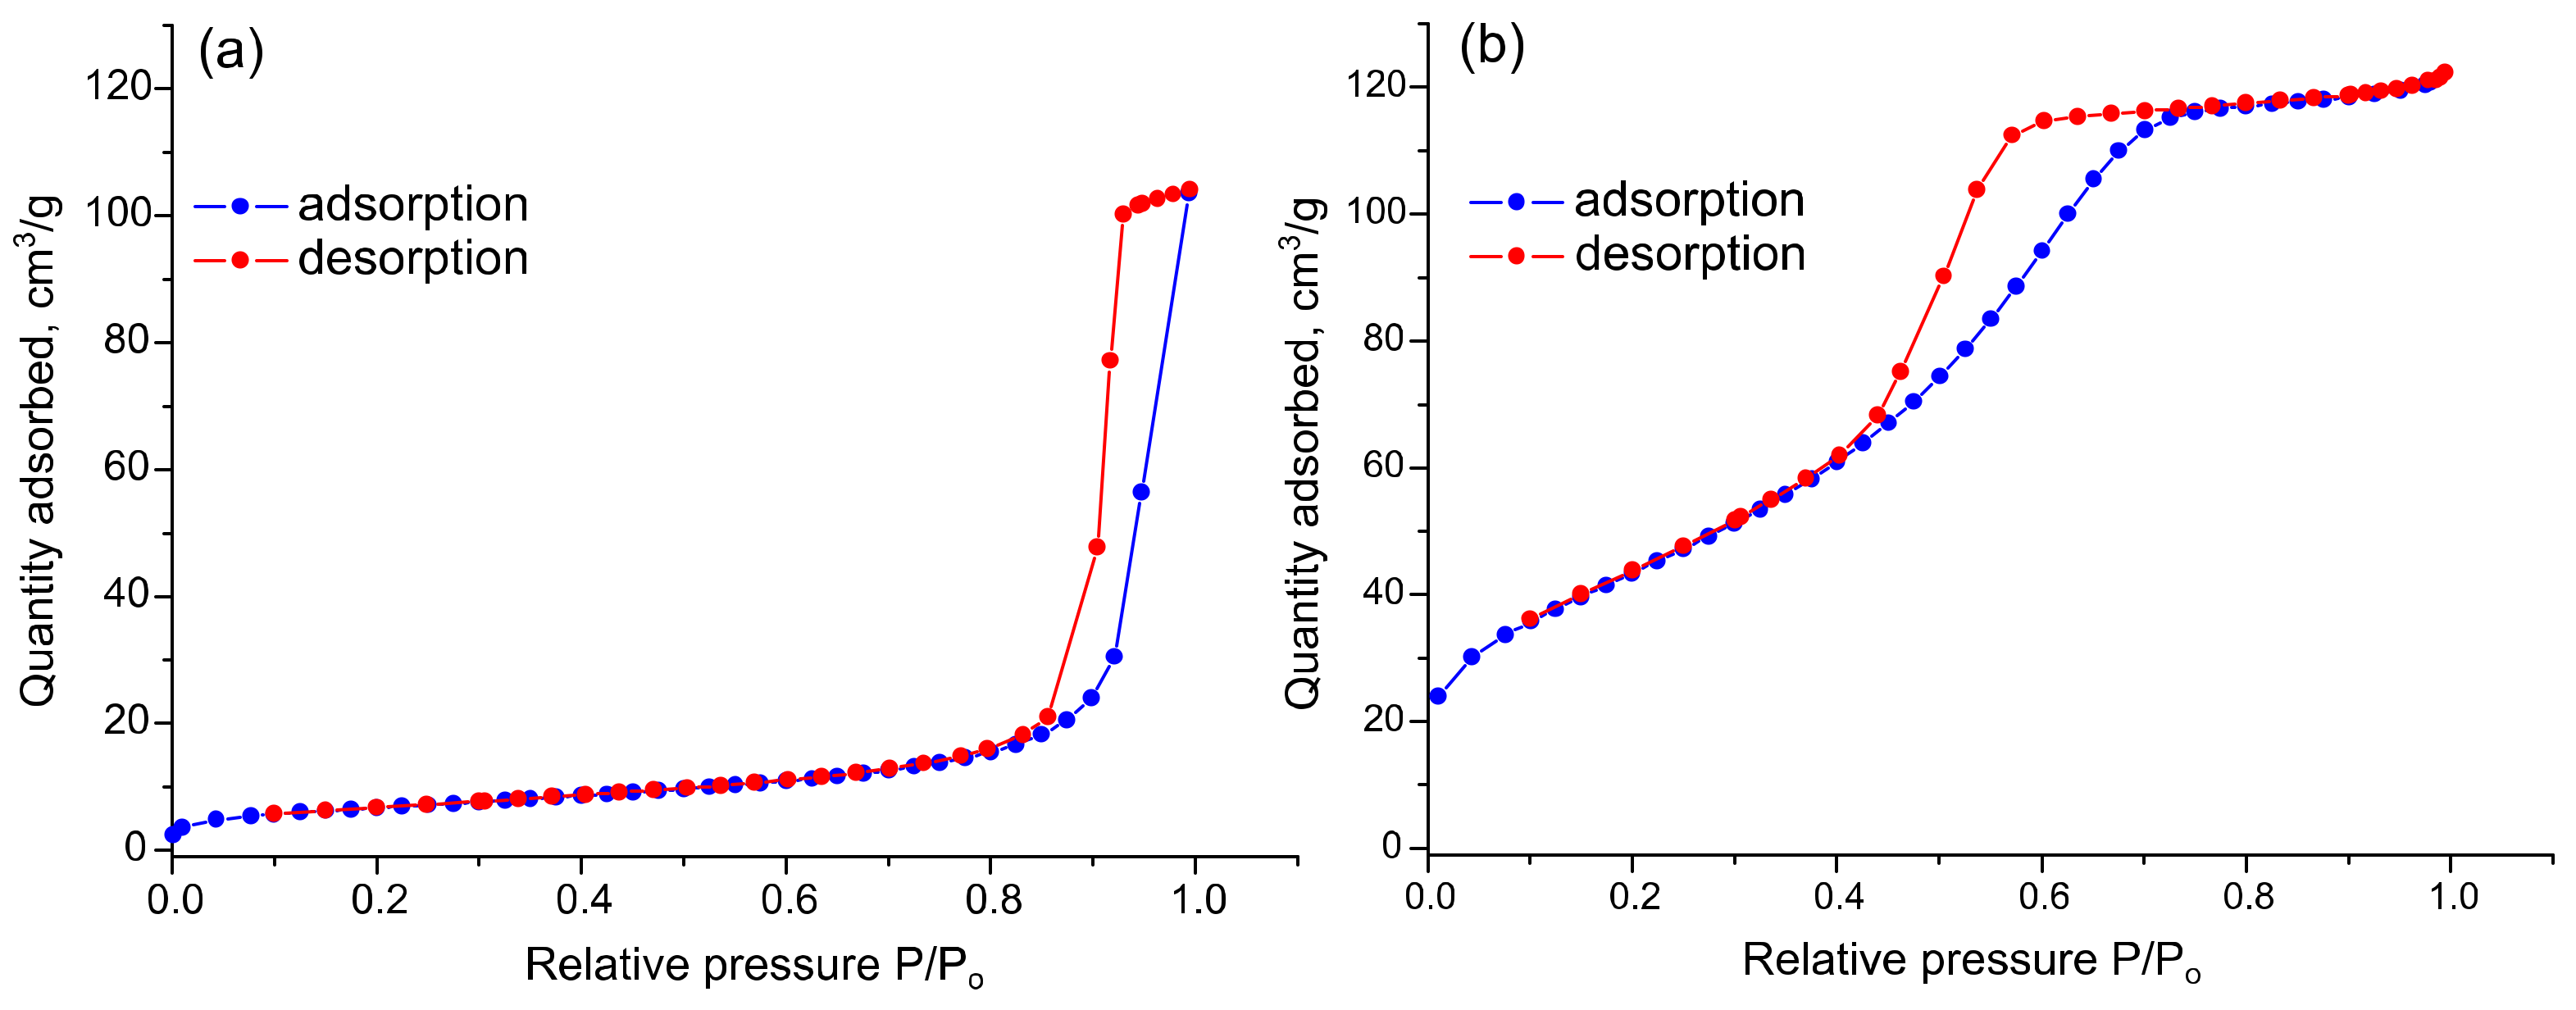
Figure 4). The N
2 adsorption-desorption curves for pure SnO
2 (
Figure 5a) and SnSi19 nanocomposite (
Figure 5b) can be attributed to type V and type IV, respectively. In both cases the hysteresis is observed, that indicates the irreversible capillary condensation. According to the IUPAC classification, in the case of SnO
2, the hysteresis is of the H1 type, which is characteristic of a porous, spatially ordered structure that has minimal connectivity between adjacent pores. The hysteresis of the N
2 adsorption-desorption curve of the SnSi19 nanocomposite is of the H2a type that indicates a more complex structure of mesopores characteristic for silica gels.
To explain the observed dependence of microstructure parameters on the composition of SnO2/SiO2 nanocomposites, we consider the process of nucleation of SiO2 on the surface of a previously formed solid phase of β-stannic acid. According to the classical nucleation theory, the work of heterogeneous nucleation is always less than the work of the formation of nuclei of a new phase through a homogeneous mechanism. Consequently, the nucleation becomes possible at low supersaturations. Thus, in the range of [Si]/([Sn] + [Si]) = 3–19 mol.%, the concentration of Si(IV) in the reaction medium is low and the supersaturation required for the formation of SiO2 nuclei in the volume of the reaction mixture is not reached. As a result, in the process of hydrothermal treatment SiO2 is formed by the mechanism of heterogeneous nucleation on the surface of SnO2 nanoparticles thus preventing their coarsening during subsequent heat treatment. With an increase in the concentration of silica precursor in the synthesis of SnSi49 and SnSi86 samples, the supersaturation necessary for homogeneous formation of SiO2 nuclei in the volume of the reaction mixture seems to be achieved. Thus, the number of SiO2 nuclei, covering the surface of SnO2, nanoparticles decreases. As a result, there is a sharp decrease in the value of the specific surface area for the nanocomposites with [Si]/([Sn] + [Si]) > 19 mol.%. The specific surface area of pure SiO2 obtained by the hydrothermal method from hydrolyzed tetraethoxysilan was 327 ± 5 m2/g. Thus, the sintering of SnO2 nanoparticles is responsible for reducing the specific surface area of nanocomposites. Formation of SiO2 fragments on the surface of tin dioxide grains by heterogeneous nucleation successfully withstands this process.
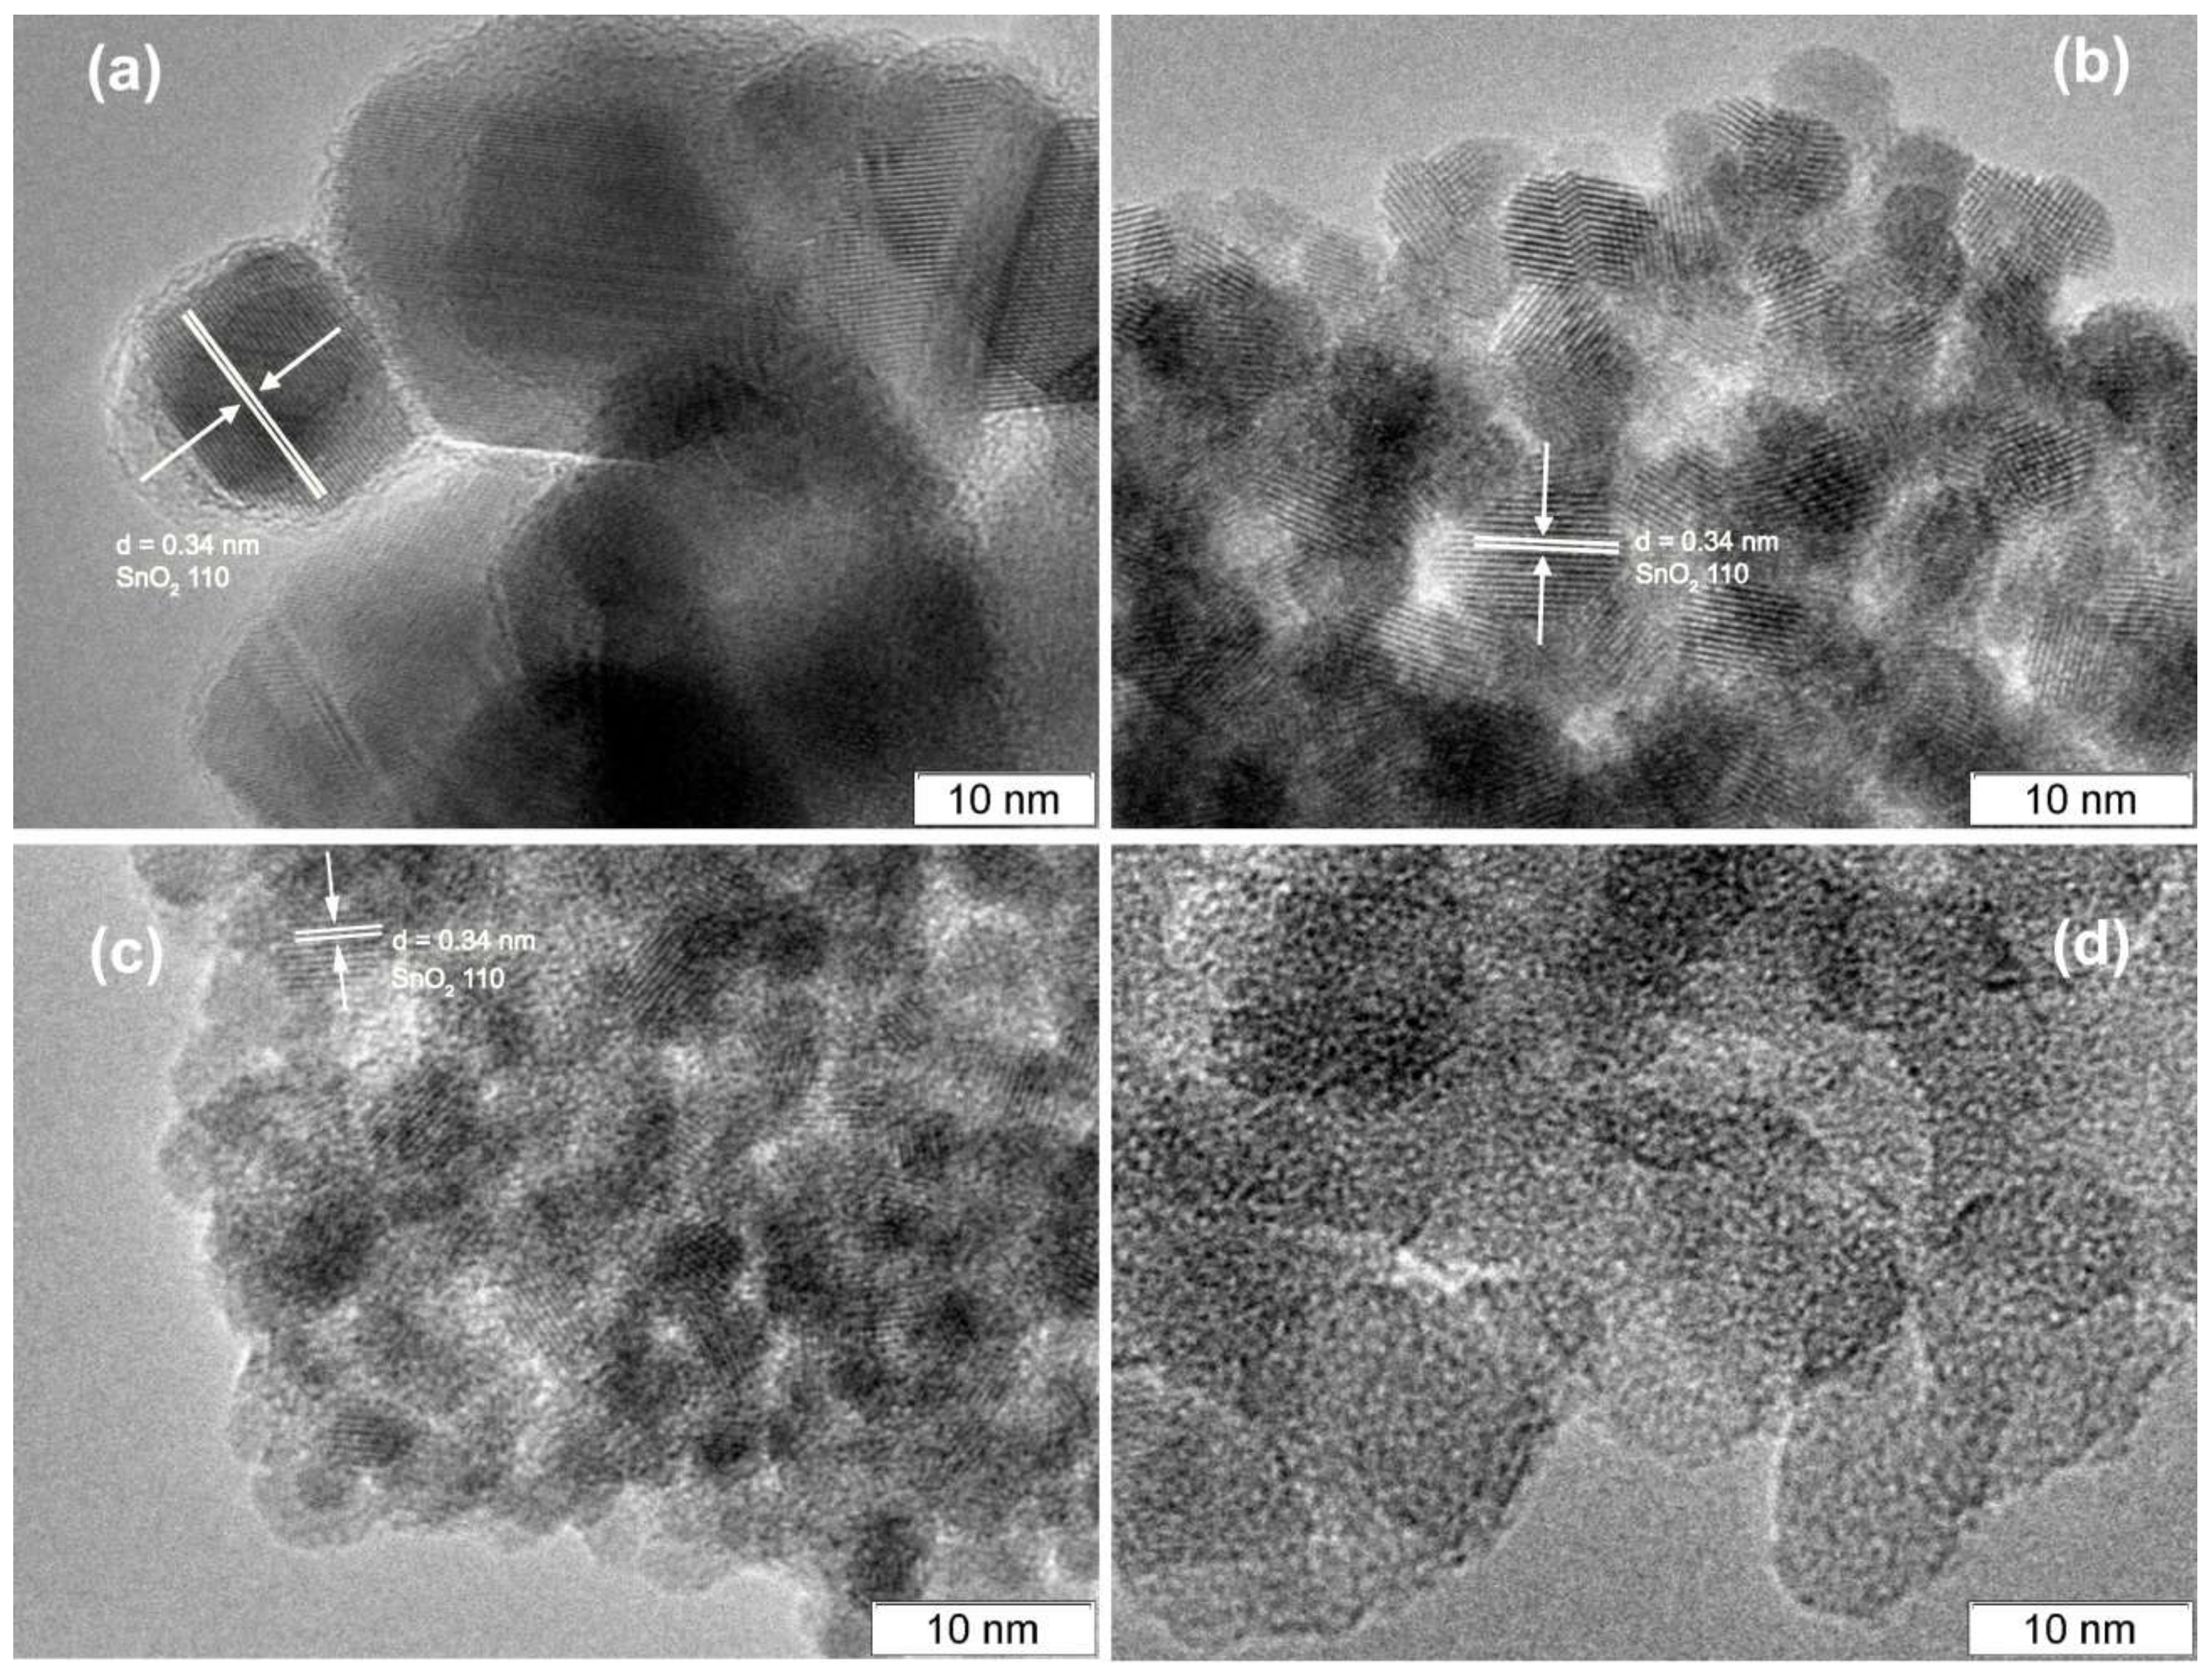
According to the HREM image of unmodified SnO
2 (
Figure 6a), it can be concluded that tin dioxide consists mainly of large crystalline nanoparticles, while SiO
2 is completely amorphous (
Figure 6d). On the images of SnSi13 and SnSi49 samples (
Figure 6b,c) one can easily highlight the crystalline phase of SnO
2 and amorphous silica particles which are distributed fairly evenly on the surface of the semiconductor oxide. Separate large SiO
2 aggregates are not observed even for the SnSi49 sample. The size of the crystalline particles in the composite samples decreases as compared to pure SnO
2 and the proportion of the amorphous silica phase increases from SnSi13 to SnSi49. With an increase in the silicon concentration, the resistance of nanocomposites growths greatly due to an increase in the fraction of the dielectric SiO
2 (
Table 1). The resistance values for SnSi49 and SnSi86 samples exceed 10
11 Ohm even at high temperature (400 °C), which makes them unsuitable for use as sensor materials.
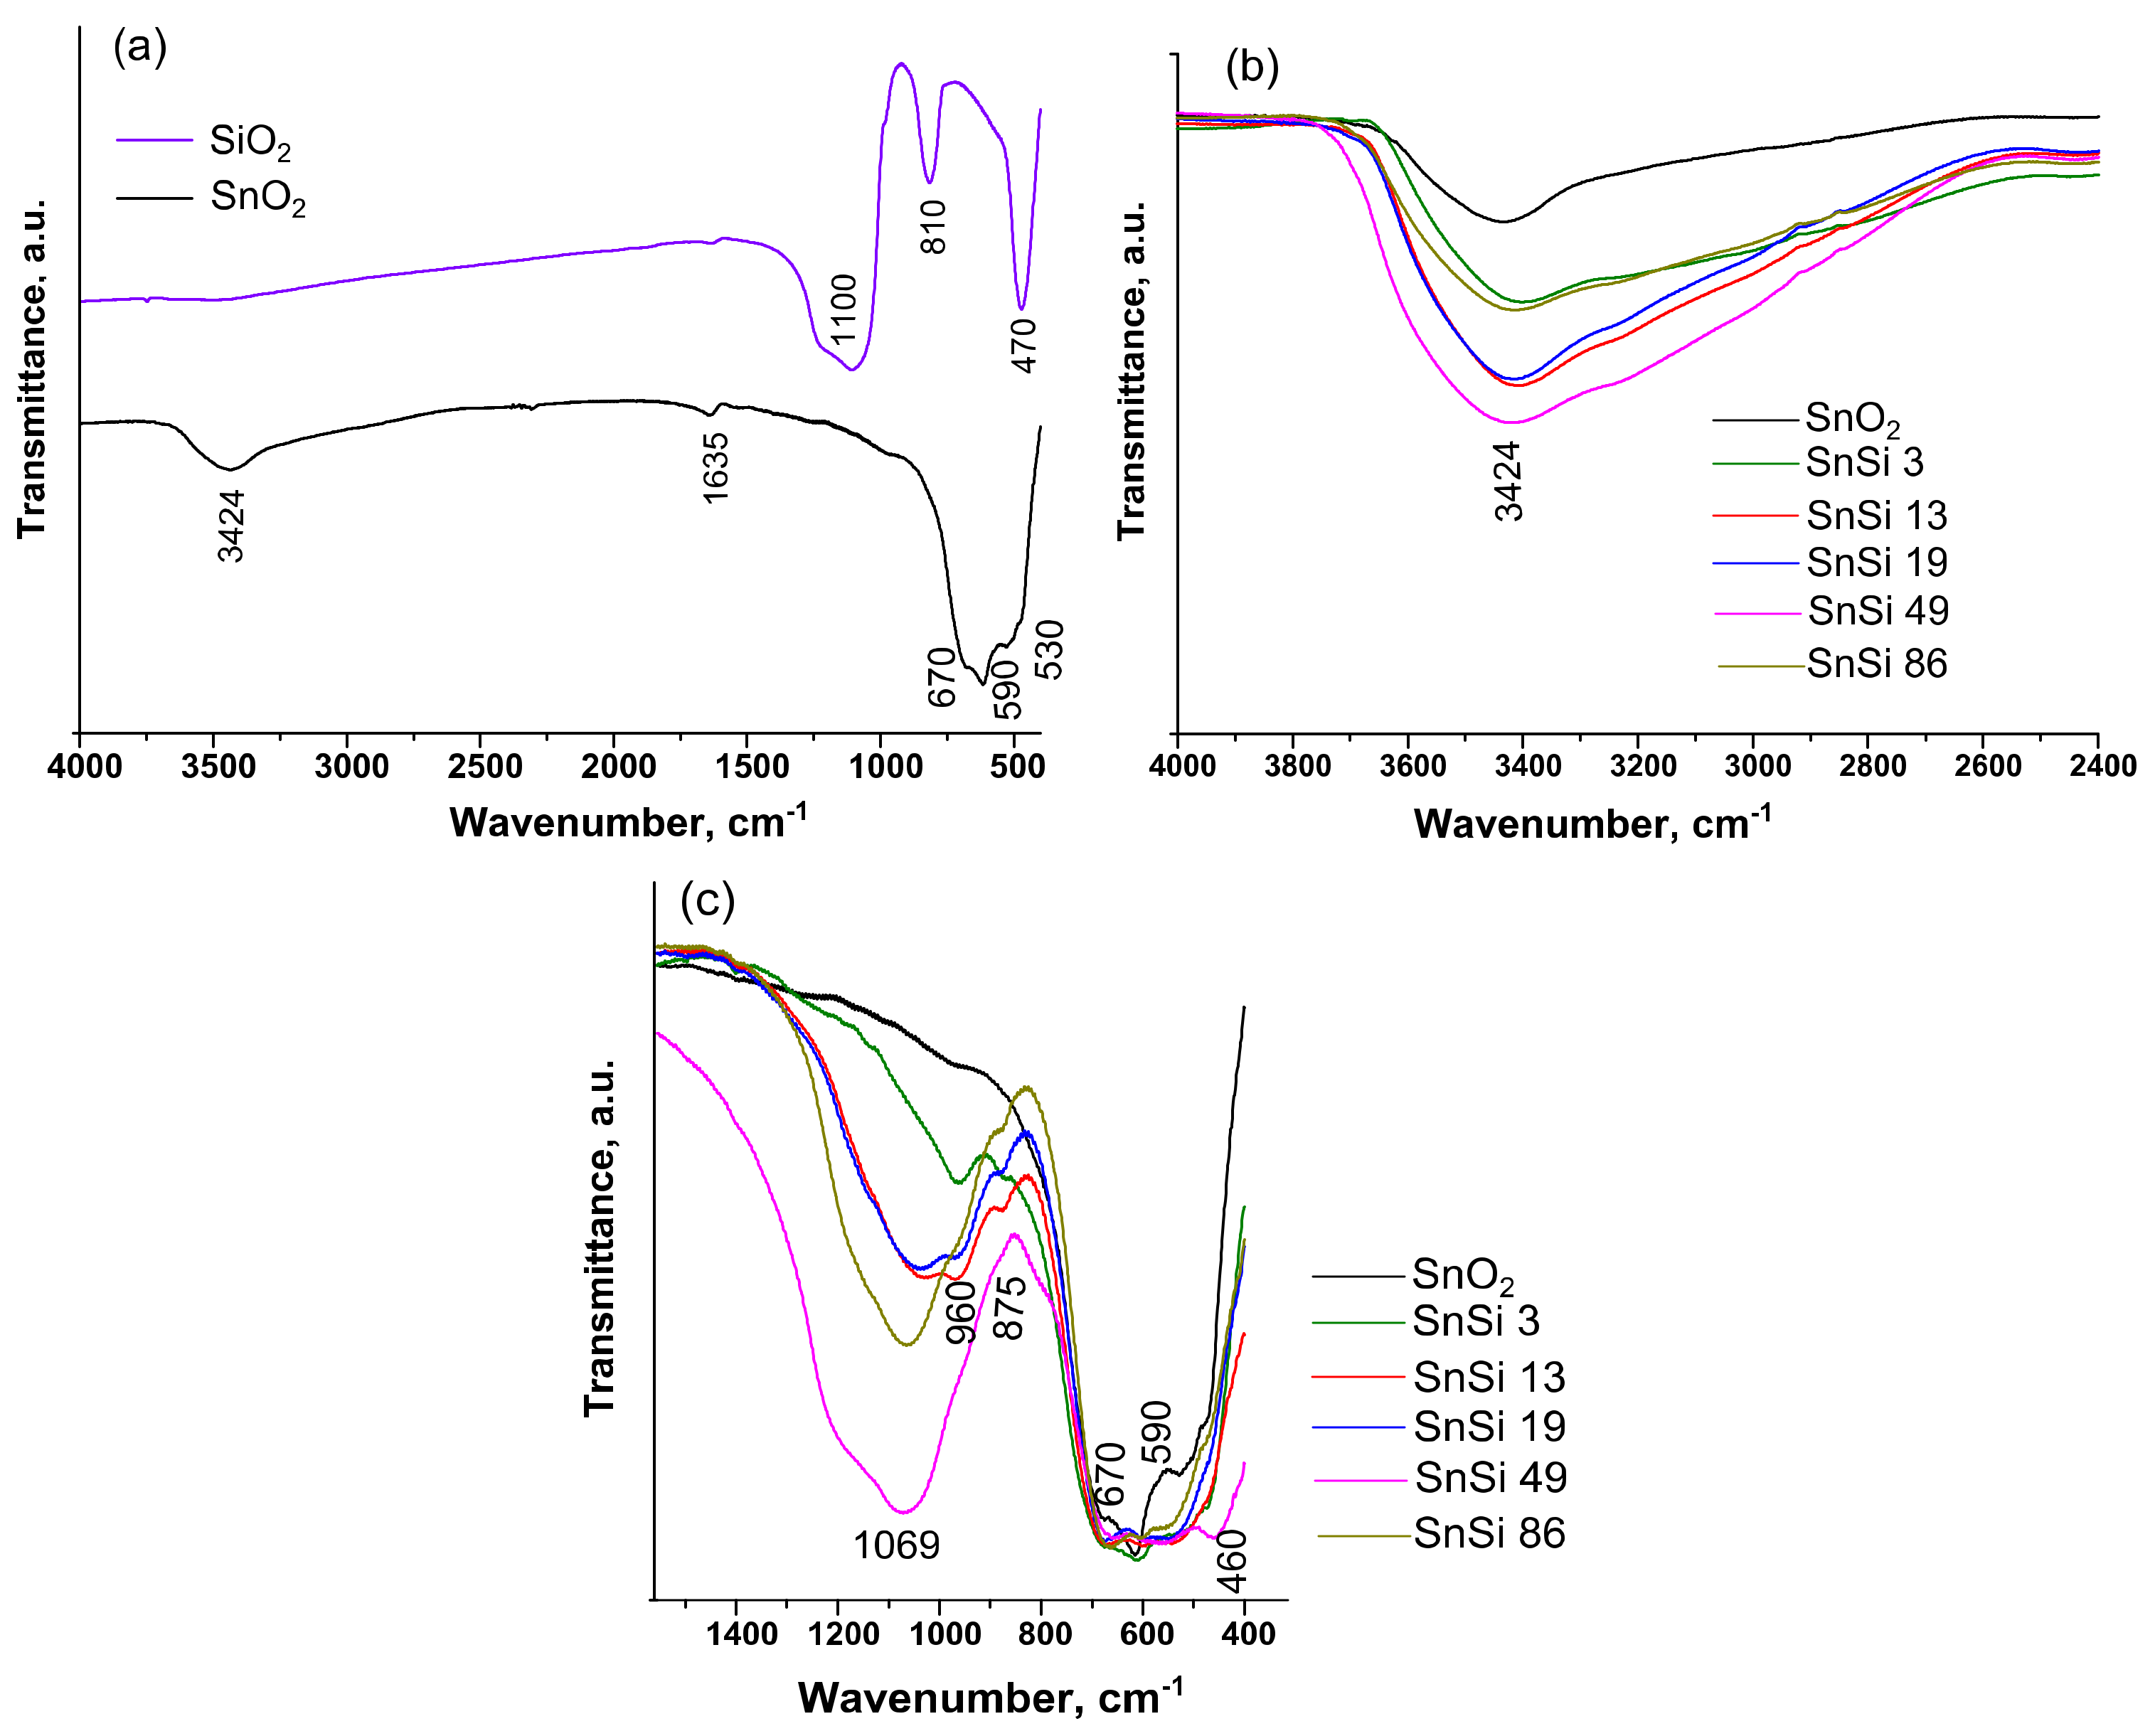
FTIR spectroscopy was used to investigate how the introduction of silicon dioxide affects the composition of active groups on SnO
2 surface. The IR of unmodified tin dioxide (
Figure 7a) contains stretching vibrations of O–H groups (3650–2500 cm
−1), physically adsorbed water (1635 cm
−1), antisymmetric vibrations of Sn–O–Sn bridge groups (670 cm
−1), terminal Sn–OH bonds (590 cm
−1) and symmetric vibrations of Sn–O (530 cm
−1) [
25]. On the IR spectrum of pure SiO
2 (
Figure 7a), the oscillations of hydroxyl groups and adsorbed H
2O are practically absent. The broad absorption band with a maximum at 1100 cm
−1 is due to the superposition of antisymmetric vibrations of Si–O–Si bridge bonds and vibrations of silanol groups (1250–870 cm
−1). The spectrum also contains absorption bands corresponding to the symmetric vibrations of Si–O–Si (810 cm
−1) and to the deformation vibrations of Si–O (460 cm
−1) [
26]. To estimate the change in the concentration of surface groups, the IR spectra of the composite samples were normalized to the intensity of Sn–O–Sn oscillation (670 cm
−1) (
Figure 7b,c). As the [Si]/([Sn] + [Si]) ratio increases from 3 to 49 mol.%, there is a consistent increase in the intensity of oscillations of surface hydroxyl and silanol groups. However, in the spectrum of SnSi86 sample, a noticeable decrease in the intensity of vibrations of O–H and Si–OH bonds occurs. Perhaps this is due to the condensation reaction between the silanol and hydroxyl groups on the surface of SnO
2:
This is due to the significantly larger number of formed SiO
2 particles. The spectra of SnSi3–SnSi19 samples contain the absorbance band at 960 cm
−1, corresponding to the antisymmetric vibrations of the [SiO
4] group associated with Sn
4+ (O
3Si–Sn) [
27]. The highest intensity of this absorption band is observed in the spectrum of the SnSi13 nanocomposite. This may correspond to the largest number of SiO
2 fragments formed on SnO
2 surface by heterogeneous nucleation. In the range of 700–400 cm
−1, the spectra of composite samples contain all the absorption bands corresponding to the vibrations of the surface groups of individual SnO
2 and SiO
2.
The main active groups on the SnO
2 surface involved in the redox reaction in the formation of a sensor signal are chemisorbed oxygen forms:
where CO
(gas) is CO molecule in the gas phase,
are different forms of chemisorbed oxygen, CO
2(gas) is a product of the oxidation of CO gas desorbed into the gas phase. The change in concentration of chemisorbed oxygen in nanocomposites relative to unmodified SnO
2 was investigated by the XPS method.
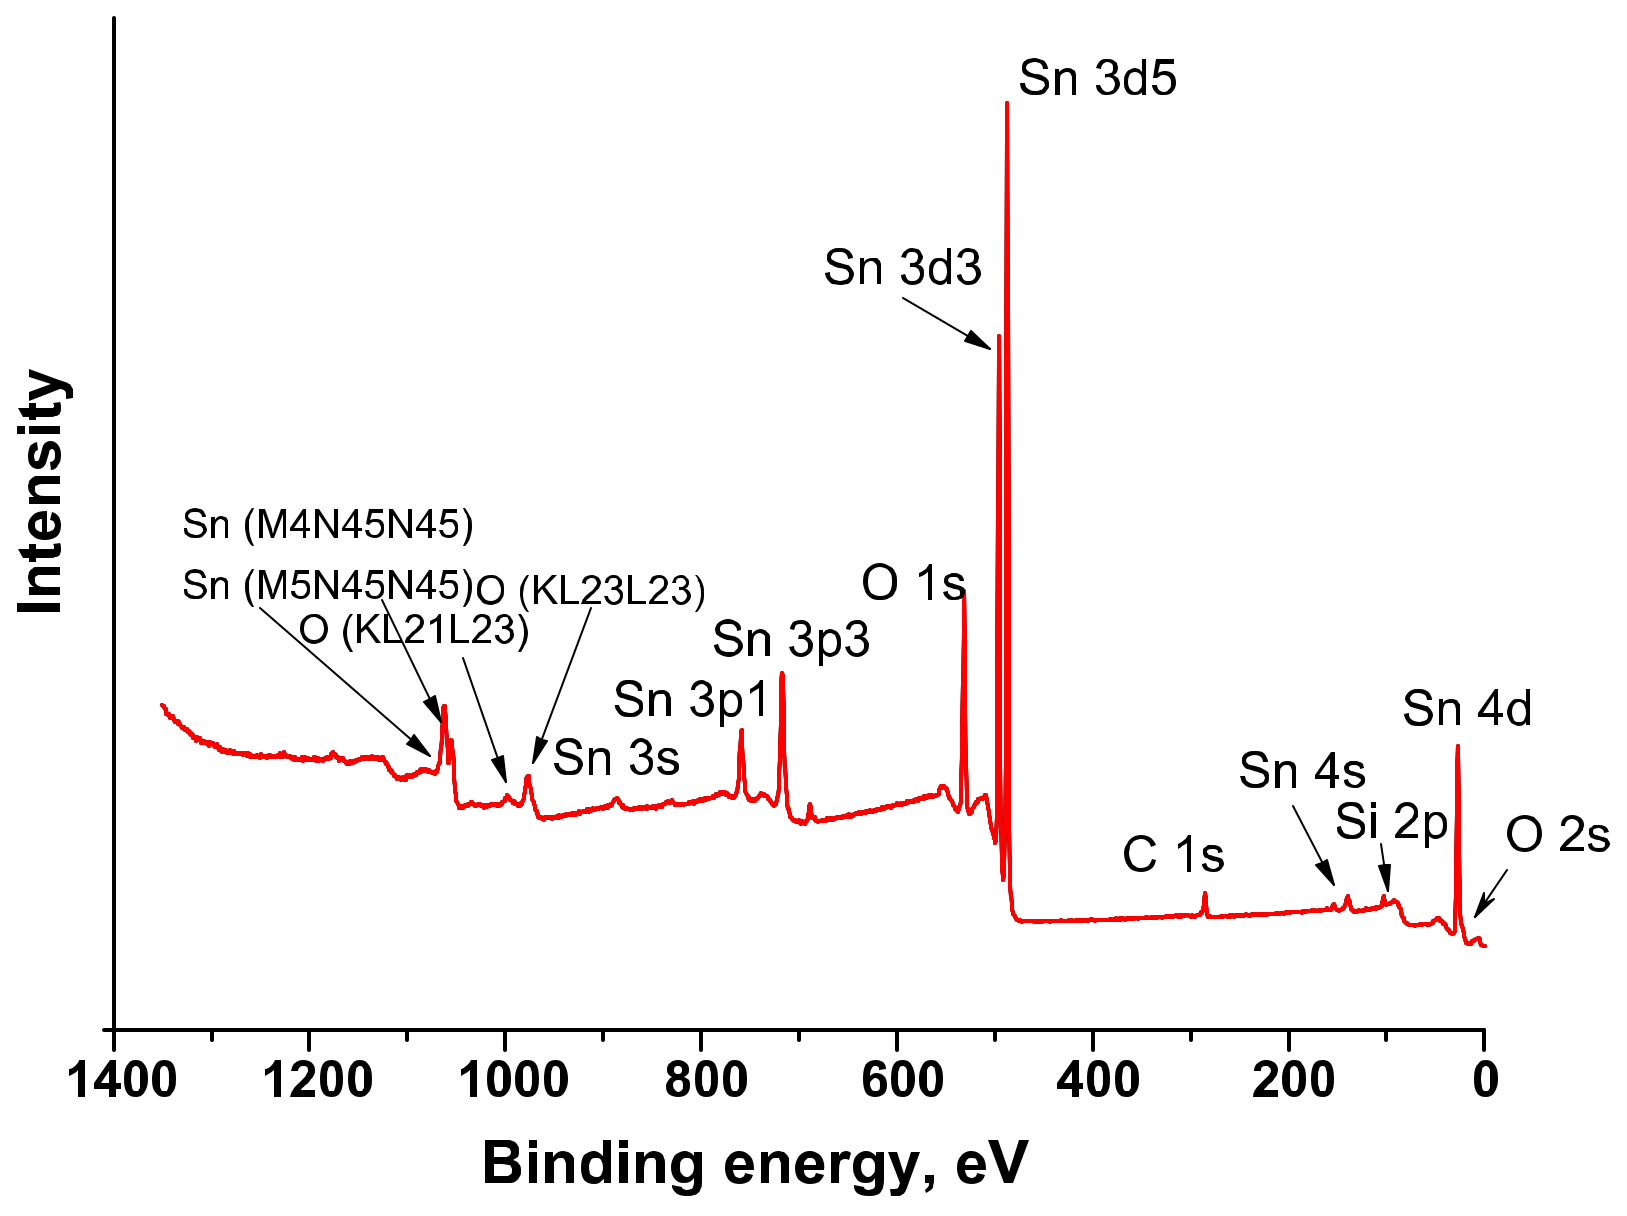
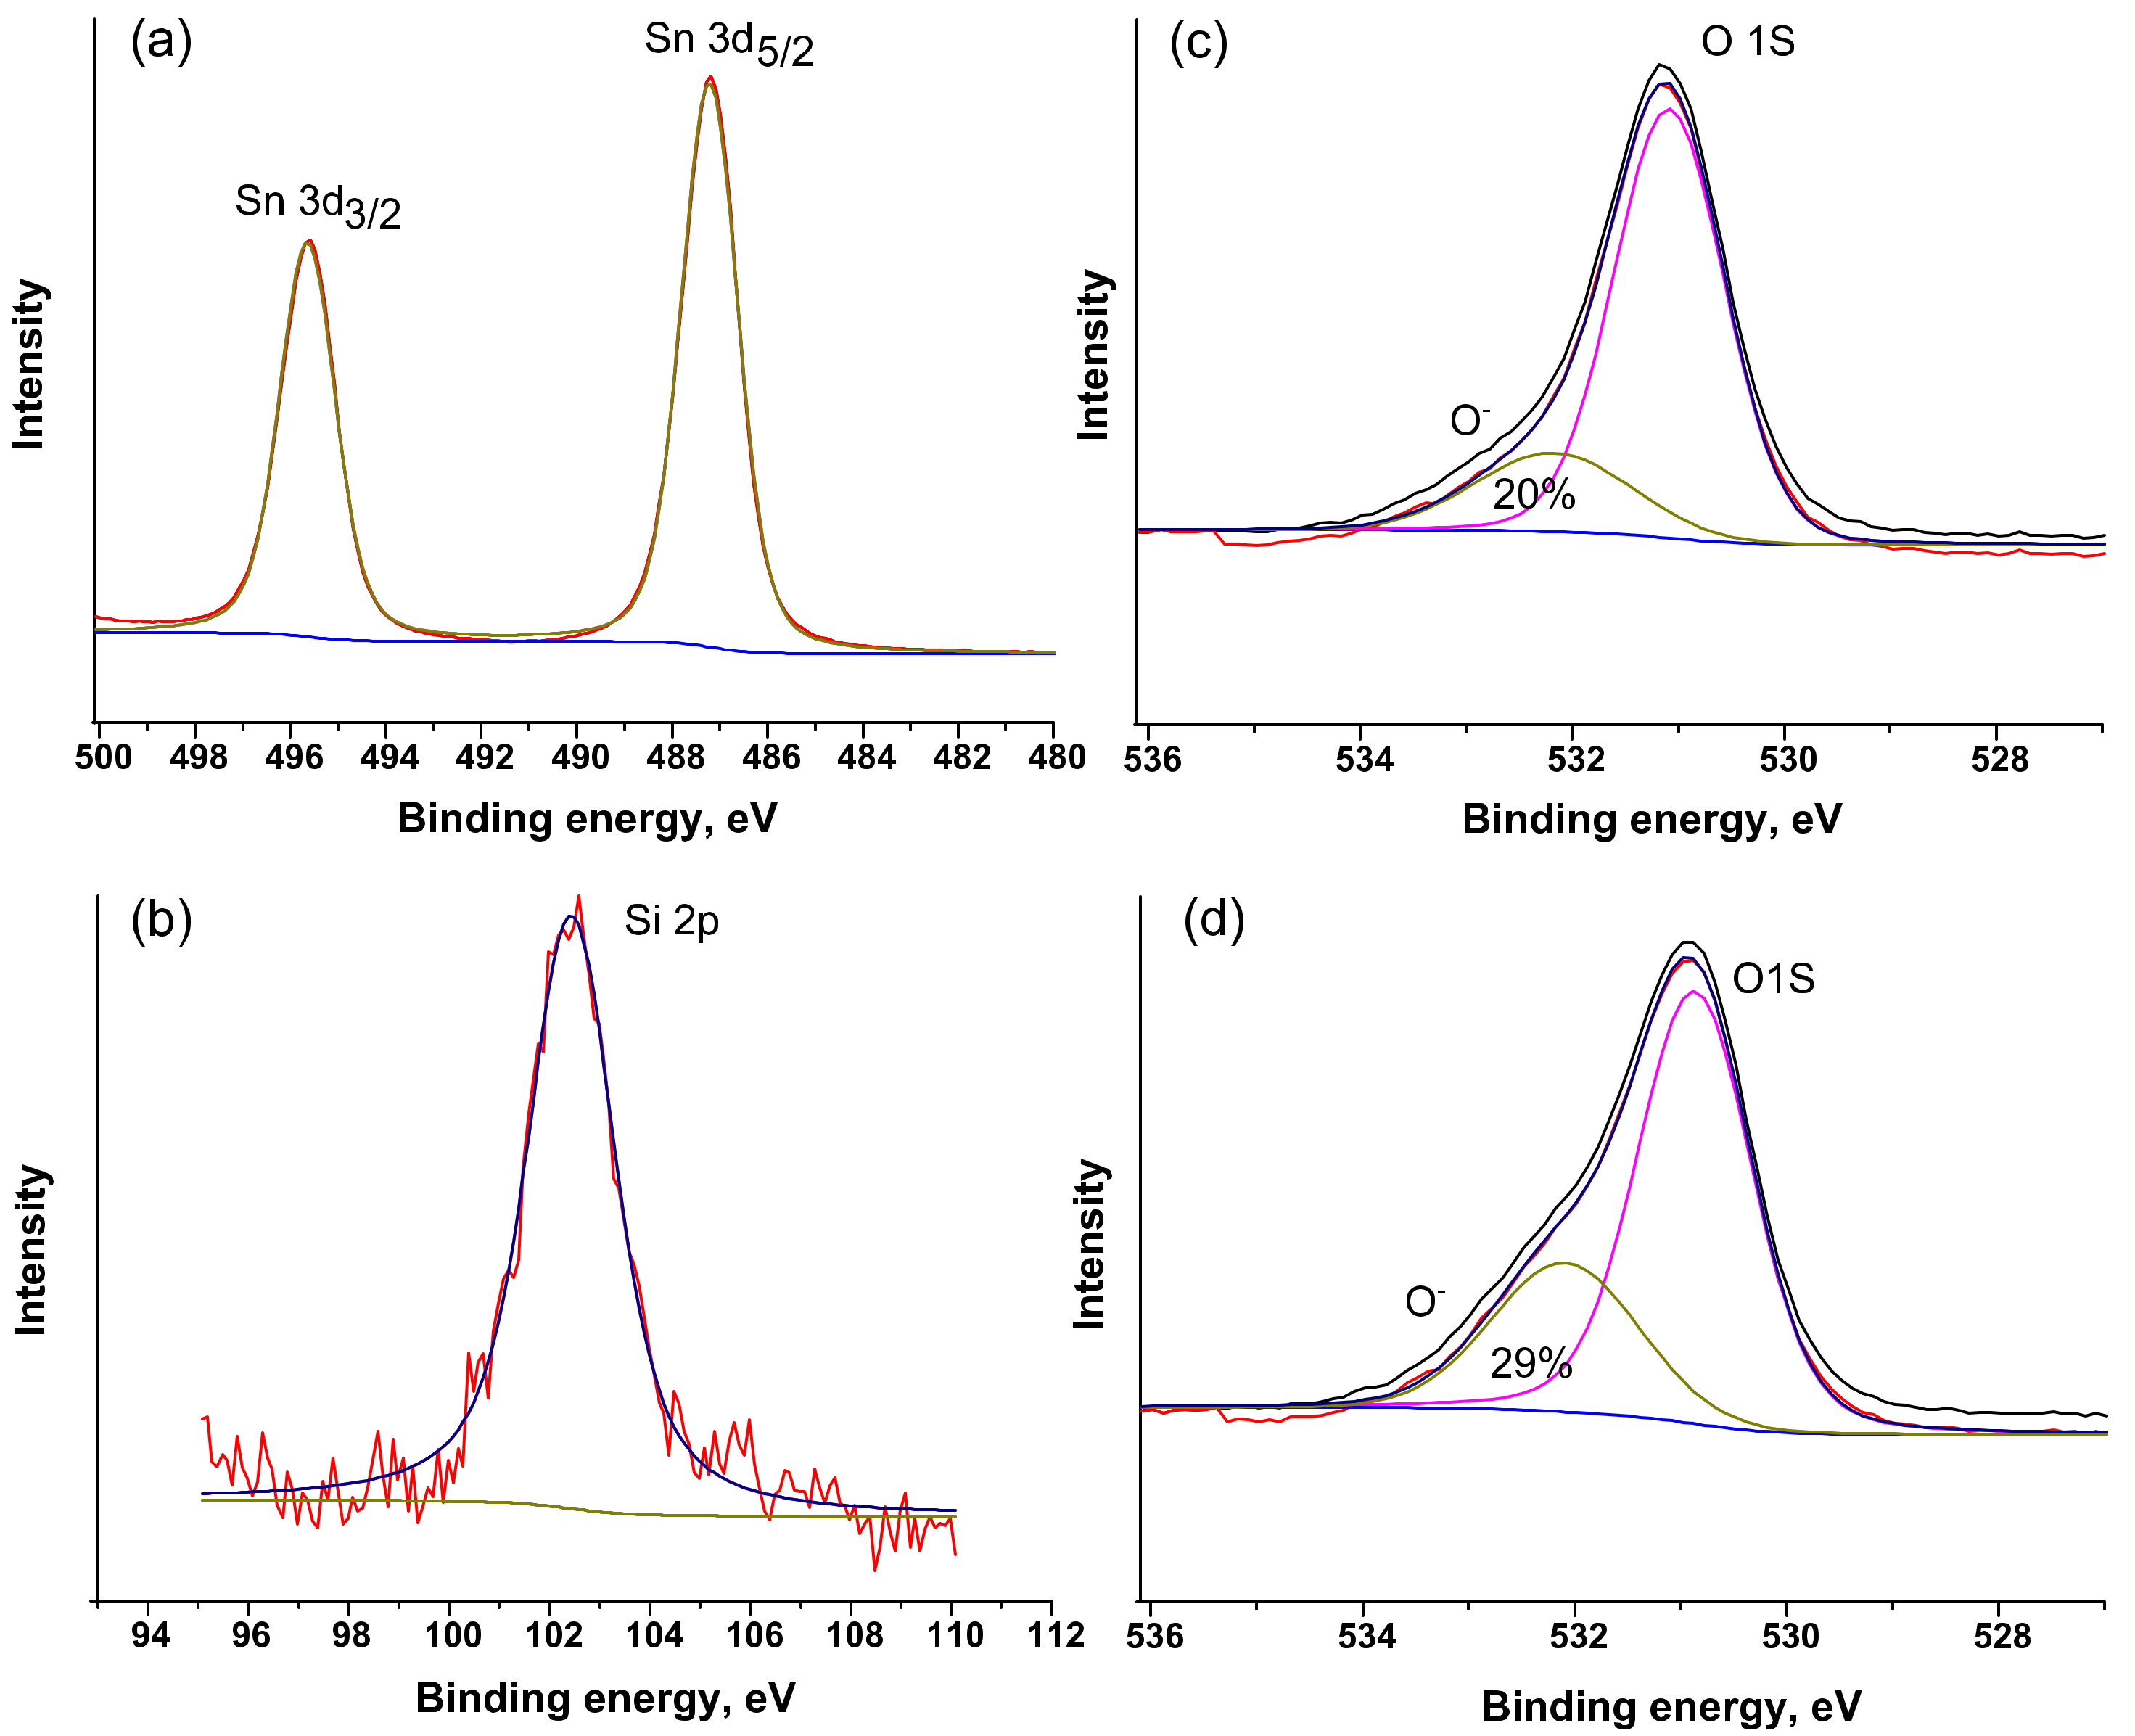
Figure 8 shows the survey X-ray photoelectron spectrum of the SnSi13 nanocomposite. The spectrum contains signals of C, O, Si, Sn. The presence of peak C1
s (285.0 eV) related with residual carbon contamination on the surface of the samples associated with analysis preparation process. The positions of Sn3
d5/2 (486.6 eV) and Sn3
d3/2 (497.0 eV) peaks (
Figure 9a) correspond to Sn(IV) in SnO
2 [
28]. The spectrum in Si2
p (
Figure 9b) is described by a single component with an energy of 103.0 eV, corresponding to Si(IV) in SiO
2 [
28]. For nanocrystalline SnO
2 and SnSi13 nanocomposite the XP-spectrum in O1
S region has an asymmetrical shape and is described by two components (
Figure 9c,d). The main peak (O1,
E = 531.0 eV) corresponds to lattice oxygen in the structure of tin dioxide. The presence of a broad component with
E = 532.1 eV (O2) is due to various forms of chemisorbed oxygen and hydroxyl groups. The ratio of the integral intensities of the components for pure SnO
2 is O2/O1 = 0.25. The introduction of SiO
2 leads to a significant increase in this value to O2/O1 = 0.36. This is consistent with the results obtained by IR spectroscopy, and may be due to an increase in the specific surface area.
Sensor properties of nanocrystalline SnO
2 and SnO
2/SiO
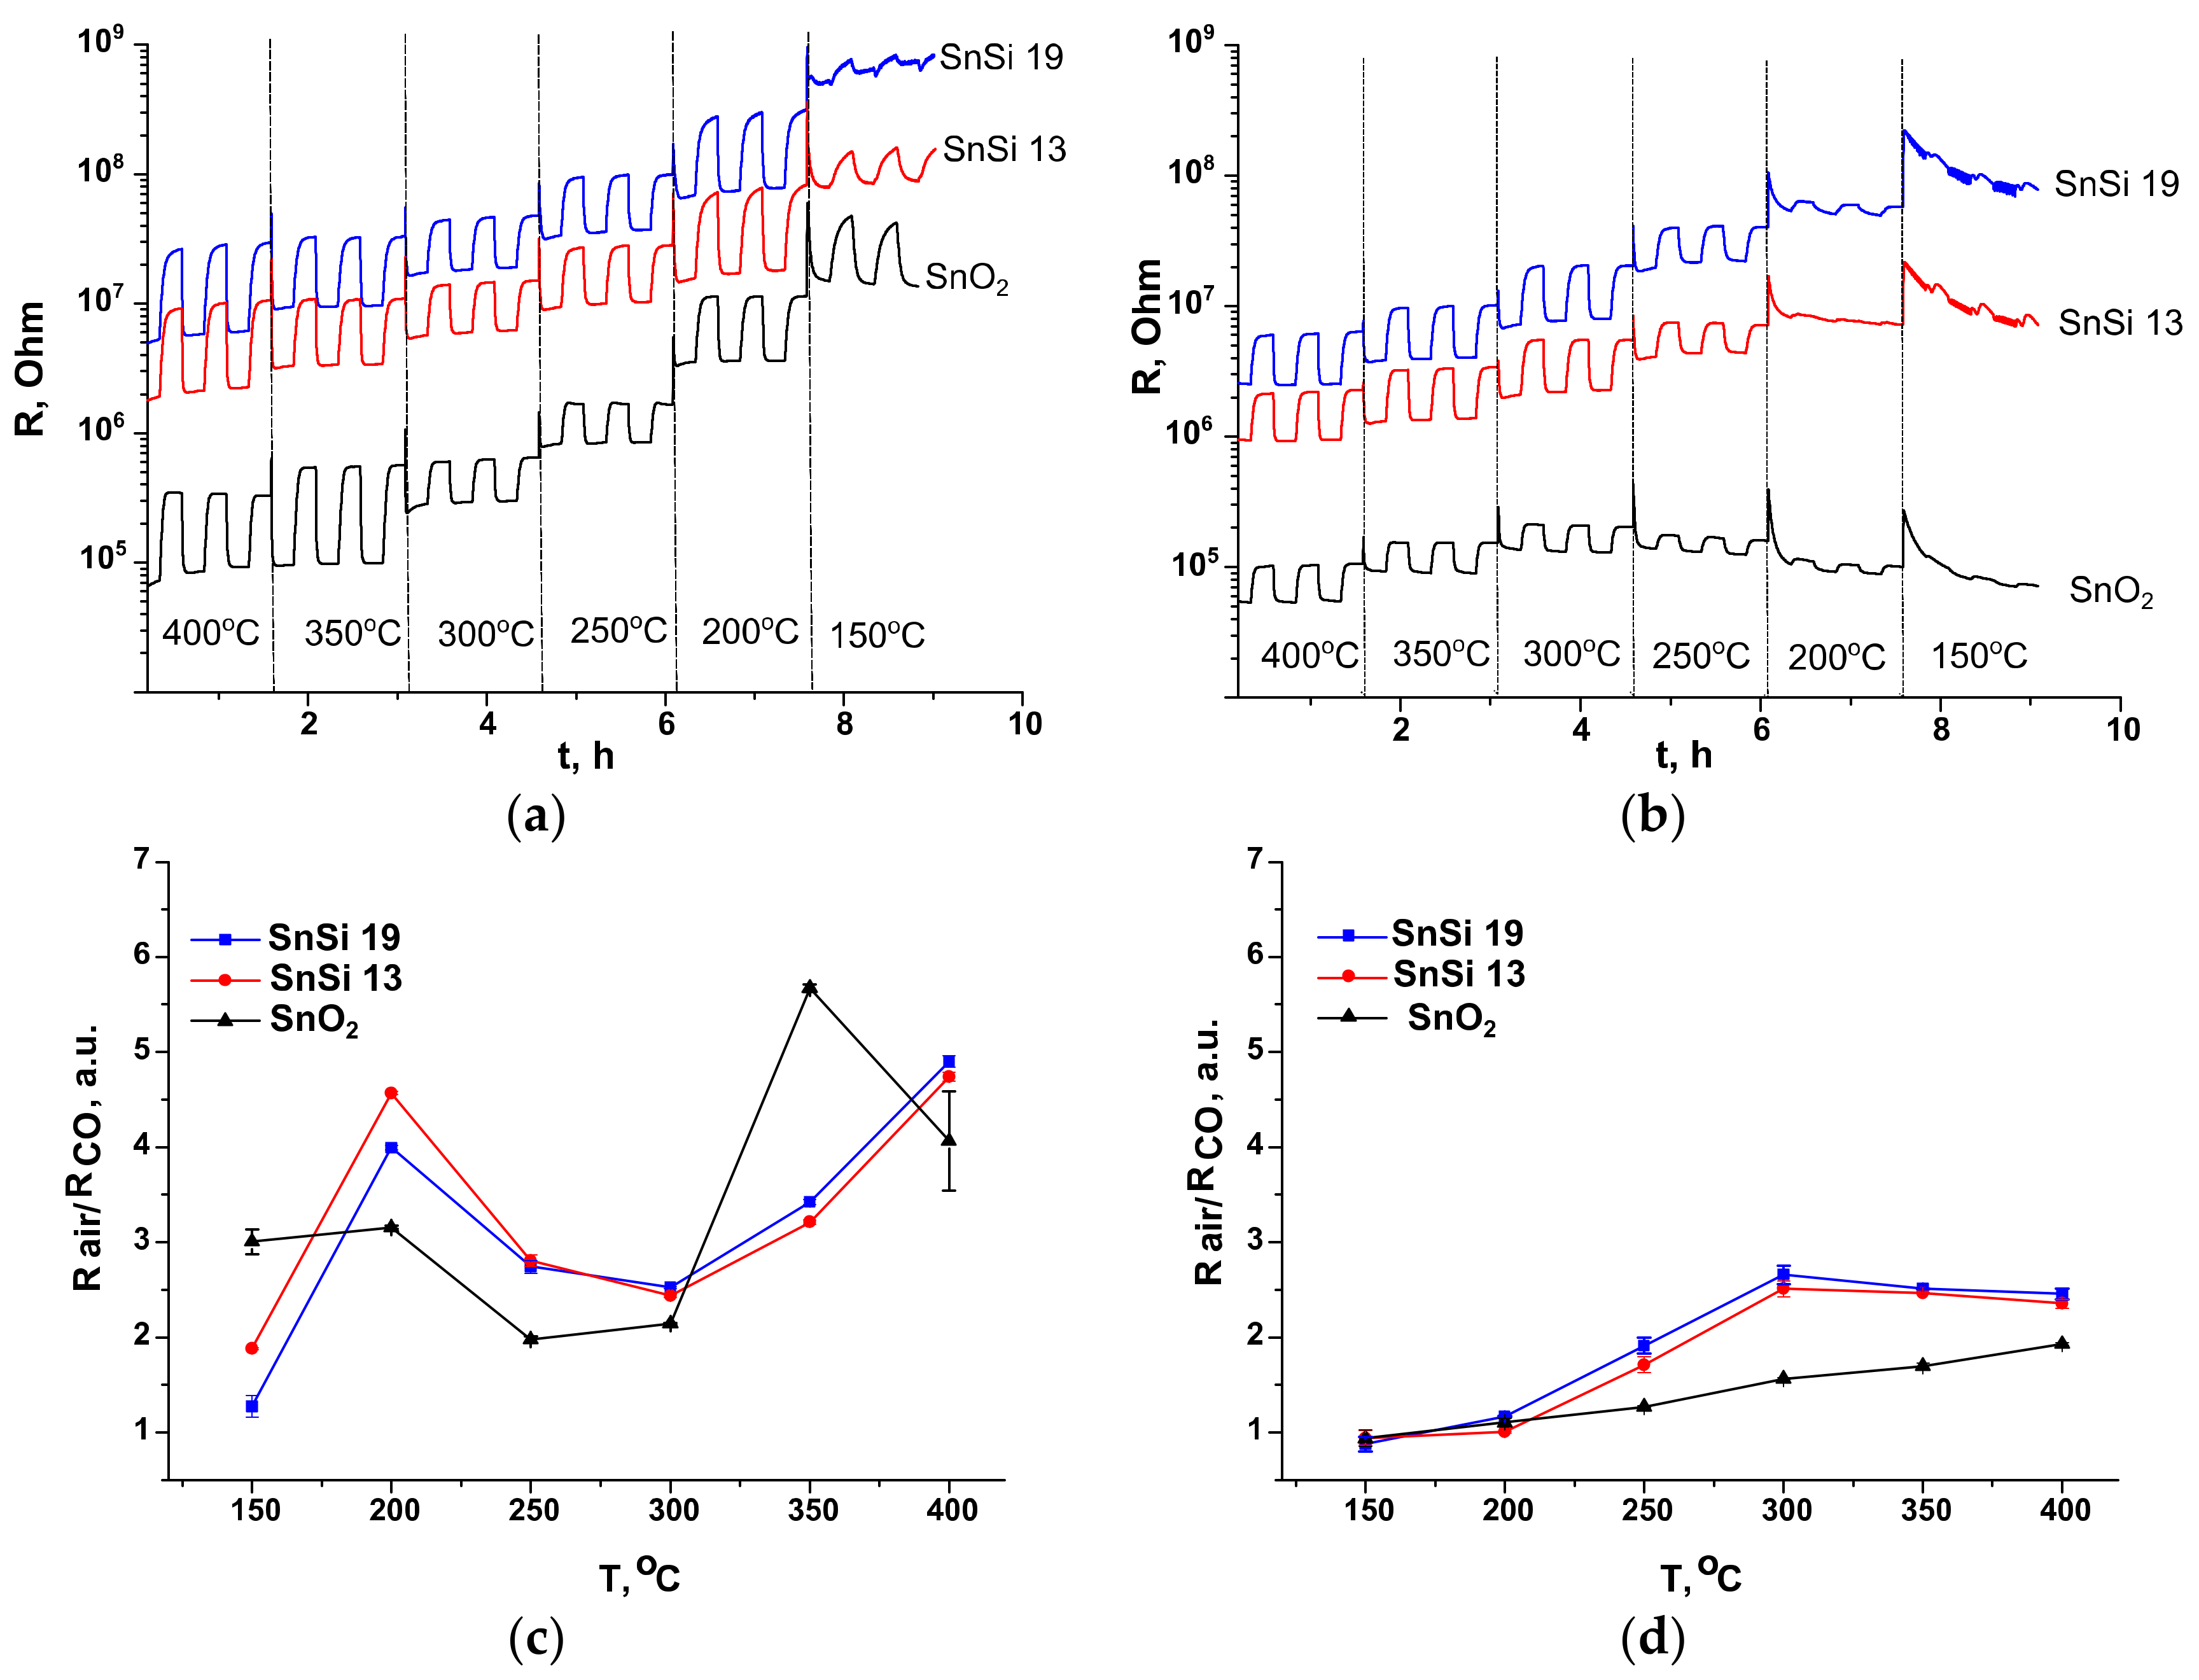
2 nanocomposites toward CO were investigated by in situ conductivity measurements.
Figure 10a,b shows the change in the resistance of SnO
2, SnSi13 and SnSi19 samples with a periodic change in the composition of the gas phase in the presence of 100 ppm CO in dry air (RH = 1%) (
Figure 10a) and at relative humidity RH = 20% (at 25 °C) (
Figure 10b). Tin dioxide is n-type semiconductor, therefore when interacting with a reducing gas its resistance decreases in accordance with the Equations (4) and (5).
The sensor response of all measured samples (SnO
2, SnSi13 and SnSi19) is well reproducible. On the temperature dependence of sensor response in dry air there are two maxima: at temperatures of 350 °C for SnO
2 and 400 °C for SnSi13, SnSi19, and also at 200 °C for all of the samples (
Figure 10c). In humid air for nanocomposite samples, the maximum sensor response is observed at 300 °C, and in the case of pure tin dioxide, the magnitude of the response grows monotonically with increasing temperature up to 400 °C (
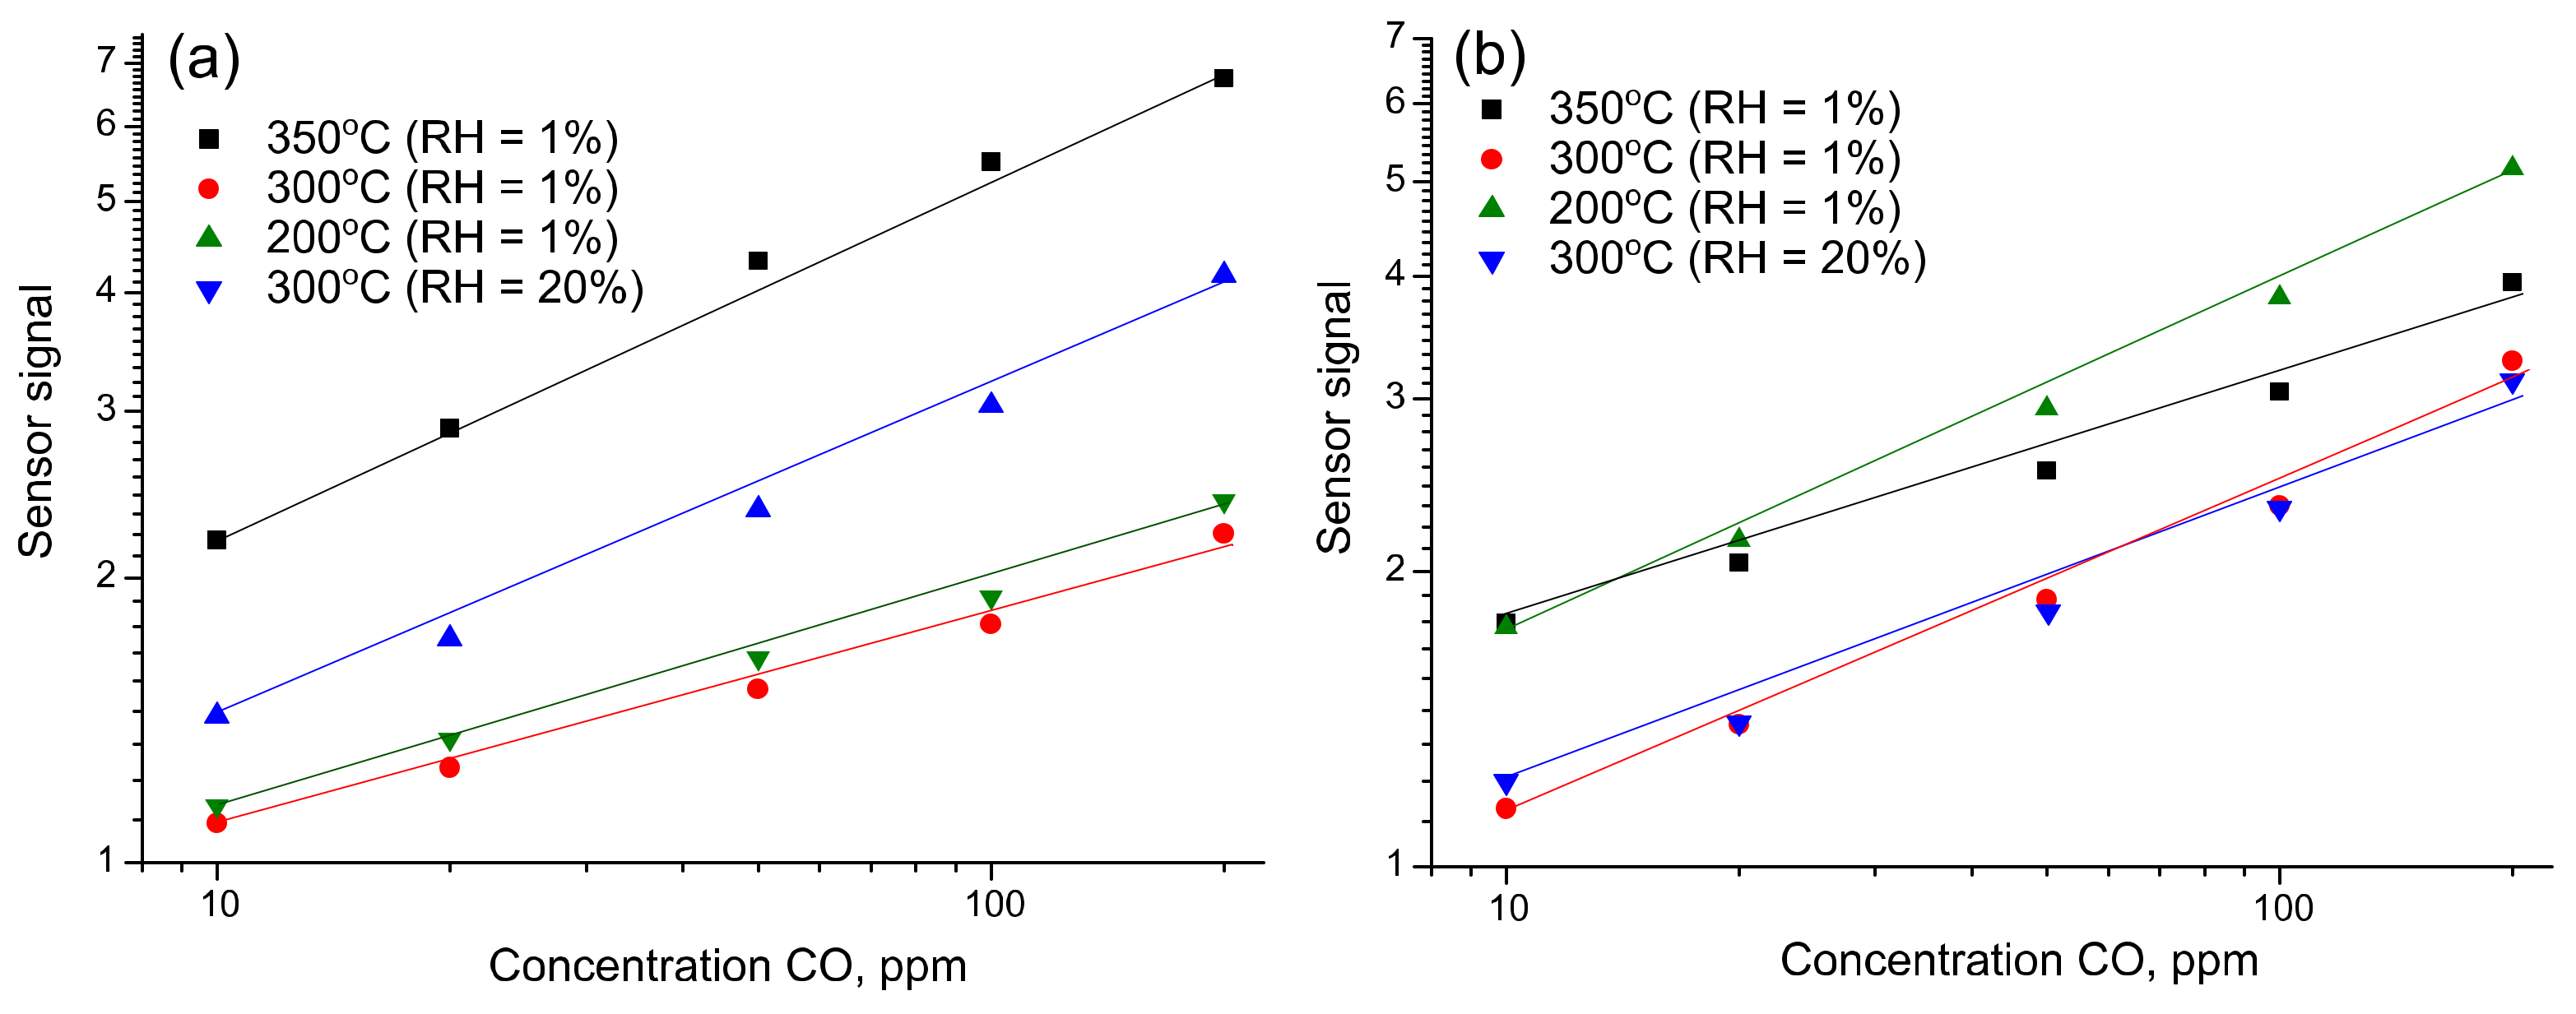
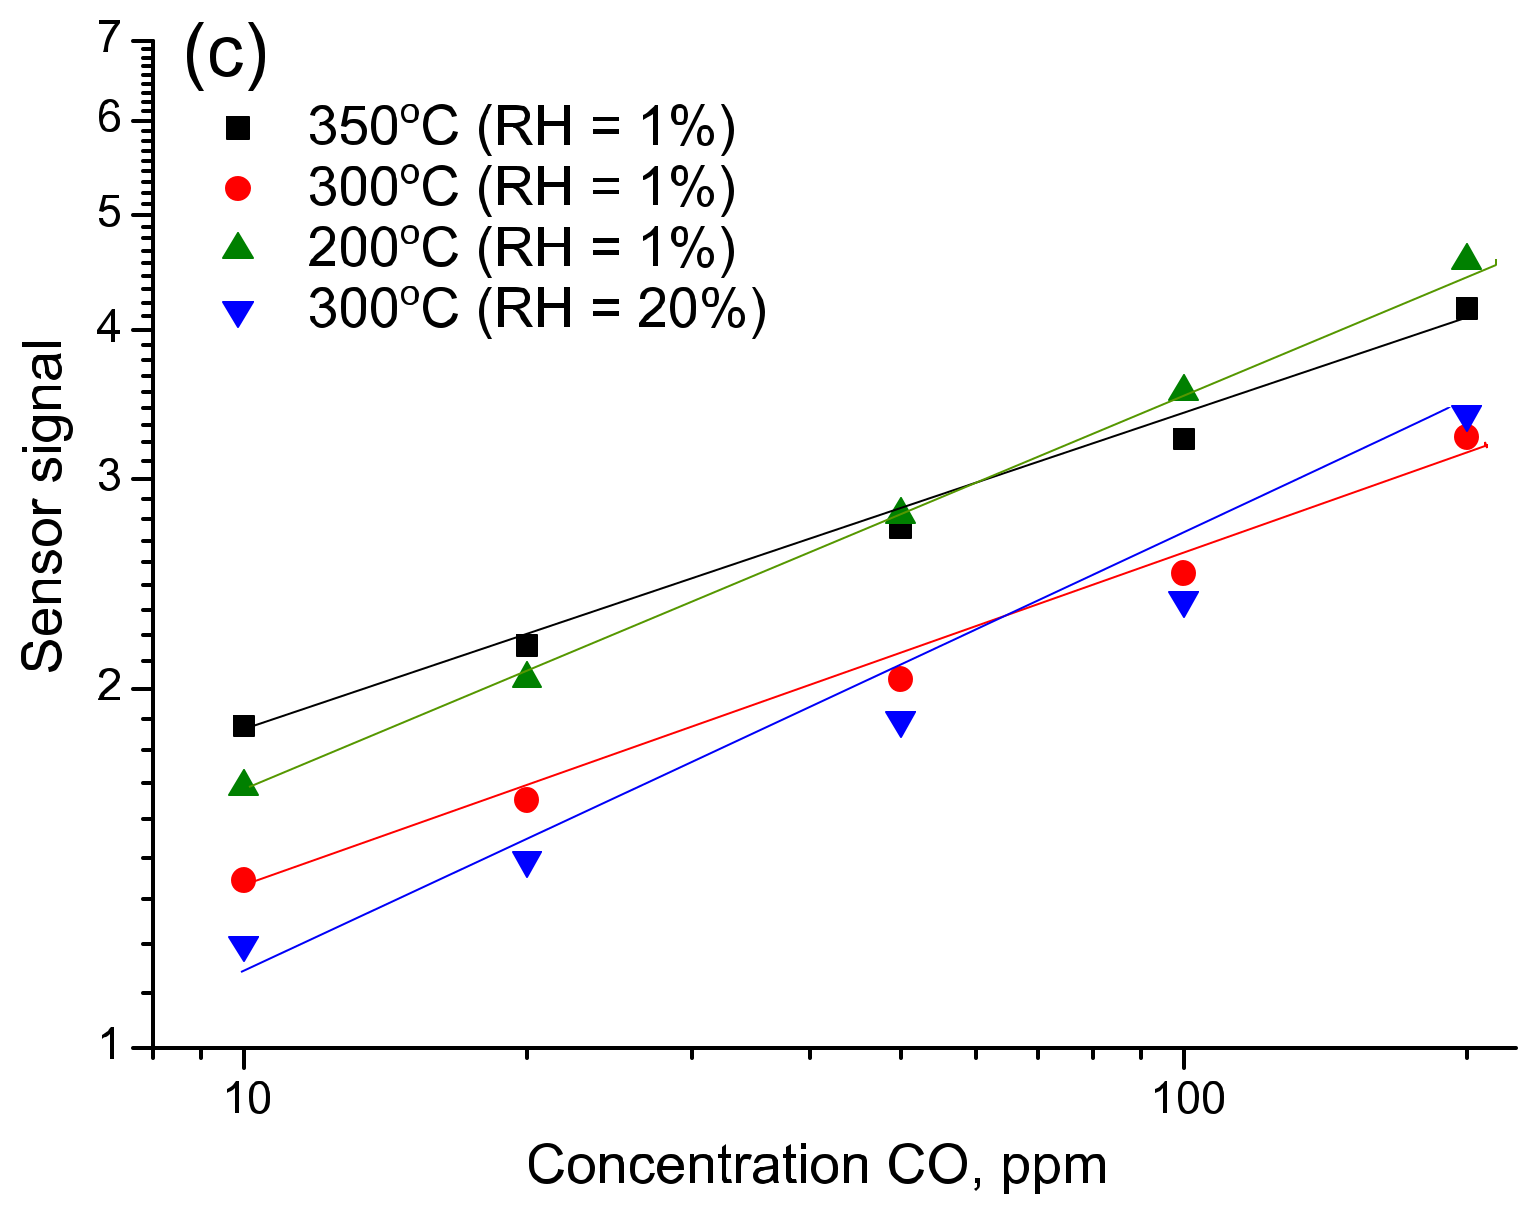
Figure 10d). In general, an increase in air humidity leads to a decrease in the sensor response toward CO. However, for SnSi13 and SnSi19 nanocomposites at a measurement temperature of 300 °C, the magnitude of the signal does not depend on air humidity. Based on these results, temperatures of 350, 300, and 200 °C were selected to build the calibration curves at RH = 1% and RH = 20%. For the indicated temperatures the values of sensor response were obtained at CO concentrations of 200, 100, 50, 20, and 10 ppm CO in humid and dry air. The dependences of the sensor response
S on the concentration of carbon monoxide
CCO correspond to a power law
and are linearized in double logarithmic coordinates (
Figure 11).
By calculating the average resistance value (
Rav) and the standard deviation (σ) of resistance in air the values of detection limits (LDL), CO for each sensor was calculated from the obtained calibration curves. The value
Rav/(
Rav–3σ) was taken as the minimum measurable sensor signal. The results are presented in
Table 2.
In humid air, the sensor’s response decreases, and also the noise increases especially for the low temperature measurements (
Figure 10b). However, SnO
2/SiO
2 samples show greater sensor response as compared to pure SnO
2 (
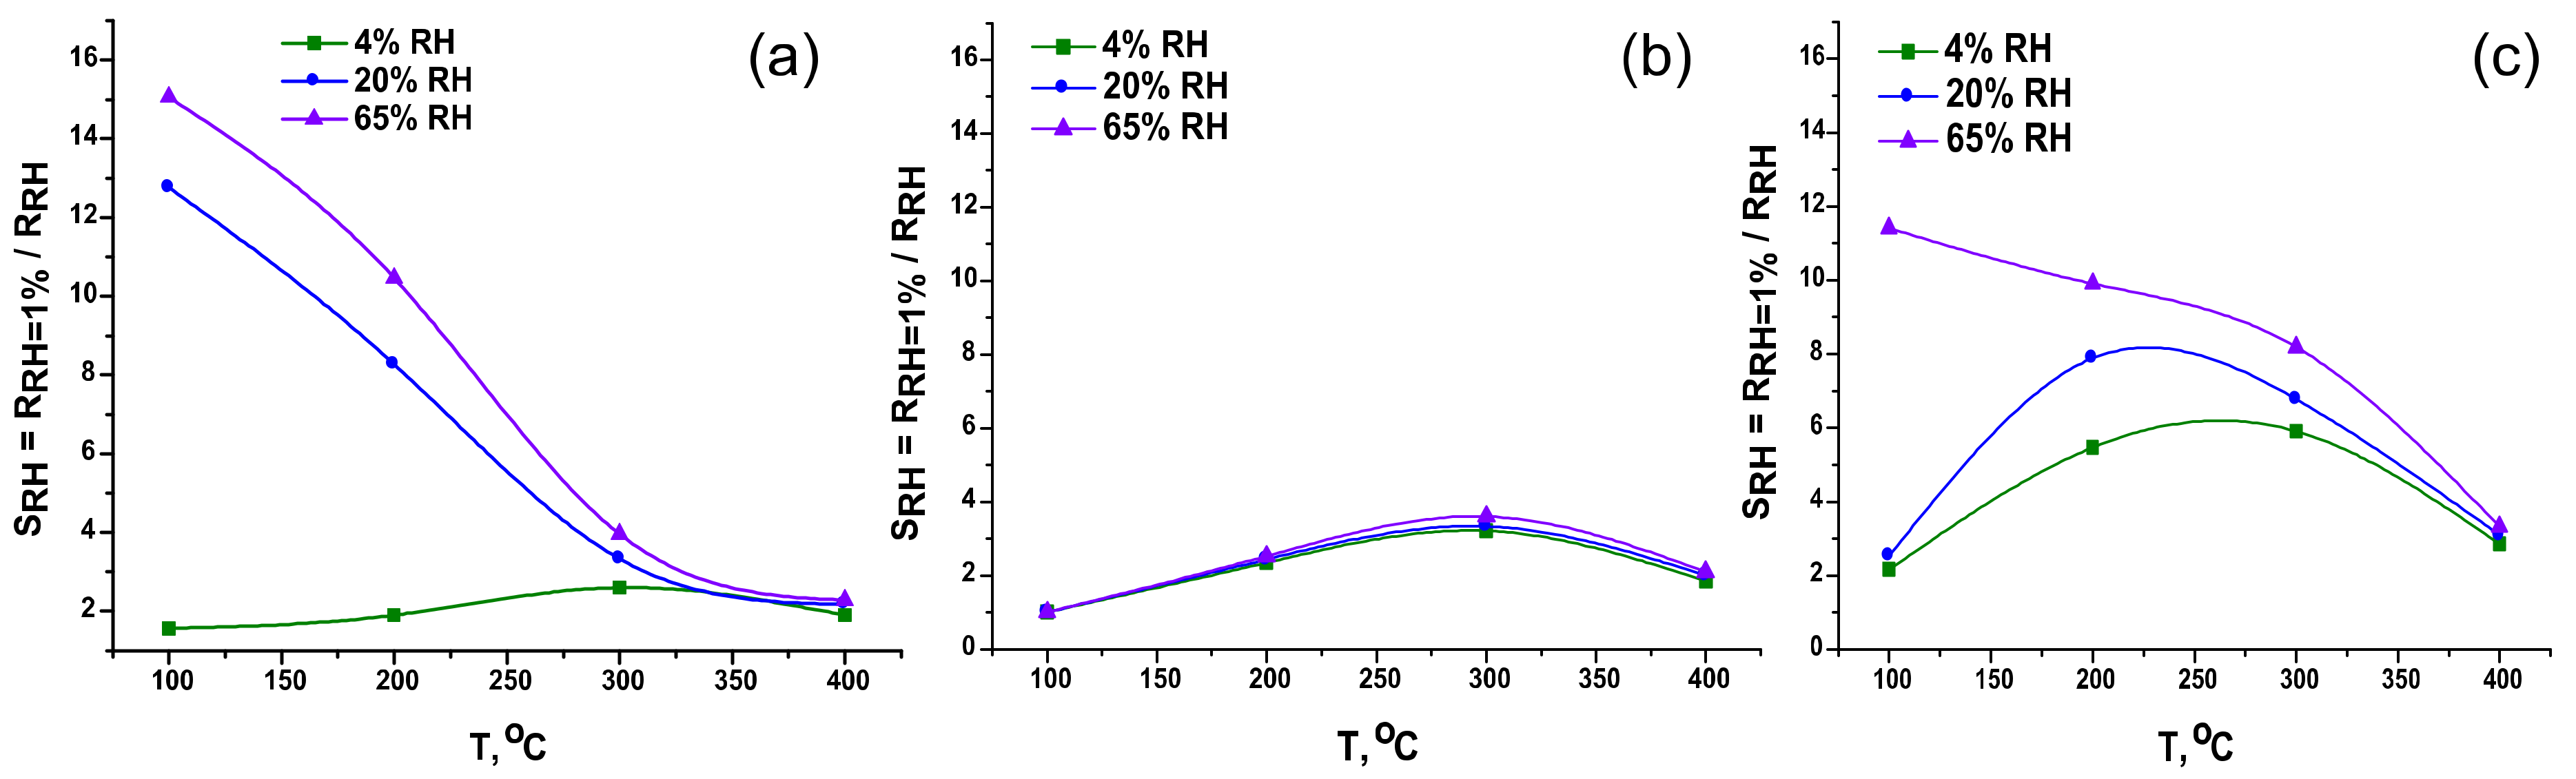
Figure 10d). The effect of humidity on the electrophysical properties of the samples was investigated by in situ conductivity measurements. The concentration of water vapor in the air with RH = 4%, 20%, and 65% (at 25 °C) is 0.031, 0.125, 0.625 and 2.032 vol.%, respectively. The decrease in sensor response toward CO in humid air can be explained by blocking of active centers on tin dioxide surface because of competitive adsorption of water molecules, which in turn result in the decrease in samples resistance due to the reactions:
So, one can calculate the value of the response to water vapor as
(
Figure 12). The measurements of sensor resistances in the temperature range of 400–100 °C showed that pure SnO
2 is the most sensitive to the content of water vapor in the air flow (
Figure 12a). The response to water vapor of the SnSi13 sample (
Figure 12b) over the all temperature range coincides in magnitude for all RH values, that indicates the stability of its characteristics under fluctuations in air humidity and the potential applicability of this material for CO detection in real conditions. The resistance of the SnSi19 sample varies less with increasing air humidity than pure tin dioxide (
Figure 12c).
In humid air, the greater sensor response of SnO
2/SiO
2 nanocomposites compared to pure SnO
2 may be due to the tolerance (reduced sensitivity) of their electrophysical properties to hydroxyl poisoning [
15]. The main cause of this effect, in our opinion, is the predominant adsorption of water molecules on the surface of SiO
2 fragments. These fragments can act as moisture concentrators reducing hydroxyl poisoning for SnO
2 surface, which, in its turn, is responsible for the formation of the sensor response of nanocomposites.
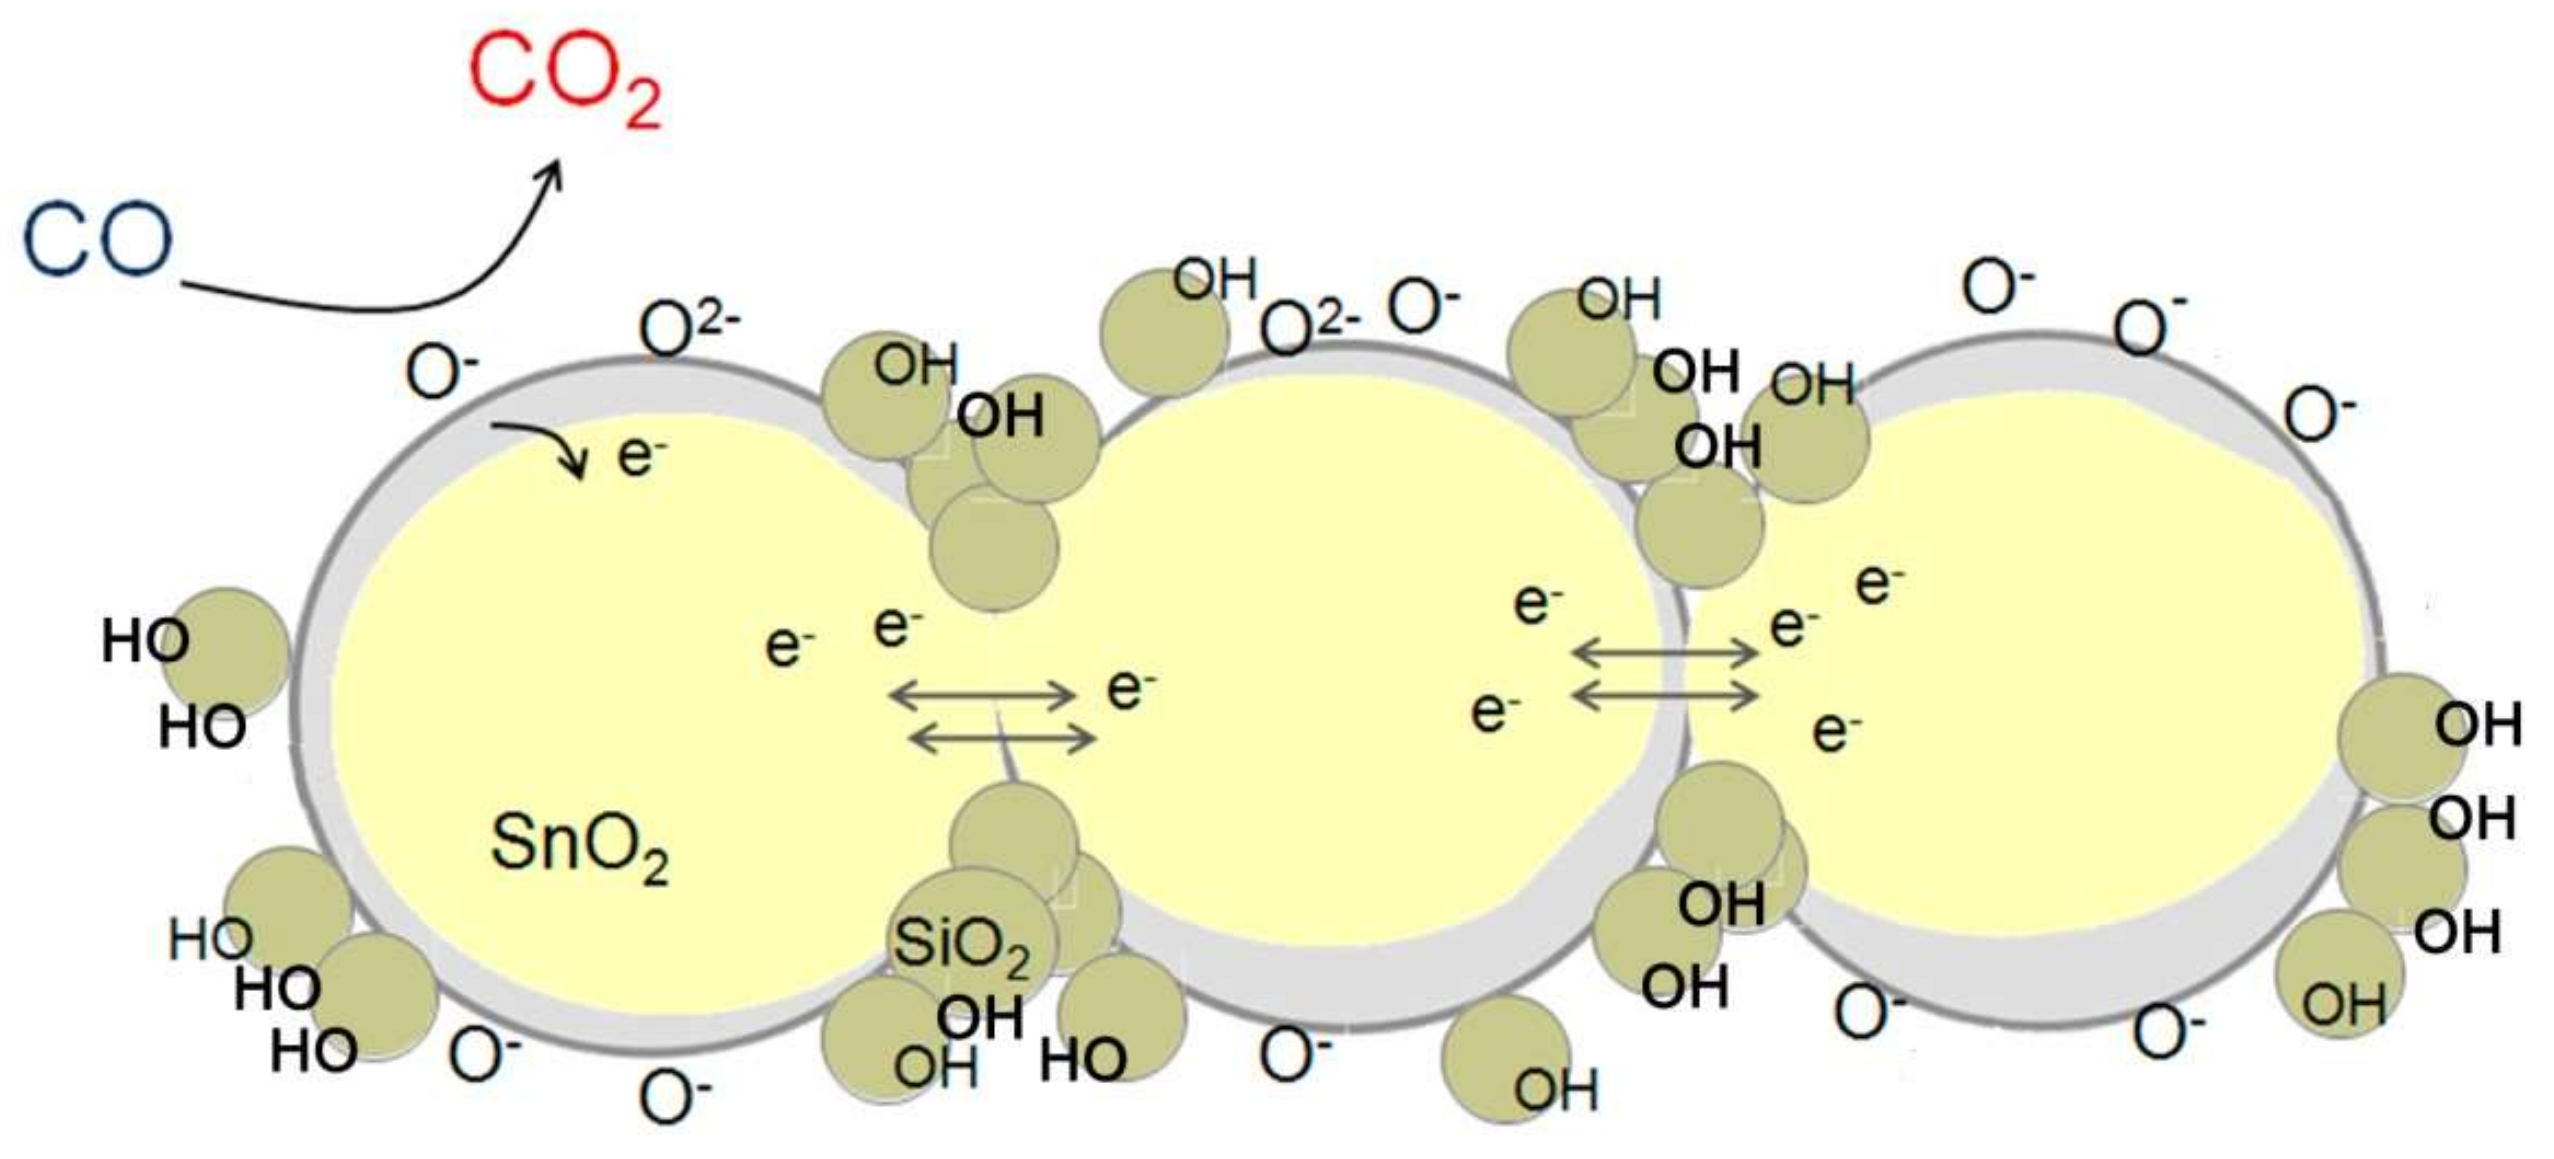
The mechanism for improving the sensor characteristics of SnO
2/SiO
2 nanocomposites compared to pure SnO
2 in humid air can be represented as follows (
Figure 13). The SnO
2/SiO
2 nanocomposites contain fragments of amorphous SiO
2, which form an interface with the SnO
2 nanocrystals. In wet conditions, the adsorption of water vapor takes place predominantly on these SiO
2 fragments. This reduces the number of water molecules that are adsorbed on the surface of SnO
2. As a result, the blocking of active centers on the tin dioxide surface, which causes a decrease in the sensor signal to CO in humid air, occurs to a lesser extent. This leads to the retention of a high sensor response to CO when the sensor is operating in humid air. The sensor based on the SnSi13 nanocomposite demonstrated the greatest indifference of the sensor response to changes in air humidity.
The set of the obtained results allows us to conclude that during the synthesis of the SnSi13 nanocomposite, an optimal supersaturation of the silica precursor was created, which ensured the formation of the maximum number of SiO2 fragments on the SnO2 surface through heterogeneous nucleation. This led to the formation of such a microstructure of the nanocomposite, which allowed reducing its sensitivity to hydroxyl poisoning and increasing the sensor response to carbon monoxide in humid air.

 ,
, 


