The Microstructure and Pitting Resistance of 2002 Lean Duplex Stainless Steel after the Simulated Welding Thermal Cycle Process

Department of Materials Science, Fudan University, Shanghai 200433, China
*
Author to whom correspondence should be addressed.
Materials 2019, 12(1), 70; https://doi.org/10.3390/ma12010070
Submission received: 2 December 2018
/
Revised: 16 December 2018
/
Accepted: 18 December 2018
/
Published: 26 December 2018
(This article belongs to the Section Corrosion)
Abstract
:In this paper, thermal cycles with different heat inputs and cooling rates were investigated for a novel lean duplex stainless steel 2002 using a welding simulation. The microstructure and pitting resistance of the simulated heat-affected zones were studied. With the increasing heat input, the amount and size of the austenite phase both increased, along with a transformation from rods to dendritic structures. The critical pitting temperature (CPT) and the pitting potential (Epit) both increased first and then declined as the heat input increased, indicating a strong dependence of pitting resistance on the heat input. For the different cooling rates, the amount of ferrite increased as the cooling rate increased from 0.25 °C/s to 20 °C/s. The CPT and Epit both increased with the increasing cooling rates, indicating an improved pitting resistance. The pits initiated preferentially at the boundaries of ferrite and austenite due to the precipitation of M23C6 in the specimens with different cooling rates.
1. Introduction
Duplex stainless steels (DSSs) have attracted much attention for the satisfactory mechanical properties and favorable corrosion resistance, which are thus widely used in chemical, petrochemical, and nuclear industries [1,2,3,4,5]. The excellent performances of DSSs result from the approximately equal amounts of the two phases: the island-like austenite (γ-phase) and the continuous ferrite matrix (α-phase) [6,7]. The development of lean duplex stainless steel (LDSS), with low contents of nickel and molybdenum and the consequently improved hot workability and weldability becomes a significant focus point for researchers [8,9,10]. In recent years, a novel lean duplex 2002 stainless steel has been developed with a composition of 20.53Cr-3.45Mn-2.08Ni-0.31Mo-0.17N. Previous works from our group have stated several promising properties of LDSS 2002 [7,11,12,13]. For instance, the breaking elongation after annealing at 1050 °C can reach to a maximum of 52.7% owing to the transformation-induced plasticity (TRIP) [11].
Duplex stainless steels inevitably go through welding processes before industrial applications. Welding can severely influence the microstructure and local corrosion resistance of the material [14]. In particular, degradation appears in the heat-affected zone (HAZ) where the intermetallic compounds tend to precipitate, and this precipitation is difficult to prevent [7,15]. The thermal cycle of HAZ can be simulated with different parameters such as the heat input and cooling rate. During the thermal cycle, the alloy is always heated to a peak temperature with a short heating time, then held for a few seconds and ultimately cooled to room temperature. An applied heat source is defined as the heat input, which stands for the amount of energy entering the base metal per unit length of weld from a moving heat source [16]. Heat input is the key factor affecting the thermochemical responses and is related to the cooling process [17,18]. The microstructure, mechanical properties, and corrosion resistance of the welded metals strongly depend on the heat input, which affects the distribution of the main alloying elements of Cr, Mo, and N in the two phases. A higher heat input leads to a lower cooling rate, which is beneficial to phase balance while the grains grow larger [16,19]. On the contrary, a high heat input would cause the precipitation of intermetallic compounds [20,21]. Lundquist et al. [22] found that a lower heat input resulted in the formation of Cr2N in a ferrite phase, but a higher input could diminish the amount of nitride precipitates via the reformation of austenite. Deng et al. [23] investigated the isothermal aging of UNS S31803 to simulate a welding thermal cycle and found that the specimens were subjected to the precipitation of secondary phases.
The cooling rate is another important parameter in welding. In the actual welding process, the cooling rate is related to the heat input and the thickness of the plate. HAZ can be divided into the high temperature HAZ (HTHAZ: 1350–800 °C) and the low temperature HAZ (LTHAZ: 1050 °C–room temperature) according to Ramirez, A. J [24]. In the HTHAZ, during the aforesaid process of heating and holding, austenite phases transform into ferrite phases, resulting in the coarsened ferrite phases [14,25]. The precipitation of secondary phases is the main concern for the low temperature HAZ. A suitable cooling rate needs to be adopted to ensure the phase balance and reduce the precipitation of detrimental phases. The HTHAZ cooling rate for LDSS 2002 has been investigated in the previous work of our group [15]. A proper cooling rate of 10 °C/s can provide a balance of austenite and ferrite and avoid the precipitation of Cr2N. While for the low temperature HAZ, different cooling rates may cause a myriad of precipitates, such as the carbides (M23C6), nitrides (Cr2N), and intermetallic phases (σ, χ), thus affecting the corrosion properties of steel [26,27,28,29,30]. Lv et al. [31] pointed out that for DSS 2205, the increasing cooling rate in LTHAZ led to a more stable passive film, and the most satisfactory phase balance was obtained with a cooling rate of 20 °C/s.
Therefore, it is essential to investigate the influence of different heat inputs and LTHAZ cooling rates on the microstructure and corrosion resistance of LDSS 2002. Then a full range of welding process parameters can be deduced according to the optimum heat input value and LTHAZ cooling rate given in this work. In the present work, the welding thermal cycles with different heat inputs and LTHAZ cooling rates were performed on LDSS 2002 through a Gleeble thermomechanical simulator. The microstructure evolution of the simulated heat-affected zone (HAZ) was investigated using optical microscopy (OM), scanning electron microscopy (SEM), and transmission electron microscopy (TEM). The pitting resistance was evaluated using potentiodynamic polarization and critical pitting temperature (CPT) tests.
2. Materials and Methods
2.1. Material
The material used in this study is a newly developed lean duplex stainless steel 2002 provided by Baosteel Research Institute, Shanghai, China, and the chemical composition is shown in Table 1.
2.2. Simulated Welding Thermal Cycle Process
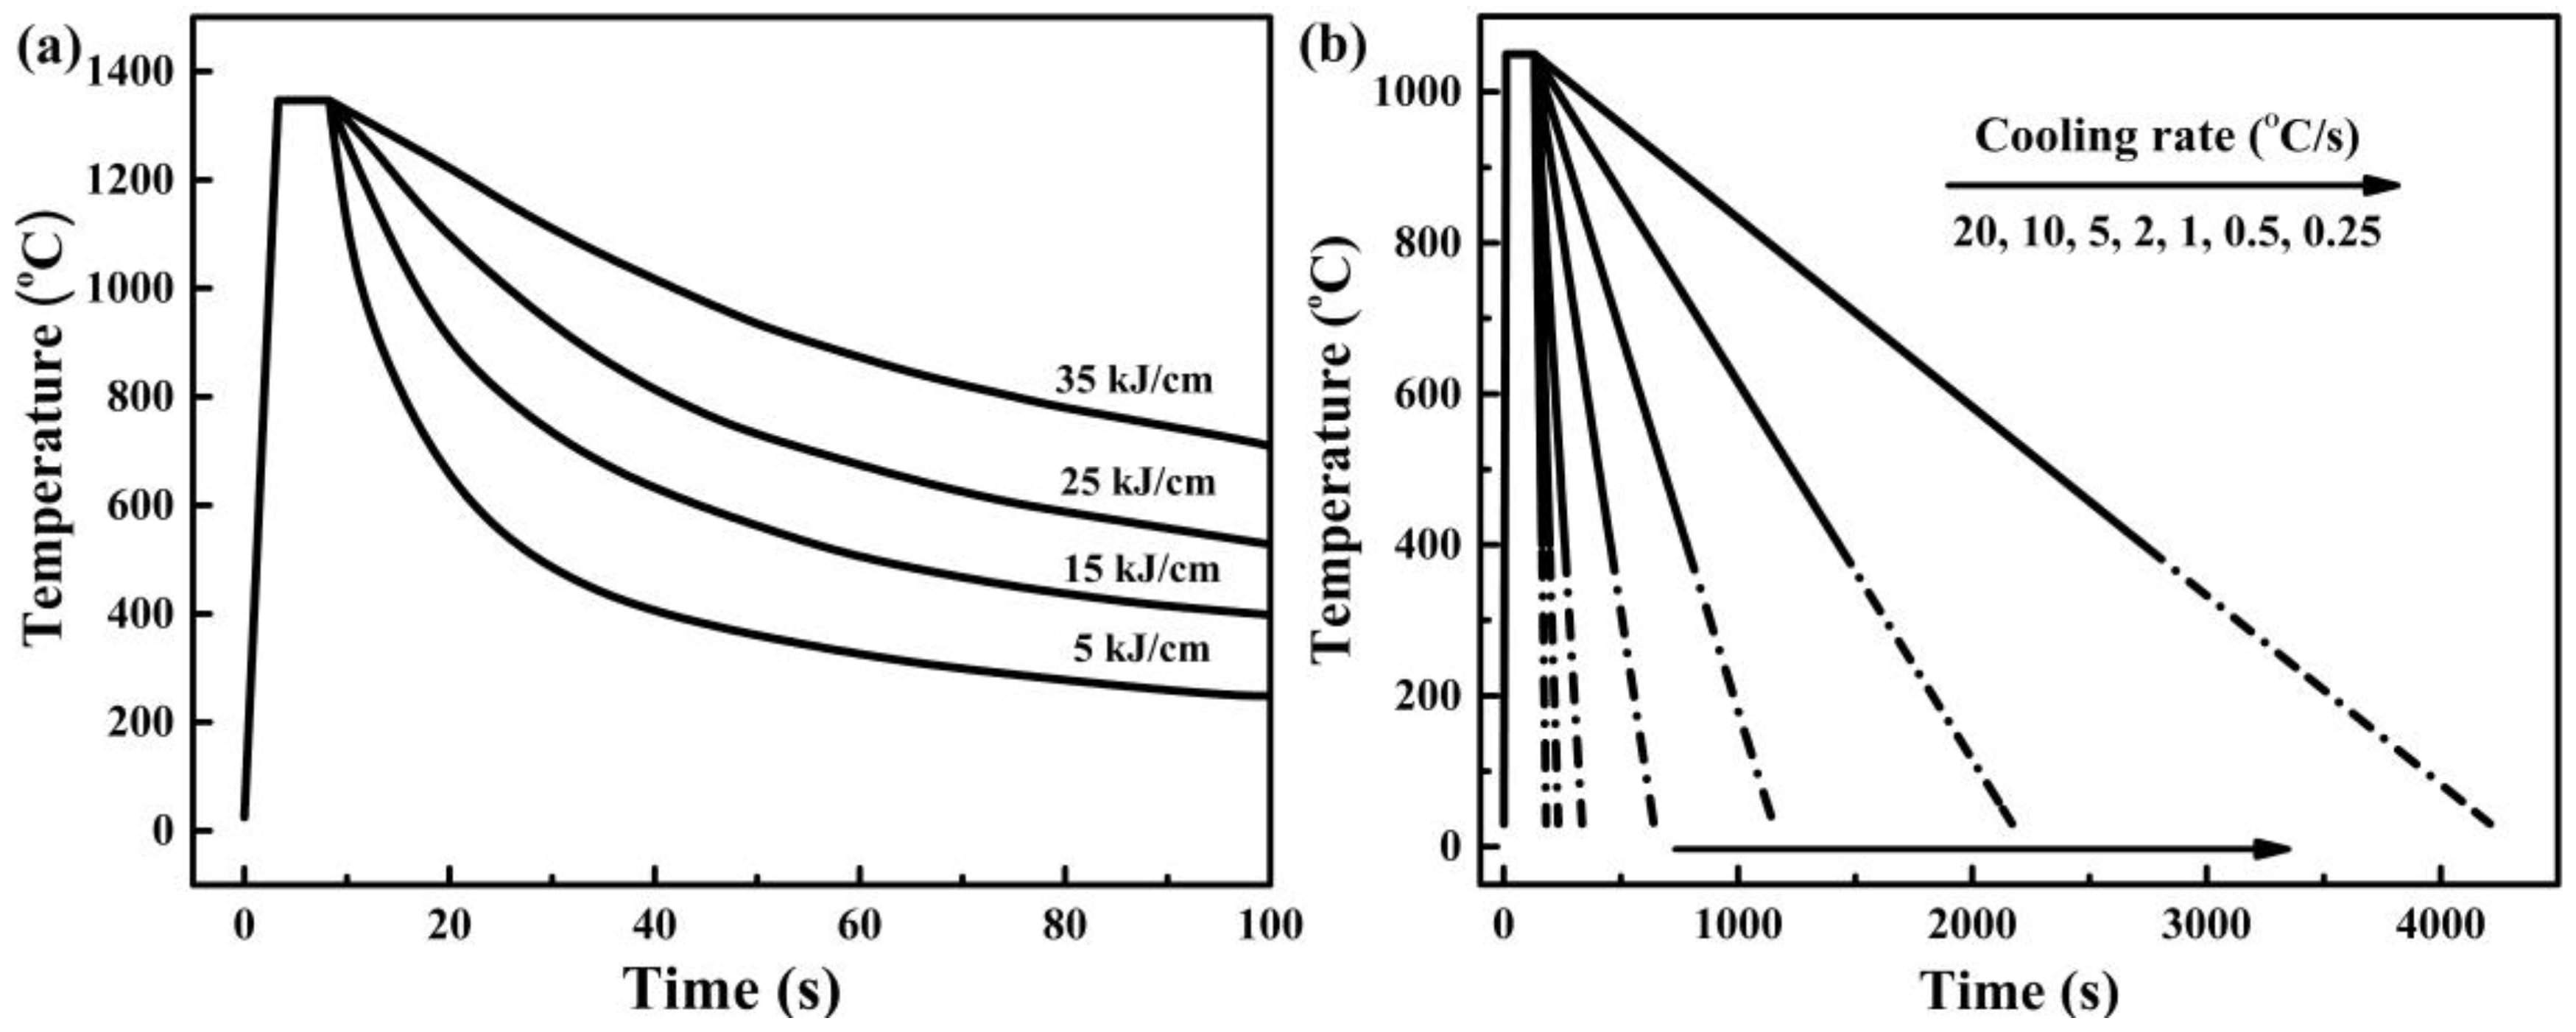
The simulation of the welding thermal cycle was carried out using a Gleeble-3800 thermomechanical simulator (Dynamic Systems Inc., Poestenkill, NY, USA). Before the welding simulation, the sample with approximate dimensions of 10.5 mm × 10.5 mm × 55 mm was solution-treated at 1000 °C for 30 min and then quenched in cold water. The thermal cycles with different simulated heat inputs are shown in Figure 1a. The preheated peak temperature in the thermal cycle was 1350 °C and the holding time was 3 s. Then the heat input was set at 5, 15, 25, and 35 kJ/cm, resulting in different cooling processes. To study the effect of cooling rate for the low temperature HAZ on the microstructure and corrosion resistance of DSS 2002, the samples were heated to 1050 °C at a rate of 100 °C/s. After being kept at 1050 °C for 120 s, the specimens were cooled to room temperature at cooling rates of 0.25, 0.5, 1, 2, 5, 10, and 20 °C/s, respectively. The specimens were cut to 10.5 mm × 10.5 mm × 10 mm for microstructure observation and electrochemical tests. For electrochemical tests, the specimens were sealed with epoxy resin. Before all experiments, the specimens were wet ground mechanically with emery papers from 600 to 2000 grit, then polished with a diamond paste of 1.5 μm, rinsed with ethanol and deionized water, and dried in air.
2.3. Electrochemical Tests
Electrochemical measurements were conducted using a CHI 660D electrochemical workstation (Shanghai Chenhua Instrument Co., Ltd., Shanghai, China). The tests were carried out with a three-electrode system where a saturated calomel electrode (SCE) acted as the reference electrode, a Pt foil acted as the counter electrode, and the specimens acted as the working electrode. The exposed surface was 1 cm2 for the working electrode covered by the 3M tape (3MTM 1600 Vinyl Electrical Tape, 3M Company, Maplewood, MN, USA). All potentials mentioned in the present work were referred to SCE. The test solution was bubbled with pure nitrogen gas (N2) to remove the dissolved oxygen (O2) before and throughout the test.
The critical pitting temperature (CPT) tests were performed in 1M NaCl solution for its good sensitivity, reproducibility, and efficiency [32,33]. The CPT values were determined through the potentiostatic measurements according to ASTM G 150-99. Prior to the electrochemical tests, the working electrode was cathodically polarized at −900 mVSCE for 120 s. Then, the specimen was allowed to stabilize at an open circuit potential for 10 min. The CPT test was then conducted in 1M NaCl solution at 250 mVSCE, and the solution temperature was increased at a rate of 1 °C/min. The current density was continuously recorded with the increasing of temperature. The CPT was defined as the temperature at which the current density reached 100 μA/cm2. Potentiodynamic polarization measurements were conducted in the 3.5 wt.% NaCl solution at 30 °C according to ASTM G 59-97. The potential was scanned from −0.8 VSCE in the anodic direction at a scanning rate of 0.1667 mV/s. The potential at which the current reached 100 μA/cm2 was identified as the pitting potential (Epit). All the experiments were terminated 60 s after the current density increased to 100 μA/cm2.
2.4. Microstructure Characterization
The microstructure of the specimen was observed by the optical microscopy (OM, Shanghai Microscope Company, Shanghai, China) and scanning electron microscopy (SEM, Philips XL30 FEG, Royal Dutch Philips Electronics Ltd., Amsterdam, Netherlands). Ferrite and austenite phases were distinguished using electrochemical etching in 30 wt.% KOH solution at a potential of 2 V for 10 s before observation. Transmission electron microscopy (TEM, JEOL JEM 2100F, JEOL Ltd., Akishima, Tokyo, Japan) was carried out at 200 kV to examine the secondary phase precipitated in the specimens.
3. Results and Discussion
3.1. Influence of Heat Input
Figure 2 exhibits the microstructure of LDSS 2002 specimens after the simulated welding with different heat inputs. The dark austenite phase was embedded inside the gray ferrite matrix. As the heat input increased from 5 kJ/cm to 35 kJ/cm, the austenite phase gradually increased and changed from rod-shaped to dendritic. For the heat input of 5 kJ/cm, a small amount of austenite distributed in the ferrite matrix, as shown in Figure 2a. When the heat input increased to 15 kJ/cm as shown in Figure 2b, the Widmanstatten-type austenite (WA) and intragranular austenite (IGA) formed in the ferrite matrix. Meanwhile, both the size and quantity of austenite increased compared with the lower heat input. For the highest heat input of 35 kJ/cm, a large amount of ferrite had transformed into austenite. Figure 2d shows the dendritic austenite phase, which presents a significant increase in the volume content. According to the previous reports, the austenite tends to form at the grain boundary of the ferrite phase [11,32,33]. The phase transformation from ferrite to austenite is controlled by diffusion [25,34,35], which is strongly affected by heat input. The reformation of the austenite phase is determined by a para-equilibrium transformation mechanism where the key process is the diffusion of the elements such as nitrogen. The microstructure of specimens with different heat inputs is similar to the microstructure of specimens with different HTHAZ cooling rates at a range of 1350–800 °C [16]. This was owing to the fact that the heat input was related to the HTHAZ cooling rates and that the higher heat input results in the lower cooling rate. Increasing the heat input will prolong the cooling time, thus promoting the diffusion of austenite-stabilizing elements and ensuring more transformation of ferrite to austenite.
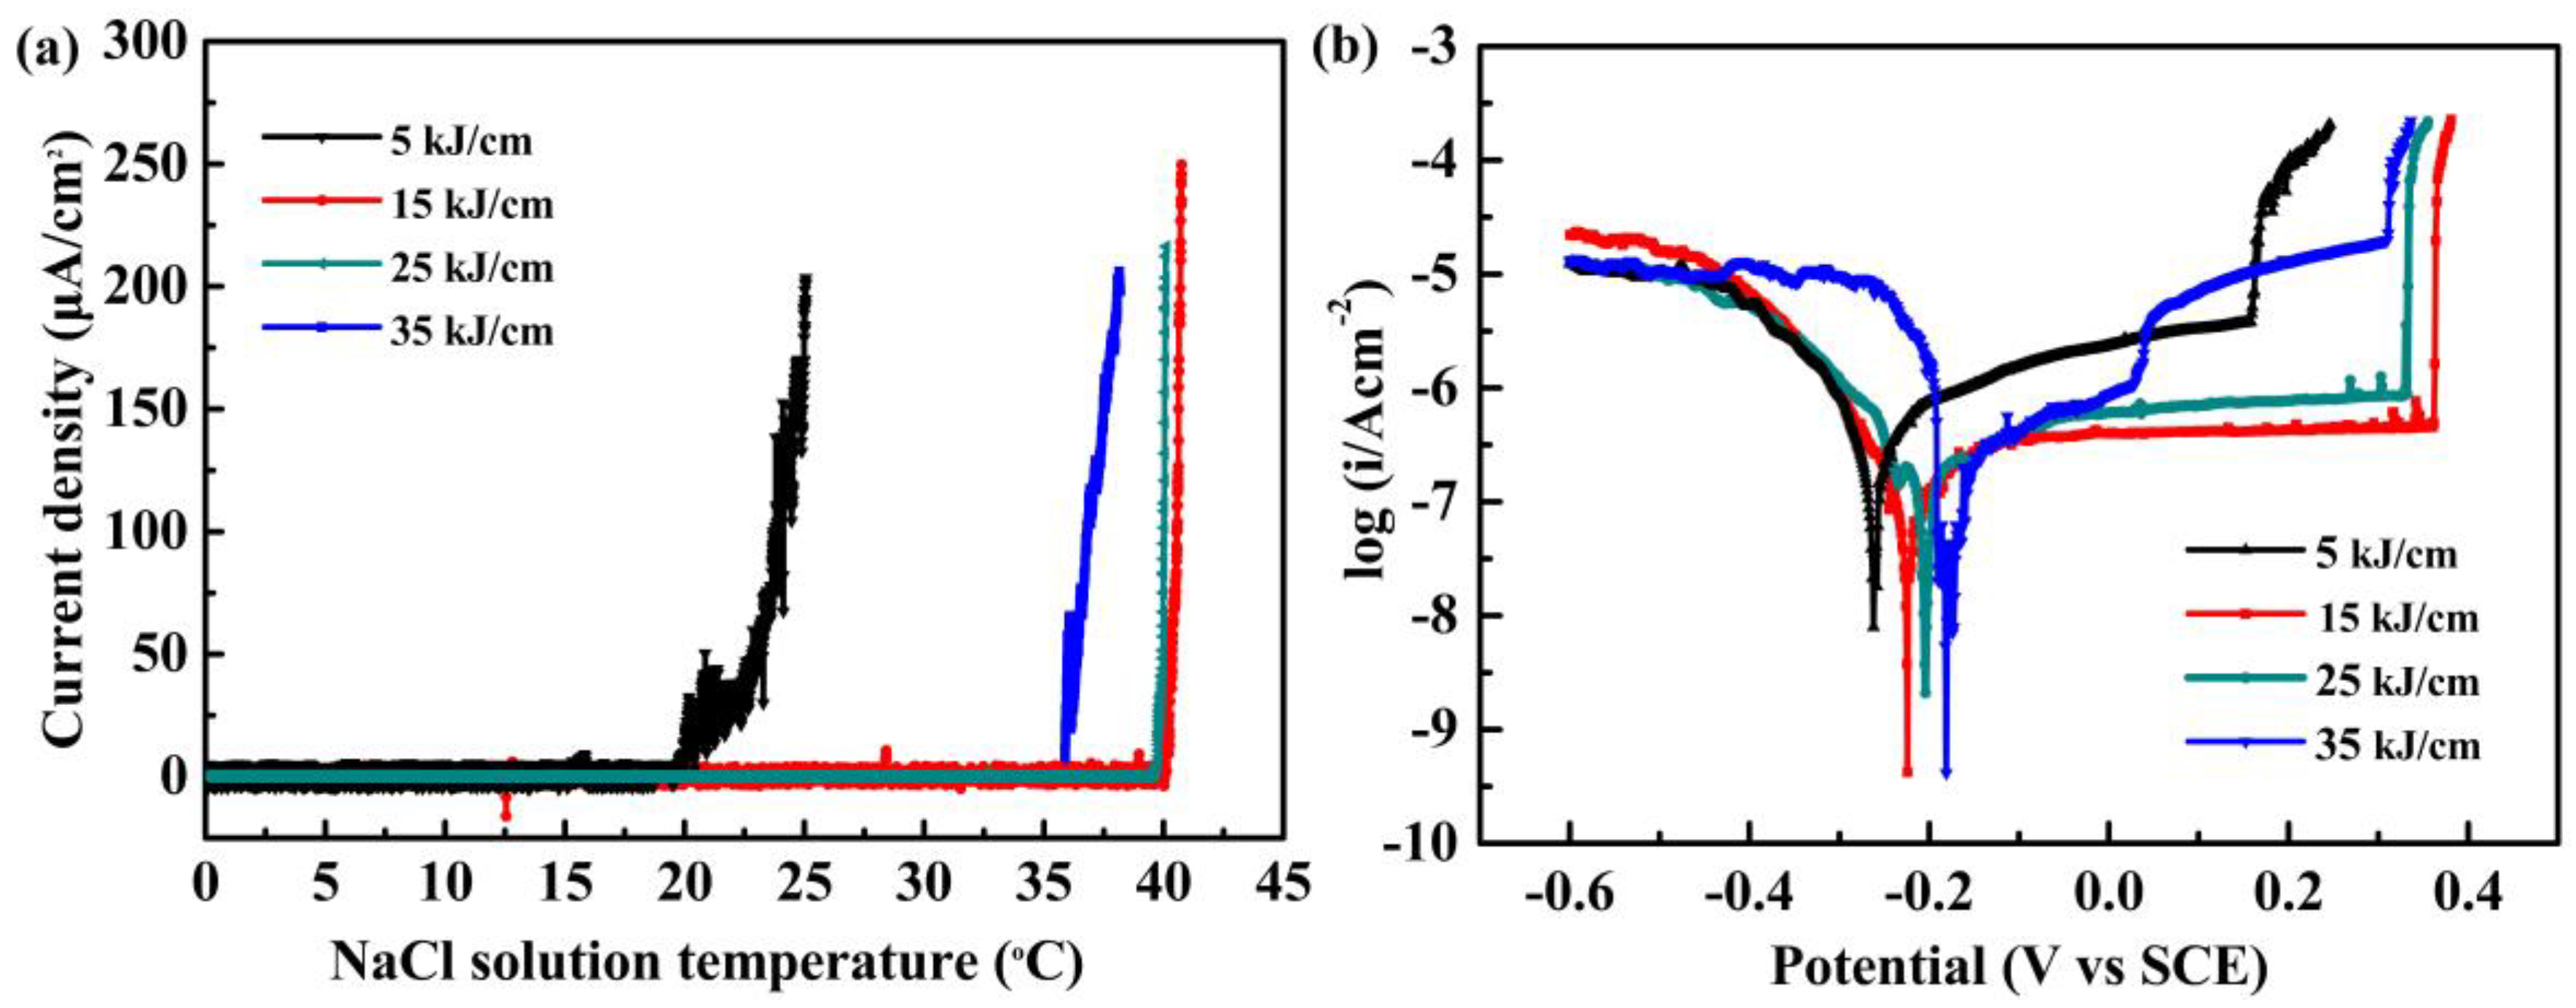
Different heat inputs and the induced microstructure evolution may lead to different pitting resistance of the LDSS 2002 heat-affected zone. Figure 3 plots the electrochemical test curves for the LDSS 2002 heat-affected zone with different heat inputs. The CPT curves of current density under 250 mVSCE versus the solution temperature for specimens with different heat inputs are displayed in Figure 3a. The derived CPT value of LDSS 2002 first increased from 24.0 °C to 40.5 °C as the heat input increased from 5 to 15 kJ/cm, and then dropped to 36.8 °C with further increasing of the heat input to 35 kJ/cm. This illustrates that the pitting resistance of LDSS 2002 was improved first and then decreased with the increase of heat input. The highest CPT value of 40.5 °C was obtained for the specimens with a heat input of 15 kJ/cm. There are few current fluctuations in the CPT curve, showing that few metastable pits had nucleated during the tests [36,37].
The pitting potential of LDSS 2002 increased from 0.215 VSCE to 0.370 VSCE as the heat input increased from 5 to 15 kJ/cm, and then decreased to 0.315 VSCE with further increasing of the heat input to 35 kJ/cm (Figure 3b). The specimen with the heat input of 15 kJ/cm presented the largest passivation region and lowest passive current density, indicating a stable passive film formed on the specimen. The results of pitting potential agreed well with the CPT results. The specimens with the heat input of 15 kJ/cm in the welding simulation presented the best pitting resistance.
For the HAZ with a low heat input, it took a short time for the specimens to cool down from the high-temperature region, which could lead to the insufficient diffusion of nitrogen. The saturation solubility of nitrogen in the ferrite phase of lean duplex steel was only 0.05% [9]. The solubility of nitrogen in the ferrite phase also decreased rapidly with a sharp decrease in temperature. The Cr2N tended to precipitate in the ferrite phase, resulting in a detrimental effect on the anti-corrosion properties [29,30]. Meanwhile, there is not enough time for nitrogen to spread and generate an austenite phase. When the heat input increased from 5 kJ/cm to 15 kJ/cm, it took more time to cool down so that elements of nitrogen and nickel had sufficient time to diffuse and form the austenite phase, which is beneficial for balancing the ferrite/austenite phases and consequently obtaining the best corrosion resistance of LDSS 2002. When the heat input value was 35 kJ/cm, the proportion of austenite phase became lager. However, the specimens would stay in the intermediate temperature region for an extended period due to a slower cooling rate corresponding to the high heat input. The precipitation of detrimental secondary phases at the boundary of the two phases or inside the ferrite phase during this period could lead to a decreased corrosion resistance of LDSS 2002 [10,38,39,40].
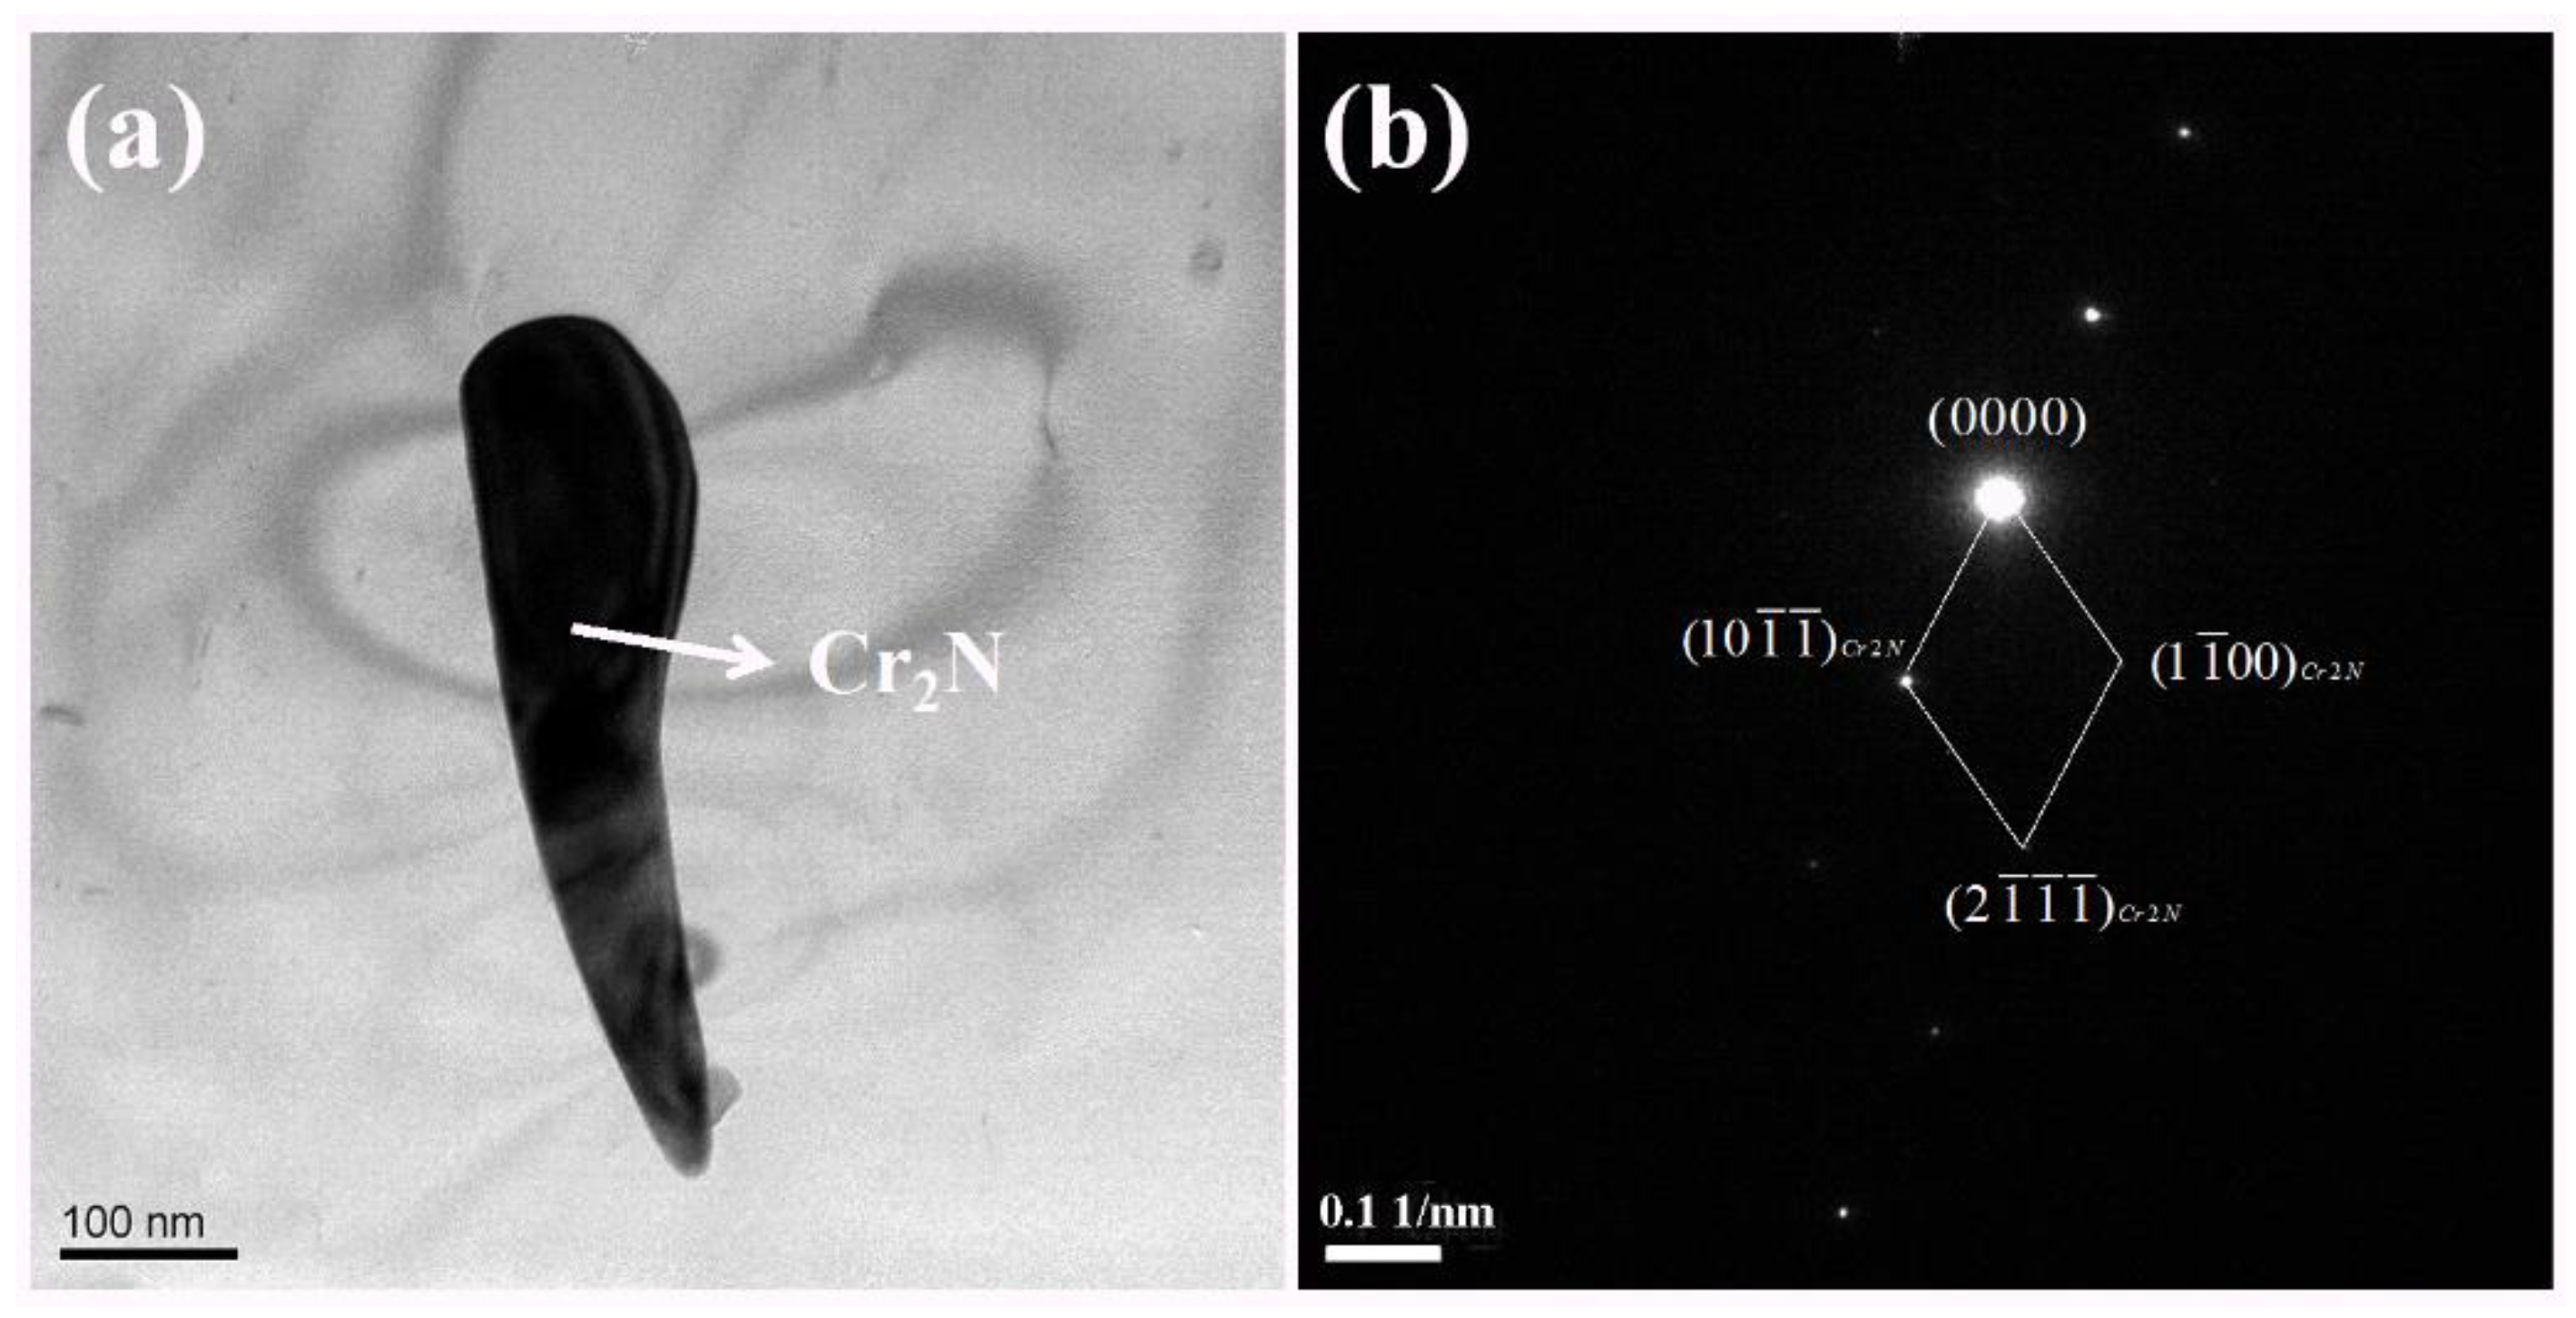
Figure 4 presents the TEM characterization of the secondary phase Cr2N in the specimen with a heat input of 5 kJ/cm. Figure 4b illustrates a diffraction pattern of nitrides. When the heat input was at a low level, the cooling rate was too fast. The oversaturated nitrogen, which could not diffuse to the two-phase boundary to form an austenite phase, precipitated the slender needle-like Cr2N inside the ferrite phase [7,41]. This result reveals that the Cr2N has precipitated under the condition of lower heat input, causing the Cr-depleted zone surrounding Cr2N. The pits in the electrochemical test may locate at the Cr-depleted zones.
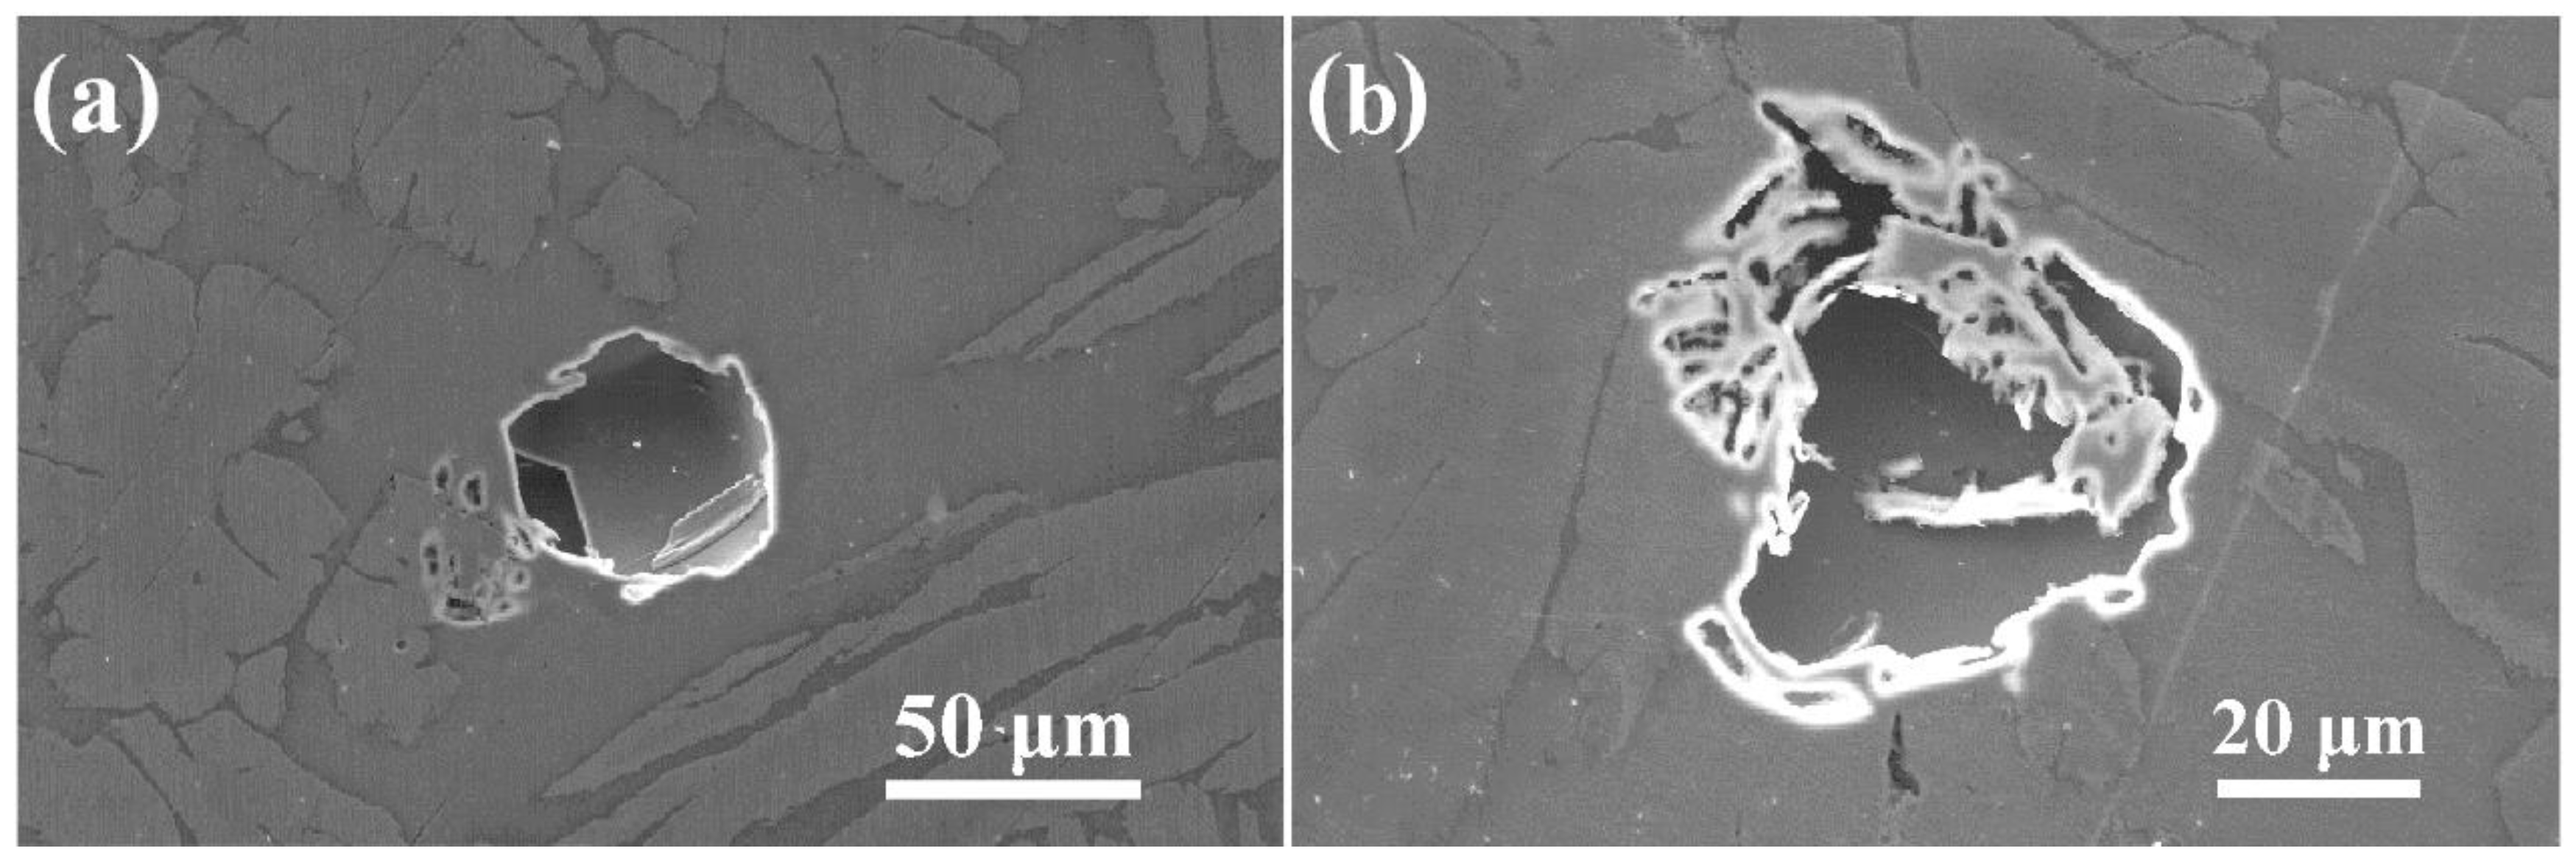
Figure 5 displays the pitting morphologies of the LDSS 2002 specimen with different heat inputs of 5 and 15 kJ/cm after the CPT test. The stable pits mainly distributed inside the ferrite phase when the heat input value was 5 kJ/cm, which may originate from the precipitation of Cr2N inside the ferrite (Figure 5a). With respect to the heat input of 15 kJ/cm, the pits stretched across the two phase boundaries and distributed in both the ferrite and austenite phases, indicating the equivalent corrosion resistance of these two phases and consequently leading to the best pitting resistance.
The measured results indicate a clear variation of pitting resistance associated with the increase of heat input. An appropriate heat input value of 15 kJ/cm was significant to prevent the uneven distribution of the ferrite and austenite phases and the precipitation of intermetallic compounds so as to obtain the satisfactory corrosion resistance.
3.2. Influence of the LTHAZ Cooling Rate
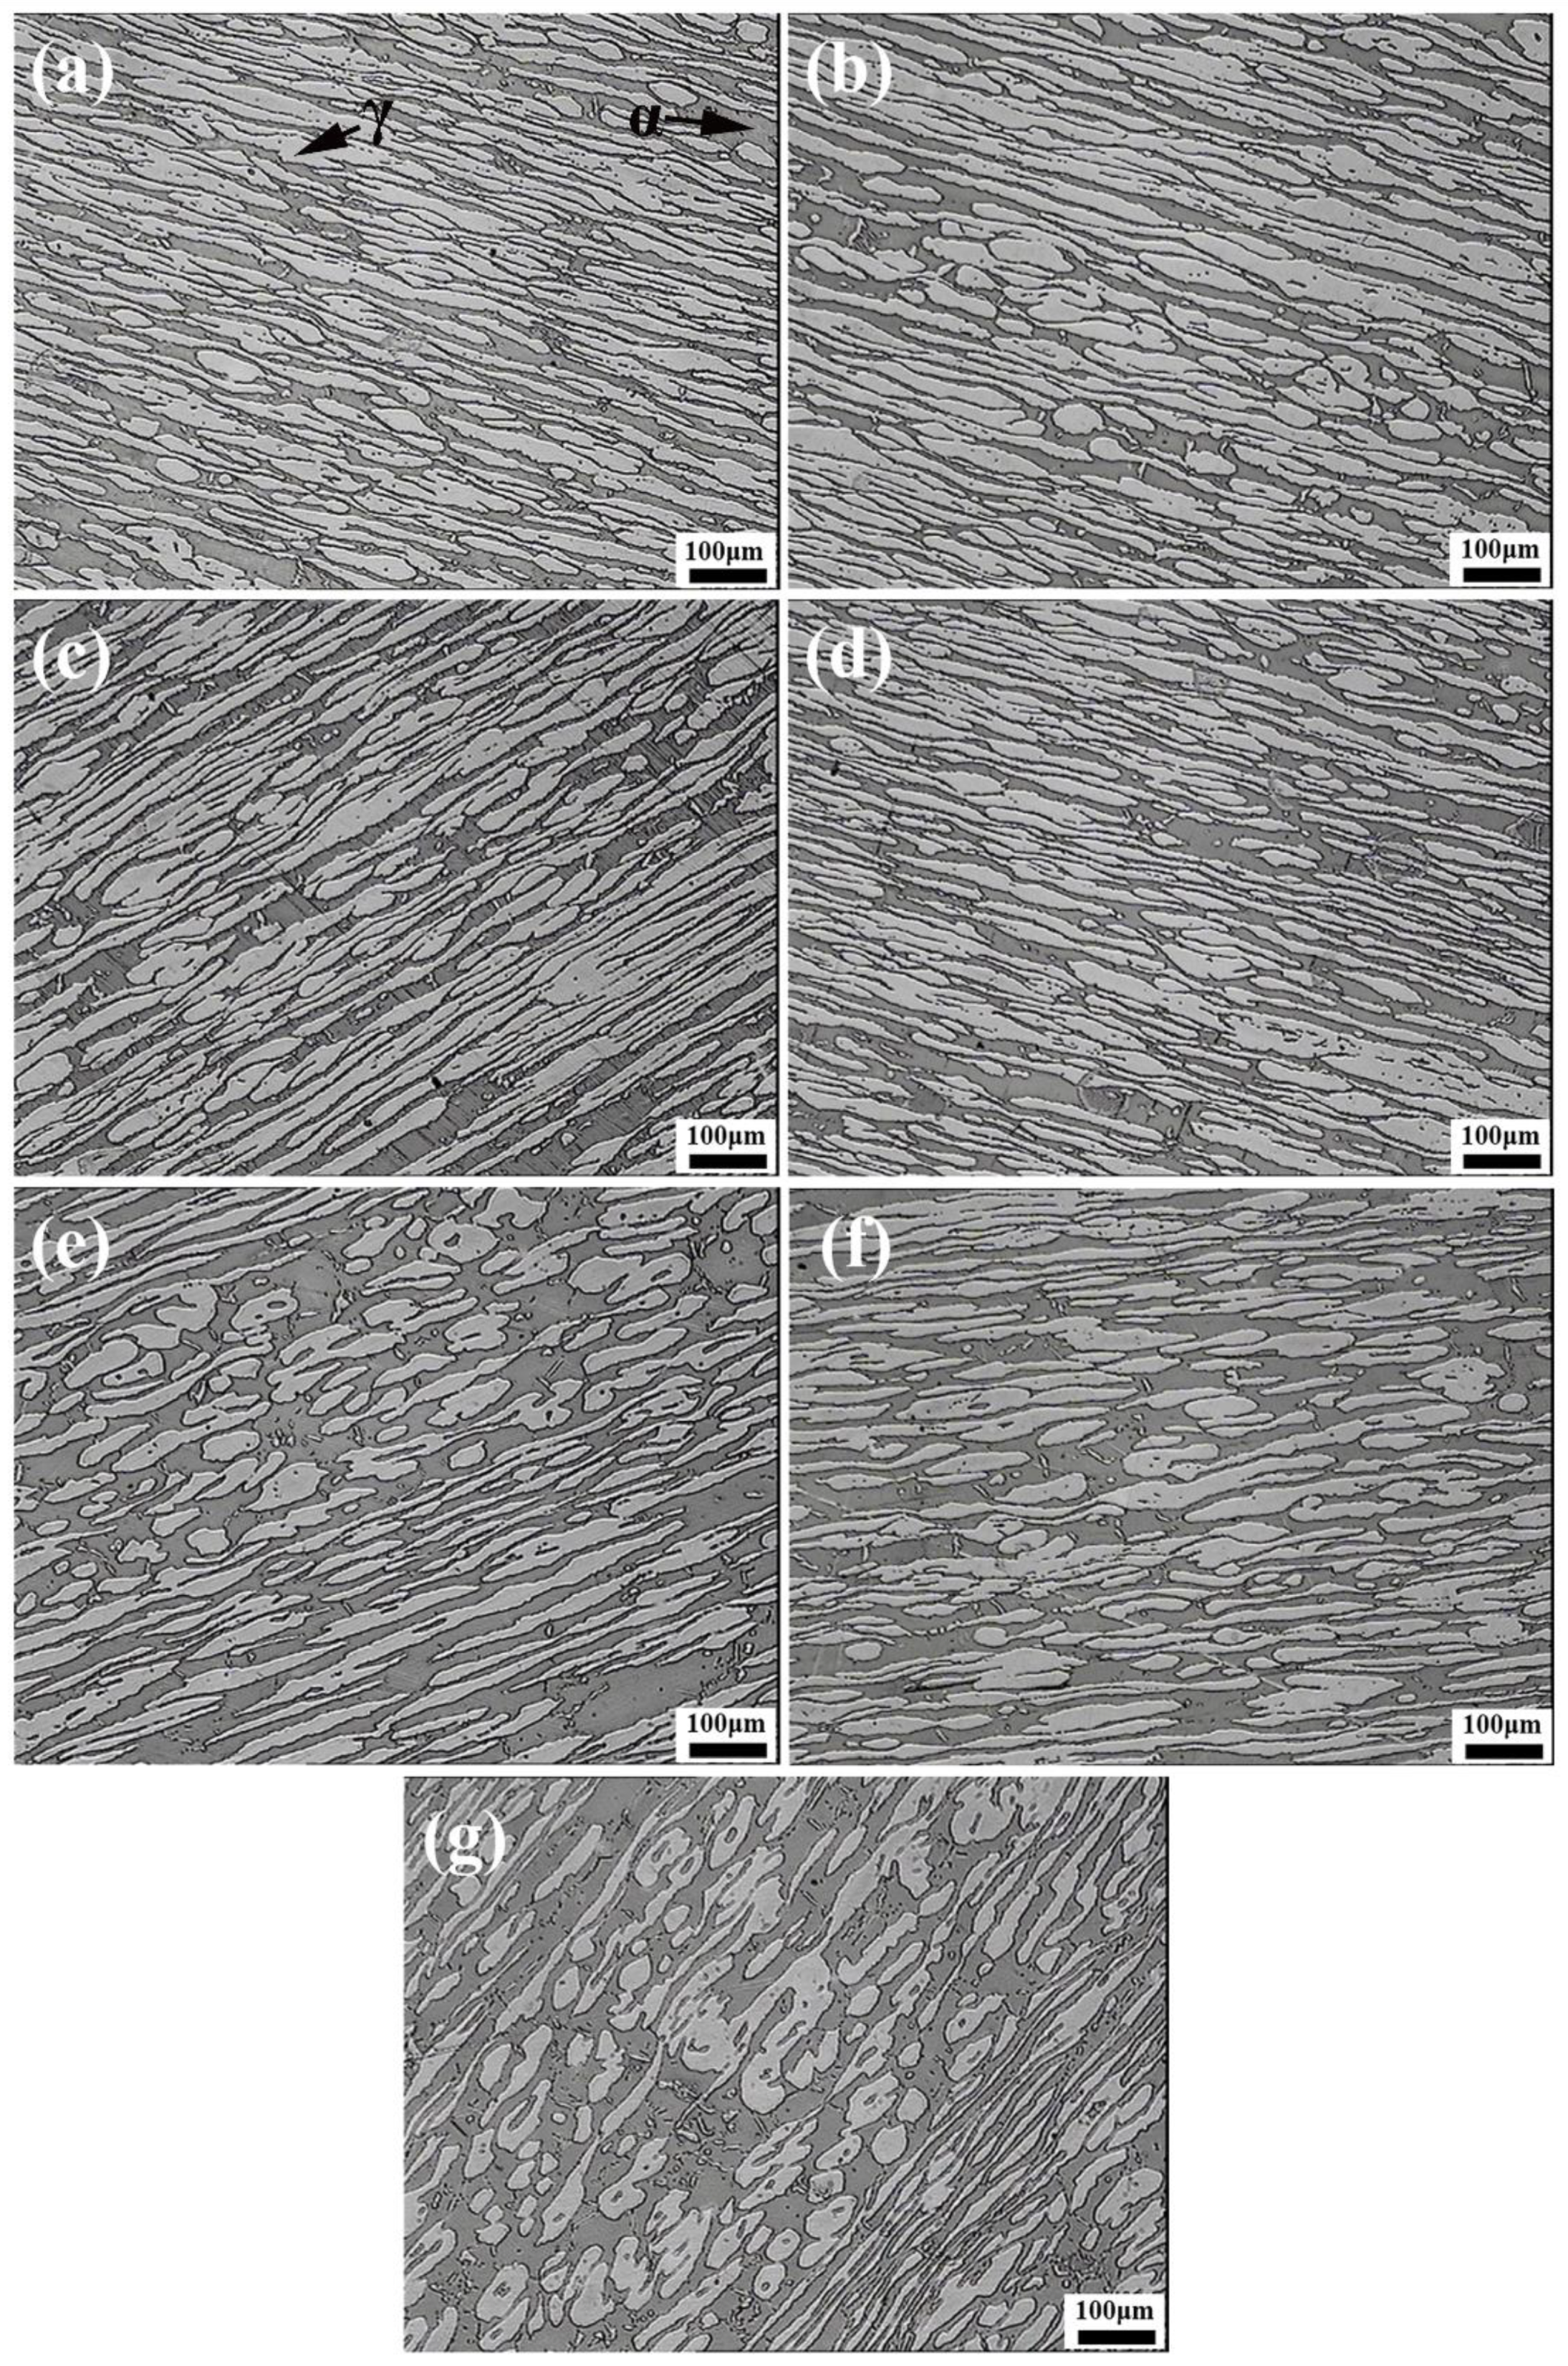
For the low temperature heat-affected zone, different cooling rates mainly caused the formation of detrimental secondary phases and influenced the phase balance. Figure 6 shows the microstructure of the specimens with different LTHAZ cooling rates. It can be seen that the ratio of ferrite to austenite in LDSS 2002 sample changed. The amount of ferrite phases increased while the amount of austenite phases decreased, indicating the transformation of austenite to ferrite with the increase of cooling rate. It is obvious that when the cooling rates were 5, 10, and 20 °C/s, the ferrite phase increased and the austenite grains also coarsened compared with the microstructure of specimens with the cooling rates of 0.25, 0.5, 1, and 2 °C/s. This was caused by the longer stay of the specimens in the relatively high-temperature zone due to the slower cooling rates during the LTHAZ cooling process.
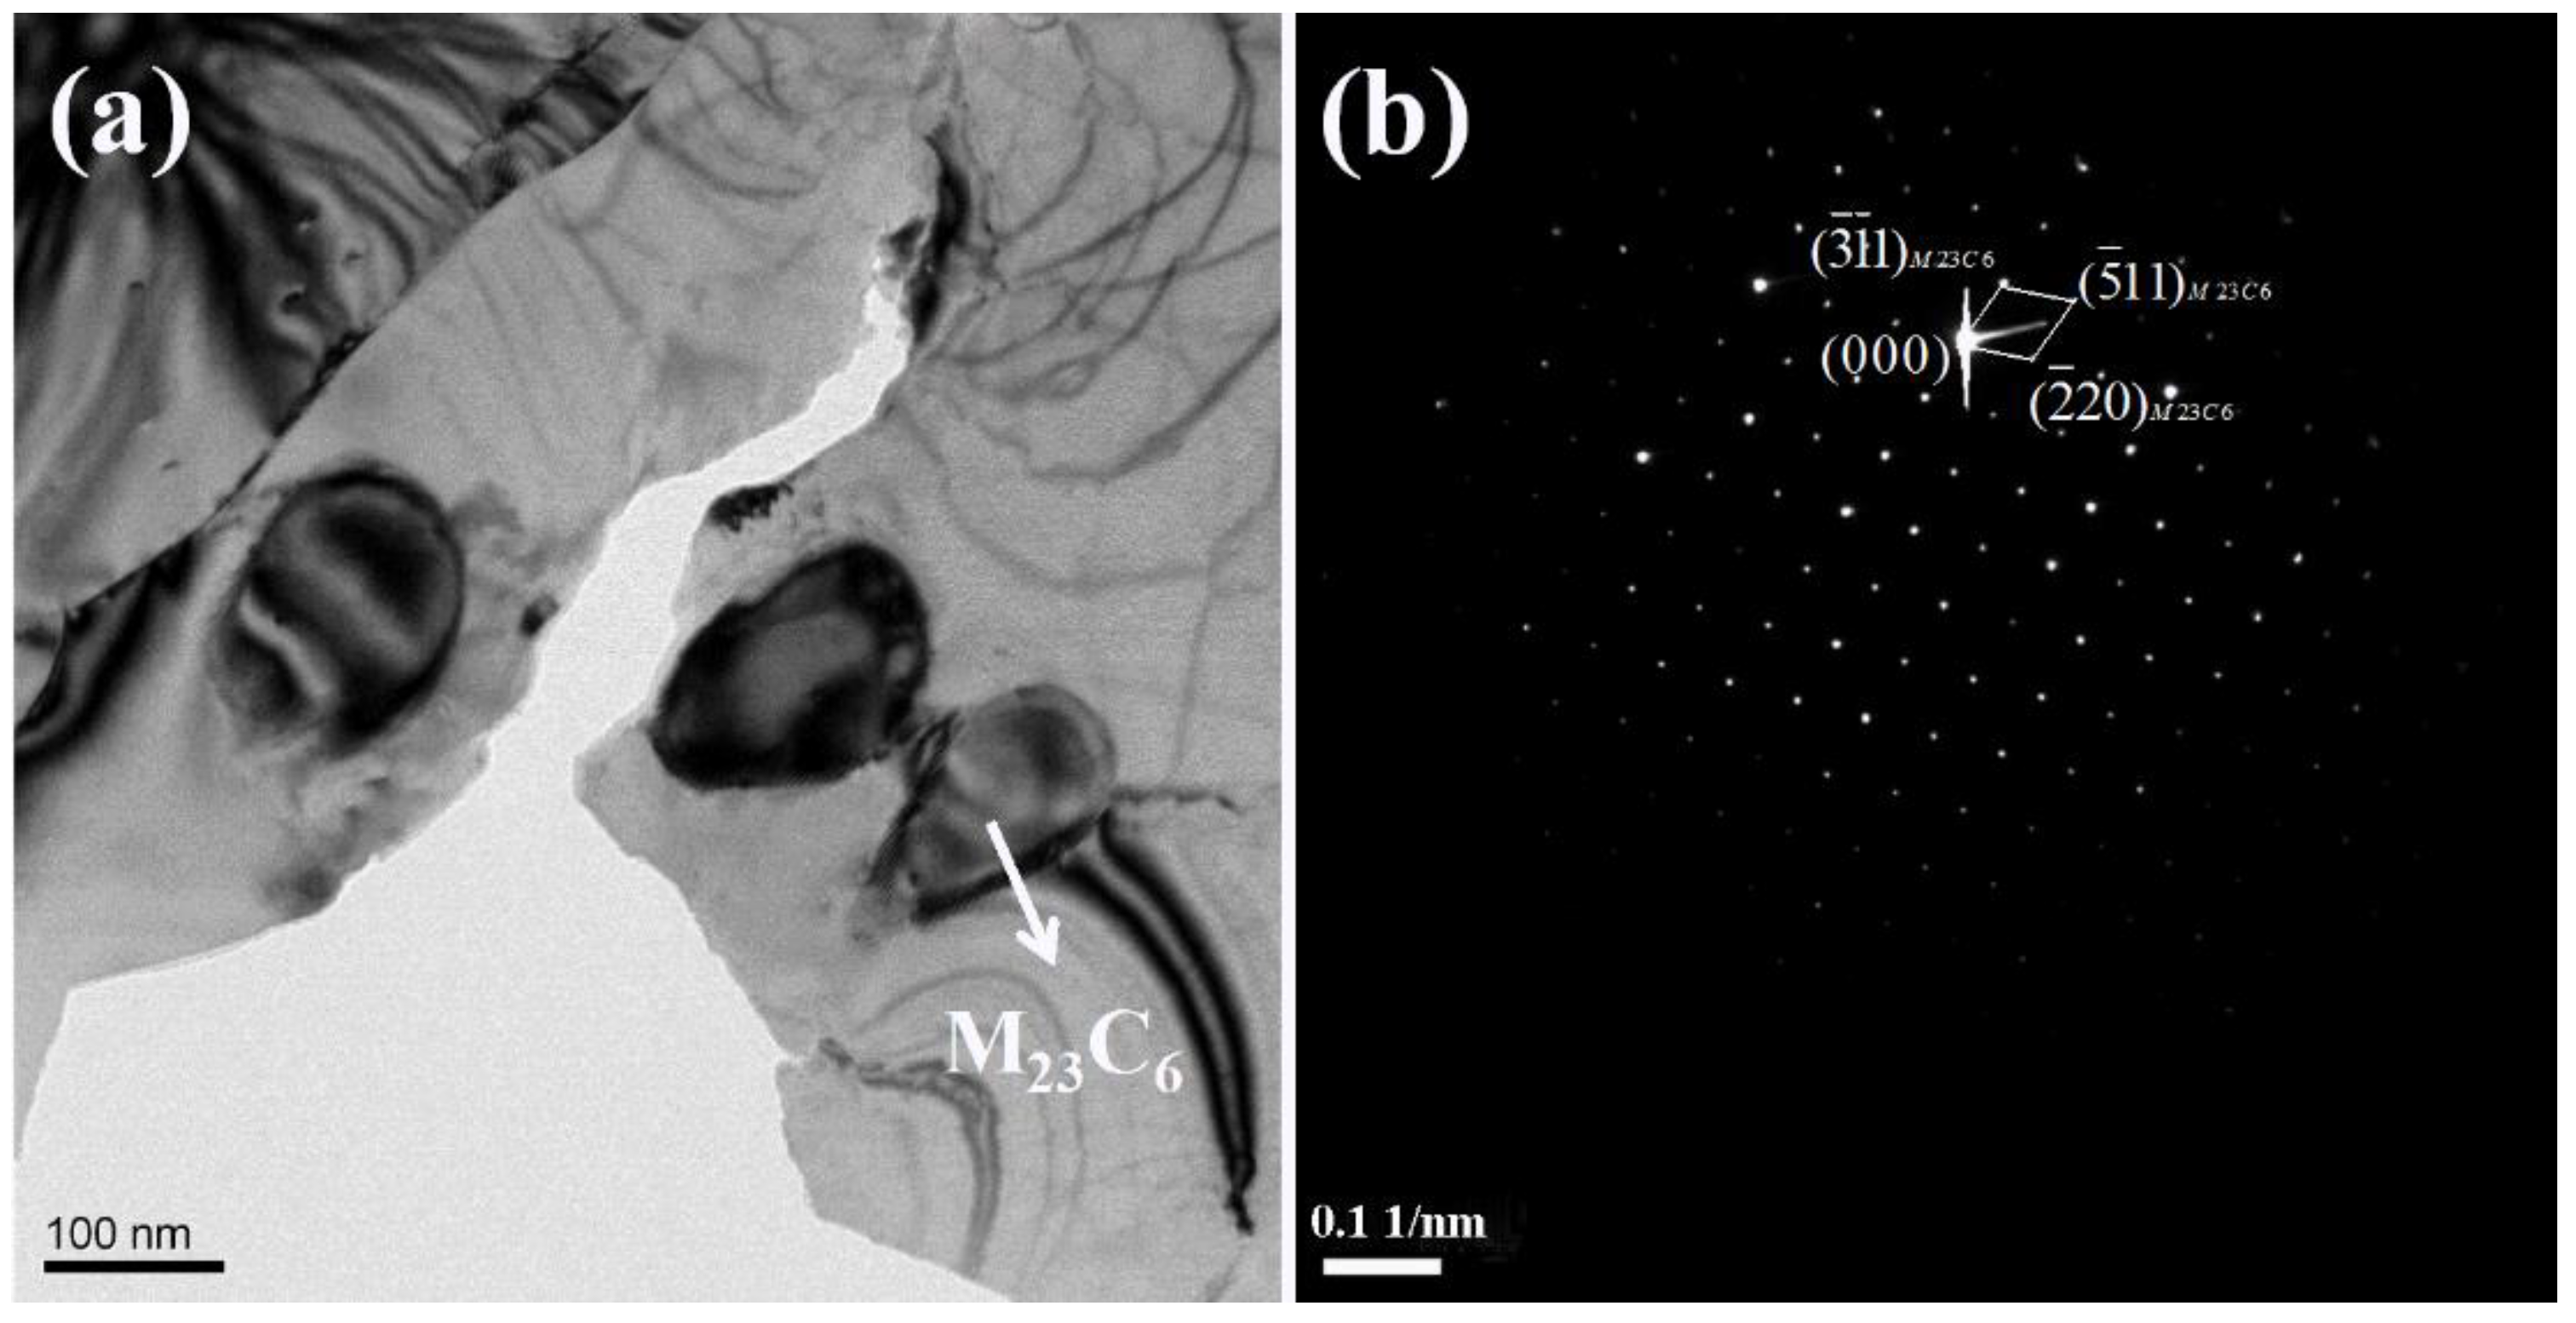
During the cooling process, the LDSS 2002 specimen stayed in the intermediate temperature region for a relatively short time when a fast cooling rate was adopted, and the elements of C, N, and Cr did not have enough time to diffuse to form harmful secondary phases, which was beneficial to the corrosion resistance. Known from the phase fractions in the thermodynamic equilibrium calculated using Thermo-Calc (Thermo-Calc Software, Solna, Sweden) for the LDSS 2002 [11,13], the detrimental secondary phase of M23C6 would precipitate at the temperature range of 850 to 500 °C. A lower cooling rate means a longer time staying in this temperature range, resulting in the precipitation of the secondary phase. To verify whether the LDSS 2002 specimen had secondary phase precipitations with low cooling rates, the microstructure of the 2002 specimen cooled down from 1050 °C to room temperature with a cooling rate of 0.25 °C/s was characterized using TEM as shown in Figure 7. It confirmed the precipitation of M23C6 in the sample with a cooling rate of 0.25 °C/s, which has also been reported before [42,43,44]. The specimens were maintained in the intermediate temperature region for a long time because of the much lower cooling rate during the cooling process, which was beneficial to the diffusion of C and N from austenite phase and the diffusion of Cr from ferrite phase to the two-phase boundary, thus forming the harmful secondary phases.
The cooling rate influences the precipitation of secondary phases in LDSS 2002 sample, which would also affect the pitting resistance of the specimens. Figure 8a reveals the results of critical pitting temperature (CPT) versus the cooling rates. Figure 8b illustrates the potentiodynamic polarization curves of LDSS 2002 specimens with different cooling rates in 3.5 wt.% NaCl solution. The CPT value increased from 23.3 °C to 30.6 °C as the cooling rate increased. The CPT value reached the maximum with a cooling rate of 20 °C/s, indicating that the best corrosion resistance was obtained with the fastest cooling rate. As shown in Figure 8a, there were some current glitches in the CPT curves, which revealed the unstable passive films. However, for the specimens with a cooling rate of 20 °C/s, there were few fluctuations in the curve, suggesting that the passive film on the surface under this condition was stable. The results of the potentiodynamic polarization tests are consistent with the CPT tests. With an increasing cooling rate from 0.25 °C/s to 20 °C/s, the pitting potential increased from 0.376 VSCE to 0.513 VSCE. It appears that the corrosion potential of specimens with the cooling rate of 0.25, 0.5, 1, and 2 °C/s was about 0.2 VSCE, while the value of the other three samples was near 0.3 VSCE. As seen in the potentiodynamic polarization curves, when the cooling rates were 0.25 and 0.5 °C/s, there were distinct metastable current peaks, which may be caused by the precipitation of secondary phases such as M23C6. Based on the results above, the specimens exhibited the best pitting resistance at a cooling rate of 20 °C/s.
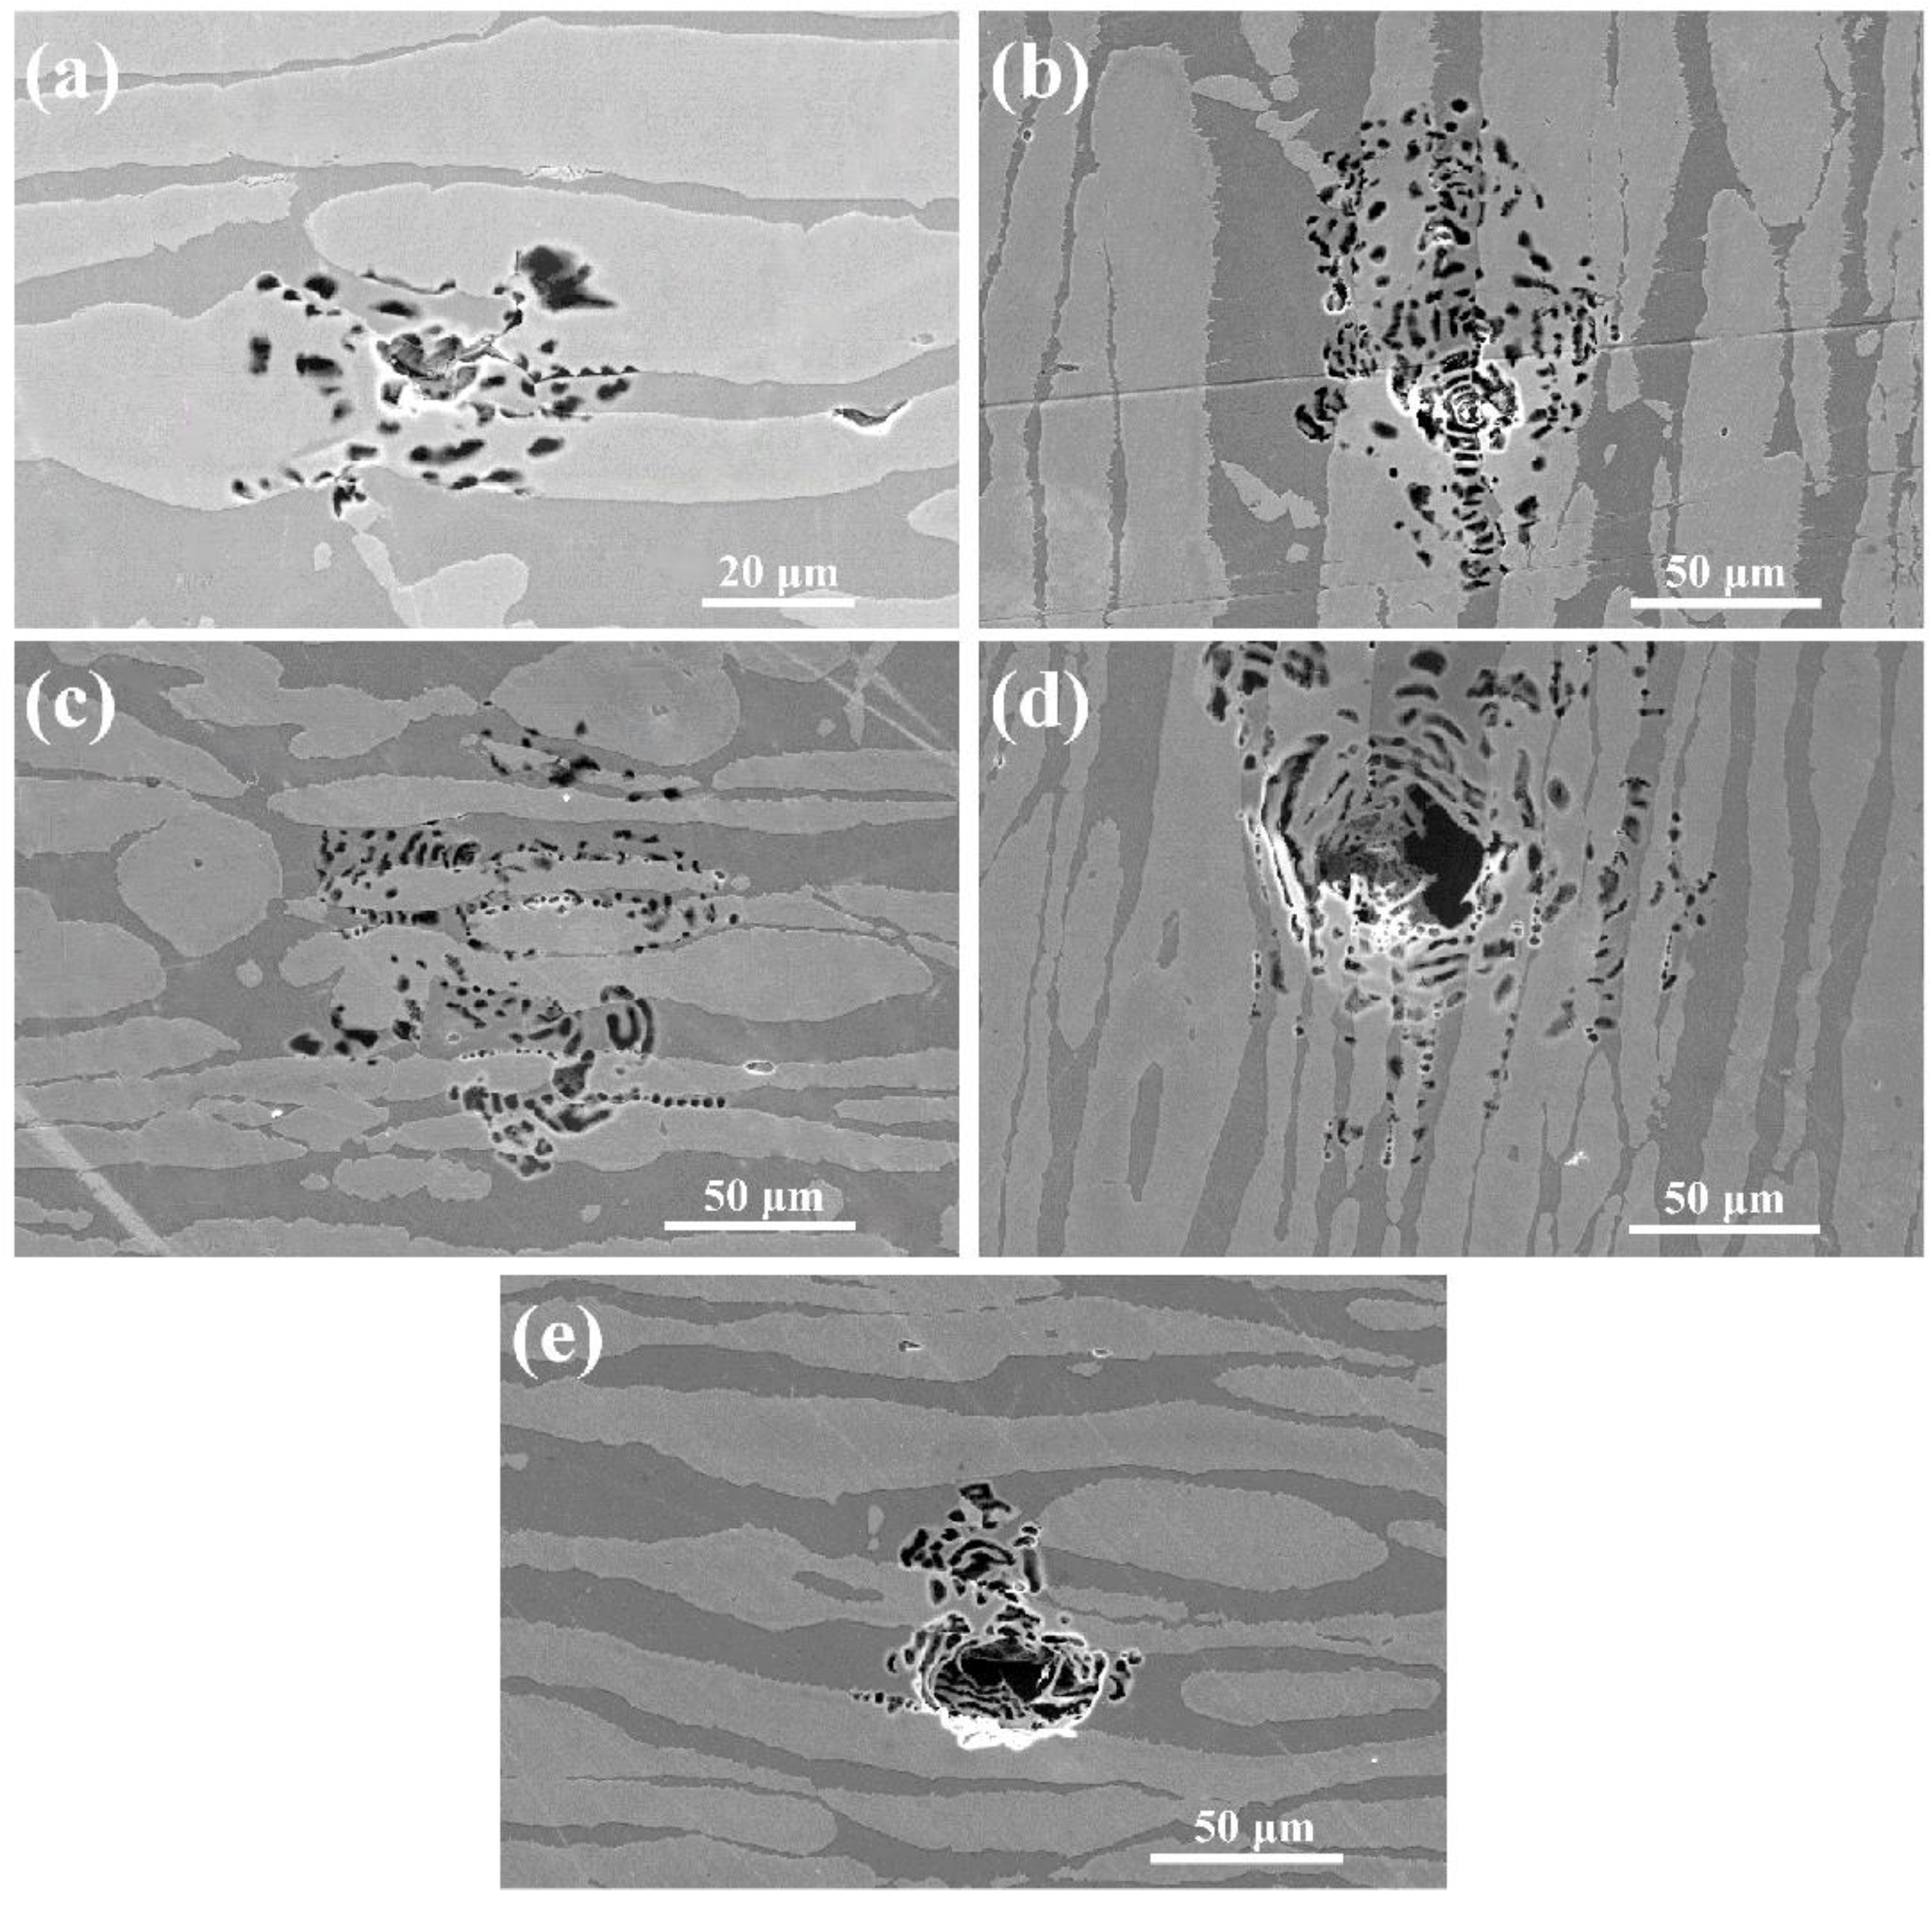
The SEM morphologies of the LDSS 2002 specimens with different cooling rates after the CPT tests are depicted in Figure 9. All the stable pits present the lace-like topography. According to the literature [45,46], the lace-like morphology illustrates that the hindered diffusion is essential for the formation of stable pits in the early stage of pitting development. As seen in Figure 9, the stable lace-like pits can be found along the ferrite/austenite phase boundaries and preferentially extend into the ferrite phase. If the pits continue to develop, they appear to grow into the austenite phase. This illustrates that the harmful secondary phases of M23C6 and Cr2N may precipitate along the ferrite/austenite boundary during the LTHAZ cooling process, leading to the formation of a Cr-depleted zone. Furthermore, the element Cr in the ferrite phase diffused into the ferrite/austenite boundary, which resulted in the expansion of pits into the interior of the ferrite phase that lacked Cr [47].
4. Conclusions
For the purpose of providing scientific guidance and the optimum welding parameters for the manufacturing and welding processes of a novel lean duplex stainless steel 2002, the influence of heat input and cooling rate on the microstructure and pitting resistance in the simulated heat-affected zone of LDSS 2002 were investigated. On the basis of the above experiments, the following conclusions can be drawn:
1. The microstructure of LDSS 2002 changed with different heat inputs. The rod-like austenite phase appeared in the HAZ for a low heat input. With the increase of heat input, the austenite presented as dendritic structures with the increased amount and size.
2. As the heat input rose from 5 kJ/cm to 15 kJ/cm, the CPT increased from 24 °C to 40.5 °C and the Epit increased from 0.215 VSCE to 0.370 VSCE. By further increasing the heat input to 35 kJ/cm, the CPT value dropped to 36.8 °C and the Epit decreased to 0.315 VSCE, demonstrating that the pitting resistance was enhanced first and later deteriorated. Under the low heat input, the initiation position of pitting altered from the ferrite phase to spanning across both the two phases. For the higher heat input, the pits initiated at the ferrite/austenite interface and subsequently grew into the austenite phase.
3. When the LDSS 2002 specimen was cooled from 1050 °C to room temperature, both the CPT and Epit increased with the increase of cooling rate, indicating that the corrosion resistance had been improved as the cooling rate of LTHAZ increased.
4. During the cooling process, the content of the ferrite phase increased and the austenite decreased with the cooling rate increasing. All the stable pits initiated along the ferrite and austenite boundaries and extended into the ferrite phases. This may be caused by the precipitation of the detrimental secondary phase of M23C6.
5. For the LDSS 2002 sample in the same condition with that in this research, the optimum heat input and the LTHAZ cooling rate was 15 kJ/cm and 20 °C/s, respectively.
Author Contributions
Y.Y. and Y.G. carried out the experiments. Y.Y. analyzed the data and wrote the paper. Y.L. gave the writing revision. J.L. and Y.J. framed the experimental scheme and provided the funding.
Funding
This research is funded by the National Key Research and Development Program of China, Grant number 2018 YFB 0704400 and the National Natural Science Foundation of China, Grant numbers 51671059, 51871061, and 51801028.
Acknowledgments
The authors gratefully acknowledge the helpful collaboration of Baosteel.
Conflicts of Interest
The authors declare no conflict of interest.
References
- Bhattacharya, A.; Singh, P.M. Electrochemical behaviour of duplex stainless steels in caustic environment. Corros. Sci. 2011, 53, 71–81. [Google Scholar] [CrossRef]
- Lai, R.; Cai, Y.; Wu, Y.; Li, F.; Hua, X. Influence of absorbed nitrogen on microstructure and corrosion resistance of 2205 duplex stainless steel joint processed by fiber laser welding. J. Mater. Process. Technol. 2016, 231, 397–405. [Google Scholar] [CrossRef]
- Baddoo, N.R. Stainless steel in construction: A review of research, applications, challenges and opportunities. J. Constr. Steel Res. 2008, 64, 1199–1206. [Google Scholar] [CrossRef]
- Johansson, M.M.; Marianne Westin, E.; Oliver, J.; Pettersson, R.F.A. Localized Corrosion Resistance of Welded Austenitic and Lean Duplex Stainless Steels. Weld. World 2011, 55, 19–27. [Google Scholar] [CrossRef]
- Sathirachinda, N.; Pettersson, R.; Pan, J. Depletion effects at phase boundaries in 2205 duplex stainless steel characterized with SKPFM and TEM/EDS. Corros. Sci. 2009, 51, 1850–1860. [Google Scholar] [CrossRef]
- Kim, S.; Jang, S.; Lee, I.; Park, Y. Effects of solution heat-treatment and nitrogen in shielding gas on the resistance to pitting corrosion of hyper duplex stainless steel welds. Corros. Sci. 2011, 53, 1939–1947. [Google Scholar] [CrossRef]
- Zhang, Z.; Wang, Z.; Jiang, Y.; Tan, H.; Han, D.; Guo, Y.; Li, J. Effect of post-weld heat treatment on microstructure evolution and pitting corrosion behavior of UNS S31803 duplex stainless steel welds. Corros. Sci. 2012, 62, 42–50. [Google Scholar] [CrossRef]
- Wei, Z.; Laizhu, J.; Jincheng, H.; Hongmei, S. Effect of ageing on precipitation and impact energy of 2101 economical duplex stainless steel. Mater. Charact. 2009, 60, 50–55. [Google Scholar] [CrossRef]
- Zhang, L.; Zhang, W.; Jiang, Y.; Deng, B.; Sun, D.; Li, J. Influence of annealing treatment on the corrosion resistance of lean duplex stainless steel 2101. Electrochim. Acta 2009, 54, 5387–5392. [Google Scholar] [CrossRef]
- Zhang, L.; Jiang, Y.; Deng, B.; Zhang, W.; Xu, J.; Li, J. Effect of aging on the corrosion resistance of 2101 lean duplex stainless steel. Mater. Charact. 2009, 60, 1522–1528. [Google Scholar] [CrossRef]
- Guo, Y.; Hu, J.; Li, J.; Jiang, L.; Liu, T.; Wu, Y. Effect of Annealing Temperature on the Mechanical and Corrosion Behavior of a Newly Developed Novel Lean Duplex Stainless Steel. Materials 2014, 7, 6604–6619. [Google Scholar] [CrossRef] [PubMed] [Green Version]
- Guo, Y.; Hu, J.; Jiang, Y.; Li, J. Characterization of Strain-induced Martensite and Anodic Polarization Properties of a Newly Developed Lean Duplex Stainless Steel 2002 after Tensile Deformation. Int. J. Electrochem. Sci. 2016, 11, 4812–4827. [Google Scholar] [CrossRef]
- Sun, T.; Guo, Y.; Jiang, Y.; Li, J. Effect of Short-Time Aging on the Pitting Corrosion Behavior of a Novel Lean Duplex Stainless Steel 2002. Acta Metall. Sin. (Engl. Lett.) 2018. [Google Scholar] [CrossRef]
- Chen, L.; Tan, H.; Wang, Z.; Li, J.; Jiang, Y. Influence of cooling rate on microstructure evolution and pitting corrosion resistance in the simulated heat-affected zone of 2304 duplex stainless steels. Corros. Sci. 2012, 58, 168–174. [Google Scholar] [CrossRef]
- Guo, Y.; Sun, T.; Hu, J.; Jiang, Y.; Jiang, L.; Li, J. Microstructure evolution and pitting corrosion resistance of the Gleeble-simulated heat-affected zone of a newly developed lean duplex stainless steel 2002. J. Alloys Compd. 2016, 658, 1031–1040. [Google Scholar] [CrossRef]
- Mohammed, G.; Ishak, M.; Aqida, S.; Abdulhadi, H. Effects of Heat Input on Microstructure, Corrosion and Mechanical Characteristics of Welded Austenitic and Duplex Stainless Steels: A Review. Metals 2017, 7, 39. [Google Scholar] [CrossRef]
- Nowacki, J.; Rybicki, P. The influence of welding heat input on submerged arc welded duplex steel joints imperfections. J. Mater. Process. Technol. 2005, 164, 1082–1088. [Google Scholar] [CrossRef]
- Sun, J.; Wu, C. The effect of welding heat input on the weldpool behavior in MIG welding. Sci. China Ser. E 2002, 45, 291. [Google Scholar] [CrossRef]
- Hsieh, R.-I.; Liou, H.-Y.; Pan, Y.-T. Effects of Cooling Time and Alloying Elements on the Microstructure of the Gleeble-Simulated Heat-Affected Zone of 22% Cr Duplex Stainless Steels. J. Mater. Eng. Perform. 2001, 10, 526–536. [Google Scholar] [CrossRef]
- Pekkarinen, J.; Kujanpää, V. The effects of laser welding parameters on the microstructure of ferritic and duplex stainless steels welds. Phys. Procedia 2010, 5, 517–523. [Google Scholar] [CrossRef]
- Mohammed, G.R.; Ishak, M.; Aqida, S.; Abdulhadi, H.A. The effect of fiber laser parameters on microhardness and microstructure of duplex stainless steel. MATEC Web Conf. 2017, 90, 01024. [Google Scholar] [CrossRef]
- Lundqvist, B.; Norberg, P.; Olsson, K. Influence of different welding conditions on mechanical properties and corrosion resistance of sandvik SAF 2205 (UNS S31803). In Proceedings of the Conference on Duplex Stainless Steels, The Hague, The Netherlands, 16–18 November 1986; pp. 16–29. [Google Scholar]
- Deng, B.; Wang, Z.; Jiang, Y.; Sun, T.; Xu, J.; Li, J. Effect of thermal cycles on the corrosion and mechanical properties of UNS S31803 duplex stainless steel. Corros. Sci. 2009, 51, 2969–2975. [Google Scholar] [CrossRef]
- Ramirez, A.J.; Brandi, S.D. Application of discrete distribution point heat source model to simulate multipass weld thermal cycles in medium thick plates. Sci. Technol. Weld. Joining 2004, 9, 72–82. [Google Scholar] [CrossRef]
- Hertzman, S.; Brolund, B.; Ferreira, P.J. An experimental and theoretical study of heat-affected zone austenite reformation in three duplex stainless steels. Metall. Mater. Trans. A 1997, 28, 277–285. [Google Scholar] [CrossRef]
- M, M.A.; Shrikrishna, K.A.; Sathiya, P.; Goel, S. The impact of heat input on the strength, toughness, microhardness, microstructure and corrosion aspects of friction welded duplex stainless steel joints. J. Manuf. Process. 2015, 18, 92–106. [Google Scholar] [CrossRef]
- Menendez, H.; Devine, T.M. The Influence of Microstructure on the Sensitization Behavior of Duplex Stainless Steel Welds. Corrosion 1990, 46, 410–418. [Google Scholar] [CrossRef]
- Chen, T.; Yang, J. Effects of solution treatment and continuous cooling on σ-phase precipitation in a 2205 duplex stainless steel. Mater. Sci. Eng. A 2001, 311, 28–41. [Google Scholar] [CrossRef]
- Sieurin, H.; Sandström, R. Austenite reformation in the heat-affected zone of duplex stainless steel 2205. Mater. Sci. Eng. A 2006, 418, 250–256. [Google Scholar] [CrossRef]
- Chan, K.; Tjong, S. Effect of Secondary Phase Precipitation on the Corrosion Behavior of Duplex Stainless Steels. Materials 2014, 7, 5268–5304. [Google Scholar] [CrossRef] [Green Version]
- Lv, S.; Yang, Z.; Zhang, B.; Chen, J.; Chen, Y.; Li, X. Corrosion and passive behaviour of duplex stainless steel 2205 at different cooling rates in a simulated marine-environment solution. J. Iron Steel Res. Int. 2018, 25, 943–953. [Google Scholar] [CrossRef]
- Ovarfort, R. Critical pitting temperature measurements of stainless steels with an improved electrochemical method. Corros. Sci. 1989, 29, 987–993. [Google Scholar] [CrossRef]
- Deng, B.; Wang, Z.; Jiang, Y.; Wang, H.; Gao, J.; Li, J. Evaluation of localized corrosion in duplex stainless steel aged at 850 °C with critical pitting temperature measurement. Electrochim. Acta 2009, 54, 2790–2794. [Google Scholar] [CrossRef]
- Liou, H.; Hsieh, R.; Tsai, W. Microstructure and pitting corrosion in simulated heat-affected zones of duplex stainless steels. Mater. Chem. Phys. 2002, 74, 33–42. [Google Scholar] [CrossRef]
- Liou, H.; Hsieh, R.; Tsai, W. Microstructure and stress corrosion cracking in simulated heat-affected zones of duplex stainless steels. Corros. Sci. 2002, 44, 2841–2856. [Google Scholar] [CrossRef]
- Liu, J.; Du, X.; Yang, Y.; Deng, Y.; Hu, W.; Zhong, C. A one-step, clean, capping-agent-free electrochemical approach to prepare Pt nanoparticles with preferential (100) orientation and their high electrocatalytic activities. Electrochem. Commun. 2015, 58, 6–10. [Google Scholar] [CrossRef]
- Zhong, C.; Hu, W.B.; Cheng, Y.F. On the essential role of current density in electrocatalytic activity of the electrodeposited platinum for oxidation of ammonia. J. Power Sources 2011, 196, 8064–8072. [Google Scholar] [CrossRef]
- Ha, H.; Kwon, H. Effects of CrN on the pitting corrosion of high nitrogen stainless steels. Electrochim. Acta 2007, 52, 2175–2180. [Google Scholar] [CrossRef]
- Huang, C.; Shih, C. Effects of nitrogen and high temperature aging on σ phase precipitation of duplex stainless steel. Mater. Sci. Eng. A 2005, 402, 66–75. [Google Scholar] [CrossRef]
- Hong, J.; Han, D.; Tan, H.; Li, J.; Jiang, Y. Evaluation of aged duplex stainless steel UNS S32750 susceptibility to intergranular corrosion by optimized double loop electrochemical potentiokinetic reactivation method. Corros. Sci. 2013, 68, 249–255. [Google Scholar] [CrossRef]
- Zhang, Z.; Zhang, H.; Zhao, H.; Li, J. Effect of prolonged thermal cycles on the pitting corrosion resistance of a newly developed LDX 2404 lean duplex stainless steel. Corros. Sci. 2016, 103, 189–195. [Google Scholar] [CrossRef]
- Zhao, H.; Zhang, Z.; Zhang, H.; Hu, J.; Li, J. Effect of aging time on intergranular corrosion behavior of a newly developed LDX 2404 lean duplex stainless steel. J. Alloys Compd. 2016, 672, 147–154. [Google Scholar] [CrossRef]
- Zhang, Z.; Zhang, H.; He, L.; Han, D.; Jiang, Y.; Li, J. Microstructure Evolution in Aged UNS S82441 Duplex Stainless Steel. Steel Res. Int. 2014, 85, 640–644. [Google Scholar] [CrossRef]
- Zhang, Z.; Zhao, H.; Zhang, H.; Yu, Z.; Hu, J.; He, L.; Li, J. Effect of isothermal aging on the pitting corrosion resistance of UNS S82441 duplex stainless steel based on electrochemical detection. Corros. Sci. 2015, 93, 120–125. [Google Scholar] [CrossRef]
- Jiang, Z.; Feng, H.; Li, H.; Zhu, H.; Zhang, S.; Zhang, B.; Han, Y.; Zhang, T.; Xu, D. Relationship between Microstructure and Corrosion Behavior of Martensitic High Nitrogen Stainless Steel 30Cr15Mo1N at Different Austenitizing Temperatures. Materials 2017, 10, 861. [Google Scholar] [CrossRef] [PubMed]
- Moayed, M.; Newman, R. Evolution of current transients and morphology of metastable and stable pitting on stainless steel near the critical pitting temperature. Corros. Sci. 2006, 48, 1004–1018. [Google Scholar] [CrossRef]
- Yang, Y.; Yan, B.; Li, J.; Wang, J. The effect of large heat input on the microstructure and corrosion behaviour of simulated heat affected zone in 2205 duplex stainless steel. Corros. Sci. 2011, 53, 3756–3763. [Google Scholar] [CrossRef]
Figure 1.
The simulated welding thermal cycles with different (a) heat inputs, and (b) cooling rates.
Figure 1.
The simulated welding thermal cycles with different (a) heat inputs, and (b) cooling rates.

Figure 2.
Microstructure of specimens with different heat inputs: (a) 5 kJ/cm; (b) 15 kJ/cm; (c) 25 kJ/cm; (d) 35 kJ/cm. α stands for the ferrite phase and γ represents the austenite phase. WA means the Widmanstatten-type austenite.
Figure 2.
Microstructure of specimens with different heat inputs: (a) 5 kJ/cm; (b) 15 kJ/cm; (c) 25 kJ/cm; (d) 35 kJ/cm. α stands for the ferrite phase and γ represents the austenite phase. WA means the Widmanstatten-type austenite.

Figure 3.
(a) The current density plots under 250 mVSCE in 1 M NaCl solution in the critical pitting temperature (CPT) test; (b) the potentiodynamic polarization curves in 3.5 wt.% NaCl solution.
Figure 3.
(a) The current density plots under 250 mVSCE in 1 M NaCl solution in the critical pitting temperature (CPT) test; (b) the potentiodynamic polarization curves in 3.5 wt.% NaCl solution.

Figure 4.
TEM characterization of Cr2N in the DSS 2002 specimen with a heat input of 5 kJ/cm: (a) a bright-field image; (b) diffraction pattern.
Figure 4.
TEM characterization of Cr2N in the DSS 2002 specimen with a heat input of 5 kJ/cm: (a) a bright-field image; (b) diffraction pattern.

Figure 5.
SEM pitting morphologies of specimens with different heat inputs after the CPT tests: (a) 5 kJ/cm; (b) 15 kJ/cm.
Figure 5.
SEM pitting morphologies of specimens with different heat inputs after the CPT tests: (a) 5 kJ/cm; (b) 15 kJ/cm.

Figure 6.
Microstructure of specimens with different cooling rates: (a) 0.25 °C/s; (b) 0.5 °C/s; (c) 1 °C/s; (d) 2 °C/s; (e) 5 °C/s; (f) 10 °C/s; (g) 20 °C/s.
Figure 6.
Microstructure of specimens with different cooling rates: (a) 0.25 °C/s; (b) 0.5 °C/s; (c) 1 °C/s; (d) 2 °C/s; (e) 5 °C/s; (f) 10 °C/s; (g) 20 °C/s.

Figure 7.
TEM Characterization of M23C6 phase in the DSS 2002 specimen with a cooling rate of 0.25 °C/s: (a) a bright-field image; (b) diffraction pattern.
Figure 7.
TEM Characterization of M23C6 phase in the DSS 2002 specimen with a cooling rate of 0.25 °C/s: (a) a bright-field image; (b) diffraction pattern.

Figure 8.
(a) The current density curve in the CPT tests under 250 mVSCE; (b) the potentiodynamic polarization curves in the 3.5 wt.% NaCl solution for the 2002 specimens with different cooling rates.
Figure 8.
(a) The current density curve in the CPT tests under 250 mVSCE; (b) the potentiodynamic polarization curves in the 3.5 wt.% NaCl solution for the 2002 specimens with different cooling rates.

Figure 9.
SEM morphologies of specimens with different cooling rates after the CPT tests: (a) 0.25 °C/s; (b) 1 °C/s; (c) 5 °C/s; (d) 10 °C/s; (e) 20 °C/s.
Figure 9.
SEM morphologies of specimens with different cooling rates after the CPT tests: (a) 0.25 °C/s; (b) 1 °C/s; (c) 5 °C/s; (d) 10 °C/s; (e) 20 °C/s.


Table 1.
Chemical composition of DSS 2002.
| Element | C | Si | Mn | P | S | Cr | Ni | Mo | Cu | N |
|---|---|---|---|---|---|---|---|---|---|---|
| wt. % | 0.031 | 0.32 | 3.45 | 0.01 | 0.004 | 20.53 | 2.08 | 0.31 | 0.34 | 0.17 |
© 2018 by the authors. Licensee MDPI, Basel, Switzerland. This article is an open access article distributed under the terms and conditions of the Creative Commons Attribution (CC BY) license (http://creativecommons.org/licenses/by/4.0/).
Share and Cite
MDPI and ACS Style
Yang, Y.; Guo, Y.; Liu, Y.; Li, J.; Jiang, Y. The Microstructure and Pitting Resistance of 2002 Lean Duplex Stainless Steel after the Simulated Welding Thermal Cycle Process. Materials 2019, 12, 70. https://doi.org/10.3390/ma12010070
AMA Style
Yang Y, Guo Y, Liu Y, Li J, Jiang Y. The Microstructure and Pitting Resistance of 2002 Lean Duplex Stainless Steel after the Simulated Welding Thermal Cycle Process. Materials. 2019; 12(1):70. https://doi.org/10.3390/ma12010070
Chicago/Turabian StyleYang, Yuanyuan, Yanjun Guo, Yuanyuan Liu, Jin Li, and Yiming Jiang. 2019. "The Microstructure and Pitting Resistance of 2002 Lean Duplex Stainless Steel after the Simulated Welding Thermal Cycle Process" Materials 12, no. 1: 70. https://doi.org/10.3390/ma12010070
Note that from the first issue of 2016, this journal uses article numbers instead of page numbers. See further details here.