Microstructure Evolution and Flow Stress Model of a 20Mn5 Hollow Steel Ingot during Hot Compression

Department of Mechanical Engineering, Tsinghua University, Beijing 100084, China
*
Author to whom correspondence should be addressed.
Materials 2018, 11(4), 463; https://doi.org/10.3390/ma11040463
Submission received: 15 February 2018
/
Revised: 17 March 2018
/
Accepted: 19 March 2018
/
Published: 21 March 2018
(This article belongs to the Special Issue Selected Papers from IEEE ICICE 2017)
Abstract
:20Mn5 steel is widely used in the manufacture of heavy hydro-generator shaft due to its good performance of strength, toughness and wear resistance. However, the hot deformation and recrystallization behaviors of 20Mn5 steel compressed under high temperature were not studied. In this study, the hot compression experiments under temperatures of 850–1200 °C and strain rates of 0.01/s–1/s are conducted using Gleeble thermal and mechanical simulation machine. And the flow stress curves and microstructure after hot compression are obtained. Effects of temperature and strain rate on microstructure are analyzed. Based on the classical stress-dislocation relation and the kinetics of dynamic recrystallization, a two-stage constitutive model is developed to predict the flow stress of 20Mn5 steel. Comparisons between experimental flow stress and predicted flow stress show that the predicted flow stress values are in good agreement with the experimental flow stress values, which indicates that the proposed constitutive model is reliable and can be used for numerical simulation of hot forging of 20Mn5 hollow steel ingot.
1. Introduction
Heavy cylinder forgings are widely used in key equipments such as nuclear pressure vessel, hydro-generator shaft and hydrogenation reactor [1].
Compared with solid steel ingot which is used for manufacture of cylinder forging, the advantages of adopting hollow steel ingot are as follows: (1) avoiding punching process; (2) increasing the utilization ratio of the steel ingot significantly; (3) reducing segregation and improving the material homogeneity as a result of a small solidification section and a high solidification speed; (4) requiring lower forging force [2].
20Mn5 steel has been widely used in the manufacture of hydro-generator shaft due to its good balance of strength, toughness, wear resistance and weldability. However, for heavy 20Mn5 hollow steel ingot, coarse grains and shrinkage cavities exist. To save the cost of production, it is necessary to carry out numerical simulation to obtain reasonable forging process parameters to make sure that the coarse grains can be refined and shrinkage cavities can be eliminated. In order to carry out a successful simulation of hot forging process, a precise constitutive model which describes the effect of temperature, strain rate and strain on stress is essential. At present, there is no report on the constitutive model of heavy 20Mn5 hollow steel ingot.
In this study, high temperature compression experiments of 20Mn5 steel under temperatures of 850–1200 °C and strain rates of 1/s, 0.1/s and 0.01/s are carried out using Gleeble thermal and mechanical simulation machine. Flow stress curves and microstructure after hot compression on different temperatures and strain rates are obtained. Based on the experimental flow stress curves, a two-stage constitutive model is established by introducing the classical stress-dislocation relation and the kinetic equation of dynamic recrystallization(DRX) [3,4,5,6,7,8,9,10,11,12,13,14,15,16,17,18,19,20,21,22,23,24,25]. By comparisons of the predicted flow stress values and experimental flow stress values, the proposed physically-based constitutive model shows high accuracy. Therefore, the newly developed constitutive model of 20Mn5 steel can be used for numerical simulation of hot forging process. Moreover, the flow stress curves and microstructure after hot compression can provide important reference for establishment of forging process specification of 20Mn5 heavy hydro-generator shaft.
2. Materials and Methods
2.1. Experimental Material
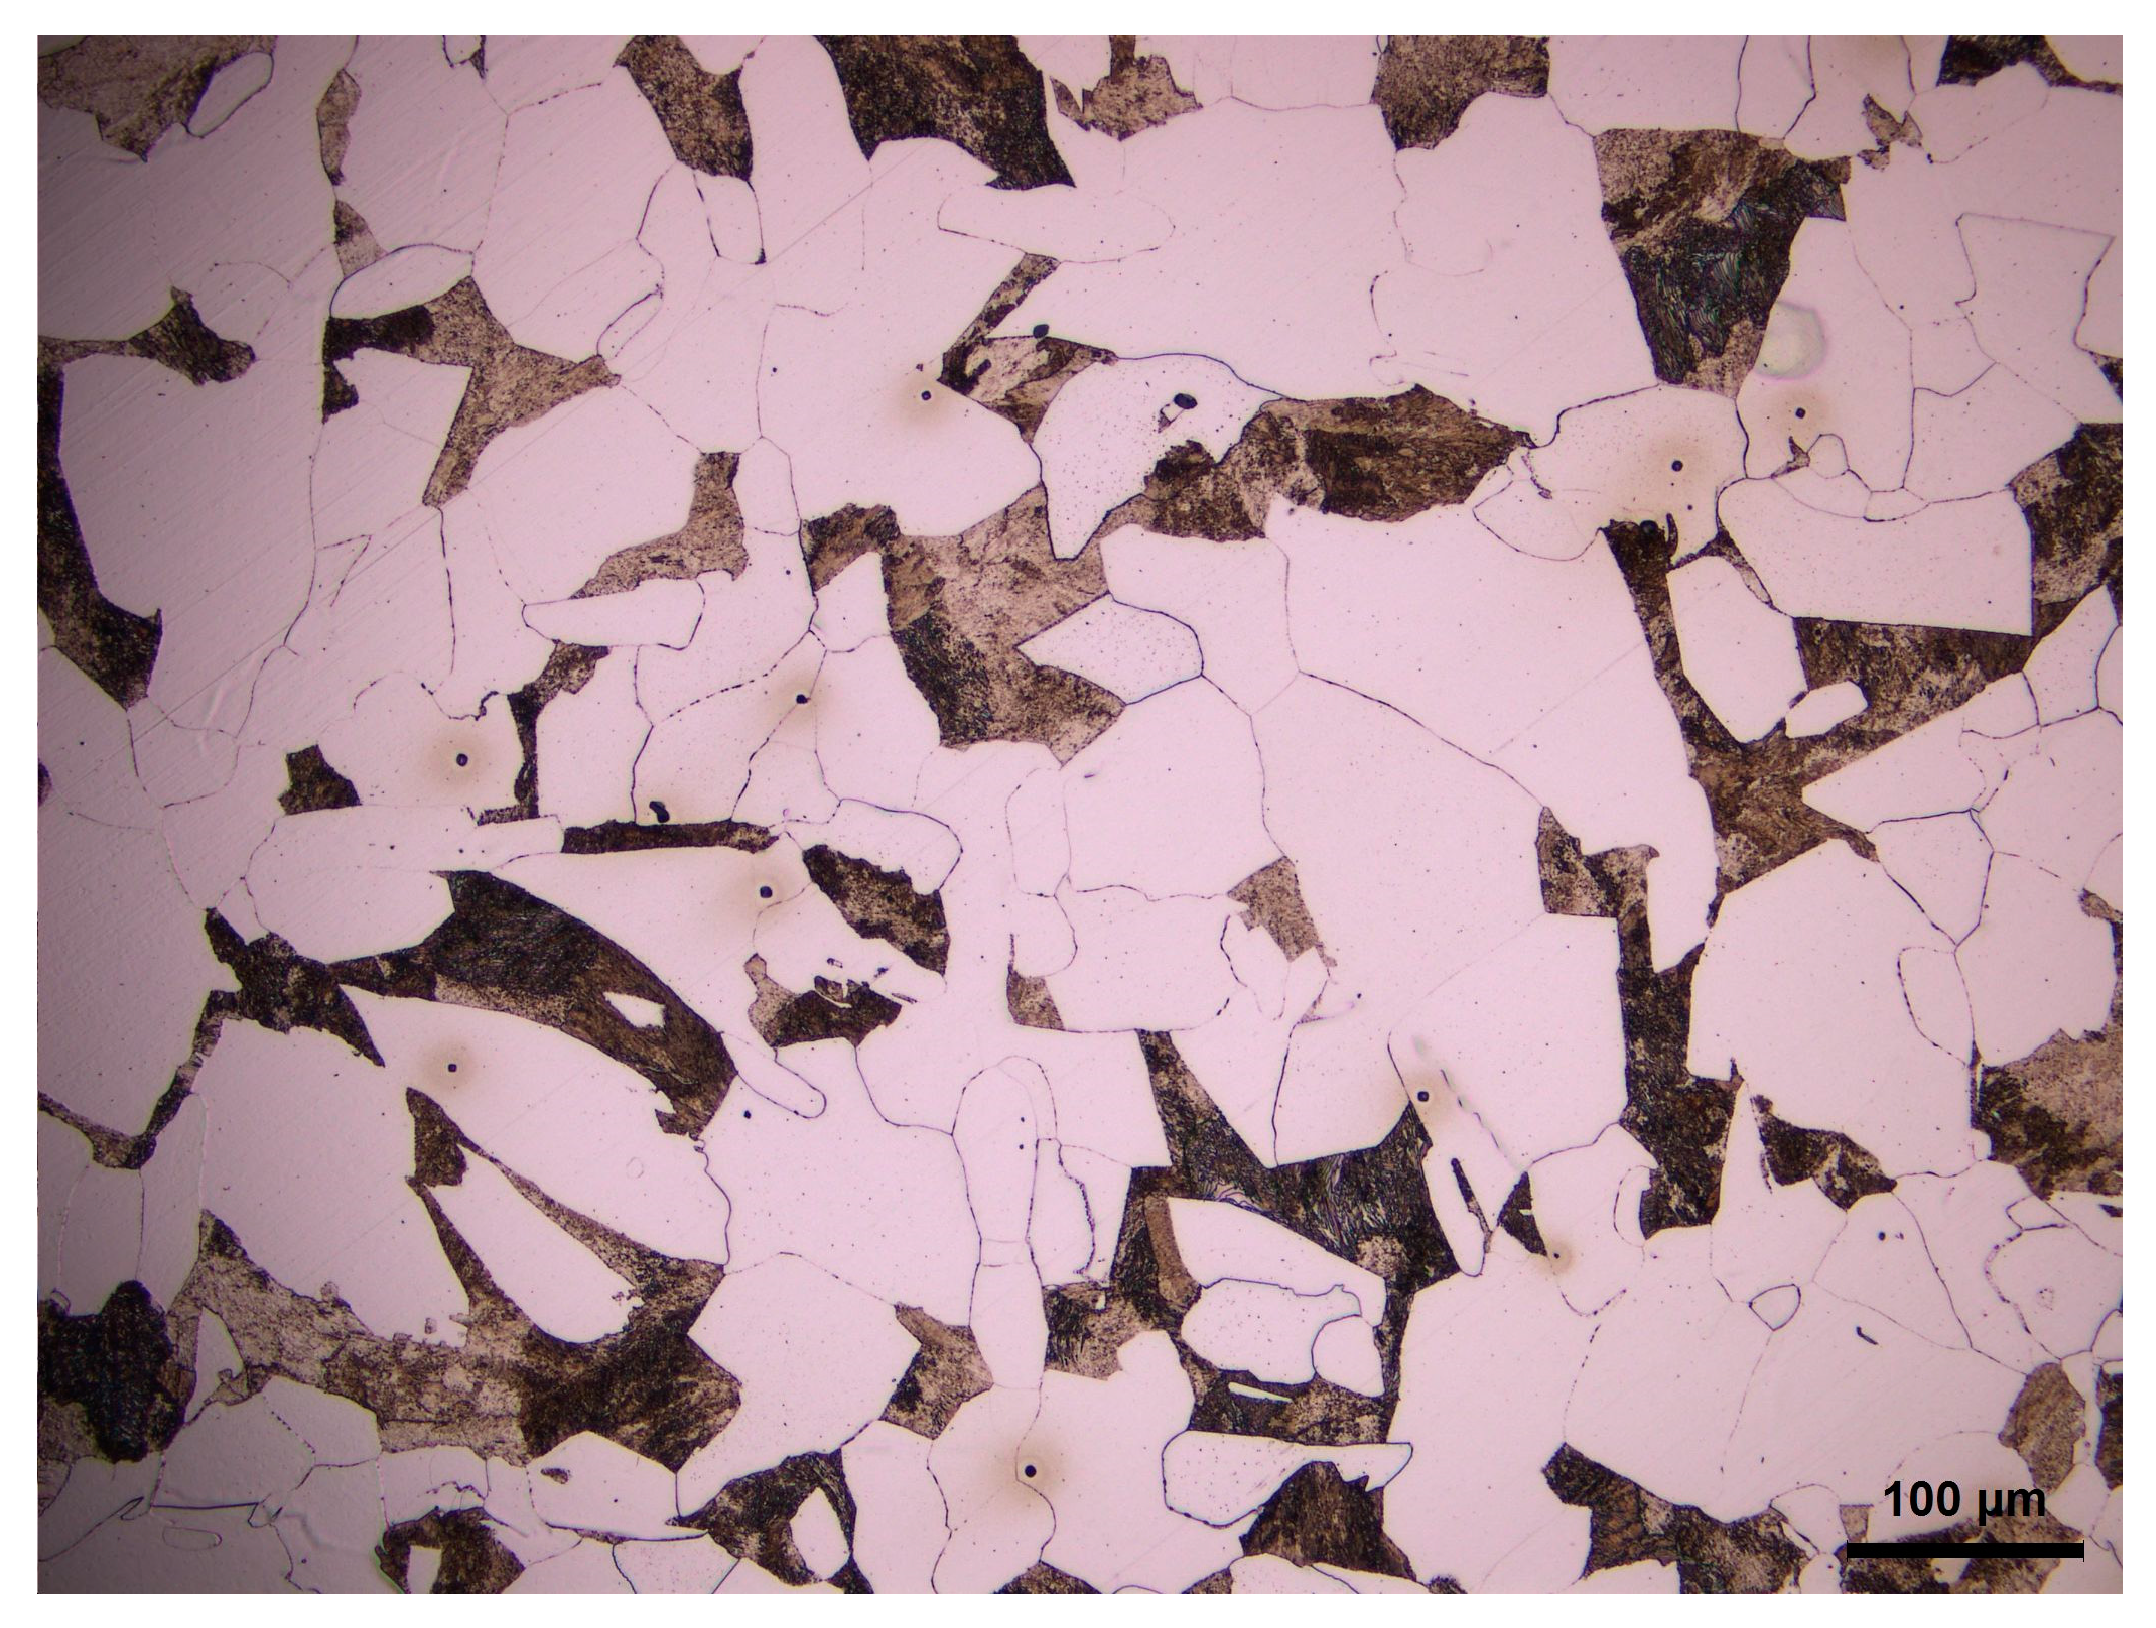
The cylindrical samples with the diameter of 8 mm and the height of 12mm were taken from a 20Mn5 hollow steel ingot used for heavy hydro-generator shaft. The chemical composition of 20Mn5 steel is given in Table 1. Figure 1 shows the initial as-cast microstructure of 20Mn5 steel, which contains ferrite and pearlite.
2.2. Experimental Procedure
The hot compression experiments were carried out on a Gleeble-1500D thermal and mechanical simulation machine (DSI, NY, USA). Firstly, the specimens were heated to 1000 °C at a heating rate of 5 °C/s and held for 3 min. Then, the temperature was adjusted to deformation temperature (850–1200 °C with a 50 °C interval) at 10 °C/s and held for 60 s to get a uniform temperature distribution. Then, the specimens were compressed to a true strain of 0.7 under deformation temperatures of 850–1200 °C with a 50 °C interval and strain rates of 1/s, 0.1/s and 0.01/s. Finally, the specimens were quenched with water in order to retain the morphologies of austenite grains. After the hot compression experiments, the specimens were cut, ground, polished and etched in the mixture of 5 g picric acid, 4 g sodium dodecyl benzene sulfonate and 100 ml water at 60–70 °C. Then, the morphologies of emerged austenite grains were observed using an OLYMPUS BX51 microscope (Olympus, Tokyo, Japan).
3. Results and Discussion
3.1. Flow Stress Curves
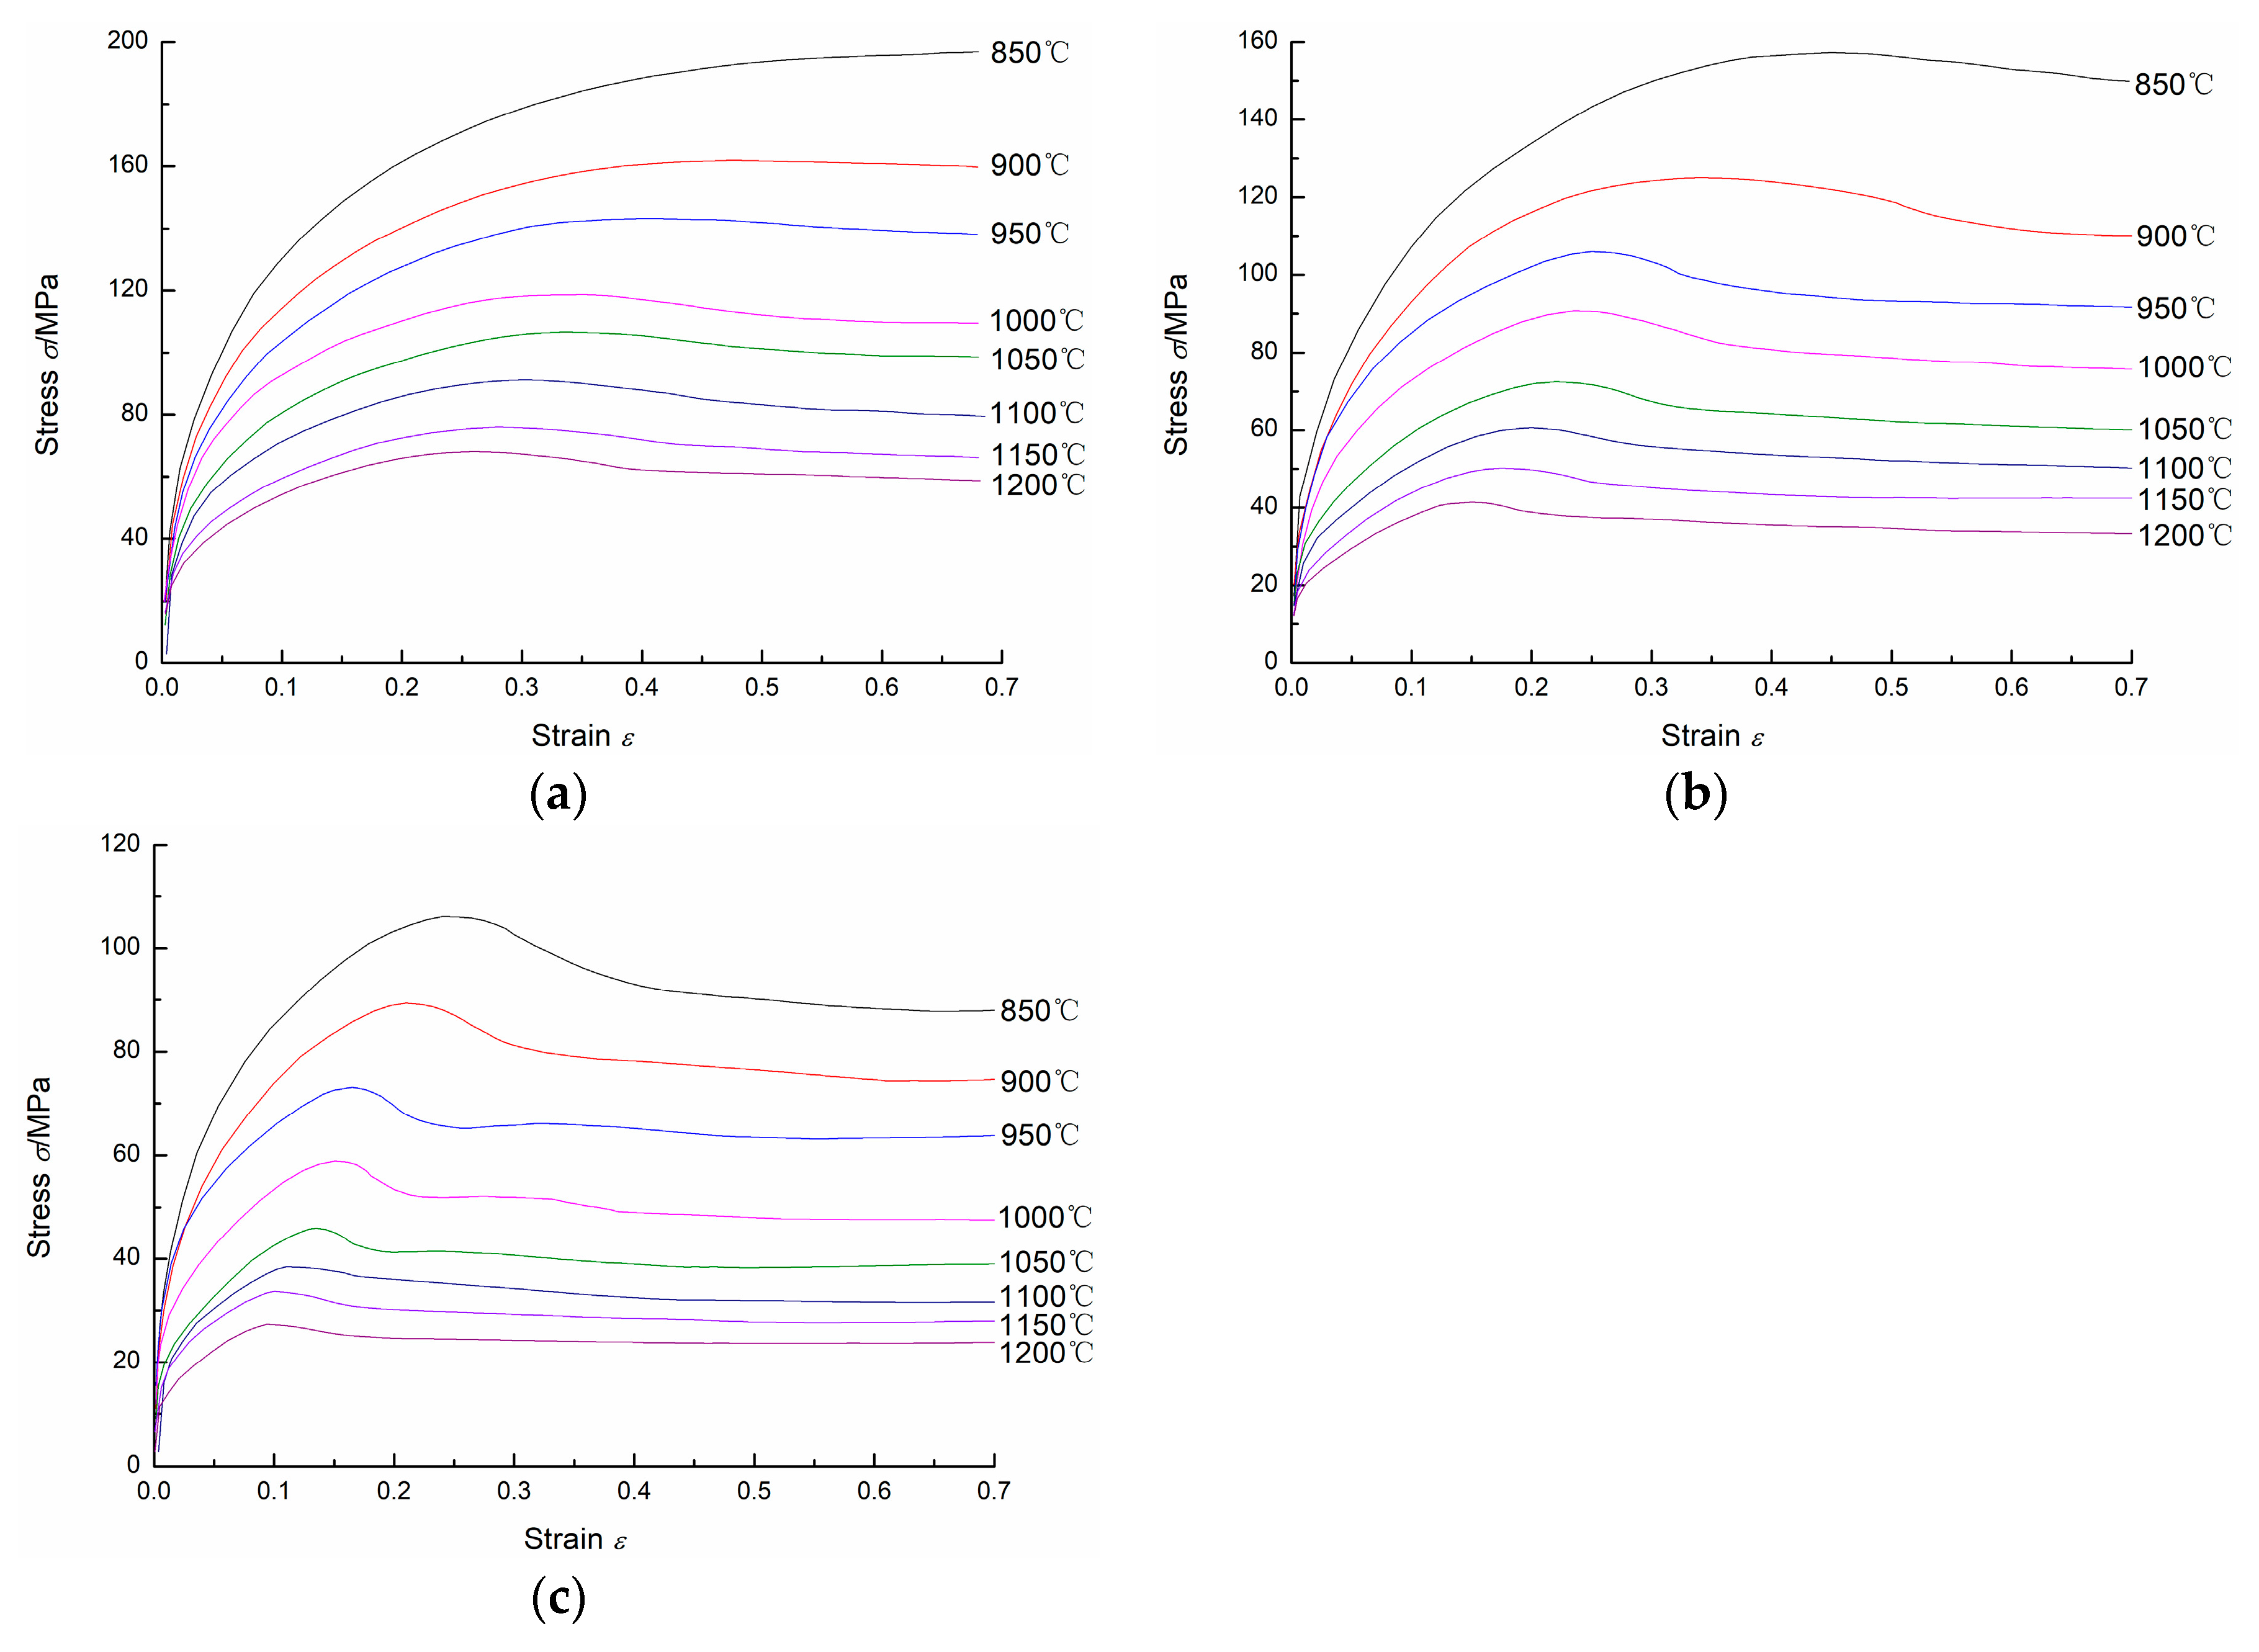
Figure 2 shows the flow stress curves of 20Mn5 steel compressed at different temperatures and different strain rates. As shown in Figure 2, for the same strain rate and strain, the flow stress is larger when the specimen is compressed at lower temperature; for the same temperature and strain, the flow stress is larger when the specimen is compressed at higher strain rate. And it can be easily seen that at high temperatures and low strain rates, the flow stress increases to a peak stress at first, and then reduces to a steady state stress and remains as a constant as the strain increases. For low temperatures and high strain rates, the steady state stress doesn’t occur. Moreover, for the same strain rate, the peak strain and steady state strain increase when the compression temperature decreases; for the same temperature, the peak strain and steady state strain increase when the strain rate increases.
For 20Mn5 steel, the flow stress is influenced by work hardening(WH), dynamic recovery(DRV) and dynamic recrystallization(DRX), which compete during hot compression. In the initial deformation stage, working hardening and dynamic recovery occur. Dislocation movement and rearrangement can reduce the dislocation density, but working hardening comes into prominence. As a result, the flow stress increases as the strain increases. When strain reaches a critical value, dynamic recrystallization occurs and the softening effect caused by dynamic recrystallization dominates. Correspondingly, the flow stress increases gradually until a peak stress at first, and then decreases as the strain increases. Finally, a dynamic balance between working hardening, dynamic recovery and dynamic recrystallization is reached. And the flow stress remains to be a constant as the strain increases.
3.2. Effect of Temperature and Strain Rate on Microstructure after Hot Compression
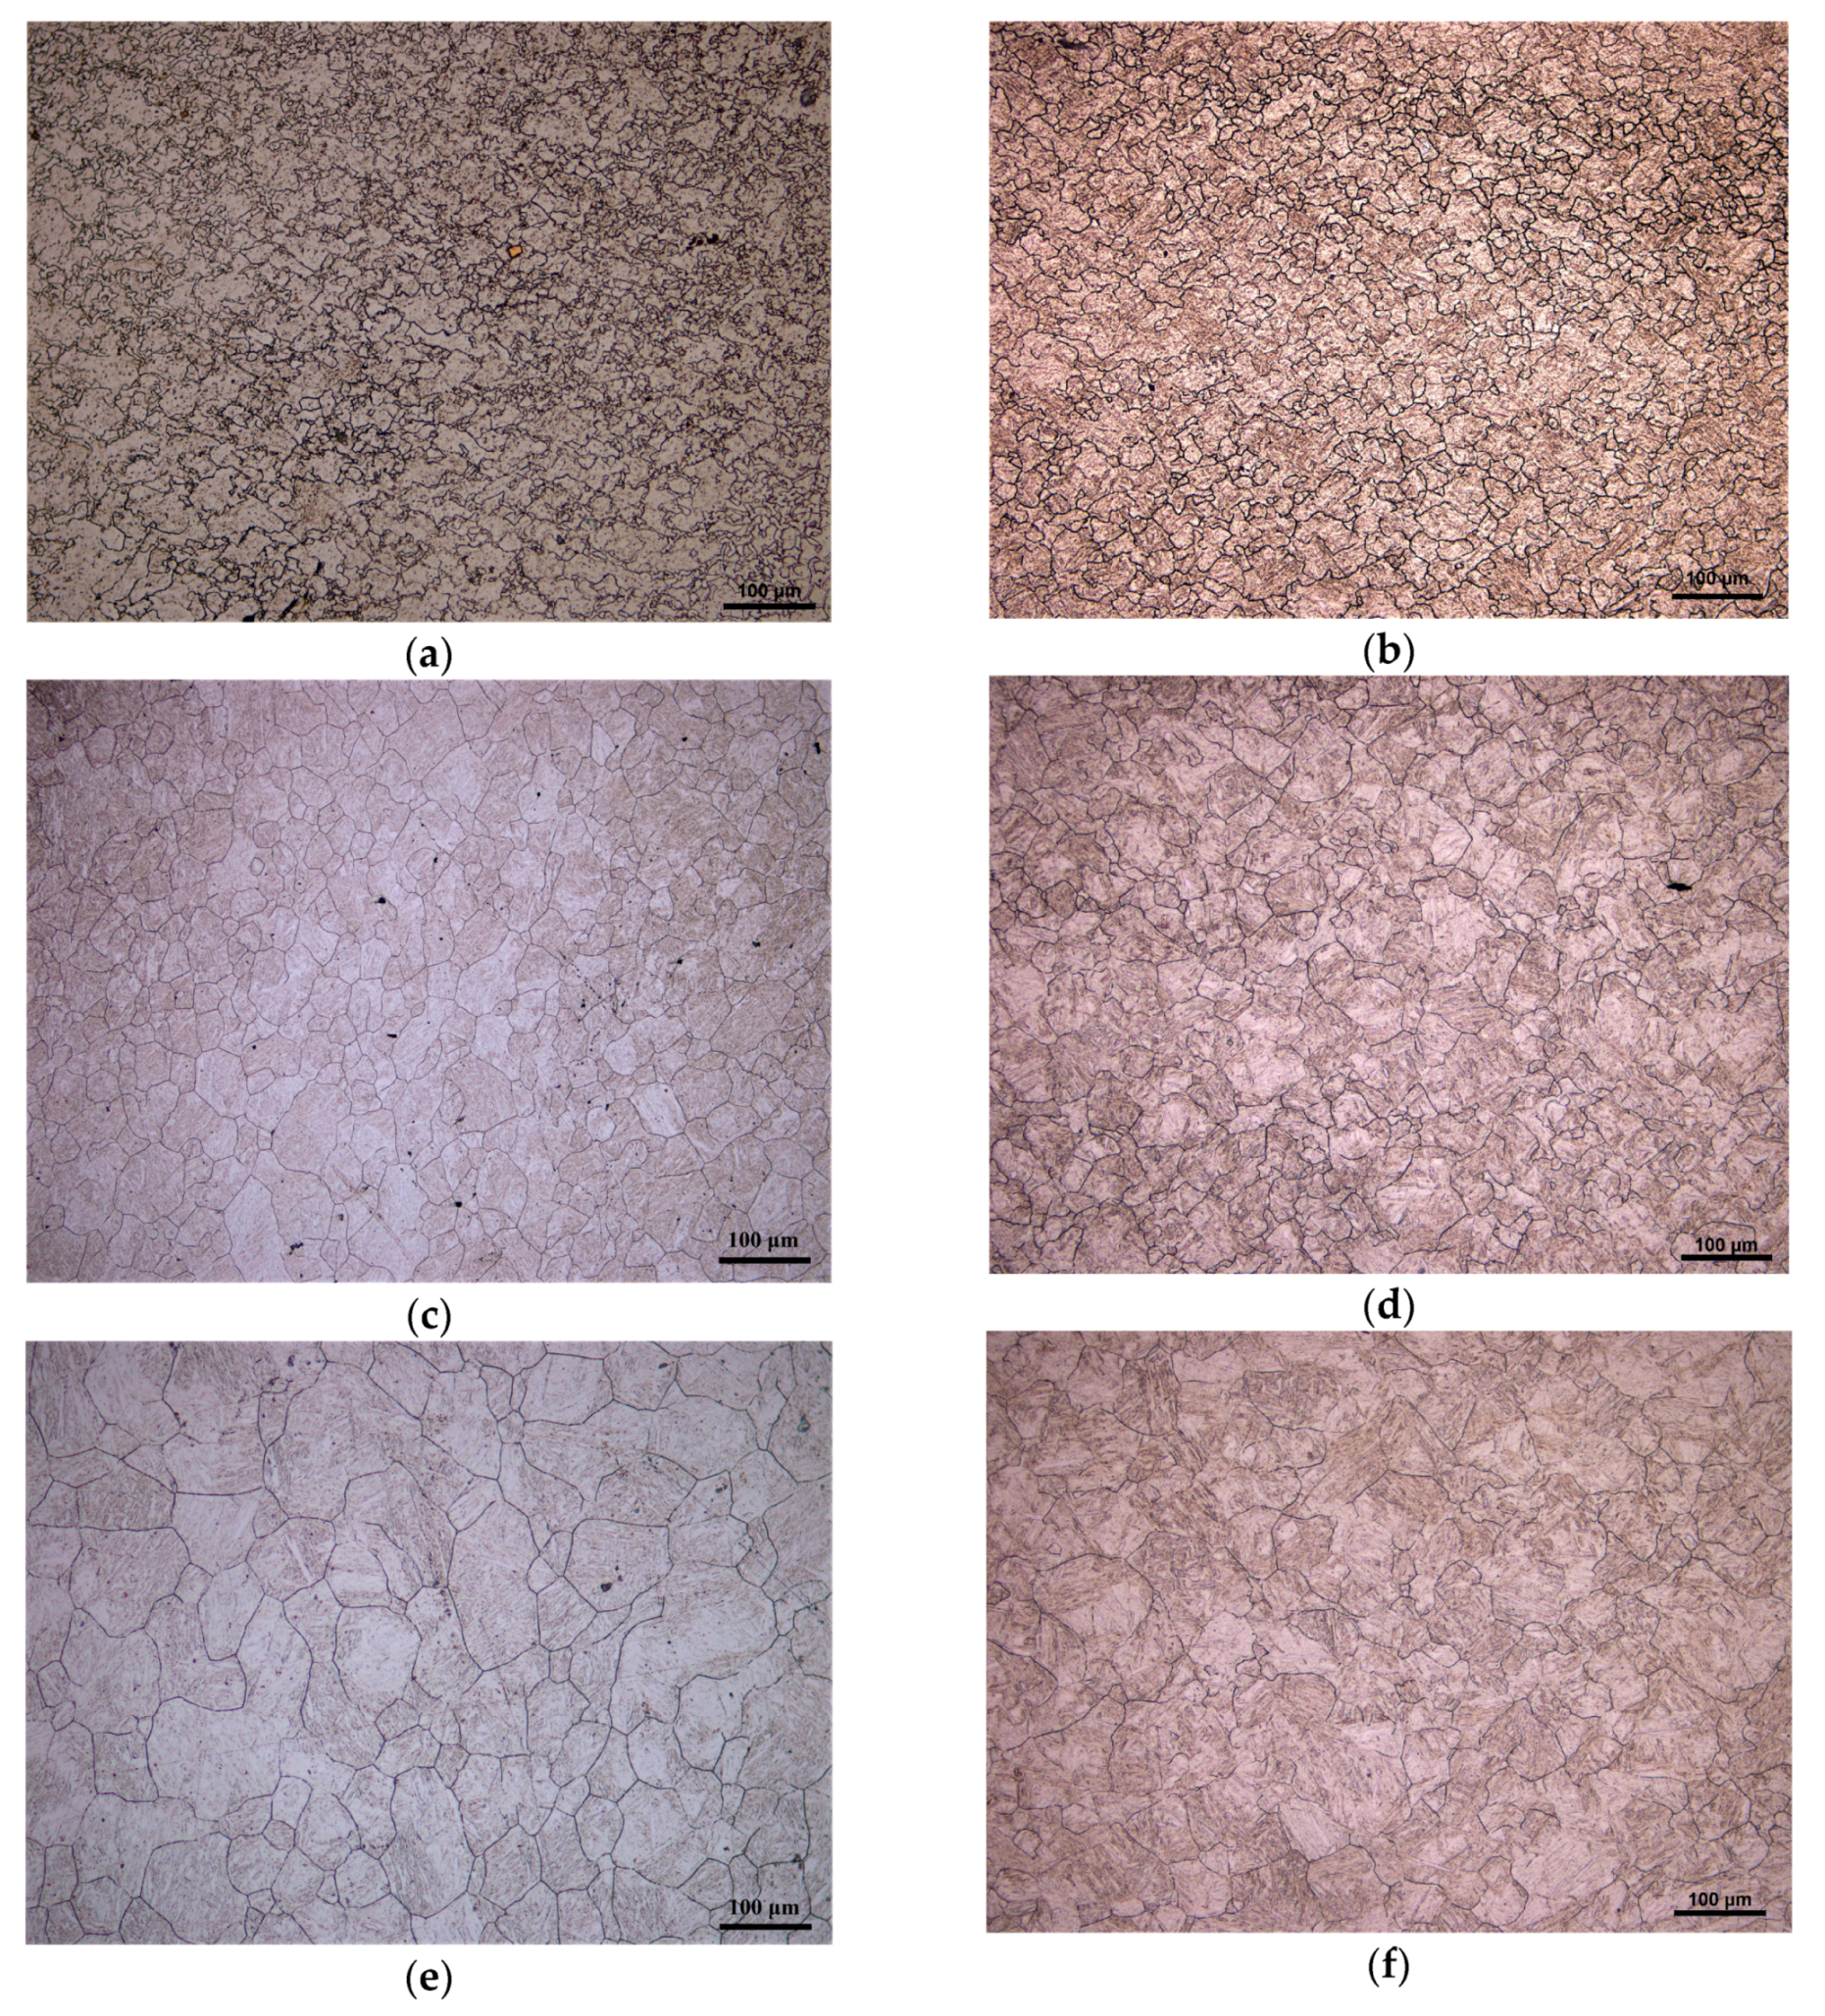
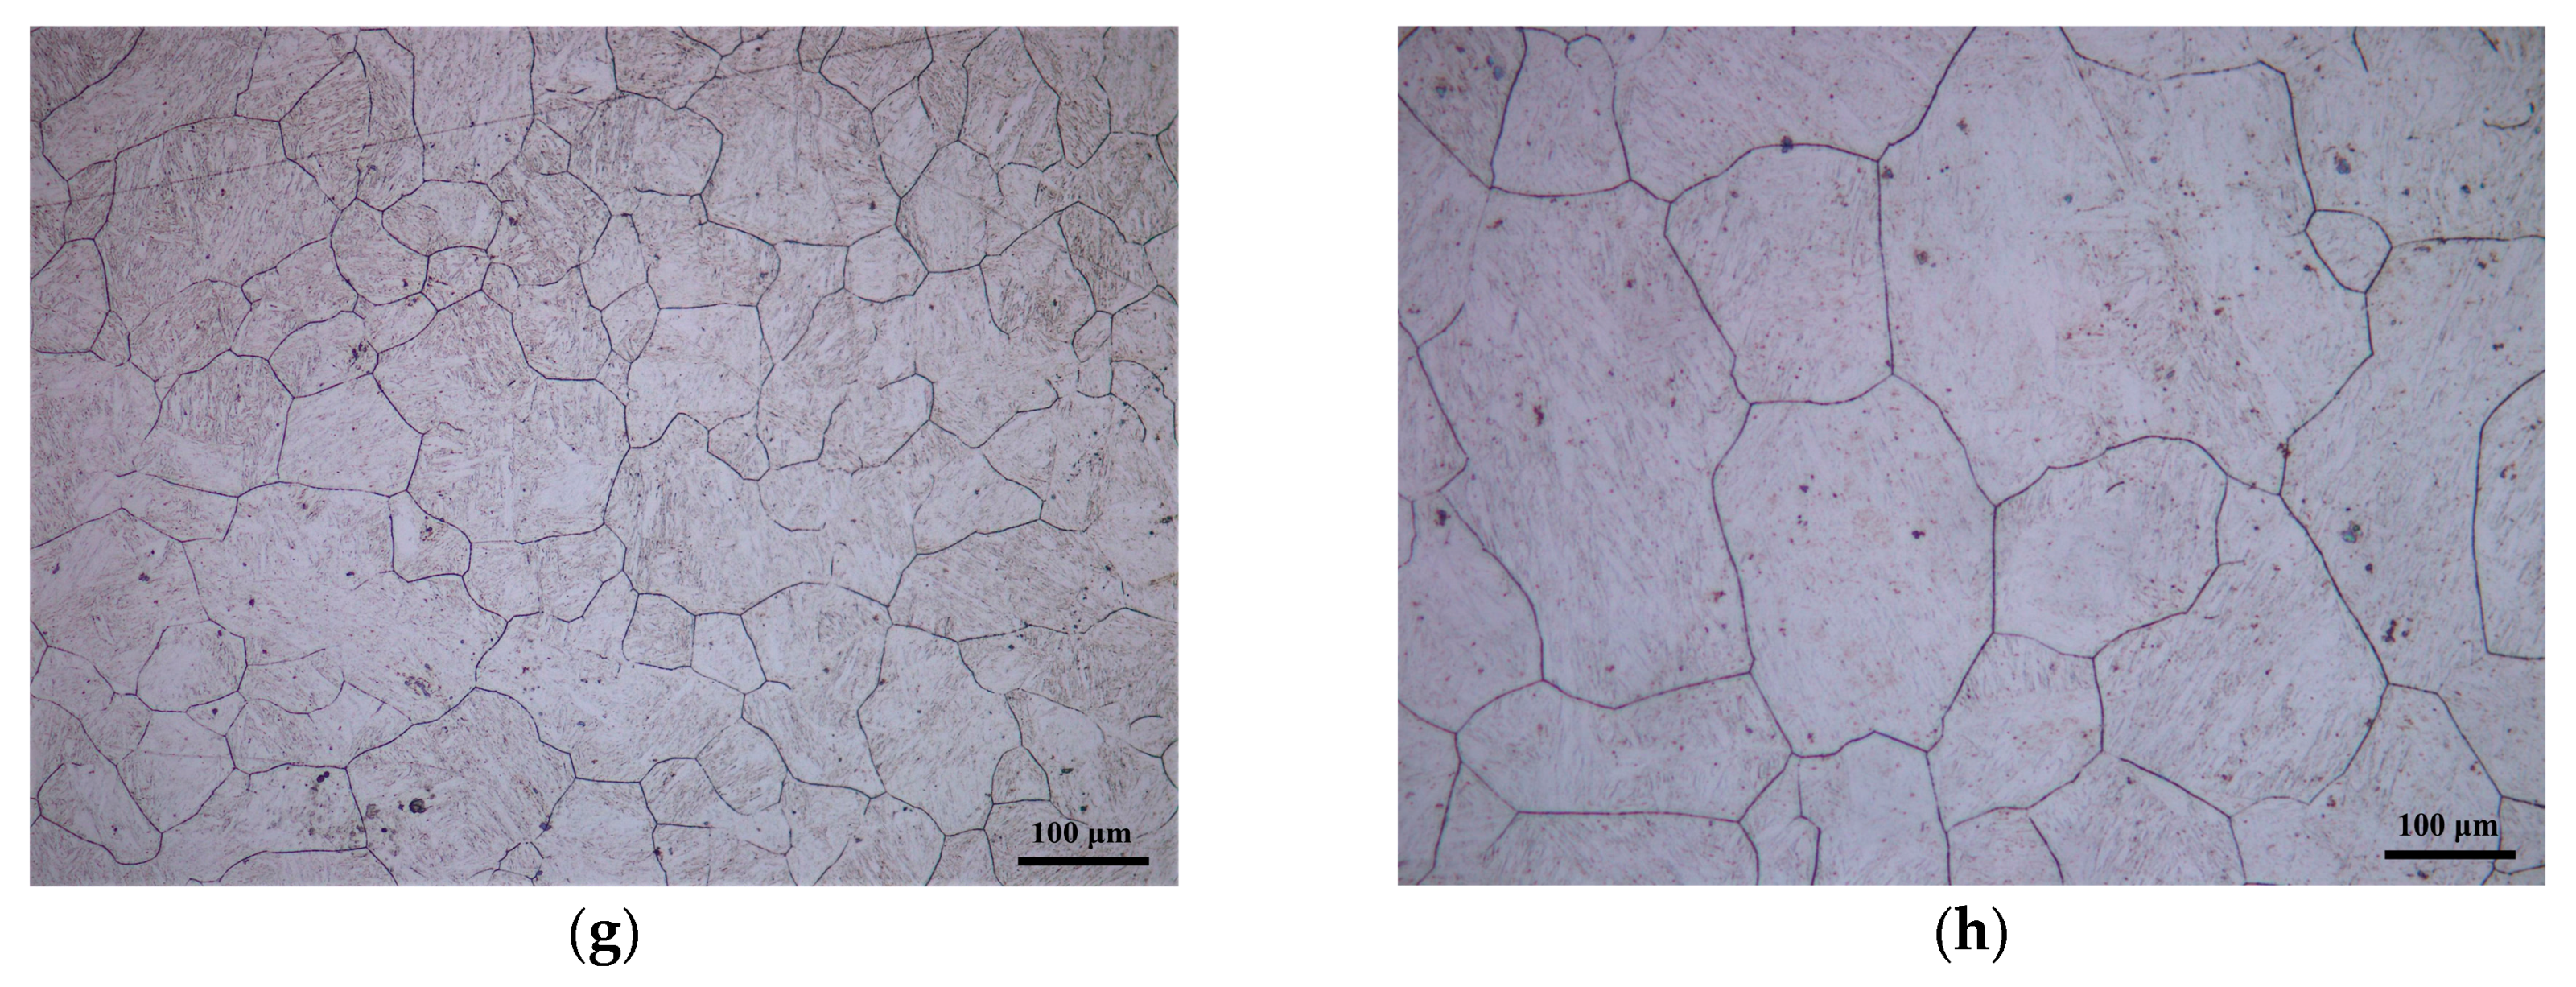
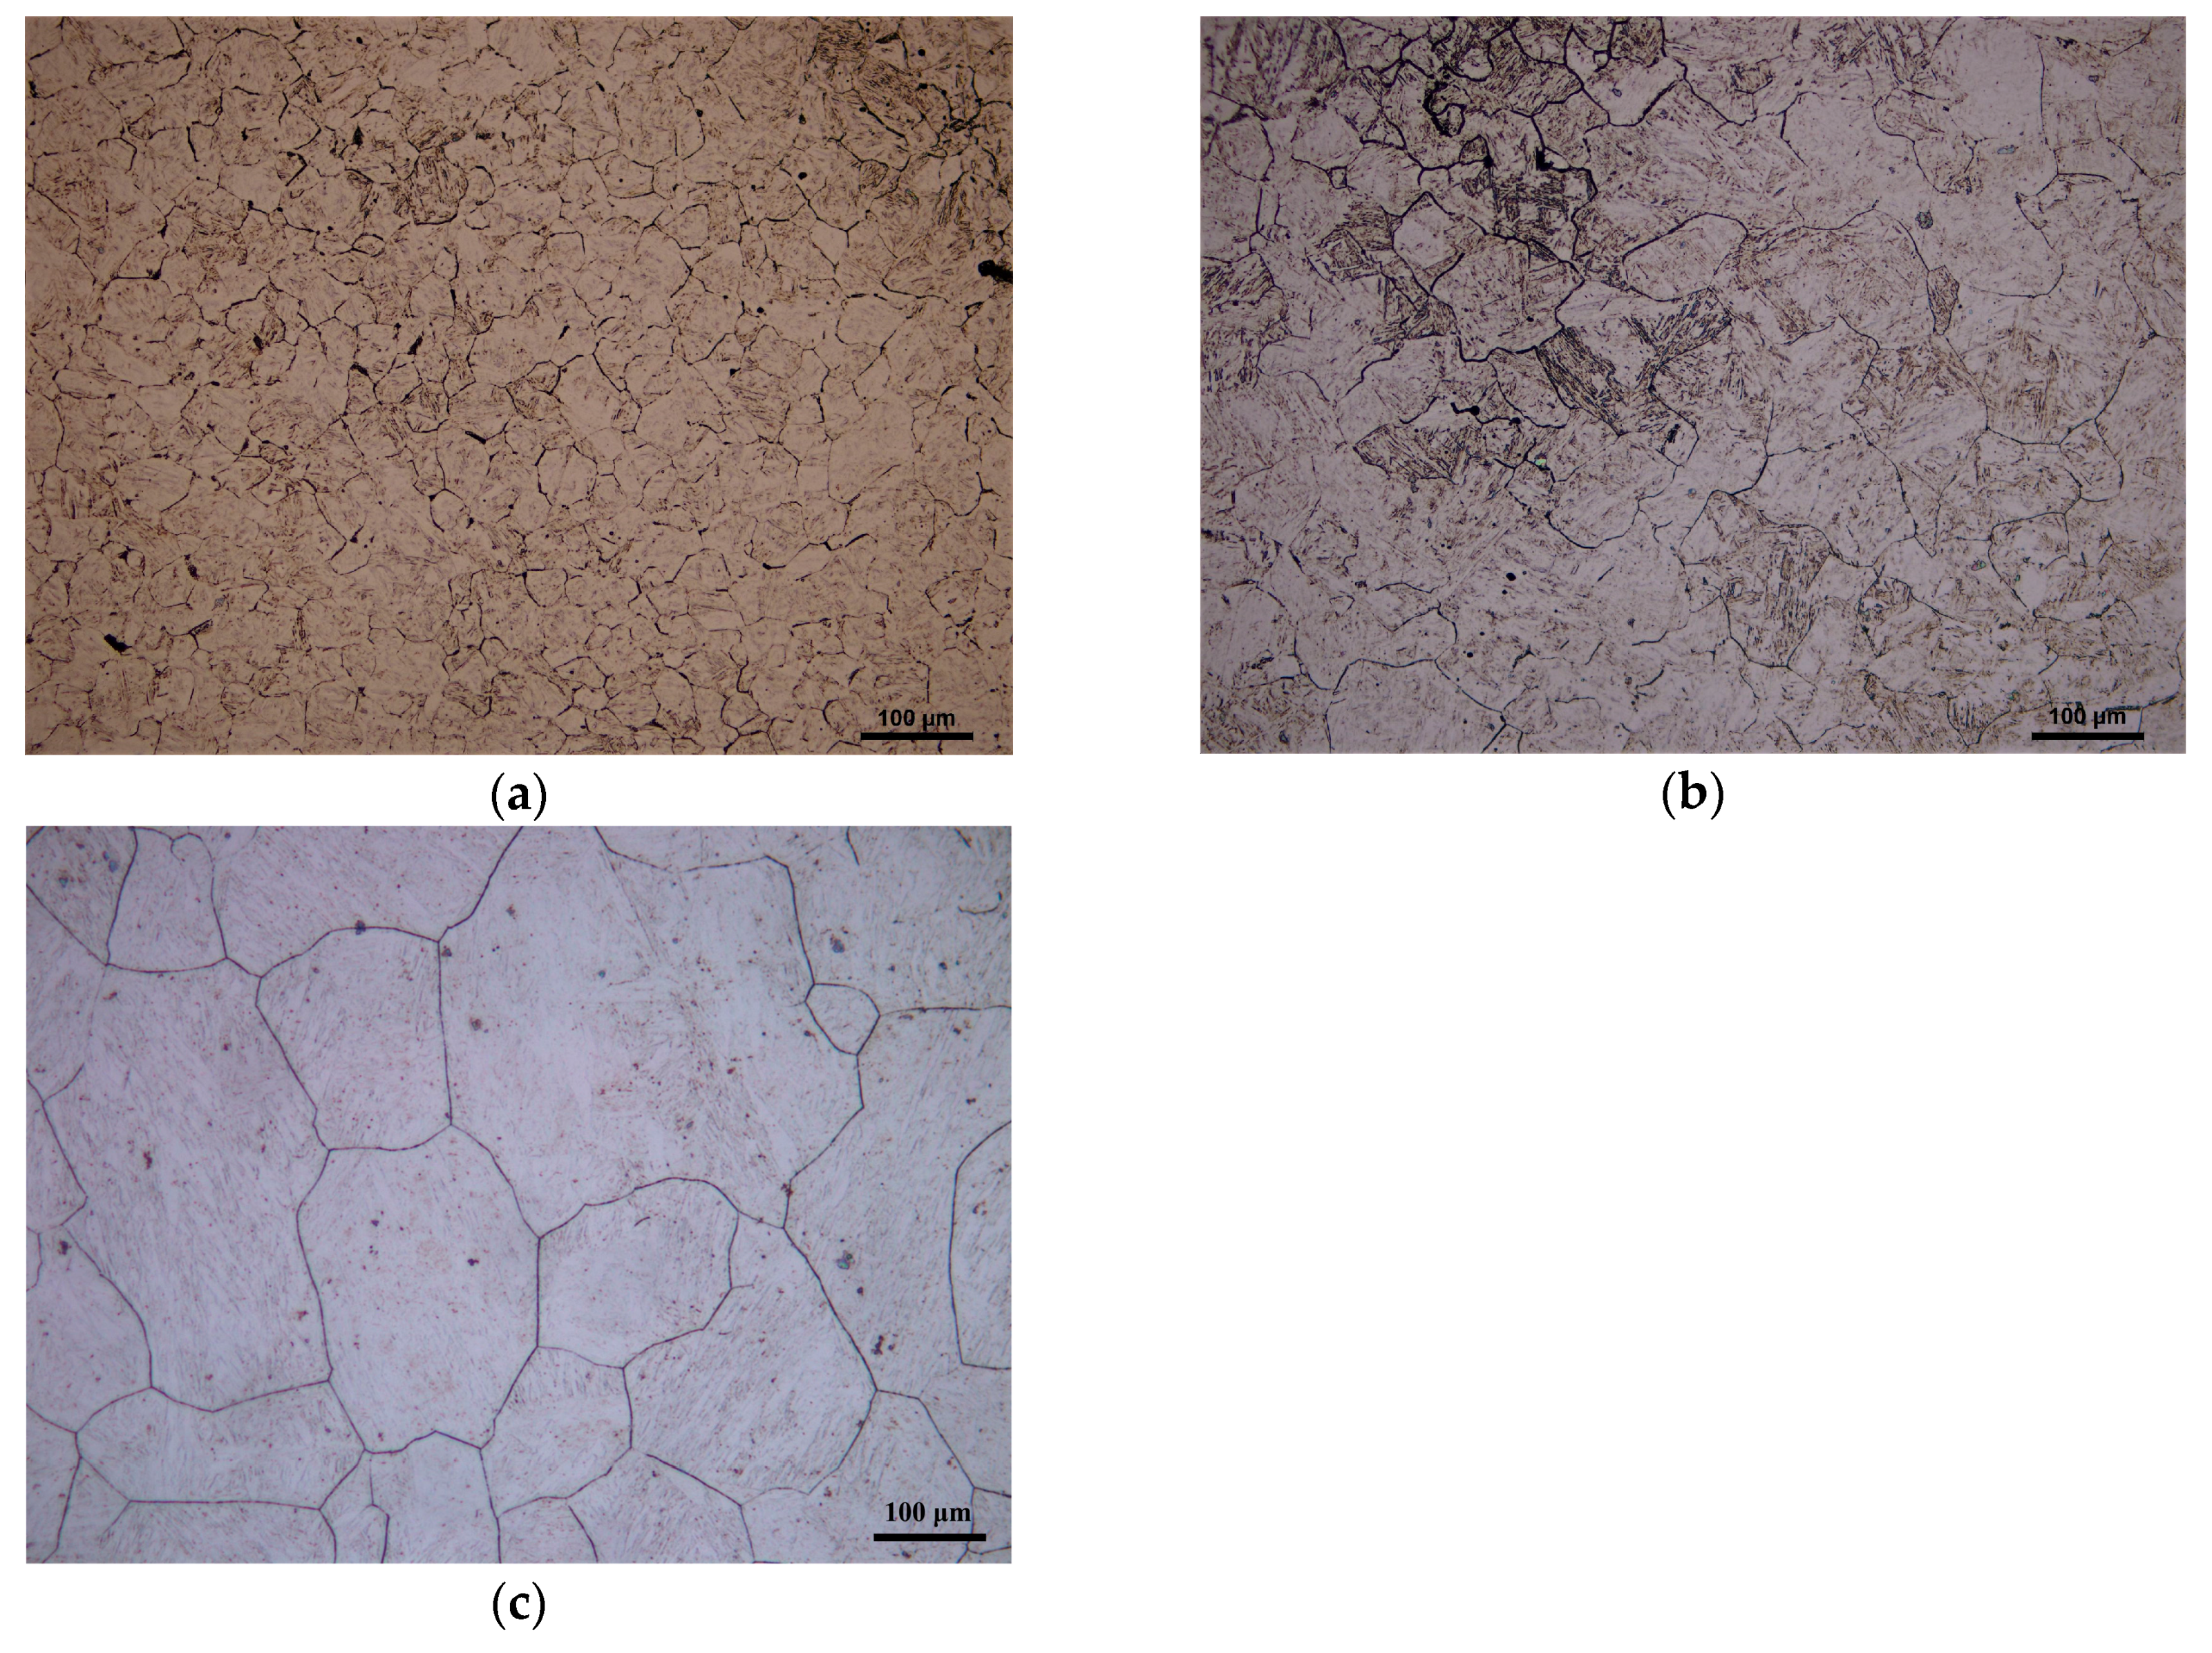
Figure 3 shows the microstructure of 20Mn5 steel compressed to a true strain of 0.7 under strain rate of 0.01 /s and different temperatures. It is obvious that the austenite grain size increases with the increase of the compression temperature. Under eight temperatures and strain rate of 0.01 /s, dynamic recrystallization occurs, respectively. The occurrence of dynamic recrystallization shown in Figure 3 can also be seen from the measured flow stress curves. In the above flow stress curves corresponding to Figure 3, the flow stress curves all reach a steady state when strain equals a certain value, which indicates that dynamic recrystallization is complete.
Figure 4 shows the microstructure of 20Mn5 steel compressed to a true strain of 0.7 under 1200 °C and different strain rates. It can be easily found that the higher the strain rate, the smaller the grain size. The reason for this phenomenon is high strain rate reduces the deformation time at a certain strain and the recrystallized nucleus has insufficient time to fully grow.
4. Establishment of A Two-Stage Constitutive Model and Its Verification
4.1. The Derivation of A Two-Stage Constitutive Model
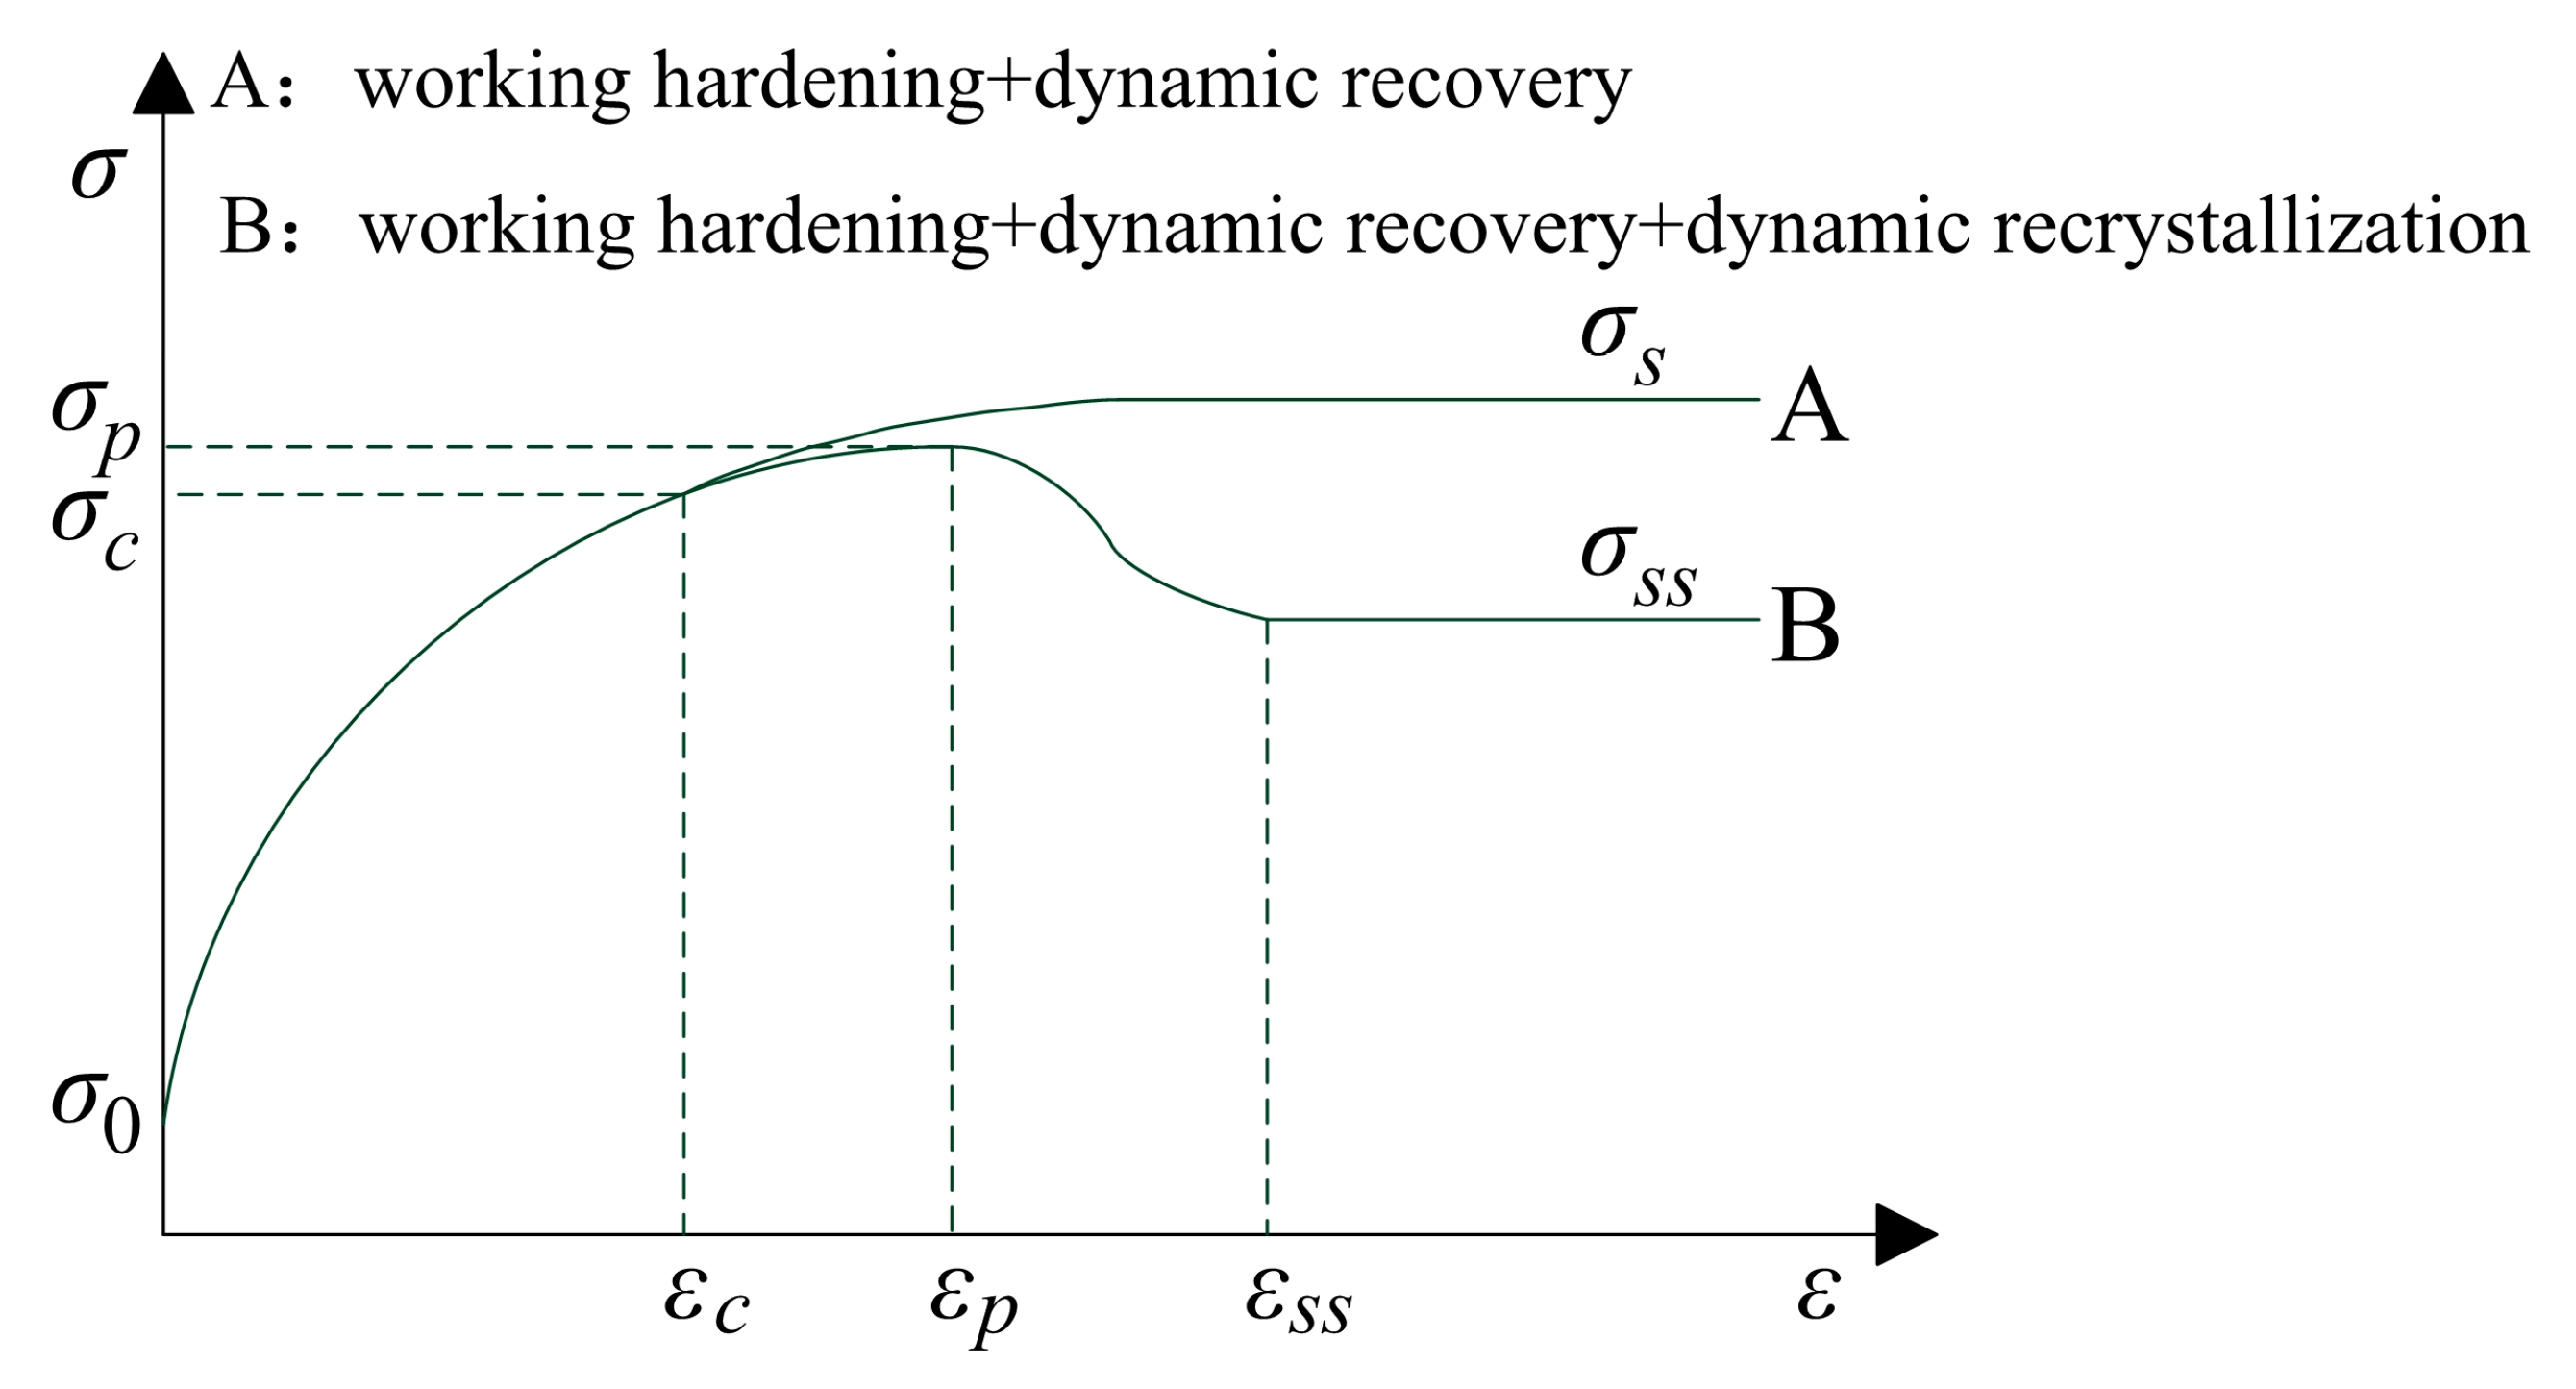
Figure 5 shows two typical flow stress curves for hot working. In curve B, in the initial deformation stage (0 ≤ ε < εc), stress increases from σ0 to σc as a result of working hardening and dynamic recovery. When strain equals a critical value εc, dynamic recrystallization occurs. And as strain increases, firstly, the stress increases from σc to σp, and then stress decreases form σp to a steady state stress σss. If dynamic recrystallization never occurs in some materials, the change of stress with strain will be similar to curve A.
The flow stress curve of 20Mn5 steel in this study is similar to curve B, and a two-stage method is used to establish the flow stress model of 20Mn5 steel.
(1) stage of working hardening and dynamic recovery (0 ≤ ε < εc)
The evolution of the dislocation density with strain is generally considered to be as follows:
where k1 represents the coefficient of working hardening, and k2 is the coefficient of dynamic recovery.
When , , where is the initial dislocation density.
By integration of Equation (1), dislocation density can be expressed as follows:
When , , where is the saturation dislocation density corresponding to the saturation stress .
Based on the above equations and the classical Taylor relation , where is the material constant, is the shear modulus and is Burgers vector, the stress at strain can be expressed as follows:
(2) stage of dynamic recrystallization (ε ≥ εc)
The volume fraction of DRX, , can be determined by the following equation:
where is the volume fraction of DRX, is the critical strain, is the peak strain, and are constants related to material.
The relation between and stress parameters can be given as follows:
where is the saturation stress, is the steady state stress, is the stress at strain calculated by Equation (3), and is flow stress at strain .
By combining Equations (4) and (5), the flow stress during DRX period can be given by the following expression:
4.2. Determination of Material Constants(α, n, Q and A) Based on the Peak Stress
The Arrhenius equation proposed by Sellars and Tegart is widely used to describe the relationship between flow stress, strain rate and temperature:
where , and are material constants; is the activation energy of deformation (J/mol); is strain rate (s−1); is flow stress (MPa); is the absolute temperature (K); and is the gas constant (8.314 J/(mol·K)).
Based on Taylor expansion, the following equations can be obtained:
According to Equations (7) and (10), the following equations can be easily obtained:
According to Equations (7), (11) and (12), the following equation is obvious:
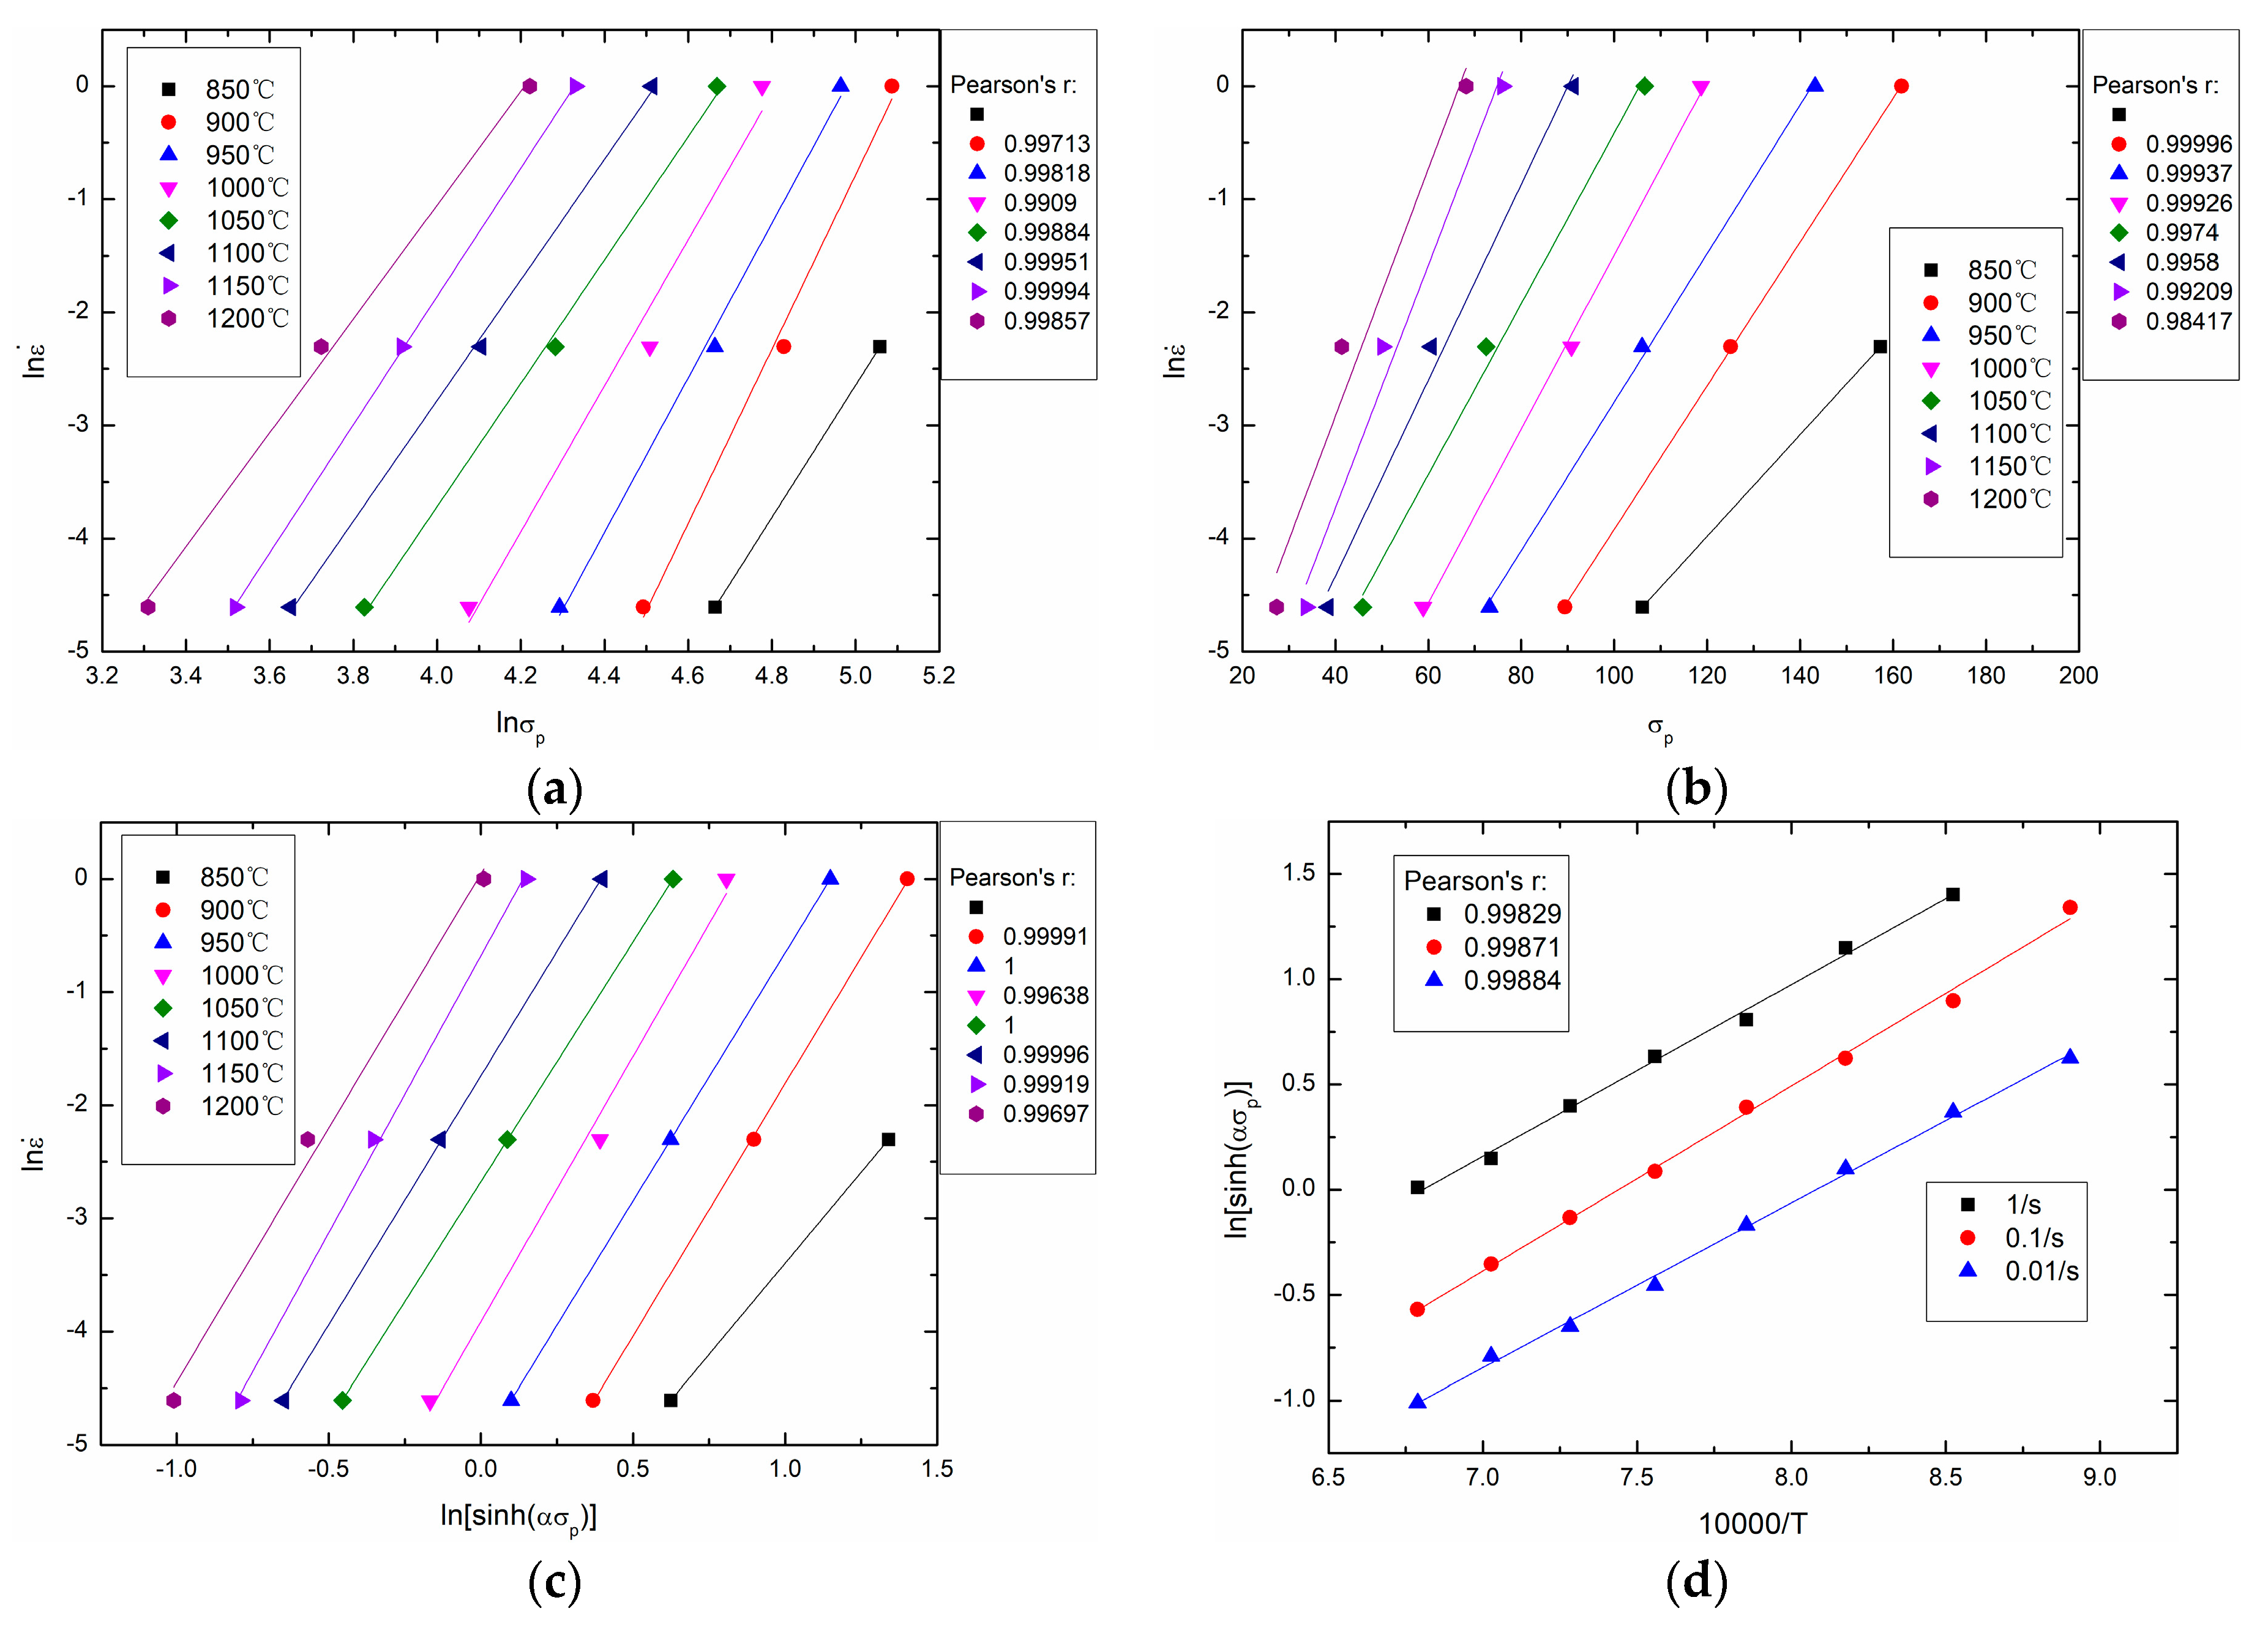
Taking the natural logarithms on both sides of Equations (7), (11) and (12), the following expressions can be obtained:
In this study, in the above equations is taken as the peak stress . Based on experimental data and Equations (14)–(16), Figure 6 is drawn as follows. In Figure 6a, the slopes of the lines equal n1, and n1 = 6.040465 is obtained. In Figure 6b, the slopes of the lines equal β, and β = 0.078723 is obtained. Thus, α = β/n1 = 0.013033. In Figure 6c, the slopes of the lines equal n, and n = 4.346973 is obtained. In Figure 6d, the slopes of the lines equal Q/(10000nR), and the intercepts of the lines equal −(1/n)lnA + (1/n)ln . Thus, Q = 298571.8169 J/mol and A = 8.85 × 10¹⁰ can be obtained.
From Equation (7), the following equation can be obtained:
where , is Zener-Hollomon parameter, and represents the strain rate compensated by temperature.
Based on the calculated material constants (, , and ), the peak stress at any temperature and any strain rate can be obtained.
4.3. Determination of Material Parameters(εp, εc, σs, σss, σ0, k2, kd, nd) in the Two-Stage Constitutive Model
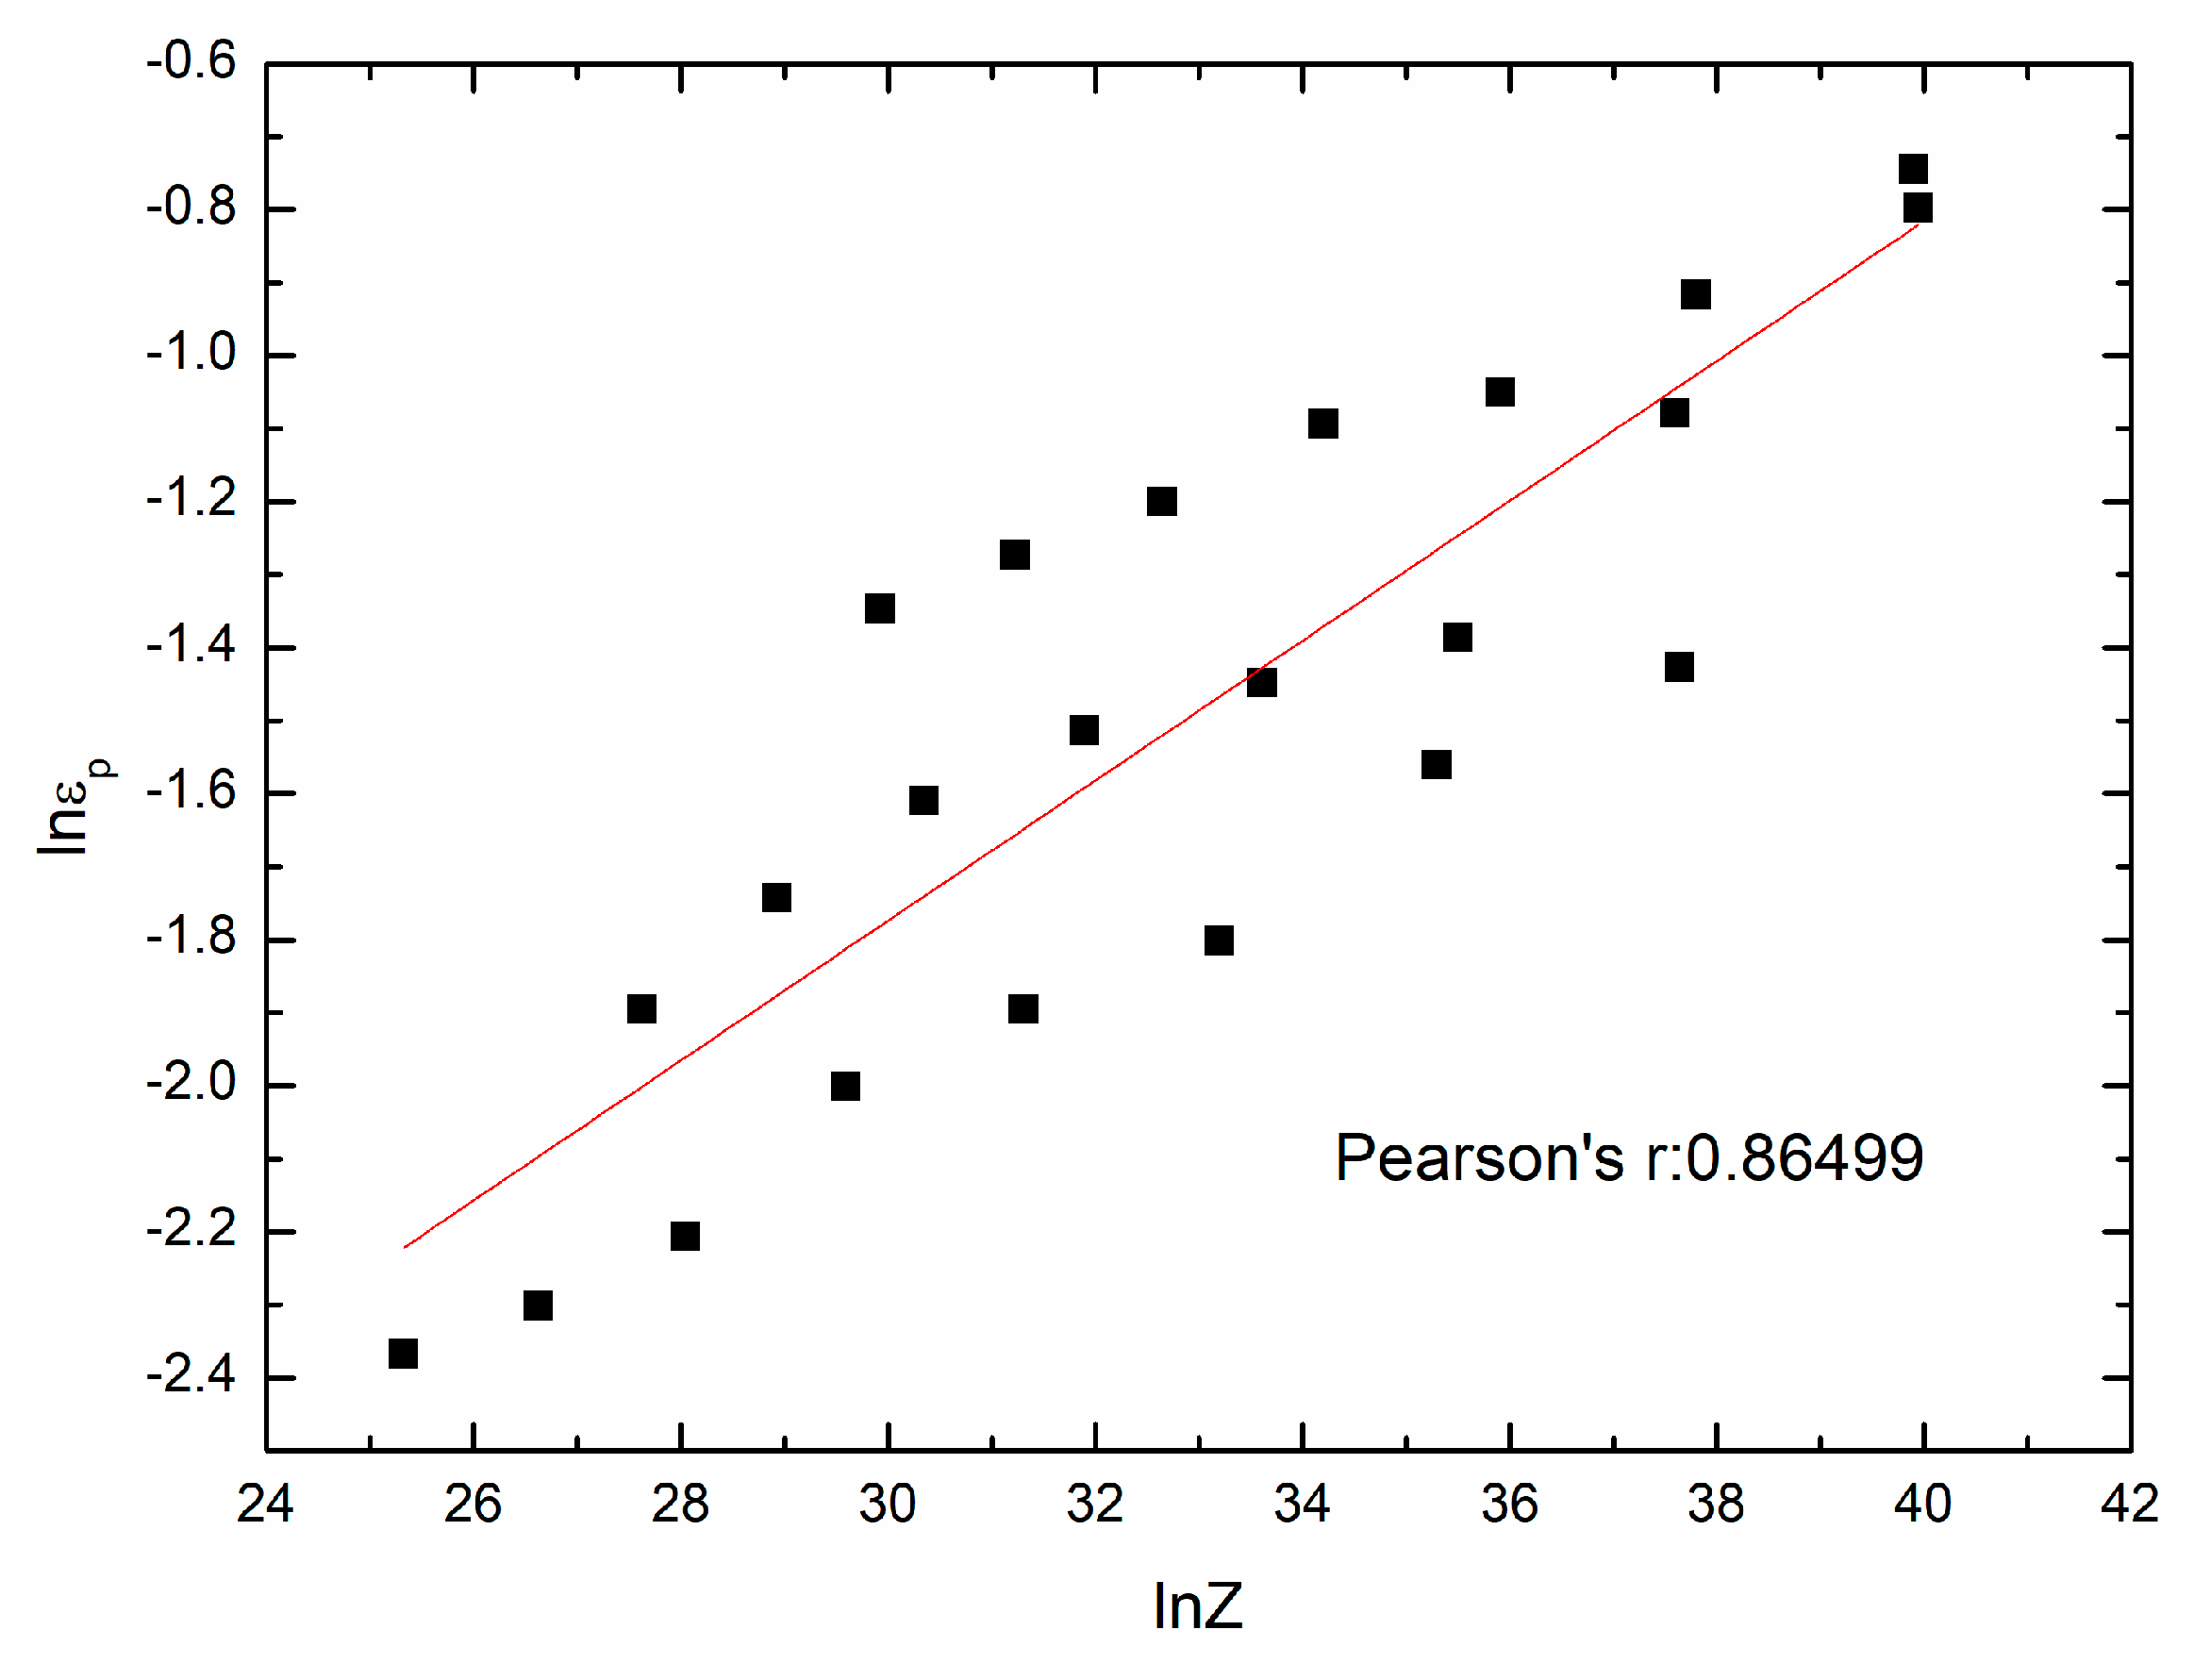
The peak strain can be obtained directly from the experimental flow stress curves. The mathematical model of can be expressed as follows:
By taking natural logarithm on both sides of Equation (18) and using different groups of , , and , Figure 7 can be drawn as follows. According to the fit result in Figure 7, can be expressed as a function of Z:
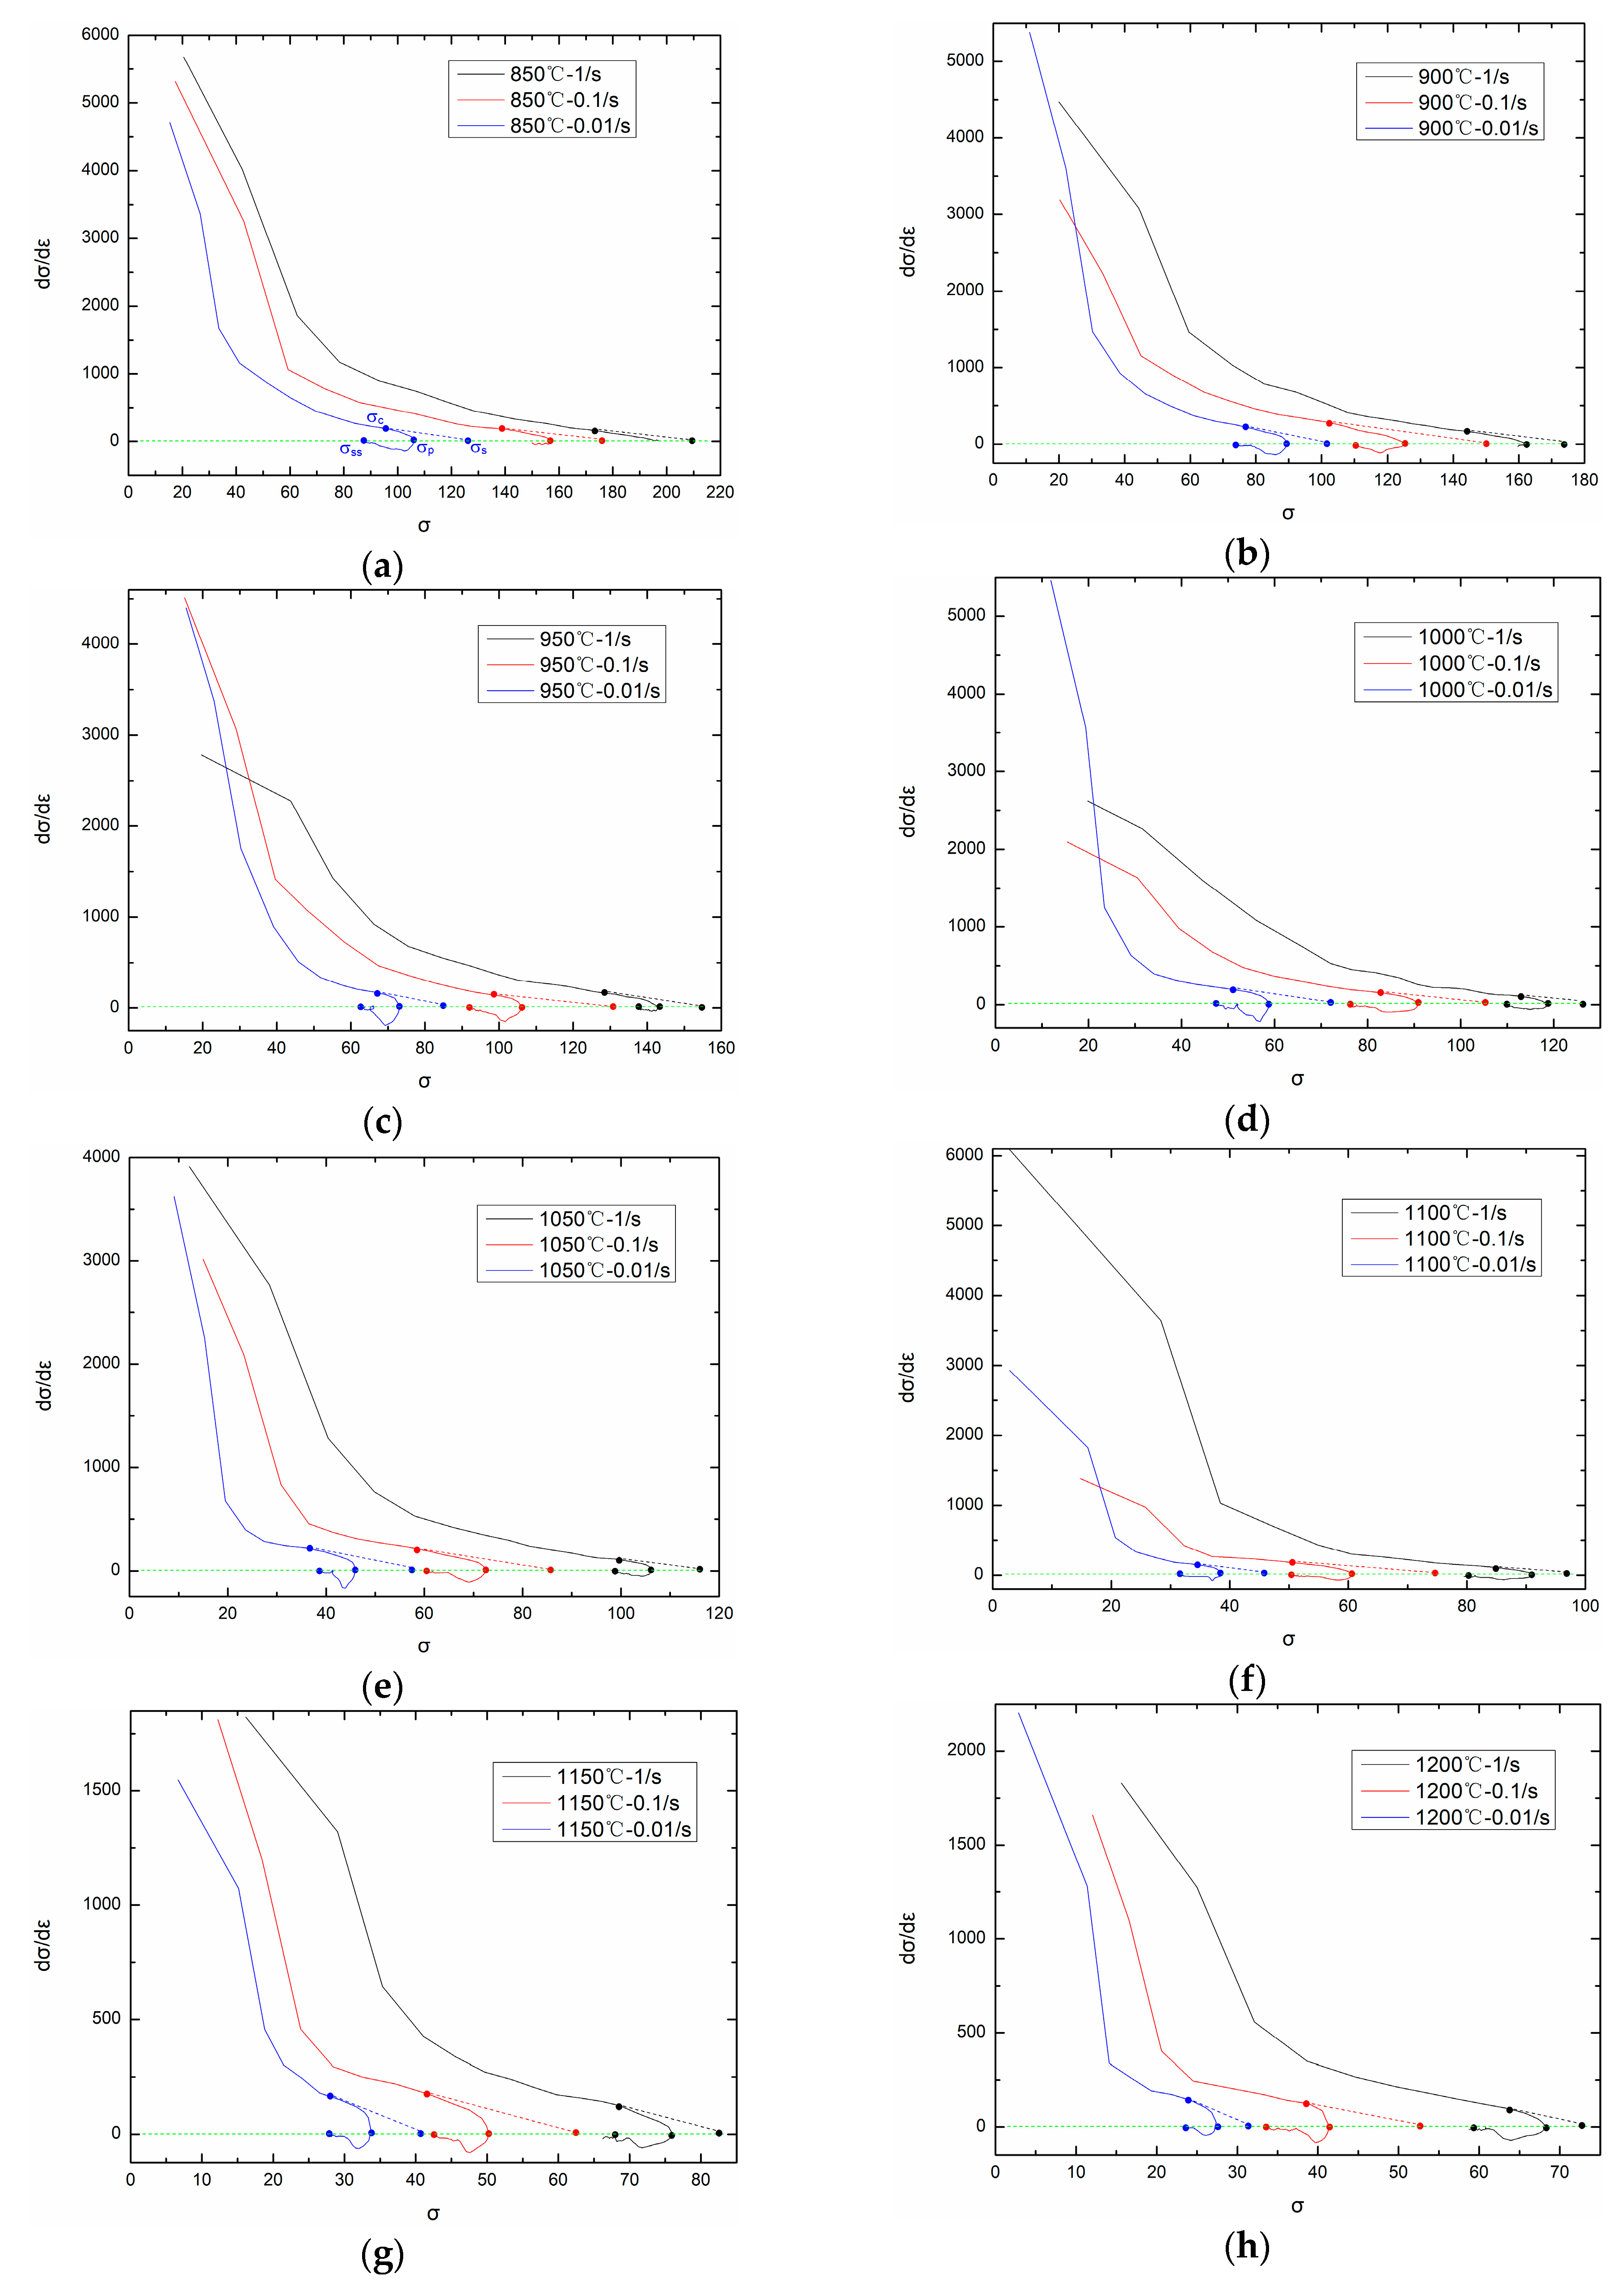
The critical strain and critical stress can be obtained from - (working hardening rate ) curve. KIM et al. proposes that - curve can be divide into three segments [26,27]. The first segment starts from and ends with , during which working hardening and dynamic recovery exist, and working hardening rate is positive. The second segment starts from and ends with , during which dynamic recrystallization exists and working hardening rate is also positive. The third segment starts from and ends with , during which working hardening rate is negative. Drawing a tangent line at the critical point (,), the intersection of the tangent line and axis is (, 0).
Figure 8 shows the - curves under different temperatures and strain rates. From Figure 8, critical stress on different temperatures and strain rates can be obtained (The second derivative when ). Based on experimental flow stress curves, the critical strain corresponding to critical stress can be easily obtained. By comparing critical strain and peak strain on each temperature and strain rate, the following relationship can be obtained:
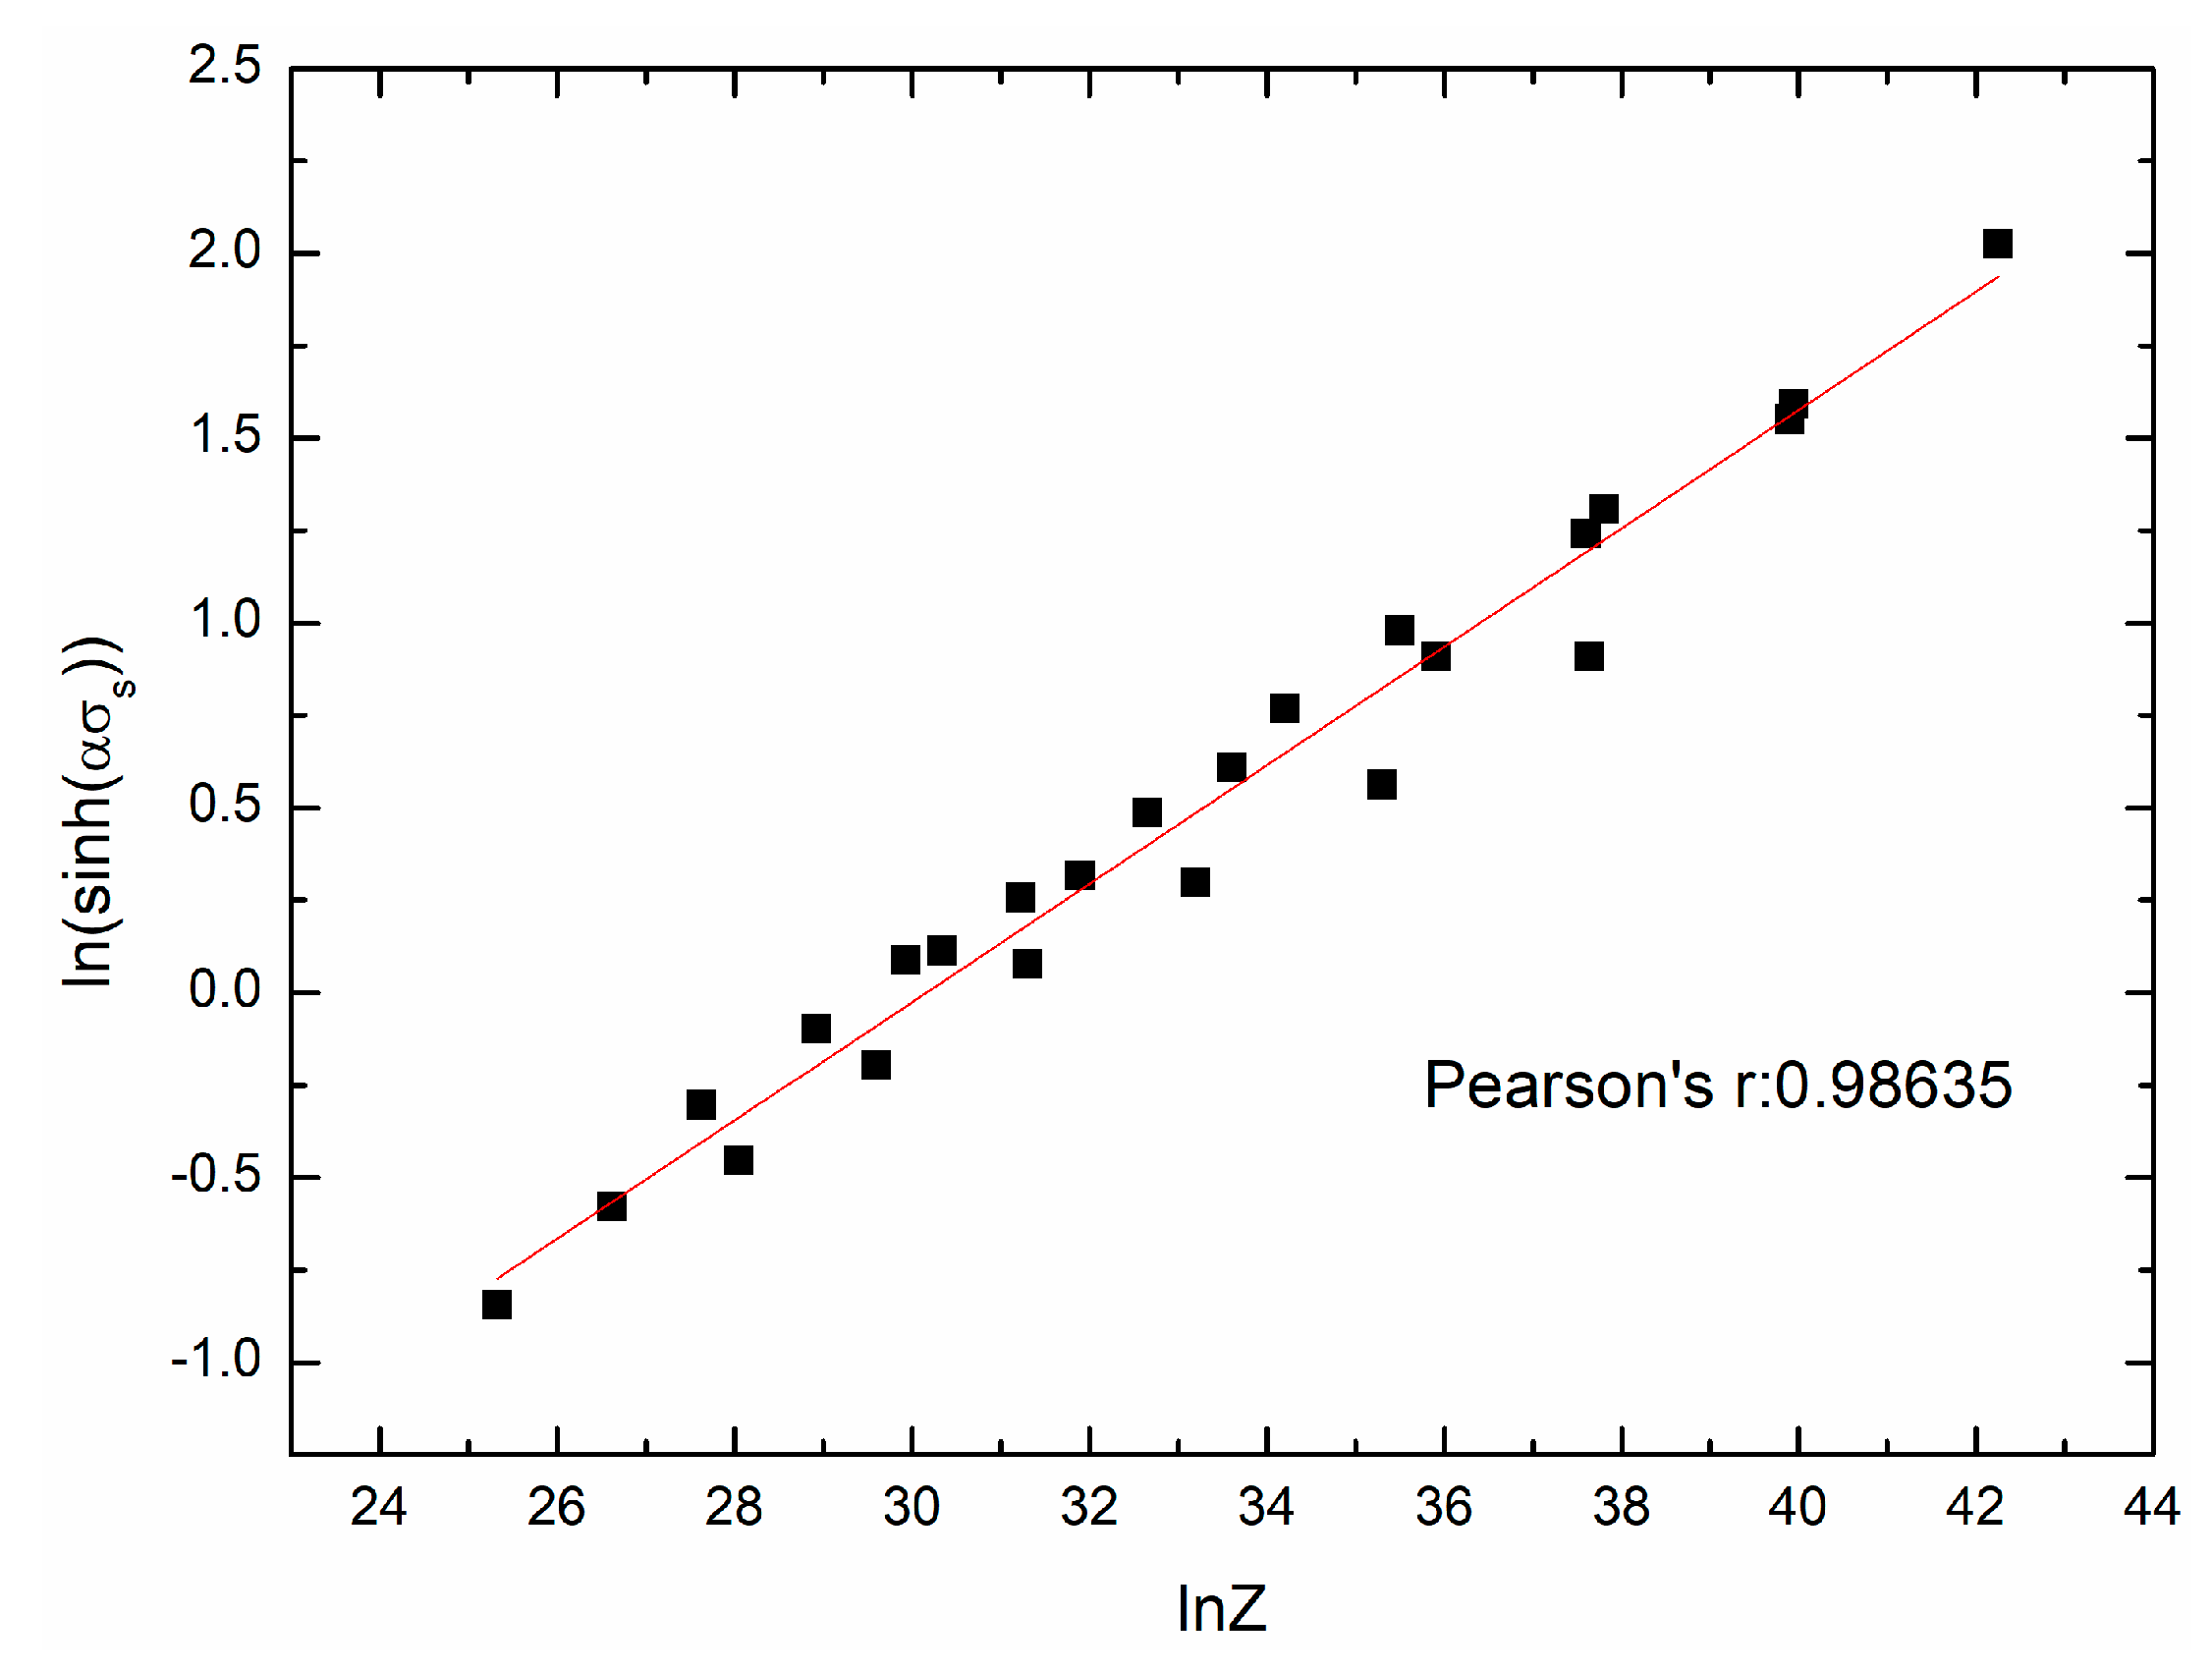
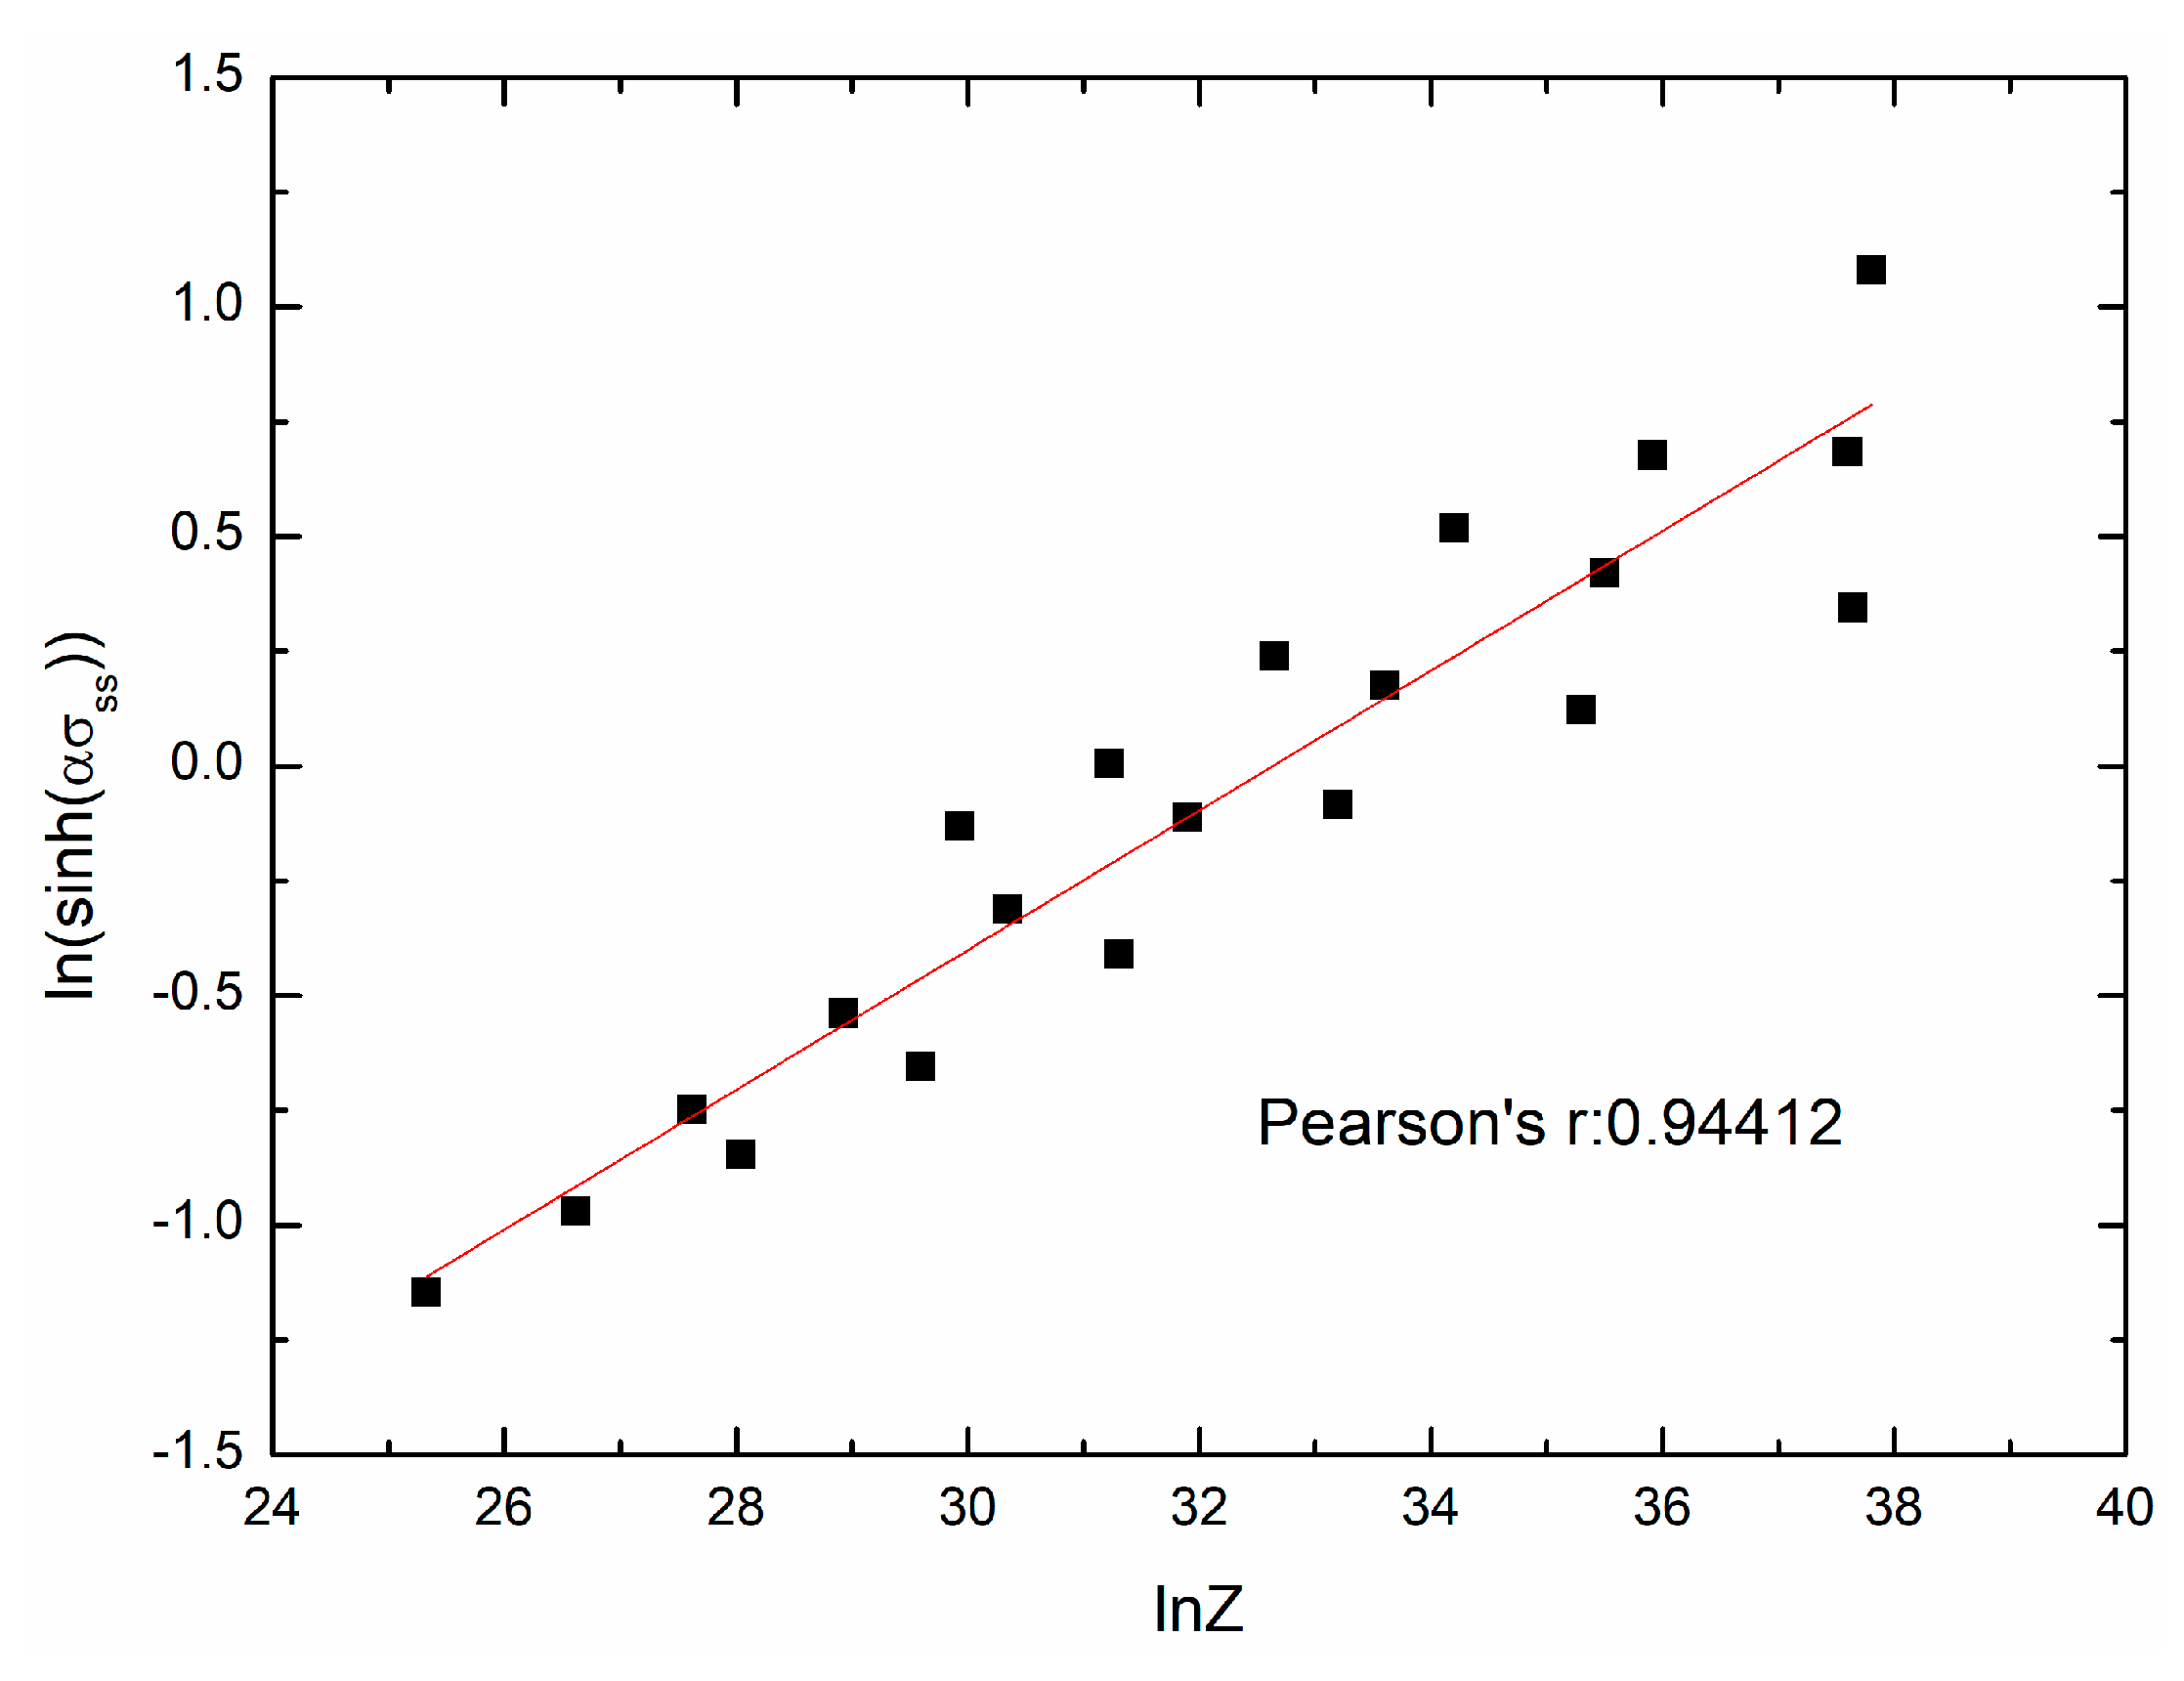
The saturation stress can be obtained by the tangent line method mentioned above. The steady state stress can be obtained from the experimental flow stress curves. The mathematical models of and can be expressed as follows:
Figure 9 and Figure 10 show the fit results of and , respectively. The mathematical models can be given as:
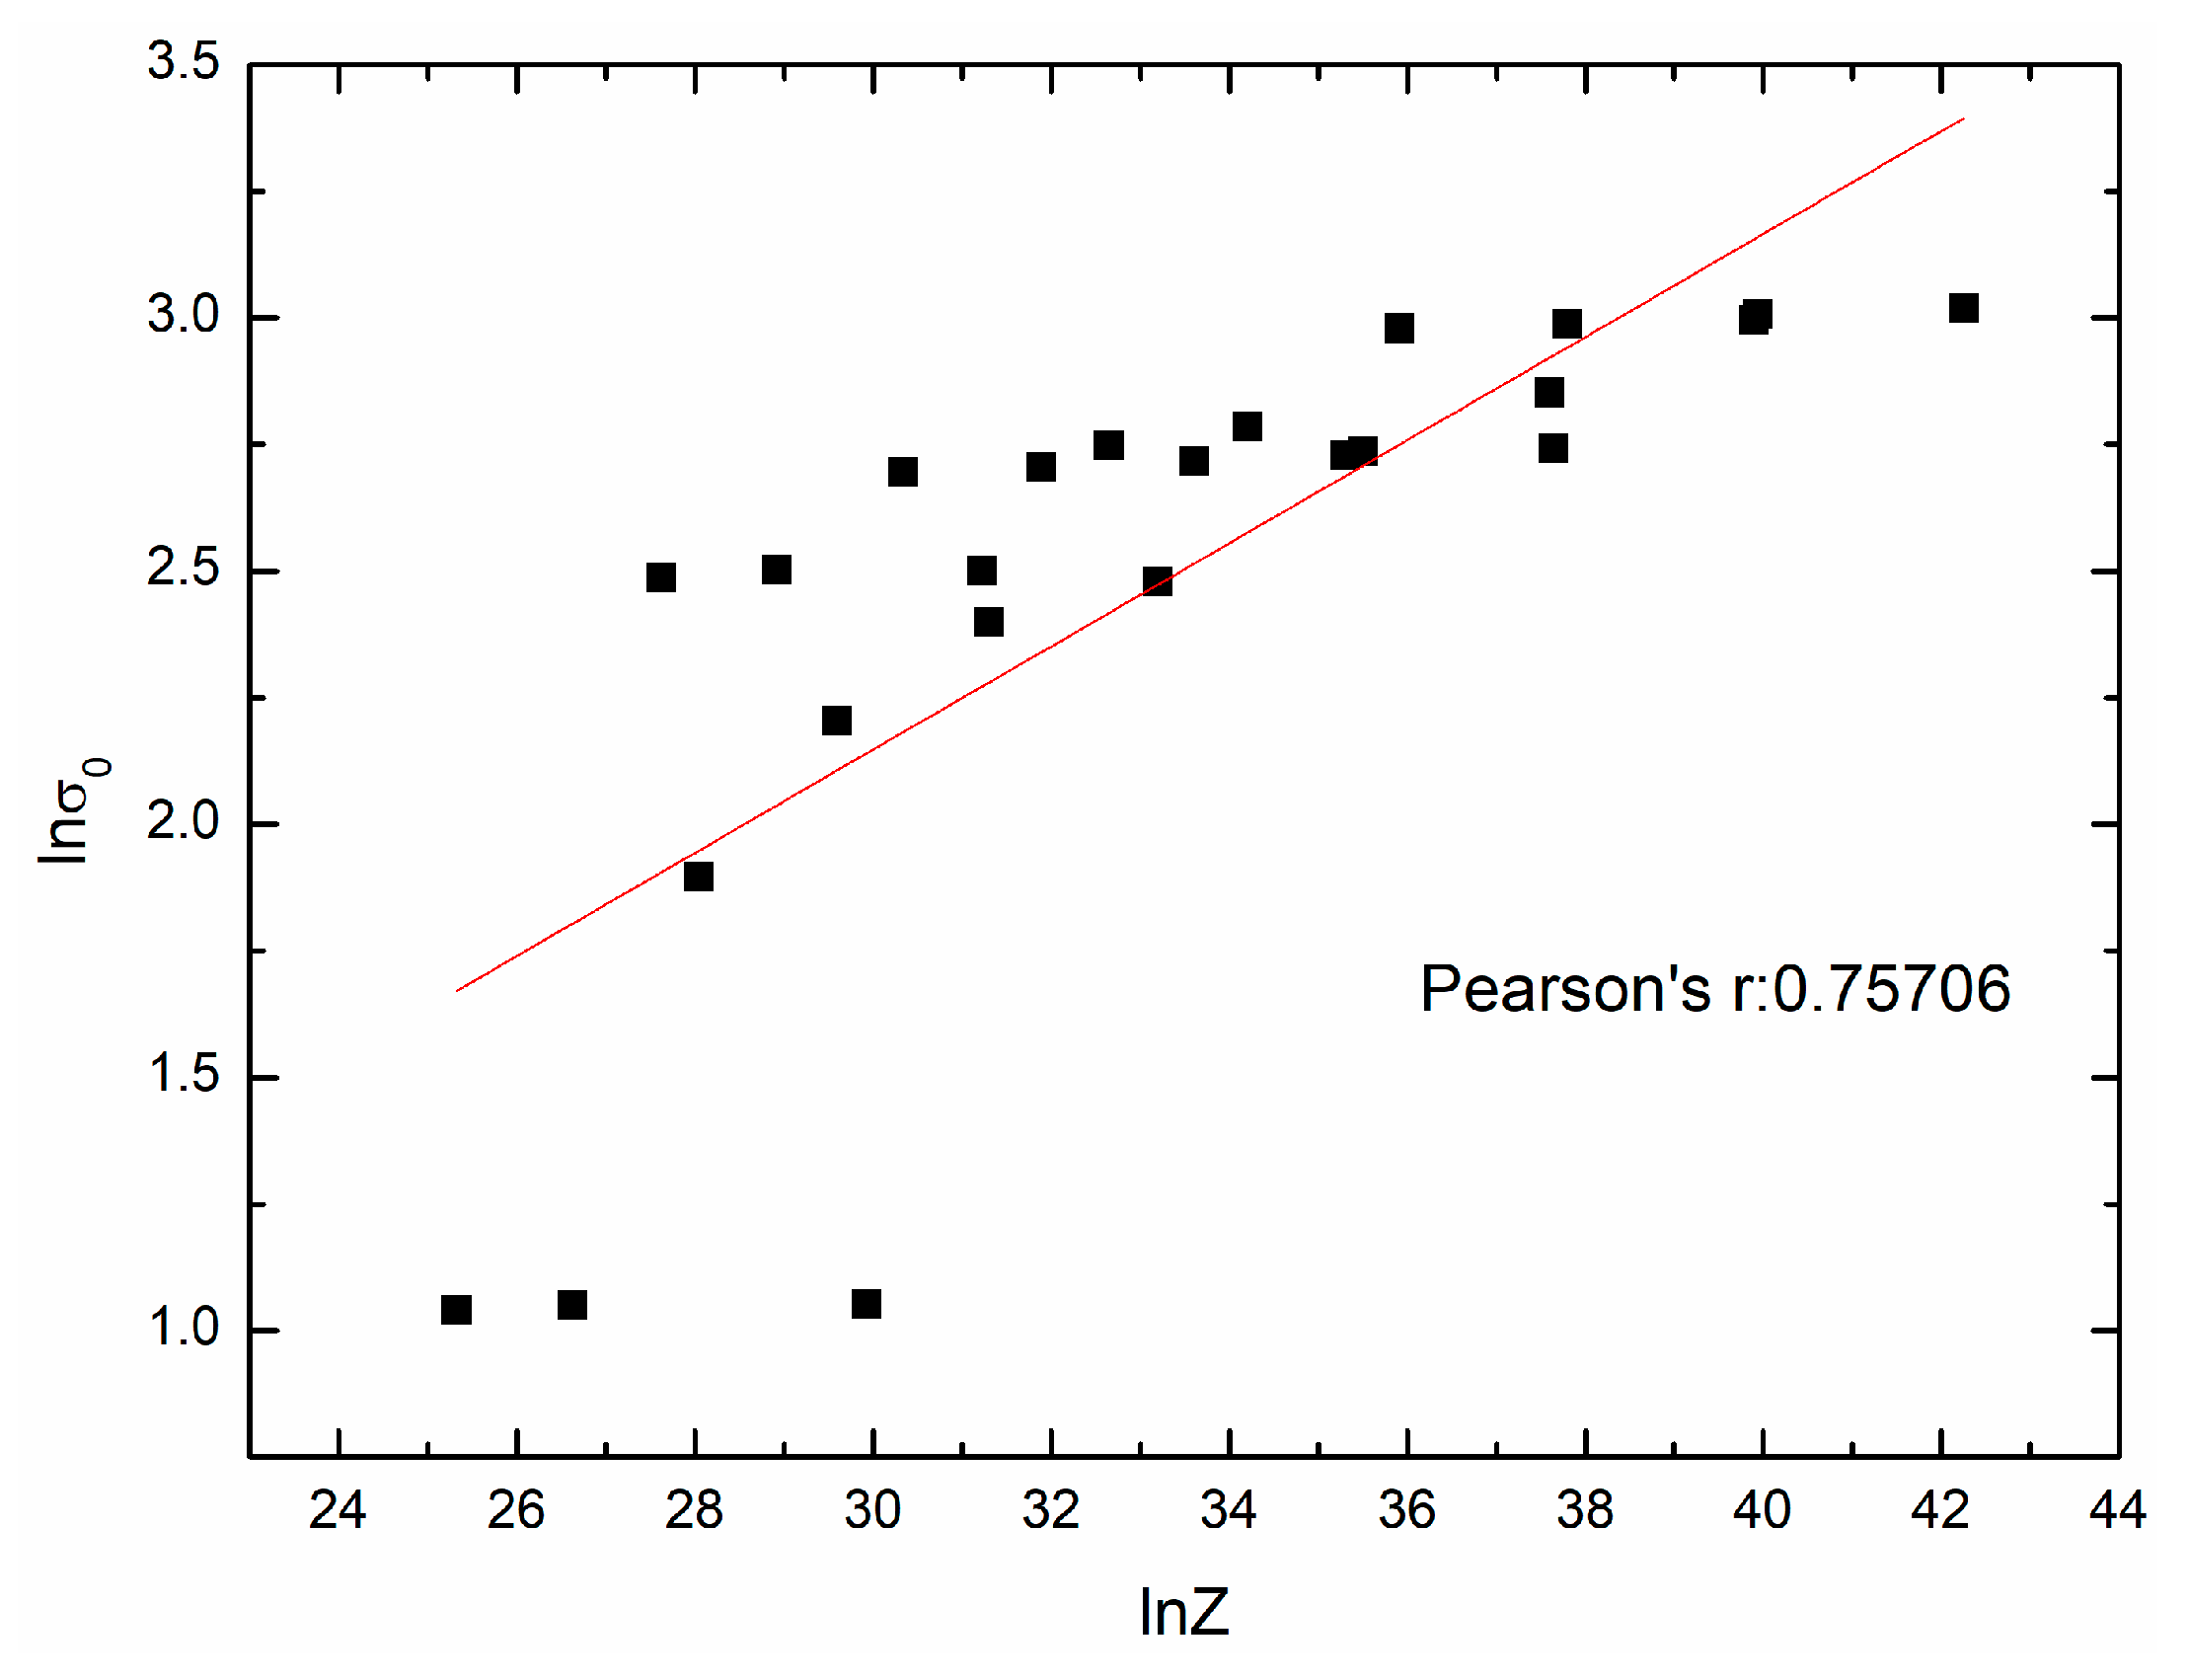
The mathematical model of initial stress can also be obtained with the method mentioned above. Figure 11 shows the fit result. And the following expression can be given:
The constant on different temperatures and strain rates can be given by the following expression:
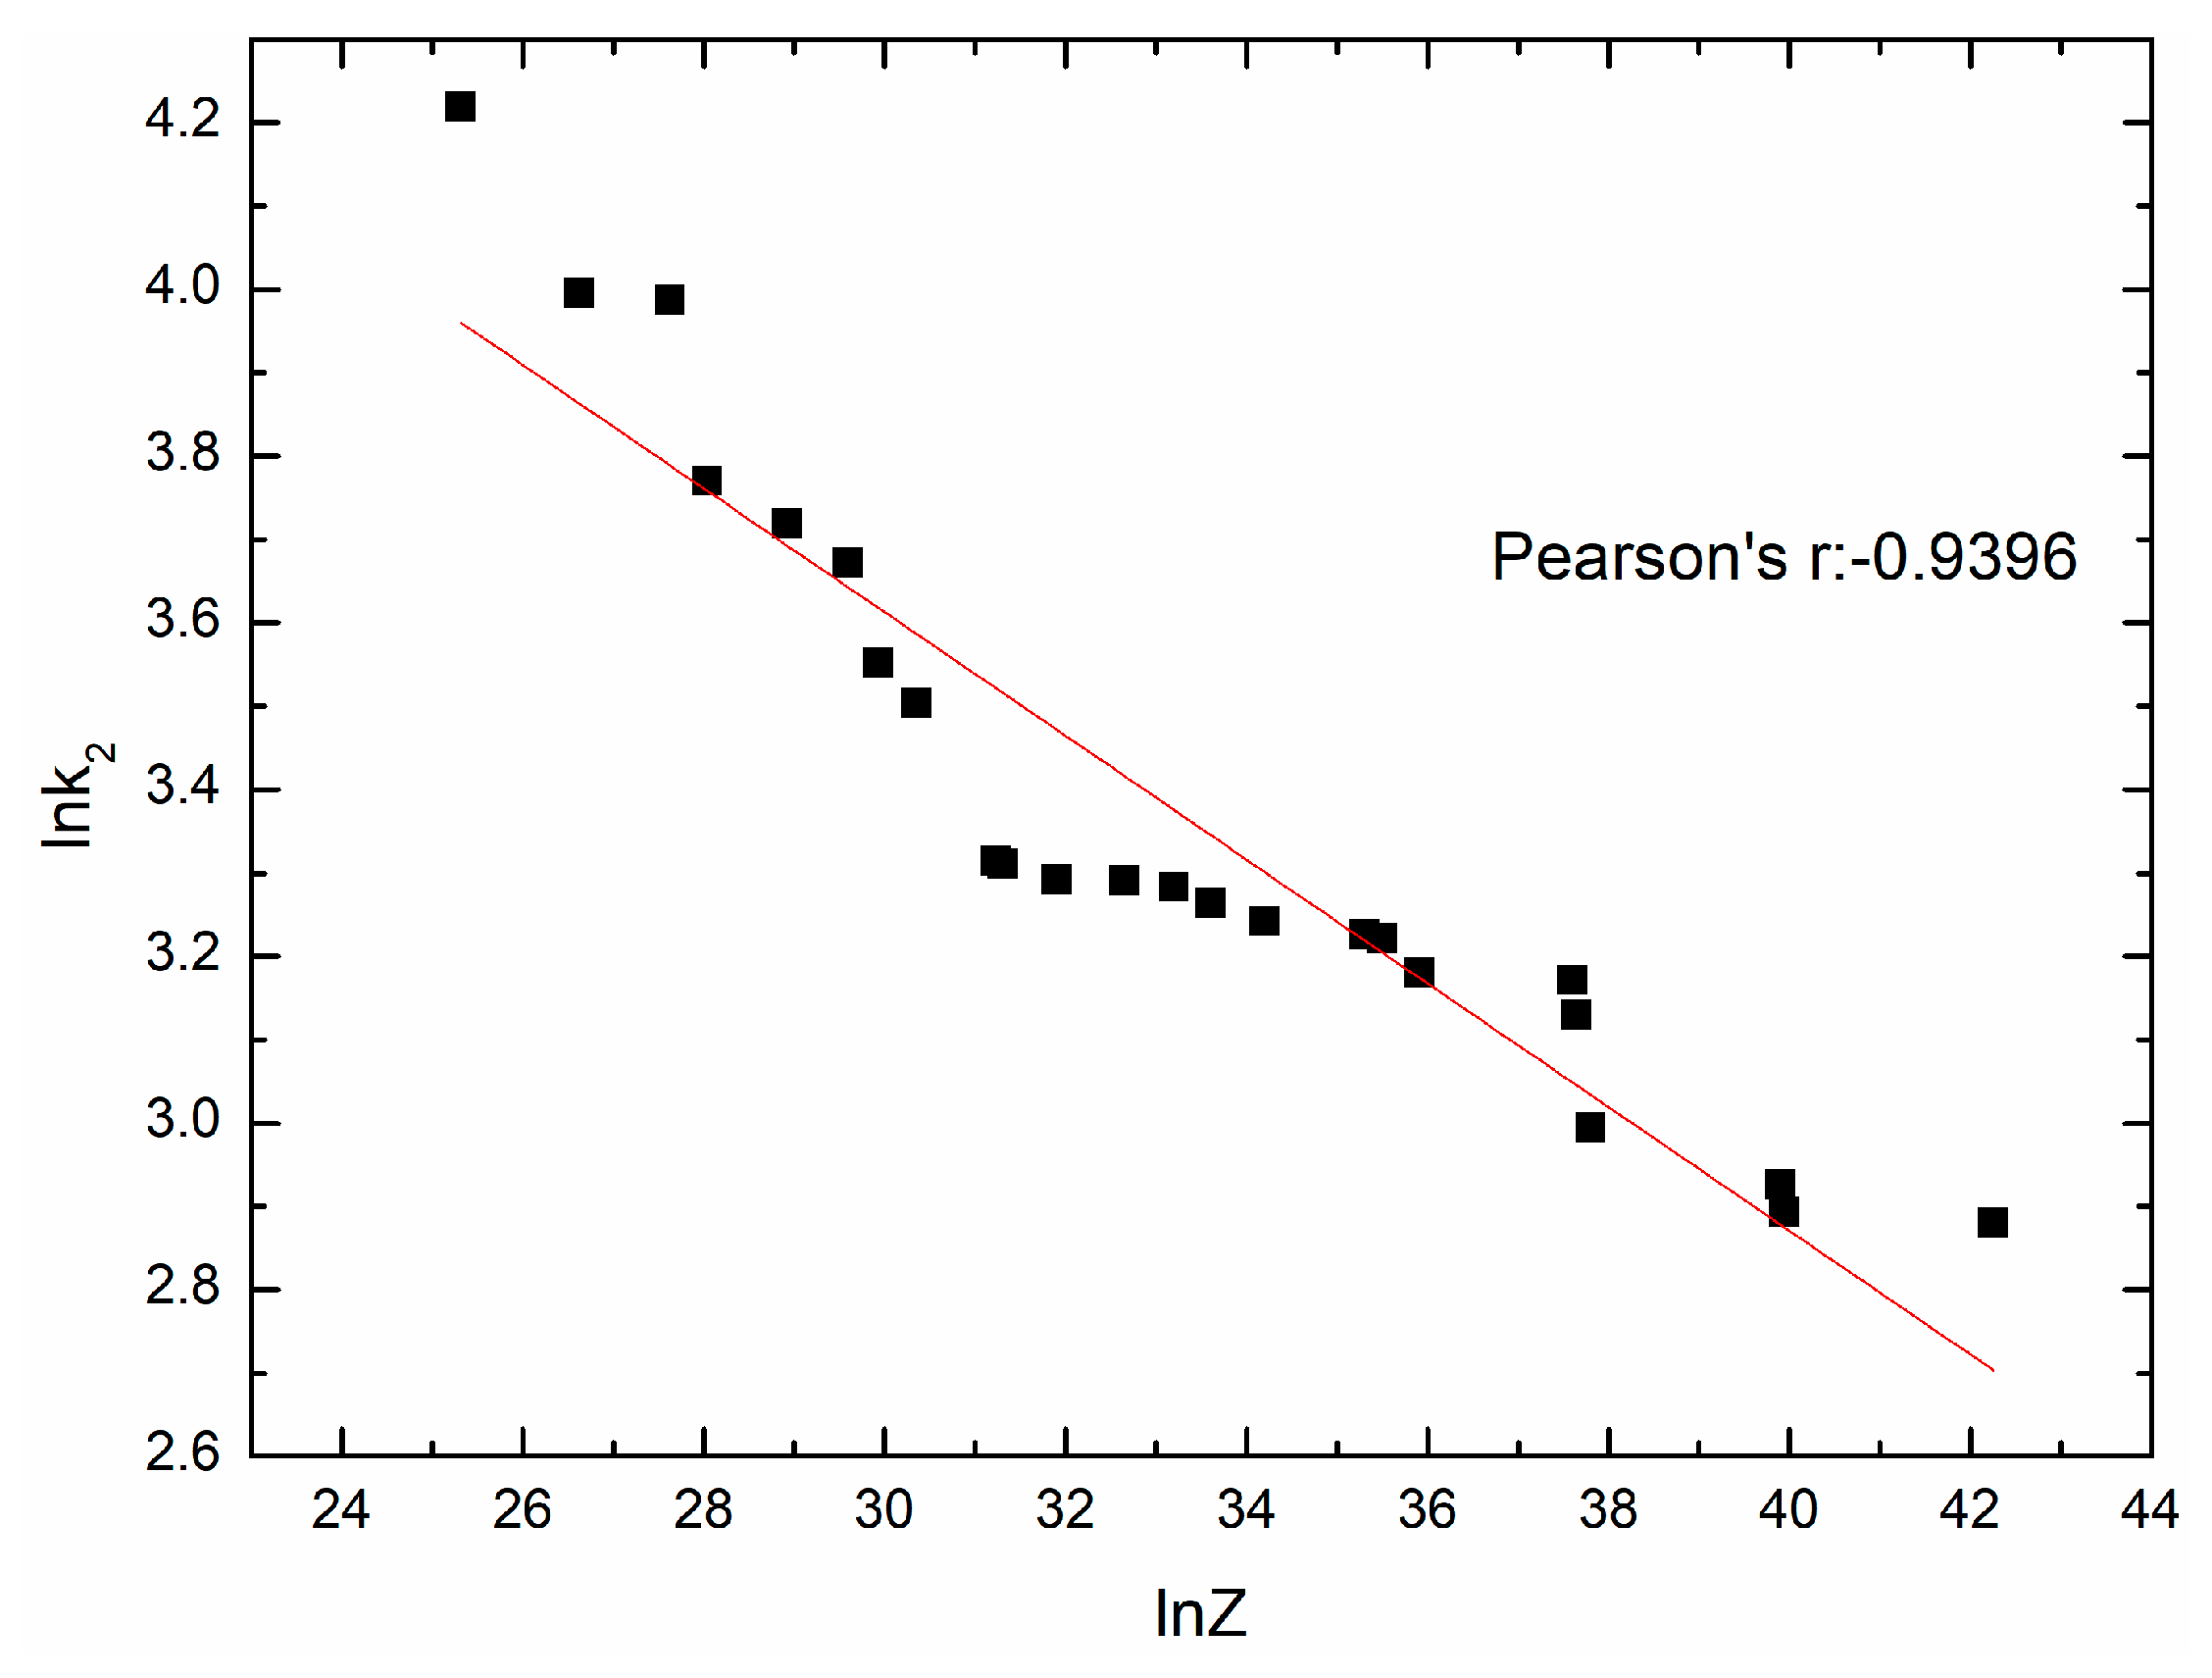
Based on the stress-strain data (), many values of on each temperature and strain rate can be obtained, and the average value is taken. Figure 12 shows the fit result. And the mathematical model is as follows:
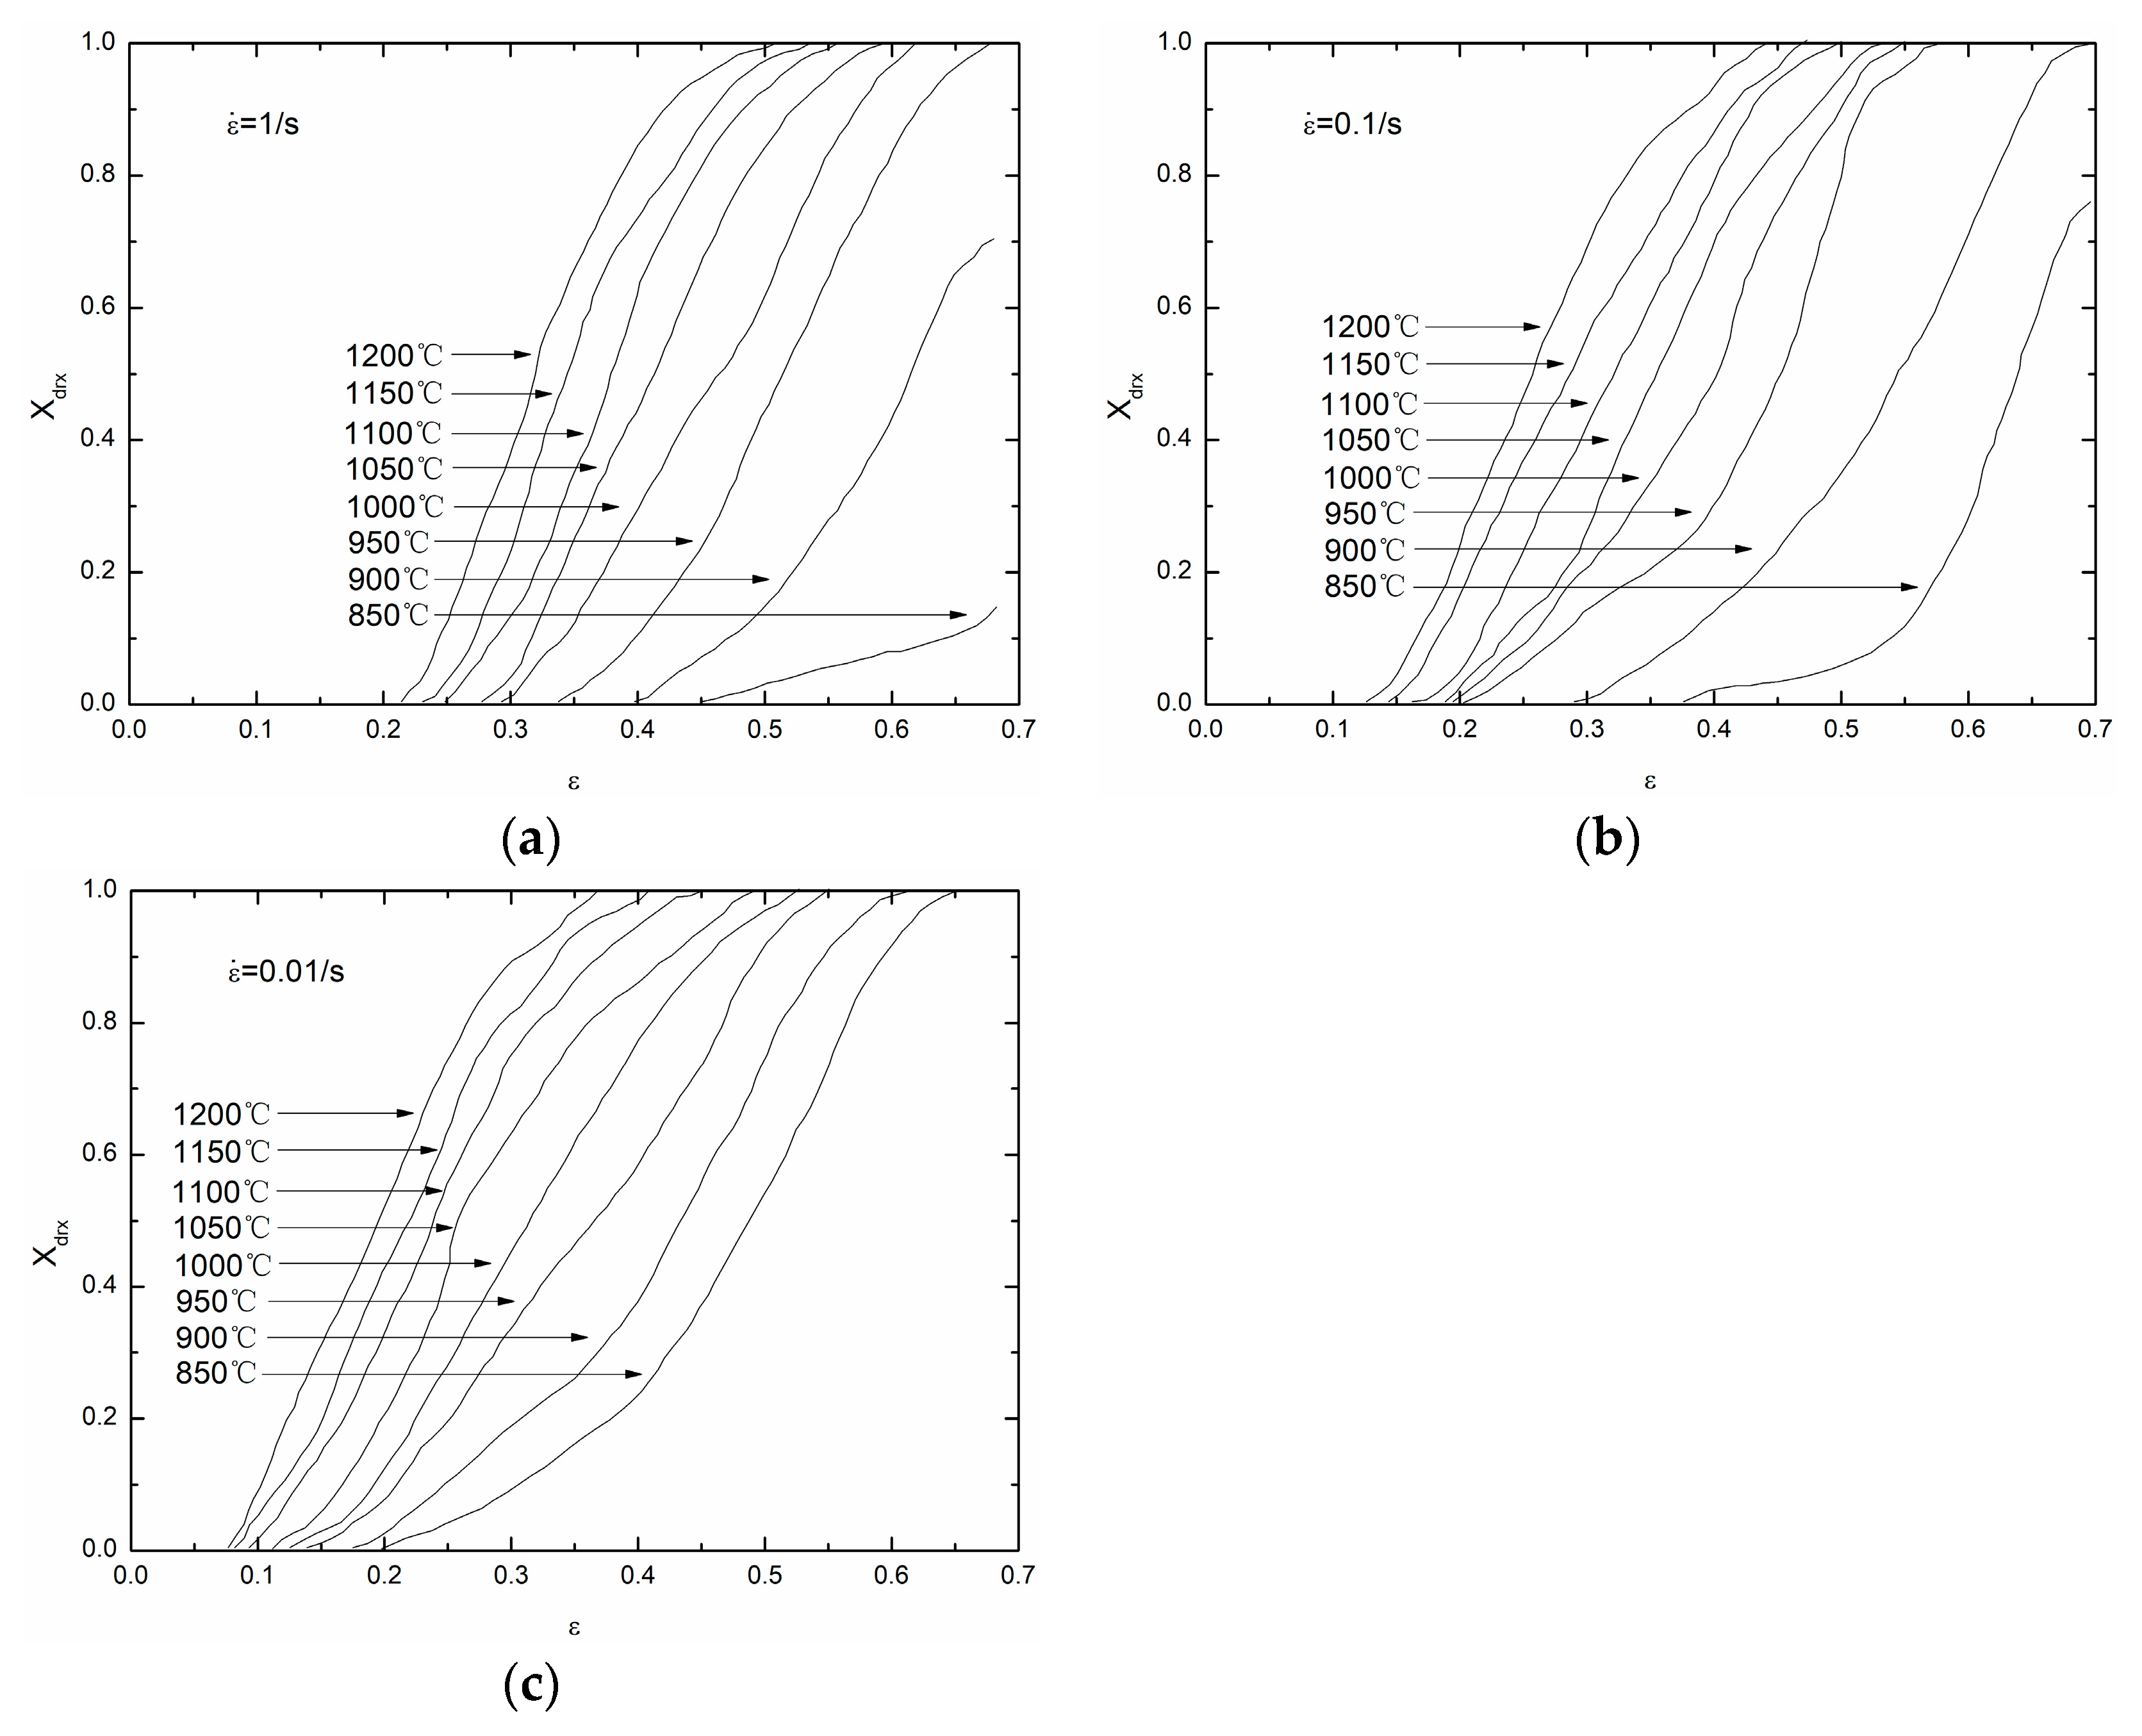
The volume fraction of DRX can be given as follows:
Based on Equation (28), different groups of (, ) on each temperature and strain rate can be obtained. Figure 13 shows the - curves on different temperatures and strain rates.
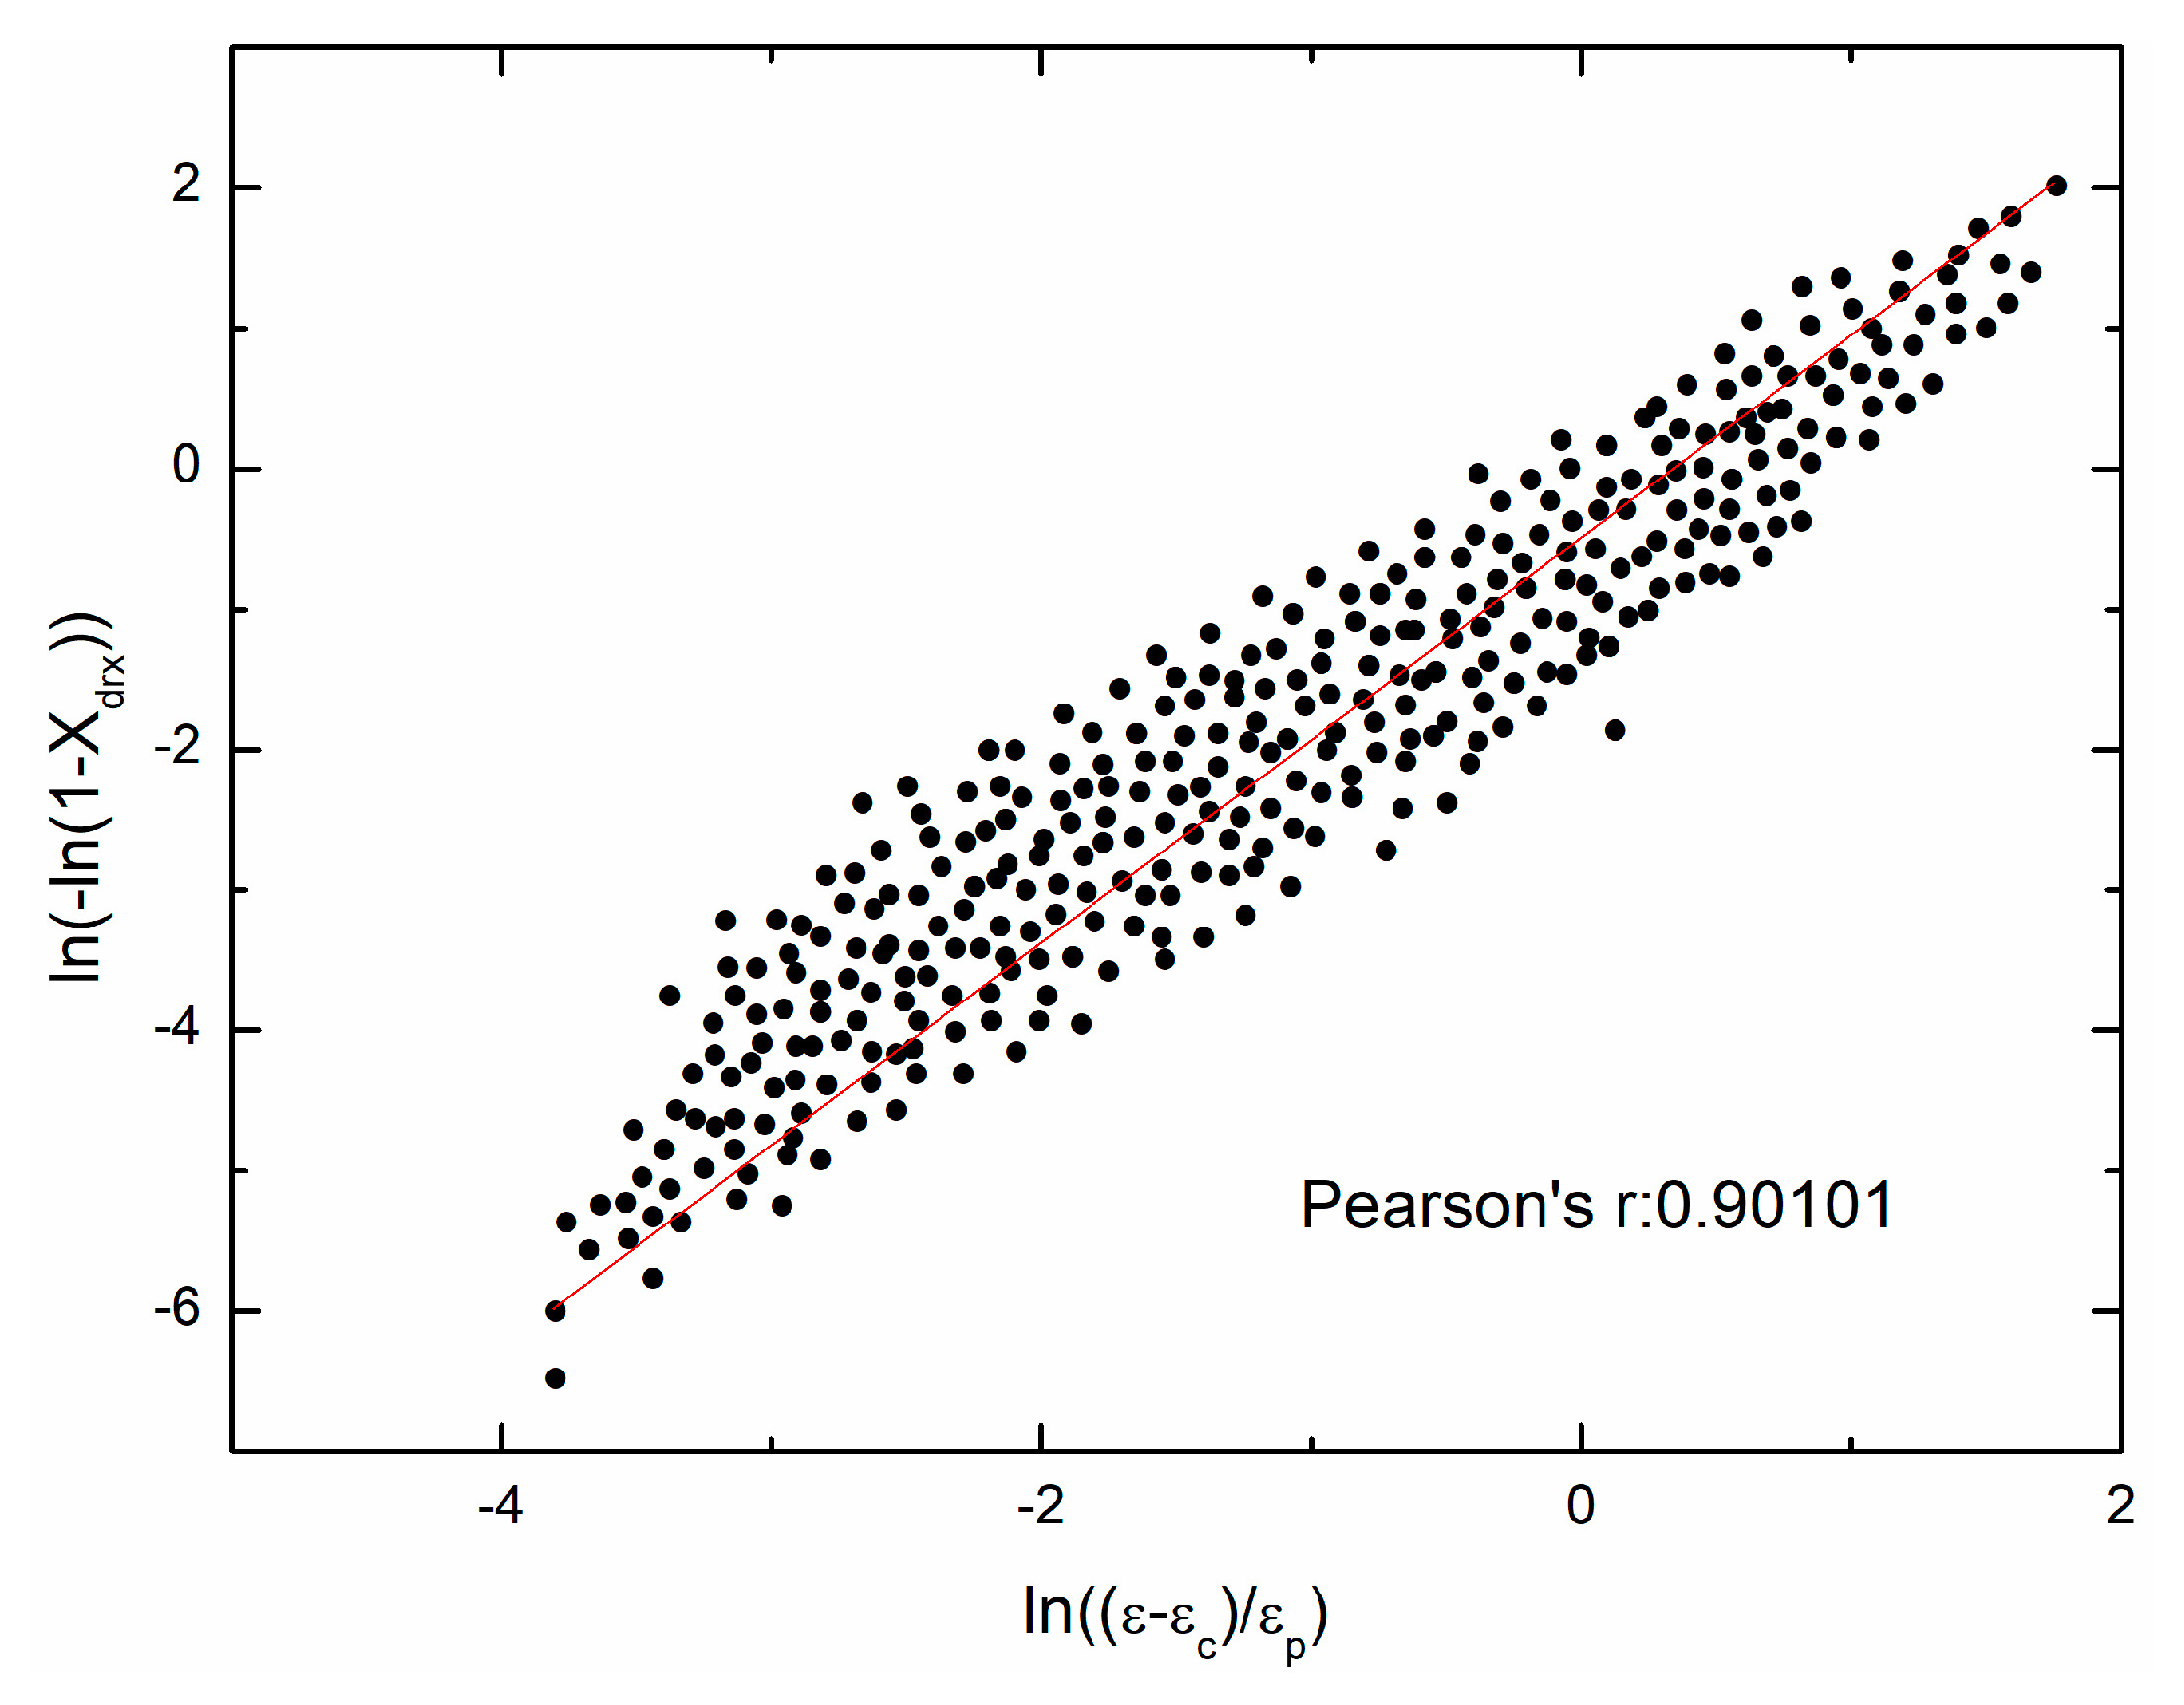
Making some transformations and taking natural logarithm on the kinetic model of DRX can give:
Figure 14 shows the fit result. And = 1.4545, = 0.6065 are obtained.
4.4. Verification of the Proposed Two-Stage Constitutive Model
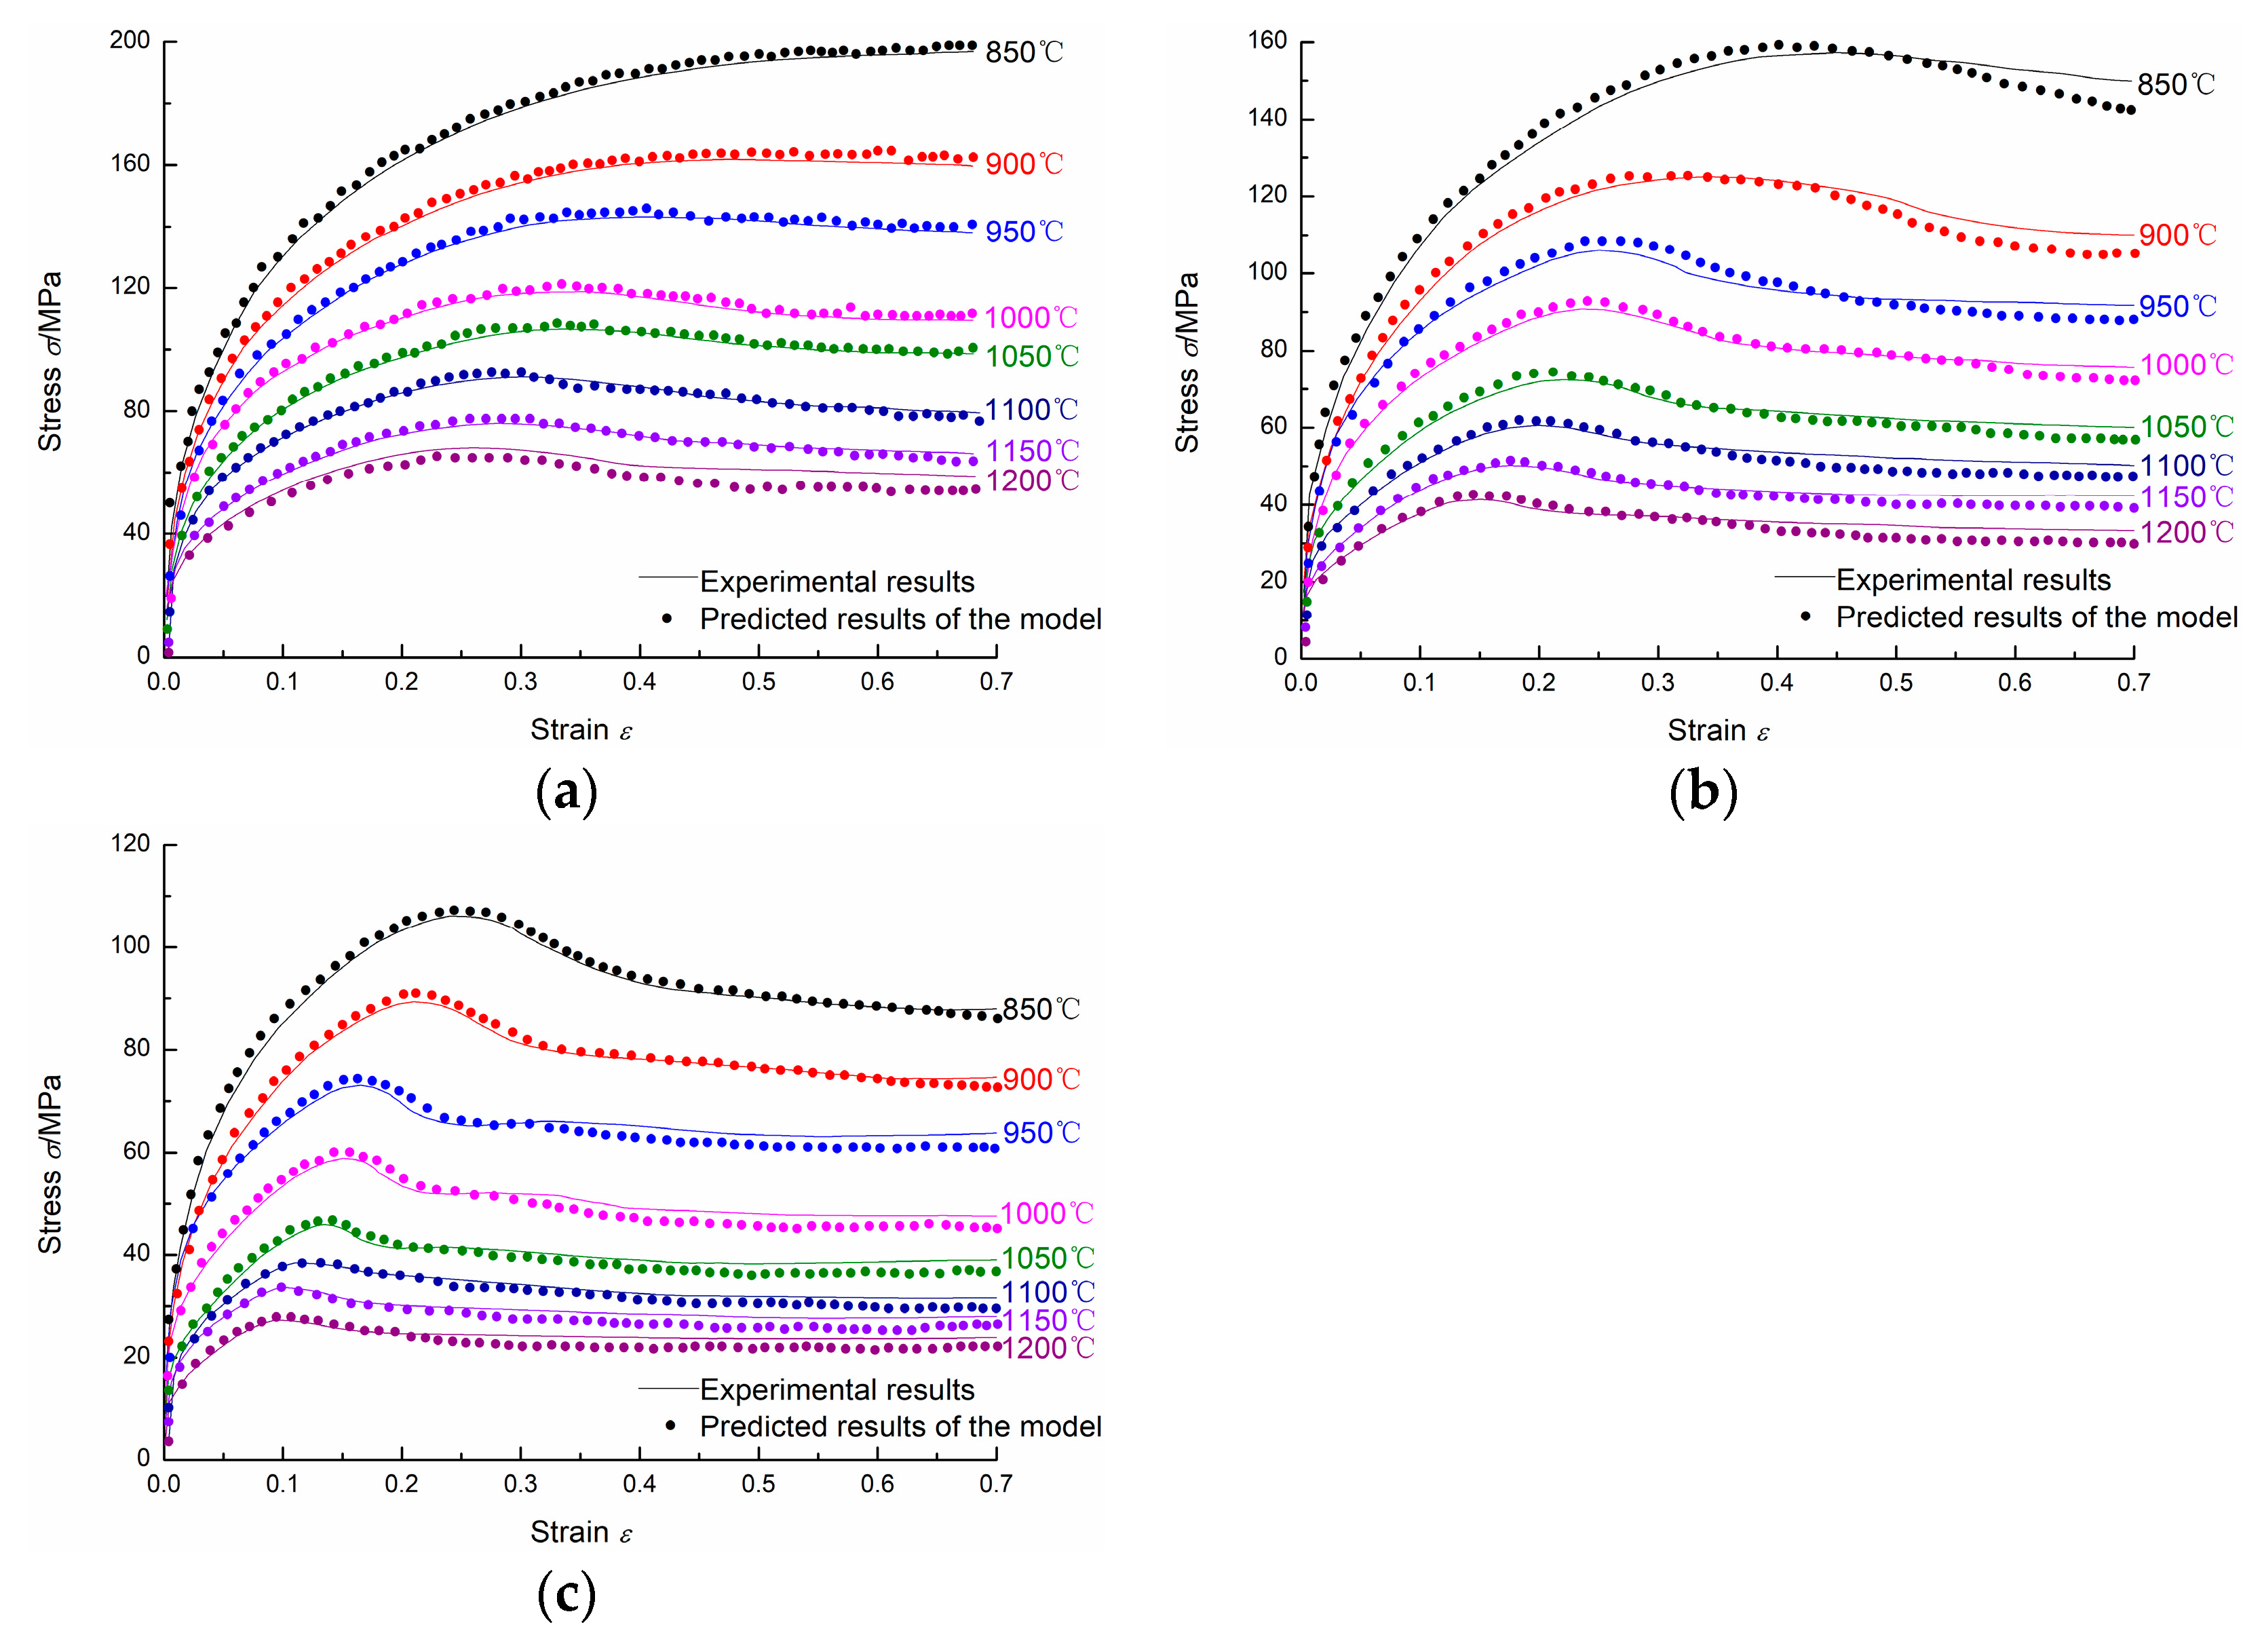
Based on the activation energy Q and the material parameters (, , , , , , , and ) determined above, the flow stress under any temperature, strain rate, and strain can be calculated. Figure 15 shows the comparison between experimental results and predicted results of the model. It can be easily seen that the predicted flow stress values are in good agreement with the experimental flow stress values. Thus, the proposed two-stage constitutive model can give a reasonable estimate of the flow stress of 20Mn5 steel and can be used for numerical simulation of hot forging of 20Mn5 hollow steel ingots.
5. Conclusions
- (1)
- During hot compression of 20Mn5 steel, firstly, the flow stress increases to a peak stress, and then the flow stress decreases gradually to a steady state stress with the increase of strain. Peak stress does not occur only at 850 °C and 1/s. At higher temperatures and lower strain rates, the peak strain, steady state strain, peak stress, and steady state stress are smaller.
- (2)
- The material constants (α, n, Q, and A) are calculated based on the peak stress.
- (3)
- A two-stage constitutive model of 20Mn5 steel is established. The related material parameters (εp, εc, σs, σss, σ0, k2, nd, and kd) are determined.
- (4)
- The proposed constitutive model can give a good prediction of the flow stress for different temperatures, strain rates, and strains, and can be used for numerical simulation of hot forging of 20Mn5 hollow steel ingots.
Acknowledgments
This study was financially supported by the National Key Basic Research Program of China (2011CB012903).
Author Contributions
Min Liu conceived and designed the experiments; Min Liu performed the experiments; Min Liu analyzed the data; Qing-Xian Ma and Jian-Bin Luo contributed some advice; Min Liu wrote the paper.
Conflicts of Interest
The authors declare no conflict of interest.
References
- Liu, M.; Ma, Q.X. Research on rotatory deformation uniformity and compaction effect of super-heavy hollow steel ingot. J. Mech. Eng. 2016, 52, 90–96. [Google Scholar] [CrossRef]
- Liu, M.; Dong, X.L.; Ma, Q.X. Investigation on hollow steel ingot forging process of heavy cylinder forging. J. Plast. Eng. 2013, 20, 1–8. [Google Scholar] [CrossRef]
- Mao, W.M.; Zhao, X.B. Recrystallization and Grain Growth of Metal, 1st ed.; Metallurgical Industry Press: Beijing, China, 1994; pp. 218–241. [Google Scholar]
- Chen, F.; Feng, G.W.; Cui, Z.S. New constitutive model for hot working. Metall. Mater. Trans. A. 2016, 47, 1229–1239. [Google Scholar] [CrossRef]
- Dong, D.Q.; Chen, F.; Cui, Z.S. A physically-based constitutive model for SA508-III steel: modeling and experimental verification. Mater. Sci. Eng. A. 2015, 634, 103–115. [Google Scholar] [CrossRef]
- Chen, F.; Cui, Z.S.; Chen, S.J. Recrystallization of 30Cr2Ni4MoV ultra-super-critical rotor steel during hot deformation. Part I: dynamic recrystallization. Mater. Sci. Eng. A. 2011, 528, 5073–5080. [Google Scholar] [CrossRef]
- Chen, F.; Liu, J.; Ou, H.G.; Liu, B.; Cui, Z.S.; Long, H. Flow characteristics and intrinsic workability of IN718 superalloy. Mater. Sci. Eng. A. 2015, 642, 279–287. [Google Scholar] [CrossRef]
- Li, X.C.; Duan, L.L.; Li, J.W.; Wu, X.C. Experimental study and numerical simulation of dynamic recrystallization behavior of a micro-alloyed plastic mold steel. Mater. Des. 2015, 66, 309–320. [Google Scholar] [CrossRef]
- Wang, J.; Zhao, G.Q.; Chen, L.; Li, J.L. A comparative study of several constitutive models for power metallurgy tungsten at elevated temperature. Mater. Des. 2016, 90, 91–100. [Google Scholar] [CrossRef]
- Lin, Y.C.; Chen, X.M. A critical review of experimental results and constitutive descriptions for metals and alloys in hot working. Mater. Des. 2011, 32, 1733–1759. [Google Scholar] [CrossRef]
- Wang, J.; Yang, H.T.; Wang, X.G.; Xiao, H. A new mathematical model for predicting flow stress up to the critical strain during hot deformation. Mater. Des. 2015, 65, 637–643. [Google Scholar] [CrossRef]
- Solhjoo, S.; Vakis, A.I.; Pei, Y.T.T. Two phenomenological models to predict the single peak flow stress curves up to the peak during hot deformation. Mech. Mater. 2017, 105, 61–66. [Google Scholar] [CrossRef]
- Ji, G.L.; Li, Q.; Li, L. A physical-based constitutive relation to predict flow stress for Cu-0.4Mg alloy during hot working. Mater. Sci. Eng. A 2014, 615, 247–254. [Google Scholar] [CrossRef]
- Ji, G.L.; Li, Q.; Ding, K.Y.; Yang, L.; Li, L. A physical-based constitutive model for high temperature deformation of Cu-0.36Cr-0.03Zr alloy. J. Alloys Compd. 2015, 648, 397–407. [Google Scholar] [CrossRef]
- Ji, G.L.; Li, L.; Qin, F.L.; Zhu, L.Y.; Li, Q. Comparative study of phenomenological constitutive equations for an as-rolled M50NiL steel during hot deformation. J. Alloys Compd. 2017, 695, 2389–2399. [Google Scholar] [CrossRef]
- Ji, G.L.; Li, F.G.; Li, Q.H.; Li, H.Q.; Li, Z. Research on the dynamic recrystallization kinetics of Aermet100 steel. Mater. Sci. Eng. A. 2010, 527, 2350–2355. [Google Scholar] [CrossRef]
- Ji, G.L.; Li, Q.; Li, L. The kinetics of dynamic recrystallization of Cu-0.4Mg alloy. Mater. Sci. Eng. A 2013, 586, 197–203. [Google Scholar] [CrossRef]
- Busso, E.P. A continuum theory for dynamic recrystallization with microstructure-related length scales. Int. J. Plast. 1998, 14, 319–353. [Google Scholar] [CrossRef]
- McQueen, H.J.; Ryan, N.D. Constitutive analysis in hot working. Mater. Sci. Eng. A. 2002, 322, 43–63. [Google Scholar] [CrossRef]
- McQueen, H.J. Development of dynamic recrystallization theory. Mater. Sci. Eng. A. 2004, 387–389, 203–208. [Google Scholar] [CrossRef]
- McQueen, H.J.; Imbert, C.A.C. Dynamic recrystallization: plasticity enhancing structural development. J. Alloys Compd. 2004, 378, 35–43. [Google Scholar] [CrossRef]
- McQueen, H.J.; Yue, S.; Ryan, N.D.; Fry, E. Hot working characteristics of steels in austenitic state. J. Mater. Process. Technol. 1995, 53, 293–310. [Google Scholar] [CrossRef]
- Medina, S.F.; Hernandez, C.A. Modelling of the dynamic recrystallization of austenite in low alloy and microalloyed steels. Acta Mater. 1996, 44, 165–171. [Google Scholar] [CrossRef]
- Poliak, E.I.; Jonas, J.J. Initiation of dynamic recrystallization in constant strain rate hot deformation. ISIJ Int. 2007, 43, 684–691. [Google Scholar] [CrossRef]
- Stewart, G.R.; Jonas, J.J.; Montheillet, F. Kinetics and critical conditions for the initiation of dynamic recrystallization in 304 stainless steel. ISIJ Int. 2004, 44, 1581–1589. [Google Scholar] [CrossRef]
- Kim, S.I.; Yoo, Y.C. Dynamic recrystallization behavior of AISI 304 stainless steel. Mater. Sci. Eng. A. 2001, 311, 108–113. [Google Scholar] [CrossRef]
- Kim, S.I.; Lee, Y.; Lee, D.L.; Yoo, Y.C. Modeling of AGS and recrystallized fraction of microalloyed medium carbon steel during hot deformation. Mater. Sci. Eng. A. 2003, 355, 384–393. [Google Scholar] [CrossRef]
Figure 1.
The initial as-cast microstructure of 20Mn5 steel.

Figure 2.
Flow stress curves of the 20Mn5 steel under strain rates of: (a) 1/s; (b) 0.1/s; (c) 0.01/s.
Figure 2.
Flow stress curves of the 20Mn5 steel under strain rates of: (a) 1/s; (b) 0.1/s; (c) 0.01/s.

Figure 3.
Microstructure of 20Mn5 steel compressed to a true strain of 0.7 under strain rate of 0.01/s and temperatures of: (a) 850 °C; (b) 900 °C; (c) 950 °C; (d) 1000 °C; (e) 1050 °C; (f) 1100 °C; (g) 1150 °C; (h) 1200 °C.
Figure 3.
Microstructure of 20Mn5 steel compressed to a true strain of 0.7 under strain rate of 0.01/s and temperatures of: (a) 850 °C; (b) 900 °C; (c) 950 °C; (d) 1000 °C; (e) 1050 °C; (f) 1100 °C; (g) 1150 °C; (h) 1200 °C.


Figure 4.
Microstructure of 20Mn5 steel compressed to a true strain of 0.7 under temperature of 1200 °C and strain rates of: (a) 1/s; (b) 0.1/s; (c) 0.01/s.
Figure 4.
Microstructure of 20Mn5 steel compressed to a true strain of 0.7 under temperature of 1200 °C and strain rates of: (a) 1/s; (b) 0.1/s; (c) 0.01/s.

Figure 5.
Typical flow stress curves for hot working.

Figure 6.
Calculation of material constants: (a) n1; (b) β; (c) n; (d) Q and A.

Figure 7.
The relationship between and .

Figure 8.
dσ/dε-σ curves on different temperatures: (a) 850 °C; (b) 900 °C; (c) 950 °C; (d) 1000 °C; (e) 1050 °C; (f) 1100 °C; (g) 1150 °C; (h) 1200 °C.
Figure 8.
dσ/dε-σ curves on different temperatures: (a) 850 °C; (b) 900 °C; (c) 950 °C; (d) 1000 °C; (e) 1050 °C; (f) 1100 °C; (g) 1150 °C; (h) 1200 °C.

Figure 9.
The relationship between and .

Figure 10.
The relationship between and .

Figure 11.
The relationship between and .

Figure 12.
The relationship between and .

Figure 13.
The - curves on different temperatures and strain rates: (a) 1/s; (b) 0.1/s; (c) 0.01/s.

Figure 14.
The relationship between and .

Figure 15.
The comparison between experimental results and predicted results of the model: (a) 1/s; (b) 0.1/s; (c) 0.01/s.
Figure 15.
The comparison between experimental results and predicted results of the model: (a) 1/s; (b) 0.1/s; (c) 0.01/s.


Table 1.
Chemical composition of 20Mn5 steel (wt %).
| C | Si | Mn | P | S | Cr | Ni | Mo | Al |
|---|---|---|---|---|---|---|---|---|
| 0.24 | 0.26 | 1.47 | 0.0084 | 0.0020 | 0.15 | 0.076 | 0.020 | 0.015 |
© 2018 by the authors. Licensee MDPI, Basel, Switzerland. This article is an open access article distributed under the terms and conditions of the Creative Commons Attribution (CC BY) license (http://creativecommons.org/licenses/by/4.0/).
Share and Cite
MDPI and ACS Style
Liu, M.; Ma, Q.-X.; Luo, J.-B. Microstructure Evolution and Flow Stress Model of a 20Mn5 Hollow Steel Ingot during Hot Compression. Materials 2018, 11, 463. https://doi.org/10.3390/ma11040463
AMA Style
Liu M, Ma Q-X, Luo J-B. Microstructure Evolution and Flow Stress Model of a 20Mn5 Hollow Steel Ingot during Hot Compression. Materials. 2018; 11(4):463. https://doi.org/10.3390/ma11040463
Chicago/Turabian StyleLiu, Min, Qing-Xian Ma, and Jian-Bin Luo. 2018. "Microstructure Evolution and Flow Stress Model of a 20Mn5 Hollow Steel Ingot during Hot Compression" Materials 11, no. 4: 463. https://doi.org/10.3390/ma11040463
Note that from the first issue of 2016, this journal uses article numbers instead of page numbers. See further details here.