Effect of Shaft Surface Roughness on the Performance of Radial Lip Seals


1
Wolfson School of Mechanical, Electrical and Manufacturing Engineering, Loughborough University, Leicestershire LE11 3TU, UK
2
Neapco Europe GmbH, 52351 Dueren, Germany
*
Author to whom correspondence should be addressed.
Lubricants 2018, 6(4), 99; https://doi.org/10.3390/lubricants6040099
Submission received: 19 July 2018
/
Revised: 6 November 2018
/
Accepted: 7 November 2018
/
Published: 13 November 2018
(This article belongs to the Special Issue Multiphysics and Multiscale Models of Tribology)
Abstract
:Reduction of leakage from the shaft–radial lip seal conjunction is critical in ensuring enduring performance of entire lubrication system. This paper investigates leakage from three types of shaft surfaces, finished using different manufacturing processes. The measurement of surface topography is conducted in order to determine the pertinent roughness parameters which correspond to the observed sealing performance in real practical applications. It is found that the skewness of the surface topography correlates well with the anecdotal leakage failure rate. To quantify this association, a hydrodynamic model, accounting for shaft roughness in a deterministic manner is developed. The results from the numerical analyses confirm that the lubricant mass flow rate is reduced in the case of negatively skewed surface height distributions, when compared with the positively skewed profiles.
1. Introduction
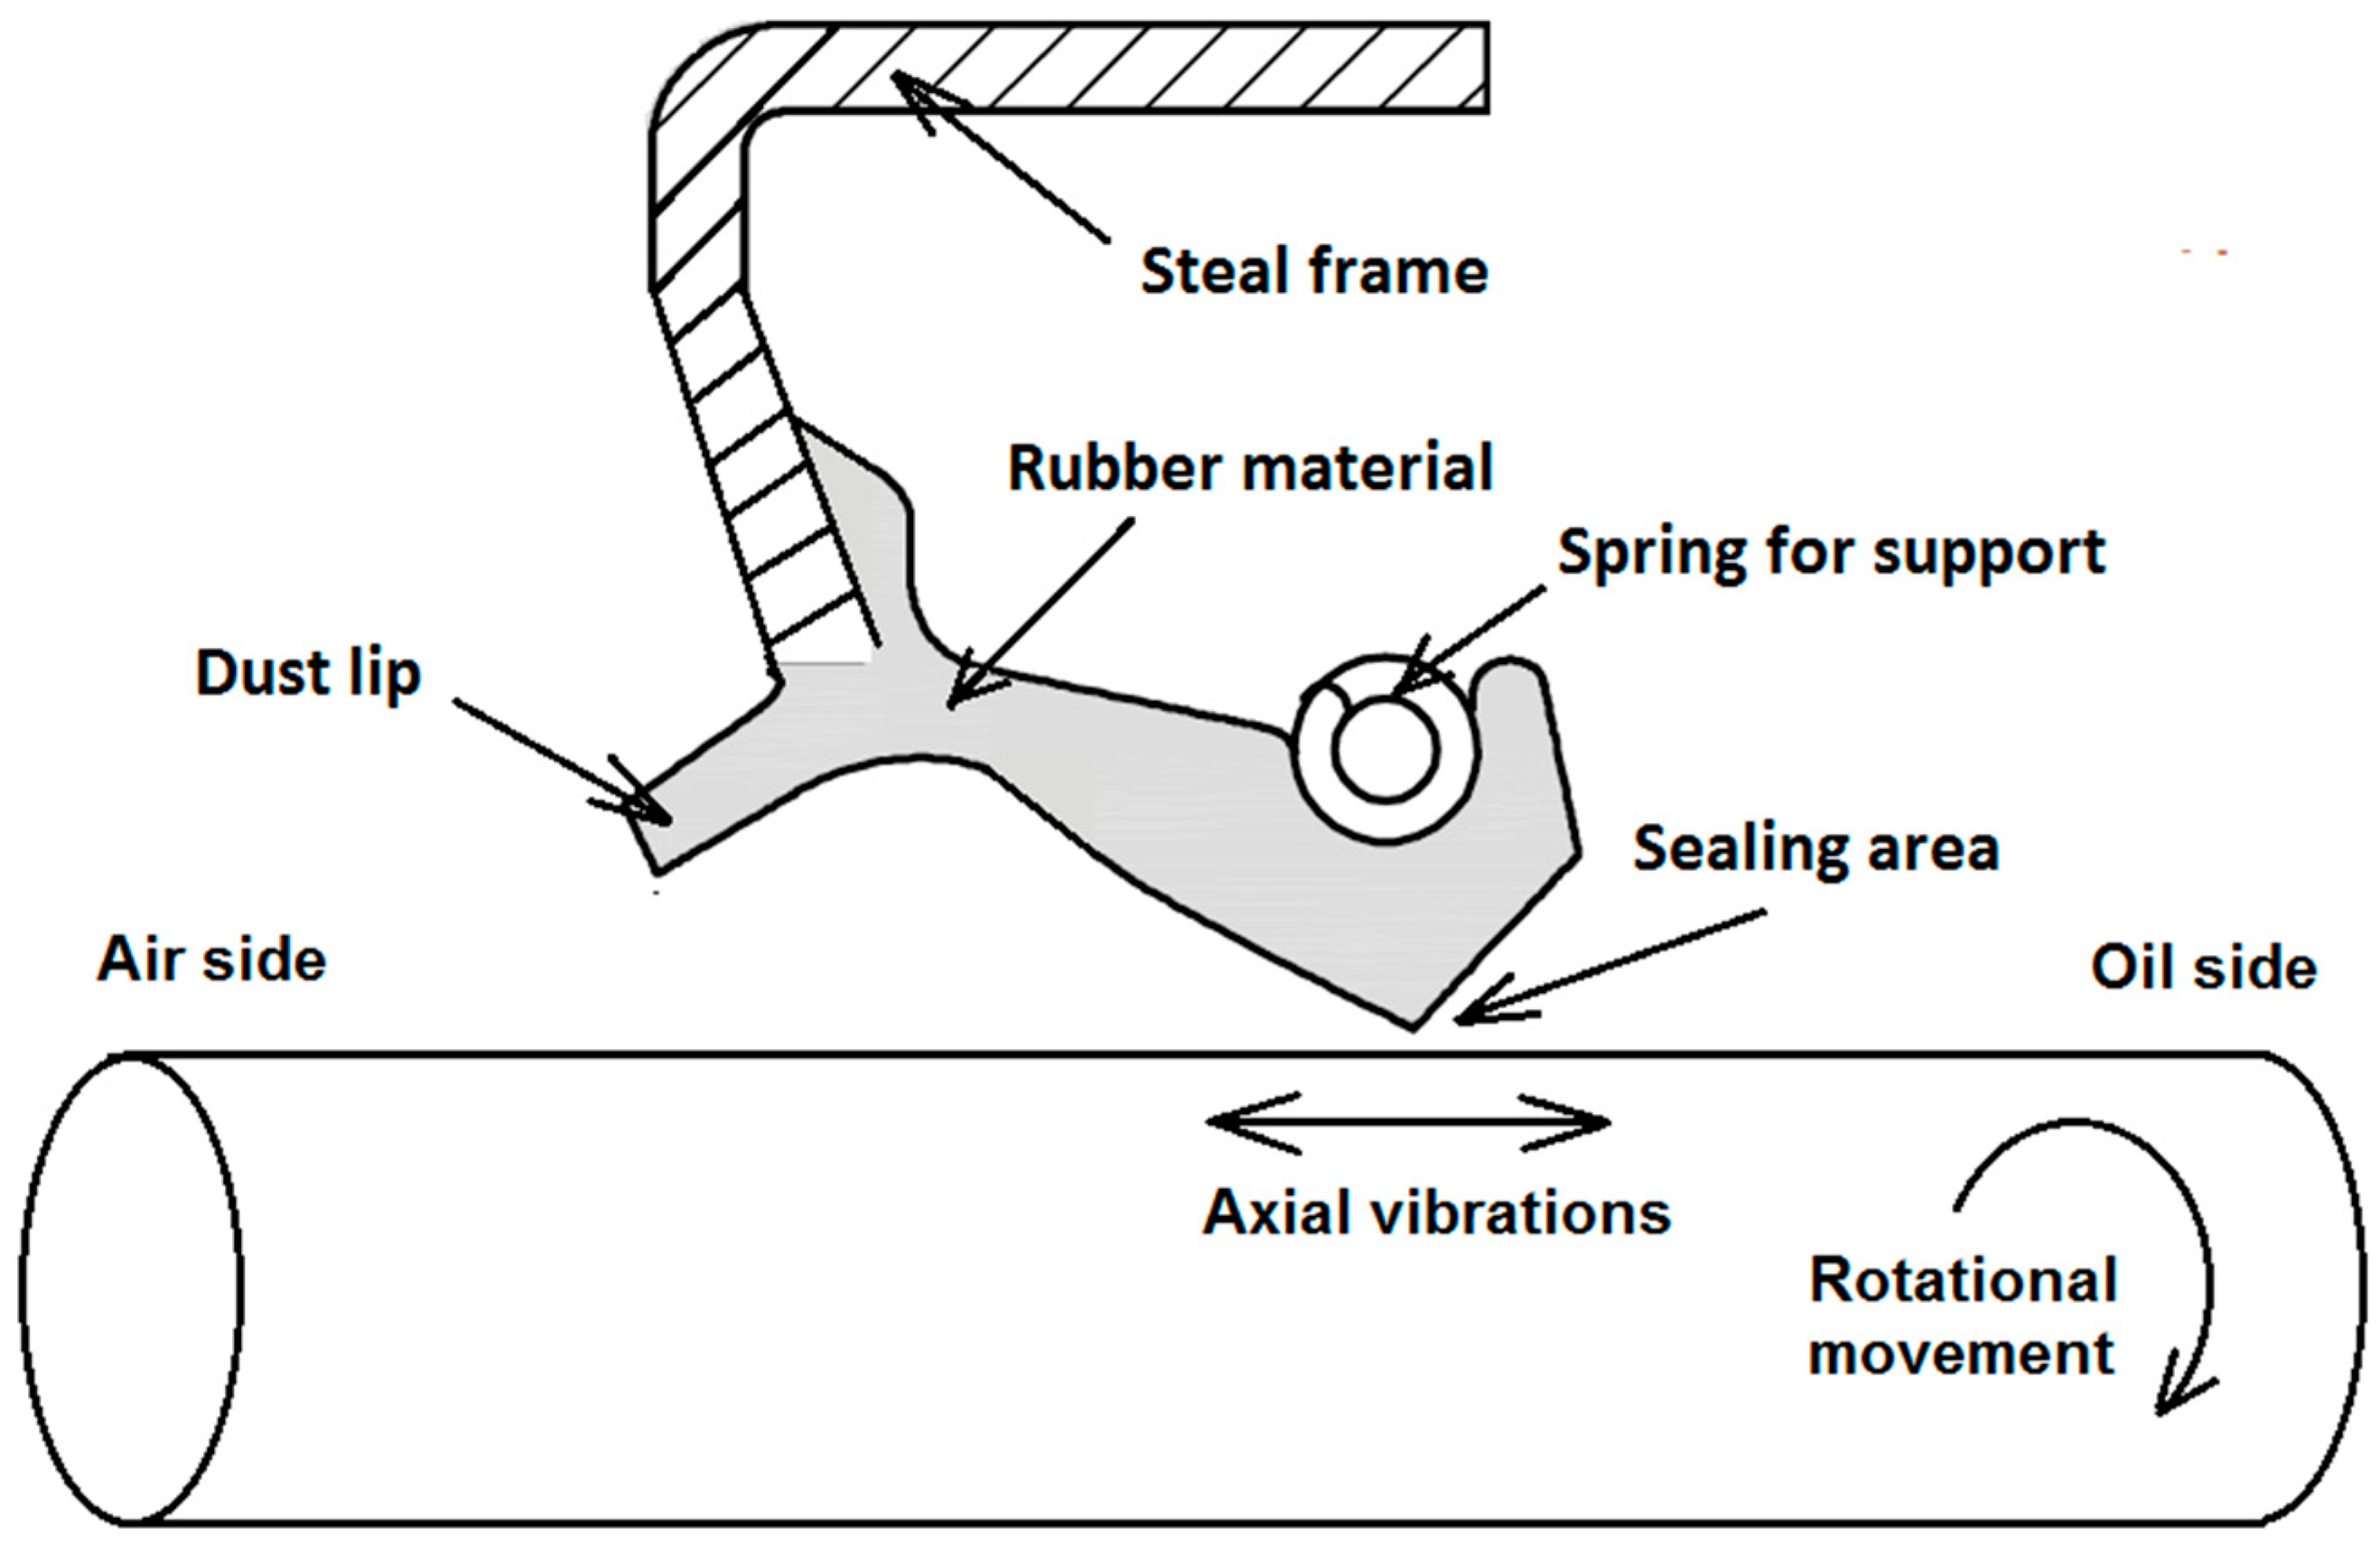
Radial lip seals are one of the most common solutions in engineering to prevent leakage between parts in relative rotary motion with low pressure differentials. As directives and legislative guidelines on emissions compound, the automotive industry is increasingly subjected to more stringent component and system efficiency without increasing associated costs. A common application of radial lip seals, employed in light passenger vehicles, is to seal the conjunction between the transaxle casing and the drive shafts. The radial lip seal typically comprises one or two elastomeric lips and a dust lip, as presented in Figure 1. The seal’s lip is pressed radially onto the rotating shaft through a combination of lip deformation and the expansion of the garter spring. The angular velocity of the shaft can be as high as 4000 rpm, whilst the pressure differential across the seal is typically in the region of 20 kPa.
A conjunctional oil film should ideally be formed to complete the seal between the contiguous surfaces in relative motion and mitigate the frictional losses. The load carrying capacity of the lubricating film has been investigated in numerous studies, forming as the result of a combination of pressure driven axial fluid flow and reverse pumping due to the variation of tangential shear of asperities across the contact’s axial width [1,2,3,4,5]. The roughness of the shaft surface is typically a fraction of the seal’s surface roughness and as elucidated by many investigators who have treated the shaft roughness as negligible. However, the work of Salant and Shen [6] has shown that the shaft roughness should not be completely ignored. This finding aligns with observation of leakage performance in some applications, where it has been frequently observed that the same seal type performance varies when paired with shafts of different surface finishes.
The importance of shaft lead has been highlighted as a significant factor in the sealing performance. Significant effort has been expended to investigate different manufacturing processes used to create the lead, as well as establishing a method for its characterisation and influence on the sealing performance [7,8,9,10,11]. The shaft lead is normally divided into two categories: the features with thread-like structures which are often periodic in form; known as macro-lead, and the directed smaller scale roughness structures with a rather random nature, which are called micro-lead [8]. Thielen et al. [10] conducted a combined experimental and numerical analysis to vary the surface micro-lead. Their investigation demonstrated that the shaft lead is critical in influencing leakage and wear performance of the shaft-seal conjunction. A numerical approach to investigate shaft lead was undertaken by Gadari et al. [11], where they isolated groove density, angle, and depth as the important parameters in determining the magnitude of oil pumping.
Macro and micro leads are not the only influential parameters of the shaft’s topography, critical to the performance of the conjunction. For adequate sealing of radial lip seals, it has been suggested, as early as the work of Jagger [12], that the shaft roughness may be an influential parameter. Official guidance for shaft surface topography can be found in ISO standards [13], where the range of maximum profile height, is set to help minimise wear and failure of the elastomeric surfaces. Some measuring devices also issue notes regarding surface topography for sealing applications, where the shaft surface recommended specifications include profile arithmetic mean height, and parameters [14].
An elastohydrodynamic investigation of the amplitude of analytically generated surfaces was presented by Gadari et al. [15]. The authors suggest that for shaft roughness exceeding half the lip roughness, there would be an increased likelihood of leakage. Shulz et al. [16] claimed that roughness specifications are assigned for particular manufacturing processes and cannot be applied to other surface finishing techniques, because of differences in topographies. They compared the performance of seven shafts, two of which were super-finished and five others were ground (each with a unique process). The authors noted that as the roughness is reduced to a critical value, friction and wear also decrease. Any further reduction in mean roughness would then cause increased friction and wear, presumably due to adhesion. Similar results were also obtained by Jung and Haas [17]. They inferred that the magnitude of average surface roughness helps to determine the regime of lubrication in the conjunction.
Many studies have attempted to create micro-textured surfaces to enhance sealing performance, for example, texturing the surfaces with pores for improving of sealing performance in water pumps by Etsion et al. [18]. In wider literature, the key surface topographical parameters found to determine contact performance, in terms of friction and wear of non-Gaussian surfaces, are skewness and kurtosis [19,20]. Sedlacek et al. [19] showed, using pin-on-disc measurements that negatively skewed characteristics incur reduced friction in boundary regime of lubrication, but mixed and full hydrodynamic conditions were not studied. In the case of experiments using slider bearings, carried out by Andharia et al. [20], surfaces with positive skewness were found to lower tribological performance, while negatively skewed surfaces improved it.
The shaft–lip seal conjunction is clearly quite complex in nature. While a significant volume of research has been conducted, much of it has focused on the role of rougher seal surface topography and shaft micro/macro lead. The current paper investigates the three different shaft surface finishes created through different manufacturing operations. The primary difference between the shafts is their surface roughness. The key roughness parameters that differentiate their performance in application are highlighted. The implied relationship between roughness parameters and anecdotal evidence is then confirmed through use of a numerical hydrodynamic model. The emphasis is on comparative studies of shafts with different surface topographies. Therefore, basic numerical analysis is carried out, which clearly embodies certain simplifying assumptions such as isothermal conditions and disregarding the effect of thermoelastic deformations.
2. Shaft Surface Roughness
2.1. Measurements of Topography
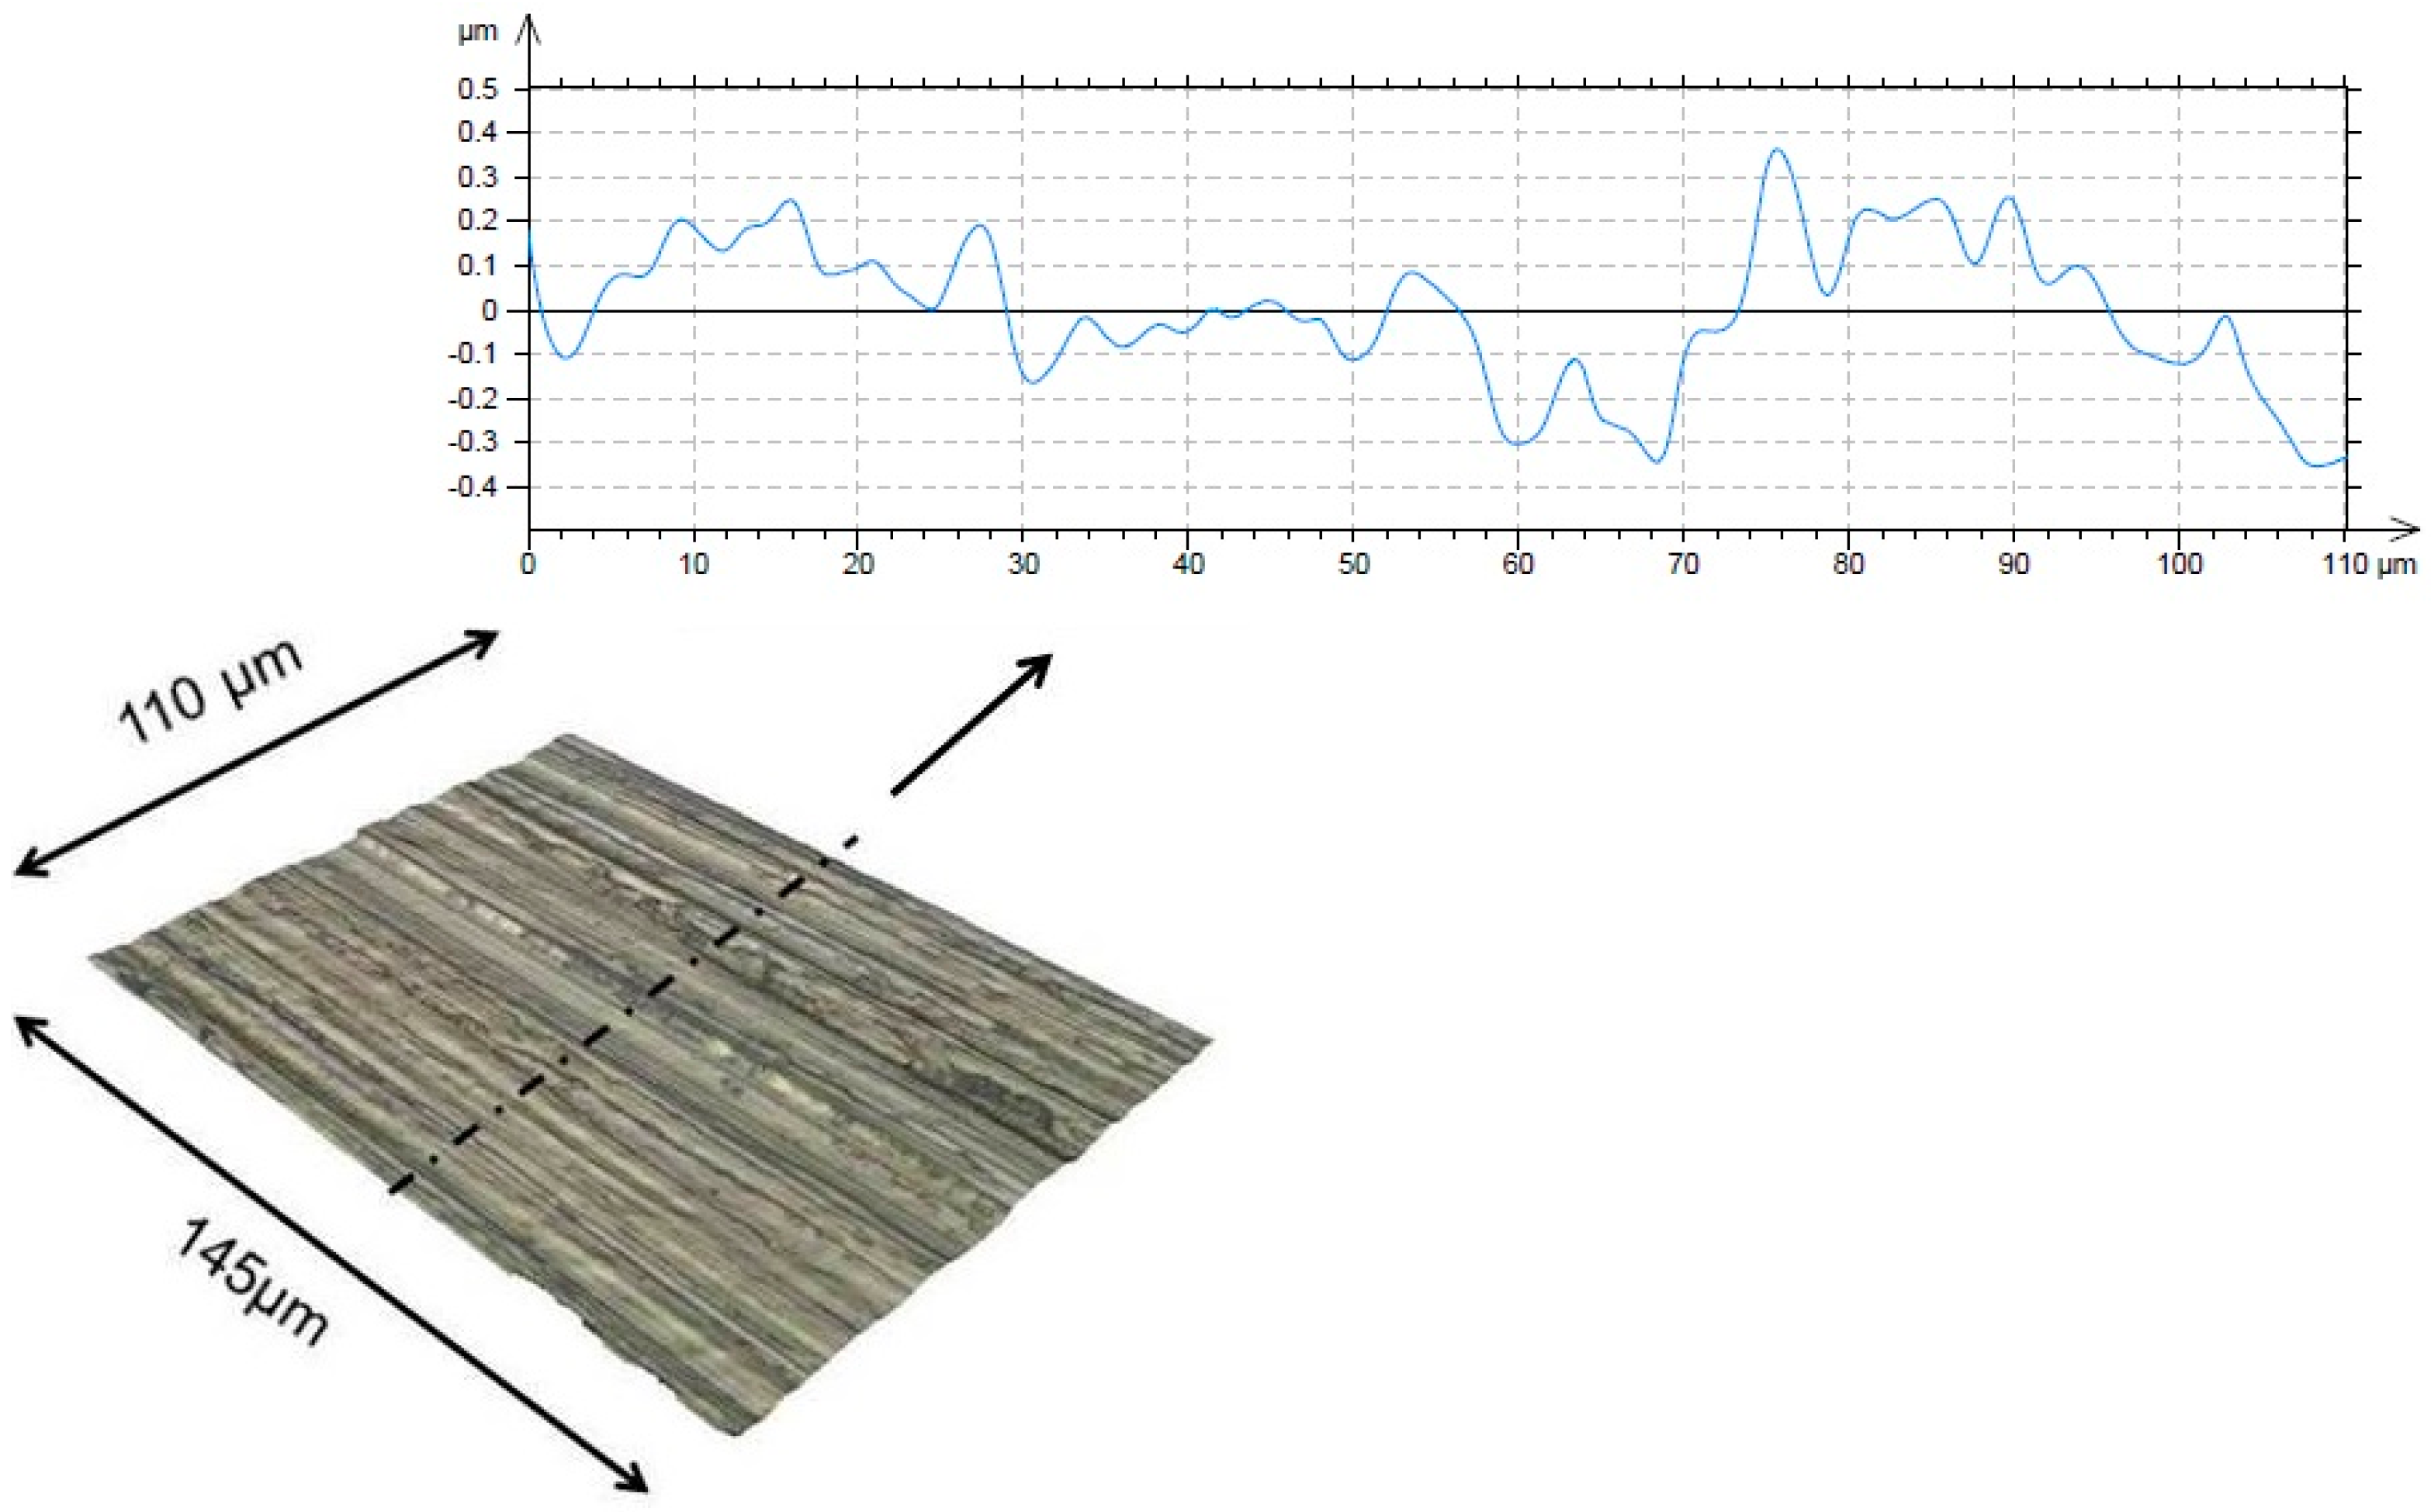
Shafts are manufactured by three different grinding and polishing processes. These are the corundum grinding for Shaft A, superfinishing for Shaft B and cubic boron nitride grinding for Shaft C. These are analysed to compare their surface roughness characteristics. Surface topographic measurements were performed using the Alicona Infinite Focus interferometer through taking 15 samples from seal bedding area of each shaft. The magnification lens was chosen, based on the predicted nominal sealing area as well as to account for any manufacturing characteristic lines observed on the investigated surfaces. The amplitude of waviness is around 1 to 2 μm. Therefore, the analysis of surface topography is based on the effect of both roughness and waviness features. Thus, the analysed contact incorporates a combination of roughness features at different length scales through a deterministic approach. During post-processing, the parabolic form related to shaft curvature was removed. An example of a surface measured with ×100 magnification lens is shown in Figure 2. The measurement resolution is 20 nm in the vertical direction and 1 μm in lateral directions tangential to the surface. Post-processing of the images is conducted using the Taylor and Hobson TalyMap 5.0 Platinum software (Leicester, UK).
2.2. Comparison of Measured Roughness Data
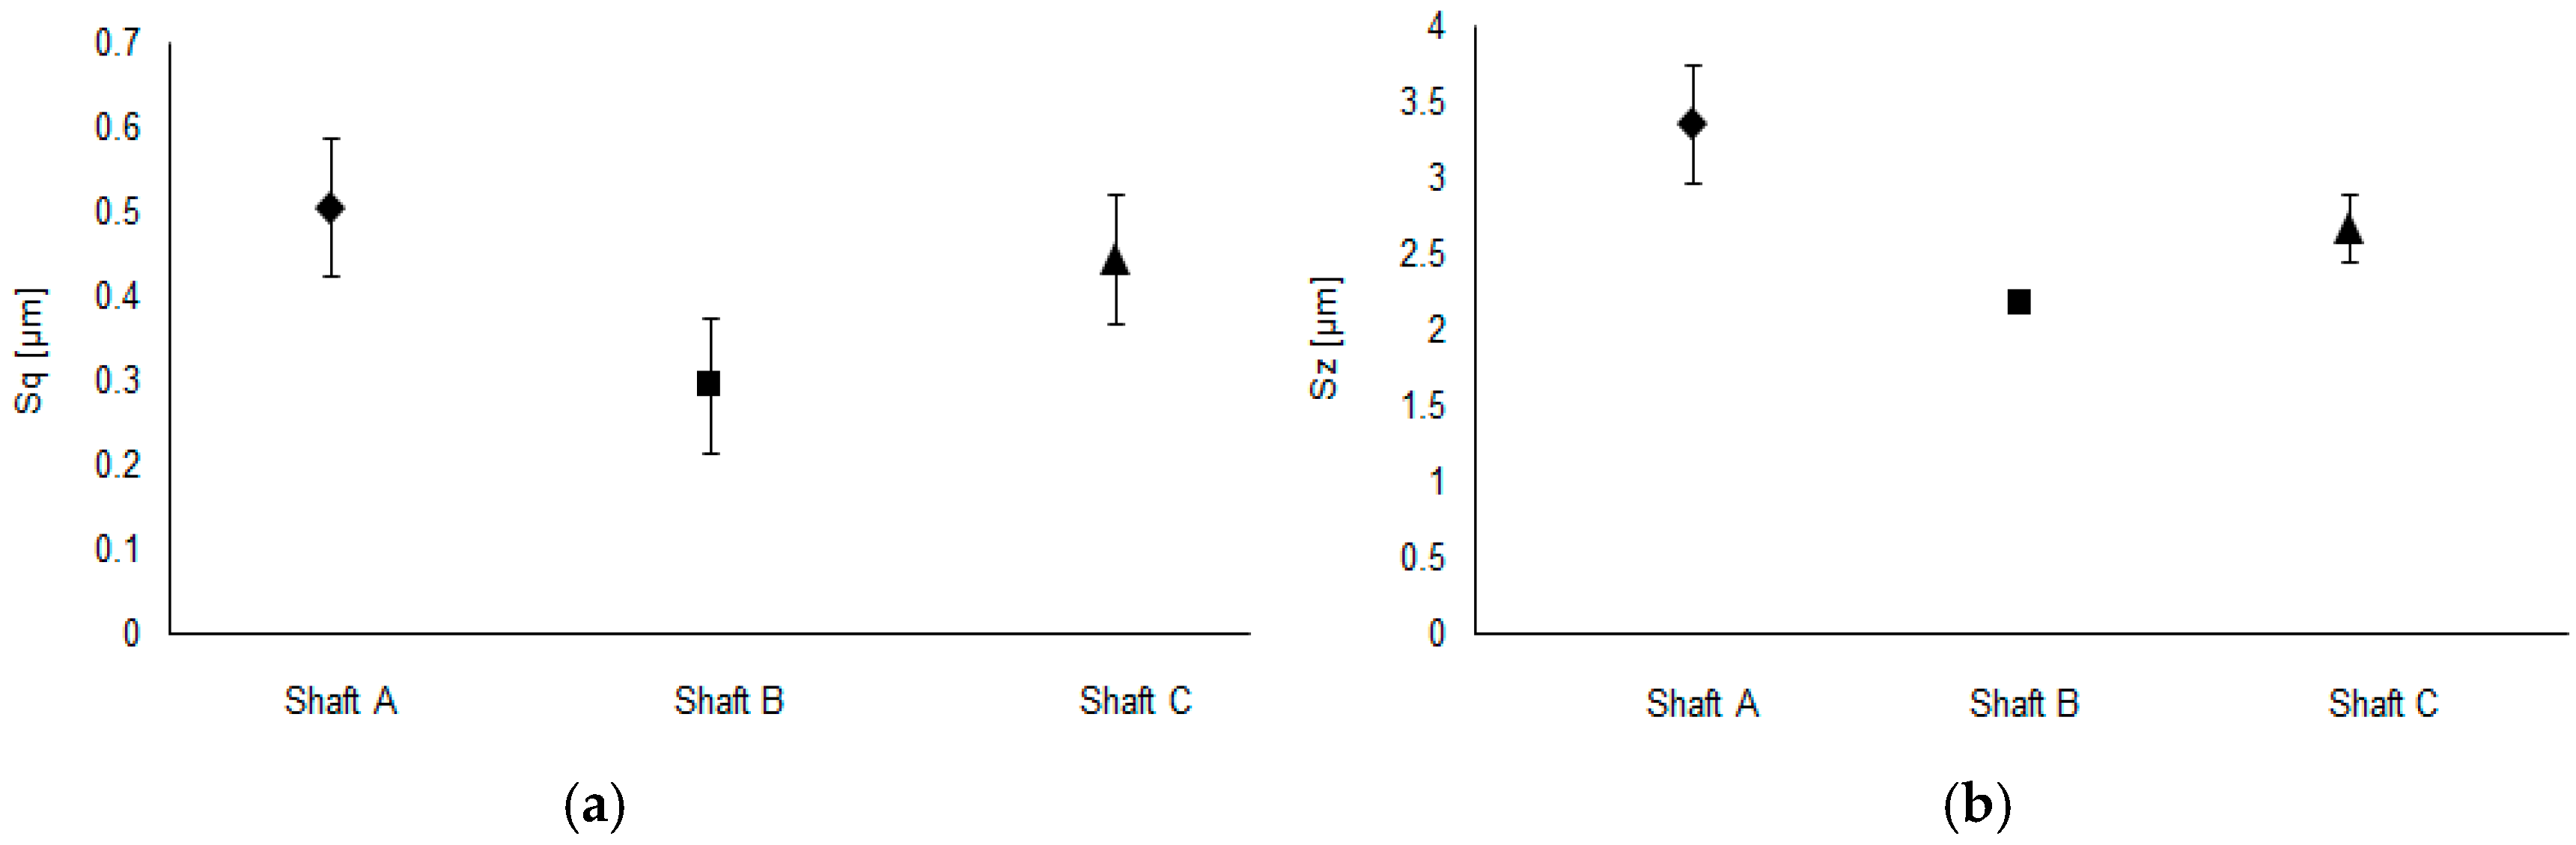
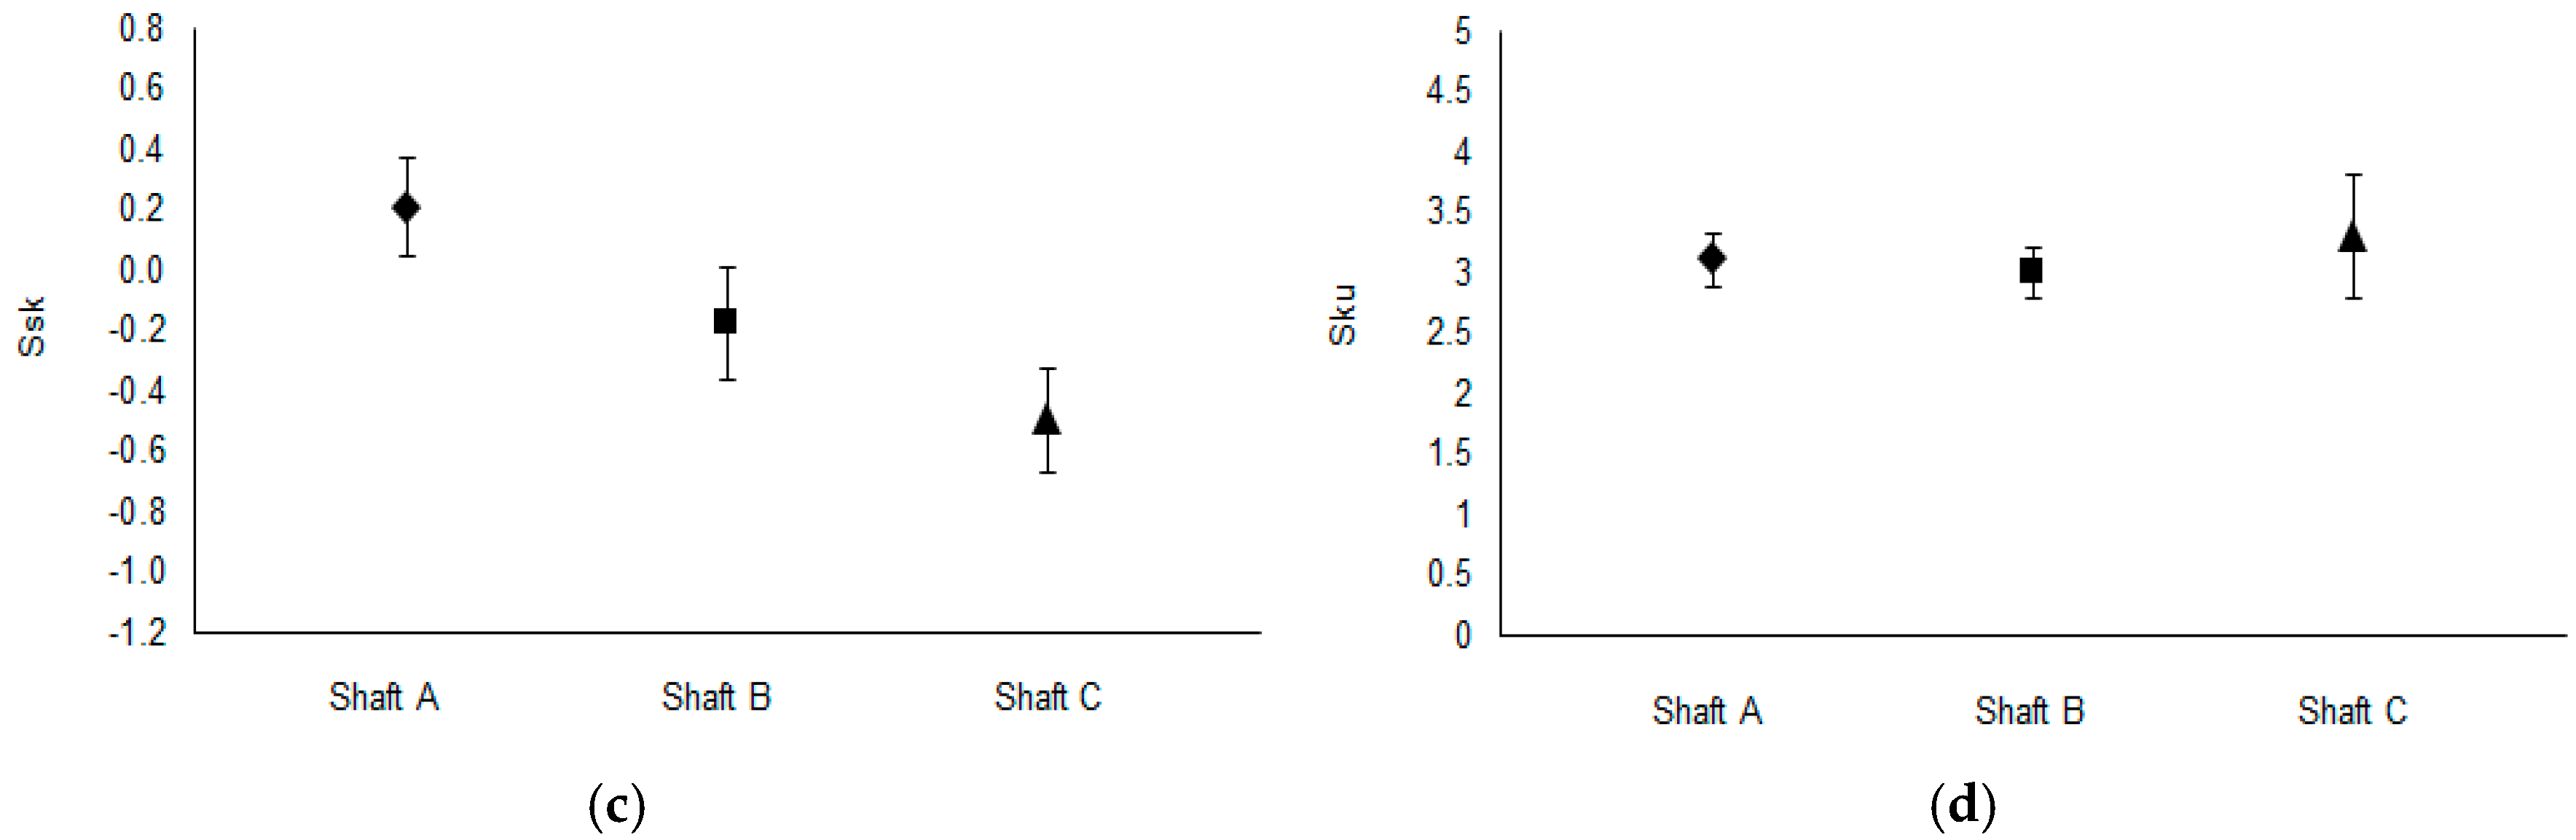
Figure 3 presents a comparison of some of the most commonly used topographical parameters based on measurements taken from the three different shafts. 2D profiles in the axial direction were extracted from the 3D samples and their 2D surface roughness equivalents obtained and presented in Figure 4. It is common practice in industry to consider some roughness parameters—in particular surface arithmetic mean height, , and surface maximum height, Rz—as the main parameters considered when characterising the quality of a products surface finish. Nevertheless, these only provide limited information about the real characteristics of a surface. For instance, these parameters are insufficient for providing any information about the height distribution, which has been shown to be significant, particularly when estimating the number of direct contact patches as well as the effective contact area [21]. Here, the two main parameters used to specify the distribution of the surface roughness features are skewness and kurtosis. Due to high directionality of the surface topography, resulting from the nature of the manufacturing process used, 2D profiles accurately express major topography differences between the shafts as the comparison of the results in Figure 3 and Figure 4 indicate.
The in situ vehicle tests carried out on lip seal conjunctions have shown that Shaft A produces significant leakage (leading to eventual failure), whilst shaft B shows less leakage, and no failure is reported from the vehicles equipped with shaft C. Through a comparison of the results presented in Figure 3, it can be seen that there is a noticeable trend in the variation of the skewness, , measured from the three shaft types, while the data from the other parameters including , and kurtosis, , amongst many other parameters investigated (although not listed in the current work) do not show a particular trend. Shaft A, which incurs the highest leakage rate also has an average positive skewness, whilst the average skewness has a negative value for the shafts with reduced leakage. A similar trend is observed for profiles in Figure 4. As the result of the overlap between the standard distributions shown in Figure 3c and Figure 4c, it is essential to investigate the confidence level in the results. Therefore, the skewness results were investigated further using a t-test to determine the confidence level in rejecting null hypothesis: . There was a significant difference between surface measurements from Shaft A (mean = 0.20422, standard deviation = 0.3224) and Shaft C (mean = −0.4982, standard deviation = 0.3486) with the results: t(28) = 5.54 and p = 6.57 × 10⁻⁶, where 28 is the number of degrees of freedom and p is the probability. Similarly, the profile measurements show a significant level of confidence in the difference, with: t(28) = 3.96 and p = 4.63 × 10⁻⁴.
Skewness is a measure of the asymmetry of a surface height distribution. Measurements over a scanned line can be mathematically described as
where, is the root mean square of asperity heights, is the length of the scanned profile, and corresponds to the total gap between the counter surfaces. Hence, a positive value for skewness is an indication of the dominance of the peaks in the measured profile, whilst a negative value indicates the dominance of the valleys in the measured profile. All measurements were also repeated using a white light interferometer, as well as the aforementioned infinite focus variation microscopy, showing a similar trend in the skewness.
3. Numerical Model
To gain a fundamental understanding of the underlying phenomenon of seal leakage, influenced by surface topography, a numerical hydrodynamic lubrication model is developed. The contact of radial lip seals is normally modelled using Reynolds hydrodynamic equation [22,23,24]. Patir and Cheng [25] developed a modified version of Reynolds equation which takes into account the effect of surface roughness on the flow of lubricant through the rough contact conjunction. This model was further enhanced by Lo [26] and in this form is widely used for the study of seals [2,3,4,5,27,28]. However, in such studies, the flow factors are developed based on the roughness features of the seal surface as these are usually significantly higher than that of the counter face surface. Additionally, the flow factor approach does not take into account parameters such as skewness (recall that surface skewness is considered to offer a good indication of propensity to leak) directly as an input nor the method allows for combining the roughness parameters of two different counter face surface materials (i.e., shaft as elastic and seal as a viscoelastic material). Furthermore, for surfaces with non-Gaussian roughness distribution, it is essential to obtain surface-specific flow factors such as those reported by Leighton et al. [29]. Therefore, to avoid the associated complications, a deterministic model to take into account the shaft roughness in the form of raw measurements was developed, as this would be expected to suitably reflect upon the in situ conditions. To avoid the complication of adding the seal roughness, it seems reasonable to ignore the seal roughness effect, thus treating this counter face surface as smooth. This is reasonable, particularly that the aim here is not to obtain absolute values of leakage but to provide a comparative study based on the different shafts’ topographies.
A radial lip seal contact generally operates under mixed regime of lubrication [5,30], in line with the aim of this investigation. In order to isolate the effect of surface roughness characteristics on the hydrodynamics conditions, a model, based on Reynolds equation is developed to investigate the effect of shaft topographical skewness upon the generated pressure distribution within the contact area as a measure of load carrying capacity. This approach helps to predict leakage of lubricant from the contact. Full separation between surfaces is assumed (i.e., no contacting asperities on opposing contacting surfaces; an assumed hydrodynamic regime of lubrication, here ). Therefore, the seal roughness effect on the flow through reverse pumping effects, caused by the seal’s asperities, is neglected. To distinguish between leakage due to manufactured shaft lead and the effect of skewed surface topography, only 1D profiles extracted from the shaft surface in the axial direction are taken into account. This allows comparison of fluid film formation and generated pressure distribution for different skewed topographies under identical loading. This approach ignores the potential effect of lead grooves, creating paths between the asperities for the flow to leak from the contact. The profiles extracted from different shafts and used in numerical analysis were chosen to clearly distinguish between positive and negative skewness, whilst maintaining other roughness parameters at a comparable level.
3.1. Governing Equations and Assumptions
The numerical model is based on Reynolds equation, which accurately approximates the more generic Navier–Stokes equations for flow within thin fluid films. In a 1D form, it becomes
where, and are lubricant rheological properties; density and viscosity, is the generated hydrodynamic contact pressure and is the gap (film thickness) between the two contiguous surfaces.
The equation above is for the axial cross-section of the seal-shaft contact conjunction. Therefore, velocity, is the speed of the contacting surfaces in the axial direction; mainly induced through axial vibrations in a real vehicle drivetrain system. The velocity in real application is expected to fluctuate. Therefore, in order to fully predict total leakage variation with sliding velocity, one would need to add transient effects in the governing equation. However, the transient effects deemed to exist in all the studied surface topographic cases. Therefore, a constant value of is applied to indicate the possible leakage rate at the onset of axial movement.
Although lubricant density and viscosity can vary with pressure, typical pressures experienced by the lubricant in the case of radial lip seals are usually sufficiently low as not to alter these bulk rheological properties in any significant manner (thus isoviscous conditions can be assumed). It must be noted that the wettability of the surfaces by the lubricant, particularly at relatively low pressures and with thermal effects can potentially play an important role in sealing performance, which is not investigated in the current analysis.
In the current study, it is also assumed that the squeeze film effects due to radial vibrations of the shaft and seal is negligible. However, this can be an important parameter in practice as it enables a transient analysis to be carried out, which is appropriate in real situations. In addition, the effect of temperature rise in the contact due to generated friction and its influence upon the lubricant rheological state as well as the thermal expansion of the components are of practical significance. Nevertheless, for the current case where the focus is on isolating the effect of surface topographical features and the relevant comparison of the leakage from the contact solely due to the shaft roughness, these parameters are deemed not to alter the relative performance comparisons between shafts of different topography. A more thorough investigation needs to also include the effect of any thermo-elastic distortion, experienced in the contact.
Considering the relatively low generated pressures in the radial seal contacts, and also neglecting the thermo-viscous effects in line with the purpose of the current investigation (for the steady-state incompressible and iso-viscous fluid flow), Reynolds equation takes the form
To solve this equation the pressure at the boundaries needs to be specified (i.e., boundary conditions). The pressure at the inlet would be the pressure experienced by the lubricant in the transmission housing; . On the opposite side, the contact is exposed to ambient pressure and hence, the pressure at the exit boundary is considered to be atmospheric; . It is well known that the contacts in the lubricated bearings and seals may be potentially subject to cavitation at any geometrically divergent gap in the contact. At the point of lubricant film rupture, leading to the inception of cavitation, it is customary to use the Swift–Stieber or Reynolds boundary conditions [22], which state that the pressure and its gradient must diminish at the point of film rupture. To accommodate the effect of cavitation in the numerical solution, at each step of iteration to determine new generated pressure, any nodal pressures lower than the stated cavitation pressure is set to the cavitation pressure (in this case set to the atmospheric pressure of 101,325 Pa). It is shown by Christopherson [31] that implementing this condition at each pressure iteration step would set the pressure gradient to zero in the numerical computations as well.
3.2. Specifying Contact Profile
The shaft profile along each axial direction was measured using the focus variation method with white light interferometry as described in Section 2.1. For the purpose of computations, the measured profiles were approximated using Fourier series, after performing Fast Fourier Transformation (FFT) on the measured profiles. The approximated axial profile of the shaft in the seal bedding area is, therefore, given as
where, indicates the shaft axial direction. The number of harmonic components was selected in such a way that the reproduced profile matches the original measured points within 99% accuracy; calculated as
where, is the number of points measured, is the profile height obtained after FFT approximation, is the corresponding measured height and is the mean height. The difference between amplitude of roughness from to is observed to reach up to two orders of magnitude.
Once the shaft profile was approximated, then the total gap at any location is obtained as
where, is the nominal gap between the two surfaces. To find the nominal gap a load balance equilibrium condition should be satisfied as described below.
3.3. Load Balance
An initial guess is made for the nominal film thickness or gap and Reynolds equation is solved numerically. The load applied is obtained as shown in Equation (7). The gap is adjusted in order to allow the formation of a fluid film to flood all the asperities in all the cases considered. This corresponds to a film thickness of around 4 to 5 times the measured value, resulting in a Stribeck oil film ratio of .
The hydrodynamic load in the contact is calculated through integration of the generated pressure distribution as
where, is the diameter of the shaft.
3.4. Method of Solution
Grid independency analysis was carried out to eliminate the possible influence of grid density on the results. Considering the boundary conditions and the problem formulation, the central finite difference method (CFDM) was chosen to discretise Reynolds equation. Point successive over-relaxation (PSOR) Gauss-Seidel method [32] was used to obtain the nodal pressure values in an iterative manner as
where, is the distance between the nodal points and is the (over)-relaxation factor. The superscript refers to the iteration step. In addition, the coefficients A, B, and C are given as
An over-relaxation factor of was chosen, which rendered faster computations without any premature convergence. The error in the computation of nodal pressures is calculated by [33]:
The convergence criterion for the generated pressures has a limit of: .
Once the pressures are deemed as converged, the contact load carrying capacity is obtained, using Equation (7). The load carried must equate the applied load if the initially guessed nominal film thickness was correct. Otherwise, a new nominal film thickness is obtained as [33]
where, the superscript refers to the load iteration step and is an adjusting parameter, typically chosen to be around 0.01. The computations continue until the difference in the calculated and applied loads diminish [33]:
where, the convergence criterion for the load loop is set to: .
3.5. Leakage Form the Seal Contact
The lubricant mass flow rate is calculated, based upon the calculated pressure gradient in the contact with the contribution of Couette shear flow [34], thus
where, is the velocity and is the diameter of the shaft.
3.6. Friction and Power Loss
The difference in surface topography can also potentially affect the generated friction. The viscous friction in the contact is obtained by integration of generated viscous shear as [34]
Subsequently, the power loss becomes
4. Results and Discussion
Table 1 provides a list of input data which are used in the current study. The observed vibrations in the axial direction, measured in drive-tests using a passenger vehicle shows that maximum displacement of the shaft, and hence the contact, can be as much as 2 mm with the frequency of vibrations varying in the range: 100–5000 Hz according to the selected gear and engine speed [35]. Therefore, the use of 1 m/s sliding speed is justified.
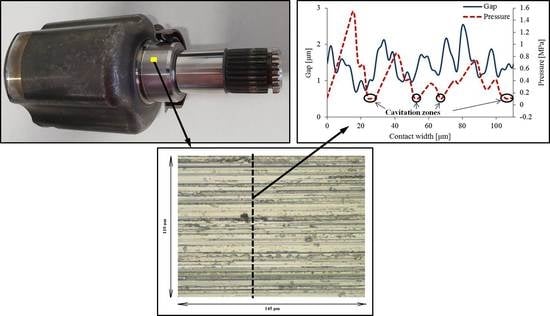
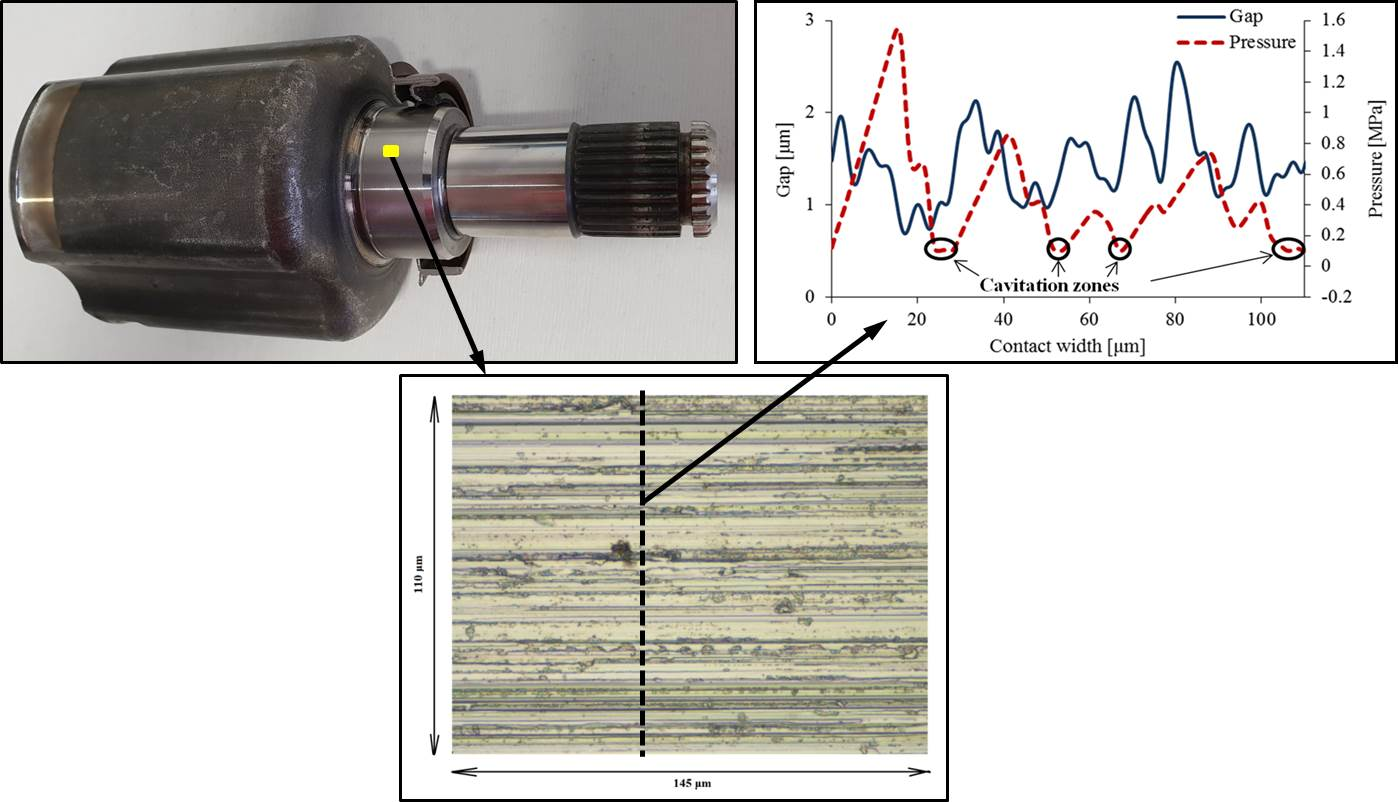
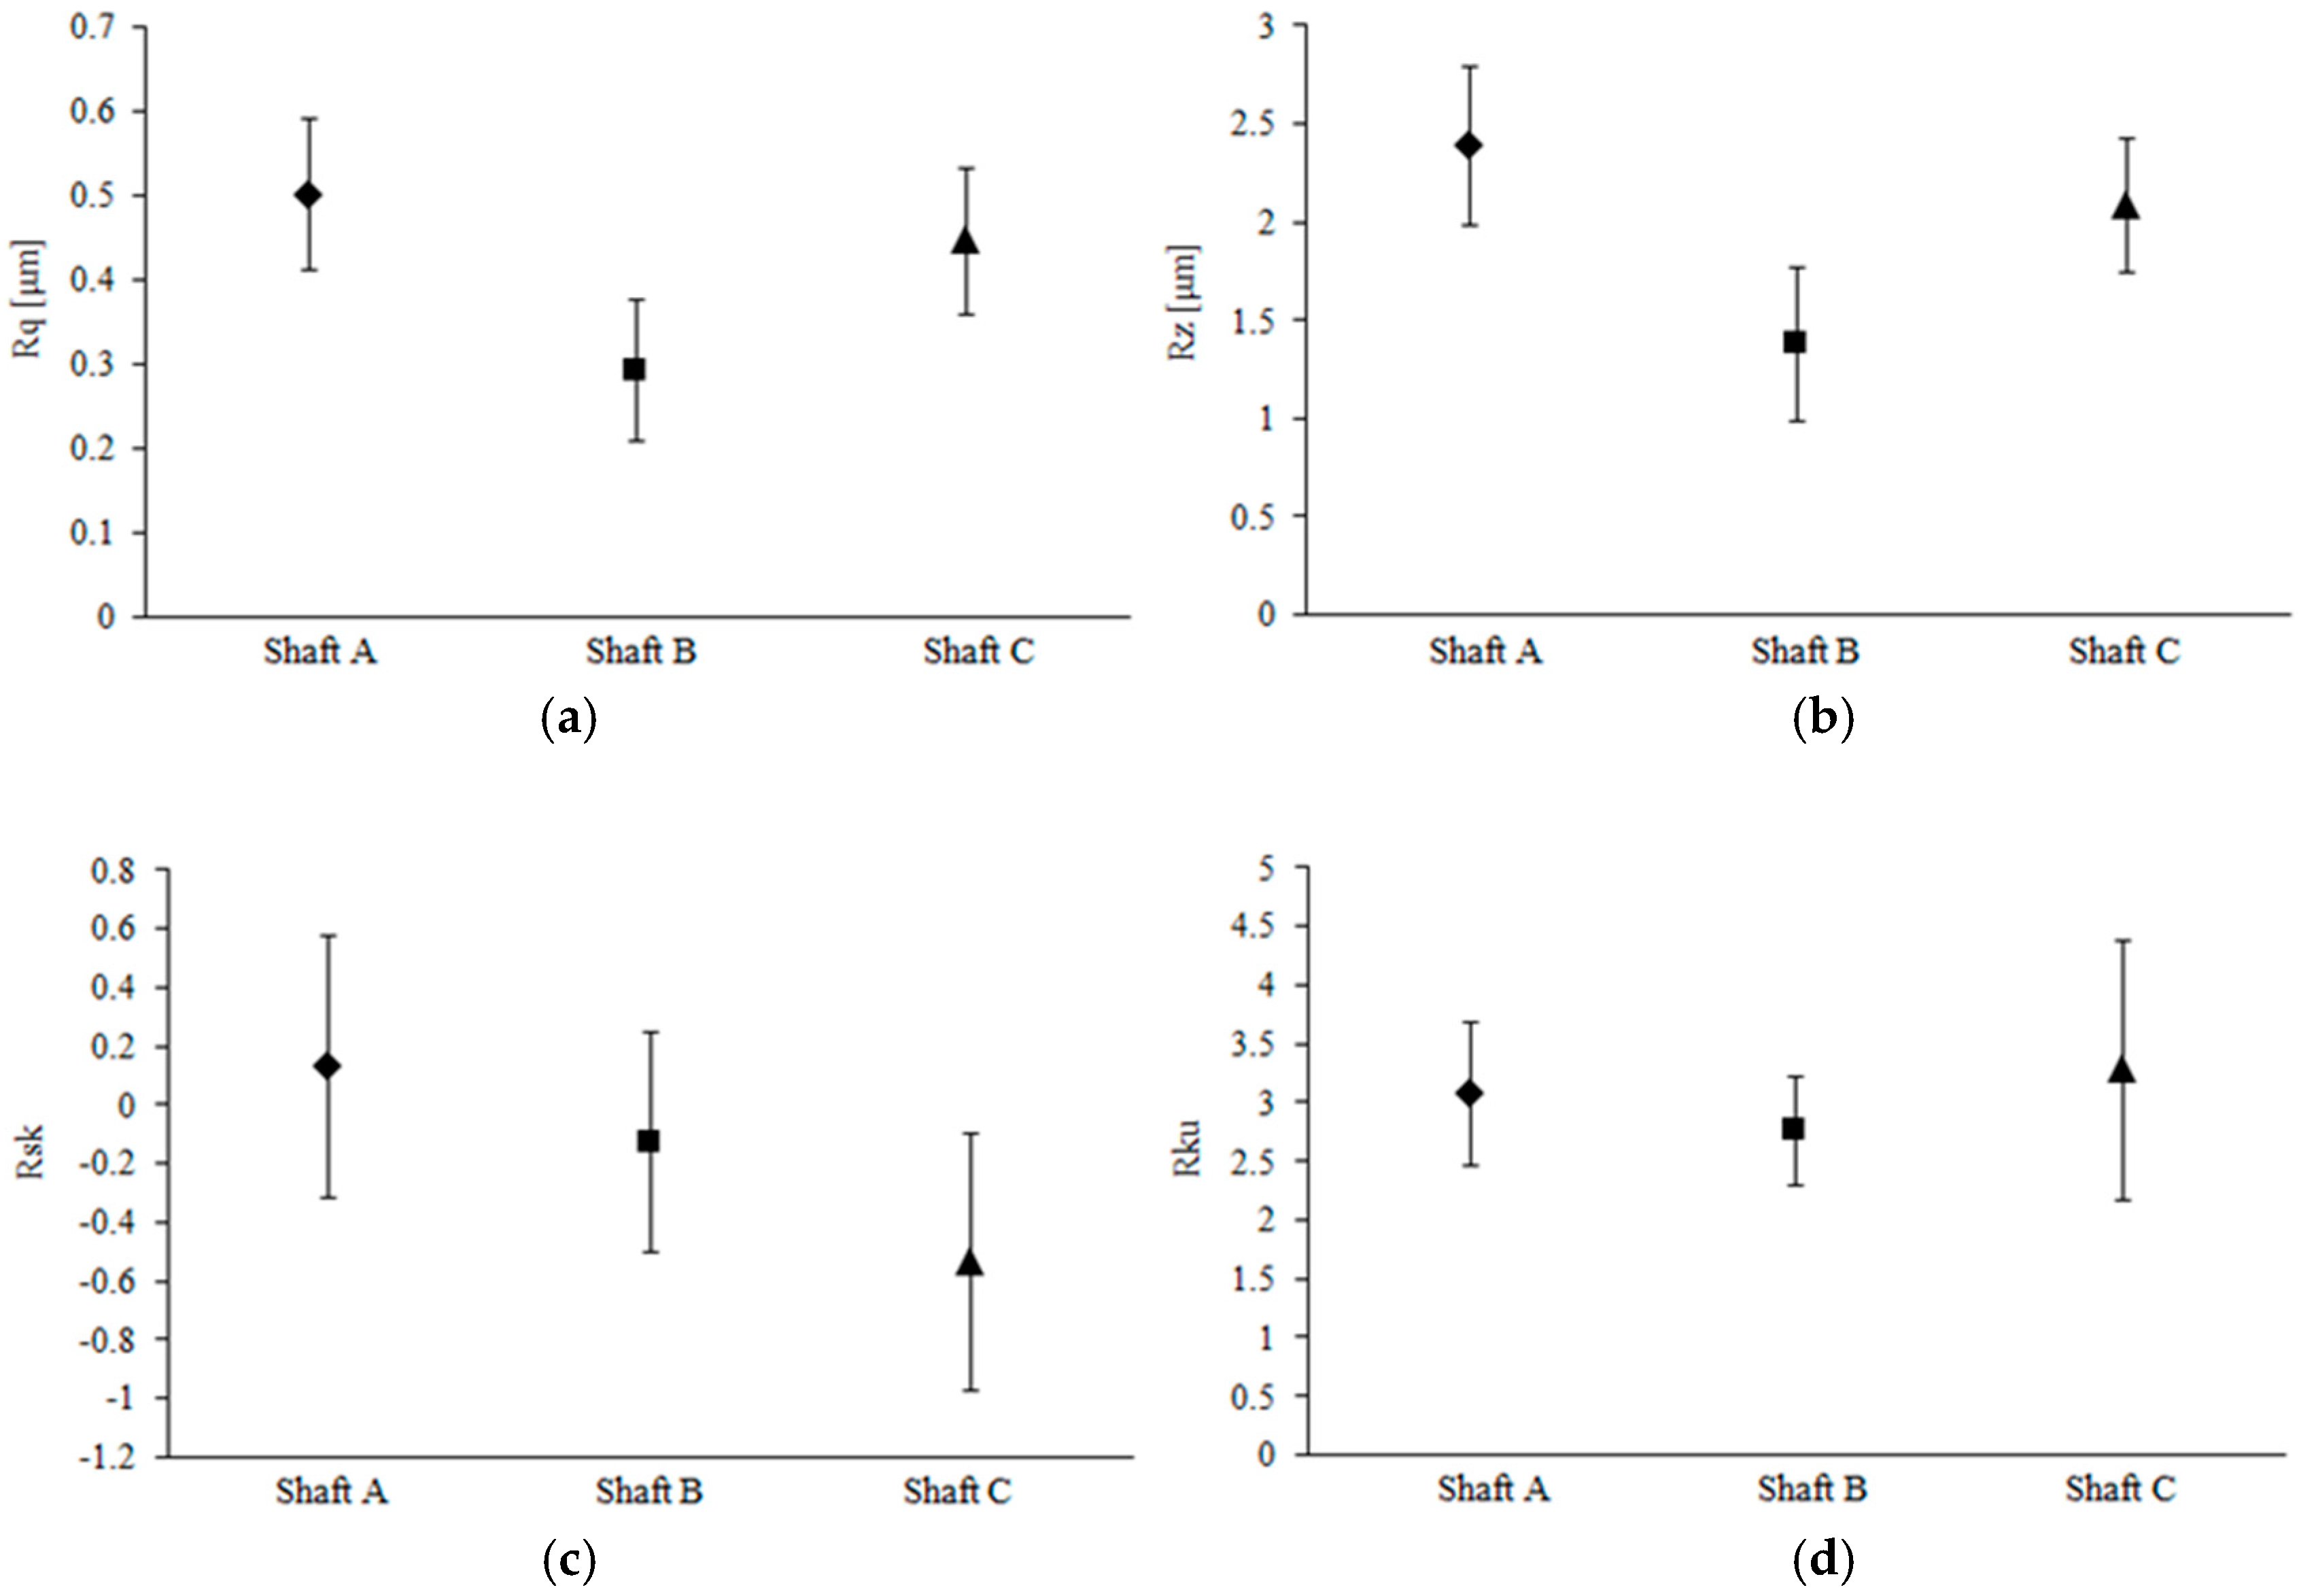
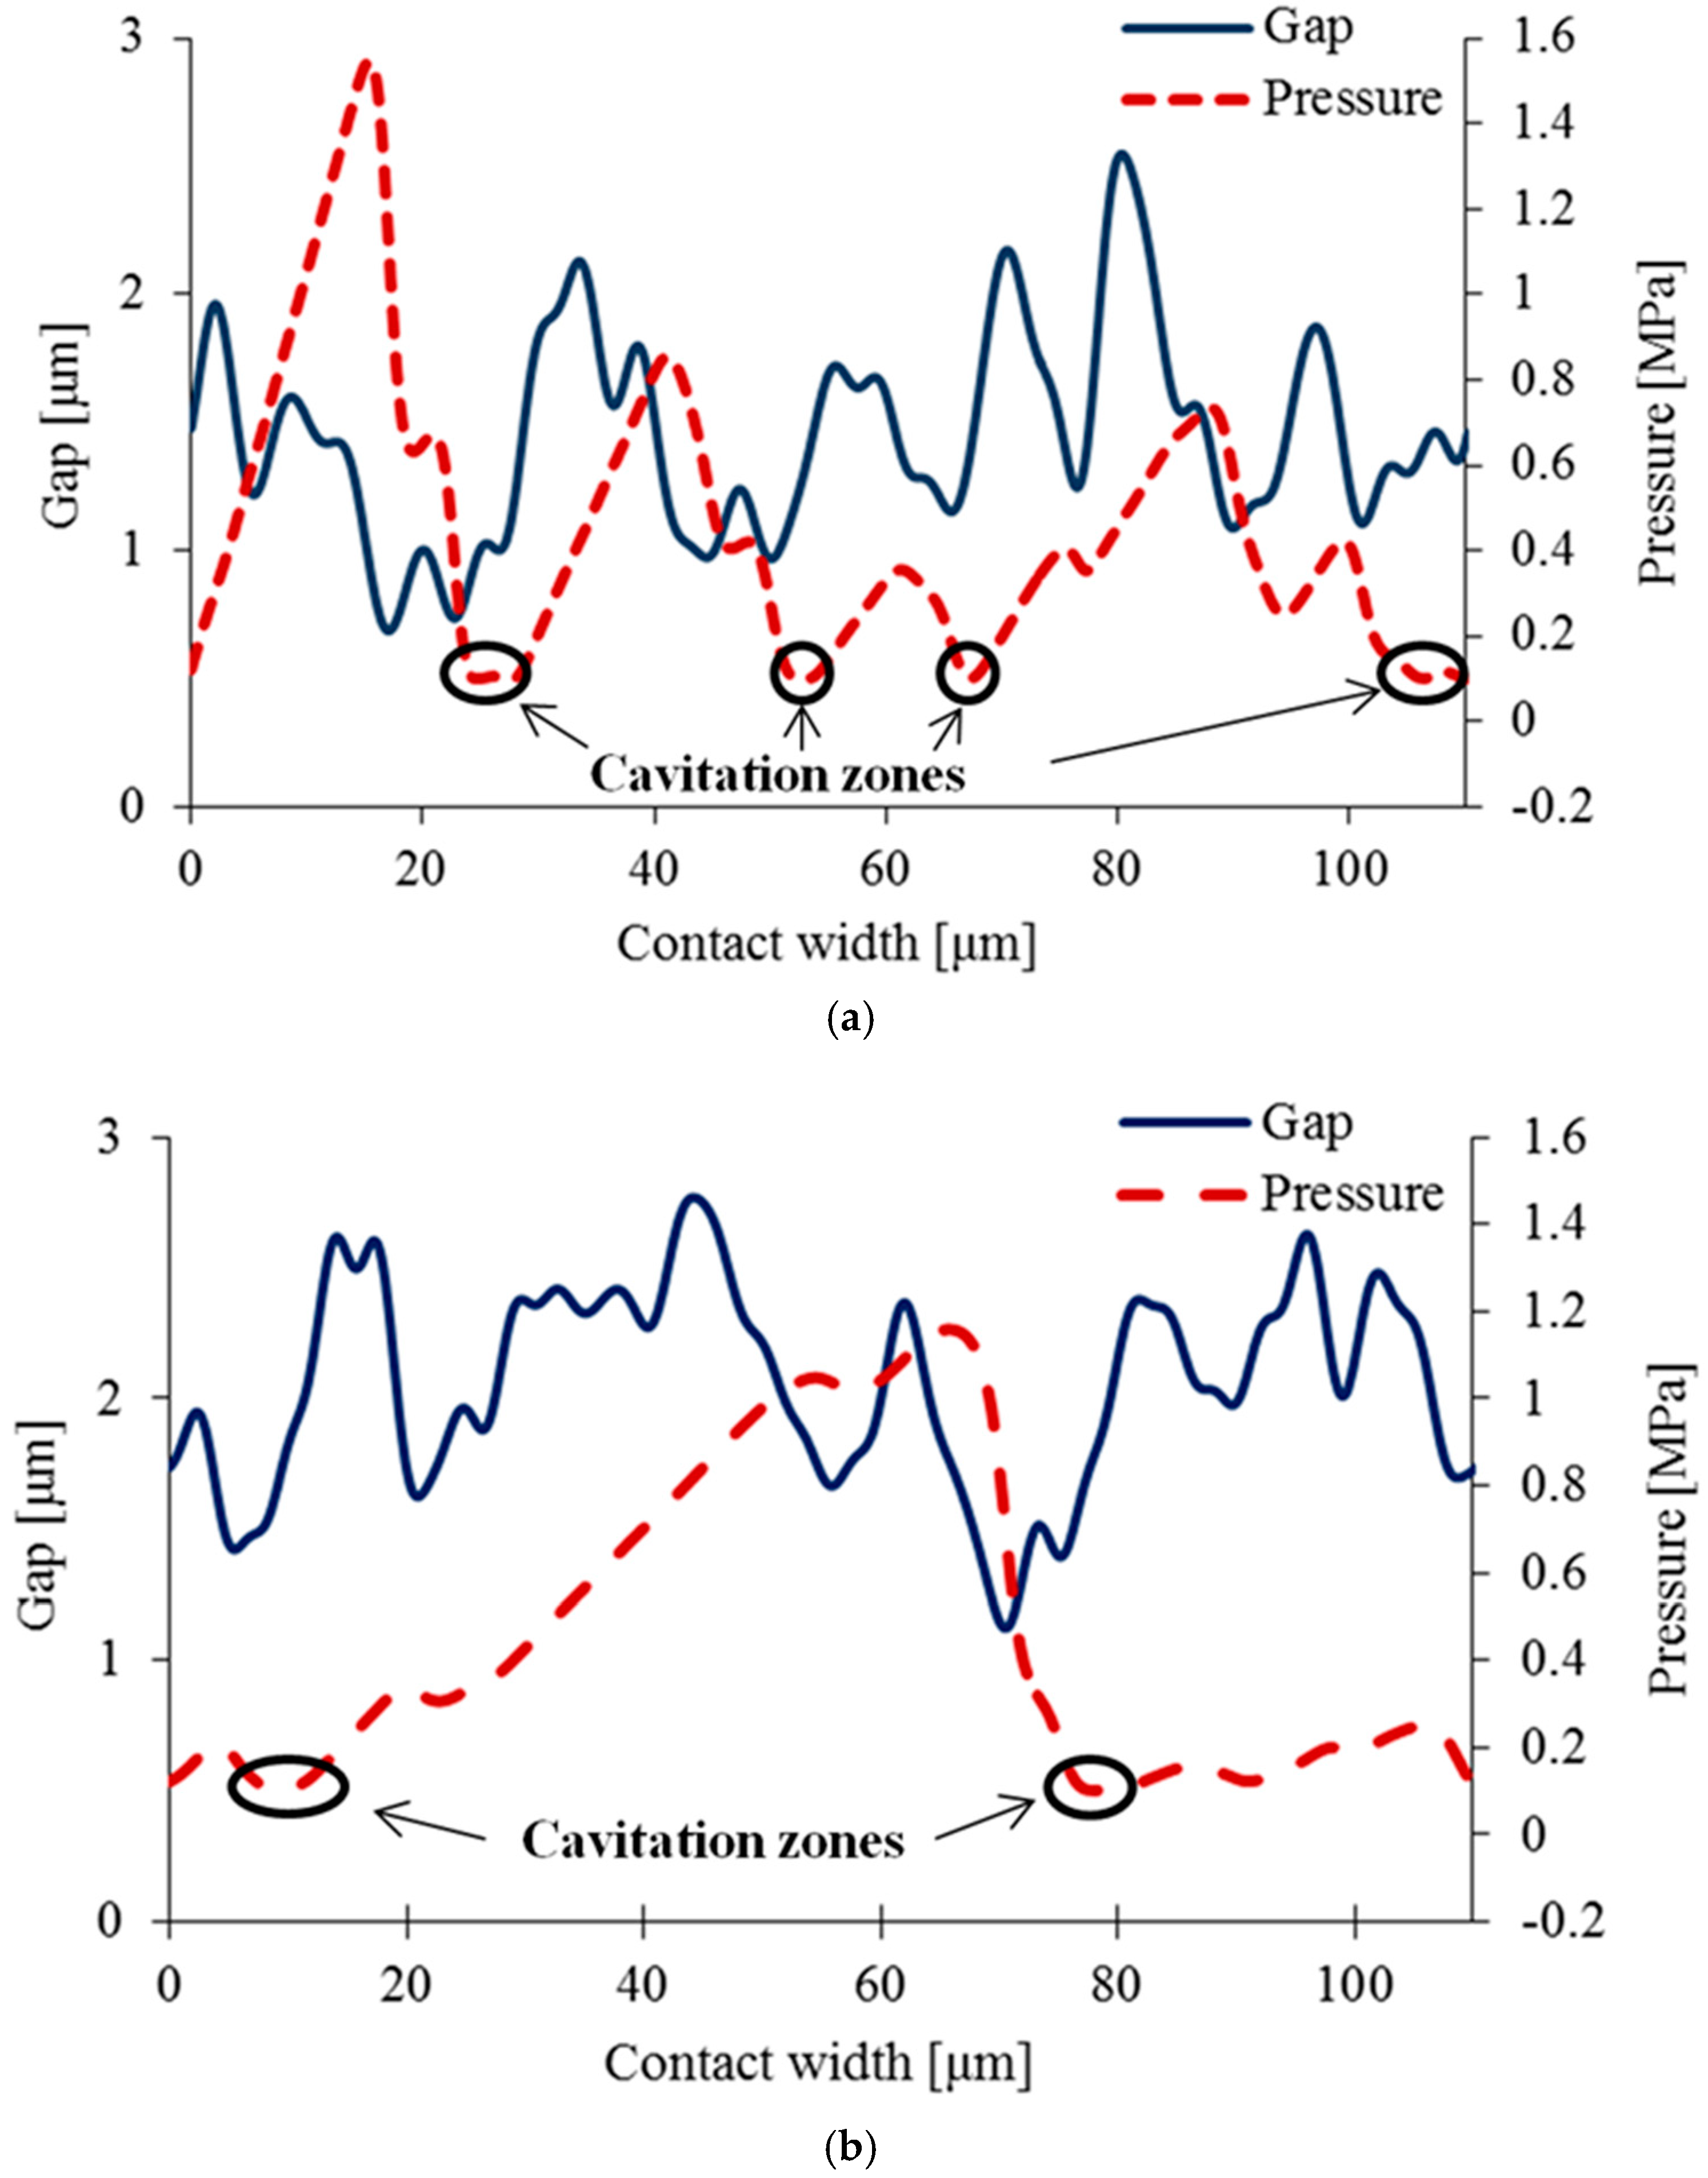
Figure 5 shows two examples of the results obtained for the generated contact pressure distribution. Figure 5a shows the pressure distribution for a negatively skewed topography, whereas that in Figure 5b is for a positively skewed profile. The pressure fluctuations following the geometrical gradients in the contact profile are as expected with areas where the pressure within the contact falls to cavitation pressure as shown in the figures in few locations. It is also interesting to note that the fluctuations in the pressure are remarkably lower in the case of the positively skewed profile. It can also be observed that there is a higher number of cavitation zones within the profile with negative skewness as the pressure distribution fluctuates around a mean value. For positively skewed profiles, the generated pressures exhibit less local fluctuations.
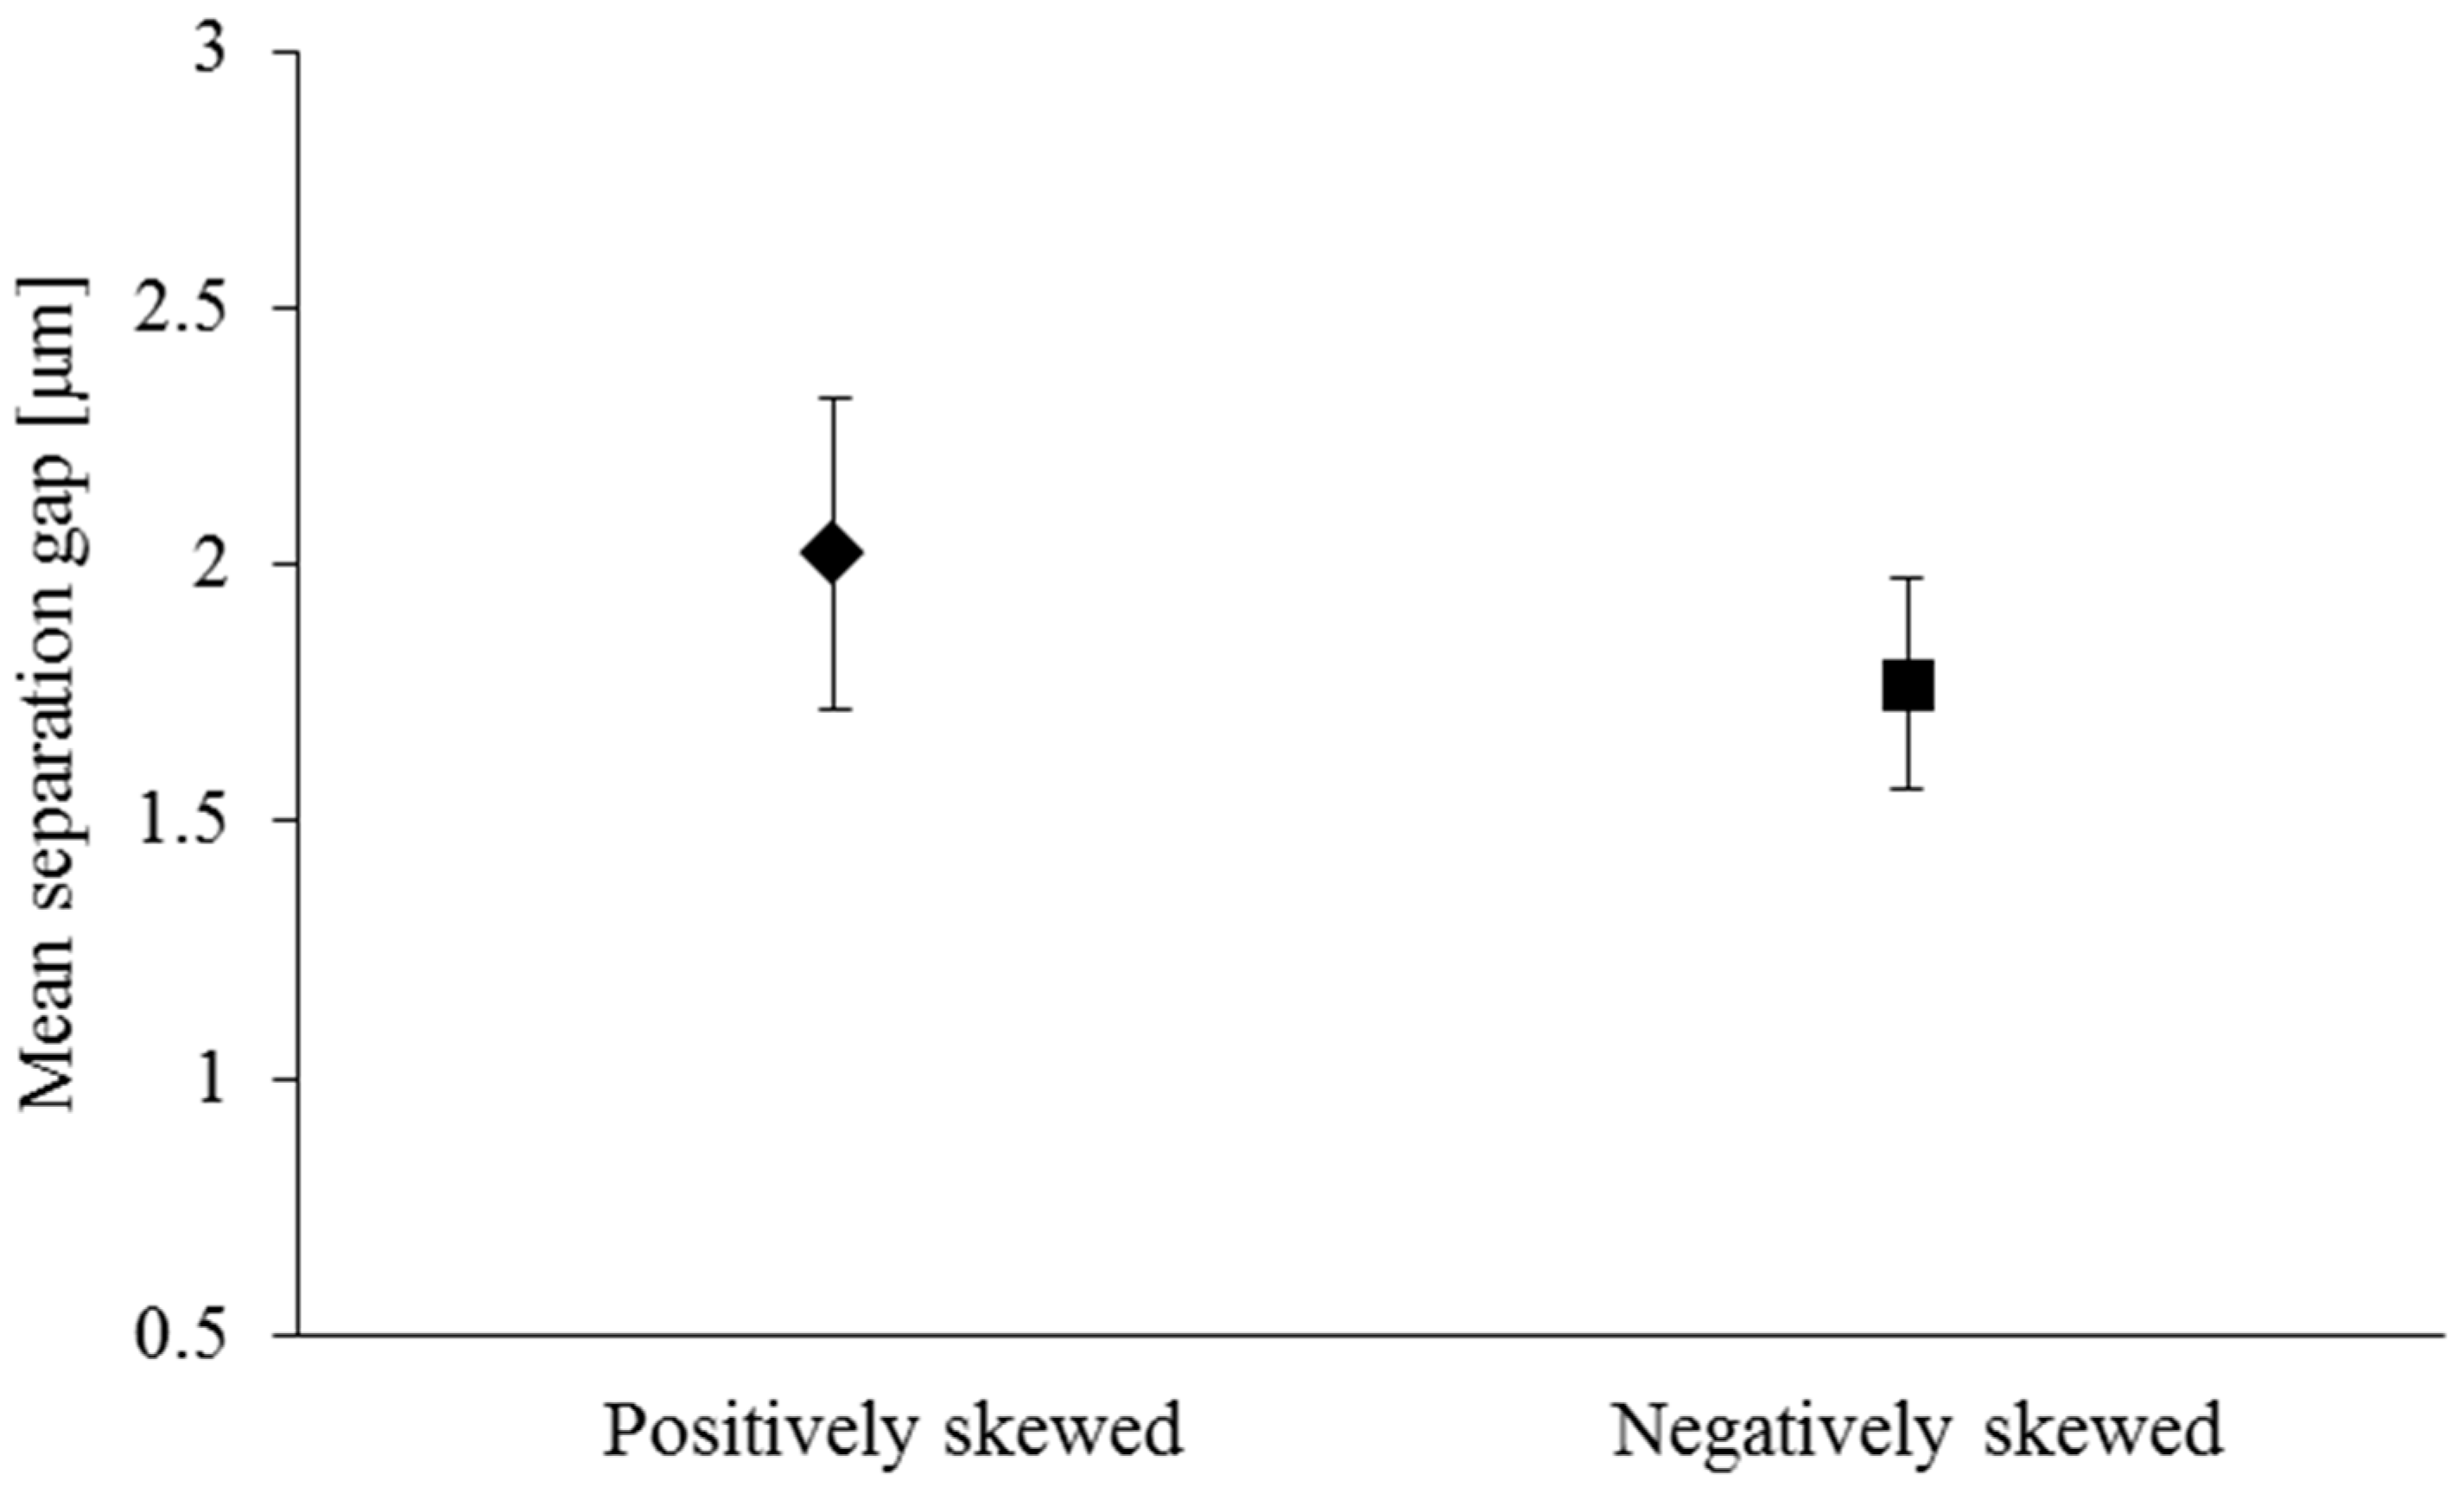
The numerical model is used to determine the pressure distribution for all the measured profiles, categorised as negatively or positively skewed profiles, whilst their other roughness parameters such as , , , and remain quite close for all cases. Then, the mean separation gap for each case is determined. Due to the inherent random nature of the roughness distribution in the investigated profiles, it would only be reasonable to compare the average mean separation gap investigated for the two categories of profiles. The results are shown in Figure 6, including the associated standard deviations. It can be seen that the mean separation gap for a negatively skewed profile is lower than that obtained for the positively skewed one. The average difference is 14.5%. The confidence level for this set of data obtained from a t-test reached a value of p = 0.0636.
As in all cases, the applied load is kept constant. The results in Figure 6 indicate that the positively skewed profiles produce higher load carrying capacity at the same separation gap.
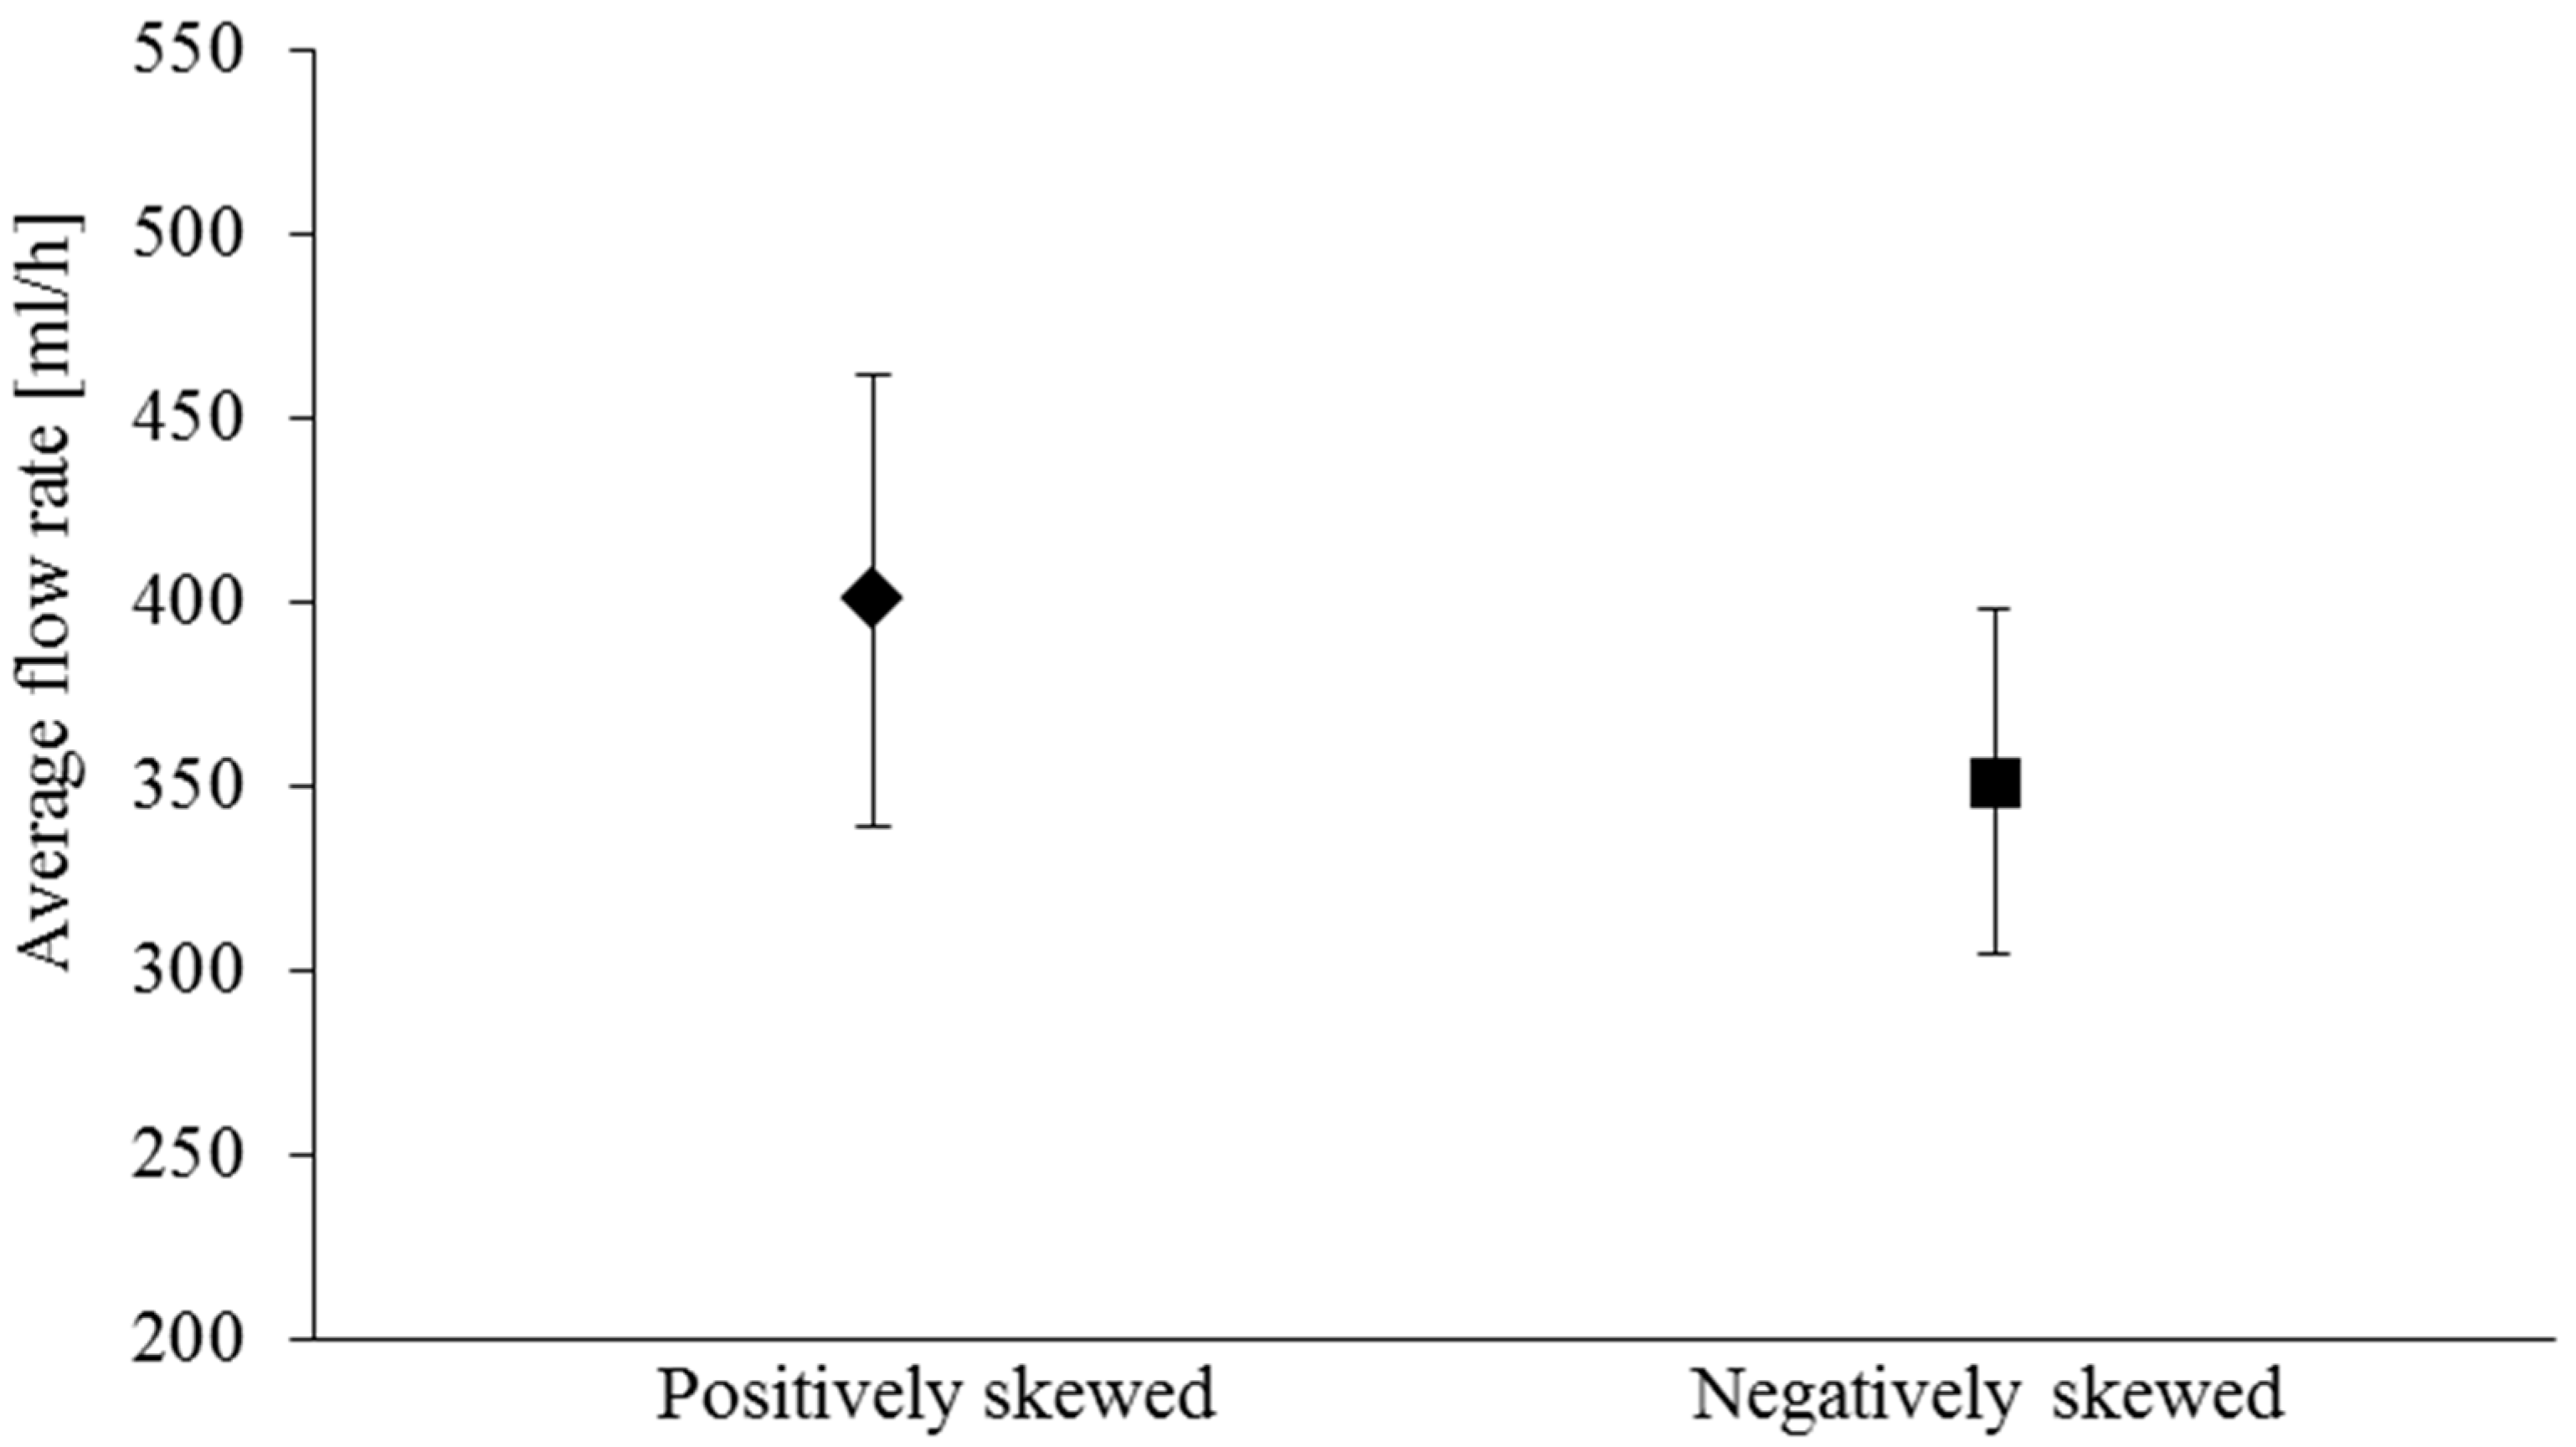
Considering the relationship given for the flow rate in the previous section, the larger separation gaps would be expected to provide a higher flow rate through the contact. Figure 7 shows a comparison of average flow rate from the contact for both positively and negatively skewed profiles, including the associated standard deviations. The observed average difference is about 14.1% which is very close to the observed average difference between the mean gaps. It is important to note that the lower film thickness, although it may be favourable in terms of leakage, has the drawback of tending to mixed or boundary regimes of lubrication with increased friction and greater propensity to wear.
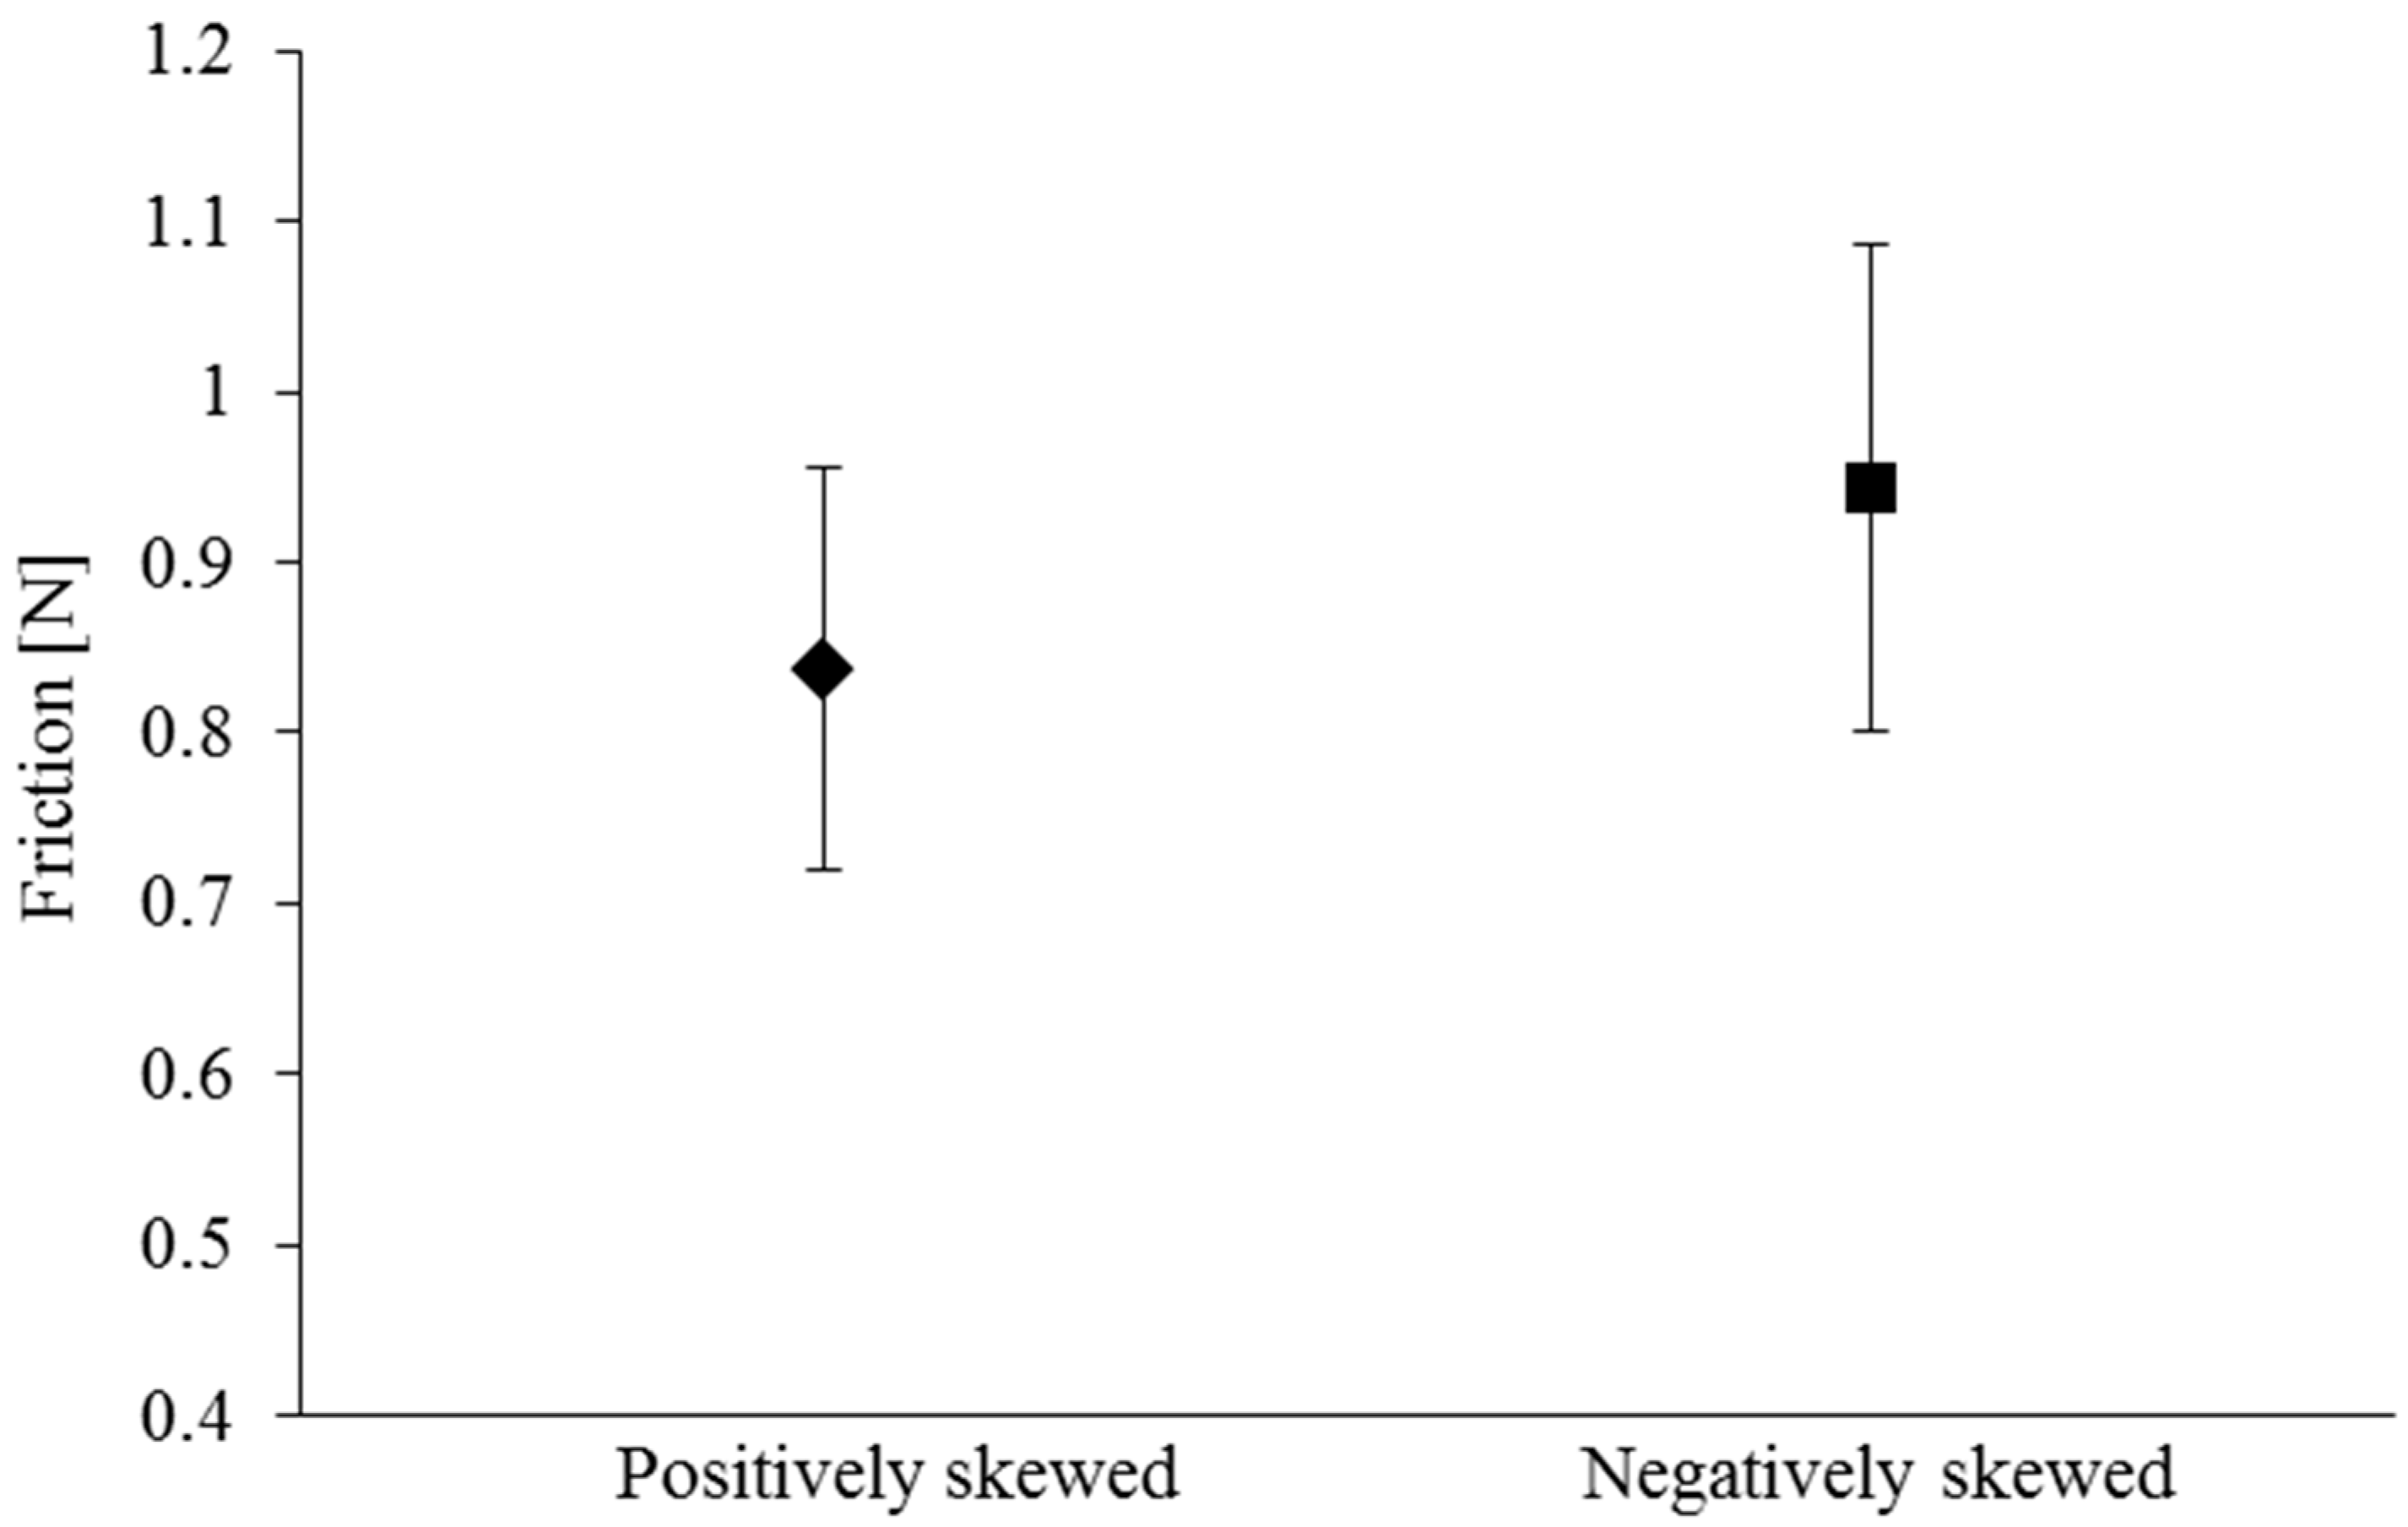
It would be interesting to note the differences in the generated friction and power loss, which represent a source of damping, attenuating the axial vibrations. The generated friction depends on the pressure gradient and the average film thickness. Figure 8 shows a comparison of average friction, computed for the two categories of roughness distribution. Owing to the lower mean gap, the negatively skewed profile produces higher friction (around 12.7%), which would be expected, considering the inverse relationship between viscous shear and mean separation gap. This is in spite of the fact that the flow rate is also lower for the negatively skewed profile. Since the contact velocity was assumed to be the same for all the investigated cases, it would also be expected that the average power loss to be the similarly higher for the negatively skewed profiles. It is important to note that in real applications, boundary friction occurs before the build-up of a lubricant film during start-up conditions. In such cases, the positively skewed surfaces may experience much higher probability of direct asperity interactions on the opposing contacting surfaces which can lead to damage to the softer elastomeric counter face surface. Negatively skewed surfaces would go through the running-in period more smoothly. Any further rise in viscous friction during operation would be of a lesser significance, as the seal could still provide a better performance.
The shafts with tendency in their roughness towards a larger area of valleys (i.e., negative skewness) show lower leakage and therefore higher sealing ability. It is noteworthy that the valleys resemble undulations made using artificial means such surface texturing, where cavities or dimples of micro-size are created on the surfaces using various methods such as laser surface texturing (LST). It would, therefore, be interesting to investigate the link between the observed tribological performance from textured surfaces (e.g., reducing leakage from seal contacts [18]) and the valleys created on the shaft surfaces through machining processes as studied here. The aim would be to optimise their performance as shown in [36]. A refined machining approach may result in surfaces with desired topographical skewness, which can perform both with higher sealing ability and lower power loss, and hence better energy efficiency.
It is important to note the assumptions made in obtaining the current results and the associated limitations stated at the outset. It is also important to note that the implications of direct contact between asperities on the opposing counter face surfaces at lower mean gaps have not been included in the current analysis. As the separation gap reduces, the probability of asperity contacts increases and hence the effect of boundary friction must also be included.
5. Conclusions
The results from numerical simulations are in agreement with the observed trends in real industrial applications, highlighting the importance of shaft roughness profile in determining the successful performance of a particular shaft type. The reason for such differences in the performance of the shafts, machined using different methods, has been explained using a deterministic numerical approach. Therefore, it is possible to simulate surface roughness features of potentially different scales. It is also shown that topographic skewness can act as the characteristic surface parameter in determining seal leakage. Based on the current analysis, it seems that a direct relationship between the roughness distribution and the shaft performance in terms of the leakage and friction can be established. However, the results must be treated with some caution as the effect of some other important parameters, such as reverse pumping, has not been taken into account and therefore, the leakage cannot be quantitatively described. The tribology of a real radial lip seal contact is a complex problem with a large number of influential parameters which may also interact with each other in addition to directly affecting the sealing performance. Therefore, the current study should be considered as an initial step towards a more complex and holistic analysis of the problem of leakage from radial lip seals. Further work needs to include a contact model to account for reverse pumping, elastic deformation, and asperities contact, accompanied with experimental verification of the model and topography of run-in surfaces. It may also be worthwhile to consider the effect of implementing artificial surface texture features to enhance sealing performance. Further investigations on topographical differences can also take into account the self-affine nature of surfaces and power spectral density [37].
Author Contributions
Conceptualization, E.K. and N.M.; Methodology, E.K., R.R. and N.M.; Software, E.K. and R.R.; Validation, E.K. and P.N. and R.R.; Formal Analysis, E.K., N.M. and R.R.; Investigation, E.K. and P.N.; Resources, P.N., N.M. and R.R.; Data Curation, E.K.; Writing-Original Draft Preparation, E.K.; Writing-Review & Editing, R.R., N.M. and H.R.; Visualization, E.K.; Supervision, R.R., N.M. and H.R.; Project Administration, R.R., N.M. and H.R.; Funding Acquisition, P.N., R.R. and N.M.
Funding
This research received funding from UK EPSRC through DTP scheme (EP/N509516/1, Project Reference Number: 1880270) and Neapco, Germany.
Acknowledgments
The authors are grateful to the Engineering and Physical Science Research Council (EPSRC) for the financial support extended to this research through the Doctoral Training Program (DTP) (EP/N509516/1, Project Reference number: 1880270). The authors also acknowledge the contribution made by the indusial partner of the project.
Conflicts of Interest
The authors declare no conflicts of interest.
Nomenclature
| Fourier coefficients | |
| Intermediate discretisation variables | |
| Shaft diameter | |
| Tolerance limit for pressure convergence | |
| Tolerance limit for load convergence | |
| Viscous friction | |
| Total gap size | |
| Nominal (mean) gap | |
| Mean roughness height | |
| Measured roughness height | |
| Approximated contact profile using FFT | |
| Nodal index | |
| Total number of computational grid points | |
| Length over which roughness parameter is calculated | |
| Length taken for fast Fourier transform (FFT) analysis | |
| Index representing each measured point | |
| Leakage mass flow rate | |
| Total number of measured points | |
| Index of harmonic component | |
| Total number of harmonic components | |
| Hydrodynamic pressure | |
| Pressure on the air side of the lip seal | |
| Cavitation pressure | |
| Power loss | |
| Pressure on the oil side of the lip seal | |
| Profile arithmetic mean height | |
| Profile kurtosis | |
| Profile skewness | |
| Profile square root mean height | |
| Average profile maximum peak to valley height | |
| Surface kurtosis | |
| Surface skewness | |
| Surface root mean height | |
| Average surface maximum peak to valley height | |
| Time | |
| Velocity in axial direction | |
| Hydrodynamic load | |
| Axial direction | |
| Greek symbols | |
| Pressure–viscosity coefficient | |
| Distance between the nodal points within the domain | |
| Pressure convergence criterion | |
| Load convergence criterion | |
| Relaxation parameter | |
| Dynamic viscosity of fluid | |
| Density of fluid | |
| RMS roughness | |
| Stribeck oil film ratio | |
| Load balance adjusting parameter | |
| Superscripts | |
| Pressure iteration step | |
| Load iteration step | |
| Abbreviations | |
| CFDM | Central finite difference method |
| FFT | Fast Fourier transform |
| ISO | International Organisation for Standardisation |
| PSOR | Point successive over-relaxation |
| RMS | Root mean square |
References
- Tonder, K.; Salant, R.F. Non-leaking lip seals: A roughness effect study. Trans. ASME J. Tribol. 1992, 114, 595–599. [Google Scholar] [CrossRef]
- Harp, S.R.; Salant, R.F. Inter-asperity cavitation and global cavitation in seals: An average flow analysis. Tribol. Int. 2002, 35, 113–121. [Google Scholar] [CrossRef]
- Salant, R.F.; Rocke, A.H. Hydrodynamic analysis of the flow in a rotary lip seal using flow factors. Trans. ASME J. Tribol. 2004, 126, 156–161. [Google Scholar] [CrossRef]
- Jia, X.; Guo, F.; Huang, L.; Salant, R.F.; Wang, Y. Parameter analysis of the radial lip seal by orthogonal array method. Tribol. Int. 2013, 64, 96–102. [Google Scholar] [CrossRef]
- Guo, F.; Jia, X.; Suo, S.; Salant, R.F.; Wang, Y. A mixed lubrication model of a rotary lip seal using flow factors. Tribol. Int. 2013, 57, 195–201. [Google Scholar] [CrossRef]
- Salant, R.F.; Shen, D. Hydrodynamic effects of shaft surface finish on lip seal operation. Tribol. Trans. 2002, 45, 404–410. [Google Scholar] [CrossRef]
- Schubert, A.; Zhang, R.; Steinert, P. Manufacturing of twist-free surfaces by hard turning. Procedia CIRP 2013, 7, 294–298. [Google Scholar] [CrossRef]
- Baumann, M.; Bauer, F.; Haas, W.; Baitinger, G. How to measure lead in sealing technology. Seal. Technol. 2013, 2013, 8–12. [Google Scholar] [CrossRef]
- Kundrak, J.; Gyani, K.; Felho, C.; Markopoulos, A.P.; Deszpoth, I. Analysis of lead twist in modern high-performance grinding methods. IOP Conf. Ser. Mater. Sci. Eng. 2016, 161, 012005. [Google Scholar] [CrossRef] [Green Version]
- Thielen, S.; Magyar, B.; Sauer, B.; Schneider, F.; Mayer, P.; Kirsch, B.; Muller, R.; Harbou, E.V.; Aurich, J.C. Functional investigation of zero lead radial shaft seal counter-surfaces turned with a special method. Tribol. Int. 2018, 118, 442–450. [Google Scholar] [CrossRef]
- El Gadari, M.; Fatu, A.; Hajjam, M. Effect of grooved shaft on the rotary lip seal performance in transient condition: Elasto-hydrodynamic simulations. Tribol. Int. 2016, 93, 411–418. [Google Scholar] [CrossRef]
- Jagger, E.T. Rotary shaft seals: The sealing mechanism of synthetic rubber seals running at atmospheric pressure. Proc. Inst. Mech. Eng. 1957, 171, 597–616. [Google Scholar] [CrossRef]
- ISO 6194-1. Rotary Shaft Lip-Type Seals Incorporating Elastomeric Sealing Elements, Part 1: Nominal Dimensions and Tolerances. 2007. Available online: https://www.iso.org/standard/34678.html (accessed on 1 June 2017).
- Bruker Nano Surfaces Division. Application Note 549. Quantitatively Measuring Surface Texture and Shaft Lead of dynamic Sealing Systems. 2011. Available online: https://cdn.thomasnet.com/ccp/30310445/194274.pdf (accessed on 1 June 2017).
- El Gadari, M.; Fatu, A.; Hajjam, M. Shaft roughness effect on elasto-hydrodynamic lubrication of rotary lip seals: Experimentation and numerical simulation. Tribol. Int. 2015, 88, 218–227. [Google Scholar] [CrossRef]
- Schulz, M.; Baumann, M.; Bauer, F. Influence of belt ground and superfinished shaft counterfaces on the tribological and functional behavior of elastomeric lip seals. In Proceedings of the 24th International Conference on Fluid Sealing, Manchester, UK, 7–8 March 2018. [Google Scholar]
- Jung, S.; Haas, W. Effects of shaft surface topography on the friction of radial lip seals. In Proceedings of the 65th STLE Annual Meeting, Las Vegas, NV, USA, 16–20 May 2010. [Google Scholar]
- Etsion, I.; Kligerman, Y.; Halperin, G. Analytical and experimental investigation of laser-textured mechanical seal faces. Tribol. Trans. 1999, 42, 511–516. [Google Scholar] [CrossRef]
- Sedlacek, M.; Podgornik, B.; Vizintin, J. Correlation between standard roughness parameters skewness and kurtosis and tribological behaviour of contact surfaces. Tribol. Int. 2012, 48, 102–112. [Google Scholar] [CrossRef]
- Andharia, P.I.; Gupta, J.L.; Deheri, G.M. Effect of surface roughness on hydrodynamic lubrication of slider bearing. Tribol. Trans. 2001, 44, 291–297. [Google Scholar] [CrossRef]
- Greenwood, J.A.; Williamson, J.B.P. Contact of nominally flat surfaces. Proc. R. Soc. A Math. Phys. Eng. Sci. 1966, 295, 300–319. [Google Scholar] [CrossRef]
- Reynolds, O. On the theory of lubrication and its application to Mr Beauchamp Tower’s experiments, including an experimental determination of the viscosity of olive oil. Philos. Trans. R. Soc. Lond. 1886, 177, 157–234. [Google Scholar] [CrossRef]
- Day, K.; Salant, R.F. Thermal elastohydrodynamic model of a radial lip seal- Part I: Analysis and base results. Trans. ASME J. Tribol. 1999, 121, 1–10. [Google Scholar] [CrossRef]
- Gabelli, A. Micro-elastohydrodynamic lubricant film formation in rotary lip seal contacts. Tribol. Ser. 1989, 14, 57–68. [Google Scholar]
- Patir, N.; Cheng, H.S. An average flow model for determining effects of three-dimensional roughness on partial hydrodynamic lubrication. Trans. ASME J. Lubr. Technol. 1978, 100, 12–17. [Google Scholar] [CrossRef]
- Lo, S.-W. On the effects of roughness orientation—A mapping and double scale analysis of flow factors. Trans. ASME J. Tribol. 1992, 114, 747–754. [Google Scholar] [CrossRef]
- Rocke, A.H.; Salant, R.F. Elastohydrodynamic analysis of a rotary lip seal using flow factors. Tribol. Trans. 2005, 48, 308–316. [Google Scholar] [CrossRef]
- Harp, S.; Salant, R.F. An average flow model of rough surface lubrication with inter-asperity cavitation. Trans. ASME J. Tribol. 2001, 123, 134–143. [Google Scholar] [CrossRef]
- Leighton, M.; Rahmani, R.; Rahnejat, H. Surface-specific flow factors for prediction of friction of cross-hatched surfaces. Surf. Topogr. Metrol. Prop. 2016, 4, 025002. [Google Scholar] [CrossRef] [Green Version]
- Shen, D.; Salant, R.F. A transient mixed lubrication model of rotary lip seal with a rough shaft. STLE Tribol. Trans. 2006, 49, 621–634. [Google Scholar] [CrossRef]
- Christopherson, D.G. A new mathematical method for the solution of film lubrication problems. Proc. Inst. Mech. Eng. 1941, 146, 126–135. [Google Scholar] [CrossRef]
- Hoffmann, K.A.; Chiang, S.T. Computational Fluid Dynamic for Engineers: Volume 1; Engineering Education System: Wichita, KS, USA, 1993. [Google Scholar]
- Rahmani, R.; Theodossiades, S.; Rahnejat, H.; Fitzsimons, B. Transient elastohydrodynamic lubrication of rough new or worn piston compression ring conjunction with an out-of-round cylinder bore. Proc. IMechE Part J. J. Eng. Tribol. 2012, 226, 284–305. [Google Scholar] [CrossRef] [Green Version]
- Gohar, R.; Rahnejat, H. Fundamentals of Tribology; Imperial College Press: London, UK, 2008. [Google Scholar]
- Nomikos, P.; Kozuch, E.; Morris, N.; Rahmani, H.; Rahnejat, H. Measurement of vibrations affecting the power transmission seals. In Proceedings of the 4th Biennial International Conference on Powertrain Modelling and Control Testing, Mapping and Calibration (PMC 2018), Loughborough, UK, 10–11 September 2018. [Google Scholar]
- Rahmani, R.; Rahnejat, H. Enhanced performance of optimised partially textured load bearing surfaces. Tribol. Int. 2018, 117, 272–282. [Google Scholar] [CrossRef]
- Jacobs, T.D.B.; Junge, T.; Pastewka, L. Quantitative characterization of surface topography using spectral analysis. Surf. Topogr. Metrol. Prop. 2017, 5. [Google Scholar] [CrossRef]
Figure 1.
Schematic representation of a radial lip seal with an added dust lip.

Figure 2.
Example of measured surfaces and the associated roughness profile in the specified cross-section.
Figure 2.
Example of measured surfaces and the associated roughness profile in the specified cross-section.

Figure 3.
Comparison of some of the common roughness parameters for 3D surface samples taken from the three studied shafts: (a) RMS roughness, ; (b) maximum height, ; (c) skewness, ; and (d) kurtosis, .
Figure 3.
Comparison of some of the common roughness parameters for 3D surface samples taken from the three studied shafts: (a) RMS roughness, ; (b) maximum height, ; (c) skewness, ; and (d) kurtosis, .


Figure 4.
Comparison of some of the common roughness parameters for 2D profiles extracted from the three studied shafts: (a) RMS roughness, ; (b) maximum height, ; (c) skewness, ; and (d) kurtosis, .
Figure 4.
Comparison of some of the common roughness parameters for 2D profiles extracted from the three studied shafts: (a) RMS roughness, ; (b) maximum height, ; (c) skewness, ; and (d) kurtosis, .

Figure 5.
Separation gap and predicted generated pressure distribution for shafts with typical: (a) negatively and (b) positively skewed roughness profiles.
Figure 5.
Separation gap and predicted generated pressure distribution for shafts with typical: (a) negatively and (b) positively skewed roughness profiles.

Figure 6.
Mean separation gap.

Figure 7.
Comparison of flow rates.

Figure 8.
Friction in axial direction.


Table 1.
List of input data.
| Parameter | Symbol | Value | Unit |
|---|---|---|---|
| Lubricant dynamic viscosity | 0.1 | Pa·s | |
| Pressure on the oil side | 121,590 | Pa | |
| Pressure on the air side | 101,325 | Pa | |
| Cavitation pressure | 101,325 | Pa | |
| Axial velocity | 1 | m/s | |
| Applied load | 50.1 | N | |
| Contact width | 110 | µm | |
| Number of grid points | 1000 | - | |
| Shaft diameter | D | 40 | mm |
© 2018 by the authors. Licensee MDPI, Basel, Switzerland. This article is an open access article distributed under the terms and conditions of the Creative Commons Attribution (CC BY) license (http://creativecommons.org/licenses/by/4.0/).
Share and Cite
MDPI and ACS Style
Kozuch, E.; Nomikos, P.; Rahmani, R.; Morris, N.; Rahnejat, H. Effect of Shaft Surface Roughness on the Performance of Radial Lip Seals. Lubricants 2018, 6, 99. https://doi.org/10.3390/lubricants6040099
AMA Style
Kozuch E, Nomikos P, Rahmani R, Morris N, Rahnejat H. Effect of Shaft Surface Roughness on the Performance of Radial Lip Seals. Lubricants. 2018; 6(4):99. https://doi.org/10.3390/lubricants6040099
Chicago/Turabian StyleKozuch, Emilia, Petros Nomikos, Ramin Rahmani, Nick Morris, and Homer Rahnejat. 2018. "Effect of Shaft Surface Roughness on the Performance of Radial Lip Seals" Lubricants 6, no. 4: 99. https://doi.org/10.3390/lubricants6040099
Note that from the first issue of 2016, this journal uses article numbers instead of page numbers. See further details here.