A Critical Appraisal of the Definition of Sarcopenia in Patients with Non-Alcoholic Fatty Liver Disease: Pitfall of Adjusted Muscle Mass by Body Weight

 , ,
, ,
Abstract
:1. Introduction
2. Materials and Methods
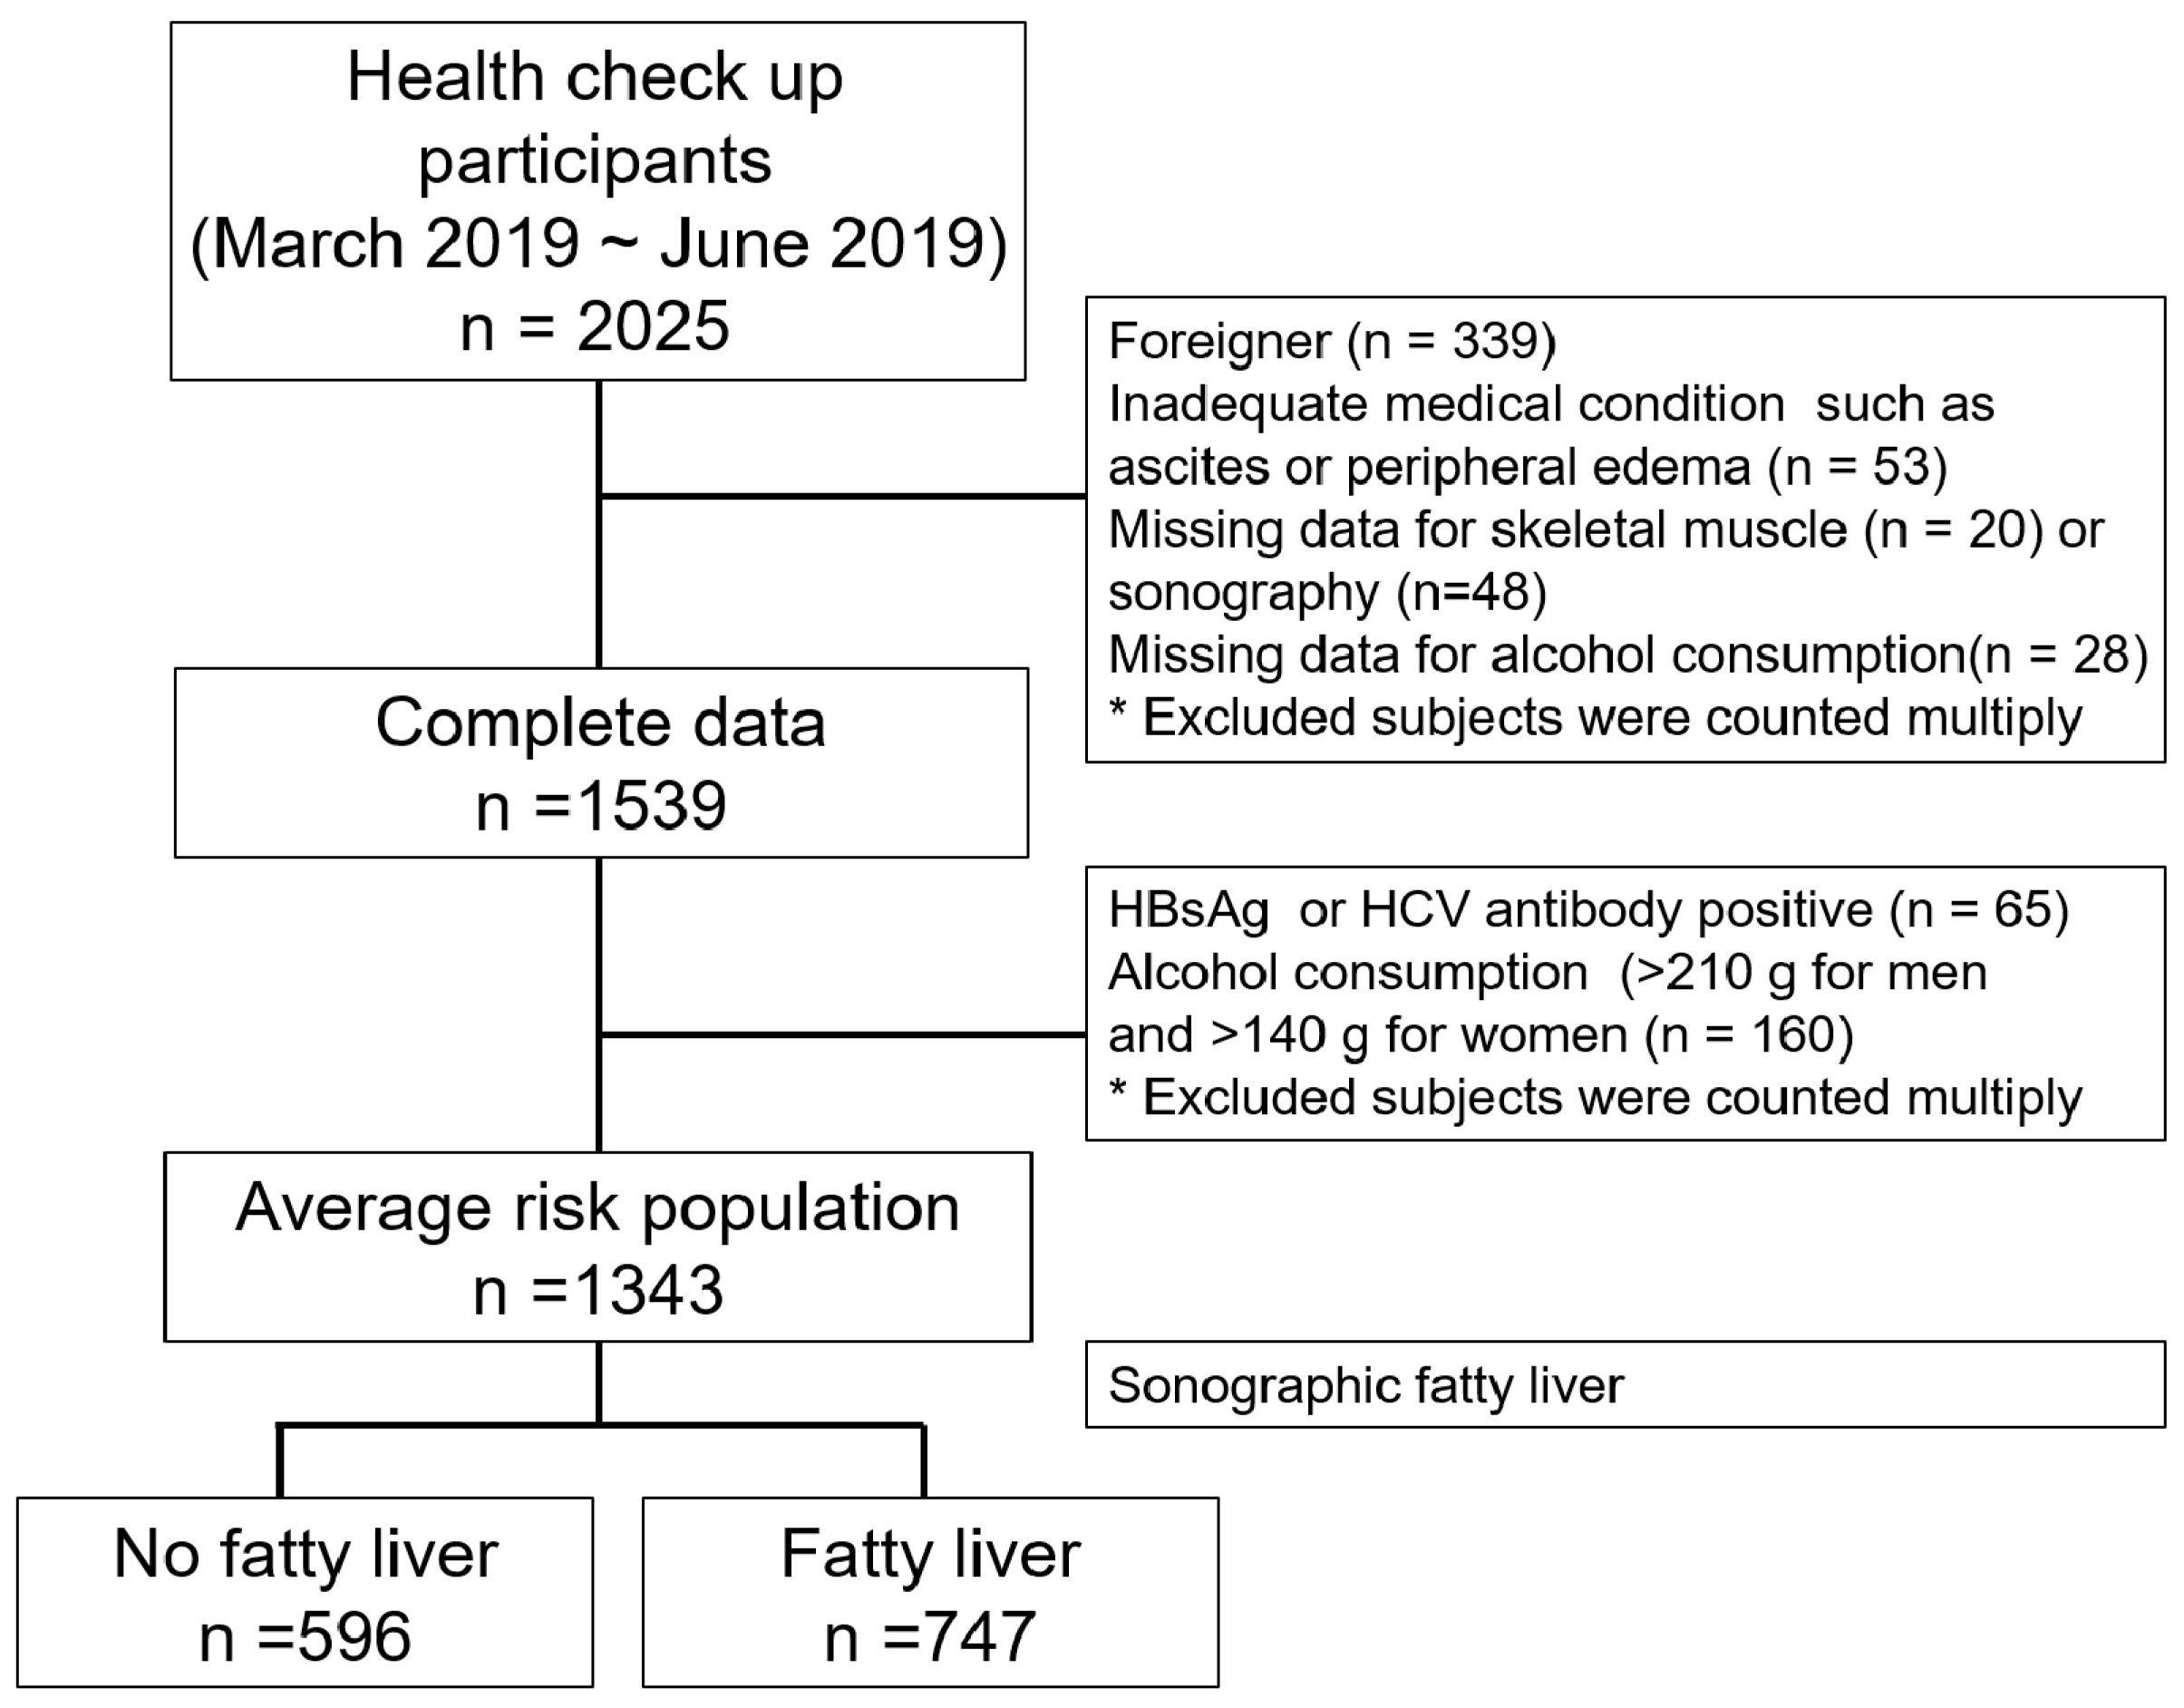
2.1. Study Design
2.2. Inclusion and Exclusion Criteria
2.3. Clinical Variables and Laboratory Evaluations
2.4. Definition of Sarcopenia
2.5. Definition of NAFLD
2.6. Statistical Analysis
3. Results
3.1. Baseline Characteristics
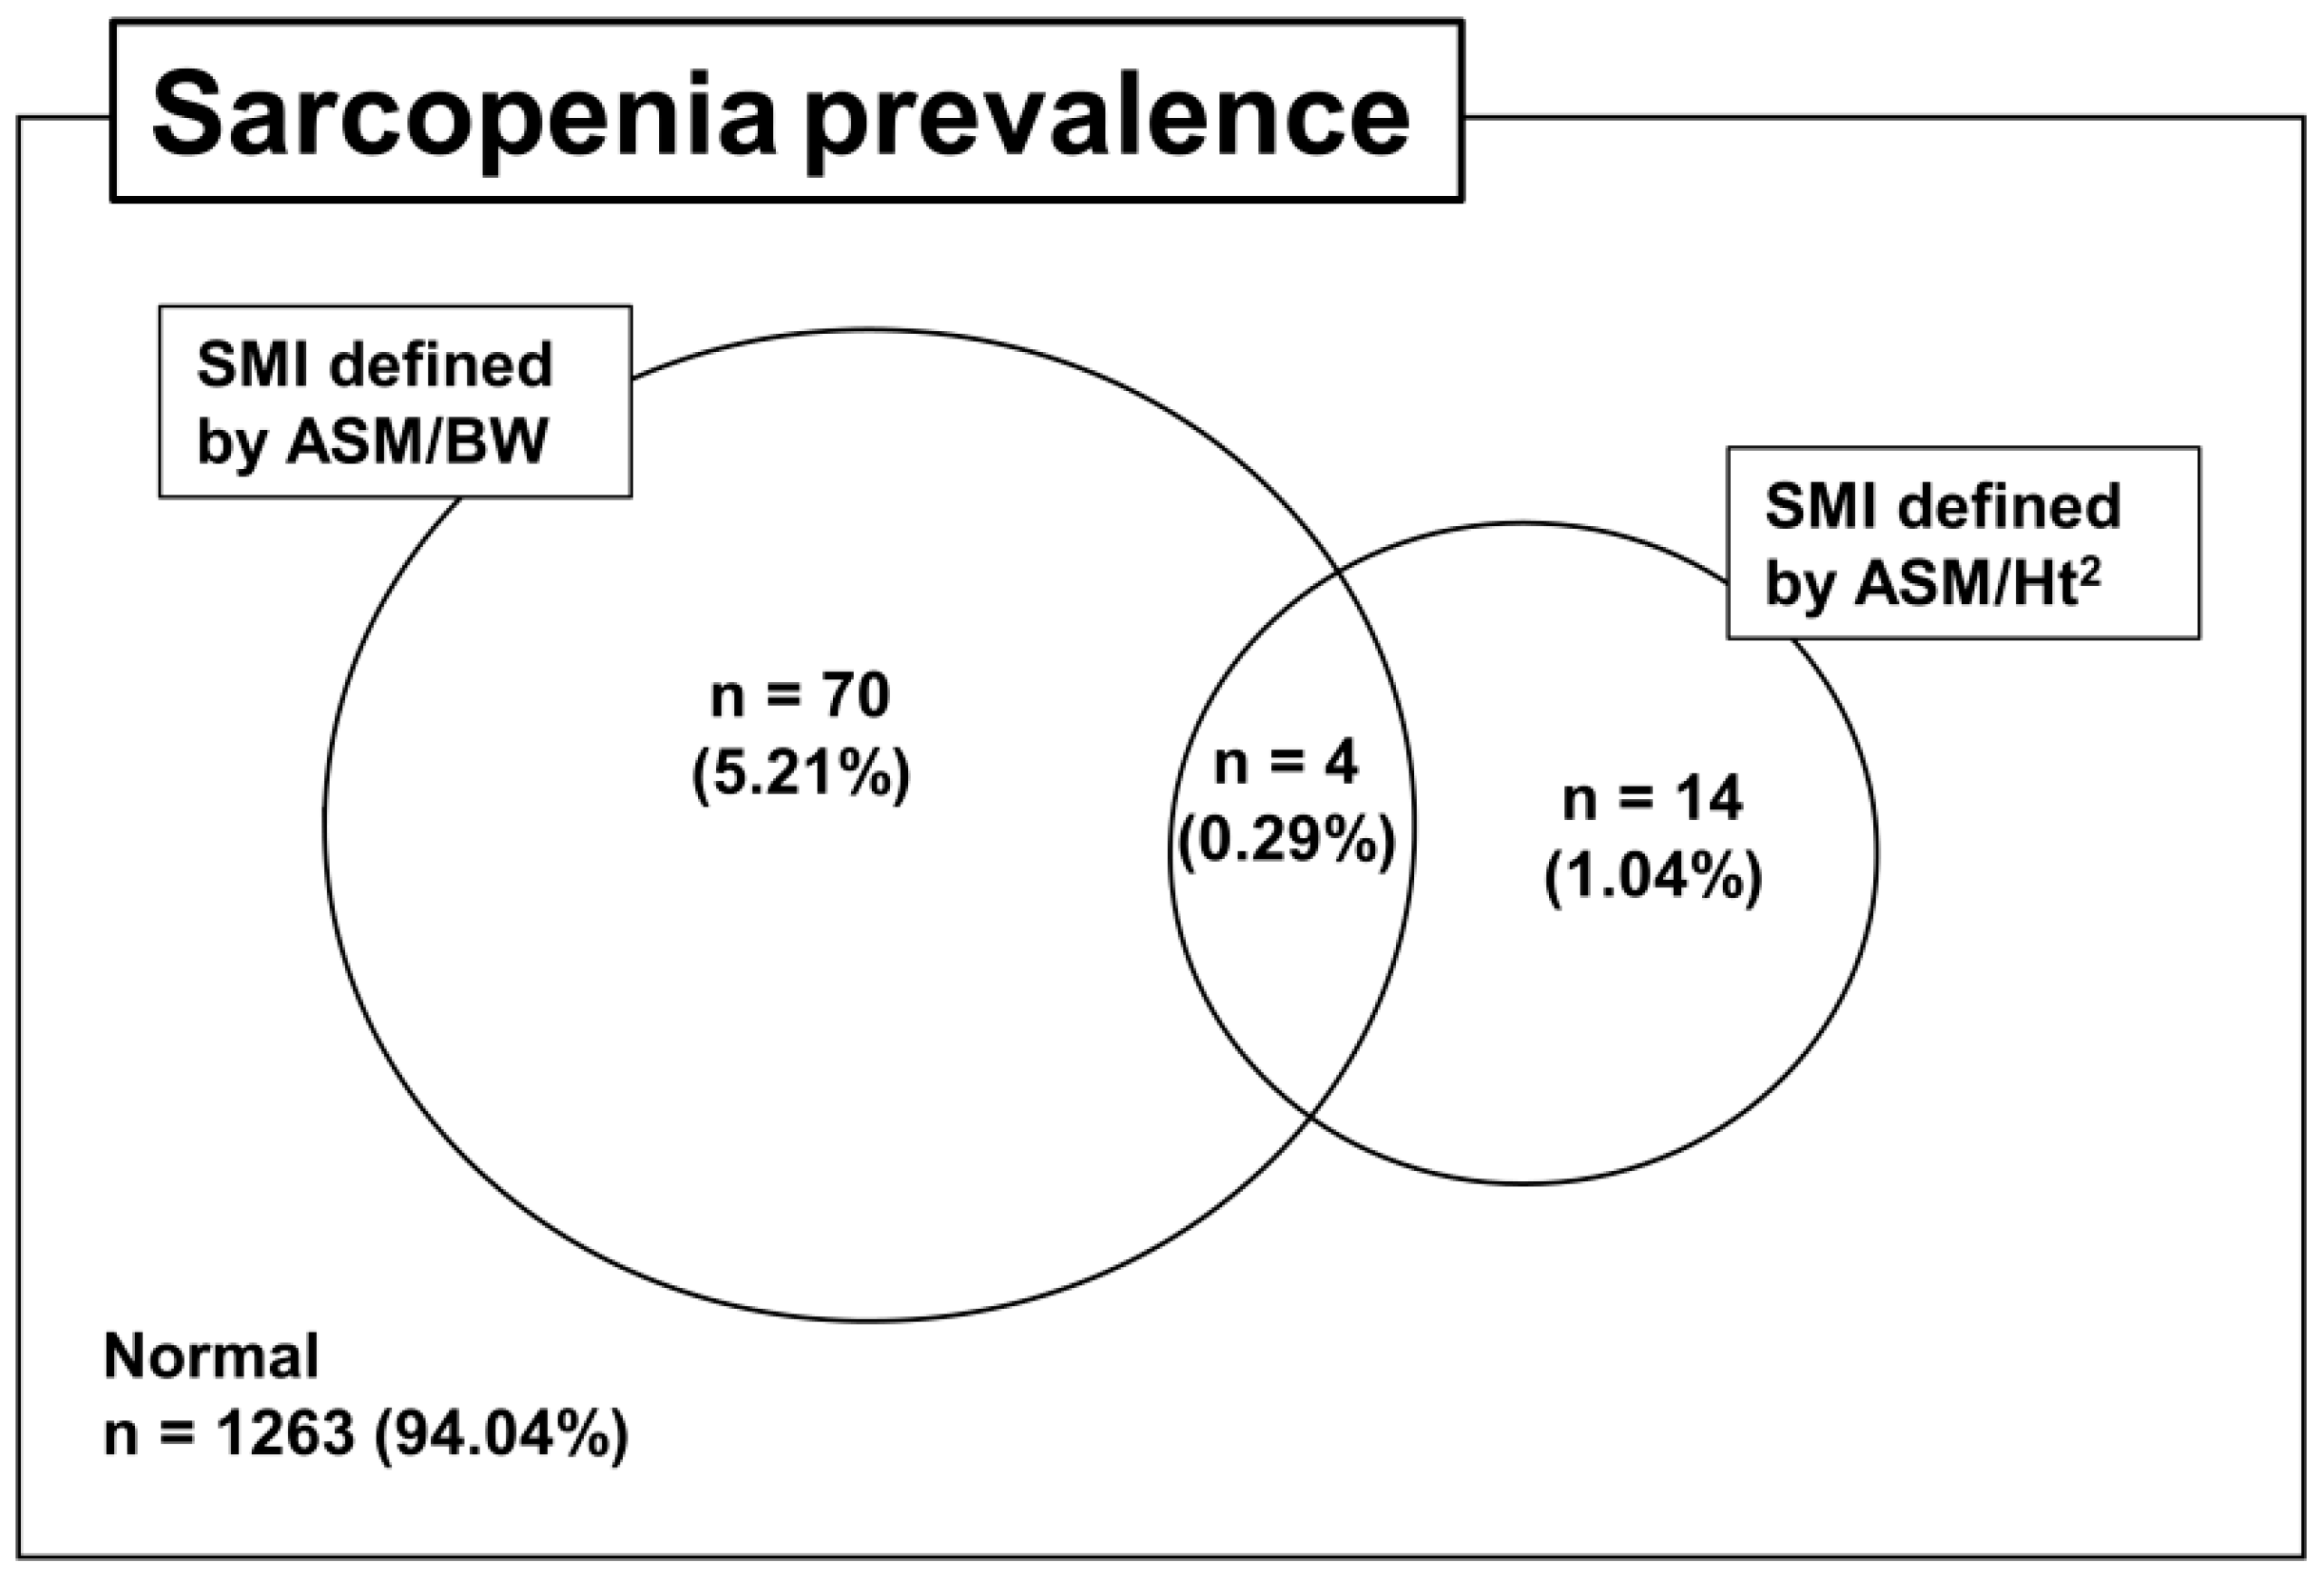
3.2. Prevalence of Sarcopenia According to Adjustment Methods and the Concordance Rate
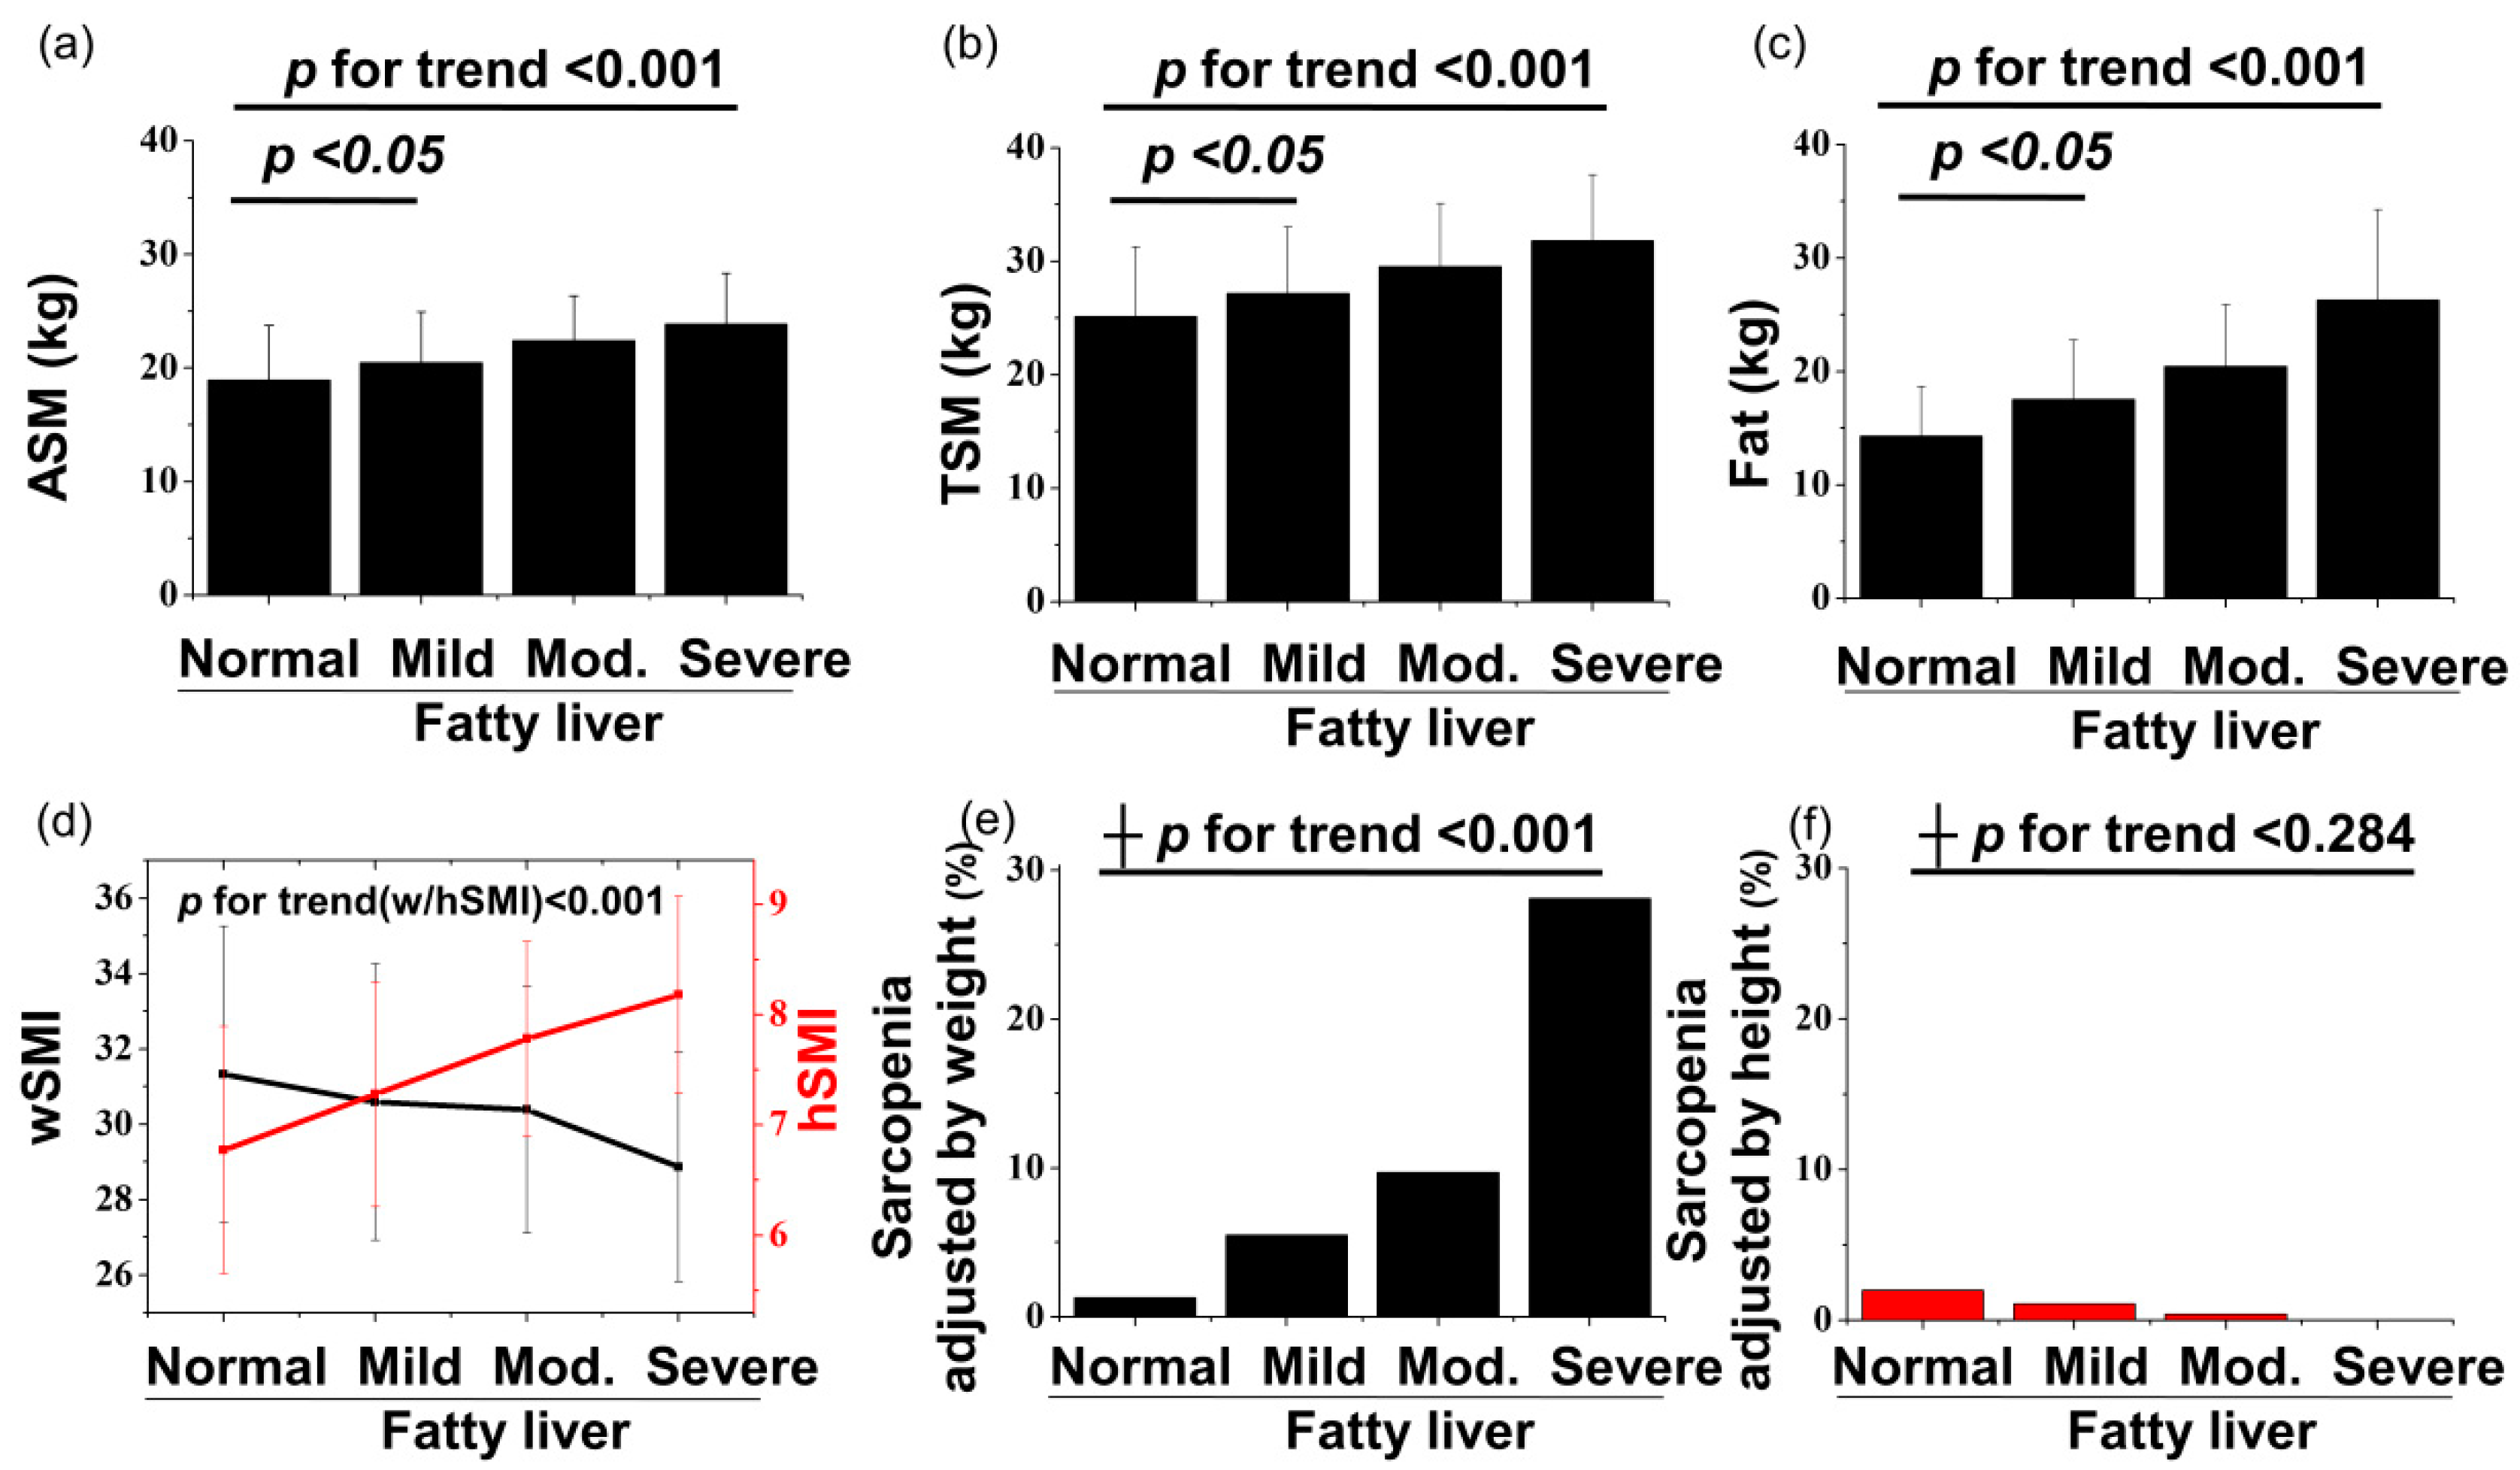
3.3. Associations between NAFLD and Sarcopenia According to Two Types of Adjustment Methods
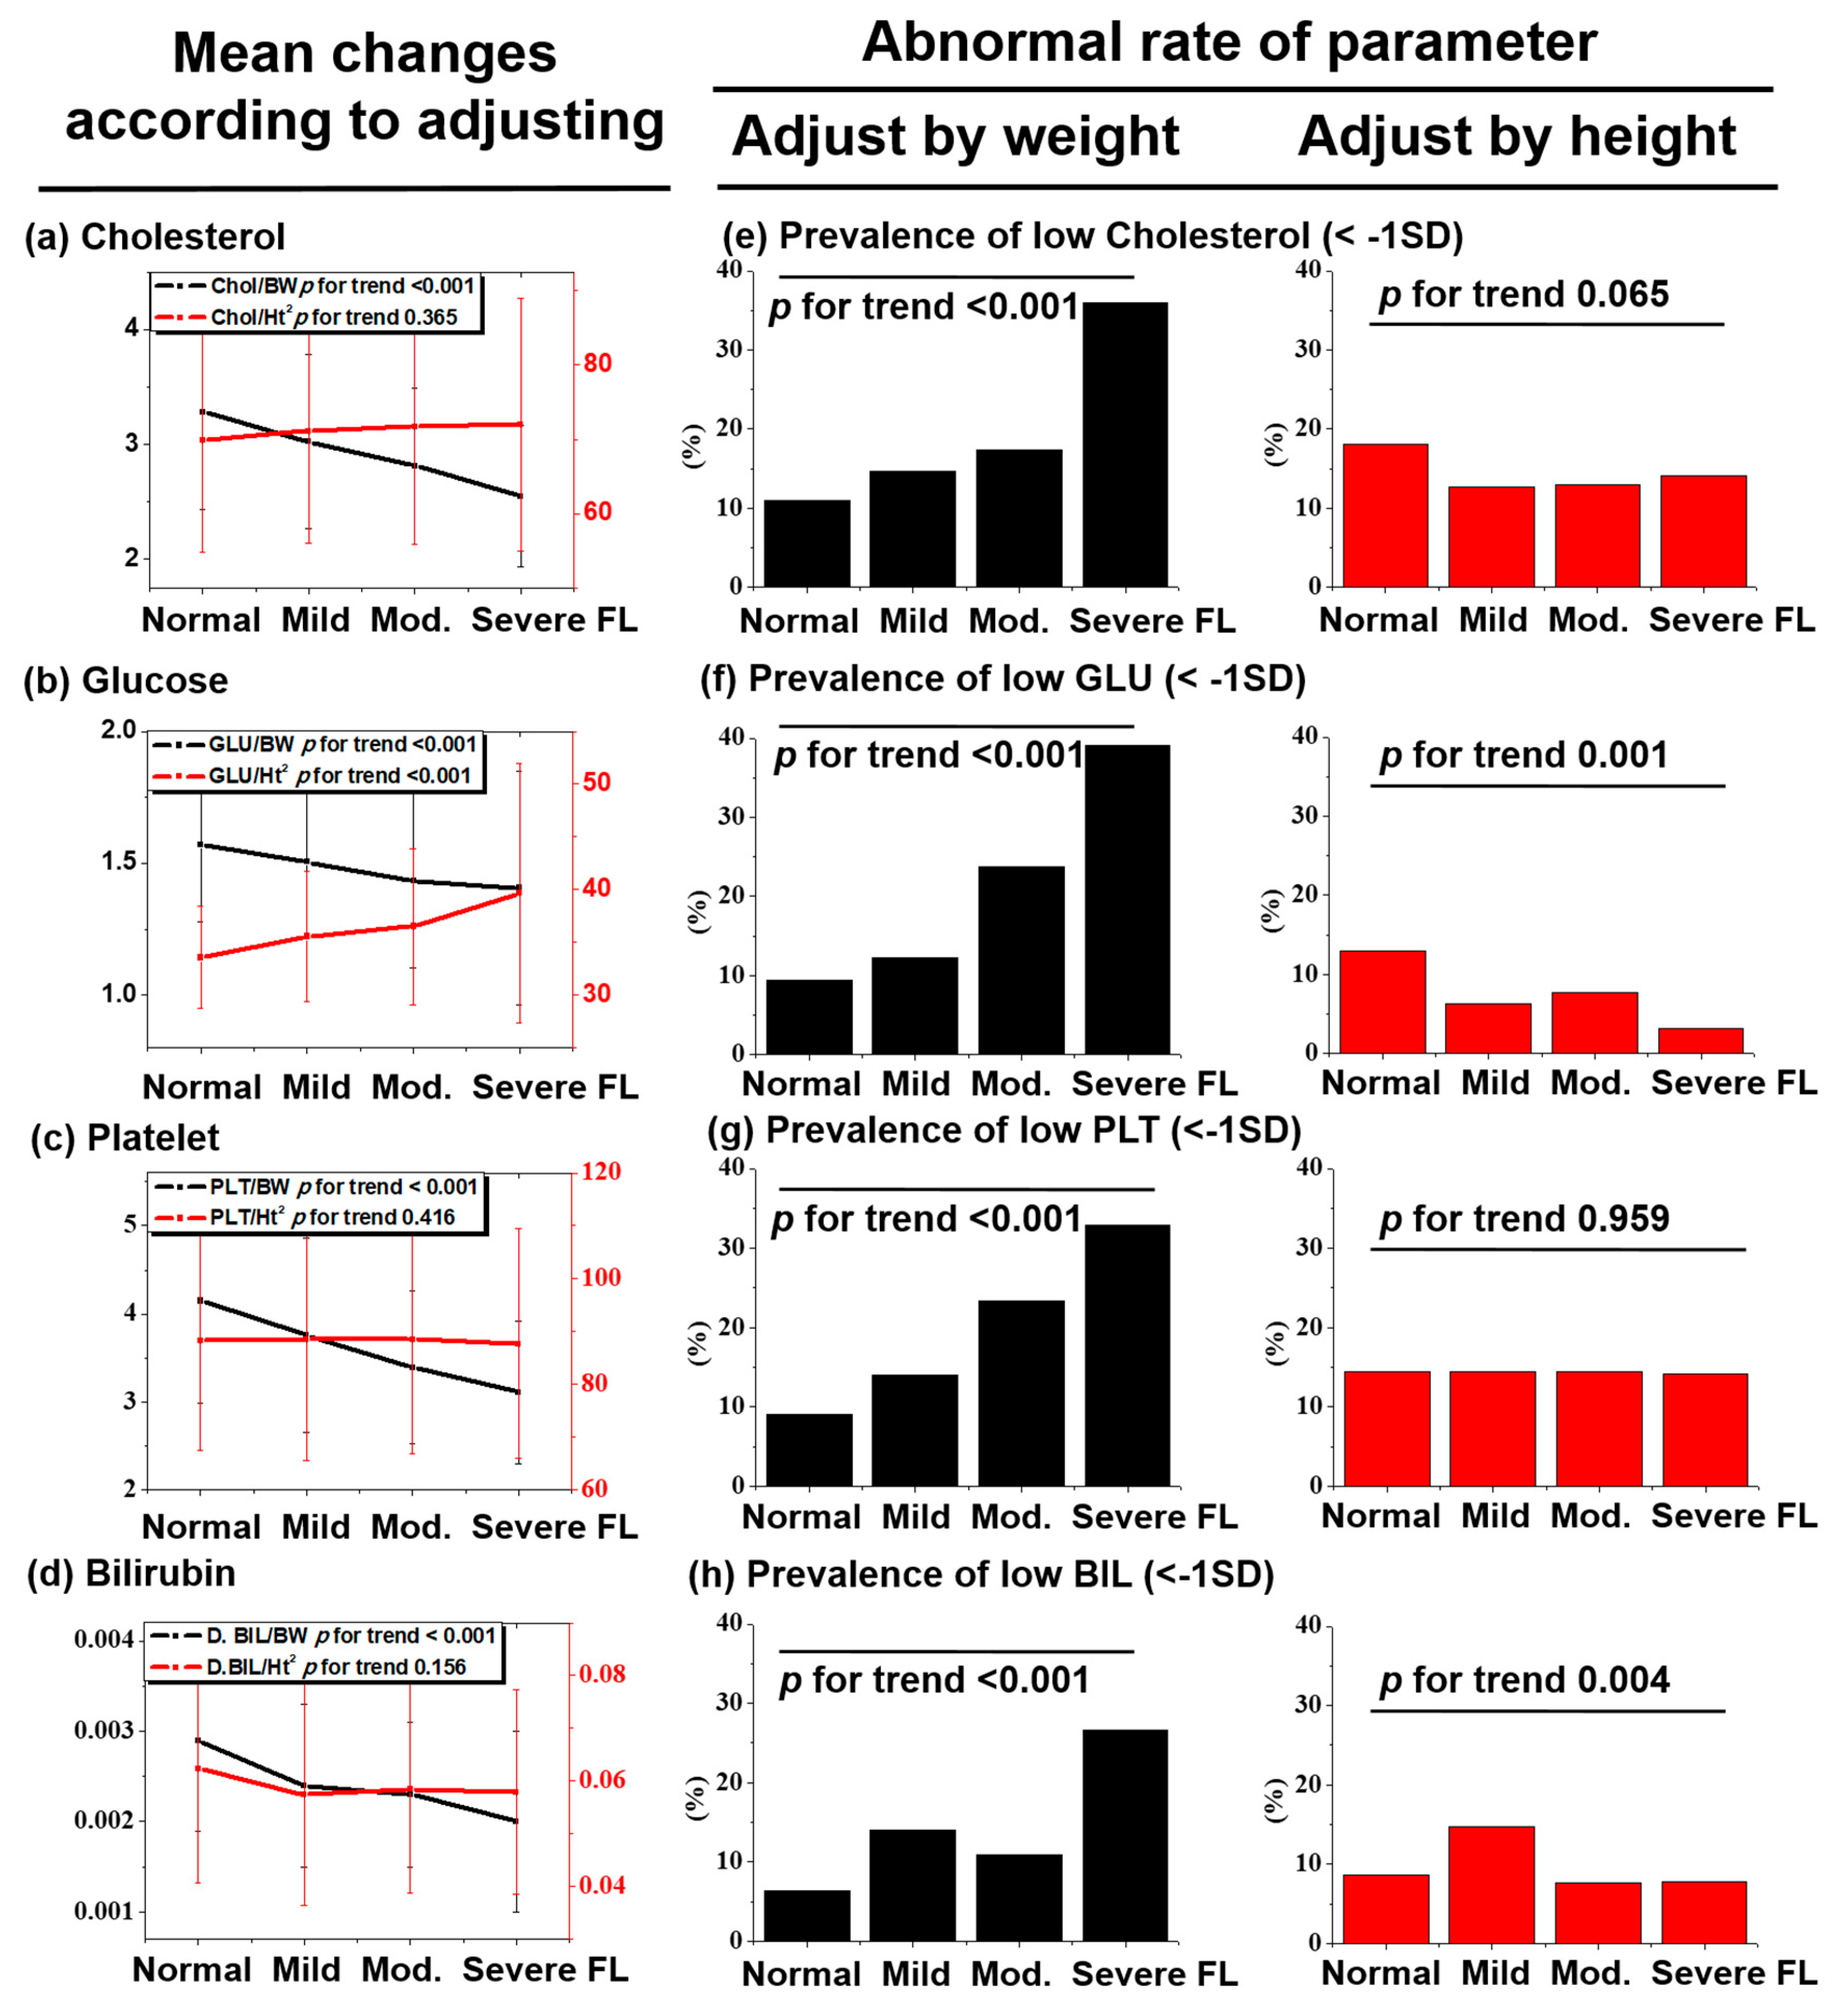
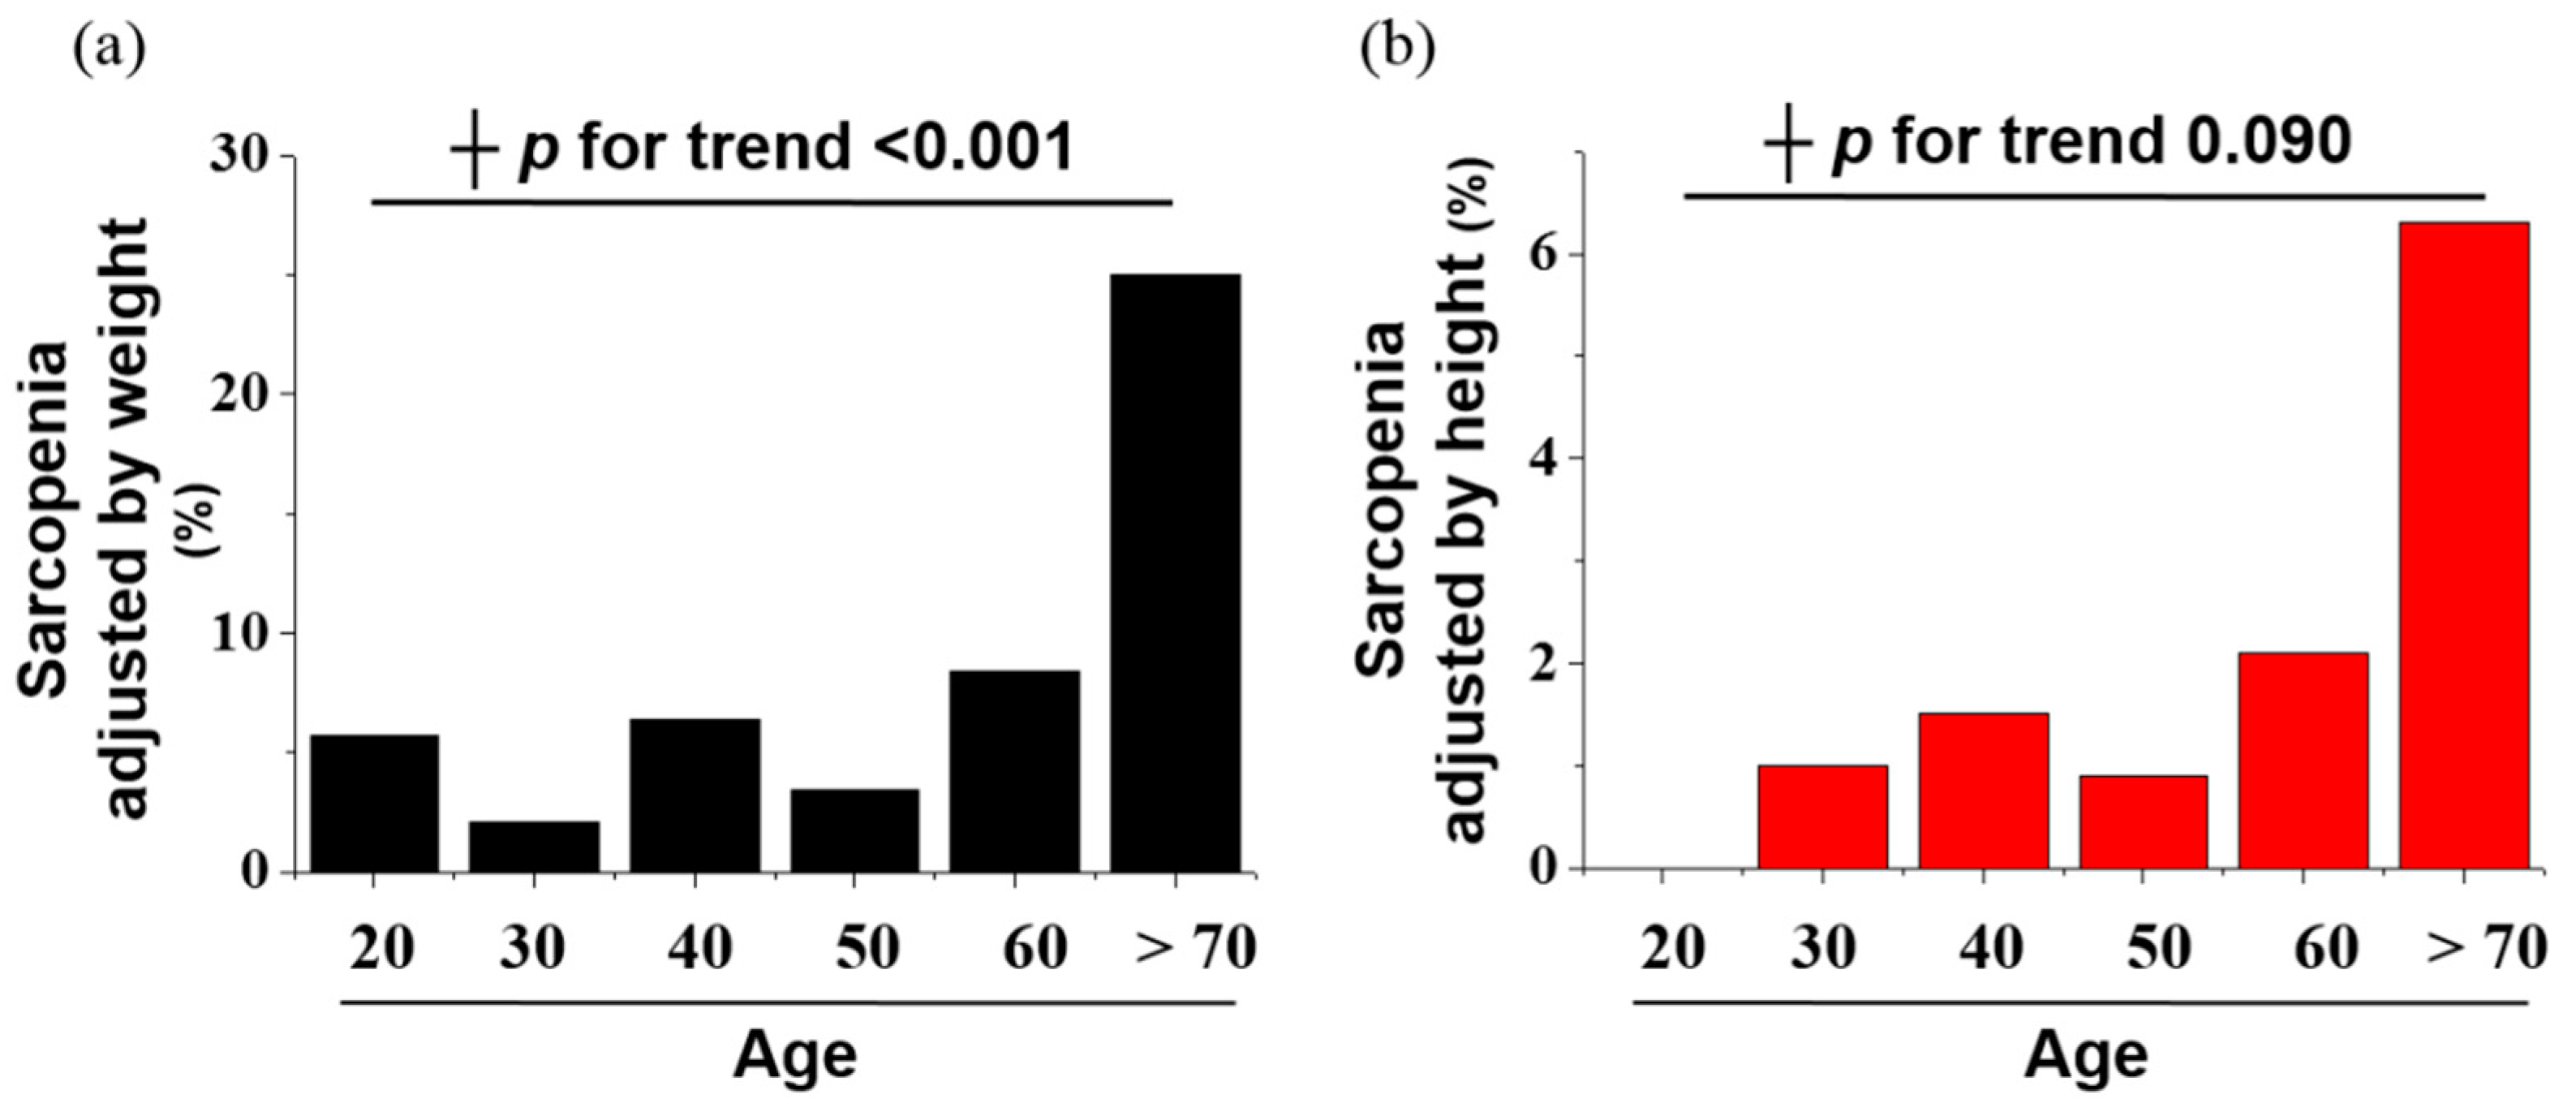
3.4. Pitfalls and Risk of the Weight Adjustment Method in NAFLD
3.5. Risk Factors for NAFLD Determined with Multivariate Analysis
4. Discussion
Author Contributions
Funding
Conflicts of Interest
Informed Consent Statement
Abbreviations
Appendix A


| Total Subjects (N = 1343) | Normal | Mild FL | Moderate FL | Severe FL | p for Trend |
|---|---|---|---|---|---|
| (a) Age (≥20 and <40), n = 394 (29.3%) | |||||
| ASM (kg) | 19.47 (5.19) | 21.58 (4.61) | 24.08 (2.90) | 26.75 (3.15) | <0.001 |
| TSM (kg) | 25.92 (6.69) | 28.54 (6.04) | 31.14 (5.96) | 35.80 (4.62) | <0.001 |
| Fat (kg) | 14.05 (4.43) | 17.19 (5.87) | 22.01 (6.53) | 27.72 (7.96) | <0.001 |
| wSMI | 31.66 (3.65) | 31.45 (3.83) | 30.71 (2.49) | 29.62 (2.38) | 0.121 |
| bSMI (m2) | 0.9047 (0.1840) | 0.9204 (0.1799) | 0.9184 (0.1193) | 0.9244 (0.1091) | 0.870 |
| hSMI (kg/m2) | 6.77 (1.18) | 7.36 (1.06) | 8.06 (0.63) | 8.57 (0.68) | <0.001 |
| Sarcopenia n (%) | |||||
| by wSMI | 1 (0.4) | 3 (3.3) | 4 (11.1) | 4 (30.8) | <0.001 |
| by bSMI | 0 (0) | 0 (0) | 0 (0) | 1 (7.7) | <0.001 |
| by hSMI | 3 (1.2) | 0 (0) | 0 (0) | 0 (0) | 0.64 |
| (b) Age (≥40 and <60), n = 758 (56.4%) | |||||
| ASM (kg) | 18.90 (4.52) | 20.43 (4.43) | 22.79 (3.63) | 24.21 (4.10) | <0.001 |
| TSM (kg) | 25.04 (5.62) | 27.23 (5.71) | 30.20 (4.63) | 32.09 (5.26) | <0.001 |
| Fat (kg) | 14.21 (4.23) | 17.49 (5.01) | 19.86 (5.20) | 26.51 (8.22) | <0.001 |
| wSMI | 31.51 (4.04) | 30.60 (3.55) | 30.88 (3.00) | 29.05 (3.07) | <0.001 |
| bSMI (m2) | 0.8709 (0.1832) | 0.8556 (0.1666) | 0.8925 (0.1343) | 0.8478 (0.1415) | 0.112 |
| hSMI (kg/m2) | 6.82 (1.08) | 7.29 (1.01) | 7.87 (0.83) | 8.29 (0.85) | <0.001 |
| Sarcopenia n (%) | |||||
| by wSMI | 1 (0.4) | 15 (5.4) | 11 (6.4) | 11 (26.8) | <0.001 |
| by bSMI | 2 (0.7) | 14 (5.0) | 10 (5.8) | 4 (9.8) | 0.004 |
| by hSMI | 6 (2.2) | 3 (1.1) | 0 (0) | 0 (0) | 0.165 |
| (c) Age (≥60), n = 191 (14.2%) | |||||
| ASM (kg) | 17.11 (4.21) | 19.04 (4.29) | 19.26 (4.46) | 18.87 (3.28) | 0.02 |
| TSM (kg) | 22.91 (5.23) | 25.16 (5.56) | 25.21 (6.80) | 25.38 (4.19) | 0.063 |
| Fat (kg) | 15.39 (4.55) | 18.42 (4.98) | 21.39 (5.22) | 23.43 (6.93) | <0.001 |
| wSMI | 29.47 (4.03) | 29.38 (3.62) | 28.06 (4.04) | 27.11 (3.33) | 0.09 |
| bSMI (m2) | 0.7701 (0.1761) | 0.7883 (0.1641) | 0.7609 (0.1846) | 0.7139 (0.1539) | 0.598 |
| hSMI (kg/m2) | 6.54 (1.04) | 7.09 (1.04) | 7.12 (0.99) | 7.20 (0.67) | 0.003 |
| Sarcopenia n (%) | |||||
| by wSMI | 6 (8.0) | 6 (9.2) | 9 (22.0) | 3 (30.0) | 0.043 |
| by bSMI | 6 (8.0) | 7 (10.8) | 5 (12.2) | 2 (20.0) | 0.661 |
| by hSMI | 3 (4.0) | 2 (3.1) | 1 (2.4) | 0 (0) | 0.902 |
| Total Subject (N = 1343) | Prevalence of Sarcopenia | In-Concordance Rate (%) | ||
|---|---|---|---|---|
| By wSMI | By hSMI | By wSMI and hSMI | ||
| Underweight (BMI < 18.5, n = 70) | 0 (0) | 7 (10.0) | 0 | 10 (7/70) |
| Normal (BMI ≥ 18.5, <23, n = 538) | 1 (0.2) | 8 (1.5) | 1 | 1.3 (7/538) |
| Overweight (BMI ≥ 23, <25, n = 355) | 8 (2.3) | 1 (0.3) | 1 | 1.97 (7/355) |
| Obesity (BMI ≥ 25, n = 380) | 65 (17.1) | 2 (0.5) | 2 | 16.57 (63/380) |
| p for trend | <0.001 | <0.001 | - | - |
References
- Morley, J.E.; Anker, S.D.; Von Haehling, S. Prevalence, incidence, and clinical impact of sarcopenia: Facts, numbers, and epidemiology-update 2014. J. Cachex Sarcopenia Muscle 2014, 5, 253–259. [Google Scholar] [CrossRef] [PubMed]
- Tanimoto, Y.; Watanabe, M.; Sun, W.; Sugiura, Y.; Hayashida, I.; Kusabiraki, T.; Tamaki, J. Sarcopenia and falls in community-dwelling elderly subjects in Japan: Defining sarcopenia according to criteria of the European Working Group on Sarcopenia in Older People. Arch. Gerontol. Geriatr. 2014, 59, 295–299. [Google Scholar] [CrossRef] [PubMed]
- Brown, J.C.; Harhay, M.; Harhay, M.N. Sarcopenia and mortality among a population-based sample of community-dwelling older adults. J. Cachex Sarcopenia Muscle 2015, 7, 290–298. [Google Scholar] [CrossRef] [PubMed]
- Malmstrom, T.K.; Miller, D.K.; Herning, M.M.; Morley, J.E. Low appendicular skeletal muscle mass (ASM) with limited mobility and poor health outcomes in middle-aged African Americans. J. Cachex Sarcopenia Muscle 2013, 4, 179–186. [Google Scholar] [CrossRef] [PubMed]
- Pacifico, L.; Perla, F.M.; Chiesa, C. Sarcopenia and nonalcoholic fatty liver disease: A causal relationship. Hepatobiliary Surg. Nutr. 2019, 8, 144–147. [Google Scholar] [CrossRef] [PubMed] [Green Version]
- Cruz-Jentoft, A.J.; Bahat, G.; Bauer, J.; Boirie, Y.; Bruyère, O.; Cederholm, T.; Cooper, C.; Landi, F.; Rolland, Y.; Sayer, A.A.; et al. Sarcopenia: Revised European consensus on definition and diagnosis. Age Ageing 2019, 48, 16–31. [Google Scholar] [CrossRef] [PubMed] [Green Version]
- Wijarnpreecha, K.; Panjawatanan, P.; Thongprayoon, C.; Jaruvongvanich, V.; Ungprasert, P. Sarcopenia and risk of nonalcoholic fatty liver disease: A meta-analysis. Saudi J. Gastroenterol. 2018, 24, 12–17. [Google Scholar] [CrossRef] [PubMed]
- Pan, X.; Han, Y.; Zou, T.; Zhu, G.; Xu, K.; Zheng, J.-N.; Zheng, M.; Cheng, X. Sarcopenia Contributes to the Progression of Nonalcoholic Fatty Liver Disease- Related Fibrosis: A Meta-Analysis. Dig. Dis. 2018, 36, 427–436. [Google Scholar] [CrossRef] [PubMed]
- Yu, R.; Shi, Q.; Liu, L.; Chen, L. Relationship of sarcopenia with steatohepatitis and advanced liver fibrosis in non-alcoholic fatty liver disease: A meta-analysis. BMC Gastroenterol. 2018, 18, 51. [Google Scholar] [CrossRef] [PubMed]
- Cai, C.; Song, X.; Chen, Y.; Chen, X.; Yu, C. Relationship between relative skeletal muscle mass and nonalcoholic fatty liver disease: A systematic review and meta-analysis. Hepatol. Int. 2019, 14, 115–126. [Google Scholar] [CrossRef] [PubMed] [Green Version]
- Shen, H.; Liangpunsakul, S. Mo1555 Association Between Sarcopenia and Prevalence of Nonalcoholic Fatty Liver Disease: A Cross-Sectional Study From the Third National Health and Nutrition Examination Survey. Gastroenterology 2016, 150, S1143–S1144. [Google Scholar] [CrossRef]
- Zhai, Y.; Xiao, Q.; Miao, J. The Relationship between NAFLD and Sarcopenia in Elderly Patients. Can. J. Gastroenterol. Hepatol. 2018, 2018, 1–4. [Google Scholar] [CrossRef] [PubMed] [Green Version]
- Peng, T.-C.; Wu, L.-W.; Chen, W.-L.; Liaw, F.-Y.; Chang, Y.-W.; Kao, T.-W. Nonalcoholic fatty liver disease and sarcopenia in a Western population (NHANES III): The importance of sarcopenia definition. Clin. Nutr. 2019, 38, 422–428. [Google Scholar] [CrossRef] [PubMed]
- Kim, Y.-S.; Lee, Y.; Chung, Y.-S.; Lee, D.-J.; Joo, N.-S.; Hong, D.; Song, G.E.; Kim, H.-J.; Choi, Y.J.; Kim, K.-M. Prevalence of Sarcopenia and Sarcopenic Obesity in the Korean Population Based on the Fourth Korean National Health and Nutritional Examination Surveys. J. Gerontol. Ser. A Biol. Sci. Med. Sci. 2012, 67, 1107–1113. [Google Scholar] [CrossRef] [PubMed]
- Lee, Y.-H.; Kim, S.U.; Song, K.J.; Park, J.Y.; Kim, D.Y.; Ahn, S.H.; Lee, B.-W.; Kang, E.S.; Cha, B.-S.; Han, K.-H. Sarcopenia is associated with significant liver fibrosis independently of obesity and insulin resistance in nonalcoholic fatty liver disease: Nationwide surveys (KNHANES 2008–2011). Hepatology 2016, 63, 776–786. [Google Scholar] [CrossRef] [PubMed] [Green Version]
- Mittelstaedt, C. Retroperitoneum. General Ultrasound; Churchill Livingstone: New York, NY, USA, 1992; p. 749. [Google Scholar]
- Bedogni, G.; Bellentani, S.; Miglioli, L.; Masutti, F.; Passalacqua, M.; Castiglione, A.; Tiribelli, C. The Fatty Liver Index: A simple and accurate predictor of hepatic steatosis in the general population. BMC Gastroenterol. 2006, 6, 33. [Google Scholar] [CrossRef] [PubMed] [Green Version]
- Han, D.; Chang, K.-V.; Li, C.-M.; Lin, Y.-H.; Kao, T.-W.; Tsai, K.-S.; Wang, T.-G.; Yang, W.-S. Skeletal muscle mass adjusted by height correlated better with muscular functions than that adjusted by body weight in defining sarcopenia. Sci. Rep. 2016, 6, 19457. [Google Scholar] [CrossRef] [PubMed]
- Chen, L.-K.; Liu, L.-K.; Woo, J.; Assantachai, P.; Auyeung, T.-W.; Bahyah, K.S.; Chou, M.-Y.; Hsu, P.-S.; Krairit, O.; Lee, J.S.; et al. Sarcopenia in Asia: Consensus Report of the Asian Working Group for Sarcopenia. J. Am. Med. Dir. Assoc. 2014, 15, 95–101. [Google Scholar] [CrossRef] [PubMed]
- Newman, A.B.; Kupelian, V.; Visser, M.; Simonsick, E.; Goodpaster, B.; Nevitt, M.; Kritchevsky, S.B.; Tylavsky, F.A.; Rubin, S.M.; Harris, T.B.; et al. Sarcopenia: Alternative definitions and associations with lower extremity function. J. Am. Geriatr. Soc. 2003, 51, 1602–1609. [Google Scholar] [CrossRef] [PubMed] [Green Version]


| Health Check-Up Participants (N = 1343) | NAFLD (−) n = 596 | NAFLD (+) n = 747 | Hepatic Steatosis Status of Subjects With NAFLD | p-Value * | p for Trend | ||
|---|---|---|---|---|---|---|---|
| Mild FL n = 434 | Moderate FL n = 249 | Severe FL n = 64 | |||||
| Age (year) | 44.13 (13.0) | 48.94 (10.764) | 48.76 (11.2) | 49.59 (10.0) | 46.80 (10.0) | <0.001 | <0.001 |
| Sex Male (n [%]) | 238 (31.9) | 509 (68.1) | 260 (59.9) | 197 (79.1) | 52 (81.3) | <0.001 | <0.001 |
| BMI (kg/m2) | 21.64 (2.56) | 24.88 (3.07) | 23.86 (2.66) | 25.71 (2.60) | 28.54 (3.59) | <0.001 | <0.001 |
| Body weight (kg) | 59.89 (10.66) | 70.27 (11.77) | 66.48 (10.32) | 73.62 (10.26) | 82.83 (13.87) | <0.001 | <0.001 |
| Fat (kg) | 14.29 (4.37) | 19.26 (6.11) | 17.55 (5.20) | 20.43 (5.45) | 26.28 (7.97) | <0.001 | <0.001 |
| ASM (kg) | 18.92 (4.83) | 21.40 (4.47) | 20.45 (4.50) | 22.41 (3.96) | 23.89 (4.45) | <0.001 | <0.001 |
| TSM (kg) | 25.14 (6.12) | 28.36 (5.93) | 27.18 (5.83) | 29.53 (5.57) | 31.80 (5.83) | <0.001 | <0.001 |
| Height (cm) | 165.87 (8.68) | 167.70 (8.26) | 166.61 (8.25) | 168.99 (7.79) | 170.05 (9.01) | <0.001 | <0.001 |
| WC (cm) | 73.01 (7.56) | 82.73 (8.62) | 79.55 (7.60) | 85.55 (6.75) | 93.34 (9.48) | <0.001 | <0.001 |
| Platelet count (×103/µL) | 240.45 (47.43) | 244.23 (51.89) | 243 k (52.64) | 244 k (50.86) | 250 k (51.08) | 0.329 | 0.414 |
| Fasting glucose (mg/dL) | 91.60 (9.91) | 101.08 (17.13) | 98.09 (14.21) | 103.32 (17.40) | 112.64 (26.04) | <0.001 | <0.001 |
| Triglyceride (mg/dL) | 85.25 (39.43) | 144.60 (97.82) | 118.87 (66.40) | 174.21 (120.36) | 203.93 (119.85) | <0.001 | <0.001 |
| Total cholesterol (mg/dL) | 190.23 (33.41) | 199.30 (37.24) | 196.04 (35.73) | 203.22 (38.88) | 206.20 (38.88) | <0.001 | <0.001 |
| HDL Cholesterol (mg/dL) | 60.73 (12.44) | 52.42 (10.49) | 54.84 (10.77) | 49.34 (9.19) | 47.79 (8.54) | <0.001 | <0.001 |
| LDL Cholesterol (mg/dL) | 111.52 (24.46) | 122.01 (27.43) | 118.19 (26.21) | 126.98 (29.47) | 128.65 (29.47) | <0.001 | <0.001 |
| AST (IU/L) | 24.40 (9.71) | 27.99 (13.79) | 25.19 (11.98) | 30.18 (13.79) | 38.45 (18.25) | <0.001 | <0.001 |
| ALT (IU/L) | 19.13 (9.47) | 29.71 (23.49) | 22.68 (15.75) | 35.73 (27.04) | 54.54 (28.89) | <0.001 | <0.001 |
| GGT (IU/L) | 19.08 (15.64) | 31.25 (29.55) | 24.72 (22.61) | 37.08 (32.83) | 52.84 (41.04) | <0.001 | <0.001 |
| T. Bil (IU/L) | 0.90 (0.36) | 0.902 (0.345) | 0.87 (0.33) | 0.93 (0.31) | 0.97 (0.45) | 0.789 | 0.015 |
| Prevalence of sarcopenia, n (%) | |||||||
| ASM/BW*100 | 8 (1.3) | 66 (8.8) | 24 (5.5) | 24 (9.7) | 18 (28.1) | <0.001 | <0.001 |
| ASM/BMI | 8 (1.3) | 43 (5.8) | 21 (4.8) | 15 (6.0) | 7 (10.9) | <0.001 | <0.001 |
| ASM/Ht2 | 12 (2.0) | 6 (0.8) | 5 (1.1) | 1 (0.4) | 0 (0) | 0.055 | 0.284 |
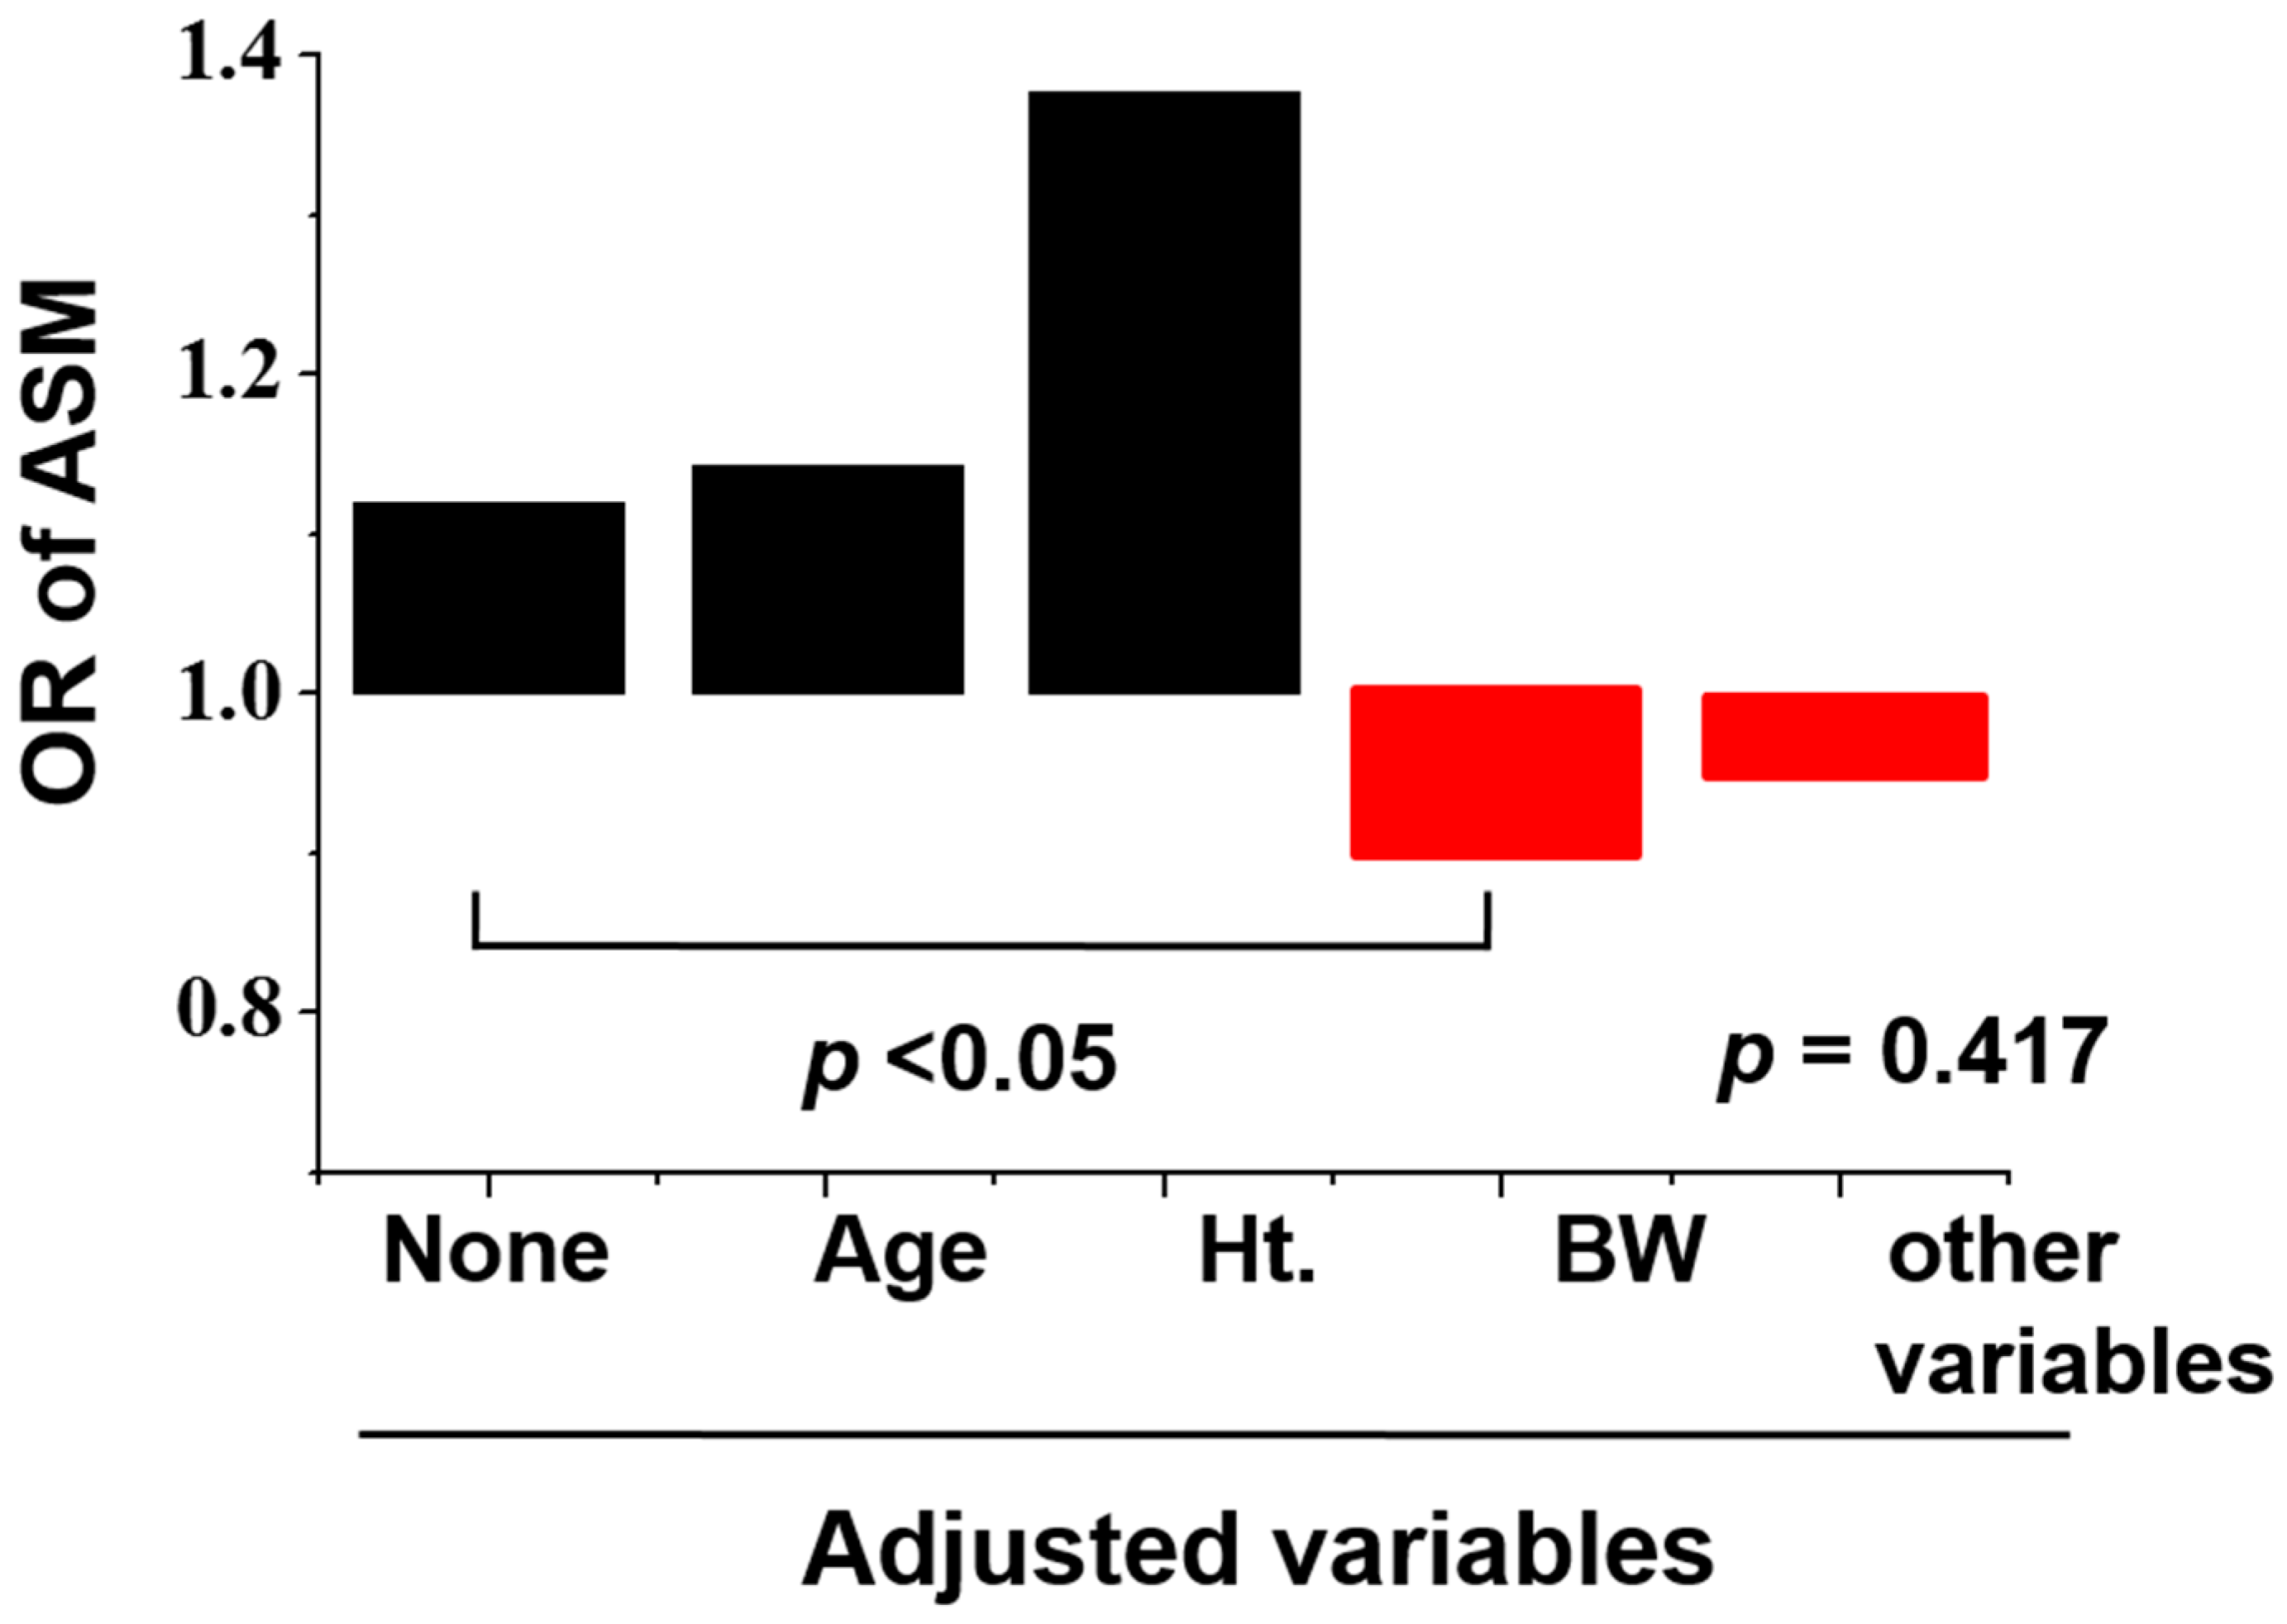
| Odds Ratio of ASM | NAFLD (−) | NAFLD (+) | 95% CI | p-Value |
|---|---|---|---|---|
| Unadjusted | 1 | 1.12 | 1.093–1.147 | <0.001 |
| Model 1 (age) | 1 | 1.143 | 1.114–1.172 | <0.001 |
| Model 2 (+height) | 1 | 1.378 | 1.298–1.462 | <0.001 |
| Model 3 (+weight) | 1 | 0.899 | 0.821–0.985 | 0.022 |
| Model 4 (+metabolic parameters) | 1 | 0.948 | 0.833–1.079 | 0.417 |
© 2020 by the authors. Licensee MDPI, Basel, Switzerland. This article is an open access article distributed under the terms and conditions of the Creative Commons Attribution (CC BY) license (http://creativecommons.org/licenses/by/4.0/).
Share and Cite
Park, H.; Jun, D.W.; Park, H.-k.; Park, K.-Y.; Kim, M.; Hwang, H.-S. A Critical Appraisal of the Definition of Sarcopenia in Patients with Non-Alcoholic Fatty Liver Disease: Pitfall of Adjusted Muscle Mass by Body Weight. Life 2020, 10, 218. https://doi.org/10.3390/life10100218
Park H, Jun DW, Park H-k, Park K-Y, Kim M, Hwang H-S. A Critical Appraisal of the Definition of Sarcopenia in Patients with Non-Alcoholic Fatty Liver Disease: Pitfall of Adjusted Muscle Mass by Body Weight. Life. 2020; 10(10):218. https://doi.org/10.3390/life10100218
Chicago/Turabian StylePark, Huiyul, Dae Won Jun, Hoon-ki Park, Kye-Yeung Park, Minki Kim, and Hwan-Sik Hwang. 2020. "A Critical Appraisal of the Definition of Sarcopenia in Patients with Non-Alcoholic Fatty Liver Disease: Pitfall of Adjusted Muscle Mass by Body Weight" Life 10, no. 10: 218. https://doi.org/10.3390/life10100218