Monitoring of Changes in Land Use/Land Cover in Syria from 2010 to 2018 Using Multitemporal Landsat Imagery and GIS


Department of Geography, Humboldt University of Berlin, 10099 Berlin, Germany
*
Author to whom correspondence should be addressed.
Land 2020, 9(7), 226; https://doi.org/10.3390/land9070226
Submission received: 3 June 2020
/
Revised: 1 July 2020
/
Accepted: 6 July 2020
/
Published: 11 July 2020
(This article belongs to the Section Land Systems and Global Change)
Abstract
:Understanding the effects of socio-ecological shocks on land use/land cover (LULC) change is essential for developing land management strategies and for reducing adverse environmental pressures. Our study examines the impacts of the armed conflict in Syria, which began in mid-2011, and the related social and economic crisis on LULC between 2010 and 2018. We used remote sensing for change detection by applying a supervised maximum likelihood classification to Landsat images of the three target years 2010, 2014, and 2018. Based on the computed extent of our LULC classes and accuracy assessment, we calculated area-adjusted estimates and 95% confidence intervals. Our classification achieved an overall accuracy of 86.4%. Compared to 2010, we found an increase in spatial extent for bare areas (40,011 km2), forests (2576 km2), and urban and peri-urban areas (3560 km2), whereas rangelands (37,005 km2) and cultivated areas (9425 km2) decreased by 2018. It is not possible to determine whether the changes in LULC in Syria will be permanent or temporary. Natural conditions such as climate fluctuations had an impact on the uses of the natural environment and cultivated areas during the study period, especially in regions suffering from water stress. Although seasonal precipitation patterns and temperature affect LULC change, however, we could not identify a prevailing climate trend towards more drought-prone conditions. Our analysis focuses on (potential) direct and indirect implications of the Syrian conflict on LULC change, which most notably occurred between 2014 and 2018. Conflict-related main drivers were human activities and demographic changes, which are mainly attributable to large-scale population displacement, military operations, concomitant socio-economic status, and control of local resources. As the study provides quantitative and qualitative information on the dynamics of LULC changes in Syria, it may serve as a framework for further relevant conflict-related research and support planning, management practices, and sustainable development.
1. Introduction
In the face of a growing world population, changing demands of land-based products, environmental changes and feedbacks, and increasing global interconnectivity due to ongoing globalization processes, understanding the diverse and complex interactions of social-ecological land systems and linkages across different scales remains a major challenge. Changes in land use/land cover (LULC) can result in direct and indirect impacts on natural habitats, biodiversity, and terrestrial landscapes. Hence, the conversion processes of LULC are a major driver in global environmental change [1,2,3,4]. As land cover is defined as the combination of biotic and abiotic components on the Earth’s surface, it includes water bodies, natural vegetation (grassland, forests), bare rock/soil, and other natural components. By contrast, land use comprises cultivated areas, urban or built-up land, pastures, recreational green areas, managed woods, and is therefore considered an induced modification of natural land cover [1]. Monitoring and mapping changes in LULC is pivotal for environmental management, land and water resource sustainability, and regional and urban planning needs.
Given surges in the socioeconomic trends of the great acceleration [2], multiple interrelated “high-level” driving forces of current and future LULC changes can be identified. The world population is estimated to rise to 11 billion people by 2100 [5] and more than 90% are expected to live in cities by 2100, with both processes being particularly prevalent in Africa and Asia [6]. Furthermore, rising living standards, rising consumption, and changing diets towards a more meat-rich nutrition increase the demand for land-based products [7]. Economic globalization and interconnectivity increase land competition of land uses, as land is becoming a scarce resource at a global scale [8]. Environmental feedbacks, e.g., soil degradation, changing precipitation patterns, and climate change, can also cause LULC conversion processes.
Generally, LULC changes are caused by either anthropogenic drivers or natural forces, or a combination of both [9]. Anthropogenic drivers of LULC include proximate and underlying causes [9]. Proximate causes are human activities including both the slow drivers of change such as demographic changes or industrialization and rapid drivers such as armed conflicts, revolutions, and socioeconomic shocks [10,11,12]. Proximate causes have an impact at the local level that directly modify or completely alter the LULC, potentially leading to structural changes in complex social-ecological systems. Underlying causes of LULC change are socio-economic, biophysical, cultural, technological drivers at national, regional, and global levels. These drivers do not occur in isolation but show complex interactions between levels of organization, as well as spatial and temporal patterns [3,10,13,14].
According to Müller et al. (2014), regime shifts in land systems can be triggered by the gradual accumulation of pressures or by sudden events, i.e., by drastic and rapidly occurring shocks [15]. Civil war (hereinafter referred to as “conflict”) is among the most immediate occurring shocks and widely affects both the physical structures on Earth’s surface and societies, as it causes internal and external displacement of the population [16,17]. Human-induced abrupt landscape changes often persist over decades or even centuries [14,16,18]. Armed conflicts around the world have led to severe economic, social, demographic, and political implications for the lives and livelihoods of the population [19,20,21,22]. However, natural systems may profit from warfare as destruction, contamination, or population displacement leads to a reduction of human pressure and can thus have beneficial consequences for biodiversity and nature rehabilitation [17]. A well-known example is the former war zone between North and South Korea, where demilitarization and abandonment since 1953 has re-established wildlife populations and formed a unique, thriving natural habitat [23,24]. Most immediate conflict-induced changes usually occur within and near the actual combat zone (local impacts), normally limited to small areas. Local impacts are decisive for either increased or reduced pressure on LULC. Several scenarios indicate that armed conflict has detrimental impacts on land-based resources, especially vegetation and wildlife [25,26]. Areas of armed conflict are usually characterized by lawlessness or the breakdown of the state and its legal structures, leading to significant environmental losses due to high pressure on natural resources caused by the displaced population through food and fuel shortages [27,28]. In particular, the introduction of displaced populations from conflict areas into new landscapes entails uncontrolled exploitation of local resources if they cannot be accommodated in existing settlements [12,29,30]. Thus, fragmentation of the landscape is intensified, land degradation is increased, water demand is increased, and forest loss is amplified through the acquisition of new land for agriculture, access to fuel, and raw materials for construction [12,29,30]. However, changes in land-use patterns occur primarily within and near densely populated urban environments [31,32]. Moreover, mass migration during wars, especially in combat zones, may lead to substantial abandonment of agricultural land [33,34,35], increasing or decreasing logging [16], forest fires [36,37], and destruction of settlements [38,39]. Nonetheless, land use activities and urban growth can also intensify far away from battle zones, as the displaced population exerts increased pressure through economic activities and increasing population density [40]. The effects of armed conflicts on land systems are very complex and linked to the prevailing circumstances, as they occur manifold and not unidirectional [17].
Remote sensing (RS) data and techniques in combination with geographic information systems (GIS) are widely used to analyze and characterize LULC and its changes, which helps in land use planning and modeling. Satellite imagery provides an efficient and cost-effective way to monitor and map different patterns of LULC in a variety of spatial and temporal scales [41,42]. As the launch of the first satellite of the Landsat family in 1972, the Landsat data series are the longest-running record of Earth observation and monitoring. Landsat images are organized in an online archive and available free of charge since 2008 [43,44]. Due to their fine spatial resolution, their suitable spectral bands, and their practical processing capabilities, Landsat images have widely been used to investigate spatial and temporal dynamics of LULC change [45,46,47,48,49,50,51,52,53].
Research linking remote sensing images and change of conflict-related LULC is limited but growing. Most research focuses on the amount of change in LULC rather than on spatial configuration within certain properties. Several studies have measured land cover change statistics, deforestation, urbanization, and loss of biodiversity [16,17,18,19,20,21,25,26,27,28,29,31,32,33,34].
These investigations focus on either direct impacts of conflicts resulting from bombing, military movements, and proliferation of minefields or indirect impacts of conflicts on LULC that are mainly driven by population displacement and its consequences. Remote sensing data have increasingly been used to monitor the spatial changes of land use within and around refugee camps, focusing on more efficient management as well as assessing the impact of displaced populations on forest cover [3,21,54,55,56,57,58,59]. Smith’s study (1996) used remote sensing data to examine agricultural productivity and its decline in areas of armed conflict [60]. Some scientists, such as Haavisto (2003), have revealed the impact of conflicts on deforestation [61].
The armed conflict in Syria began in mid-2011. Since 2012, millions of Syrians have been displaced both inside and outside the country. Assessing the impacts of conflict and migration on LULC in an active war zone such as Syria remains a major challenge. Generally, estimates of land-use changes in certain regions of Syria are based on government reports, field observations, group interviews, and questionnaires. A satellite-based approach to land use classification can considerably improve assessment methods and provide complementary and independent numbers.
Recent studies to monitor changes in the LULC during the armed conflict in Syria have been limited to small spatial extents. Müller et al. (2016) limited their research to exploring war-related LULC change and transboundary freshwater resources in a small area in southern Syria where large numbers of Syrian refugees were concentrated on the Syria–Jordan border [62]. The study by Hammad et al. (2018) investigated LULC changes in coastal basins in western Syria [63]. Both studies indicate, firstly, rapid LULC changes during the war and, secondly, a relationship between land alteration and mass migration of refugees. Implications of armed conflicts on LULC are not consistent, but heterogeneous and depend on varying local and regional contexts. In addition to the prevailing war, it is important to consider the influence of climate variability and socio-economic impacts as additional drivers for LULC change. The study by Müller et al. (2016) also examined the impact of climatic conditions, such as droughts, on LULC [62]. It shows that drought, besides the conflict, had an impact on the change in the extent of land uses, especially irrigated agricultural land in southern Syria, as well as on the change in the volume of surface water stored in reservoirs and dams. So far, no studies have investigated the overall and independent impact of climate variability on LULC during the Syrian conflict. There was a study by Houmsi et al. (2019) that examined the temporal and spatial trends of drought for the period prior to the conflict from 1951–2010 and its impact on the shift of the climate conditions of agricultural land from humid to dry-subhumid and from dry-subhumid to semi-arid [64].
By integrating remote sensing (RS), geographic information systems (GIS), and available socio-demographic data, this study aims (1) to monitor changes of LULC since the outbreak of the Syrian conflict, (2) to identify the direction and patterns of spatial and temporal dynamics of LULC change, and (3) to determine the role of proximate drivers behind the dynamics of these changes with a focus (potential) direct and indirect drivers of the conflict situation in Syria. For the remote sensing analysis, three target years were selected to track LULC changes, 2010, 2014, and 2018. By understanding the impacts of driving forces on LULC patterns in Syria during the study period, this study aims to help to minimize the adverse environmental implications for socio-ecological systems. In addition, the study may contribute to spatial planning and sustainable development as well as land-use planning in urban areas in Syria.
2. Study Area
2.1. Location, Demarcation, and Climate
The Syrian Arab Republic (hereinafter, Syria) is a country in Western Asia located on the eastern coastline of the Mediterranean Sea. Its geographical location extends between latitudes 32° and 38° N, and longitudes 35° and 43° E with a total area of 185,180,000 km2 [65]. Syria is administratively subdivided into 14 governorates, with the capital city Damascus, which today is the largest city in terms of population (Figure 1).
According to classification by Köppen, the prevailing climates in Syria are defined as a warm desert climate and warm semi-arid climate in the east and warm Mediterranean climate in the western part [65] Syria’s climate is characterized by seasonality and is therefore determined by significant differences in precipitation and temperature, with summers being warm to hot and dry, while the winters are rainy, cool, and relatively humid. The amount of precipitation in winter ranges between 45% and 65% of annual precipitation. Spring and autumn often appear as short transitional seasons in Syria’s climate [65]. The average annual precipitation in Syria is 252 mm [66]. In general, precipitation decreases in Syria when moving from north to south and from west to east. Precipitation in Syria also increases with rising altitude. In general, precipitation decreases in Syria when moving from north to south and from west to east and usually reaches its maximum in January. Rainfall in Syria also increases with rising altitude (Figure 1) [65]. Precipitation is characterized by the heterogeneity between the coast and the interior, and therefore the annual rainfall averages vary from one region to another [65,66]. In summary, three distinctive regions can be distinguished. Firstly, coastal regions that are characterized by high average annual rainfall up to about 1400 mm. Secondly, inland areas adjacent to coasts with average annual rainfall reaching from 250 mm in southern regions to 600 mm in northern and northeastern regions. Thirdly, Al-Badia regions (steppe), accounting for about 60% of the country’s area, with average annual precipitation not exceeding 150 mm [65,66]. Annual temperature ranges are relatively large, with average temperatures of flat terrain areas around 35 °C in summer and 12 °C in winter. Daily temperature ranges are also relatively high, reaching on the same day about 23 °C in inland areas and about 13 °C in coastal areas. The temperature often falls below 0 °C in winter, but rarely below −10 °C in all regions except for coastal areas in the west of the country. In summer, places such as the Al-Badia (steppe) experience high temperatures which may often reach 45 °C.
The current population estimate of Syria is roughly 13.3 million people, according to the international organizations and the Central Bureau of Statistics (CBS) in Syria [69,70]. Prior to the Syrian conflict in 2011, the population of Syria was more than 23.5 million people, of whom 47% lived in rural areas [71]. The conflict resulted in considerable devastation in Syria, which triggered a population loss of about 43%, which included displaced people, deaths, and missing persons [69,70]. The rate of natural increase of the population within the country was 2.5% for the period 2010–2018 [69,71]. It is now estimated that about half of the population lives in major cities [66,69]. LULC in Syria are classified into four major groups as follows [65,71]: (1) Cultivable land (6.2 million hectares, ha). The cultivated land area is estimated at 5.7 million ha or 94% of the cultivable land, which accounts for only 33% of the total area of Syria. About 62% of the cultivated area is located in the three northern governorates (Aleppo, Ar-Raqqa, and Al-Hasakeh); (2) uncultivable land (3.7 million ha, 20% of the total area of Syria) includes buildings, public utilities, bare land, rocky land, and rock and water bodies; (3) rangeland, steppe and desert land (8.2 million ha, 44% of the total area of Syria), which are used as pastures during the years of adequate rainfall for grazing; (4) forest and wooded areas (0.6 million ha, 3%).
2.2. Development Stages of Influence and Control in Syria from the Outbreak of the Conflict in 2011 until 2018
As LULC changes detected in this study took place during the conflict years, they are therefore related in one way or another to conflict circumstances and areas of control of the conflicting parties. Thus, it is important to describe the development stages of influence and control across Syria from the outbreak of the conflict until 2018. Since the outbreak of the Syrian Revolution in 2011, leading to an open civil war and border disputes with external forces, the control of various regions has been subject to several changes as illustrated by the following chronology of events [72,73]. Figure 2 provides a temporal representation (2010, 2014, and 2018) of the below-described changes in area control among the warring parties.
- March 2011—The first protests against the regime quickly spread across the country and security forces respond with arrests and shootings.
- July 2011—The insurgency becomes an armed uprising with increasing support from Turkey, Western and Arab states.
- June 2012—The Syrian opposition forces, which includes the so-called Free Syrian Army and Islamist groups with their various organizations and ideological background, take control of several Syrian governorates. Affected regions are the northern parts of Aleppo governorate on the Turkish border, some neighborhoods of Homs city, the western parts of Homs governorate, parts of Rural Damascus governorate, located in Eastern Ghouta in the east of Damascus city, and small parts of Hama and Idleb governorates.
- July 2012—The armed Syrian opposition launches an offensive in Aleppo, the country’s second-largest city, and controls several areas of the city after taking command of the entire northern part of Aleppo province. Afterward, the war escalates and the first inhabitants abandon their dwellings to flee.
- June 2013—The armed Syrian opposition has taken control of almost the entire Idleb governorate, the western, northern and eastern parts of Aleppo governorate, all governorates of Ar-Raqqa, Deir-ez-Zor, the southern parts of Dara governorate in the south of the country, parts of Rural Damascus governorate such as Eastern Ghouta, areas adjacent to the Lebanese border and parts of southwestern of Homs Governorate.
- October 2013—Regime army regains control of parts of Homs and Idleb governorates. At this stage, the administrative sector of the Syrian opposition has expanded to include large parts of the Dara regime.
- January 2014—After the Islamic State of Iraq and Syria (ISIS) has detached itself from Al-Qaeda and proclaimed a caliphate in Iraq and Syria, it takes control of the Ar-Raqqqa governorate and then expands its dominance of vast territories in Syria and Iraq.
- September 2014—ISIS control has expanded to cover most of Al-Hasakeh, Deir-ez-Zor, and large parts of Aleppo, Homs, Hama, and Rural Damascus governorates.
- September 2014—The United States establish an international coalition against ISIS and launch airstrikes to restrain the advance of the ISIS, helping the so-called Syrian Democratic Forces (SDF, Kurdish forces).
- March 2015—Syrian opposition forces conquer Idleb province in northwestern Syria.
- September 2015—Russia joins the war in support of the Syrian regime, deploys fighter planes on the Syrian coast, and provides military aid, putting the conflict quickly at a standstill.
- August 2016—The SDF regains control of large parts of Al-Hasakeh, Raqqa, and Aleppo governorates east of the Euphrates River. Turkey supports Syrian opposition forces in Aleppo province, while ISIS is being expelled from a large area in the east of the province.
- December 2016—After months of siege and bombardment, Syrian regime forces and their allies have taken full control of Aleppo city.
- January 2017—Russia, Iran, and Turkey meet in Astana, Kazakhstan, to resolve the Syrian situation, in parallel with the volatile peace efforts supported by the United Nations. The de-escalation zones in Syria were established by an agreement between these countries [74]. Areas of de-escalation included northwestern Syria (Idleb governorate and the surrounding area, parts of Hama, Lattakia and Aleppo governorates) as well as areas in central and southern Syria (Homs and Dara Governorates).
- November 2017—The Syrian democratic forces supported by the USA take control of the city of Ar-Raqqqa, the capital of ISIS. Thus, the Eastern Euphrates region, which consists of the Al-Hasakeh governorate and parts of Ar-Raqqa and Deir-ez-Zor governorates, is under the full control of these forces. Simultaneously, the regime’s army dominates the areas of the ISIS located in the governorates of Deir-ez- zor, Ar-Raqqa, Homs, Aleppo, and Rural Damascus governorates in the west of the Euphrates River. The ISIS is thus losing almost the entire previously occupied area.
- April 2018—Regime forces regain control of Ghouta in rural Damascus regime and recapture enclaves commanded by opposition forces in central Syria in rural Damascus, Homs, and Hama regimes.
- September 2018—A new agreement is reached between Russia and Turkey. The objective of this agreement is to freeze the combat operations and to maintain the ceasefire in these areas, the de-escalation zones.
3. Materials and Methods
3.1. Data Source
To analyze changes in LULC between 2010 and 2018 in Syria, we used images of the Landsat-5 Thematic Mapper (TM) and Landsat-8 Operational Land Imager (OLI) from the Landsat archive [75] with a spatial resolution of 28.5 m and 30 m, respectively. These images contain radiometric information of three visible and three infrared bands with spectral characteristics suitable for monitoring changes in LULC [18,76,77]. The list of Landsat TM/OLI imagery we acquired is given in Table 1.
In general, due to photosynthetic activity, the growing season is more convenient for monitoring and mapping vegetation cover than the dormancy period [78]. The main planting season in Syria is the rainy season from January to February [65]. In this season, most winter crops of cereals and legumes are grown all over Syria to avoid the risk of frost. We selected Landsat images of May and April to capture maximum vegetation cover, as winter crops reach their green peak during this reference period [65]. It is often difficult to obtain cloud-free scenes above the coastal mountain range due to high cloud cover in March and April. Due to the lack of suitable images, we had to resort to scenes from the years 2015 and 2017 in two cases.
Supplementary data can be integrated as external inputs for remotely sensed data in a classification process according to different concepts [79]. Despite a lack of field observations due to the conflict in Syria, there was sufficient auxiliary data to identify the characteristics of the natural environment and land uses in the study area. The valuable data included the Google-Earth archive, topographic maps of various scales ranging from 1/25,000 to 1/100,000 covering the whole of Syria, and an assessment study of the International Center for Agricultural Research in the Dry Areas (ICARDA) [80]. We used these data as ground control points (GCPs) and accordingly as reference points for the geometric correction of Landsat images. In addition, we utilized the data to train the classifier, to assess the accuracy of the classification and to better visually interpret the Landsat images by deepening the background knowledge on land use in the study area.
3.2. Pre-Processing of the Satellite Data
Figure 3 illustrates the methodological processing steps we performed to analyze LULC dynamics changes during the study period. Although the Landsat imagery level 1G used is radiometrically and geometrically corrected by the USGS, difficulties may counter when applying the polygon-based mosaic classification due to different atmospheric conditions [65]. We accounted for this by implementing geometric corrections, atmospheric corrections, best bands composite selections, and final subsetting in the pre-processing. In addition, pre-processing procedures for coarse and medium spatial resolution data, such as Landsat images, have a great benefit in presenting the objects of these images and in increasing visual interpretability [81].
We rectified and coregistered the Landsat images using a second-order polynomial model. This procedure is the most commonly used for the geometric correction of Landsat images since it is simple and fast, does not change the digital number value of pixels nor does it require additional sensor geometry data [82,83,84].
Based on this model, we reconstructed raw Landsat images by using the nearest neighbor resampling algorithm for all bands. Furthermore, we calculated the root-mean-squared-error (RMSE) to ensure the correctness of the GCPs selected. We found the RMSE to fall below critical thresholds, assuring the quality level and excluding distortion. [81,85]. Primarily, we performed the atmospheric correction to eliminate radiation imbalances and atmospheric impacts caused by scattering, absorption, and reflection using the software ENVI 5.3 [86,87,88]. We further processed the mosaic datasets (images) in ArcGIS 10.4 to isolate spectral bands that are highly correlated to avoid data redundancy at the edges during image classification [89].
3.3. Classification Uncertainties and Controls
The medium spatial resolution of the Landsat imagery and the spatial overlaps among LULC classes with a small spatial extent can result in spectral overlap, i.e., mixed pixel problems, which in turn can lead to erroneous classifications.
One of the issues encountered is the classification of planted lands with trees, especially rainfed lands, in bare areas. Extensive cultivated lands are spread over light-colored soils. Images of these lands in Google Earth showed that each pixel of Landsat satellite data typically contains between 10 and 16 trees. Therefore, it may be difficult to classify such disperse vegetation features with satisfactory accuracy on Landsat images. The spatial resolution of Landsat imagery was sufficient to distinguish irrigated tree crops and bare lands. Despite the difference in growth between rainfed and irrigated winter crops in Syria, particularly wheat and barley, the areas of these crops are homogeneous and similar in relation to spatial and spectral discrimination [65]. Therefore, it was necessary to include a series of Landsat images to identify the maximum growth dates for these crops, which are from mid-April until the beginning of May. This makes it possible to classify areas planted with these crops as agricultural land, as well as to distinguish between cultivated areas and bare lands according to the seasonal growth periods. The bare areas in Syria show great diversity, reflecting the geological structure and the complex topographic situation. Errors may arise due to low spectral separation of LULC classes and consequent misclassifications, especially in heterogeneous areas with mixed pixels at a small scale. Similar uncertainties arise with spectral and spatial overlaps between urban areas (built-up areas) and agricultural areas. This mainly concerns lands that fell fallow during the conflict or regions where spectral and spatial mixing between military artificial surfaces, urban areas, and bare areas occurred. We applied mask function in ArcGIS to separate different LULC from each other. A spectral and spatial overlap may also occur between natural water bodies and agricultural lands in the river beds, especially along the river Euphrates. These agricultural lands may be flooded with water as a result of changes in water capacity in spring, both due to natural conditions and the amount of water being released from the operation of dams in Turkey [65]. In addition, the impacts of the conflict on the area of actually cultivated land and water resource management practices need to be considered. To minimize classification uncertainty, the size and amount of training data in those regions were extended to provide better constraints for the classifier. We accounted for the bandwidth difference between Landsat 5 TM and Landsat 8 OLI sensors by applying an atmospheric correction. However, a study by Roy et al. (2015) identified higher reflectance of OLI sensors and that although atmospheric correction reduced differences in the NIR and the SWIR bands, the magnitude of the mean sensor reflectance differences in the visible bands increased [90]. Thus, any remaining impact on classification and change detection cannot be ruled out completely.
3.4. Ground Truth Data, Image Classification, and Accuracy Assessment
Various reviews and comparisons of detecting LULC changes with remote sensing-based techniques have been conducted with little consensus on optimal method for this purpose [91,92,93,94,95], including unsupervised classification (ISODATA-method), supervised classification and multistage supervised approaches (maximum likelihood classifier, neural network classifier, support vector machines). The maximum likelihood classifier (MLC) is a supervised classification approach that has been successfully used in studies conducted in comparable semi-arid environments with similar remote sensing data [46,63,65,84]. Therefore, we selected the widely used MLC algorithm due to its robustness, reliability, and its application suitability regarding our study area. The MLC-classifier requires training samples based on individual or composite spectral bands and, when applied, assigns pixels based on the maximum likelihood to the corresponding class.
We trained the MLC classifier with representative data assigned to all LULC classes that we derived from the ground truth reference points, utilizing bands 3 (red), 4 (NIR) and 5 (SWIR-1) of Landsat 5 TM and bands 4 (red), 5 (NIR) and 6 (SWIR-1) of Landsat 8 OLI”. These data included 420 field reference points (GPS-measurements) in five Syrian governorates: Aleppo, Lattakia, Dara, Ar-Raqqa, and Deir ez-Zor. The GCPs formed the core set of our training data. To ensure the accuracy and reliability of the classified LULC categories, additional training samples were also collected by visual interpretations of Landsat imagery for the three study years. Thereby, we brought in our background knowledge of past and current LULC in the study area to confirm each GCP land-use allocation, if possible, with corresponding or nearly corresponding high-resolution imagery in Google Earth Pro. Furthermore, we utilized the NDVI to derive ground-reference points, especially when detecting agricultural areas in the eastern regions at the edge of the AL-Badia, where most of the bare areas or fallow areas are spread. The study by Foody et al. (2006) indicated that the size and number of training samples and the method of sampling affect the results of the land-use classification [96]. According to studies that successfully dealt with the classification of LULC in semi-arid regions, we set the minimum extent of the training areas to 50 m * 50 m [65,89,97]. In some cases, we chose larger training sites, especially in homogeneous areas, such as cultivated areas, to reduce the impact of technical geometrical noise that could appear in GPS measurements [65]. We aimed to cover the largest possible spectral range to achieve the representability of each LULC class in our training samples. We extracted the samples in the center of the representative and homogeneous regions [65]. The number and class distribution of our training samples are presented in Table 2.
Subsequently, we applied the MLC algorithm to each Landsat image containing the spectral bands in false colors composite (band 5-4-3 as RGB for Landsat 5 TM and band 6-5-4 as RGB for Landsat 8 OLI). For each time step, we classified the Landsat images into six classes of LULC (Table 3). Afterward, we calculated the area of each category based on the pixel count. Finally, we smoothed the results of the image classification with the “majority-filter” (3 × 3 pixels) in ArcGIS to reduce the “salt & pepper” effect [98].
To evaluate errors that may appear in the classification approach, we created a confusion matrix and computed the accuracies of the change detection results (overall accuracy, user’s accuracy, and producer’s accuracy) [99,100]. We based the accuracy assessment on a total of 1012 validation points to evaluate the classification accuracy of years 2010, 2014, and 2018 separately. We drew a stratified random sample (slightly modified inclusion probabilities) outside the training areas to generate validation points for each LULC class. Thus, the number of selected points in each class approximately matches the relative size of the corresponding LULC category. According to a recommendation by FAO (2016), we set the minimum sample size per strata to 20 samples [101]. However, we limited the number of water body samples due to its unique and differentiable spectral signature. We evaluated the validation points with high-resolution Google Earth Pro imagery (2010, 2014, and 2018) that correspond to the date (±15 days) of the Landsat images. We identified the current LULC allocation, compared it to our classified maps of 2010, 2014, and 2018 and subsequently calculated the accuracy. However, the classification of LULC may contain uncertainties, which can result from misclassification, homogeneity, and autocorrelations within verification samples during the manual preparation induced by the interpreter [102,103,104]. Thus, based on the error matrix and results of accuracy assessment, we calculated error-adjusted area estimates for each LULC class as well as confidence intervals at the level of 95% according to the statistical approach recommended by Olofsson et al. (2013, 2014) [104,105]. We carried out the LULC change detection by comparing the classification results of 2010, 2014, and 2018 based on adjusted area estimates for each LULC category.
4. Results
4.1. Classification Accuracy Assessment
The area-adjusted overall accuracy achieved in the final classification maps was 87.2% (2010), 85.2% (2014), and 86.7% (2018) (Table 4). The results accuracy assessment indicates that the errors associated with the overall evaluation accuracy are likely to be attributed to the low spectral separation of bare areas. In addition, overlap among different land-use classes such as rangelands and agricultural areas can cause spectral mixing and thus mixed-pixel problems occur which leads to difficulties in separating these areas in the Landsat data and subsequently to errors in the classification results. In the following, we refer to area-adjusted accuracy statistics, which however show similar results to former accuracies, except differences in 2014.
Taking all target years and all LULC classes into account, we obtained on average higher user´s accuracies (UA) than producer´s accuracies (PA), which overall indicates higher commission errors than omission errors. In 2010, rangelands covered approximately 44% of the total country area and achieved high PA of 92% and UA of 86%. It is therefore an important category for monitoring land use during the years of study. It should be noted that many regions assigned to the bare areas class can also easily be classified as rangelands due to grazing during the transition seasons (spring and autumn). Throughout all target years, bare areas showed on average both a high PA (85.3%) and UA (93.3%). The water bodies class obtained the highest PA results of 97% on average (2010, 2014, 2018) due to its distinctive spectral signature. The lower UA of water bodies (88.9% on average) can be attributed to commission errors in 2014 and the small sample size that assigns a strong weight to single misclassifications. The cultivated areas class achieved relatively low UAs compared to other LULC classes, with the lowest UA (75%) in 2018. This low accuracy is due to classification errors, where bare lands were misclassified as cultivated areas. Conspicuously, these areas are mostly located in the west and north of the country and correspond quite well to areas where precipitation is >250 mm/year. It, therefore, can be assumed that they represent predominantly cultivated crops, mostly cultivated rainfed crops, although complementary irrigation cannot be completely excluded. However, on the classified Landsat images, it is not possible to distinguish fully between areas that are consistently cultivated from bare areas. Bare areas contain small areas that are intensively cultivated with crops and vegetables in short periods of the year. Urban areas overall exhibited decent UA (81.6%) but by far the lowest PA (62.9%) on average. The urban areas category also includes open structures for human activities, such as quarries and military sites. Due to the fairly limited resolution of Landsat images, only large non-built-up areas can be displayed on the classified image. During the period under study, urban areas were mostly misclassified as rangelands and bare areas. The roads in the study area did not appear on the classified images because of mixed pixel signatures. Agricultural areas (fruit-tree plantations) could also be classified as forest cover. This is reflected in the PA of the forest classification. UA for this category remained largely unchanged. Forest cover in Syria is considered a rare category compared to other land uses. Therefore, the area-adjusted estimate of this category based on a statistical approach will be more accurate and reliable [104]. The results of the accuracy assessment of the supervised classification indicate an overestimation of bare areas, urban areas, and forest, whereas cultivated areas and rangeland, and an underestimation of urban areas to some extent.
4.2. LULC Change Dynamics
The LULC classification results are presented in Figure 4 and the corresponding LULC data in Table 5. The results show that the trend of LULC change between 2010 and 2018 did not witness any change before and after calculating adjusted area estimates, except for the forest cover. Area-adjustment accounts for differences in class accuracy and thus results in adjusted area extents that we refer to in the following analysis, also taking into account the 95% confidence intervals. To ensure good readability, we hereafter refer to a thousand hectares (tha) as a unit to quantify the magnitude of change (1 km2 = 100 ha = 0.1 tha). Change detection revealed remarkable differences in the size and the trends among the LULC classes observed in the study period. Cultivated areas showed a reduction from 2010 to 2014 and a growth from 2014 to 2018. The most prominent changes in LULC were the continuous decline in rangelands and the increase in bare areas during the study period.
In 2010, rangelands accounted for the largest land area (8080 ± 343 tha) followed by cultivated areas (4784 ± 285 tha) and bare areas with or without sparse cover (4709 ± 257 tha). The classifications for 2014 and 2018 show that the share of bare areas increased significantly at the expense of rangelands, which declined in comparison to their spatial extent in 2010. The coverage of bare areas increased to 7922, ± 367 tha (43% of Syria) in 2014 and thereafter to 8710, ± 306 tha (47% of Syria) in 2018. The comparison of 2010 and 2014 classifications revealed that cultivated areas declined notably (by 1020 tha). Afterward, however, the agricultural area increased by 79 tha between 2014 to 2018. Rangelands showed a continuous reduction in extent during the study period, which formerly represented the largest land cover (44% of Syria) in 2010. The decrease in rangelands mainly occurred from 2010 to 2014 (by 34%) and proceeded in the period from 2014 to 2018 (by 18%). Forests and other wooded areas continuously increased from 391 (±132) tha in 2010 to 556 (±106) tha in 2014 and further to 649 (±112) tha in 2018. The urban and peri-urban areas increased to 872 (±166) tha by 2014, which is almost twice the area of 2010, while an opposite trend emerged in the period from 2014 to 2018. Analysis of LULC change showed a decrease in urban areas by 11% between 2014 and 2018. Water bodies covered the smallest land area in 2010 with 131 (±25) tha, which corresponds to 0.7% of the total Syrian area. Water bodies have not changed considerably in comparison to other LULC types. The area covered by rivers, ponds, and lakes decreased by 83 tha (±26) per year from 2010 to 2014 but subsequently increased by 160 (±25) tha annually from 2014 to 2018.
5. Discussion
5.1. LULC Change Drivers
Based on the consistency of the classification assessment and the findings of the change detection analysis, we found that the land-use system in Syria has undergone rapid spatial and temporal changes during the eight years of study. In the introduction of the research, we have mentioned “high-level” driving forces and the corresponding direct and indirect drivers that could be behind changes in LULC. Given the large size of the study area, the complexity of the political and military landscape, and the change of influence and control areas on the ground in the light of the ongoing war in Syria, it was not possible to analyze all these drivers and show their direct and indirect impact on land-use changes during the study period. In the following, based on our analysis, and by reporting and interpreting evidence from various other relevant studies, we discuss potential direct and indirect drivers that may have led to these changes in LULC during the eight years of study. Thereby, we primarily focus on possible implications of the conflict, but also the potential effects of prevailing climatic conditions and trends.
5.1.1. LULC Changes and Conflict Conditions
During the study period, cultivated land was converted to non-cultivated land-use types in many areas in Syria. Generally, cultivated areas declined by 943 tha per year between 2010 and 2018. The results indicate a decrease in the use of arable land by 21% between 2010 and 2014 (Table 5). We hypothesize that population loss during the conflict, especially in governorates with large agricultural areas such as Ar-Raqqa, Al-Hasakeh, Deir-ez-Zor, and Aleppo, had tremendous impacts on agriculture between 2011 and 2014, leading to a remarkable decrease in agricultural land. Analysis of demographic data from the Central Bureau of Statistics as well as studies that dealt with the humanitarian and agricultural situation in Syria showed a loss of agricultural employment. [70,71,106,107]. Correspondingly, they reported a strong increase in the number of unemployed people and indicated population involvement in either the regular army or groups of the armed opposition. Thereby, related key processes are population displacement, forced migrations, and deaths. The number of refugees and displaced persons inside Syria reached 6.1 million people, while 5.5 million people took refuge outside Syria [108,109]. In 2011, more than 80% of the population in rural areas worked in agriculture [110]. Due to mismanagement of state institutions in the agricultural sector and intensification of rural-urban migration, agricultural areas, and thus the livelihoods of the population suffered substantial losses [109]. The FAO study on the state of agricultural production in Syria in 2013 included the governorates of rural Damascus, Homs, and Dara, and highlighted additional reasons for the decrease in cultivated land. The study suggested the lack of fuel for irrigation, plowing service, harvesting, and transportation of crops, as well as huge conflict-related agricultural production costs to have major impacts [110]. Another FAO study revealed that the area planted with cereal crops in 2014 was very low compared to previous years. According to the study, the area planted with wheat in 2014 was estimated at 900 thousand hectares, compared to 1.5 million hectares before the crisis [111]. As a result, farmers throughout Syria were no longer able to make ends meet, forcing many of them to abandon agricultural activity in search of more viable livelihoods. Poor management of water resources in the light of the conflict may also have driven people out of the rural areas, and thus further contributed to the decrease in the extent of agricultural land [109]. Military operations of conflict parties have had a direct impact on the diminishing area of cultivated land in most parts of Syria [73,109]. Large areas of agricultural land were destroyed in the course of military operations - in some cases deliberately - as happened in northeastern Syria, especially in Al-Hasakeh Governorate [108,109]. Military operations also had a major impact on the decline of tree crops, since tree crops were destroyed in many Syrian governorates, especially in Hama, Idleb, Aleppo, and rural Damascus [109]. Official reports by the Central Bureau of Statistics in Syria indicate that more than 51.7 tha of tree crops were cleared between 2010 and 2017, representing 12% of the total area planted with tree crops in 2010 and 7% in 2017 [69,71,106,112]. In addition, most of the front lines of military operations occurred in or around agricultural lands in many areas in Idleb, Ar-Raqqa, Hama, and Aleppo governorates. Furthermore, agricultural land in these regions was confiscated by parties to the conflict. Some opposition forces also imposed taxes on agricultural products to secure financing [109]. The interplay of all drivers resulted in the displacement of large numbers of rural families from, and consequently to the abandonment of cultivated land. As the frequency of conflicts increased in most areas of Syria, growing insecurity disrupted the trade in agricultural crops and inputs, which resulted in shortages of fertilizers, energy, and manpower in agricultural activity [109]. As a result, agricultural production revenues continued to decline remarkably, thereby contributing to the decline in the area of agricultural land. According to the World Bank report in 2018, the GDP of the agricultural sector in Syria decreased by 41% in 2014 compared to 2010 as a result of the conflict´s implications [113].
Our change detection showed a slight increase in the area of agricultural land from 2014 to 2018 (80 tha). Since the magnitude of change is lower than the 95% confidence intervals of area extent in 2014 and 2018, we assume a class stabilization rather than an opposite (increasing) trend. This may be explained by the fact that the intensity of the conflict has declined between 2014 and 2018 in some Syrian governorates, especially in de-escalation areas. The relative stability in one form or another in these areas helped to create favorable conditions for agricultural activity, as did the return of many rural dwellers. Our change detection supports this assumption, as we observed the strongest increase in agricultural lands in governorates with de-escalation zones. This finding is consistent with data of previous studies that indicated a decrease in the number of unemployed people and an increase in the number of people in de-escalation areas whose economy is mainly based on agricultural resources [70,71,106,107,108]. Profitable trade of agricultural products may also be a factor that contributed to increasing/stabilizing cultivated areas. This mainly affects crops, such as wheat, cotton, and barley, that are traded between regions of the regime and those outside its control, e.g., ISIS-controlled areas in which most of the agricultural land is concentrated. This is consistent with our finding of increasing agricultural lands in areas controlled by the Syrian regime and those that are under the control of the various opposition forces. The increase in the area of agricultural land between 2014 and 2018 can also be attributed to changes in the control and management of agricultural land. Cultivated land in northeastern Syria has increased in the area controlled by ISIS. This region includes the governorates of Al-Hasakeh and Ar-Raqqa and large parts of Deir-ez-Zor Governorate and contains nearly one-third of the agricultural areas in Syria. It remained under ISIS control until the end of 2017 [114]. In some areas of these governorates, croplands expanded to previously uncultivated areas, e.g., rangelands, driven by the purpose of enhancing agricultural production, and to compensate for the loss of agricultural areas that ISIS had lost in favor of opposition forces backed by the international coalition. Moreover, ISIS demanded landowners to maintain land cultivation to control food production and secure sources of financing through taxes imposed on agricultural products [114,115].
The spatial extent of rangelands showed relative stability, ranging from 46% to 55% of the country’s area between 2003 and 2010 [116,117]. Our classification of 2010 demonstrates that rangeland areas have not undergone notable changes in their spatial extent until then and accounted for approximately 44% of the country. Analysis of LULC changes indicates that rangelands decreased substantially (34%) between 2010 and 2014 (Table 5). The LULC classification of 2018 reveals a continuing trend of rangeland cover loss, with large areas of rangeland being converted into bare areas. Rangelands decreased by 8% between 2014 and 2018 (Figure 4, Table 5). We found these results to be consistent with the pathways of conflict-related events, particularly in northeastern Syria and in the Syrian Al-Badia. Distribution maps of control zones between 2013 and 2014 indicate extensive and intense military conflicts between Syrian regime forces and opposition forces in the AL-Badia (Figure 2). Opposition forces eventually took control of most of the AL-Badia in June 2013 [73,74]. ISIS then acquired control of large swaths of land in Syria and Iraq, including Al-Badia, by January 2014 [73,74,118,119]. A consequence of these conflicts was the displacement of the population in these areas which was accompanied by the severe deterioration of livestock breeding and rangelands development [111]. Camp construction, urban expansion, the extension of military structures, and overgrazing and the lack of capacity to manage rangelands during wartime can contribute to a decrease in the rangeland area [65,108,120]. With the intensification of the conflict after 2014 in specific regions and the expansion of military operations, conflicting parties purposely removed vast areas of rangelands to expose fronts, facilitate surveillance, protect transport routes or infrastructure and to ensure the arrival of military and oil supplies. These practices were mainly concentrated in the Syrian Badia and on the sides of the main and subsidiary transport routes between the cities of Aleppo, Hama, Ar-Raqqa, and Deir ez-Zor [119,121].
Our classification result of 2010 shows that forests have a very limited spatial extent and accounted for only 2% of the total study area. Forests in Syria are mainly located in the coastal provinces (Lattakia and Tartous) and the governorates of Hama, rural Damascus, and Idleb (81% of the total forest area). The results of spatial-temporal trend analysis show that the forest cover increased by 30% between 2010 and 2014 and by a further 14% between 2014 and 2018 (Table 5). An increase in forest cover over several years in some areas of Syria may be not surprising. Growth of forest cover is likely to occur in areas where forests remained somewhat isolated from the effects of conflict, such as coastal governorates and Hama Governorate, where 62% of forest cover is located. Our outcomes differ from the results of previous studies and reports that showed a decrease in the area of forests in some coastal areas and the northwest of Idleb governorate for reasons related to the ongoing conflict 2010 and 2018, such as heavy logging to produce fuelwood and charcoal, and forest fires a result of mutual bombardment between the conflict parties [63,122,123].
It seems that the best explanation for this increase in forest cover between 2010 and 2018 is misclassification, which is due to the spectral confusion between the degraded forest cover and tree crops planted on terraced hillsides. To verify this outcome, the results of the forest cover classification for the three years were compared with the corresponding Google Earth Pro imagery. We found through visual inspection that forest areas, especially at relatively low elevations, are confused with areas of tree crops (Olives and fruit-tree plantations). This is also illustrated by the additional classification of forest cover at a regional or local level, which includes Lattakia Governorate, on the Syrian coast, where 30% of the forests and about 40% of the fruit trees are concentrated [71]. We also found that when the area classified on the image increases from the local to the national level, the total area of the forest cover increases. This can be attributed to the size of the classified area and the fragmented nature of the forest cover [124]. This can also be related to the spatial accuracy of Landsat imagery and the classification of mixed pixels containing dense tree crops and small forest spots as forest cover. To validate this interpretation, additional classifications related to the size of the classified area using different pixel sizes are required.
LULC classifications for the study years revealed that bare areas continued to expand between 2010 and 2018. The 2014 LULC classification shows that bare land increased by 41% and that the most prominent change was the conversion from rangelands to bare areas with or without sparse cover (covering 43% of the total area of Syria) (Figure 4). Most of these areas are located in the three eastern governorates of the country (Ar-Raqqa, Deir-ez-Zor, Al-Hasakeh) and the governorates of Homs and rural Damascus. The increase in bare lands between 2010 and 2014 (41%) is the outcome of rangeland degradation and shrinking areas of agricultural land. As a result of massive displacement of population and changes in the practice of land management, large areas of rangelands and agricultural land changed to bare lands, especially in areas that were controlled by ISIS in eastern and central Syria [108]. The increase in bare areas can also be attributed to the widespread distribution of mines through military operations, where the World Health Organization has shown that more than 8 million Syrians are at risk of lethal mines and remnants of war that spread over large areas and constitute a major impediment to land cultivation and pasture development [125,126]. Unfortunately, there is no accurate data on this important LULC driver in the period of war.
Our analysis reveals that the spatial extent of bare areas continued to increase after 2014. The results indicate an increase of bare areas by 9% between 2014 and 2018, albeit lower rates than before (Table 5). In addition to the drivers mentioned above, other main drivers behind the continuation of this increase in rangelands may be changes in land use activities and the escalation of the conflict between the warring parties in large parts of Syria after 2014. According to a report by Reuters, many farmers in ISIS-controlled areas did not cultivate their land for the 2015 season [127]. This was due to low fertilizer, lack of fuel, and instability as a result of the conflict, as well as deterioration of irrigated agriculture [127]. Tracking the course of the conflict-related events and the distribution of the control map indicates that gradually, after 2017, stability was reestablished in those areas from which the ISIS organization withdrew in the north-east and central Syria, in areas where military escalation was reduced as well as in areas where combat fronts were calm under the de-escalation agreements. Consequently, illegal economic activities began to grow on a large scale, such as oil production, refining, extraction of raw materials, and construction materials, which negatively affected the development of rangelands. This potentially contributed to the conversion of rangelands to bare areas, particularly in the Ar-Raqqa and Deir ez-Zor governorates [128,129].
In general, LULC change detection indicates a major increase in the spatial extent of urban and peri-urban areas between 2010 and 2014. Compared to 2010, the urban areas doubled and expanded by 105% until 2014. (Table 5). However, when considering confidence intervals, urban area expansion is subject uncertainty and ranges from 66% (low estimate) and 144% (high estimate). One possible explanation is the increase in population. Aleppo governorate and the eastern governorates of Ar-Raqqa, Deir-ez-Zor, and Al-Hasakeh particularly were affected by large and uncontrolled urban growth between 2011 and 2012 [130,131]. Poor management, oversight of state institutions at the beginning of the conflict, availability of resources, and the need to build new homes could encourage urban growth within existing urban areas and at urban fringes. The same pattern in similar scenarios was also detected in Gbanie’s study (2018) [28]. With the intensification of the conflict and due to the fierce battles, large parts of urban areas became uninhabitable. Therefore, the wake of destruction, fallen buildings, and the desire to leave the most affected urban areas reinforce the necessity for new living spaces for the Syrian population and thus increase urbanization processes in the rural outskirts of the cities or even at new sites. As the conflict worsened further during the first half of the year 2013, people fled to relatively more stable areas, especially near the border and urban areas increased rapidly. As a result of the prevailing situation, large numbers of refugees, as well as urban and peri-urban dwellers, practiced urban and peri-urban agriculture in new landscapes to earn a living. This could ultimately lead to a marked expansion in urban and peri-urban areas. This case is in line with the findings of other studies, which showed that during forced internal migration of populations urban and peri-urban agricultural activities occur on a large scale, ultimately leading to an observed increase in the spatial extent of urban areas [28,132,133]. Some studies also indicated that many camps for internally displaced persons (IDP) have been established on large areas of agricultural land, particularly in the northwest (Aleppo and Idelb governorates) and the northeastern part of Syria (Al-Hasakeh governorate) [108,120,134]. This is what we can conclude from analyzing Google Earth images of 2012, 2013, and 2014. The camps and urban areas have a similar spectral signature. The spatial extent of these urban areas might have changed over time according to the military control of the parties to the conflict and the prevailing military situation. During the conflict, closed military zones were established and the existing military infrastructure expanded in the Syrian Coast region (in the provinces of Lattakia and Tartous) and in eastern and southern Syria (in the provinces of Deir-ez-Zor and rural Damascus), especially by countries that supported the Syrian regime in its war against the opposition [135,136].
The spatial extent of urban and peri-urban areas decreased between 2014 and 2018 by 11%. However, the urban class is subject to uncertainty, as the area change related to confidence intervals ranges from −8% (low estimate) to 29% (high estimate). We assume that the potential decrease in urban areas might be due to the strong population decline and low income of the population. The flight of civilian population to new regions inside the country and massive displacement of the population outside the country (33.8% internally and externally 26.6%) [108,130], as well as the decline in economic activities due to the country’s volatile social and political environment, led to the disappearance of urban and peri-urban agriculture practiced by the displaced and local low-income residents [70,71,106,108,130]. Furthermore, several reports and conflict-related news in Syria indicate that large parts of villages, towns, and cities were partially or completely destroyed [137,138]. Both the scenario for the decline in urban area growth and the scenario of destruction of parts of the existing urban areas were observed in studies that dealt with similar armed conflicts around the world [3,139]. In addition, massive destruction led to strong fragmentation within urban areas in Syria. This may have resulted in isolated urban spots being replaced by agricultural areas or the sprawling bare areas on the classified images. Such patterns are consistent with previous studies that examined land-use changes during conflicts [2,16,140].
Our analysis of the spatio-temporal trend of water bodies showed a reduction of 48 tha (36%) by 2014. One explanation may be the uncontrolled increase of irrigated land, especially in the first two years of the conflict, i.e., before the refugee crisis, due to weak control by state institutions in Syria. Irrigated agriculture depends mainly on surface water reservoirs (stored water) such as lakes and dams built on waterways [141]. Another reason for this decrease in water may be low water storage of dams due to changes in water resource management practices during the conflict, especially after the large internal displacement of the population. Moreover, the low water storage of dams due to changes in water management practices as a result of the conflict situation in the country may have supported the decline of water bodies, especially after the large internal displacement of the population. For example, studies that examined changes in water resource in Dara governorate in southern Syria during the conflict indicated that the decrease by 49% in the storage of reservoirs in the study area is largely due to changes in water management practices during the period of refugee displacement between 2013 and 2015 [62,142]. This uncommon decrease in water levels was detected on satellite images as well as in the statistical analysis of water changes in the Syrian governorates during the study period. This result is consistent with the findings of previous studies that dealt with land-use changes in other conflict zones around the world [3,16].
The 2018 classification showed an increase in water bodies by 76 tha (48%) compared to 2014. One possible explanation is a considerable decrease in the area of irrigated agricultural land and consequently, the associated decrease in the use of irrigation water. This interpretation is consistent with other studies [62,143,144]. The decrease in irrigated area coincided with the large internal and external displacement of the population [108,130]. There are other reasons for the increase in the area of water bodies which can be attributed to the major changes in water resource management practices that have grown with the escalation and widening of the conflict [62]. From 2013 onwards, opposition groups controlled most surface water reservoirs such as dams in Syria. In late 2013, ISIS controlled the Euphrates River dam near the city of Ar-Raqqa in northern Syria, where the country’s largest water surface is located [72]. The opposition forces lacked proper information about these dams as well as technical expertise and the institutional work to manage them effectively in a coordinated manner. Moreover, there was a lack of energy to operate these facilities [145]. This led to dependence on alternative sources, the groundwater. At the end of January 2017, the United Nations warned that damage to the Euphrates dam could lead to widespread flooding of the Euphrates Basin caused by the high water level behind the dam [146,147,148]. In addition, the water level of the Euphrates River rose about 10 m at the end of January 2017, which led to the inundation of large areas of agricultural land on both sides of the river for a long time [147]. These measurements indicate an increased reliance on groundwater for agriculture and other uses compared to surface water whose spatial extent has increased after 2014. Concurrently, this change in water usage was accompanied by massive population displacements both internally and externally, which may have caused changes in water resources management practices.
5.1.2. LULC Changes and Climatic Conditions
Climate variability, i.e., the interplay of the yearly temporal and spatial distribution of precipitation and temperature fluctuations, is considered a major driver of observed LULC patterns. Thereby, droughts are the most influential phenomena in Syria. Overall, a gradually declining average rainfall pattern since 1940 and constantly increasing average temperatures with a drastic upward trend since the 1980s can be observed in Syria, concomitant with long-term warming in the eastern Mediterranean [149,150,151,152]. Challenges related to climate variability and changes related to water use during the conflict can also lead to alterations in land productivity and irrigation needs, the large-scale failure of agricultural crops [152]. Moreover, climatic conditions are linked to the civil war as well as ongoing violent conflicts and resulting in poor management practices and unsustainable agricultural and environmental policies [153,154,155,156,157]. This can amplify environmental implications. Commonly, climate change is referred to as a threat multiplier [158]. The interaction of increasing temperatures and decreasing precipitation amplifies water stress, leading to more frequent and severe dry periods. Kelley et al. (2015) indicate a strong impact of droughts in Syria on the agricultural systems, especially in water-stressed areas. Occurring droughts were documented between 2007 and 2010 and in 2014 [115,152].
Low precipitation is directly reflected in the availability and extent of water bodies and may explain the decline from 2010 to 2014. The study by Müller et al. (2016), which examined the impact of the refugee crisis on changes in land use and water resources in southern Syria and northern Jordan between 2011 and 2015 also indicated that the decrease in volume of surface water stored in reservoirs and dams corresponds to the regional drought that Syria experienced in 2014 [62]. However, the report by JRC (2019) indicates strong climate anomalies and dry conditions for 2017 and 2018 as well [159] which does not correspond to the increase of water bodies from 2014 to 2018 found in our analysis. Therefore, we assume that the change in water cover is not a consequence of natural climate variability. Nonetheless, dry periods may have contributed to the decrease in cultivated areas, forests, and rangelands and the contrary increase in bare lands observed from 2010 to 2014 (Table 5). As two-thirds of the cultivated land in Syria is rain-fed, there is a high vulnerability and dependency on climatic conditions and natural year-to-year variability. This decline in agricultural areas in relation to climatic conditions often occurs in north and northeastern Syria [149]. In addition, the spatial extent of the irrigated agricultural areas may be affected by droughts due to this type of cultivation being linked to the volume of surface water stored in reservoirs, dams, and groundwater-fed by rainfall. According to the study by Müller et al. (2016) the low rainfall period 2013–2015 was accompanied by a marked decrease in the area of irrigated agriculture [62].
From 2010 to 2018, bare areas increase mainly to the expense of rangelands. The study by Houmsi et al. (2017) showed that there was a climatic shift of areas from dry-subhumid to semi-arid in the north and northwest of Syria due to drought during the period between 1981 and 2010 [64]. This shift was likely enhanced between 2010 and 2018 due to dry conditions in 2014, 2017, and 2018 [115,159]. This conclusion also corresponds to the results of our study, which showed an increase in the area of bare lands during the study period, especially in the governorates of Al-Hasakeh, Ar-Raqqa, Aleppo, and Idleb, where most of the bare lands are located (Figure 4). Rangelands are located in the more arid and fragile regions that are not suitable for cultivation. These vulnerable areas rely on seasonal precipitation and small changes in rainfall patterns and temperature may entail degradation processes and trigger land conversion. Thus, the consequences of the occurring dry periods for rangelands are more striking due to less resilience regarding water retention. Overgrazing may be another reason for the increase in bare areas at the expense of rangelands. According to the study by Al-Fares (2012), overgrazing led to the degradation of rangelands in drier semi-arid plains and dry interior regions [65]. This type of rangeland degradation is often associated with droughts and periods of little rainfall. This is consistent with the results of our study, which showed a decrease in rangelands and an increase in bare areas in the governorates of Al-Hasakeh, Ar-Raqqa, Deir-Ez-Ezor, Homs, and rural Damascus where the Syrian Badia forms the largest part of these governorates. It is believed that the effect of overgrazing is limited to the first years of study period i.e., until 2014 and to a specific spatial scale because of the exacerbation of the conflict between 2014 and 2018, along with droughts, presumably had the greatest impact on diminishing area of rangelands [111].
Quantifying climate change impact is subject to uncertainty and a major challenge, as numerous direct and indirect interactions contribute to LULC changes that vary across the regions. Our examination has shown that there has been no significant trend towards less/more drought-prone conditions in the study period. Further analysis is needed, e.g., by incorporating spatially resolved temperature and precipitation data or by assessing useful aridity-indices. Generally, long-term trends of precipitation and temperature do not necessarily translate into short-term effects. However, it cannot be ruled out completely, whether a short-term effect occurred and contributed substantially to LULC change. Climatic conditions have to be taken into account, however, we conclude that climate impacts regarding the fluctuation of precipitation and temperature were not the main driver for LULC in the study period.
6. Conclusions
We used multi-temporal Landsat in this study to monitor and analyze land use/land cover (LULC) change in Syria from 2010 to 2018. This study not only examines the spatial and temporal changes in LULC in Syria but also attempts to identify the causes of these changes by linking it to relevant published literature. Our results of spatial, temporal, and statistical analyses of land-use changes indicate that the degree of LULC change from 2010 to 2014 was greater than the change from 2014 to 2018 for all LULC classes except water bodies. We find that this change entailed severe conversions in the natural environment and agricultural land during the study period. The results also indicate that the spatial extent of cultivated areas and rangelands declined during the study period while the other LULC classes showed an increase. At this stage, it is not possible to determine whether the specific changes will be permanent or temporary.
Given the large size of the study area, the complexity of the political and military landscape in Syria, population movements and economic consequences, and the impact of droughts linked to climate change, it is difficult to identify single drivers of change for specific LULC types and to analyze their direct and indirect impact on LULC changes during the study period. By discussing our findings on the causes of change in LULC dynamics, we concluded that population loss and social unrest due to population displacement and long-term or short-term population pressure are the main potential causes of these changes.
We also concluded by tracking land control pathways during the study years that the spatial extent of LULC classes, such as agricultural lands and rangeland, is substantially affected by the prevailing conflict situation in north-eastern and southern Syria (governorates of Al-Hassakeh, Ar-Raqqa, Deir-ez-zor, and Dara) and in the Al-Badia (Homs and rural Damascus governorates), whereas other regions located in western Syria (Lattakia, Tartous and Hama governorates) appear to be less impacted by the political situation and the state of conflict, especially after 2014. It has become apparent to us that this can be attributed to differences in local dominant political power and the changing balance of power between the warring parties as well as resource management practices at local and national levels.
We found evidence, substantiated by published literature, that the effects of droughts on LULC during the study period mainly occurred in water bodies, cultivated areas, and rangelands, especially in water-stressed areas. Consequently, those changes naturally led to an alteration of other LULC classes, such as bare areas. By linking our results to literature published we could not identify a significant trend towards less/more drought-prone conditions in the study period and we, therefore, we do not consider climate variability and fluctuating climatic conditions as a major driver of LULC in Syria.
Monitoring the current dynamics of LULC changes in Syria and identifying the reasons behind them shows the continued change that will probably extend in the future. This most probably will continuously cause both rapid and continued increase in erosion and degradation of agricultural soils which in turn has serious economic, social and environmental consequences and impacts on land systems and its management, especially at the local level. The future trajectory mainly depends on the political and military scene in Syria and long-term climatic conditions associated with climate change.
The proposed procedure for detecting LULC changes in Syria is straightforward to apply and allows us to monitor future developments also by using remote sensing data from other seasons. To generate a more holistic view, temporally corresponding proximate drivers of LULC change, demographic and socio-economic may be implemented in a spatial model in the future. This study shows that remote sensing technology is an effective tool for monitoring temporal and spatial changes in LULC in Syria at the country-scale. Our study provides quantitative and qualitative information on the dynamics of LULC changes and aims to establish a basis for understanding the drivers of these changes. Our investigation can contribute to a framework for developing land management strategies as well as for reducing the adverse environmental impacts. We conclude this study with hope and desire for a peaceful and prosperous development for people in Syria in the near and long-term future.
Author Contributions
The authors’ contributions to this research were as follows: Conceptualization, M.A.M. and C.S.; methodology, M.A.M. and C.S.; software, M.A.M.; validation, M.A.M. and J.A.; formal analysis, M.A.M.; investigation, M.A.M.; data curation, M.A.M. and J.A.; writing—original draft preparation, M.A.M. and J.A.; writing—review and editing, C.S.; visualization J.A.; supervision, C.S.; project administration, C.S.; funding acquisition, C.S. All authors have read and agreed to the published version of the manuscript.
Funding
This research and the article processing charge for publication was funded by Einstein Foundation Berlin, grant number [EJS-2019-458-2].
Conflicts of Interest
The authors of this manuscript have no conflict of interest.
References
- Prakasam, C. LU and LC change detection through remote sensing approach a case study of Kodaikanal Taluk, Tamil Nadu. Int. J. Geomat. Geosci. 2010, 1, 150–158. [Google Scholar]
- Steffens, W.; Sanderson, R.A.; Tyson, P.D.; Jäger, J.; Matson, P.A.; Moore, B., III; Oldfield, F.; Richardson, K.; Schellnhuber, H.J.; Turner, B.L.; et al. Global Change and the Earth System: A Planet Under Pressure, 2nd ed.; Springer: Berlin/Heidelberg, Germany, 2005; pp. 143–202. [Google Scholar]
- Wilson, S.A.; Wilson, C.O. Modeling the impacts of civil war on land use and land cover change within Kono District, Sierra Leone: A socio-geospatial approach. Geocarto Int. 2013, 28, 476–501. [Google Scholar] [CrossRef]
- Meyer, W.B.; Turner, B.L. Human population growth and global land-use/cover change. Annu. Rev. Ecol. Syst. 1992, 23, 39–61. [Google Scholar] [CrossRef]
- Gerland, P.; Adrian, E.; Raftery, A.E.; Ševčíková, H.; Li, N.; Gu, D.; Spoorenberg, T.; Alkema, L. World population stabilization unlikely this century. Science 2014, 346, 234–237. [Google Scholar] [CrossRef] [PubMed] [Green Version]
- Jiang, L.; O’Neill, B.C. Global urbanization projections for the shared socioeconomic pathways. Glob. Environ. Chang. 2017, 42, 193–199. [Google Scholar] [CrossRef] [Green Version]
- World Agriculture: Towards 2015/2030 Climate-Change. Available online: http://www.fao.org/3/y4252e/y4252e00.htm#TopOfPage (accessed on 21 June 2020).
- Lambin, E.F.; Meyfroidt, P. Global land use change, economic globalization, and the looming land scarcity. Proc. Natl. Acad. Sci. USA 2011, 9, 3465–3472. [Google Scholar] [CrossRef] [Green Version]
- Lambin, E.F.; Turner, B.L.; Geist, H.J.; Agbola, S.B.; Angelsen, A.; Bruce, J.W.; Coomes, O.T.; Dirzog, R.; Fischer, G.; Folke, C.; et al. The causes of land-use and land-cover change: Moving beyond the myths. Glob. Environ. Chang. 2001, 11, 261–269. [Google Scholar] [CrossRef]
- Lambin, E.F.; Geist, H.J.; Rindfuss, R.R. Introduction: Local processes with global impacts. In Land-Use and Land Cover Change: Local Processes and Global Impacts; Lambin, E.F., Geist, H.J., Eds.; Springer: Berlin/Heidelberg, Germany, 2006; pp. 1–8. [Google Scholar]
- Aide, T.M.; Grau, H.R. Ecology—globalization, migration, and Latin American ecosystems. Science 2004, 305, 1915–1916. [Google Scholar] [CrossRef]
- Rudel, T.K.; Coomes, O.T.; Moran, E.; Achard, F.; Angelsen, A.; Xu, J.C.; Lambin, E. Forest transitions: Towards a global understanding of land use change. Glob. Environ. Chang. 2005, 15, 23–31. [Google Scholar] [CrossRef]
- Mather, A.S. Driving forces. In Our Earth’s Changing Land: An Encyclopedia of Land-Use and Land-Cover Change (A.-K.) 1; Geist, H., Ed.; Greenwood Press: London, UK, 2006; pp. 179–185. [Google Scholar]
- Geist, H.J.; Lambin, E.F. Proximate causes and underlying driving forces of tropical deforestation. BioScience 2002, 52, 143–150. [Google Scholar] [CrossRef]
- Müller, D.; Sun, Z.; Vongvisouk, T.; Pflugmacher, D.; Xu, J.; Mertz, O. Regime shifts limit the predictability of land-system change. Glob. Environ. Chang. 2014, 28, 75–83. [Google Scholar] [CrossRef]
- Gorsevski, V.; Kasischke, E.; Dempewolf, J.; Loboda, T.; Grossmann, F. Analysis of the impacts of armed conflict on the Eastern Afromontane forest region on the South Sudan-Uganda border using multitemporal Landsat imagery. Remote Sens. Environ. 2012, 118, 10–20. [Google Scholar] [CrossRef]
- Baumann, M.; Kuemmerlea, T. The impacts of warfare and armed conflict on land systems. J. Land Use Sci. 2016, 11, 672–688. [Google Scholar] [CrossRef]
- El-Baz, F. Preliminary observations of environmental damage due to the Gulf War. Nat. Resour. Forum 1992, 16, 71–75. [Google Scholar] [CrossRef]
- Brunborg, H.; Urdal, H. The demography of conflict and violence: An introduction. J. Peace Res. 2005, 42, 371–374. [Google Scholar] [CrossRef]
- Buhaug, H.; Gates, S.; Hegre, H.; Strand, H. Global Trends in Armed Conflict; Centre for the Study of Civil War, PRIO: Oslo, Norway, 2006; pp. 1–13. Available online: https://www.hbuhaug.com/wp-content/uploads/2014/02/Global-Trends_final.pdf (accessed on 26 June 2018).
- Hoddie, M.; Smith, J.M. Forms of civil war violence and their consequences for future public health. Int. Stud. Q. 2009, 53, 175–202. [Google Scholar] [CrossRef]
- Westing, A.H. Explosive remnants of war in the human environment. Environ. Conserv. 1996, 23, 283–285. [Google Scholar] [CrossRef] [Green Version]
- Kim, C.K. Preserving biodiversity in Korea’s demilitarized zone. Science 1997, 278, 242–243. [Google Scholar] [CrossRef]
- Gaynor, K.M.; Fiorella, K.J.; Gregory, G.H.; Kurz, D.J.; Seto, K.L.; Withey, L.S.; Brashares, J.S. War and wildlife: Linking armed conflict to conservation. Front. Ecol. Environ. 2016, 14, 533–542. [Google Scholar] [CrossRef]
- Fell, D.; Bader, H. Remote satellite spectral analysis in Bosnia i Hercegovina. Agroborealis 1997, 29, 15–16. [Google Scholar]
- Formoli, T.A. The impacts of the Afghan–Soviet war on Afghanistan’s environment. Environ. Conserv. 1995, 22, 66–69. [Google Scholar] [CrossRef]
- McNeely, J.A. Biodiversity, war, and tropical forests. J. Sustain. For. 2002, 16, 1–20. [Google Scholar] [CrossRef]
- Gbanie, S.B.; Griffin, A.L.; Thornton, A. Impacts on the urban environment: Land cover change trajectories and landscape fragmentation in post-war western area, Sierra Leone. Remote Sens. 2018, 10, 129. [Google Scholar] [CrossRef] [Green Version]
- Dudley, J.P.; Ginsberg, J.R.; Plumptre, A.P.; Hart, J.A.; Campos, L.C. Effects of war and civil strife on wildlife and wildlife habitats. Conserv. Biol. 2002, 16, 319–329. [Google Scholar] [CrossRef] [Green Version]
- Davalos, L.M. The San Lucas mountain range in Columbia: How much conservation is owed to the violence? Biodiver. Conserv. 2001, 10, 69–78. [Google Scholar] [CrossRef]
- Alvarez, M.D. Forest in the time of violence: Conservation implications of the Columbian war. J. Sustain. For. 2003, 16, 47–68. [Google Scholar] [CrossRef]
- Suthakar, K.; Bui, E.N. Land use/cover changes in the war-ravaged Jaffna Peninsula, Sri Lanka, 1984–early 2004. Singap. J. Trop. Geogr. 2008, 29, 205–220. [Google Scholar] [CrossRef]
- Witmer, F.D.W. Detecting war-induced abandoned agricultural land in northeast Bosnia using multispectral, multitemporal Landsat TM imagery. Int. J. Remote Sens. 2008, 29, 3805–3831. [Google Scholar] [CrossRef]
- Witmer, F.D.W.; O’Loughlin, J. Satellite data methods and application in the evaluation of war outcomes: Abandoned agricultural land in Bosnia-Herzegovina after the 1992–1995 conflict. Ann. Assoc. Am. Geogr 2009, 99, 1033–1044. [Google Scholar] [CrossRef]
- Kaimowitz, D.; Fauné, A. Contras and Comandantes: Armed movements and forest conservation in Nicaragua’s Bosawas Biosphere Reserve. J. Sustain. For. 2008, 16, 21–46. [Google Scholar] [CrossRef]
- Temudo, M.P. “The white men bought the forest”: Conservation and contestation in a Guinea-Bissau, Western Africa. Conserv. Soc. 2012, 10, 354–366. [Google Scholar] [CrossRef]
- Hanson, T.; Brooks, T.M.; Da Fonseca, G.A.B.; Hoffmann, M.; Lamoreux, J.F.; Machlis, G.; Mittermeier, C.G.; Mittermeier, R.A.; John, D.P. Warfare in biodiversity hotspots. Conserv. Biol. 2009, 23, 578–587. [Google Scholar] [CrossRef] [PubMed]
- Dyer, C.; Jones, R. Deserted Villages Revisited, 1st ed.; University of Hertfordshire Press: Hertfordshire, UK, 2010; pp. 28–45. [Google Scholar]
- Hugo, G. Environmental concerns and international migration. Int. Migrat. Rev. 1996, 30, 105–131. [Google Scholar] [CrossRef]
- Maystadt, J.-F.; Verwimp, P. Winners and Losers among a Refugee-Hosting Population: Consumption, Economic Activities, and Agglomeration; HiCN Working Paper 60; The Institute of Development Studies, University of Sussex: Brighton, UK, 2009; pp. 1–48. Available online: http://www.hicn.org/wordpress/wp-content/uploads/2012/06/wp60.pdf (accessed on 23 June 2018).
- Foody, G.M. Status of land cover classification accuracy assessment. Remote Sens. Environ. 2002, 80, 185–201. [Google Scholar] [CrossRef]
- Hansen, M.C.; Loveland, T.R. A review of large area monitoring of land cover change using Landsat data. Remote Sens. Environ. 2012, 122, 66–74. [Google Scholar] [CrossRef]
- Woodcock, C.E.; Allen, R.; Anderson, M.; Belward, A.; Bindschadler, R.; Coehn, W.; Gao, F.; Goward, S.N.; Helder, D.L.; Helmer, E. Free access to Landsat imagery. In Science; Sills, J., Ed.; AAAS: Washington, DC, USA, 2008; Volume 320, pp. 1011–1012. [Google Scholar]
- Yang, X.; Lo, C.P. Using a time series of satellite imagery to detect land use and land cover changes in the Atlanta, Georgia metropolitan area. Int. J. Remote Sens. 2002, 23, 1775–1798. [Google Scholar] [CrossRef]
- Yuan, F.; Sawaya, K.E.; Loeffelholz, B.C.; Bauer, M.E. Land cover classification and change analysis of the Twin Cities (Minnesota) metropolitan area by multitemporal Landsat remote sensing. Remote Sens. Environ. 2005, 98, 317–328. [Google Scholar] [CrossRef]
- Shalaby, A.; Tateishi, R. Remote sensing and GIS for mapping and monitoring land cover and land-use changes in the Northwestern coastal zone of Egypt. Appl. Geogr. 2007, 27, 28–41. [Google Scholar] [CrossRef]
- Dewan, A.M.; Yamaguchi, Y. Land use and land cover change in Greater Dhaka, Bangladesh: Using remote sensing to promote sustainable urbanization. Appl. Geogr. 2009, 29, 390–401. [Google Scholar] [CrossRef]
- Bakr, N.; Weindorf, D.C.; Bahnassy, M.H.; Marei, S.M.; El-Badawi, M.M. Monitoring land cover changes in a newly reclaimed area of Egypt using multi-temporal Landsat data. Appl. Geogr. 2010, 30, 592–605. [Google Scholar] [CrossRef]
- Ghrefat, H.A.; Goodell, P.C. Land cover mapping at Alkali Flat and Lake Lucero, White Sands, New Mexico, USA using multi-temporal and multi-spectral remote sensing data. Int. J. Appl. Earth Obs. Geoinf. 2011, 13, 616–625. [Google Scholar] [CrossRef]
- Baumann, M.; Ozdogan, M.; Kuemmerle, T.; Wendland, K.J.; Esipova, E.; Radeloff, V.C. Using the Landsat record to detect forest-cover changes during and after the collapse of the Soviet Union in the temperate zone of European Russia. Remote Sens. Environ. 2012, 124, 174–184. [Google Scholar] [CrossRef]
- Li, J.; Yang, X.; Jin, Y.; Yang, Z.; Huang, W.; Zhao, L.; Gao, T.; Yu, H.; Ma, H.; Qin, Z.; et al. Monitoring and analysis of grassland desertification dynamics using Landsat images in Ningxia, China. Remote Sens. Environ. 2013, 138, 19–26. [Google Scholar] [CrossRef]
- Mohamed, M.A. Monitoring of temporal and spatial changes of land use and land cover in metropolitan regions through remote sensing and GIS. Nat. Resour. 2017, 8, 353–369. [Google Scholar] [CrossRef] [Green Version]
- United Nations Environment Programme (UNEP). Desk Study on the Environment in Iraq; UNEP: Nairobi, Kenya, 2003; ISBN 92-1-158628-3. Available online: https://postconflict.unep.ch/publications/Iraq_DS.pdf (accessed on 6 October 2019).
- Lodhi, M.A.; Echavarria, F.R.; Keithley, C. Using remote sensing data to monitor land cover changes near Afghan refugee camps in northern Pakistan. Geocarto Int. 1998, 13, 33–39. [Google Scholar] [CrossRef]
- Bjorgo, E. Using very high spatial resolution multispectral satellite sensor imagery to monitor refugee camps. Int. J. Remote Sens. 2000, 21, 611–616. [Google Scholar] [CrossRef]
- Giada, S.; Groeve, T.D.; Ehrlich, D.; Soille, P. Information extraction from very high resolution satellite imagery over Lukole refugee camp, Tanzania. Int. J. Remote Sens. 2003, 24, 4251–4266. [Google Scholar] [CrossRef]
- Bally, P.; Bequignon, J.; Arino, O.; Briggs, S. Remote sensing and humanitarian aid: A life-saving combination. ESA Bull. 2005, 122, 36–41. [Google Scholar]
- Baumann, M.; Radeloff, V.C.; Avedian, V.; Kuemmerle, T. Land use change in the Caucasus during and after the Nagorno-Karabakh conflict. Reg Environ. Chang. 2015, 15, 1703–1716. [Google Scholar] [CrossRef]
- UNGA ECOSOC. Strengthening of the Coordination of Emergency Humanitarian Assistance of the United Nations, Report of the Secretary-General (New York: United Nations General Assembly Economic and Social Council). 2018. Available online: https://reliefweb.int/sites/reliefweb.int/files/resources/N1810014.pdf (accessed on 27 August 2018).
- Smith, J.H. Land Cover Changes in the Bosawas Region of Nicaragua 1986–1995/1996. Ph.D. Thesis, University of Georgia, Athens, GA, USA, 1998. Available online: http://adsabs.harvard.edu/abs/1998PhDT.......449S (accessed on 27 August 2018).
- Haavisto, P. Environmental post-conflict assessments: A new UN tool developed by UNEP. In Security and Environment in the Mediterranean. Hexagon Series on Human and Environmental Security and Peace, 1st ed.; Brauch, H.G., Liotta, P.H., Marquina, A., Rogers, P.F., Selim, M., Eds.; Springer: Berlin/Heidelberg, Germany, 2003; Volume 1, pp. 535–562. [Google Scholar] [CrossRef]
- Müller, M.F.; Yoon, J.; Gorelicka, M., St.; Nicolas, A.; Tilmantc, A. Impact of the Syrian refugee crisis on land use and transboundary freshwater resources. Proc. Natl. Acad. Sci. USA 2016, 113, 14933–14937. [Google Scholar]
- Hammad, M.; Mucsi, L.; Boudewijn van Leeuwen, V. Land cover change investigation in the southern syrian coastal basins during the past 30-years using Landsat remote sensing data. J. Environ. Geogr. 2018, 11, 45–51. [Google Scholar] [CrossRef] [Green Version]
- Houmsi, M.R.; Sanusi Shiru, M.; Nashwan, M.S.; Ahmed, K.; Ziarh, G.F.; Shahid, S.; Chung, E.-S.; Kim, S. Spatial shift of aridity and its impact on land use of Syria. Sustainability 2019, 11, 7047. [Google Scholar] [CrossRef] [Green Version]
- Al-Fares, W. Historical Land Use/Land Cover Classification using Remote Sensing—A Case Study of the Euphrates River Basin in Syria; Springer: Berlin, Germany, 2012; Available online: https://link.springer.com/content/pdf/10.1007%2F978-3-319-00624-6.pdf (accessed on 26 June 2018).
- FAO. Irrigation in the Middle East Region in Figures (AQUASTAT Survey—2008); Frenken, K., Ed.; FAO Water Reports; FAO: Rome: Italy, 2009; Available online: http://www.fao.org/docrep/pdf/012/i0936e/i0936e00.pdf (accessed on 26 June 2018).
- Climate-Change Atlas of Syria. Available online: https://www.researchgate.net/publication/311666757_Climate-Change_Atlas_of_Syria (accessed on 19 June 2020).
- Climate Data Historical. Available online: https://climateknowledgeportal.worldbank.org/country/syria/climate-data-historical (accessed on 26 June 2020).
- Statistical abstracts of central Bureau of Statistics (CBS). 2017. Available online: http://cbssyr.sy/yearbook-EN.htm (accessed on 26 June 2018).
- Syrian Arab Republic: Whole of Syria Protection Sector—2018 Protection Needs Overview (October 2017). Available online: https://reliefweb.int/report/syrian-arab-republic/syrian-arab-republic-whole-syria-protection-sector-2018-protection-needs (accessed on 23 June 2018).
- Statistical Abstracts of Central Bureau of Statistics (CBS). 2010. Available online: http://cbssyr.sy/yearbook-EN.htm (accessed on 26 June 2018).
- Distribution of Zones of Influence in Syria. Available online: http://norsforstudies.org/category/mapsinfographic/maps/ (accessed on 6 October 2019).
- Armed Conflict in Syria: Overview and, U.S. Response, Updated 25 March 2019. Available online: https://crsreports.congress.gov/product/pdf/download/RL/RL33487/RL33487.pdf/ (accessed on 6 October 2019).
- Syria’s ‘De-Escalation Zones’ Explained. Available online: https://www.aljazeera.com/news/2017/05/syria-de-escalation-zones-explained-170506050208636.html (accessed on 24 August 2018).
- USGS. Landsat Data Sets. Available online: https://earthexplorer.usgs.gov (accessed on 27 August 2018).
- Irons, J.R.; Dwyer, J.L.; Barsi, J.A. The next Landsat satellite: The Landsat data continuity mission. Remote Sens Environ. 2012, 122, 11–21. [Google Scholar] [CrossRef] [Green Version]
- Wulder, M.A.; Masek, J.G.; Cohen, W.B.; Loveland, T.R.; Woodcock, C.E. Opening the archive: How free data has enabled the science and monitoring promise of Landsat. Remote Sens. Environ. 2012, 122, 2–10. [Google Scholar] [CrossRef]
- Tucker, C.J.; Grant, D.M.; Dykstra, J.D. NASA’s global orthorectified Landsat data set. Photogramm. Eng. Remote Sens. 2004, 70, 313–322. [Google Scholar] [CrossRef] [Green Version]
- Lu, D.; Weng, Q. A survey of image classification methods and techniques for improving classification performance. Int. J. Remote Sens. 2007, 28, 823–870. [Google Scholar] [CrossRef]
- Celis, D.; De Pauw, E.; Geerken, R. Assessment of Land Cover and Land Use in Central and West. Asia and North. Africa (CWANA) Using AVHRR and Agroclimatic Data (Part 2: Hot Spots of Land Cover Change and Drought Vulnerability); ICARDA: Aleppo, Syria, 2007; p. 69. [Google Scholar]
- Mather, P.M.; Koch, M. Computer Processing of Remotely-Sensed Images: An. Introduction, 3rd ed.; John Wiley and Sons: Chichester, UK, 2011; pp. 325–375. [Google Scholar]
- Liu, J.G.; Mason, P.J. Essential Image Processing and GIS for Remote Sensing, 1st ed.; John Wiley & Sons Ltd.: Chichester, UK, 2009; pp. 105–119. [Google Scholar]
- Rocchini, D.; Rita, A.D. Relief effects on aerial photos geometric correction. Appl. Geogr. 2005, 25, 159–168. [Google Scholar] [CrossRef]
- El-Hattab, M.; Amany, S.M.; Lamia, G.E. Monitoring and assessment of urban heat islands over the Southern region of Cairo Governorate, Egypt. Egypt. J. Remote Sens. Space Sci. 2018, 21, 311–323. [Google Scholar] [CrossRef]
- Jensen, J. Introductory Digital Image Processing: A Remote Sensing Perspective, 3rd ed.; Pearson Prentice Hall: Upper Saddle River, NJ, USA, 2005; pp. 197–256. [Google Scholar]
- Zhou, J.Q.; Ye, Q.; Shao, Y.S.; Zhu, S.L.; Guan, Z.Q. Principles and Application of Remote Sensing; Wuhan University Press: Wuhan, China, 2014. [Google Scholar]
- Wang, H.; Zhang, Y.; Tsou, J.Y.; Li, Y. Surface urban heat island analysis of Shanghai (China) based on the change of land use and land cover. Sustainability 2017, 9, 1538. [Google Scholar] [CrossRef] [Green Version]
- Song, C.; Woodcock, C.E.; Seto, K.C.; Lenney, M.P.; Macomber, S.A. Classification and change detection using Landsat TM data: When and how to correct atmospheric effects? Remote Sens. Environ. 2001, 75, 230–244. [Google Scholar] [CrossRef]
- Olsson, K. Remote Sensing for Fuelwood Resourses and Land Degradation Studies in Kordofan, the Sudan; Department of Geography, Royal University of Lund: Lund, Sweden, 1985. [Google Scholar]
- Roy, D.P.; Kovalskyy, V.; Zhang, H.K.; Vermote, E.F.; Yan, L.; Kumar, S.S.; Egorov, A. Characterization of Landsat-7 to Landsat-8 reflective wavelength and normalized difference vegetation index continuity. Remote Sens. Environ. 2016, 185, 57–70. [Google Scholar] [CrossRef] [PubMed] [Green Version]
- Lu, D.; Mausel, P.; Brondizio, E.; Moran, E. Change detection techniques. Int. J. Remote Sens. 2004, 25, 2365–2407. [Google Scholar] [CrossRef]
- Singh, A. Review Article digital change detection techniques using remotely-sensed data. Int. J. Remote Sens. 1989, 10, 989–1003. [Google Scholar] [CrossRef] [Green Version]
- Mas, J.F. Monitoring land-cover changes: A comparison of change detection techniques. Int. J. Remote Sens. 1999, 20, 139–152. [Google Scholar] [CrossRef]
- Dhakal, A.S.; Amada, T.; Aniya, M.; Sharma, R.R. Detection of areas associated with flood and erosion caused by a heavy rainfall using multitemporal Landsat TM data. Photogramm. Eng. Remote Sens. 2002, 68, 233–239. [Google Scholar]
- Coppin, P.; Jonckheere, I.; Nackaerts, K.; Muys, B.; Lambin, E. Digital change detection methods in ecosystem monitoring: A review. Int. J. Remote Sens. 2004, 25, 1565–1596. [Google Scholar] [CrossRef]
- Foody, G.M.; Mathur, A.; Sanchez-Hernandez, C.; Boyd, D.S. Training set size requirements for the classification of a specific class. Remote Sens. Environ. 2006, 104, 1–14. [Google Scholar] [CrossRef]
- Wellens, J. Rangeland vegetation dynamics and moisture availability in Tunisia: An investigation using satellite and meteorological data. J. Biogeogr. 1997, 24, 845–855. [Google Scholar] [CrossRef]
- Lillesand, M.T.; Kiefer, R.W.; Chipman, J.W. Remote Sensing and Image Interpretation, 7th ed.; Wiley Global Education: Hoboken, NJ, USA, 2015; pp. 517–555. [Google Scholar]
- Congalton, R.G. A review of assessing the accuracy of classifications of remotely sensed data. Remote Sens. Environ. 1991, 37, 35–46. [Google Scholar] [CrossRef]
- Congalton, R.G.; Green, K. Assessing the Accuracy of Remotely Sensed Data: Principles and Practices, 2nd ed.; CRC Press Taylor & Francis Group: Boca Raton, FL, USA, 2009; pp. 121–140. [Google Scholar]
- FAO. Map Accuracy Assessment and Area Estimation: A Practical Guide; FAO: Rome, Italy, 2016; pp. 31–34. Available online: http://www.fao.org/3/a-i5601e.pdf (accessed on 26 June 2020).
- Köhl, M.; Magnussen, S.S.; Marchetti, M. Sampling Methods, Remote Sensing and GIS Multiresource Forest Inventory, 3rd ed.; Springer: Berlin/Heidelberg, Germany, 2006; pp. 71–195. [Google Scholar]
- Eklund, L.; Persson, A.; Petter Pilesjo, P. Cropland changes in times of conflict, reconstruction, and economic development in Iraqi Kurdistan. Ambio 2016, 45, 78–88. [Google Scholar] [CrossRef] [Green Version]
- Olofsson, P.; Foody, G.M.; Herold, M.; Stehman, S.V.; Woodcock, C.E.; Wulder, M.A. Good practices for estimating area and assessing accuracy of land change. Remote Sens. Environ. 2014, 148, 42–57. [Google Scholar] [CrossRef]
- Olofsson, P.; Foody, G.M.; Foody, G.M.; Stehman, S.V.; Woodcock, C.E.; Wulder, M.A. Making better use of accuracy data in land change studies: Estimating accuracy and area and quantifying uncertainty using stratified estimation. Remote Sens. Environ. 2013, 129, 122–131. [Google Scholar] [CrossRef]
- Statistical Abstracts of Central Bureau of Statistics (CBS). 2014. Available online: http://cbssyr.sy/yearbook-EN.htm (accessed on 26 June 2018).
- Counting the Cost: Agriculture in Syria after Six Years of Crisis. Available online: http://www.fao.org/emergencies/resources/documents/resources-detail/en/c/878213/ (accessed on 24 June 2018).
- Syrian Arab Republic: 2019 Humanitarian Response Plan (January–December 2019). Available online: https://reliefweb.int/report/syrian-arab-republic/syrian-arab-republic-2019-humanitarian-response-plan-january-december-0 (accessed on 4 May 2020).
- The Importance of the Agricultural Sector for Syria’s Stability. Available online: https://syria.chathamhouse.org/research/the-importance-of-the-agricultural-sector-for-syrias-stability (accessed on 24 August 2018).
- Syrian Agricultural Production Drops Massively as Conflict Continues. Available online: http://www.fao.org/news/story/en/item/168676/icode/ (accessed on 17 March 2020).
- Syria Food Production at All-Time Low. Available online: http://www.fao.org/news/story/en/item/452217/icode/ (accessed on 17 March 2020).
- Statistical Abstracts of Central Bureau of Statistics (CBS). 2016. Available online: http://cbssyr.sy/yearbook-EN.htm (accessed on 26 June 2018).
- The World Bank in Syrian Arab Republic. Available online: https://www.worldbank.org/en/country/syria/overview (accessed on 24 August 2018).
- Eklund, L.; Degerald, M.; Brandt, M.; Prishchepov, A.V.; Pilesjö, P. How conflict affects land use: Agricultural activity in areas seized by the Islamic State. Environ. Res. Lett. 2017, 12, 1–10. [Google Scholar] [CrossRef] [Green Version]
- Jaafar, H.; Woertz, E. Agriculture as a funding source of ISIS: A GIS and remote sensing analysis. Food Policy 2016, 64, 14–25. [Google Scholar] [CrossRef] [Green Version]
- Encountering Biodiversity in the Semi-Arid Rangelands of the Syrian Arab Republic. Available online: http://www.fao.org/3/y5097e/y5097e00.htm#Contents (accessed on 2 September 2018).
- Louhaichi, M.; Tastad, A. The Syrian Steppe: Past Trends, Current Status, and Future Priorities. Rangelands 2010, 23, 2–7. [Google Scholar] [CrossRef] [Green Version]
- Syria Conflict Overview: 2011–2018, Updated 25 January 2019. Available online: https://crsreports.congress.gov/product/pdf/download/IF/IF11080/IF11080.pdf/ (accessed on 6 October 2019).
- Syria’s Desert Hawks and the Loyalist Response to ISIS. Available online: https://smallwarsjournal.com/jrnl/art/syria%E2%80%99s-desert-hawks-and-the-loyalist-response-to-isis (accessed on 19 March 2020).
- Syria: Al Hol Refugee/IDP Camp—General Infrastructure—Shelter Counts as of 8 March 2019. Available online: https://reliefweb.int/map/syrian-arab-republic/syria-al-hol-refugee-idp-camp-general-infrastructure-shelter-counts-8-march (accessed on 18 March 2020).
- The Syrian Desert Hawks: Flying no More. Available online: https://www.clingendael.org/sites/default/files/2020-02/Policy_brief_Desert_Hawks_February_2020.pdf (accessed on 19 March 2020).
- War on The Forests of The Syrian Coast. Available online: https://syriauntold.com/2019/06/06/war-on-the-forests-of-the-syrian-coast/ (accessed on 19 March 2020).
- The Impact of the Conflict on Population Displacement, Water and Agriculture in the Orontes River basin, February 2014. Available online: https://reliefweb.int/report/syrian-arab-republic/syria-impact-conflict-population-displacement-water-and-agriculture (accessed on 4 September 2019).
- Churchesa, E.C.; Wamplera, P.J.; Sun, W.; Smith, A.J. Evaluation of forest cover estimates for Haiti using supervised classification of Landsat data. Remote Sens. Environ. 2014, 30, 203–216. [Google Scholar] [CrossRef] [Green Version]
- The Legacy of ISIS—anufactured Mines in Raqqa. Available online: https://www.atlanticcouncil.org/blogs/syriasource/the-legacy-of-isis-manufactured-mines-in-raqqa/ (accessed on 23 August 2018).
- World Health Organization: Syrian Arab Republic, Annual Report 2017. Available online: https://reliefweb.int/report/syrian-arab-republic/world-health-organization-syrian-arab-republic-annual-report-2017 (accessed on 27 August 2019).
- Special Report: For Islamic State, Wheat Season Sows Seeds of Discontent. Available online: https://www.reuters.com/article/us-mideast-crisis-planting-specialreport-idUSKBN0KT0W420150120 (accessed on 26 August 2018).
- Syria’s Oil, Gas and Water—The Immiscible Solution to the War in Syria. Available online: https://limacharlienews.com/mena/syria-oil-gas-war-in-syria/ (accessed on 25 August 2019).
- U.S.’s Syria Ally Supplies Oil to Assad’s Brokers. Available online: https://www.wsj.com/articles/u-s-s-syria-ally-supplies-oil-to-assads-brokers-11549645073 (accessed on 26 August 2019).
- Sectarianism in Syria’s Civil War A Geopolitical Study. Available online: https://www.washingtoninstitute.org/policy-analysis/view/sectarianism-in-syrias-civil-war (accessed on 27 August 2019).
- Clerc, V. Informal settlements in the Syrian conflict: Urban planning as a weapon. Built Environ. 2014, 40, 34–51. [Google Scholar] [CrossRef]
- Wilson, C. Spectral analysis of civil conflict-induced forced migration on land-use/land-cover change: The case of a primate and lower-ranked cities in Sierra Leone. Int. J. Remote Sens. 2014, 35, 1094–1125. [Google Scholar] [CrossRef]
- Thornton, A.; Momoh, J.; Tengbe, P. Institutional capacity building for urban agriculture research using participatory GIS in post-conflict context: A case study of Sierra Leone. Australas. Rev. Afr. Stud. 2012, 33, 165–176. [Google Scholar]
- IDP Population in Camps & Informal Settlement—Idleb/Syria, 14 September 2018. Available online: https://reliefweb.int/sites/reliefweb.int/files/resources/reach_syr_map_idleb_idp_population_in_camps_informal_settlements_september_2018%20%282%29.pdf (accessed on 18 March 2020).
- Dangerous Liaisons: Russian Cooperation with Iran in Syria. Available online: https://www.csis.org/analysis/dangerous-liaisons-russian-cooperation-iran-syria (accessed on 20 March 2020).
- Iranian Appropriation of Syrian Defense Assets. Available online: https://www.idf.il/en/minisites/iran/iran-in-syria/iranian-appropriation-of-syrian-defense-assets/ (accessed on 20 March 2020).
- Syrian Cities Damage Atlas—Eight Year Anniversary of the Syrian Civil War: Thematic Assessment of Satellite Identified Damage. Available online: https://reliefweb.int/report/syrian-arab-republic/syrian-cities-damage-atlas-eight-year-anniversary-syrian-civil-war (accessed on 29 August 2019).
- How Seven Years of War Turned Syria’s Cities into ‘Hell on Earth’. Available online: https://edition.cnn.com/2018/03/15/middleeast/syria-then-now-satellite-intl/index.html (accessed on 29 August 2019).
- Temudo, M.P.; Silva, J.M. Agriculture and forest cover changes in post-war Mozambique. J. Land Use Sci. 2012, 7, 425–442. [Google Scholar] [CrossRef]
- Hagenlocher, M.; Lang, S.; Tiede, D. Integrated assessment of the environmental impact of an IDP camp in Sudan based on very high resolution multi-temporal satellite imagery. Remote Sens. Environ. 2012, 126, 27–38. [Google Scholar] [CrossRef]
- Karnieli, A.; Shtein, A.; Panov, N.; Weisbrod, N.; Tal, A. Was drought really the trigger behind the syrian civil war in 2011? Water 2019, 11, 1564. [Google Scholar] [CrossRef] [Green Version]
- Syrian Crisis Altered Region’s Land and Water Resources, Stanford Study Finds. Available online: https://news.stanford.edu/2016/12/05/syrian-crisis-altered-regions-land-water-resources/ (accessed on 30 August 2019).
- Jaafar, H.H.; Zurayk, R.; King, C.; Ahmad, F.; Al-Outa, R. Impact of the Syrian conflict on irrigated agriculture in the Orontes Basin. Int. J. Water Resour. Dev. 2015, 31, 436–449. [Google Scholar] [CrossRef]
- Agriculture in Syria. Available online: https://reliefweb.int/sites/reliefweb.int/files/resources/133%20Agriculture%20in%20Syria.pdf (accessed on 21 March 2020).
- Running out of Water: Conflict and Water Scarcity in Yemen and Syria. Available online: https://www.atlanticcouncil.org/blogs/menasource/running-out-of-water-conflict-and-water-scarcity-in-yemen-and-syria/ (accessed on 24 August 2018).
- Is Massive Dam about to Collapse and Flood Raqqa? ISIS Orders Locals to Evacuate Claiming American Strikes Have Made it Unsafe. Available online: https://www.dailymail.co.uk/news/article-4352880/Is-massive-dam-collapse-flood-Raqqa.html (accessed on 3 September 2019).
- Syria Crisis: Ar-Raqqa Situation. Available online: https://www.humanitarianresponse.info/en/operations/whole-of-syria/document/syria-crisis-ar-raqqa-situation-update-no-1-31-january-2017 (accessed on 3 September 2019).
- U.N. Warns of Catastrophic Dam Failure in Syria Battle. Available online: https://www.reuters.com/article/us-mideast-crisis-syria-dam-idUSKBN15U1DZ (accessed on 3 September 2019).
- Åkesson, U.; Knud Falk, K. Climate Change in Syria—Trends, Projections and Implications—Background Document for Sida´s Development of a Results Strategy for Syria 2015; Sida’s Helpdesk for Environment and Climate Change: Stockholm, Sweden, 2015; pp. 1–16. Available online: https://sidaenvironmenthelpdesk.se/digitalAssets/1725/1725298_climate-change-in-syria-final-draft-background-doc-helpdesk-env-and-cc.pdf (accessed on 17 March 2020).
- Gleick, P.H. Water, Drought, Climate Change, and Conflict in Syria; American Meteorological Society: Boston, MA, USA, 2014; pp. 331–340. [Google Scholar] [CrossRef]
- Hoegh-Guldberg, O.; Jacob, D.; Taylor, M.; Bindi, M.; Brown, S.; Camilloni, I.; Diedhiou, A.; Djalante, R.; Ebi, K.; Engelbrecht, F.; et al. Impacts of 1.5 °C global warming on natural and human systems. In Book Global Warming of 1.5 °C: An IPCC Special Report; Masson-Delmotte, V., Zhai, P., Pörtner, H.O., Roberts, D., Skea, J., Shukla, P.R., Pirani, A., Moufouma-Okia, W., Péan, C., Pidcock, R., et al., Eds.; IPCC Secretariat: Geneva, Switzerland, 2018; pp. 175–311. Available online: https://researchportal.helsinki.fi/files/132136783/SR15_Approval_Chapter_3.pdf (accessed on 17 March 2020).
- Kelley, C.P.; Mohtadi, S.; Cane, M.C.; Seager, R.; Kushnir, Y. Climate change in the Fertile Crescent and implications of the recent Syrian drought. Proc. Natl. Acad. Sci. USA 2015, 112, 3241–3246. [Google Scholar] [CrossRef] [PubMed] [Green Version]
- Voski, A. The role of climate change in armed conflicts across the developing world and in the ongoing Syrian war. Carlet. Rev. Int. Aff. 2016, 3, 120–141. [Google Scholar] [CrossRef]
- Abela, J.G.; Brottragerb, M.; Cuaresmac, J.C.; Muttarakd, R. Climate, conflict and forced migration. Glob. Environ. Chang. 2019, 54, 239–249. [Google Scholar] [CrossRef]
- Abela, J.G.; Brottragerb, M.; Cuaresmac, J.C.; Muttarakd, R. On climate variability and civil war in Asia. Clim. Chang. 2014, 122, 709–721. [Google Scholar] [CrossRef] [Green Version]
- Is Climate Change Fueling Civil War? Available online: https://www.colorado.edu/today/2019/06/13/climate-change-fueling-civil-war (accessed on 30 May 2020).
- Climate Change Hastened Syria’s Civil War. Available online: https://www.scientificamerican.com/article/climate-change-hastened-the-syrian-war/ (accessed on 30 May 2020).
- CAN’s Military Advisory Board Reports: The Role of Water Stress in Instability and Conflict. Available online: https://www.cna.org/mab/reports (accessed on 24 April 2020).
- Rembold, F.; Meroni, M.; Toreti, A.; Perez-Hoyos, A.; Dimou, M. Summary of Climate Variability and Extremes and Their Main Impacts on Agricultural Production in 2018; Publications Office of the European Union: Luxembourg, 2019; pp. 6–9. Available online: http://publications.jrc.ec.europa.eu/repository/bitstream/JRC115803/climate_update_2018_final.pdf (accessed on 19 March 2020).
Figure 1.
Map of Syria, the 14-governorates administrative divisions (a), false colors composite of Landsat 8 OLI image of 2018 (band 6-5-4 as RGB) (b), spatial pattern of average yearly rainfall adapted from [67] (c), and average annual precipitation in Syria between 2010 and 2018 adapted from [67,68] (d).

Figure 2.
Distribution of zones of influence in Syria adapted from [72,73] at the end of 2010 (a), 2014 (b) and 2018 (c), and the share of land control between the warring parties adapted from [72] (d).

Figure 3.
Methodology flowchart performed in the study.

Figure 4.
LULC maps of the study area Syria for 2010 (a), 2014 (b), and 2018 (c). The area (in %) of LULC categories after computing adjusted area estimates is given in (d).
Figure 4.
LULC maps of the study area Syria for 2010 (a), 2014 (b), and 2018 (c). The area (in %) of LULC categories after computing adjusted area estimates is given in (d).


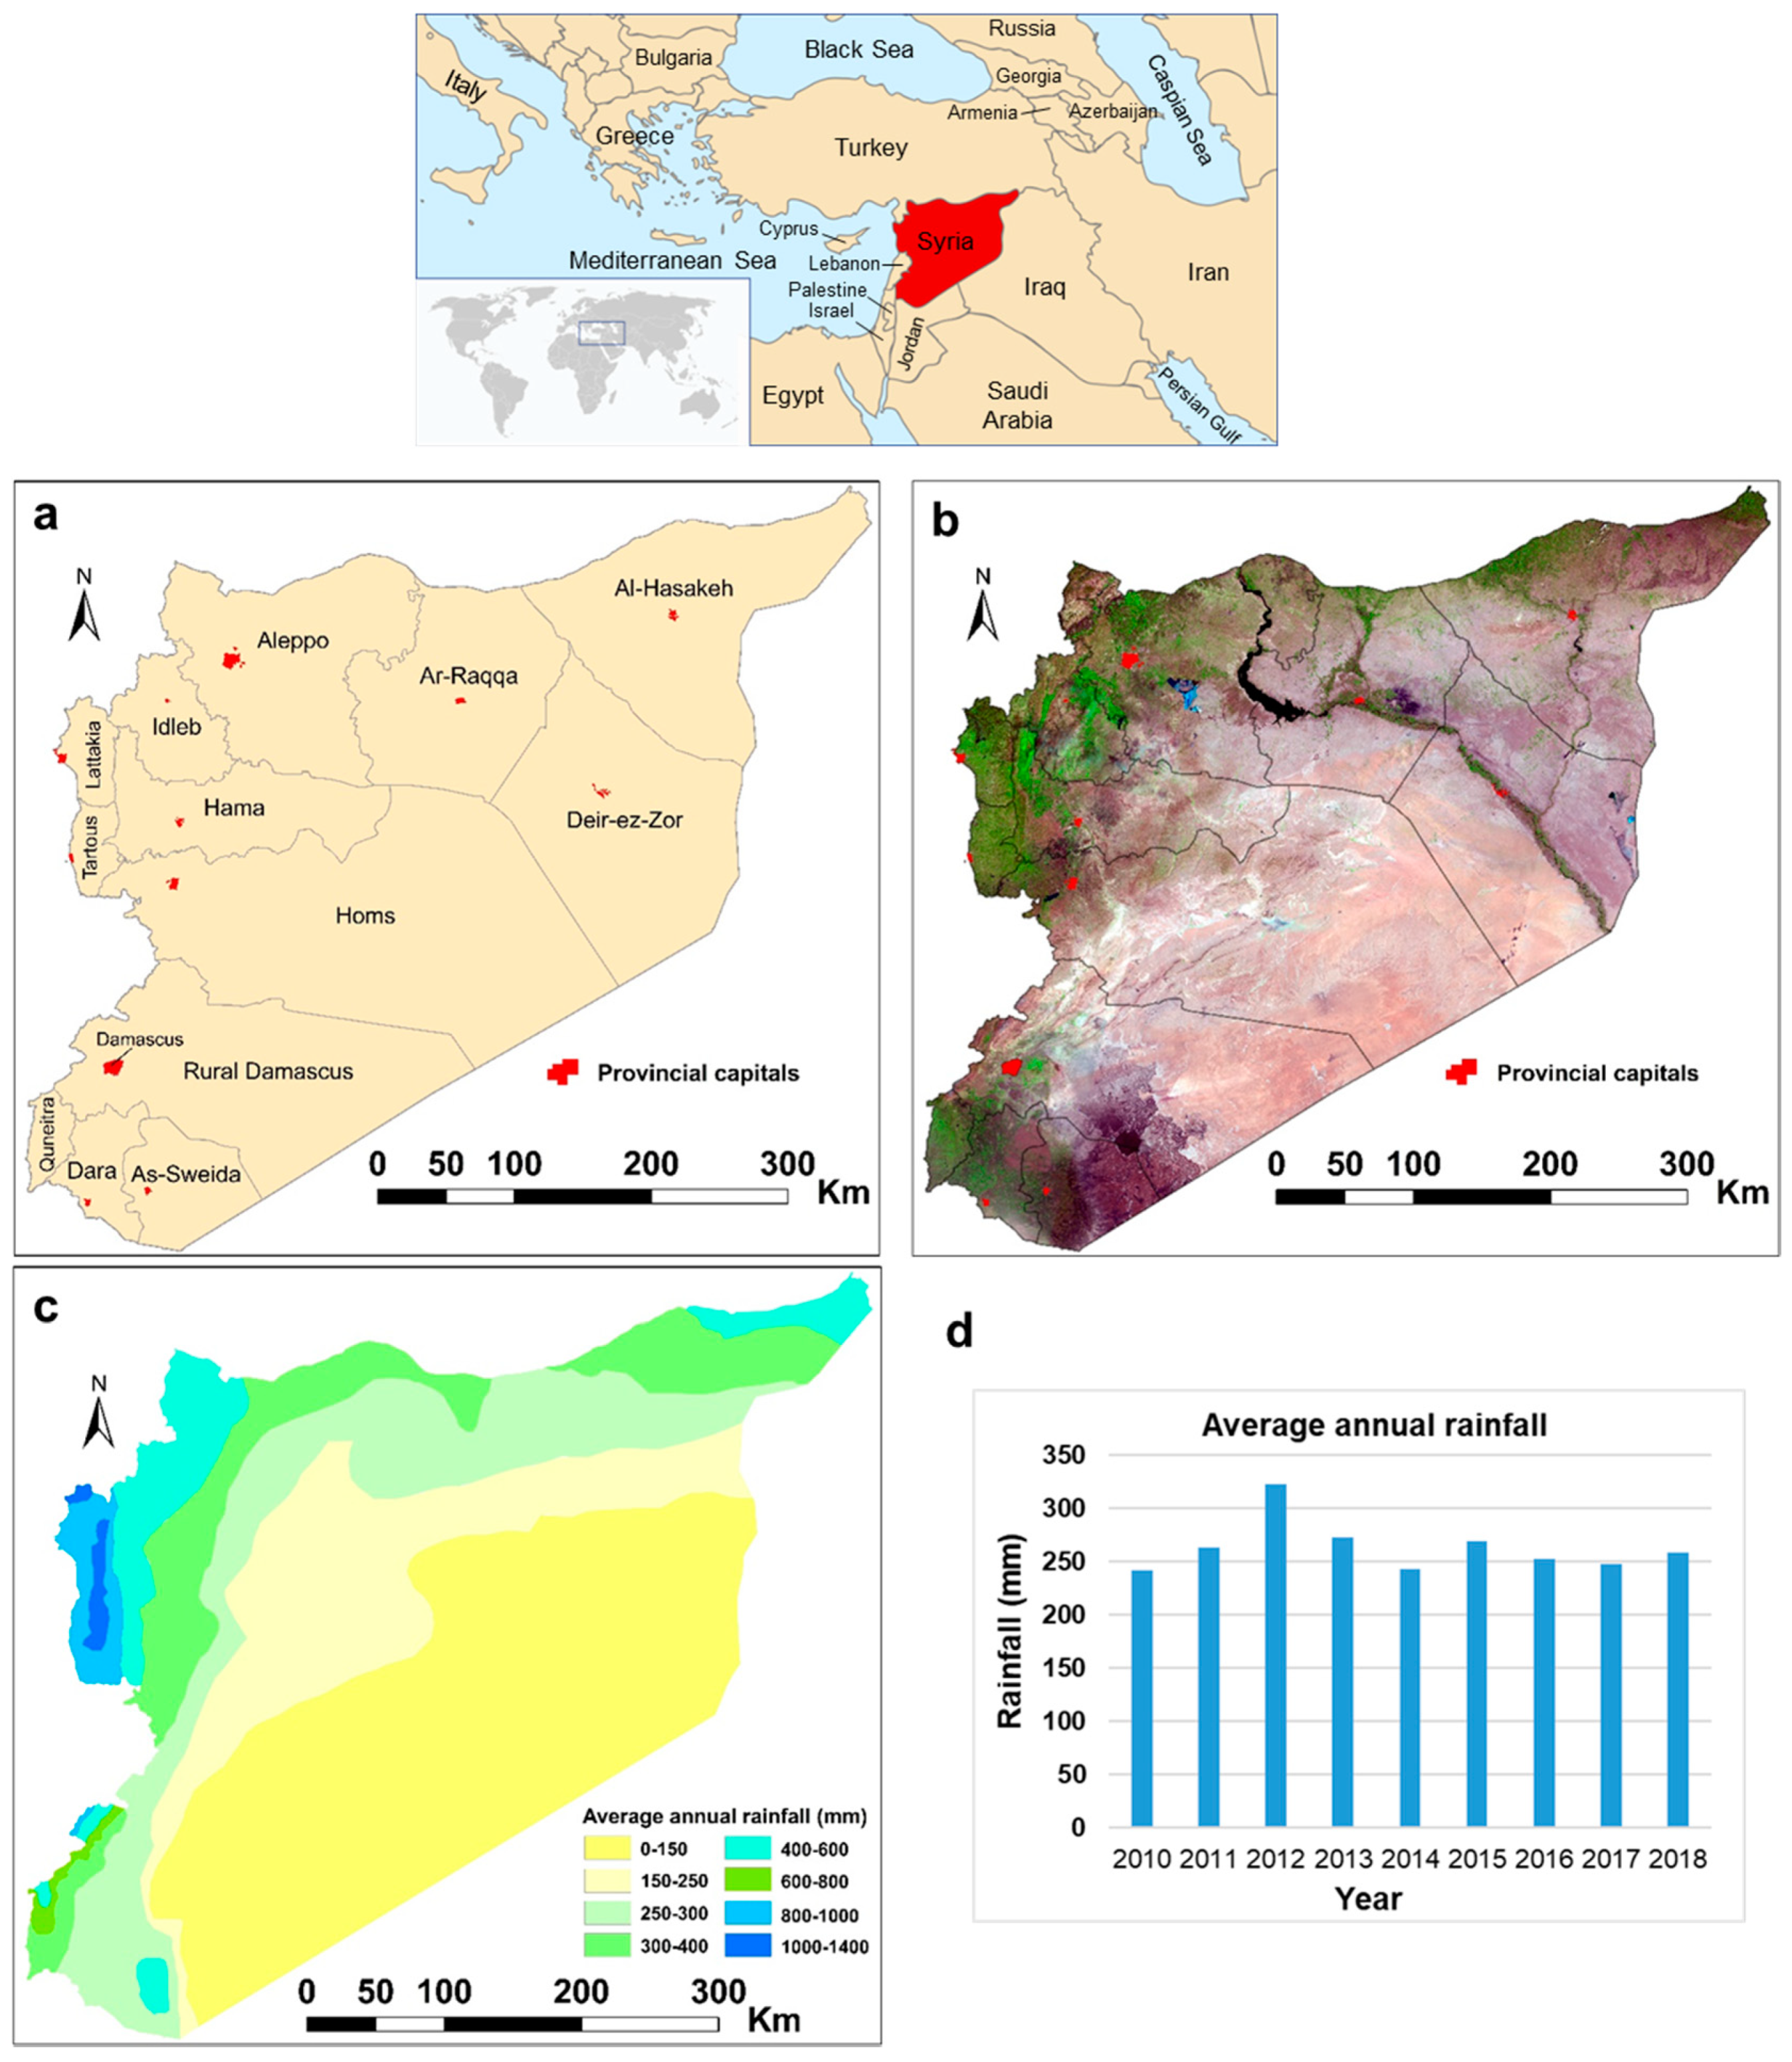
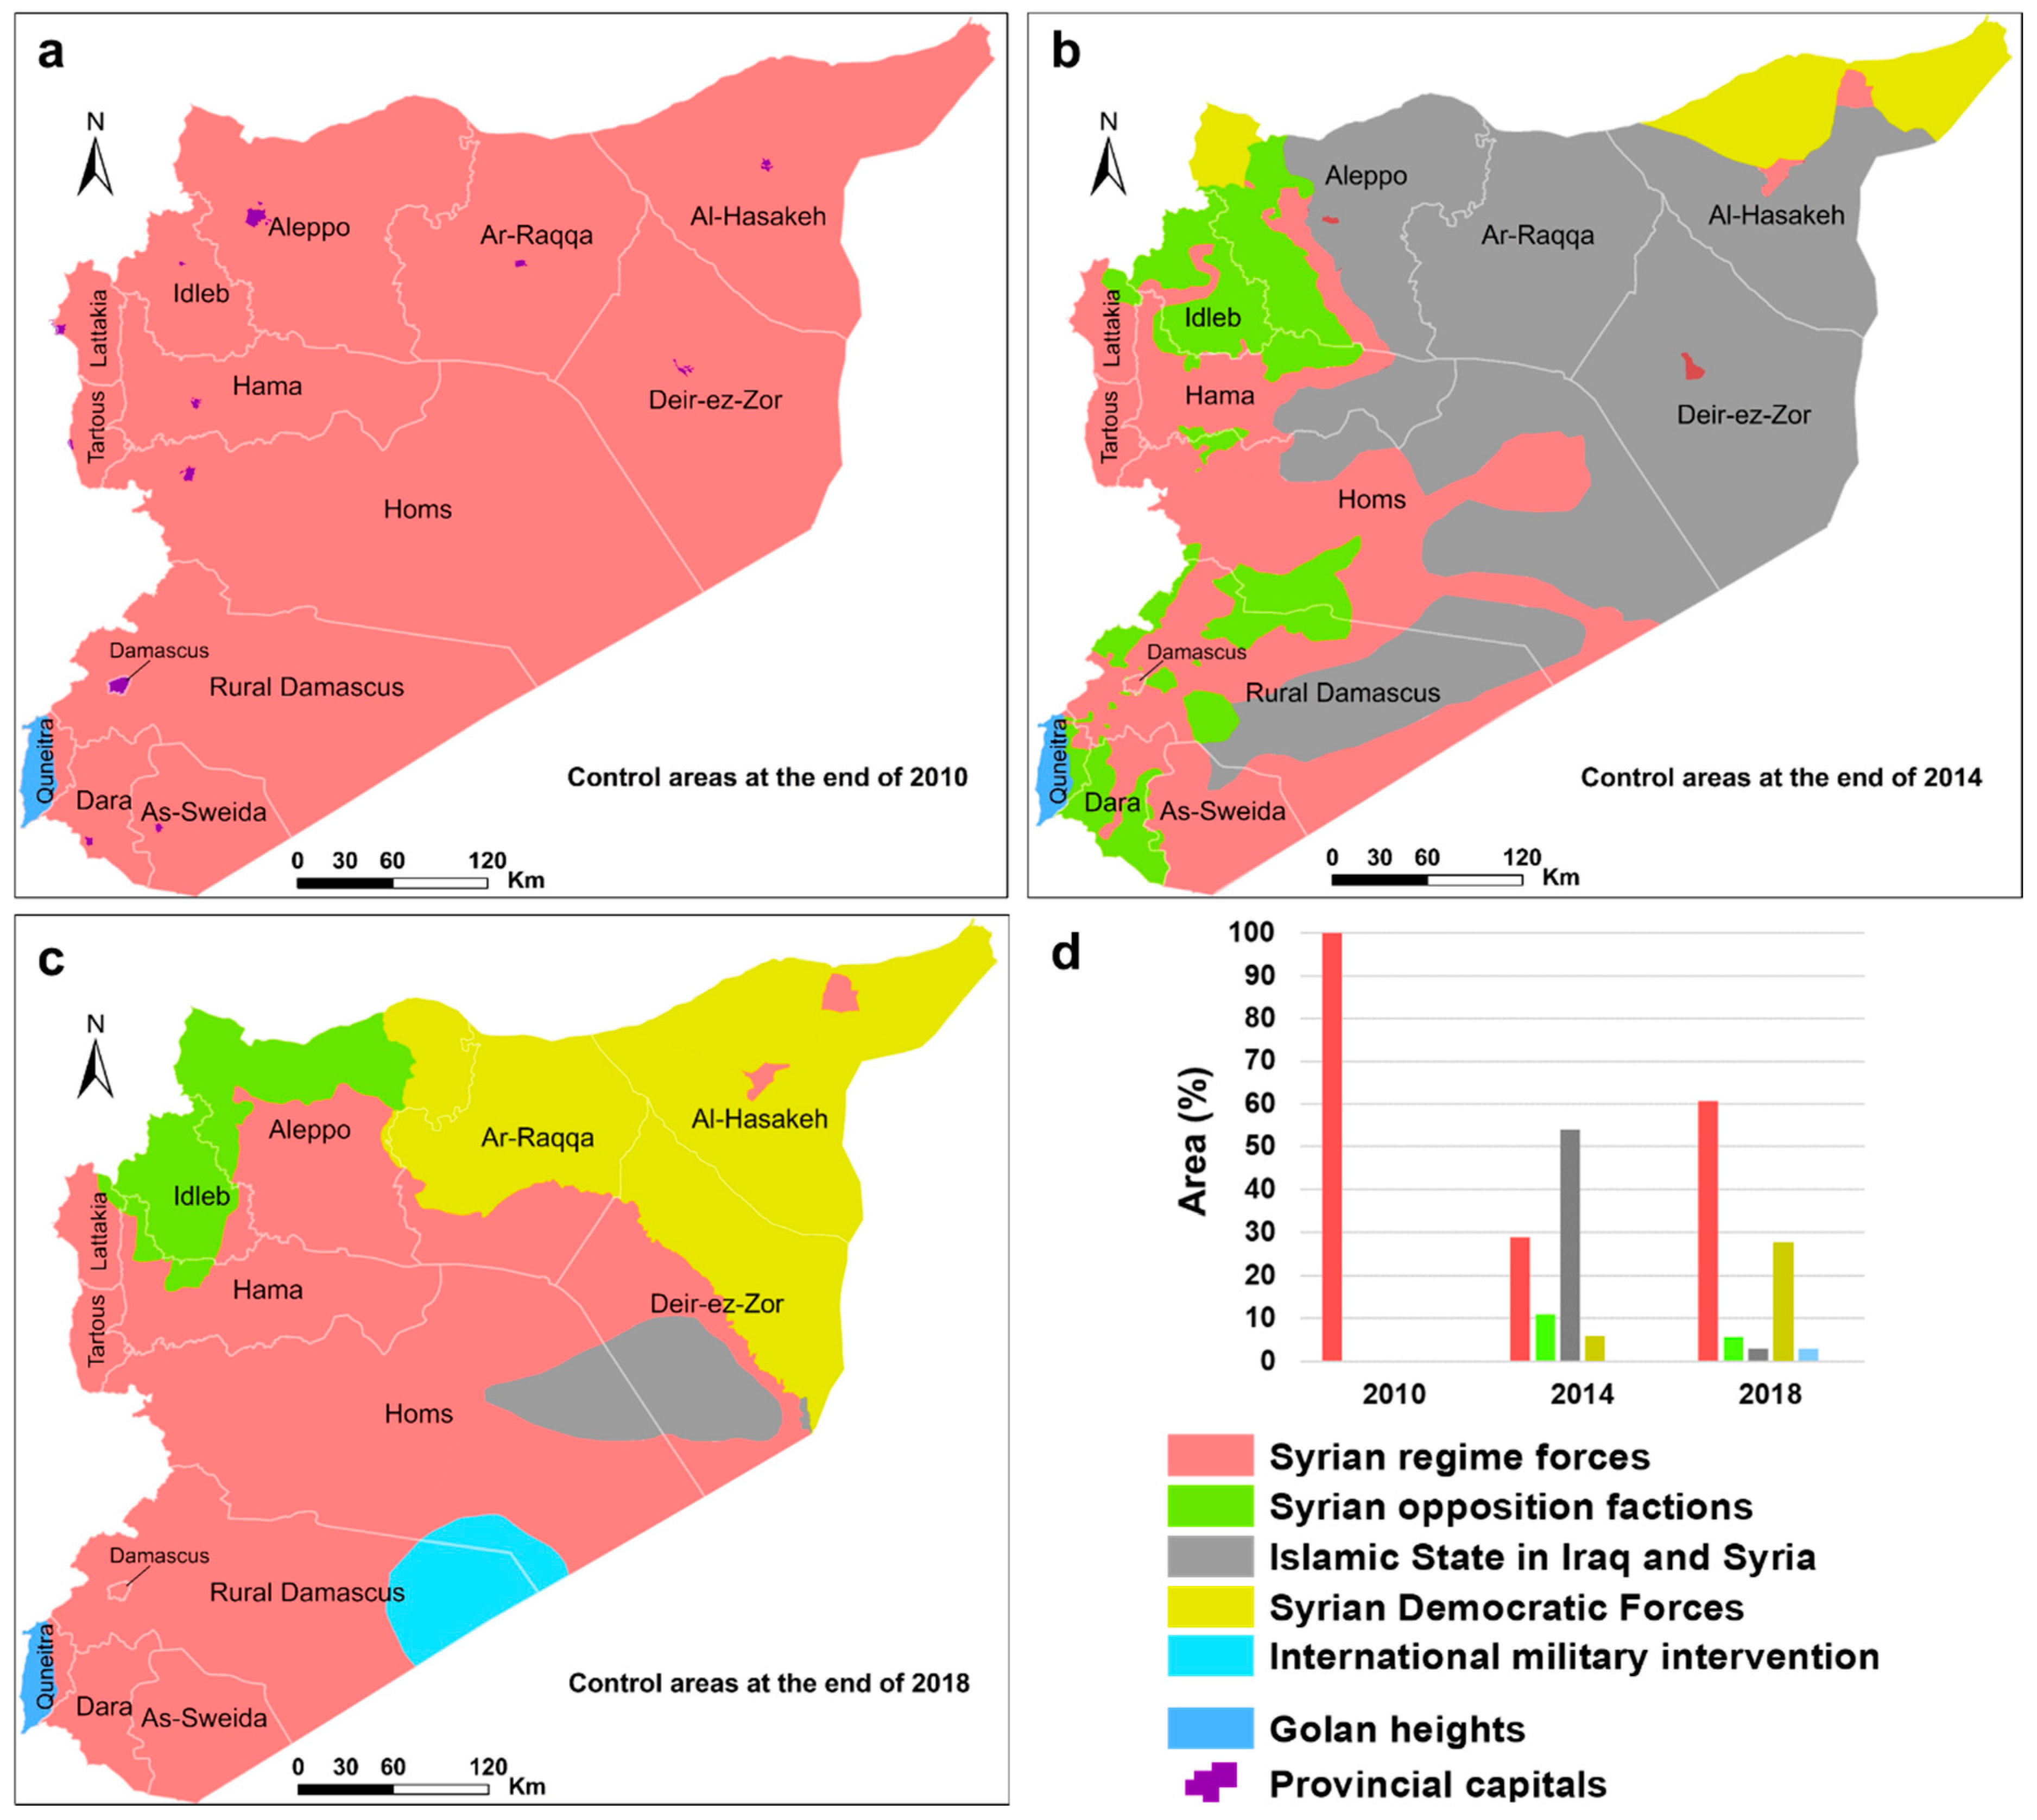
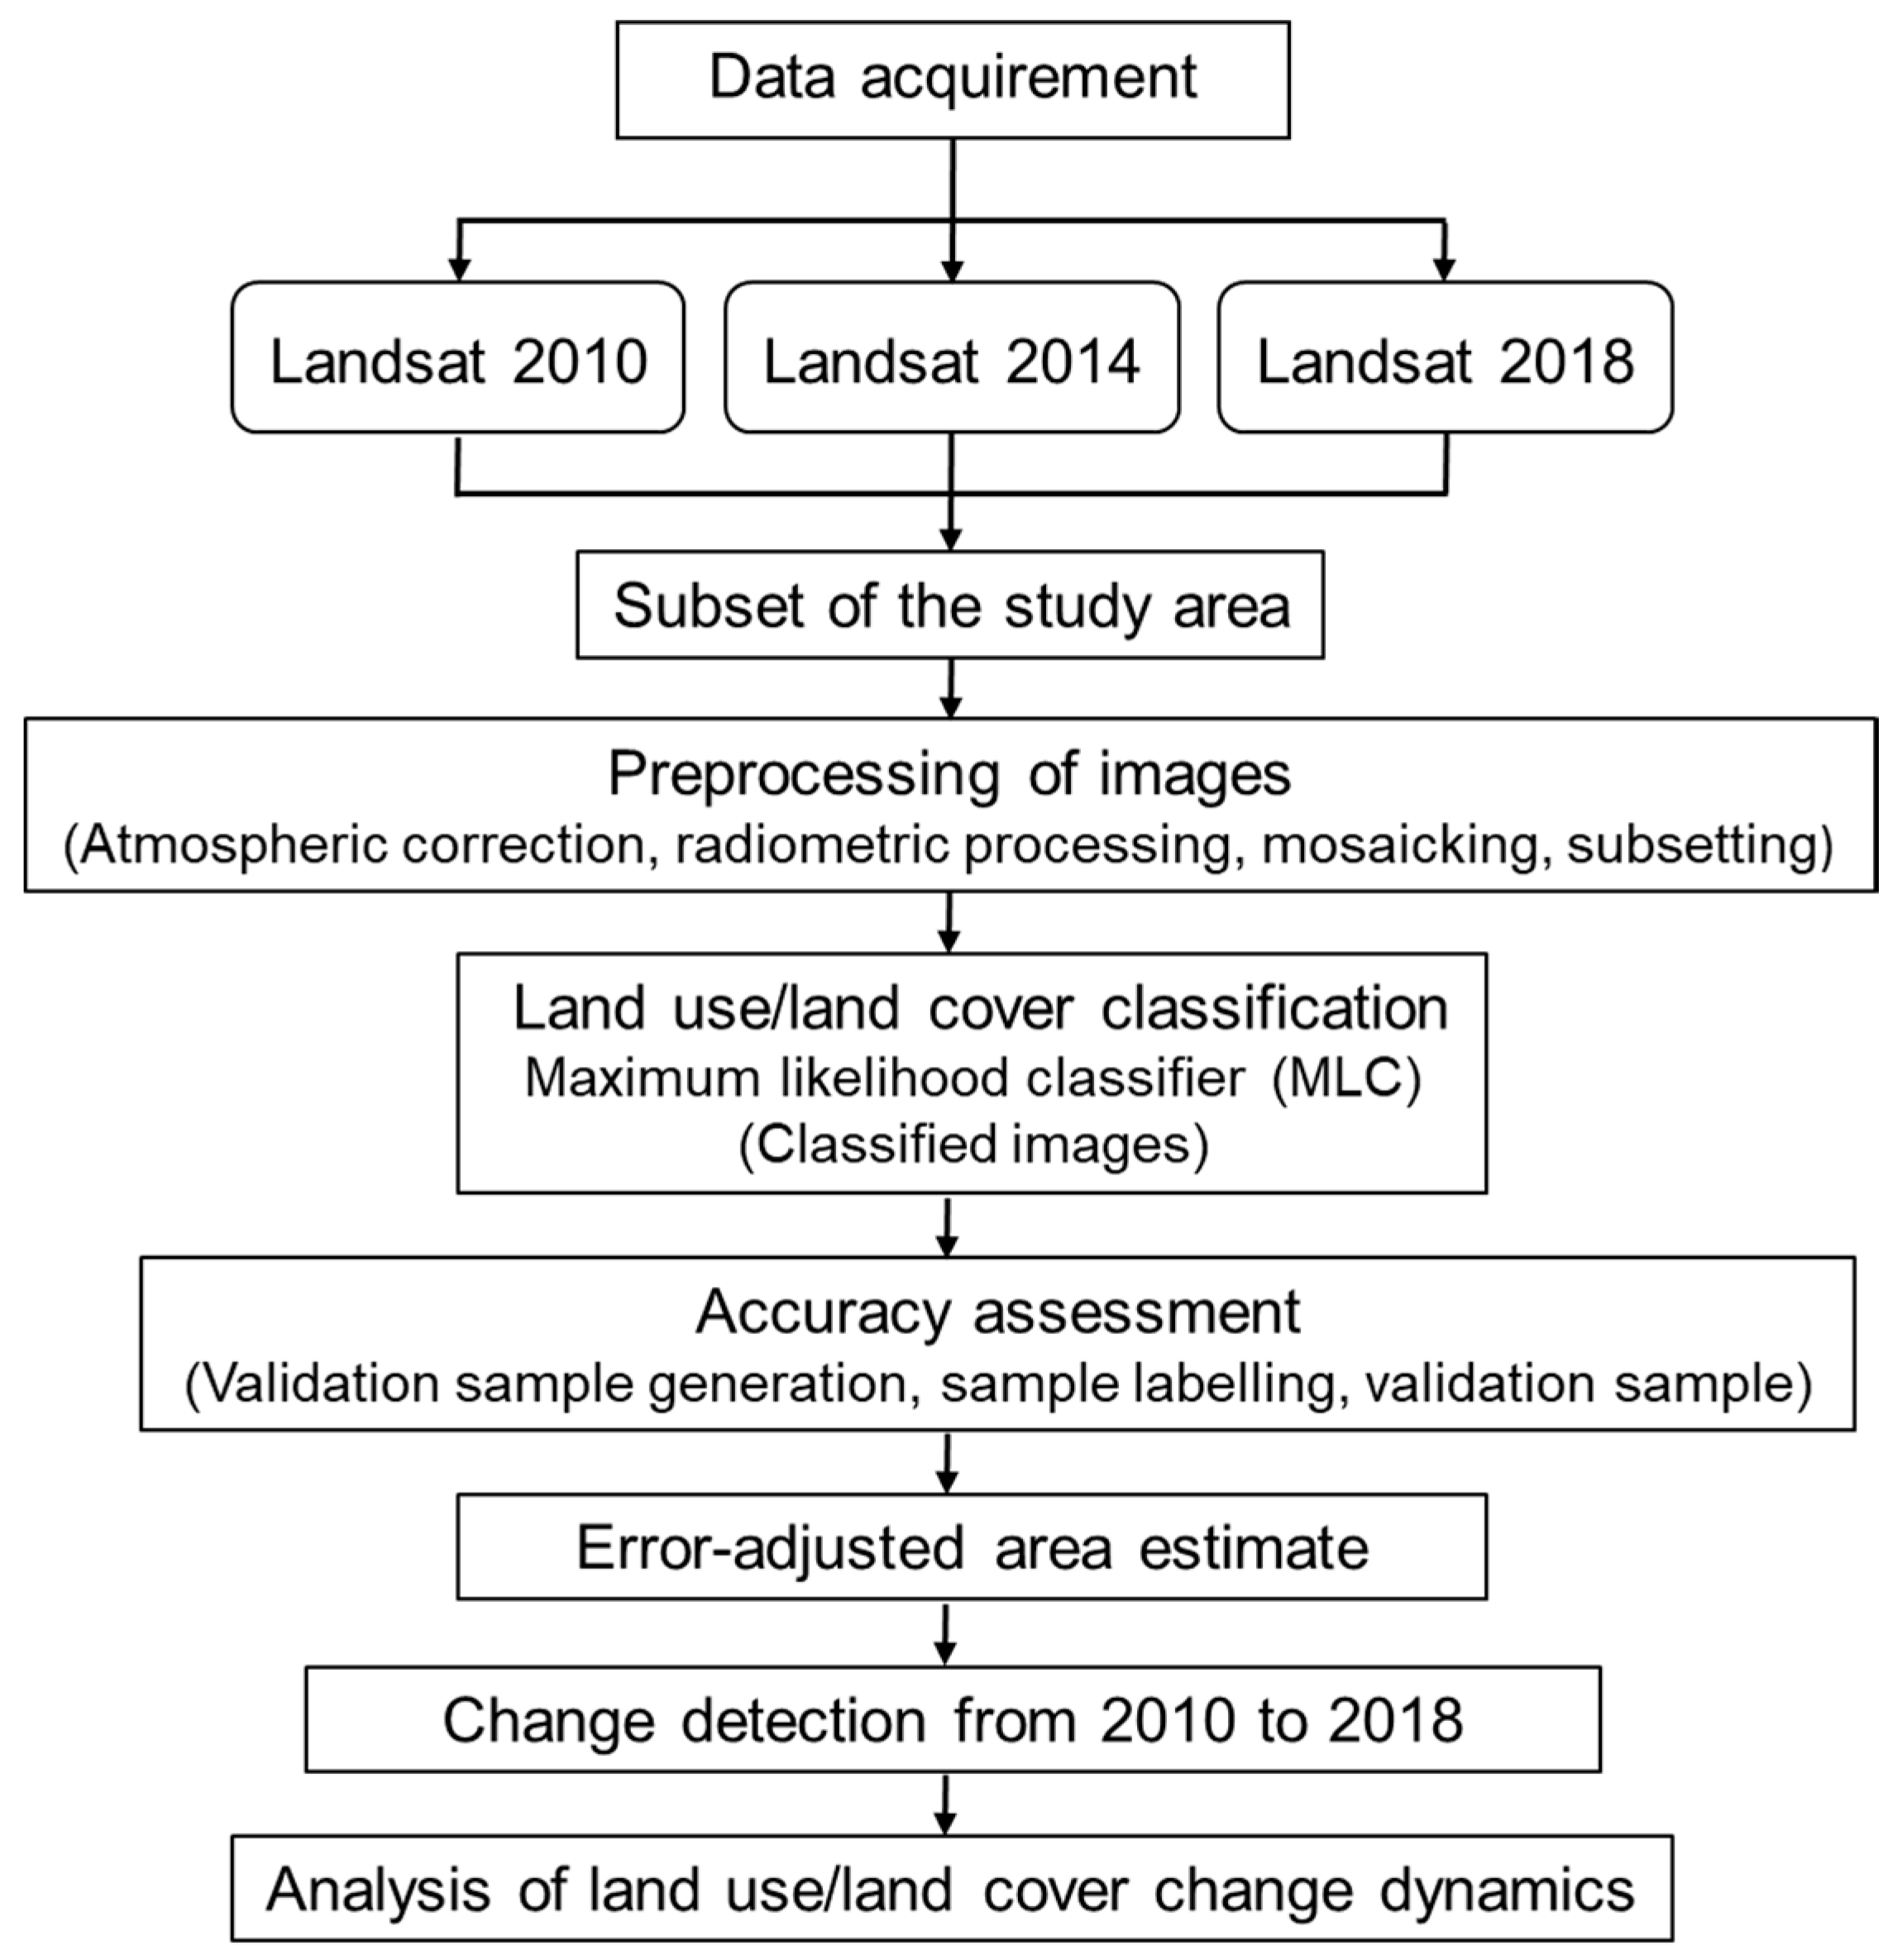
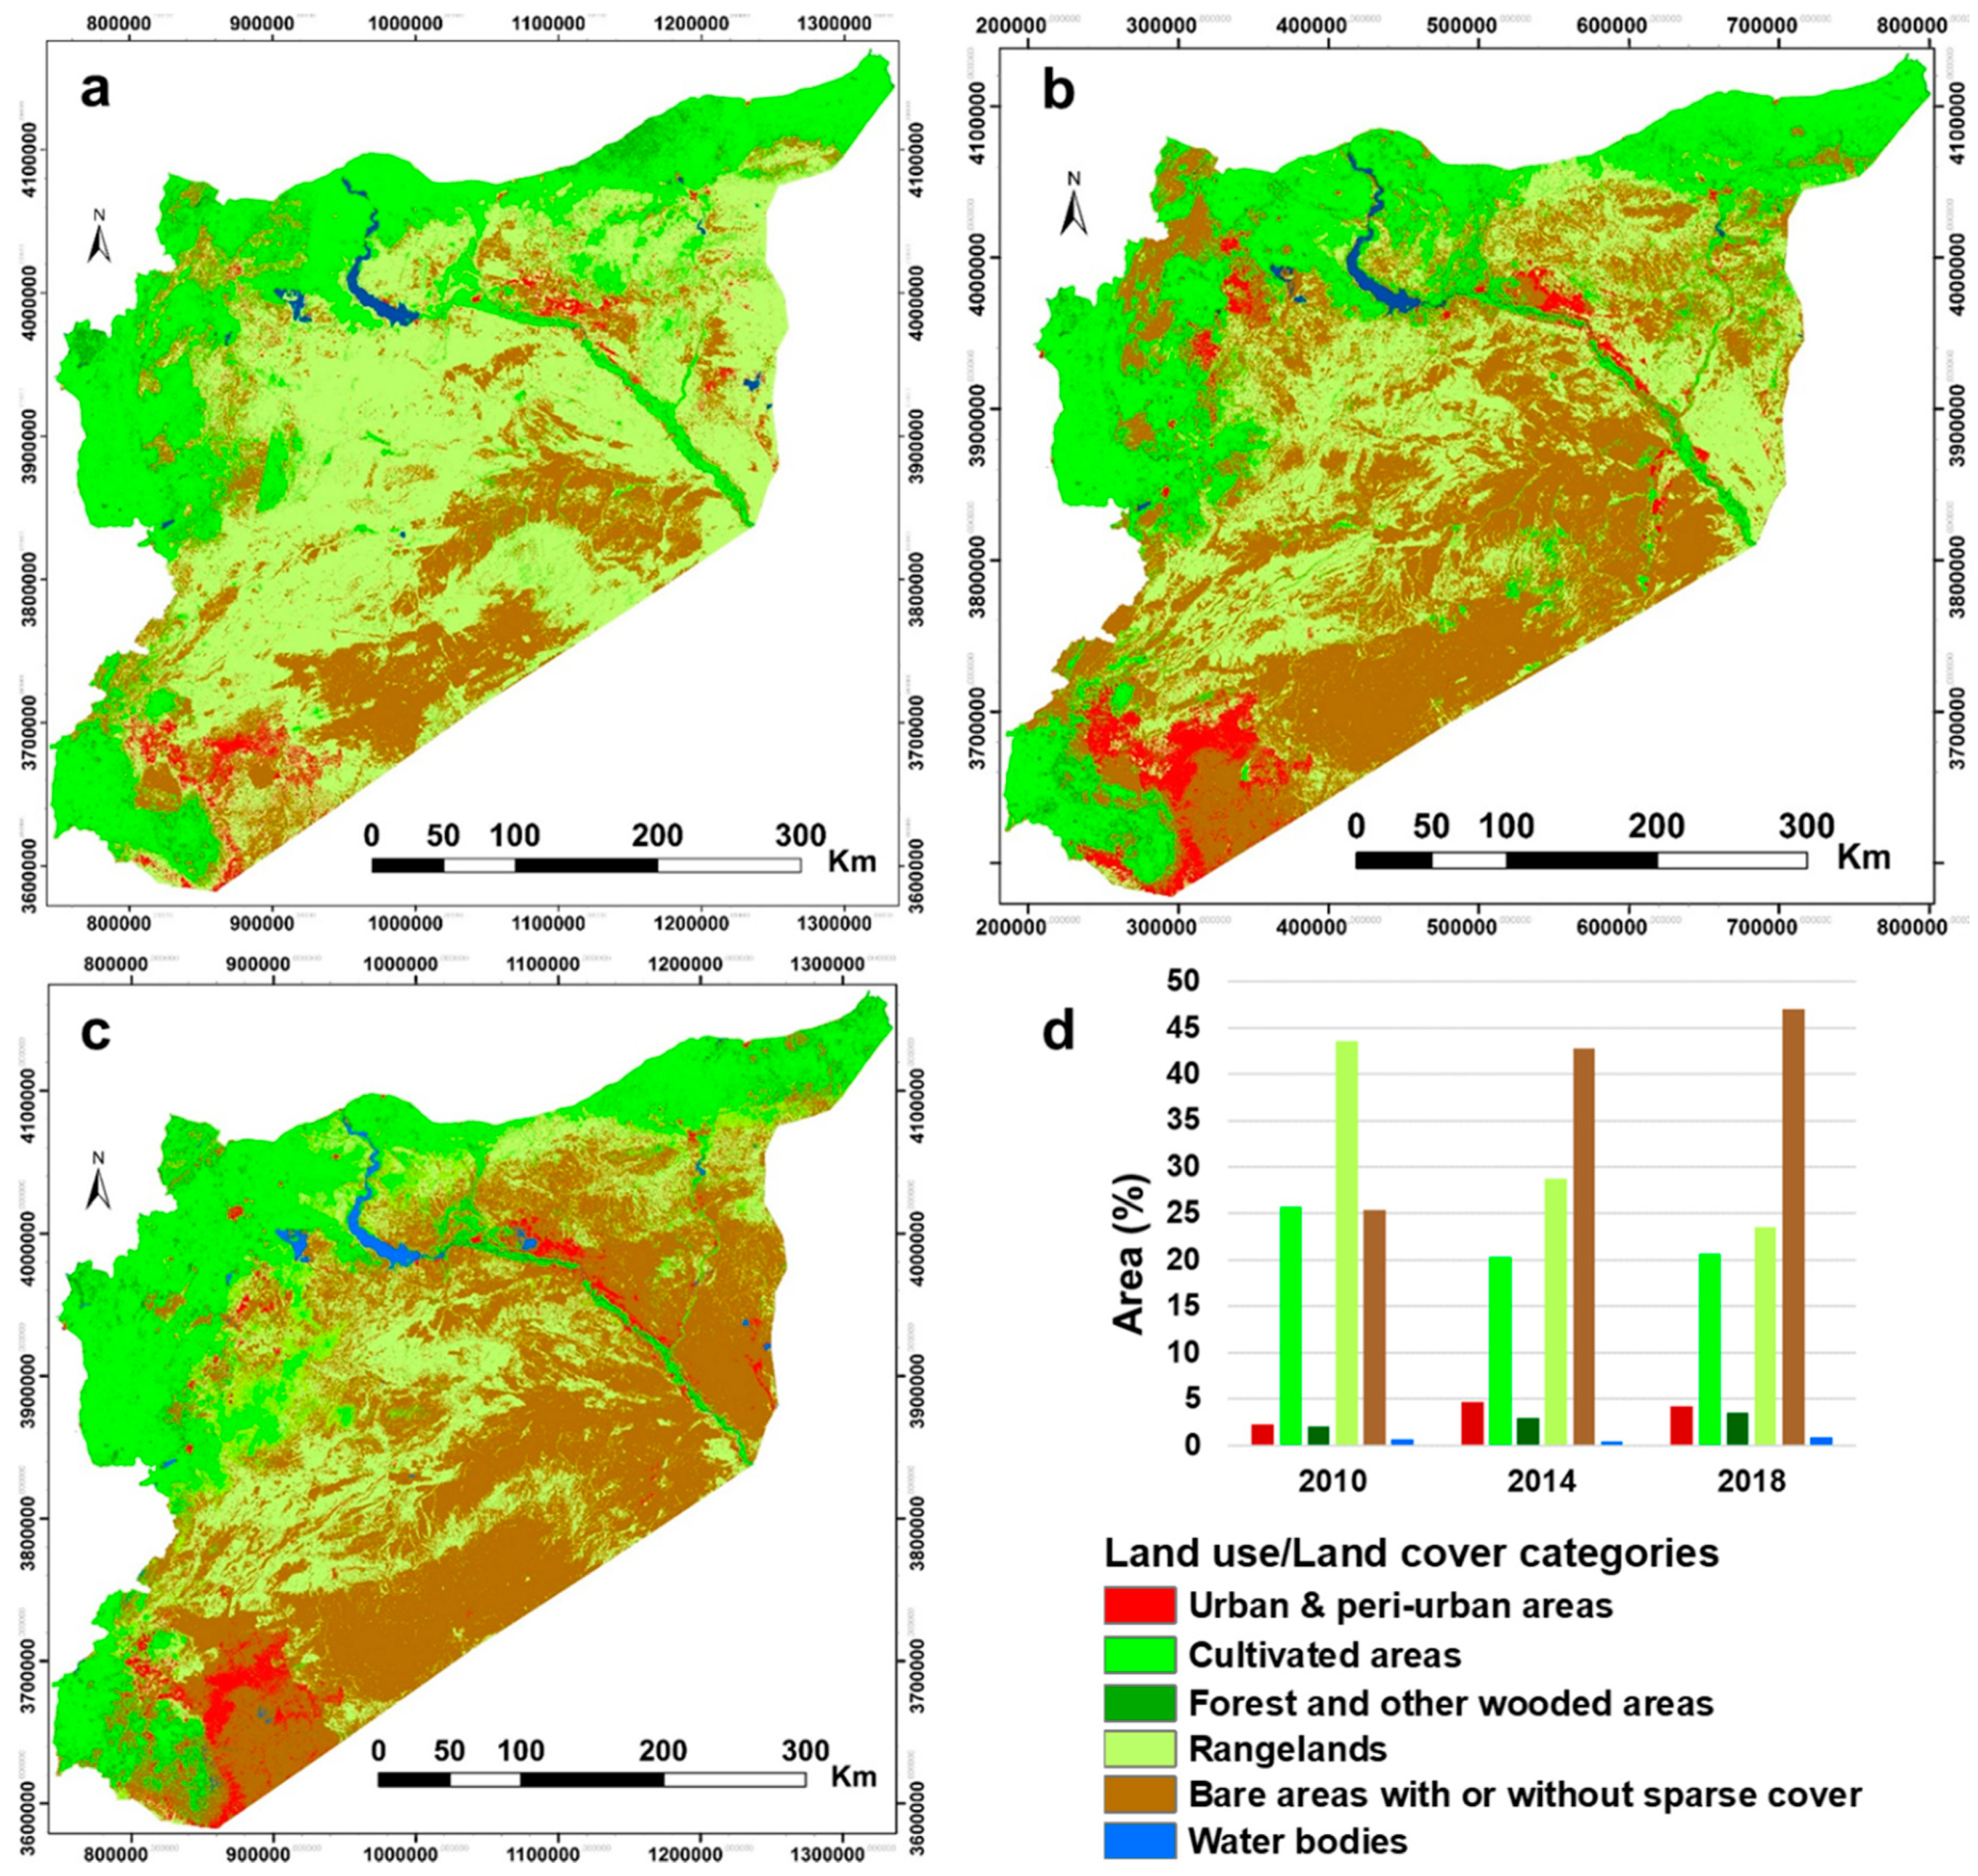
Table 1.
Landsat images acquired for the land-use/land change (LULC) classification in Syria.
| Landsat Sensor | Scene Path-Row | Date (yyyy/mm/dd) | Scene Path-Row | Date (yyyy/mm/dd) | Scene Path-Row | Date (yyyy/mm/dd) | Scene Path-Row | Date (yyyy/mm/dd) |
|---|---|---|---|---|---|---|---|---|
| TM 2010 | 171-34 171-35 171-36 | 4 May 2010 4 May 2010 4 May 2010 | 172-34 172-35 172-36 172-37 | 25 April 2010 25 April 2010 25 April 2010 25 April 2010 | 173-34 173-35 173-36 173-37 173-38 | 2 May 2010 2 May 2010 2 May 2010 2 May 2010 16 April 2010 | 174-35 174-36 174-37 | 23 April 2010 23 April 2010 23 April 2010 |
| OLI 2014 2015 | 171-34 171-35 171-36 | 2 May 2015 2 May 2015 2 May 2015 | 172-34 172-35 172-36 172-37 | 7 April 2014 15 April 2014 7 April 2014 11 April 2014 | 173-35 173-36 173-37 173-38 | 27 April 2014 27 April 2014 11 April 2014 27 April 2014 | 174-35 174-36 174-37 | 4 May 2014 4 May 2014 18 April 2014 |
| OLI 2018 | 171-34 171-35 171-36 | 24 April 2018 24 April 2018 24 April 2018 | 172-34 172-35 172-36 172-37 | 15 April 2018 15 April 2018 15 April 2018 15 April 2018 | 173-35 173-36 173-37 173-38 | 6 April 2018 6 April 2018 6 April 2018 6 April 2018 | 174-35 174-36 174-37 | 26 April 2017 13 April 2018 13 April 2018 |
Table 2.
Number of samples of each LULC class used to train the classifier in 2010, 2014, and 2018.
| LULC Categories | 2010 | 2014 | 2018 | Total |
|---|---|---|---|---|
| 1. Urban & peri-urban areas | 177 | 246 | 246 | 669 |
| 2. Cultivated areas | 219 | 243 | 209 | 671 |
| 3. Forest and other wooded areas | 37 | 39 | 41 | 117 |
| 4. Rangelands | 208 | 237 | 215 | 660 |
| 5. Bare areas | 186 | 142 | 157 | 485 |
| 6. Water bodies | 31 | 31 | 31 | 93 |
| Total | 858 | 938 | 899 | 2695 |
Table 3.
Definitions of land use/cover classes in Syria.
| Land Use/Cover | Definitions |
|---|---|
| Urban & peri-urban areas | Built-up areas and settlements (cities, villages), non-built-up areas (open structures related to human activities, such as quarries and permanent and temporary military zones) |
| Cultivated areas | Areas cultivated with crops: horticultural crops (tree crops, field and vegetable crops grown on small plots receiving intensive inputs), tree crops (olive grove areas and Aleppo pistachios trees), non-irrigated and irrigated crops (mostly rainfed winter/spring field crops and irrigated spring field crops). |
| Forest and other wooded areas | Undifferentiated coniferous and broadleaf, deciduous and evergreen, forest areas, scrubland, and degraded forest, often interspersed with tree crops |
| Rangelands | Sparse grasslands and shrublands of rocky hills and arid lands comprising the predominant grasslands and shrub areas used for extensive grazing and natural vegetation of saline depressions, which includes higher parts of saline depressions that are less frequently flooded than salt lakes |
| Bare areas with or without sparse cover | Unvegetated land, exposed rocks and burnt out areas |
| Water bodies | Freshwater lakes and reservoirs, rivers, salt lakes, periodically inundated salt flats |
Table 4.
Confusion matrices containing the (adjusted and not-adjusted) accuracy assessment of the classified LULC categories in Syria using a (slightly modified) stratified sample for the years 2010, 2014, and 2018. Here, the producer´s accuracy is PA and the user´s accuracy is UA.
Table 4.
Confusion matrices containing the (adjusted and not-adjusted) accuracy assessment of the classified LULC categories in Syria using a (slightly modified) stratified sample for the years 2010, 2014, and 2018. Here, the producer´s accuracy is PA and the user´s accuracy is UA.
| (a) Confusion Matrix for 2010 Land Use/Cover Map | ||||||||
| 1 | 2 | 3 | 4 | 5 | 6 | Total | UA (%) | |
| 1. Urban & peri-urban areas | 15 | 2 | 0 | 1 | 3 | 0 | 21 | 71.4 |
| 2. Cultivated areas | 2 | 227 | 3 | 23 | 5 | 1 | 261 | 87.0 |
| 3. Forest and other wooded areas | 2 | 7 | 14 | 1 | 0 | 0 | 24 | 58.3 |
| 4. Rangelands | 4 | 24 | 4 | 391 | 31 | 0 | 454 | 86.1 |
| 5. Bare areas | 1 | 2 | 0 | 12 | 227 | 0 | 242 | 93.8 |
| 6. Water bodies | 0 | 1 | 0 | 0 | 0 | 9 | 10 | 90.0 |
| Total | 24 | 263 | 21 | 428 | 266 | 10 | 1012 | |
| PA (%) | 62.5 | 86.3 | 66.7 | 91.4 | 85.3 | 90.0 | ||
| PA adjusted (%) | 60.6 | 86.1 | 66.7 | 91.8 | 84.5 | 86.2 | ||
| Overall accuracy (%) | 87.2 | |||||||
| Overall adjusted accuracy (%) | 87.2 | |||||||
| (b) Confusion matrix for 2014 land use/cover map | ||||||||
| 1 | 2 | 3 | 4 | 5 | 6 | Total | UA (%) | |
| 1. Urban & peri-urban areas | 20 | 2 | 0 | 0 | 2 | 0 | 24 | 83.3 |
| 2. Cultivated areas | 13 | 249 | 17 | 4 | 29 | 0 | 312 | 79.8 |
| 3. Forest and other wooded areas | 0 | 2 | 36 | 0 | 0 | 0 | 38 | 94.7 |
| 4. Rangelands | 0 | 13 | 0 | 184 | 31 | 0 | 228 | 80.7 |
| 5. Bare areas | 6 | 4 | 0 | 22 | 365 | 0 | 397 | 91.9 |
| 6. Water bodies | 0 | 0 | 0 | 0 | 3 | 10 | 13 | 76.9 |
| Total | 39 | 270 | 53 | 210 | 430 | 10 | 1012 | |
| PA (%) | 51.3 | 92.2 | 67.9 | 87.6 | 84.9 | 100.0 | ||
| PA adjusted (%) | 67.9 | 86.9 | 59.9 | 91.5 | 83.8 | 100.0 | ||
| Overall accuracy (%) | 85.4 | |||||||
| Overall adjusted accuracy (%) | 85.2 | |||||||
| (c) Confusion matrix for 2018 land use/cover map | ||||||||
| 1 | 2 | 3 | 4 | 5 | 6 | Total | UA (%) | |
| 1. Urban & peri-urban areas | 27 | 0 | 0 | 3 | 0 | 0 | 30 | 90.0 |
| 2. Cultivated areas | 3 | 207 | 14 | 9 | 44 | 0 | 277 | 74.7 |
| 3. Forest and other wooded areas | 0 | 0 | 34 | 0 | 0 | 0 | 34 | 100.0 |
| 4. Rangelands | 7 | 16 | 0 | 190 | 16 | 0 | 229 | 83.0 |
| 5. Bare areas | 6 | 14 | 0 | 5 | 407 | 0 | 432 | 94.2 |
| 6. Water bodies | 0 | 0 | 0 | 0 | 0 | 10 | 10 | 100.0 |
| Total | 43 | 237 | 48 | 207 | 467 | 10 | 1012 | |
| PA (%) | 62.8 | 87.3 | 70.8 | 91.8 | 87.5 | 100.0 | ||
| PA adjusted (%) | 60.1 | 84.2 | 66.3 | 93.5 | 88.2 | 100.0 | ||
| Overall accuracy (%) | 86.5 | |||||||
| Overall adjusted accuracy (%) | 86.7 | |||||||
Table 5.
Area estimates in thousand ha (tha) and percentage share (%) of each LULC category between 2010 and 2018 in Syria (after computing adjusted area estimate).
Table 5.
Area estimates in thousand ha (tha) and percentage share (%) of each LULC category between 2010 and 2018 in Syria (after computing adjusted area estimate).
| (a) Area Estimate for 2010 | ||||||
| Area Parameters (tha) | Urban & Peri-Urban Areas | Cultivated Areas | Forests and Other Wooded Areas | Rangelands | Bare Areas | Water Bodies |
| Classified map area 1 | 359.2 | 4732.8 | 447.3 | 8611.8 | 4241.4 | 125.5 |
| Adjusted area estimate | 423.5 | 4783.8 | 391.2 | 8079.9 | 4708.5 | 131.1 |
| Difference | −64.3 | −51.0 | 56.1 | 531.9 | −467.1 | −5.6 |
| Adjusted area of total area | 2.3% | 25.8% | 2.1% | 43.6% | 25.4% | 0.7% |
| Confidence interval (±) | 129.6 | 284.6 | 131.8 | 343.1 | 256.8 | 24.6 |
| Low area estimate | 293.9 | 4499.2 | 259.4 | 7736.8 | 4451.7 | 106.5 |
| High area estimate | 553.1 | 5068.4 | 523.0 | 8423.0 | 4965.3 | 155.7 |
| (b) Area estimate for 2014 | ||||||
| Area parameters (tha) | Urban & peri-urban areas | Cultivated areas | Forests and other wooded areas | Rangelands | Bare areas | Water bodies |
| Classified map area 1 | 711.2 | 4094.3 | 351.2 | 6035.1 | 7217.9 | 108.3 |
| Adjusted area estimate | 872.3 | 3762.1 | 555.8 | 5322.9 | 7921.5 | 83.3 |
| Difference | −161.1 | 332.2 | −204.6 | 712.2 | −703.6 | 25.0 |
| Adjusted area of total area | 4.7% | 20.3% | 3.0% | 28.7% | 42.8% | 0.4% |
| Confidence interval (±) | 165.9 | 280.4 | 106.3 | 353.7 | 366.7 | 25.8 |
| Low area estimate | 706.4 | 3481.7 | 449.5 | 4969.3 | 7554.8 | 57.5 |
| High area estimate | 1038.3 | 4042.6 | 662.1 | 5676.6 | 8288.2 | 109.1 |
| (c) Area estimate for 2018 | ||||||
| Area parameters (tha) | Urban & peri-urban areas | Cultivated areas | Forests and other wooded areas | Rangelands | Bare areas | Water bodies |
| Classified map area 1 | 520.8 | 4325.7 | 430.2 | 4932.5 | 8149.5 | 159.0 |
| Adjusted area estimate | 779.5 | 3841.3 | 648.8 | 4379.4 | 8709.6 | 159.0 |
| Difference | −258.7 | 484.4 | −218.6 | 553.1 | −560.1 | 0.0 |
| Adjusted area of total area | 4.2% | 20.7% | 3.5% | 23.6% | 47.0% | 0.9% |
| Confidence interval (±) | 162.1 | 307.2 | 111.8 | 275.9 | 306.1 | 0.0 |
| Low area estimate | 941.6 | 4148.5 | 760.6 | 4655.3 | 9015.8 | 159.0 |
| High area estimate | 617.4 | 3534.1 | 537.0 | 4103.5 | 8403.5 | 159.0 |
1 Calculated using the pixel counts of each LULC category on Landsat image.
© 2020 by the authors. Licensee MDPI, Basel, Switzerland. This article is an open access article distributed under the terms and conditions of the Creative Commons Attribution (CC BY) license (http://creativecommons.org/licenses/by/4.0/).
Share and Cite
MDPI and ACS Style
Mohamed, M.A.; Anders, J.; Schneider, C. Monitoring of Changes in Land Use/Land Cover in Syria from 2010 to 2018 Using Multitemporal Landsat Imagery and GIS. Land 2020, 9, 226. https://doi.org/10.3390/land9070226
AMA Style
Mohamed MA, Anders J, Schneider C. Monitoring of Changes in Land Use/Land Cover in Syria from 2010 to 2018 Using Multitemporal Landsat Imagery and GIS. Land. 2020; 9(7):226. https://doi.org/10.3390/land9070226
Chicago/Turabian StyleMohamed, Mohamed Ali, Julian Anders, and Christoph Schneider. 2020. "Monitoring of Changes in Land Use/Land Cover in Syria from 2010 to 2018 Using Multitemporal Landsat Imagery and GIS" Land 9, no. 7: 226. https://doi.org/10.3390/land9070226
Note that from the first issue of 2016, this journal uses article numbers instead of page numbers. See further details here.