Long-Term Monitoring of Protected Cultural Heritage Environments in Norway: Development of Methods and First-Time Application


Department of Landscape Monitoring, Division of Survey and Statistics, NIBIO – Norwegian Institute of Bioeconomy Research, PO Box 115, 1431 Ås, Norway
*
Author to whom correspondence should be addressed.
Land 2019, 8(5), 75; https://doi.org/10.3390/land8050075
Submission received: 11 March 2019
/
Revised: 11 April 2019
/
Accepted: 15 April 2019
/
Published: 27 April 2019
(This article belongs to the Special Issue European Landscapes and Quality of Life)
Abstract
:Norway has a political goal to minimize the loss of cultural heritage due to removal, destruction or decay. On behalf of the national Directorate for Cultural Heritage, we have developed methods to monitor Cultural Heritage Environments. The complementary set of methods includes (1) landscape mapping through interpretation of aerial photographs, including field control of the map data, (2) qualitative and quantitative initial and repeat landscape photography, (3) field recording of cultural heritage objects including preparatory analysis of public statistical data, and (4) recording of stakeholder attitudes, perceptions and opinions. We applied these methods for the first time to the historical clustered farm settlement of Havrå in Hordaland County, West Norway. The methods are documented in a handbook and can be applied as a toolbox, where different monitoring methods or frequency of repeat recording may be selected, dependent on local situations, e.g., on the landscape character of the area in focus.
1. Introduction
Designation and protection of natural and cultural heritage monuments and sites by law have been on national and international policy agendas for several decades. Examples include the International Council on Monuments and Sites established in 1965 [1], and the UNESCO World Heritage Convention of 1972 [2]. However, designation as valuable heritage does not always ensure protection. Sometimes, other interests are considered more important, and designated heritage is lost as part of planned development. An example is the Dresden Elbe Valley, where construction of a four-lane bridge was considered to irreversibly damage the heritage value of the landscape [3].
In areas protected by law, such developments or other potentially destructive actions are usually prohibited. However, even when negative interventions are prevented, the preservation of cultural heritage is not necessarily guaranteed. Some threats can only be avoided by active heritage management. Examples are weathering, destructive attacks by living organisms, wear and tear by large numbers of visitors, and intensification or abandonment of human land uses. In many cultural landscapes, various types of land use may either threaten, promote, or be a prerequisite for maintaining heritage values [4]. Therefore, any landscape protected by law will over time need some form of monitoring, to document how far protection values are maintained and whether management measures may be necessary. On a global level, UNESCO States Parties are obliged to regularly report on the state of conservation and protection measures put in place at their sites [5].
In Norway, cultural heritage is protected under the Cultural Heritage Act of 1978 [6]. Initially, the Act covered only monuments and sites, while protection of larger areas was only possible under the Nature Conservation Act [7], i.e., with a focus on natural, not cultural heritage. However, in 1992, the Cultural Heritage Act was extended to include “Cultural Heritage Environments”, which enabled protection of larger geographical entities or landscapes, whose single elements would not necessarily fulfil the requirements for protection by law on their own.
The Act defines a Cultural Heritage Environment (Norw. kulturmiljø) as ‘any area where a monument or site forms part of a larger entity or context’, whereby cultural and historical monuments and sites are defined as ‘all traces of human activity in our physical environment, including places associated with historical events, beliefs and traditions’. Furthermore,
‘[t]he main purpose of protecting an entire Cultural Heritage Environment is to maintain it as an integrated whole and to preserve the character of the area. A protection order for a Cultural Heritage Environment applies to outdoor areas (farmland, gardens, streets) and to the exterior of any buildings, but not inside the buildings’.[6]
Starting in 1998, twelve Cultural Heritage Environments have been protected by law so far (Table 1). They cover a large variety of landscapes and associated elements, land use histories and protection values.
Although Norwegian authorities acknowledge that some loss of cultural heritage over time may be inevitable, their aim is to keep the loss low. The Governmental White Paper no. 21 (2004–2005) [8] stated that (1) the annual loss of valuable cultural heritage sites and environments through removal, destruction or decay shall be minimized and not exceed 0.5% by 2020, and (2) protected and valuable cultural heritage sites and environments shall be secured and in good repair by 2020. In order to measure whether these goals are achieved, a monitoring system is needed.
Whilst UNESCO’s Periodic Reporting requests many indicators, it does not prescribe how the indicators should be measured. Only half of Europe’s UNESCO properties have comprehensive monitoring programmes with indicators relevant to management needs, and lack of effective monitoring is a shared concern throughout Europe [9]. Monitoring is considered particularly difficult to implement in cultural landscapes. Internationally, landscape-scale monitoring of cultural heritage often concentrates on specific hazards, such as effects of logging operations [10], or deformation and vulnerability to landslides due to tectonic activity [11,12] or hydrology [13]. National monitoring programmes often focus on land use, vegetation and biodiversity [14,15], although there are some that span both natural sciences and humanities that we can learn from, such as the Swiss Landscape Monitoring Program [16], work in Sweden [17,18] and the Norwegian 3Q Programme [19,20]. However, none of these programmes covers the full breadth of interests considered necessary in monitoring of Cultural Heritage Environments.
Compared to monuments and sites, Cultural Heritage Environments occupy a larger geographical extent (land area of 0.1–2.5 km2, with one exception; Table 1), and compared to the Protected Landscapes of the Nature Conservation Act [7,21] (n = 194, average size: 88.8 km2 [22]) they are much smaller. Moreover, they require an interdisciplinary approach to material and immaterial protection values, and to landscape elements that may be more or less natural or cultural. The requirements for monitoring Cultural Heritage Environments are therefore complex. The Directorate for Cultural Heritage, having the responsibility of reporting to the Norwegian Government, commissioned the Department of Landscape Monitoring at the Norwegian Institute of Bioeconomy Research (NIBIO) to
- 1)
- develop a method for long-term monitoring of protected Cultural Heritage Environments, and
- 2)
- demonstrate the method by conducting a first round of monitoring of one environment.
In the following sections, we describe the Cultural Heritage Environment selected to demonstrate monitoring methods, and propose four modules for a comprehensive monitoring programme: (1) Aerial photo interpretation to detect land cover and land use change, (2) Landscape photography on the ground to survey visually perceivable landscape qualities, (3) Field survey to monitor the status of selected heritage objects, and (4) Public participation to record immaterial landscape heritage and perceptions. Based on results from the demonstration area, we discuss strengths and weaknesses of the different methods, including practical considerations when implementing a monitoring programme and reflections on how results from monitoring should provide feedback to management.
2. Materials and Methods
2.1. Study Area: Havrå
A major challenge for developing a universal monitoring system for all protected Cultural Heritage Environments is the broad range of different landscape types covered (Table 1). We chose Havrå as a good example for developing the method, since it includes both a clear focal area, the clustered farm settlement and infields, together with a wider landscape and outfields containing scattered physical heritage remains, where the cultural heritage context may be more or less obvious in different parts of the landscape and to stakeholders with different levels of knowledge.
Havrå was protected on 4th December 1998, as the first Cultural Heritage Environment under the Cultural Heritage Act § 20. According to the legal Rule, protection applies to «the entire farm with fields and meadows, outfields and infields, buildings, tools, domestic animals and localised, activity-based immaterial cultural heritage» [23]. This is a broad range of values, requiring a multi-facetted monitoring approach, with different methods to collect a large variety of data.
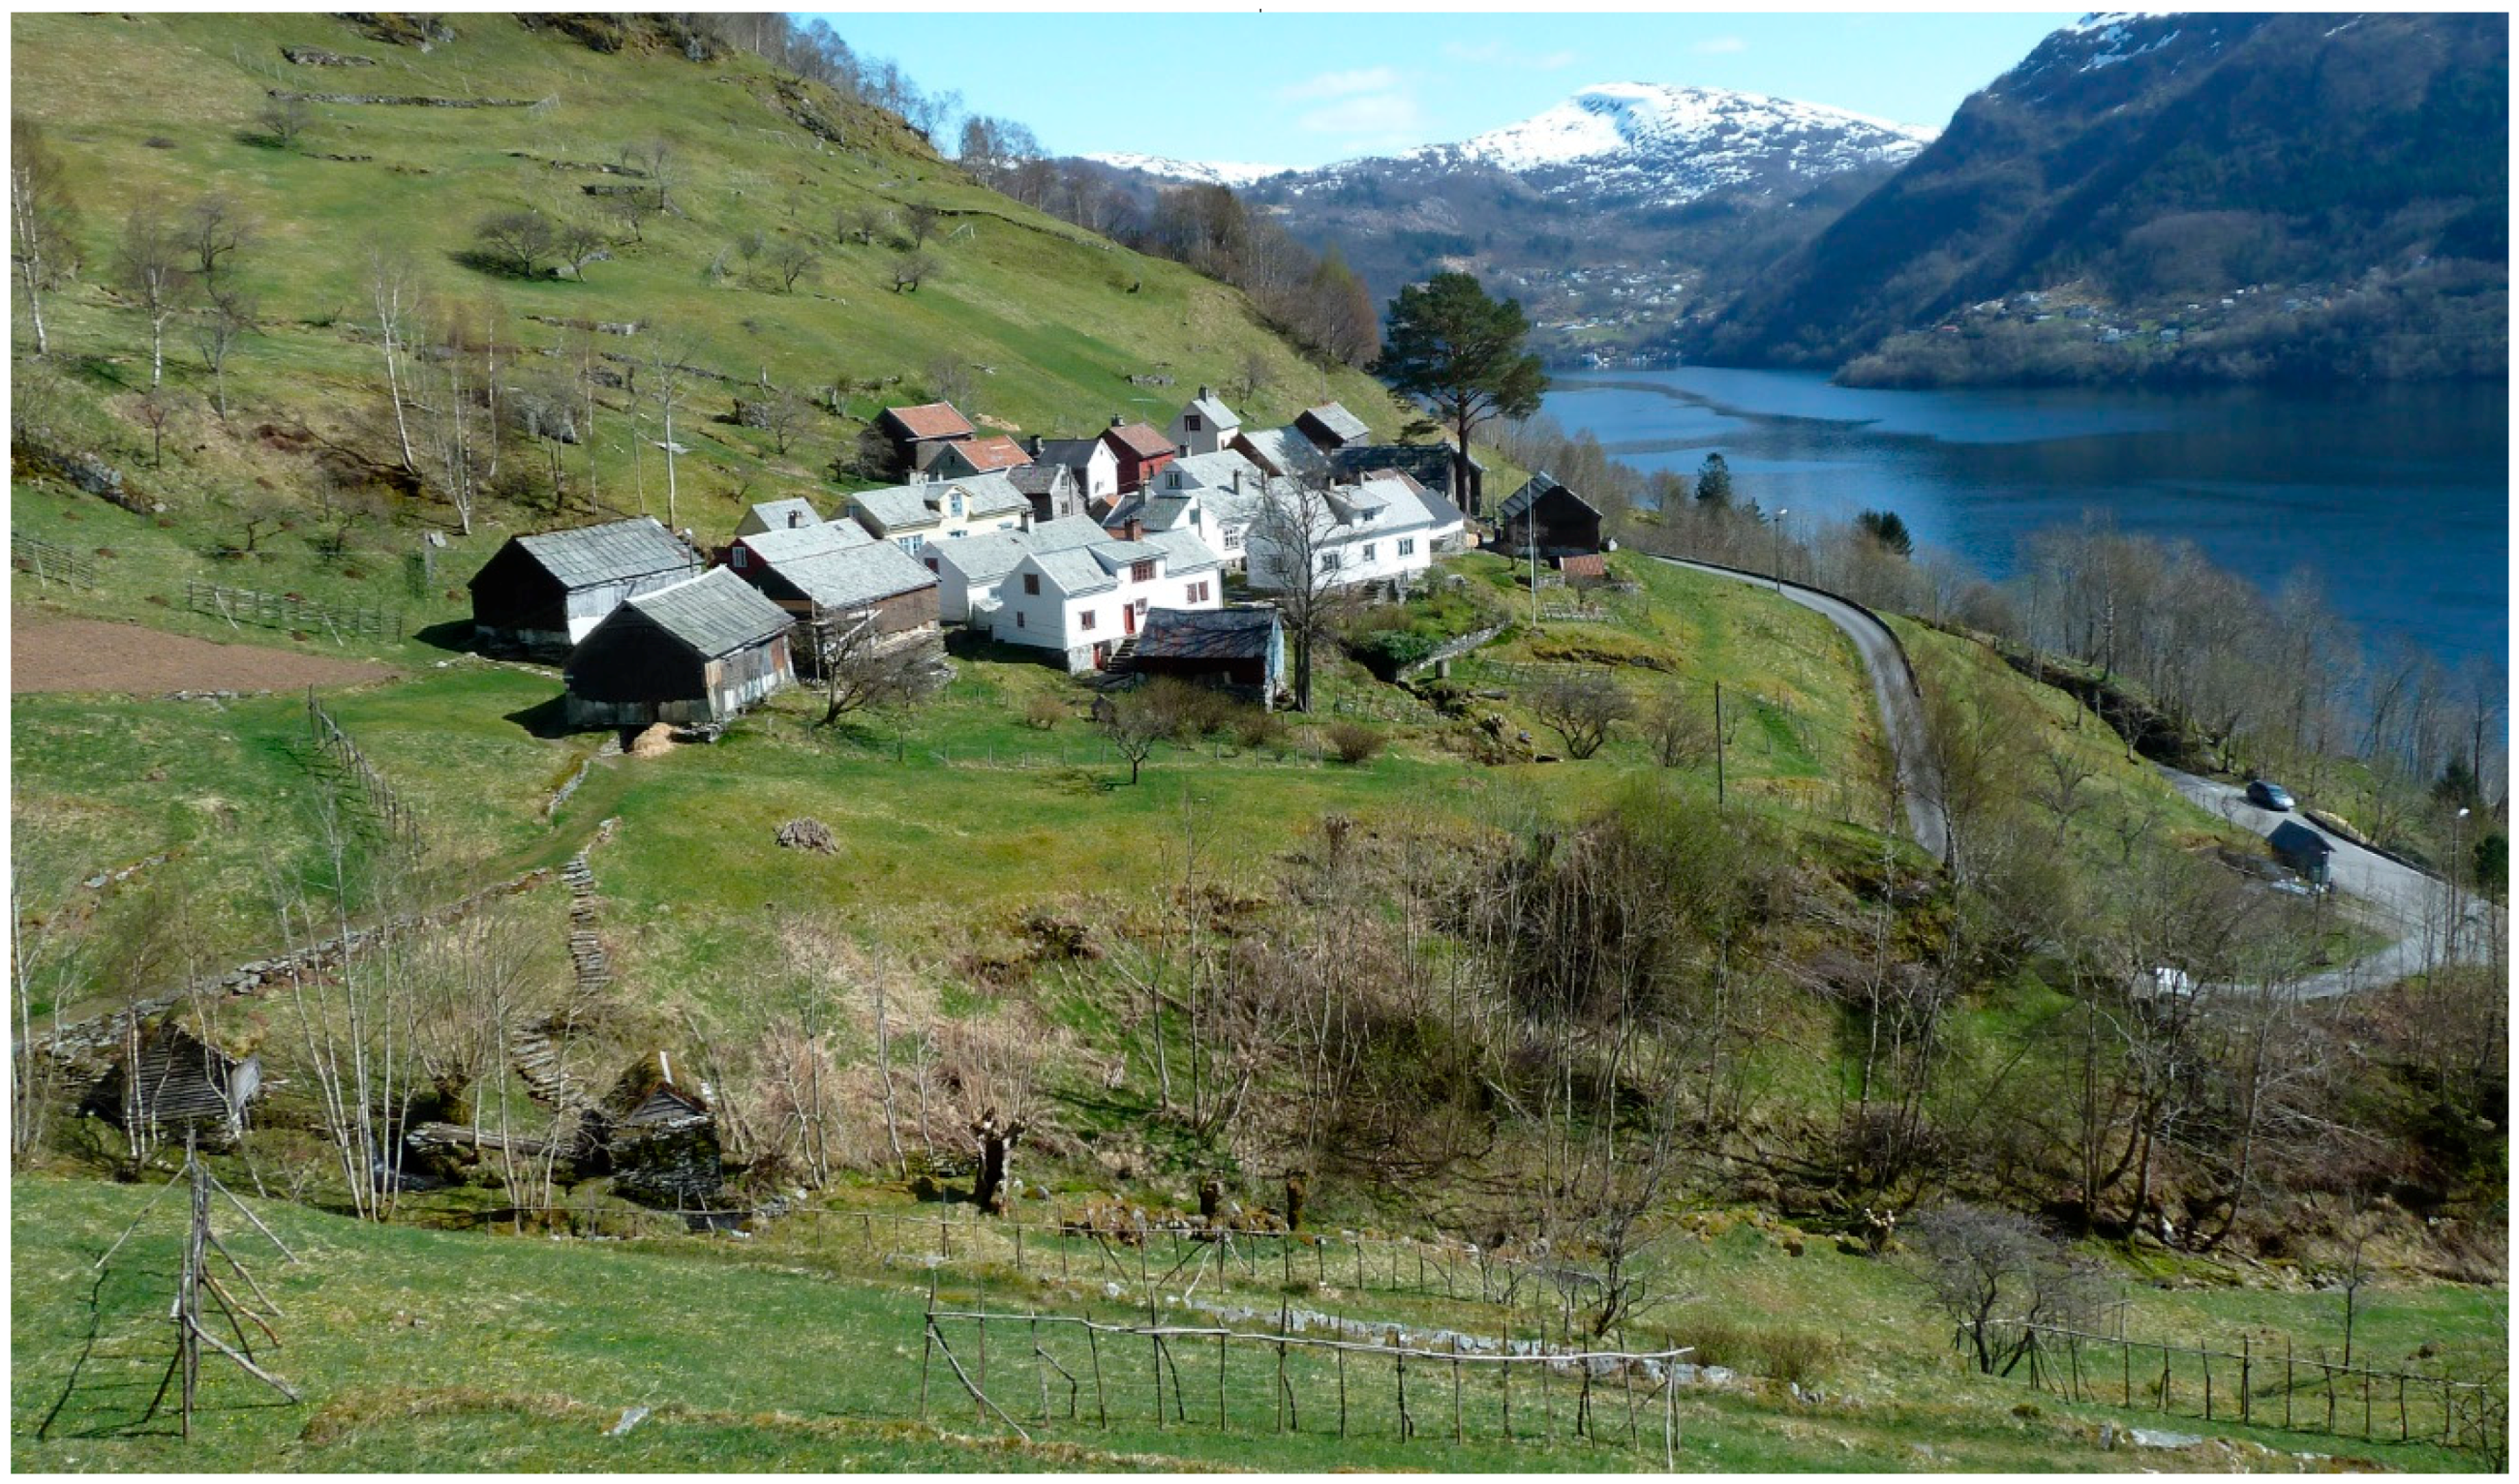
Most clustered farm settlements disappeared from Western Norway during the second half of the 1800s and early 1900s, due to a national process of land consolidation. However, Havrå remained as a clustered settlement with a very mixed structure of small infield properties of multiple families, and jointly owned outfields (Figure 1). Not only were the original buildings preserved, but also the field structure and pre-industrial farming practices. By 1930, Havrå was already recognised as an important cultural heritage landscape, which helped preserve it from the further changes of the 1900s, even without protected status [23]. In 1952, the place became nationally well-known thanks to a documentary film, shown in Norwegian cinemas, describing the life and activities of the villagers during the course of a year.
Today Havrå comprises eight farm holdings. A regional museum conducts historical farming practices on three of them, the others have a rather low degree of individual farming activity, or farming is abandoned. A part of the jointly owned outfields has been transformed into more intensive grassland and is managed by a group of neighbouring local farmers on a rental basis.
2.2. Terms and Conditions for Monitoring
The legally binding Rule of Protection defines the landscape heritage values that make the area worthy of protection. This Rule is therefore the point of departure for developing a set of monitoring methods. In certain cases, the contents of the Rule can be elaborated further by official management plans or by information material published by public authorities in charge of protected heritage management.
The Rule for Havrå defines a broad range of landscape heritage values (as quoted in Section 2.1), and thus demands a broad monitoring approach. Additional information is available from several decades of scholarly and official projects from different scientific fields, and these studies contain more or less detailed descriptions about peculiarities of the area, which are perceived as valuable.
In addition to the year of protection (Table 1) when the Rule of Protection of a Cultural Heritage Environment is enacted, we introduce the following three terms for methodological purposes: reference period, support year and year zero (Table 2).
An important first task for year zero is to collect and “time stamp” all available registry data for the area of interest, such as official databases, property cadastres, existing registers of cultural heritage, etc. This ensures that the data are secured for future study, even if the official databases are changed or no longer maintained.
2.3. Mapping from Aerial Photographs
Aerial photography has long been used to analyse landscapes [24,25,26] and, more recently, to monitor landscape change [17,20,27]. Mapping based on interpretation of aerial photographs can be very cost-effective, especially if standardised mapping instructions are already available that are suited to the scale and goals of the project in focus. Mapping instructions must provide detailed definitions of all the different land types that can be mapped, size thresholds for minimum mapping units (area of polygons, length of linear features, size of features to be recorded as points), and detailed definitions of what constitutes a change when carrying out repeat mapping, e.g., how to deal with shadow, or objects that become obscured by vegetation. It is important that these instructions are well-documented to ensure that future mapping reflects real landscape change and not changes in the way in which the mapping was carried out.
In this project, we used the methods developed in the Norwegian Monitoring Programme for Agricultural Landscapes, the «3Q Programme» [20,28,29]. The 3Q mapping instructions are tailored to manual interpretation of aerial photographs for study plots of 1 km2 in size, i.e., a similar size to most Cultural Heritage Environments (Table 1). The 3Q Programme is designed to evaluate the effects of agri-environmental policies on landscape structure, biodiversity, cultural heritage and accessibility in agricultural landscapes. As such, it aims to monitor not only land cover, i.e., the physical cover on the earth’s surface (e.g., bare soil, grass, trees, artificial constructions) but also land use, i.e., how people utilize the land (e.g., for arable production, hay making, grazing animals, transport, residential homes, agricultural buildings). We considered the scope of the 3Q Programme to be very similar to the aims of monitoring in Cultural Heritage Environments and the mapping categories seemed appropriate. We use the term land type when not distinguishing between land cover and land use.
An adjustment that we made to the 3Q mapping instructions was to add a category of linear features: hay-drying racks, which are a very important feature in the protected landscape. We also recorded all linear features, regardless of length, whereas 3Q operates with a minimum length of 20 m. As linear features like hay-drying racks and terrace walls in some cases proved difficult to survey from aerial photographs alone, mapping results were verified and adjusted during fieldwork. Two new categories of land use were also introduced, one for hay meadows on very steep slopes, where the soil was too shallow to fulfil the normal 3Q requirement for fully cultivated land, and one for grazed wooded pasture, where the tree density would result in classification as forest in 3Q.
Aerial photographs provide historical documentation that can be referred to in the future if there is any need to double-check information or if new questions should arise that were not considered during previous mapping. For example, a coarse classification of land type can be made more detailed. For our study area, we were particularly interested in what the landscape looked like in the early 1950s, since this is the reference period referred to as the desired status for protecting the area. Fortunately, aerial photographs were available taken in 1951. The older photographs were of poorer quality than the modern photographs, so comparison back in time is somewhat limited thematically and is less reliable than what we expect from future monitoring. We therefore stress that, although 1951 represents the reference period for the landscape protection, the year zero for monitoring is 2015. Aerial photographs cover Norway on average every fifth year, depending on weather and cloud conditions. Ideally, the year zero for monitoring a Cultural Heritage Environment should coincide with a year in which aerial photographs of adequate quality for standardised mapping were taken. In this case, however, the fieldwork was carried out in 2015, while the aerial photographs were from 2013.
2.4. Landscape Photography
Aerial photographs provide a good overview of an entire landscape and positioning of important landscape elements. However, the bird’s eye view can be very different from the perspective of people experiencing the landscape on the ground. Therefore, ground photography is also an important method for documenting the visual landscape, capturing both views and individual objects that can be important for landscape experience (e.g., pollarded trees, fences, buildings). We established a first set of photographs for monitoring, which includes both a quantitative and a qualitative approach [30]. The quantitative part involves taking photographs to the north, east, south and west from a systematic grid of pre-defined photo-points. This ensures representative geographical coverage of the entire area. The qualitative part involves adding a photo in a freely chosen direction from the pre-defined photo-points, and adding supplementary photo locations to capture views or objects that would otherwise be missed. This can include establishing photo-points where photographs have been taken in the past, especially if photographs are available from the reference period. The qualitative part ensures good story-telling photographs that can be used to illustrate the relationships between, e.g., cultural heritage and landscape elements and their landscape context.
A total of 50 photo-points were defined by placing a systematic grid of points over the map of the protected area, with a random starting point. We divided the area into two, with 400 m between photo-points in the northern part (11 points) and 100 m between photo-points in the southern part (39 points). The different photo-point densities were a compromise, to ensure an even geographic coverage, whilst being as cost-effective as possible. We felt that 400 m was sufficient to capture the landscape character of the more broad-scale outfield landscape in the north, whilst a denser grid of points was needed to capture the many landscape elements in the fine-scale infield and farmstead landscape of the southern part, elements that are mentioned specifically in the Rule of Protection.
The fieldwork was carried out on the 23rd and 24th of April 2015. The dates were chosen to be before the leaves came out on the trees, so that as much of the landscape and as many landscape elements as possible might be at least partially visible behind tree branches and scrub.
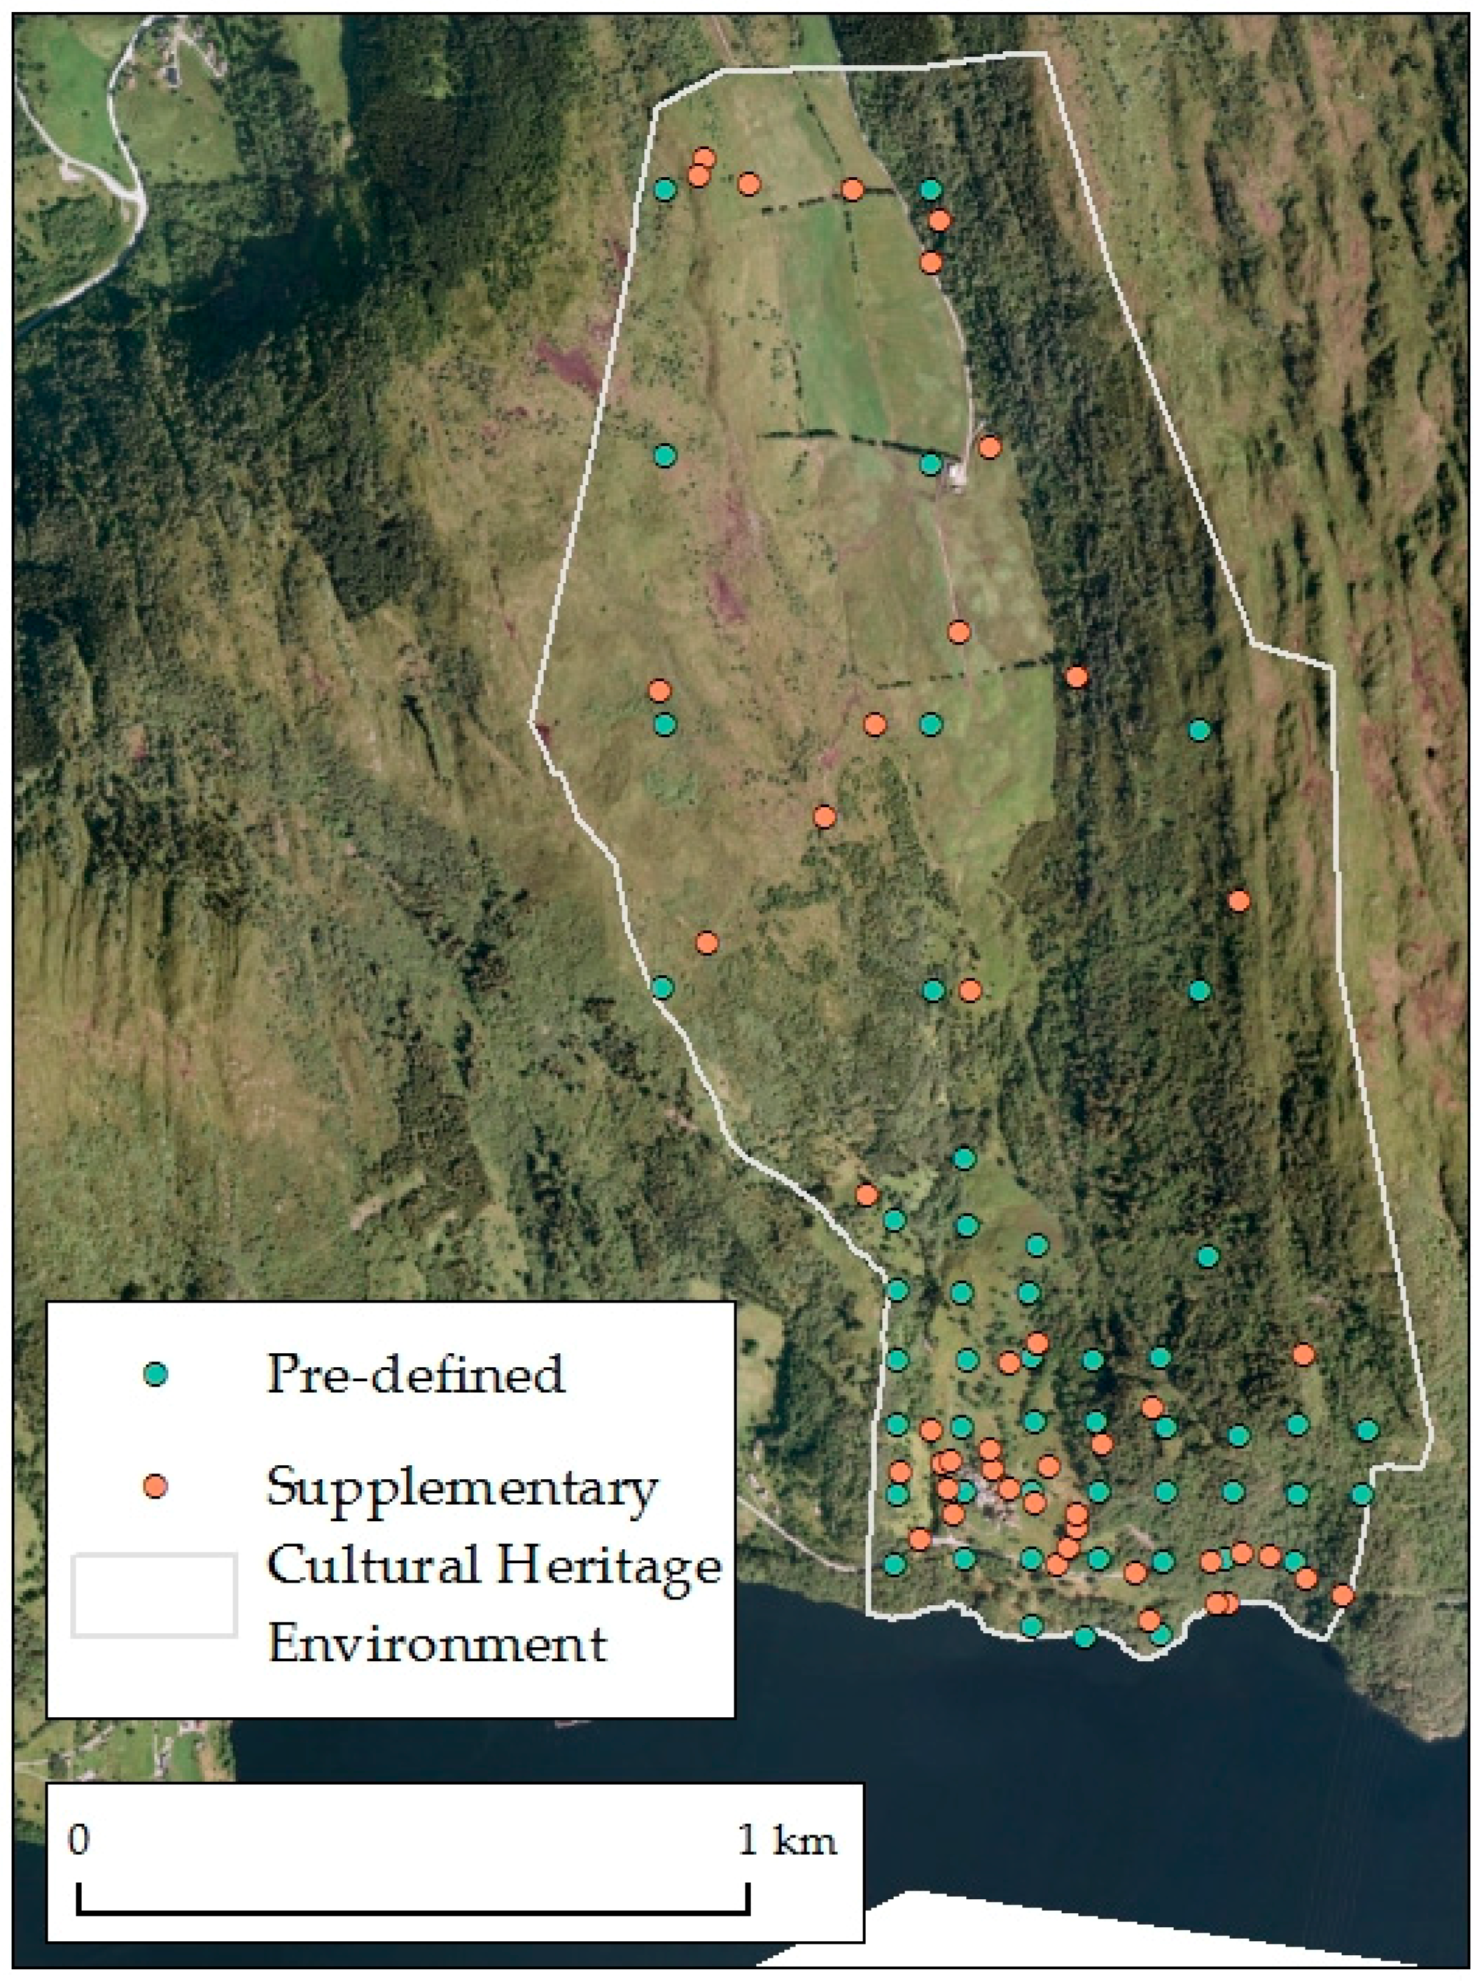
A hand-held GPS was used to navigate to the pre-defined coordinates and a printed map of the photo-points was used to control the position in relation to surrounding landscape features, to guard against GPS inaccuracy. Each photo-point was to be as close as possible to the pre-defined coordinates, but fieldworkers were allowed to move up to 10 m to avoid difficult locations, e.g., in a building, in dense scrub, or on a cliff. If a photo-point was moved, the new coordinates were recorded and the position marked on the map. One pre-defined photo-point proved inaccessible and was dropped. Figure 2 shows the final distribution of photo-points.
Five photos were taken from each photo-point: north, east, south and west, and a freely chosen direction (direction in degrees was recorded). The coordinates of any extra photo-points were recorded and plotted on the printed map, and five photos were also taken at each of these supplementary points. All photographs were taken with the camera lens at a height of 150 cm, using a stick of this length to measure the correct height. The photographers could choose focal length freely, but generally chose wide angle (35 mm) to capture the broadest possible landscape view.
2.5. Field Recording of Buildings
Aerial photos provide a good overview of land cover and land use, and ground photography captures visual qualities of the landscape and some landscape elements. However, for detailed monitoring of special landscape elements, targeted recording in the field is necessary, using a standardised method and following clear instructions. In Havrå, as for many of the protected Cultural Heritage Environments, the architectural qualities of buildings are considered very important, and are feasible to record for the entire area. We thus included field recording of buildings into the monitoring.
All buildings and ruins were identified through a combination of aerial photo interpretation, use of the Norwegian Mapping Authority’s Cadastre and Land Registry, and the Cultural Heritage Authorities’ database “SEFRAK”, a nationwide registry of in situ objects of cultural or historic interest [31]. A map of the buildings and all available information about them were taken into the field, and all localities were visited and documented with photographs. One previously unregistered ruin was also discovered during the fieldwork. A list of recording codes was used to fill in a table, registering:
- Roof: shape and material,
- Walls: cladding material and colour,
- General state of repair,
- Visibility,
- Use,
- Special features,
- Photo number(s).
2.6. Public Participation
The European Landscape Convention [32] requires public participation in landscape planning and management. Public participation can potentially provide knowledge about the landscape qualities that are valued by people, facilitate public engagement in landscape issues, reduce conflicts and lead to better management [33,34,35]. Ideally, participation should be included from the start of a protection, planning or designation process. This would ensure that as many people’s perspectives and values as possible are considered when determining exactly what to protect and how. The aim would be that stakeholders reach agreement upon protection priorities and appropriate management, before the protection is brought into law. In a monitoring perspective, participation can contribute to:
- identify perceived changes in the Cultural Heritage Environment, both material and immaterial,
- suggest reasons for changes in landscape or landscape elements, i.e. the driving forces behind them,
- identify changes in attitudes towards the Cultural Heritage Environment or parts of it,
- identify changes in experiences and perceived values,
- identify which management practices work and which don’t work,
- suggest improvements or additional requirements to the management plan.
Together with the Directorate for Cultural Heritage, we agreed to include participation in the establishment of year zero for the monitoring of Havrå. In a set of Norwegian case studies, ten methods for participation have been shown to be particularly effective [36], of which in-depth interviews were considered to be most appropriate for monitoring Cultural Heritage Environments. Rather than spread resources over many types of stakeholders, we chose to focus on landowners. This stakeholder group is probably the most influential in the protection and development of the area, and even though individuals may be replaced, landowners will continue to play an important role in the future management of the area. Focusing on one group means that future participation surveys will be more comparable with the first survey, i.e., changes will reflect changes in landowners’ attitudes and perspectives and not changes in the mix of different stakeholder types involved.
Informal talks with various stakeholders gave us the impression that most of the landowners in the area were not in regular contact with one another, that there was no culture of community meetings and that there had been some long-term disagreements between individuals. We therefore chose individual interviews as the most appropriate method. An interview guide was written to ensure that we addressed themes with all landowners, including their personal relationship to the area, their values, and their perspectives on landscape protection in general and the protection of the Cultural Heritage Environment in particular.
During the interviews, colour and grey-scale aerial photographs were available, together with maps of the area, including property borders, and other point, linear and polygon data. All interviews started with an interviewer giving an overview of the purpose of the interview, and the conversation was divided into four main sections: (1) the interviewees’ personal background in relation to the area, (2) the perceived importance of specific heritage values, including reference to a pre-selected list of thirteen landscape elements considered valuable, (3) an evaluation of different aspects of the area as a Cultural Heritage Environment protected by law, and (4) questions about future expectations and the role of monitoring, and closing remarks, including the opportunity to adjust statements made earlier.
Seven interviews were conducted, two with two people. The nine interviewees represented the owners of all eight farm holdings and one separated property unit. Interviewees included seven men and two women at c.40 to 88 years of age. Four interviews were conducted as part of the fieldwork on 23rd–24th April 2015 (“outreach office”), another on-site interview was conducted on 4th May, one interview by telephone on 27th May, and we received one written response to the interview guide, which had been sent to all interviewees prior to the interviews.
2.7. Data Processing, Storage and Management
Data management is an important part of monitoring, to enable accurate and easy comparison between different years. All methodological protocols, including lists of variables, definitions, and standardized recording forms for fieldwork, are stored digitally, together with the data. All objects were given a unique ID and georeferenced for use in a GIS system, e.g., all buildings were represented as polygons, building walls as lines and photo locations as points. Using the unique ID, any variable recorded for an object can be visualized using GIS software (e.g., Figure 2, Figure 3 and Figure 8). The maps can also highlight possible spatial patterns in the occurrence of good practice or threats within a study area.
3. Results
Since our aim in this project was primarily to develop a suitable set of methods for monitoring, our focus here in the results section is on our experiences using the different methods and the kind of information gathered from each. Nevertheless, it is useful to illustrate this with actual results from the Havrå Cultural Heritage Environment.
In total, eight NIBIO employees were, to different degrees, involved in project design, data collection, analyses, management, and dissemination through reports (cf. Author contributions and Acknowledgements). The total amount of work spent on the project was approximately three person-months, of which c.100 person-hours in the field (six persons, 2.5 days) and 40 hours on aerial photo interpretation (20 h/km2).
3.1. Mapping from Aerial Photographs
We found that the mapping instructions of the 3Q Monitoring Programme for Agricultural Landscapes were highly suitable for mapping Havrå. Interpretation of the aerial photographs for year zero showed that over a third of the protected cultural landscape comprised forest (Table 3), mostly deciduous. Almost a third was unmanaged open land, including grassland, heath, and juniper bushland, with no traces of grazing or cutting. Six percent of the area was fully cultivated land, 1.8% hay meadows and 24.2% was grazing land, of which half had some degree of bush and tree cover. Most of the grazing was on infield pasture and just 2.4% in the outfields. Only 0.6% of the protected area was built-up.
The aerial photos from 1951 were of poorer quality, but nevertheless gave an indication of the landscape composition in the reference period. In 1951, there was far less forest (11.1%), whilst unmanaged open land occupied the greatest area (37.6%). Less than 1% of the area was fully cultivated, whilst 5.4% was used for cutting hay. Around 40% of the landscape was used for some form of grazing, twice as much as in 2013. About half of this was grazing in the outfields, which had declined to a tenth by 2013. In 1951, there was only a third as much built land (0.2% of the landscape) as in 2013, most of the change being due to the building of a road into the area.
Registration of linear features (Table 4) showed that the number and total length of hay-drying racks was much reduced, whereas the total registered length of fences and paths had increased. The largest change concerned drainage ditches, most of which were established during new cultivation of farmland in the upper part of the area. The length of stone walls and terrace walls was quite stable.
3.2. Ground Photography
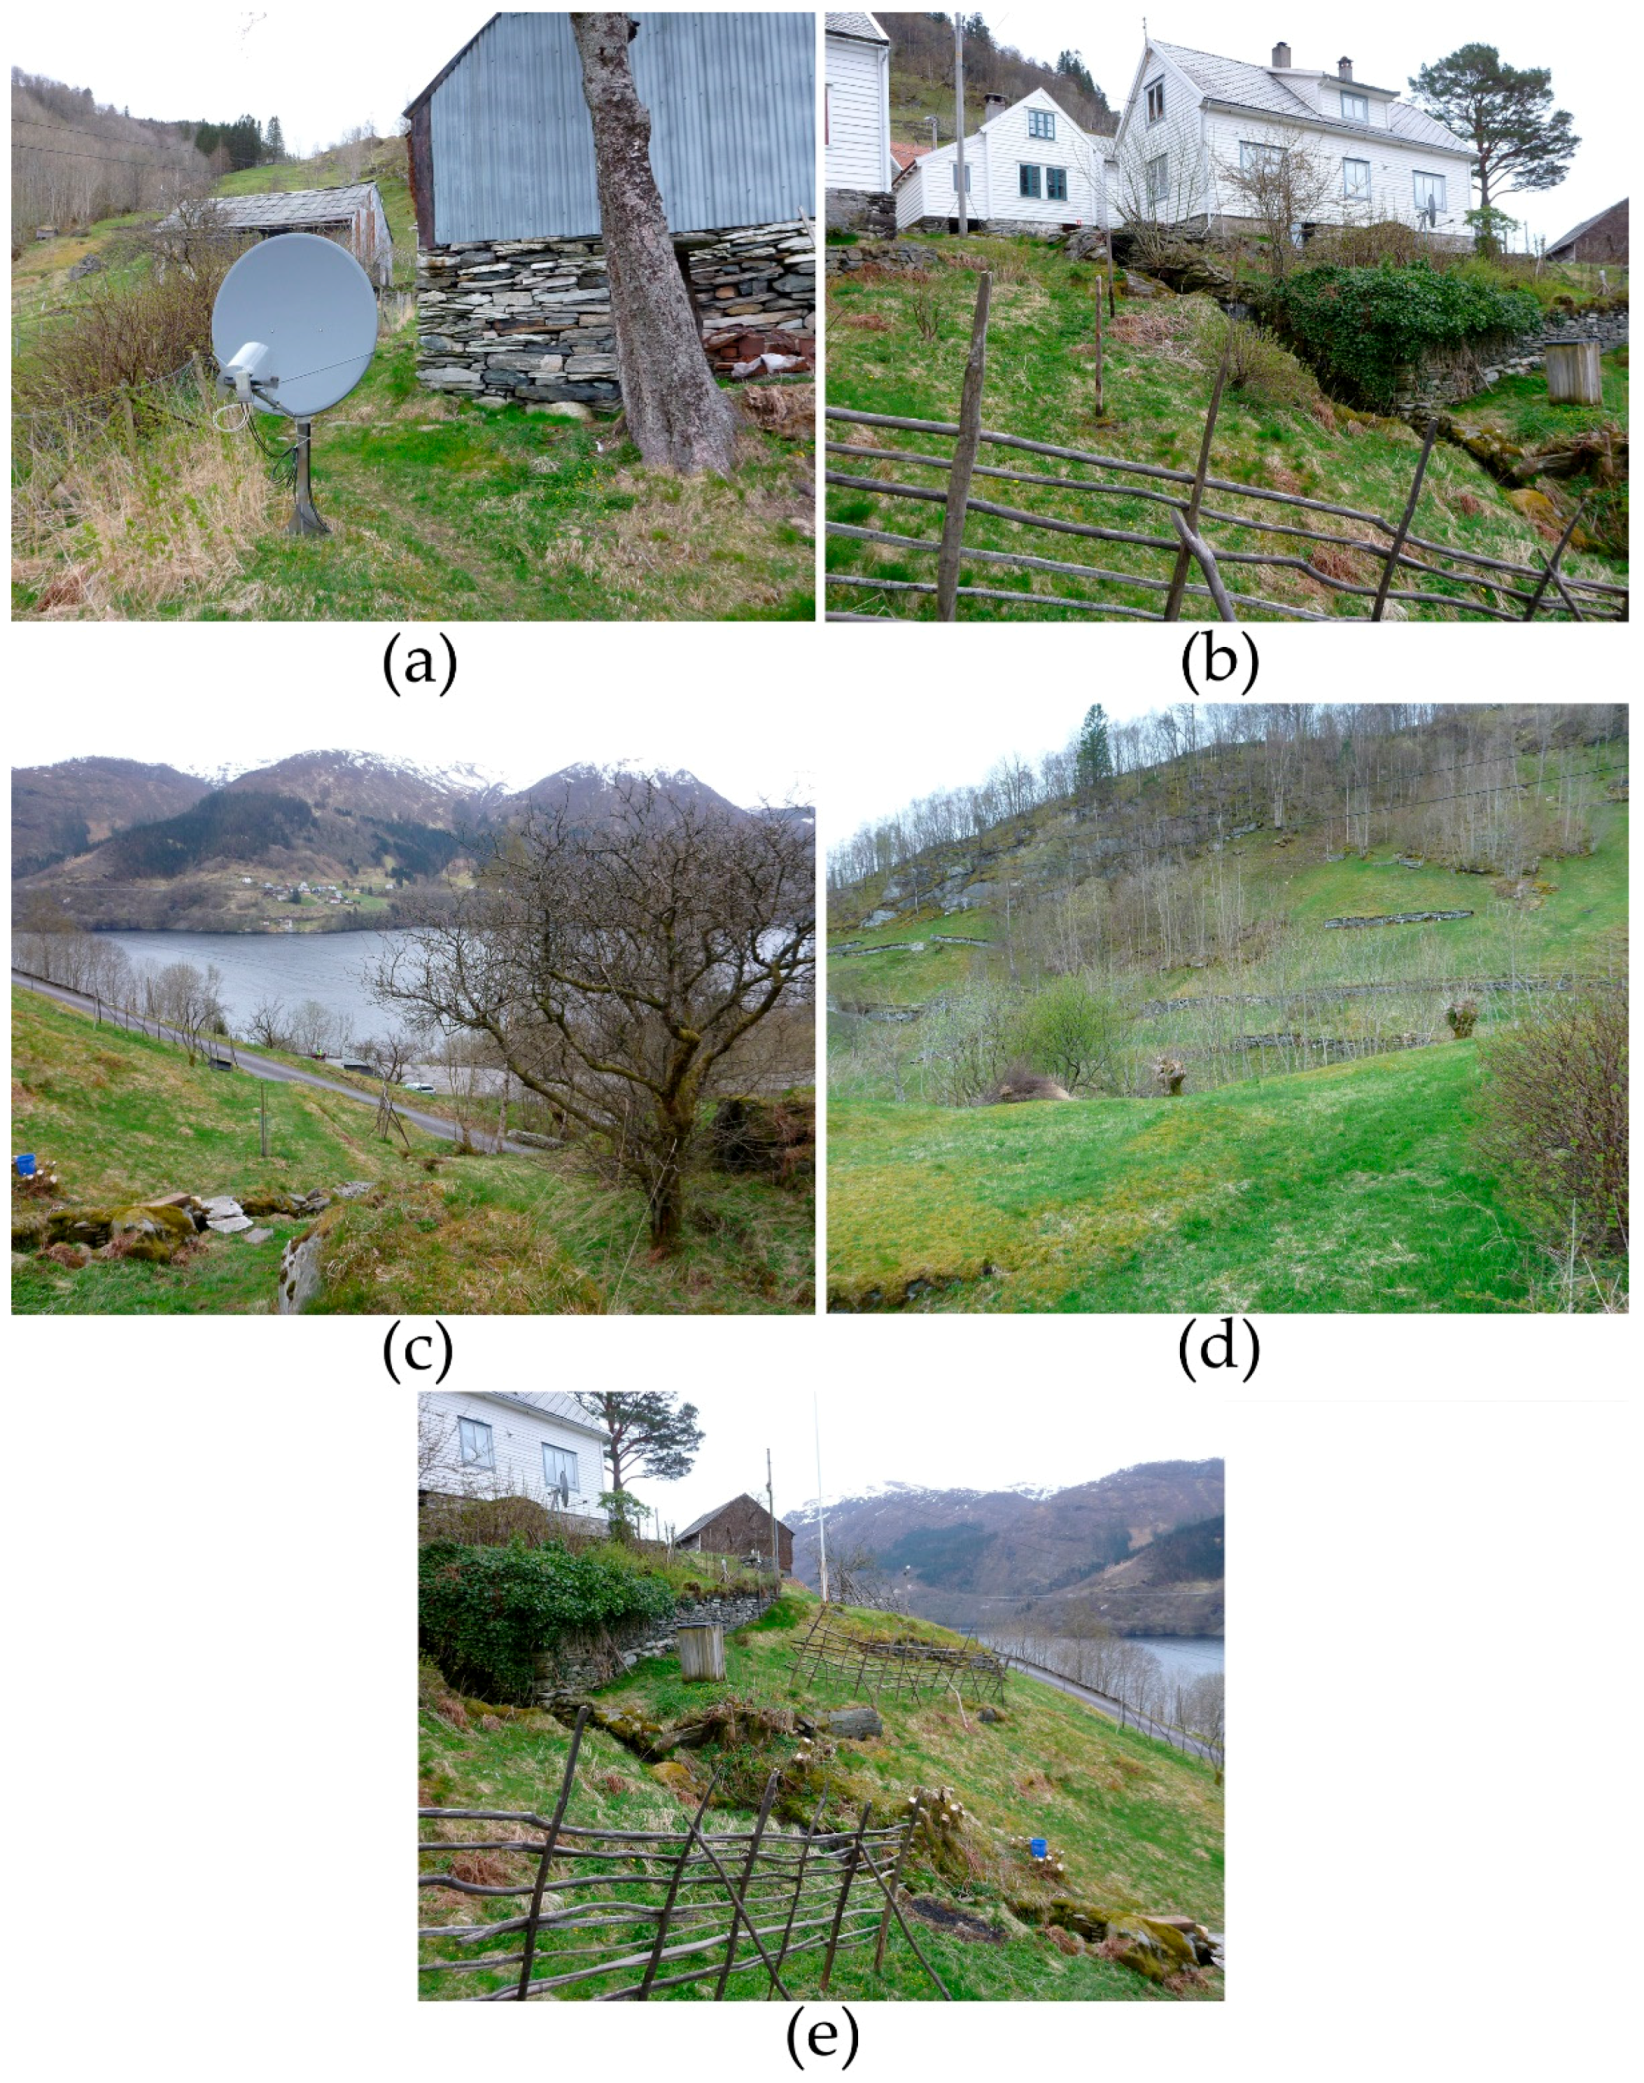
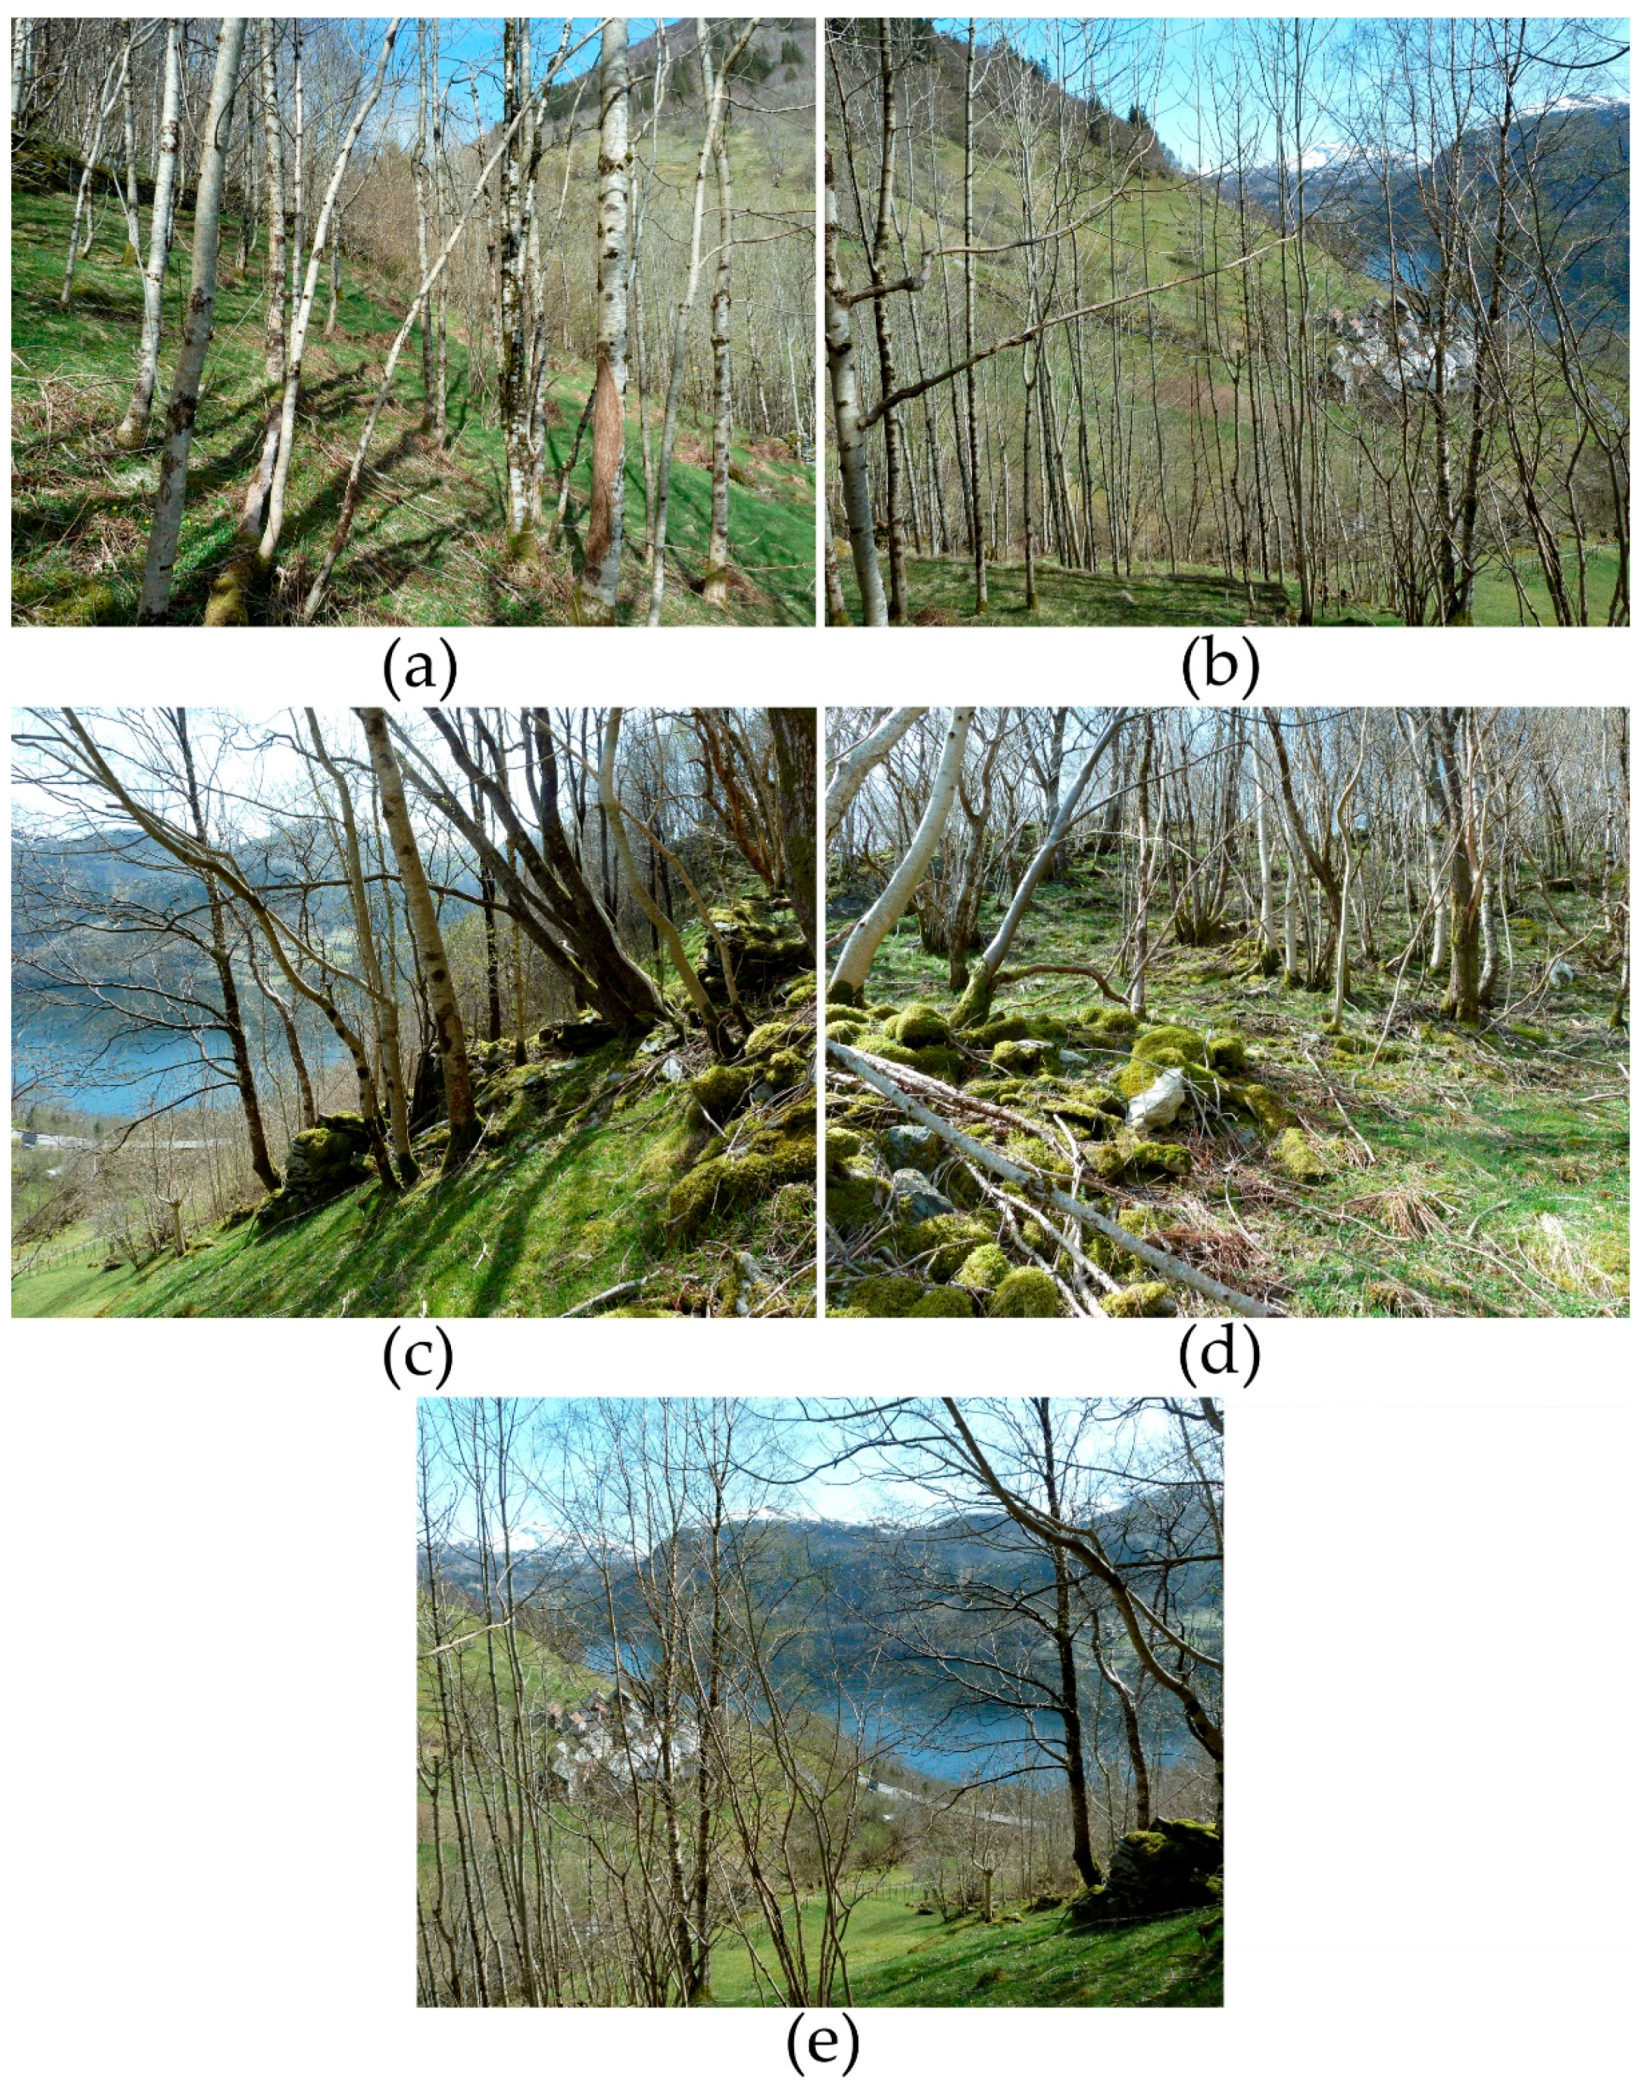
A total of 475 photographs were taken, five photos from each of the 49 pre-defined photo-points and 46 supplementary photo-points. File names were standardised to include information about the location and direction of each photo. Photographs taken from the pre-defined photo-points ensured coverage of the entire protected area. They included buildings and other valued landscape elements (Figure 4), as well as parts of the area without any prominent elements of defined value, that nevertheless contribute to the landscape character of the area (Figure 5).
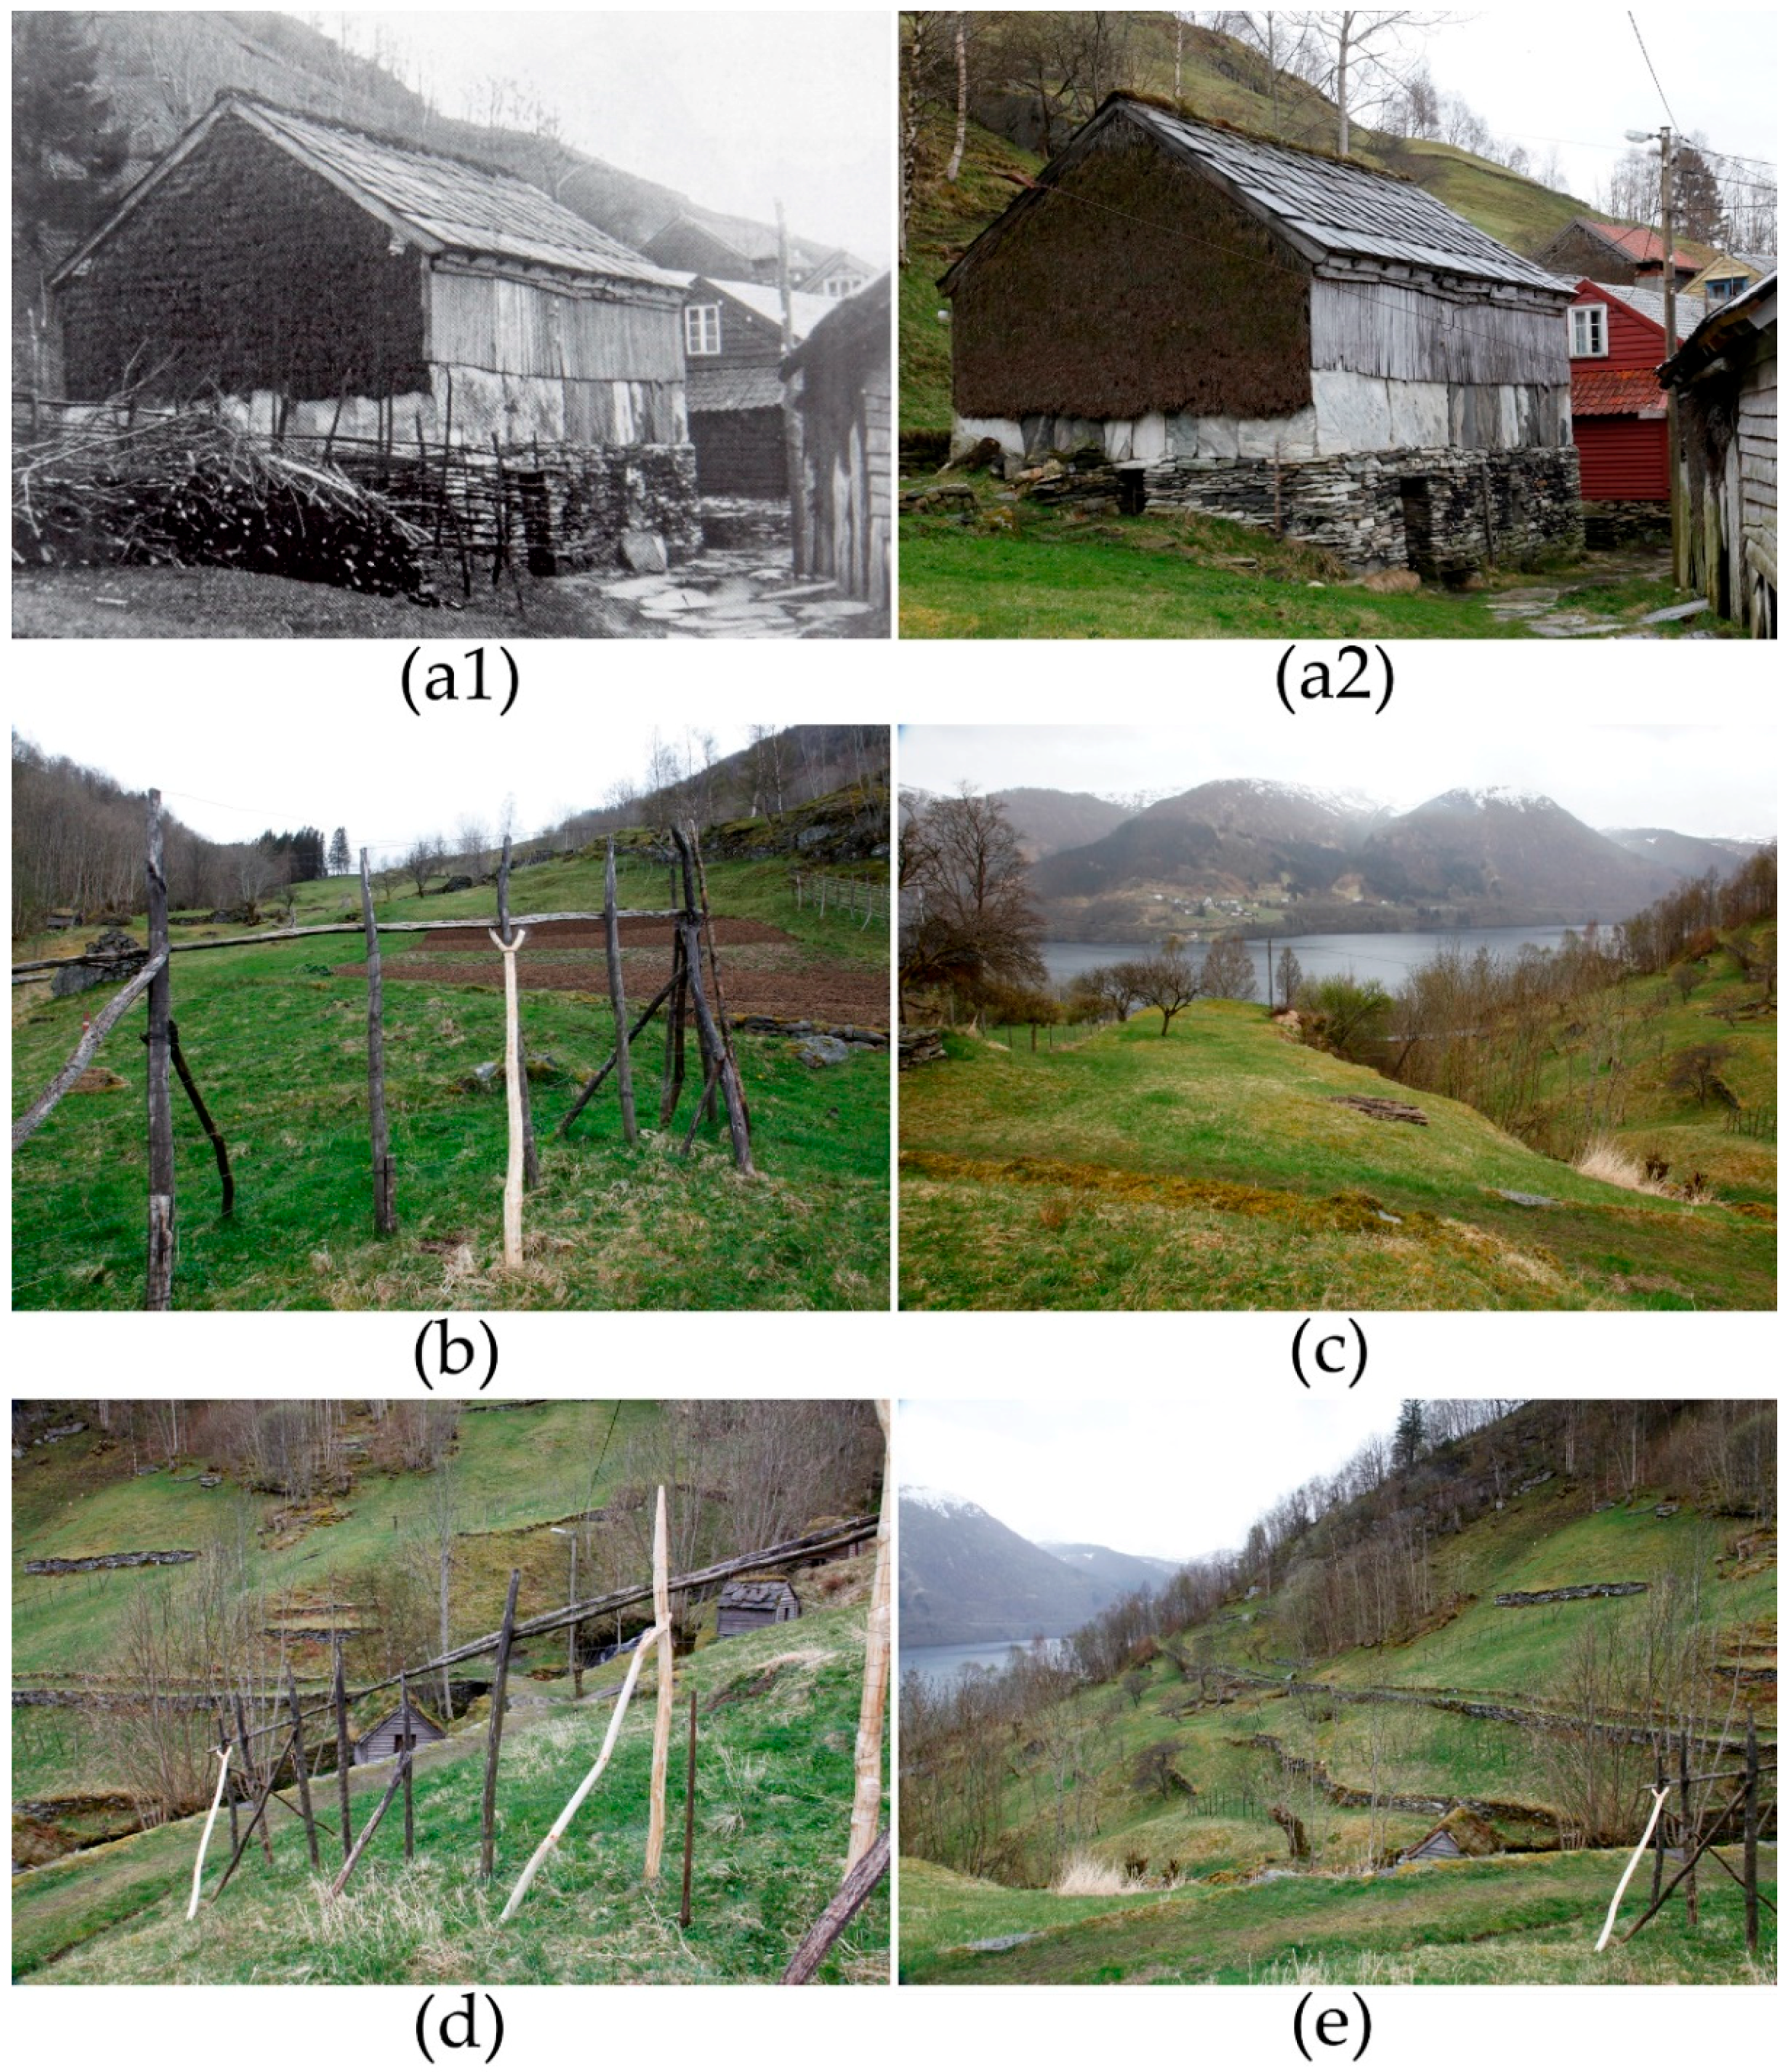
Some supplementary photo-points were chosen on the basis of historical photographs from the reference period. One photograph taken from these points thus documents continuity or change in relation to the desired state of the area, in addition to providing a basis for future monitoring (Figure 6, especially Figure 6a1,a2). The photographs into freely chosen directions from all photo-points (Figure 4e, Figure 5e and Figure 6e) add attractive scenes with the potential to provide good story-telling photographs in the future.
3.3. Field Recording of Buildings
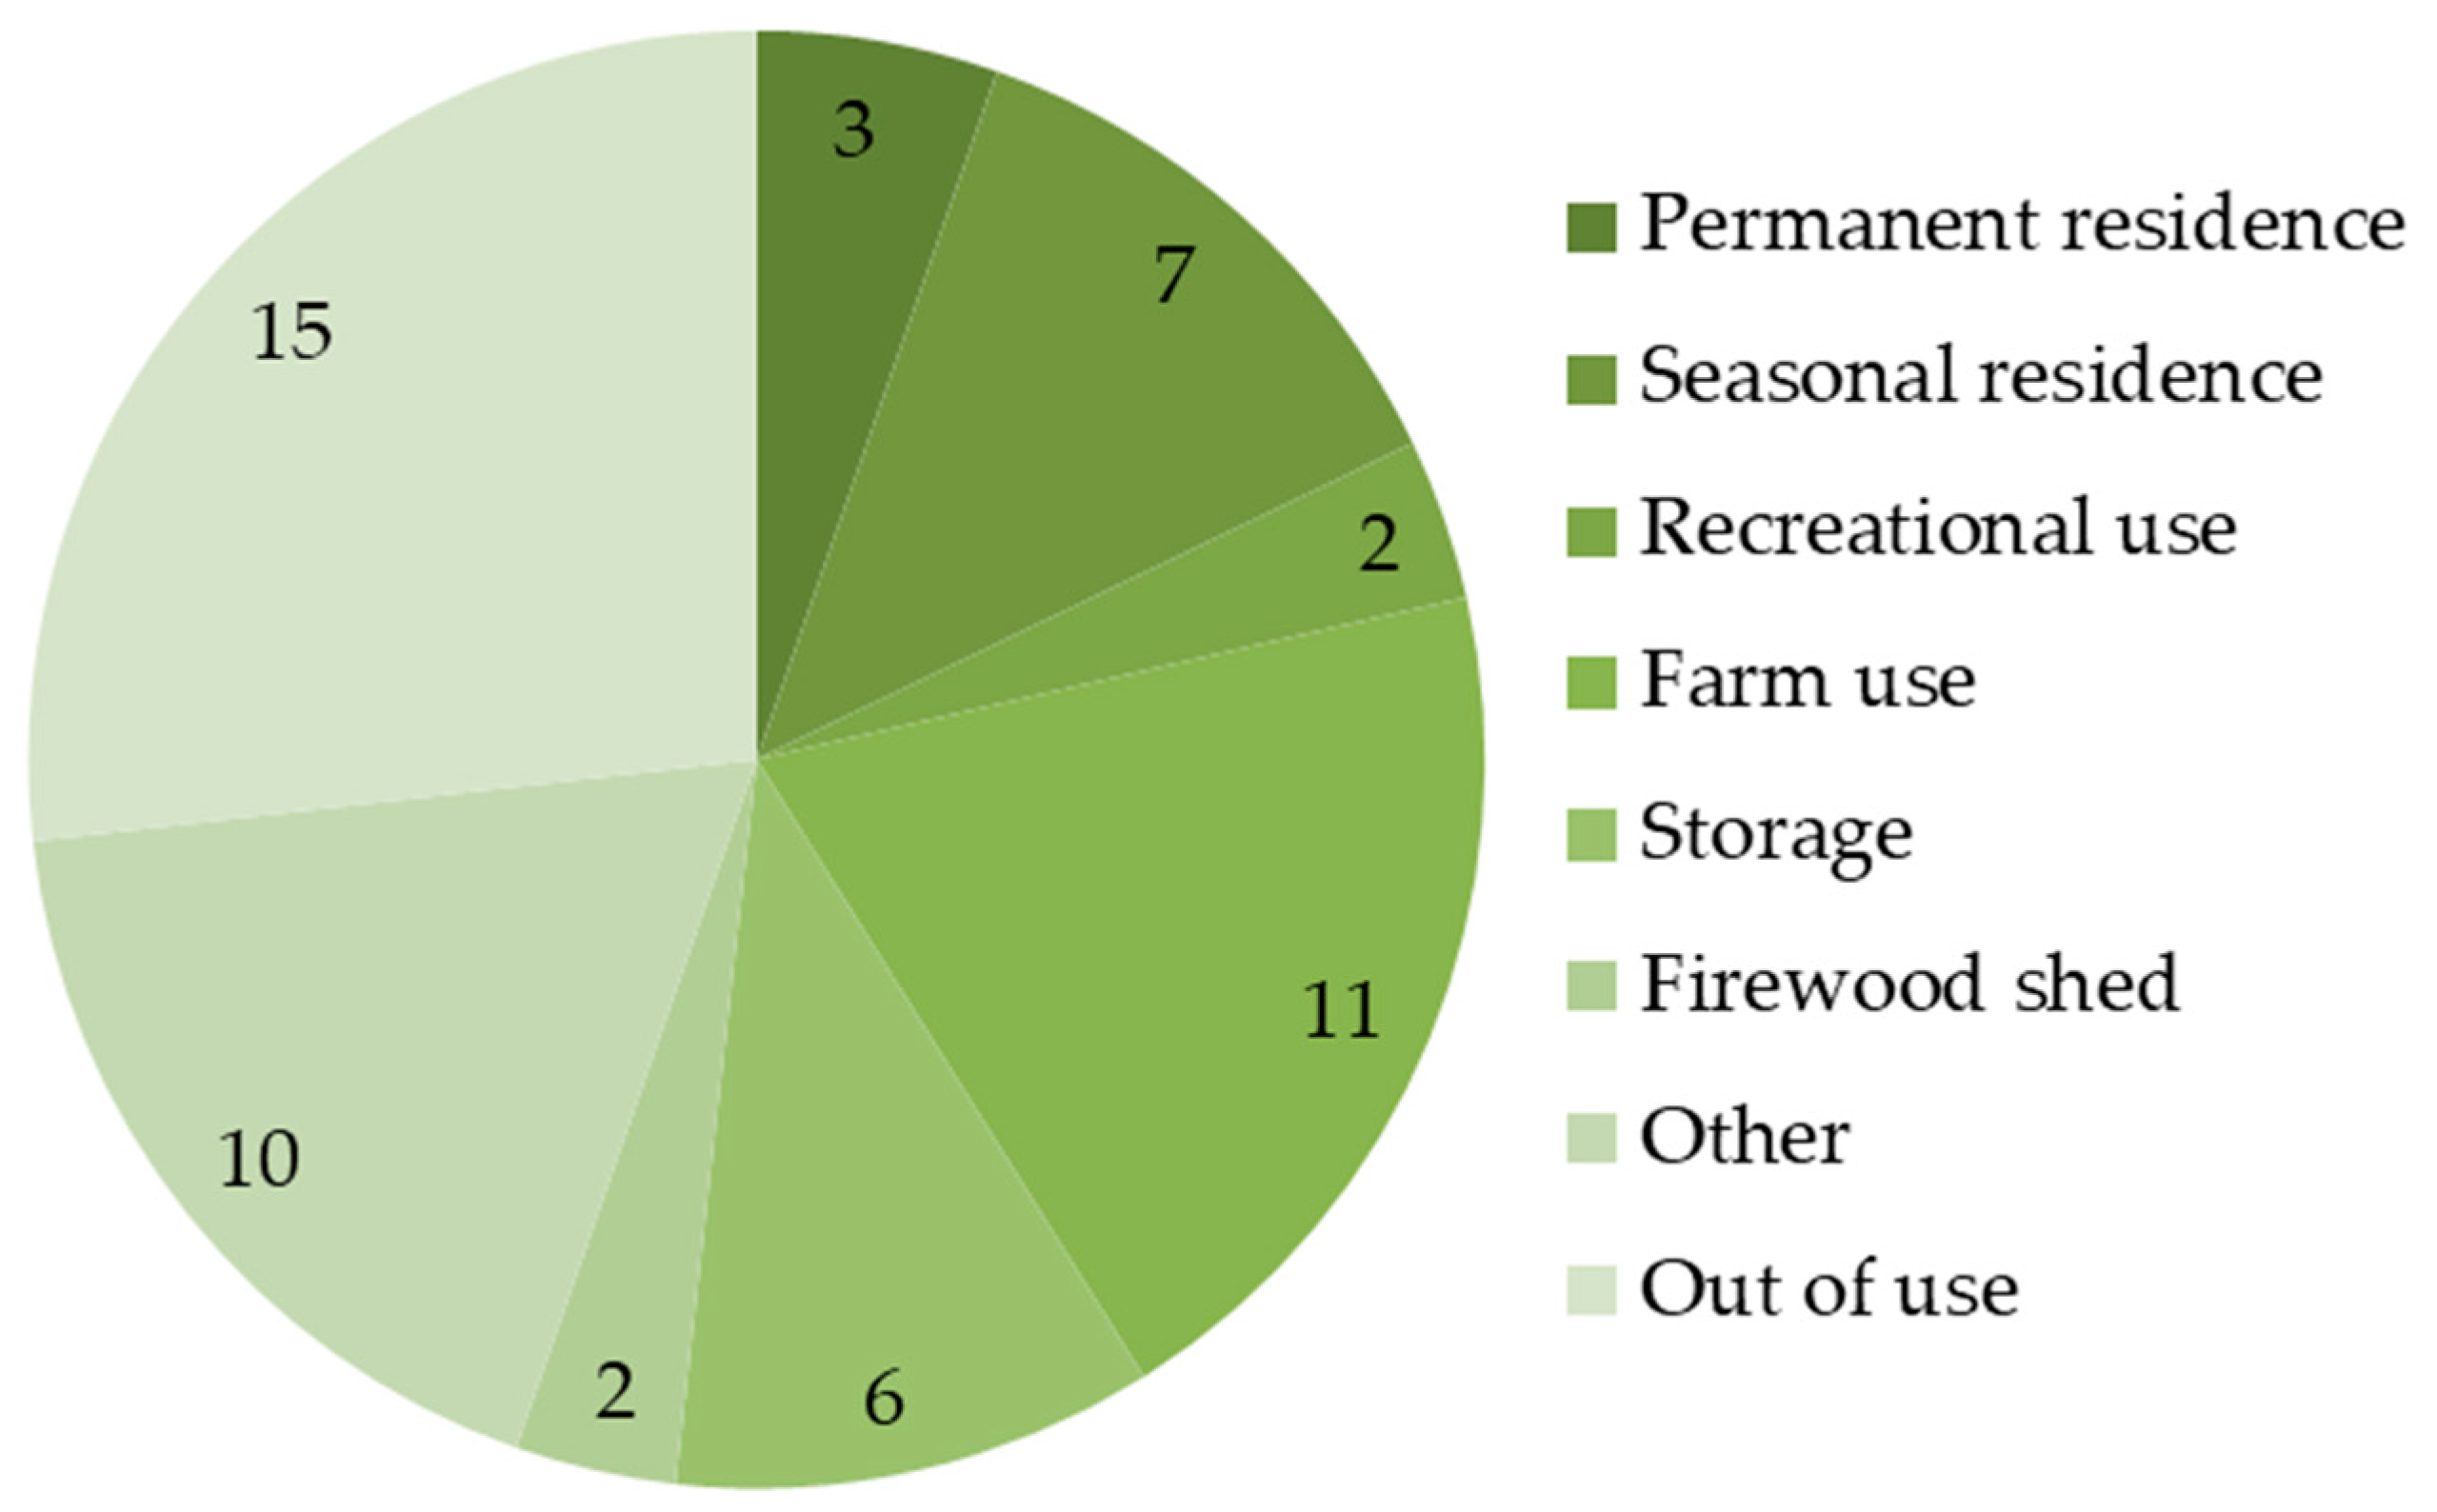
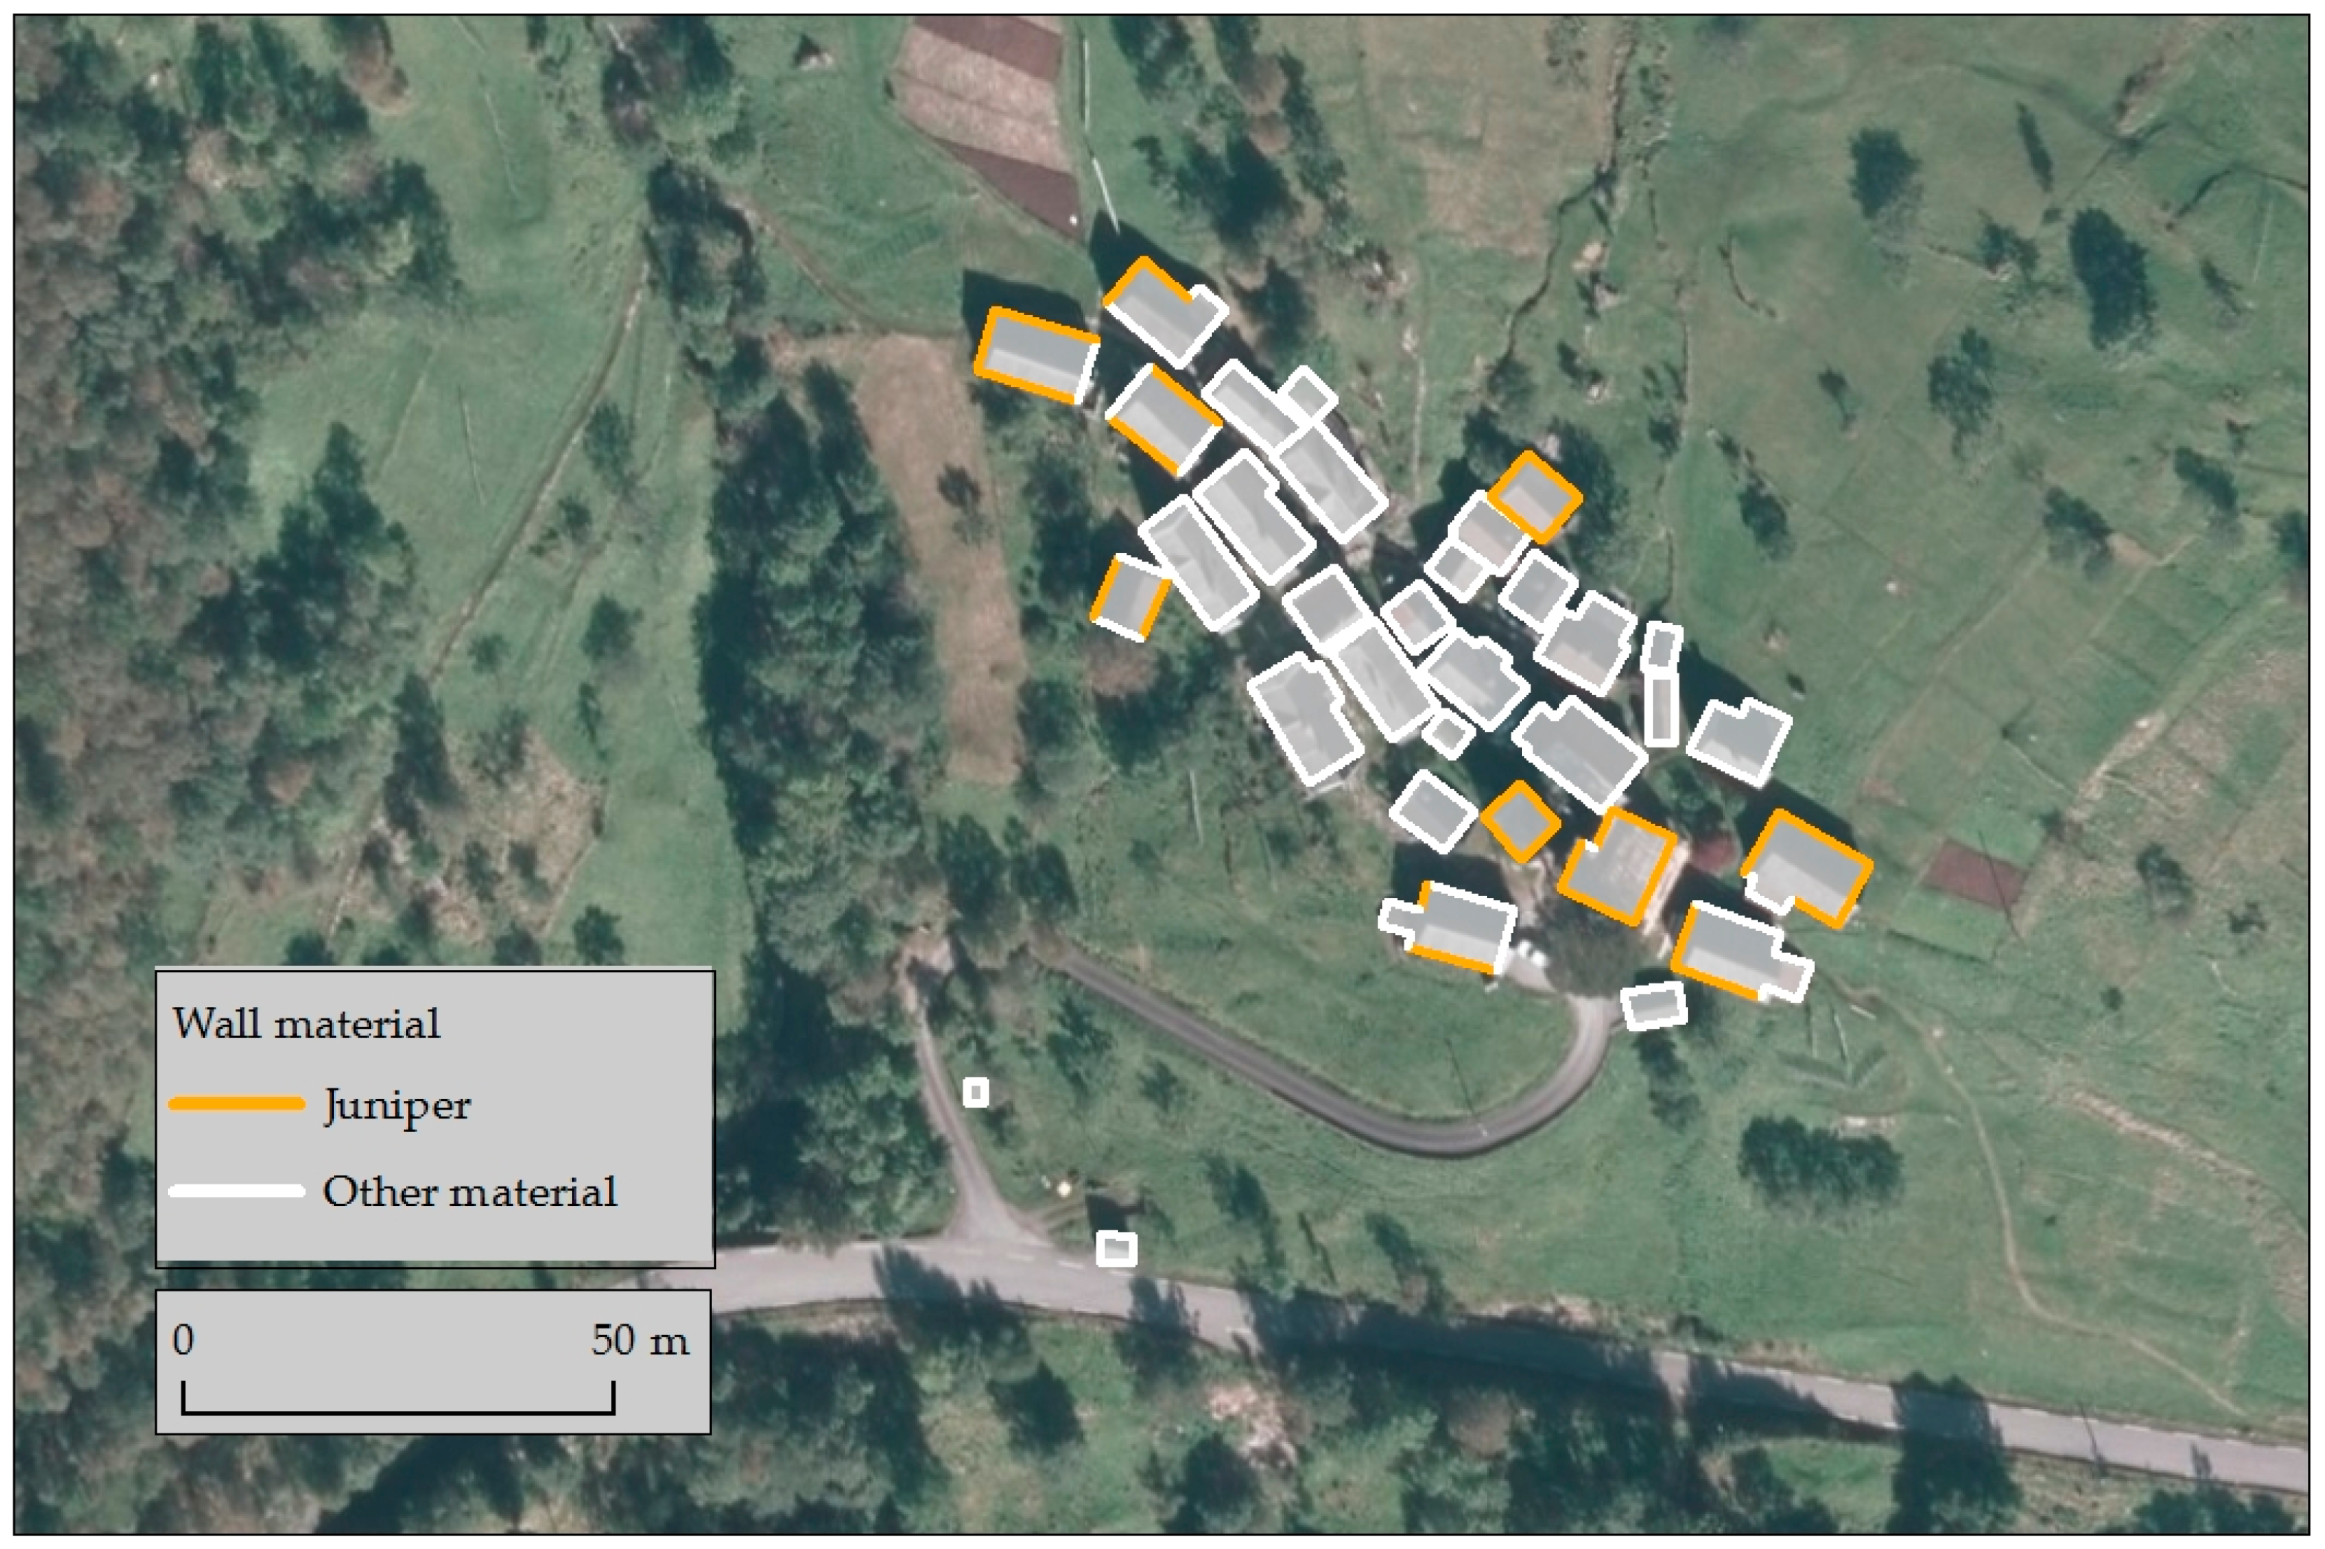
A total of 75 buildings were recorded, 19 of which were ruins or foundation walls only. The clustered farm settlement included 32 buildings, whilst the remainder included summer barns, mills and cabins. Only three, relatively younger buildings were located in the upper, northern part of the Cultural Heritage Environment. These were connected to the use of the area by neighbouring livestock farmers as tenants: a cabin, a barn and a shed. Records include, for example, use status (Figure 7) and physical features as exemplified by juniper wall cladding (Figure 8).
3.4. Public Participation
The interviewees had different degrees of affiliation with the landscape. At one end of the scale were those, now in their eighties, who had been born at Havrå or neighbouring farms, and lived and farmed there their entire lives. Others had left the farm in their youth, but later helped with farm work in their free time. There were also those who had used the area for holidays and recreation in their youth, either returning regularly over the years, or returning after a longer absence. Two of the interviewees had been working at the Havrå museum for 10–15 years.
All interviewees expressed strong attachment to the area and said that it meant a great deal to them. Most were concerned that the current owners in the area had insufficient time and workforce to keep the farm in good shape, as befitting for a nationally protected landscape and to honour the memory of their hard-working ancestors. Moreover, all interviewees saw the clustered settlement as the most central aspect of cultural heritage and the core of the protected landscape. However, there were divergent views on whether its current status reflected that of the reference period. Some buildings show signs of neglect, paths between the buildings are eroded and some interviewees believed that poor workmanship on building maintenance and the introduction of new elements (see, e.g., satellite dishes; Figure 4a) were spoiling the settlement.
Farm tracks and paths were emphasised as important for enabling visitors to experience the entire Cultural Heritage Environment. There were different views on which paths should be prioritised, but agreement on the need to improve physical and visual accessibility by clearing bushes and trees.
The pre-industrial field structure was also seen as an essential aspect of the protected landscape, requiring maintenance of marker stones, which indicate the property boundaries among farm holdings and dictated who worked where in the very limited area of infields. The stones are quite inconspicuous, and their function is not necessarily obvious to visitors. Therefore, there was some fear that the stones might become neglected landscape elements in Havrå Cultural Heritage Environment. There was also great concern that many areas are no longer used for hay-making, and that there are too few animals on the farm to maintain the pastures. However, there was no agreement about solutions. The historic landscape was characterised by labour intensive harvesting and a high degree of cooperation. Today, there are few people farming the land and few management agreements between landowners. Lack of communication has led to distrust about harvesting of jointly owned land.
The northern part of the landscape, which cannot be seen from the clustered settlement and where the land has been cultivated and rented out, is not seen as a natural part of the protected landscape. Nevertheless, management of the upper area and a connecting forestry track are relevant, since run-off affects the farmland lower down, closer to the settlement.
In addition to providing their perspectives on the physical elements of the Cultural Heritage Environment, the interviewees also provided information about immaterial values associated with the landscape. In particular, they could tell about the way things were done, both physical practices but also underlying customs and unwritten «rules». This could include tacit knowledge [37], i.e., skills that are transferred through working together rather than any formal training. Examples include both historical farming practices, but also maintenance and repair of buildings and tools. When many people lived on the farm, managing their privately-owned buildings and farm plots as well as communal land, good coordination of tasks and working together was essential. Today’s museum, which manages just three properties, cannot compensate for the decline in the number of people (and workforce) living in the settlement and farming the land. Interviewees differed in the degree to which they considered it acceptable to manage some parts of the area and buildings with modern tools and methods.
4. Discussion
The different methods we have demonstrated for monitoring a landscape are complementary, capturing different landscape qualities, both material and immaterial, with very little redundancy. Quantitative methods, such as changes in the area of different land types, can be put into context through qualitative approaches, such as re-photographing old landscape photographs or stakeholder interviews. An example from Havrå might be the building of the road into the area, which affected only a very small proportion of the total area but has been important for the functioning of the landscape. The road altered the direction of transport, severing the previous strong connection to the fjord, and altering the perceived relationships between different aspects of cultural heritage. At the same time, management authorities and stakeholders might tend to focus on the relatively small area of the clustered settlement and surrounding infields, whilst the mapping from aerial photographs can identify changes throughout the entire landscape and highlight the cumulative effects of many small changes over time, such as the gradual replacement of open vegetation with bushes and trees.
We recognise that the costs of monitoring will often limit the methods that can be used, and the set demonstrated here might be considered an ideal set of monitoring methods that is often unattainable. However, monitoring is a long-term endeavour and the interval between repeat surveys does not need to be fixed. It is possible for a programme to alternate between different modules, perhaps extending the length of the monitoring cycle in order to capture more aspects of landscape change. This may be especially relevant for protected Cultural Heritage Environments, where one would expect a rather low level of landscape change.
In this project, we were fortunate to have access to the staff who carry out the mapping from aerial photographs for the national Agricultural Landscape Monitoring Programme, who are well-trained in the use of appropriate detailed mapping instructions. Developing and documenting such mapping instructions for the first time and training staff to use them is a considerable undertaking, which might prove prohibitively costly for a small, “one-off” monitoring project. Nevertheless, we would strongly emphasize the usefulness of investing in standardised mapping instructions that can be used across multiple projects over many decades.
Landscape monitoring programmes differ in the length of their monitoring cycle, e.g., three years [38], five years [17,20], or even irregular intervals dependent on financing [14]. The length of the cycle will usually be a compromise between a desired frequent interval that can provide rapid feedback about ongoing landscape change, and economic and logistical constraints. Although always striving for methods that are observer independent, using the same, trained staff who are familiar with the monitoring methods is likely to be more time-efficient and ensure more consistent and reliable results than training a new set of staff for each new survey. A rolling survey, where a portion of sites are monitored each year, is therefore a good solution for maintaining competency in monitoring methods.
For a protected area, where change should not be large, it may be better to use a longer interval between land cover / land use mapping and alternate with monitoring of other landscape qualities, such as field recording of specific cultural heritage and monitoring of immaterial values. At Havrå, we have seen that the landscape has undergone rather large changes from 1951 to 2013, but we expect that the changes during the subsequent five years have been relatively small, especially in the landscape directly surrounding the clustered settlement. Based purely on five-year mapping results, one might assume that the protection of the area was securing the cultural landscape. However, the interviews with landowners revealed that this is a landscape on the brink of change. The current landscape is being maintained primarily by a museum, which has rights of use for only a part of the area. The land use is artificial, in the sense that no farmer could make a living purely from farming this land. It is unreasonable to expect that the subsistence farming that created the landscape could be resumed, even if some individuals might find this an interesting lifestyle. Probably a more sustainable solution would be to develop sources of income from tourism and educational activities. This requires a discussion about authenticity, a coordinated strategy to develop the area in a sensitive way, and clear agreements about who does what and how the economic proceeds are to be divided. These issues are beyond the scope of this paper, but highlight the fact that different monitoring methods may be needed to uncover driving forces of change, before these are seen in the landscape in the form of land use and land cover changes.
Regarding land use and land cover, it should be mentioned that there has been a long-standing debate about mixing these two terms in classification systems [39,40,41]. Nevertheless, for our purposes, we found the 3Q classification system to be a useful compromise, where land cover is interpreted to provide as much information as possible about land use. We know that open vegetation types in this landscape indicate some form of harvesting. The presence of hay-drying racks can indicate that they are held open by cutting the grass for hay. Signs of animal tracks indicate that they are used for grazing. At low grazing intensity, these tracks become less visible in the aerial photographs and the interpretation is more difficult, but if bushes and trees have appeared on an area that was formerly open, this is a good indication that grazing has ceased, or at least is insufficient to maintain the open vegetation. The 3Q classification system also has a category for cases where it is uncertain whether harvesting or grazing still occurs. In a monitoring perspective, we are interested in land cover because this affects how the landscape is experienced, both by wildlife and people. However, we are also interested in land use because this both influences and reflects how the landscape is experienced, as well as being an indicator of how the landscape has been used in the past and will change in the future. Interestingly, interpretation of the 1951 aerial photographs indicated that, even in the reference period, a large part of the landscape was probably undergoing change from previous times. The dominant land category was unmanaged open land, yet, in this landscape, most land will eventually become covered with forest if there is no management.
We have stressed the concept of year zero, as being the first year of reliable, well-documented data collection that provides the foundation for all future monitoring. In practice, a strict year zero may be difficult to achieve, as illustrated here by the fact that the aerial photographs were from 2013, whilst the fieldwork was carried out in 2015. Such is often the case when dependent on aerial photographs from an area, especially in Norway where cloud cover can seriously influence plans for aerial photography. In the 3Q Programme, which aims for a five-year monitoring cycle, aerial photographs are accepted from four to seven-year intervals, if five years is not available. The interval of change is then standardized by calculating average annual change multiplied by five.
Although year zero is the start of systematic monitoring, we have also shown that data from the reference period or a support year can provide valuable information about landscape change. We were able to use older aerial photographs for mapping, which gave a general impression of the main land use and land cover changes, even though some objects or land types were not possible to decipher from the older, poorer quality photos. The important detail here is that the mapping instructions were the same, and the information from the two sets of aerial photographs were examined together, so that we can be confident that recorded changes were real and not due to differences in mapping methodology. We also had success using ground photographs from reference period and support years, and were able to integrate the old photographs into the new methodology by establishing additional photo-points, with GPS coordinates and photos in all directions for future use. This provided a much greater time-span of story-telling photographs that illustrate changes in visual qualities in the area.
In addition, regarding public participation, some data are available from the reference period. In the film of Havrå from 1952, inhabitants express their attitudes and perspectives regarding landscape qualities and the management of the area. The film makes clear the enormous changes that have occurred in lifestyles over a 60–70 year period, together with associated values of land, time and human labour. Indeed, even over a short period, stakeholder attitudes may change rather profoundly and quickly. Our results identified deficits in mutual communication among landowners as a crucial challenge to effective heritage management. However, subsequent to publication of our reports in late 2016 [42,43], we received feedback from a participant that the level of dialogue among landowners and with regional authorities has much improved since late 2015–early 2016, partly in connection with generational change on several farm holdings.
Regarding monitoring technology, one can expect further development in the future. As the resolution of satellite images increases, they may replace aerial photographs in land cover and land use change monitoring, without compromises in degree of detail [44]. Unmanned aerial vehicles may enable recording over small areas, to gather specific data on demand. Moreover, improved processing capacity of large amounts of data is likely to make possible various automated analyses, for example detecting changes in terrain, land cover and human-made landscape features such as buildings. Nevertheless, for current needs and the near future, we see great power in the visualisation of landscape continuity and change through aerial photography [45] and repeat on-ground photography. These methods also provide material that will be of use in combination with the new technology in the future [46,47,48].
5. Conclusions
This paper has demonstrated a comprehensive monitoring programme for a protected Cultural Heritage Environment. We have stressed the need for repeatable, well-documented methods to provide reliable measurements of status and change. Already in the first round of monitoring, and with some help from supporting historical data, we have detected challenges in terms of maintaining or reconstructing the desired status of different tangible and intangible landscape elements and values in the Cultural Heritage Environment. Interpretation of aerial photographs showed that farmland has either been intensified or abandoned. Many formerly open areas are no longer harvested by people or animals and have turned into a forest, which has more than tripled in size between 1951 and 2013. Repeat landscape photography illustrates the changes observed from aerial photos, and shows examples of good maintenance but also examples of neglect and unfavourable change throughout the landscape. Field survey included 75 buildings, 56 of which were still usable; however, only 42 were in good shape. Interviewing the owners of the eight farm units represented on the site revealed a complicated history of land management during the last four to six decades, a broad spectrum of opinions on management of tangible and intangible landscape values and a rather low degree of mutual communication. We conclude that our proposed methods, in combination, seem well suited to capture different types of information to monitor changes over time. The monitoring data can thus provide appropriate feedback to ensure that the heritage values defined in the Rule of Protection are adequately protected, or to highlight where values are threatened, and extra measures are needed.
Author Contributions
Funding acquisition, S.O.K. and O.P.; all authors contributed significantly to the conceptualisation, methodology and investigation, including fieldwork: Ground photos, O.P. and W.F., Field registrations, S.O.K., W.F. and S.E., Interviews, S.E.; Interview analyses, S.E.; Map analyses, S.O.K. and W.F. Data curation photos, O.P. Writing—original draft S.E. and W.F.; Writing—review and editing, all authors; Project leader: S.O.K.
Funding
Method development and data collection were funded by the Norwegian Directorate for Cultural Heritage. Preparation of the manuscript was funded by the Norwegian Ministry of Agriculture and Food, through the Research Council of Norway, Grant No. 194051. The APC was funded by NIBIO.
Acknowledgments
We would like to thank our colleagues at NIBIO who also contributed to generation and analysis of data, and discussions: Frode Bentzen (aerial photo interpretation, field control of aerial photo interpretation, and ground photography), Wenche Dramstad (conceptualisation of the study), Kari Stensgaard (interview survey and field registration), and Hanne Gro Wallin (aerial photo interpretation). Thanks are also due to our interviewees, i.e., residents, landowners and museum employees at Havrå, and to our contact persons at the Directorate for Cultural Heritage: Ragnhild Hoel and Anke Loska.
Conflicts of Interest
The authors declare no conflict of interest. The Norwegian Directorate for Cultural Heritage as a funder of the study had some influence on the design of the study; however, they had no role in the collection, analyses, or interpretation of data; in the writing of the manuscript, or in the decision to publish the results.
References
- ICOMOS. Introducing ICOMOS—International Council on Monuments and Sites. Available online: www.icomos.org (accessed on 31 January 2019).
- UNESCO. Convention Concerning the Protection of the World Cultural and Natural Heritage; United Nations Educational, Scientific and Cultural Organization: Paris, France, 1972; Available online: https://whc.unesco.org/en/conventiontext/ (accessed on 31 January 2019).
- UNESCO-WHC. Final Decisions of the 33rd Session of the World Heritage Committee, WHC-09/33.COM/20; United Nations Educational, Scientific and Cultural Organization, World Heritage Committee: Seville, Spain, 2009; Available online: https://whc.unesco.org/en/sessions/33COM/ (accessed on 30 January 2019).
- Pedroli, G.B.M.; Meiner, A. Landscapes in transition: An account of 25 years of land cover change in Europe. 9789292138820 1977-8449, European Environment Agency (EEA), Copenhagen. 2017. Available online: http://edepot.wur.nl/451614 (accessed on 31 January 2019).
- UNESCO. Reporting and Monitoring; United Nations Educational, Scientific and Cultural Organization, 2019. Available online: https://whc.unesco.org/en/118/ (accessed on 30 January 2019).
- Act of 9 June 1978 No. 50 Concerning Cultural Heritage. Available online: https://www.regjeringen.no/en/dokumenter/cultural-heritage-act/id173106/ (accessed on 31 January 2019).
- Act of 19 June 1970 No. 63 Relating to Nature Conservation (Subsequently Amended). Available online: http://extwprlegs1.fao.org/docs/pdf/nor3772E.pdf (accessed on 31 January 2019).
- Norwegian Ministry of the Environment. Report No. 21 to the Storting (2004–2005). The Government’s Environmental Policy and the State of the Environment in Norway. 2005. Available online: https://www.regjeringen.no/en/dokumenter/report-no.-21-to-the-storting-2004-2005/id406982/ (accessed on 31 January 2019).
- UNESCO-WHC. Final Report on the Results of the Second Cycle of the Periodic Reporting Exercise for the Europe Region and Action Plan WHC-15/39.COM/10A; The United Nations Educational, Scientific and Cultural Organization, World Heritage Committee: Paris, France, 2015. [Google Scholar]
- Affek, A.N.; Zachwatowicz, M.; Sosnowska, A.; Gerlee, M.; Kiszka, K. Impacts of modern mechanised skidding on the natural and cultural heritage of the Polish Carpathian Mountains. For. Ecol. Manag. 2017, 405, 391–403. [Google Scholar] [CrossRef]
- Mateos, R.M.; Ezquerro, P.; Azanon, J.M.; Gelabert, B.; Herrera, G.; Fernandez-Merodo, J.A.; Spizzichino, D.; Sarro, R.; Garcia-Moreno, I.; Bejar-Pizarro, M. Coastal lateral spreading in the world heritage site of the Tramuntana Range (Majorca, Spain). The use of PSInSAR monitoring to identify vulnerability. Landslides 2018, 15, 797–809. [Google Scholar] [CrossRef]
- Nolesini, T.; Frodella, W.; Bianchini, S.; Casagli, N. Detecting Slope and Urban Potential Unstable Areas by Means of Multi-Platform Remote Sensing Techniques: The Volterra (Italy) Case Study. Remote Sens. 2016, 8, 746. [Google Scholar] [CrossRef]
- Preti, F.; Errico, A.; Caruso, M.; Dani, A.; Guastini, E. Dry-stone wall terrace monitoring and modelling. Land. Degrad. Dev. 2018, 29, 1806–1818. [Google Scholar] [CrossRef]
- Norton, L.R.; Maskell, L.C.; Smart, S.S.; Dunbar, M.J.; Emmett, B.A.; Carey, P.D.; Williams, P.; Crowe, A.; Chandler, K.; Scott, W.A.; et al. Measuring stock and change in the GB countryside for policy—Key findings and developments from the Countryside Survey 2007 field survey. J. Environ. Manag. 2012, 113, 117–127. [Google Scholar] [CrossRef] [PubMed]
- Riedel, S.; Meier, E.; Buholzer, S.; Herzog, F.; Indermaur, A.; Lüscher, G.; Walter, T.; Winizki, J.; Hofer, G.; Ecker, K.; et al. ALL-EMA Methodology Report: Agricultural Species and Habitats. Agroscope Science No. 57 / 2018, Agroscope & WSL Swiss Federal Institute for Forest, Snow and Landscape Research, Zurich. 2018. Available online: https://www.agroscope.admin.ch/agroscope/en/home/topics/environment-resources/monitoring-analytics/all-ema.html (accessed on 31 January 2019).
- Kienast, F.; Frick, J.; van Strien, M.J.; Hunziker, M. The Swiss Landscape Monitoring Program—A comprehensive indicator set to measure landscape change. Ecol. Model. 2015, 295, 136–150. [Google Scholar] [CrossRef]
- Ståhl, G.; Allard, A.; Esseen, P.-A.; Glimskär, A.; Ringvall, A.; Svensson, J.; Sundquist, S.; Christensen, P.; Torell, Å.G.; Högström, M.; et al. National Inventory of Landscapes in Sweden (NILS)—Scope, design, and experiences from establishing a multiscale biodiversity monitoring system. Environ. Monit. Assess. 2011, 173, 579–595. [Google Scholar] [CrossRef]
- Ihse, M.; Blom, G. A Swedish countryside survey for monitoring of landscape features, biodiversity and cultural heritage. In Consequences of Land Use Changes; Mander, Ü., Jongman, R.H.G., Eds.; WIT Press: Ashurst, NY, USA, 2000; pp. 39–75. [Google Scholar]
- Dramstad, W.E.; Fry, G.; Fjellstad, W.J.; Skar, B.; Helliksen, W.; Sollund, M.L.B.; Tveit, M.S.; Geelmuyden, A.K.; Framstad, E. Integrating landscape-based values—Norwegian monitoring of agricultural landscapes. Landsc. Urban Plan. 2001, 57, 257–268. [Google Scholar] [CrossRef]
- Dramstad, W.E.; Fjellstad, W.J.; Strand, G.H.; Mathiesen, H.F.; Engan, G.; Stokland, J.N. Development and implementation of the Norwegian monitoring programme for agricultural landscapes. J. Environ. Manag. 2002, 64, 49–63. [Google Scholar] [CrossRef]
- Act of 19 June 2009 No. 100 Relating to the Management of Biological, Geological and Landscape Diversity. Available online: https://www.regjeringen.no/en/dokumenter/nature-diversity-act/id570549/ (accessed on 28 March 2019).
- Statistics Norway. Protected Areas. Available online: https://www.ssb.no/en/natur-og-miljo/statistikker/arealvern (accessed on 31 January 2019).
- Jensen, M.A.; Monstad, K.; Kvamme, M. Kulturlandskap på museum—er det mulig i praksis? Utfordringer og erfaringer fra det freda kulturmiljøet Havrå. Heimen 2012, 3, 319–332. [Google Scholar]
- Bewley, R.H. Aerial survey for archaeology. Photogramm. Rec. 2003, 18, 273–292. [Google Scholar] [CrossRef]
- Crawford, O.G.S. Air Survey and Archaeology. Ordnance Survey Professional Paper No. 7; HSMO: Southampton, UK, 1928. [Google Scholar]
- Troll, C. Fortschritte der wissenschaftlichen Luftbildforschung. Z. Der Ges. Für Erdkd. Zu Berl. 1943, 7/10, 277–311. [Google Scholar]
- Fensham, R.J.; Fairfax, R.J. Aerial photography for assessing vegetation change: A review of applications and the relevance of findings for Australian vegetation history. Aust. J. Bot. 2002, 50, 415–429. [Google Scholar] [CrossRef]
- Engan, G. 3Q Instruks for Flybildetolking; 8/2004; Norsk institutt for jord- og skogkartlegging/Norwegian Institute of Land Inventory (NIJOS): Ås, Norway, 2004; Available online: http://www.skogoglandskap.no/filearchive/Rapport_08_04.pdf (accessed on 28 March 2019).
- Fjellstad, W.; Dramstad, W.E. 3Q: Endringer i jordbrukets kulturlandskap—Østfold, Oslo/Akershus og Vestfold. Tema Arealstruktur; 12/2005; Norsk institutt for jord- og skogkartlegging/Norwegian Institute of Land Inventory (NIJOS): Ås, Norway, 2005; Available online: http://www.skogoglandskap.no/filearchive/Rapport_12_05.pdf (accessed on 28 March 2019).
- Puschmann, O.; Eiter, S.; Fjellstad, W.J.; Krøgli, S.O. Preparing future flashbacks – repeat photography as a method in landscape monitoring; NIBIO POP, 4(24); Norwegian Institute of Bioeconomy Research: Ås, Norway, 2018; Available online: https://nibio.brage.unit.no/nibio-xmlui/handle/11250/2560429 (accessed on 28 March 2019).
- Aas, E. Recording the past. In Monuments & Sites—Norway: A Cultural Heritage; Hinsch, L., Lidén, E., Myklebust, D., Tschudi-Madsen, S., Eds.; Riksantikvaren/Universitetsforlaget Oslo: Oslo, Norway, 1987; ICOMOS Bulletin 7, 110–113. [Google Scholar]
- Council of Europe. The European Landscape Convention. Available online: https://www.coe.int/en/web/conventions/full-list/-/conventions/treaty/176 (accessed on 31 January 2019).
- Kizos, T.; Plieninger, T.; Iosifides, T.; Martín, M.L.G.; Girod, G.; Karro, K.; Palang, H.; Printsmann, A.; Shaw, B.; Nagy, J. Responding to Landscape Change: Stakeholder Participation and Social Capital in Five European Landscapes. Land 2018, 7, 14. [Google Scholar] [CrossRef]
- Caspersen, O.H. Public participation in strengthening cultural heritage: The role of landscape character assessment in Denmark. Geogr. Tidsskr. Dan. J. Geogr. 2009, 109, 33–45. [Google Scholar] [CrossRef]
- Hribar, M.S.; Lisec, A. Protecting trees through an inventory and typology: Heritage trees in the Karavanke Mountains, Slovenia. Acta Geogr. Slov. Geogr. Zb. 2011, 51, 169–180. [Google Scholar] [CrossRef]
- Eiter, S.; Vik, M.L. Public participation in landscape planning: Effective methods for implementing the European Landscape Convention in Norway. Land Use Policy 2015, 44, 44–53. [Google Scholar] [CrossRef]
- Polanyi, M. Personal Knowledge: Towards a Post-Critical Philosophy; University of Chicago Press: Chicago, IL, USA, 1958; Available online: https://bibliodarq.files.wordpress.com/2015/09/polanyi-m-personal-knowledge-towards-a-post-critical-philosophy.pdf (accessed on 31 January 2019).
- Ballin, M.; Masselli, M.; Barcaroli, G.; Scarnó, M. Redesign Sample for Land Use/Cover Area Frame Survey (LUCAS) 2018; Publications Office of the European Union: Luxembourg, 2018; Available online: https://ec.europa.eu/eurostat/web/products-statistical-working-papers/-/KS-TC-18-006 (accessed on 31 January 2019).
- Di Gregorio, A. Land Cover Classification System: Classification Concepts; The Food and Agriculture Organization of the United Nations: Rome, Italy, 2016; Available online: http://www.fao.org/3/a-i5232e.pdf (accessed on 31 January 2019).
- Anderson, J.R.; Hardy, E.E.; Roach, J.T.; Witmer, R.E. A Land Use and Land Cover Classification System for Use with Remote Sensor Data; Professional Paper 964; U.S. Geological Survey: Washington, DC, USA, 1976. Available online: https://pubs.er.usgs.gov/publication/pp964 (accessed on 31 January 2019).
- Fisher, P.F.; Comber, A.J.; Wadsworth, R. Land use and Land cover: Contradiction or Complement. In Re-Presenting GIS; Fisher, P., Unwin, D., Eds.; Wiley: Chichester, UK, 2005. [Google Scholar]
- Krøgli, S.O.; Dramstad, W.; Puschmann, O.; Eiter, S. Langtidsovervåking av Fredete Kulturmiljøer—Veileder for Innsamling av Data; NIBIO Rapport 159 (2); Norwegian Institute of Bioeconomy Research: Aas, Norway, 2016; Available online: http://hdl.handle.net/11250/2430109 (accessed on 31 January 2019).
- Fjellstad, W.J.; Puschmann, O.; Eiter, S.; Stensgaard, K.; Bentzen, F.; Wallin, H.G.; Dramstad, W.; Krøgli, S.O. Overvåking av Havrå kulturmiljø—Første Omdrev 2015; Norwegian Institute of Bioeconomy Research, Department of Landscape Monitoring: Aas, Norway, 2016; Available online: http://hdl.handle.net/11250/2430112 (accessed on 31 January 2019).
- Barlindhaug, S.; Holm-Olsen, I.M.; Tommervik, H. Monitoring archaeological sites in a changing landscape—Using multitemporal satellite remote sensing as an ‘early warning’ method for detecting regrowth processes. Archaeol. Prospect. 2007, 14, 231–244. [Google Scholar] [CrossRef]
- Abrate, M.; Bacciu, C.; Hast, A.; Marchetti, A.; Minutoli, S.; Tesconi, M. GeoMemories-A Platform for Visualizing Historical, Environmental and Geospatial Changes in the Italian Landscape. ISPRS Int. J. Geo-Inf. 2013, 2, 432–455. [Google Scholar] [CrossRef]
- Crutchley, S. Ancient and modern: Combining different remote sensing techniques to interpret historic landscapes. J. Cult. Herit. 2009, 10, E65–E71. [Google Scholar] [CrossRef]
- Risbøl, O.; Briese, C.; Doneus, M.; Nesbakken, A. Monitoring cultural heritage by comparing DEMs derived from historical aerial photographs and airborne laser scanning. J. Cult. Herit. 2015, 16, 202–209. [Google Scholar] [CrossRef] [Green Version]
- Chen, F.L.; You, J.B.; Tang, P.P.; Zhou, W.; Masini, N.; Lasaponara, R. Unique performance of spaceborne SAR remote sensing in cultural heritage applications: Overviews and perspectives. Archaeol. Prospect. 2018, 25, 71–79. [Google Scholar] [CrossRef]
Figure 1.
The clustered farmstead in Havrå Cultural Heritage Environment. Photo: W.F./NIBIO.

Figure 2.
The location of pre-defined (systematic grid) and supplementary photo-points. Aerial photo: https://norgeibilder.no.
Figure 2.
The location of pre-defined (systematic grid) and supplementary photo-points. Aerial photo: https://norgeibilder.no.

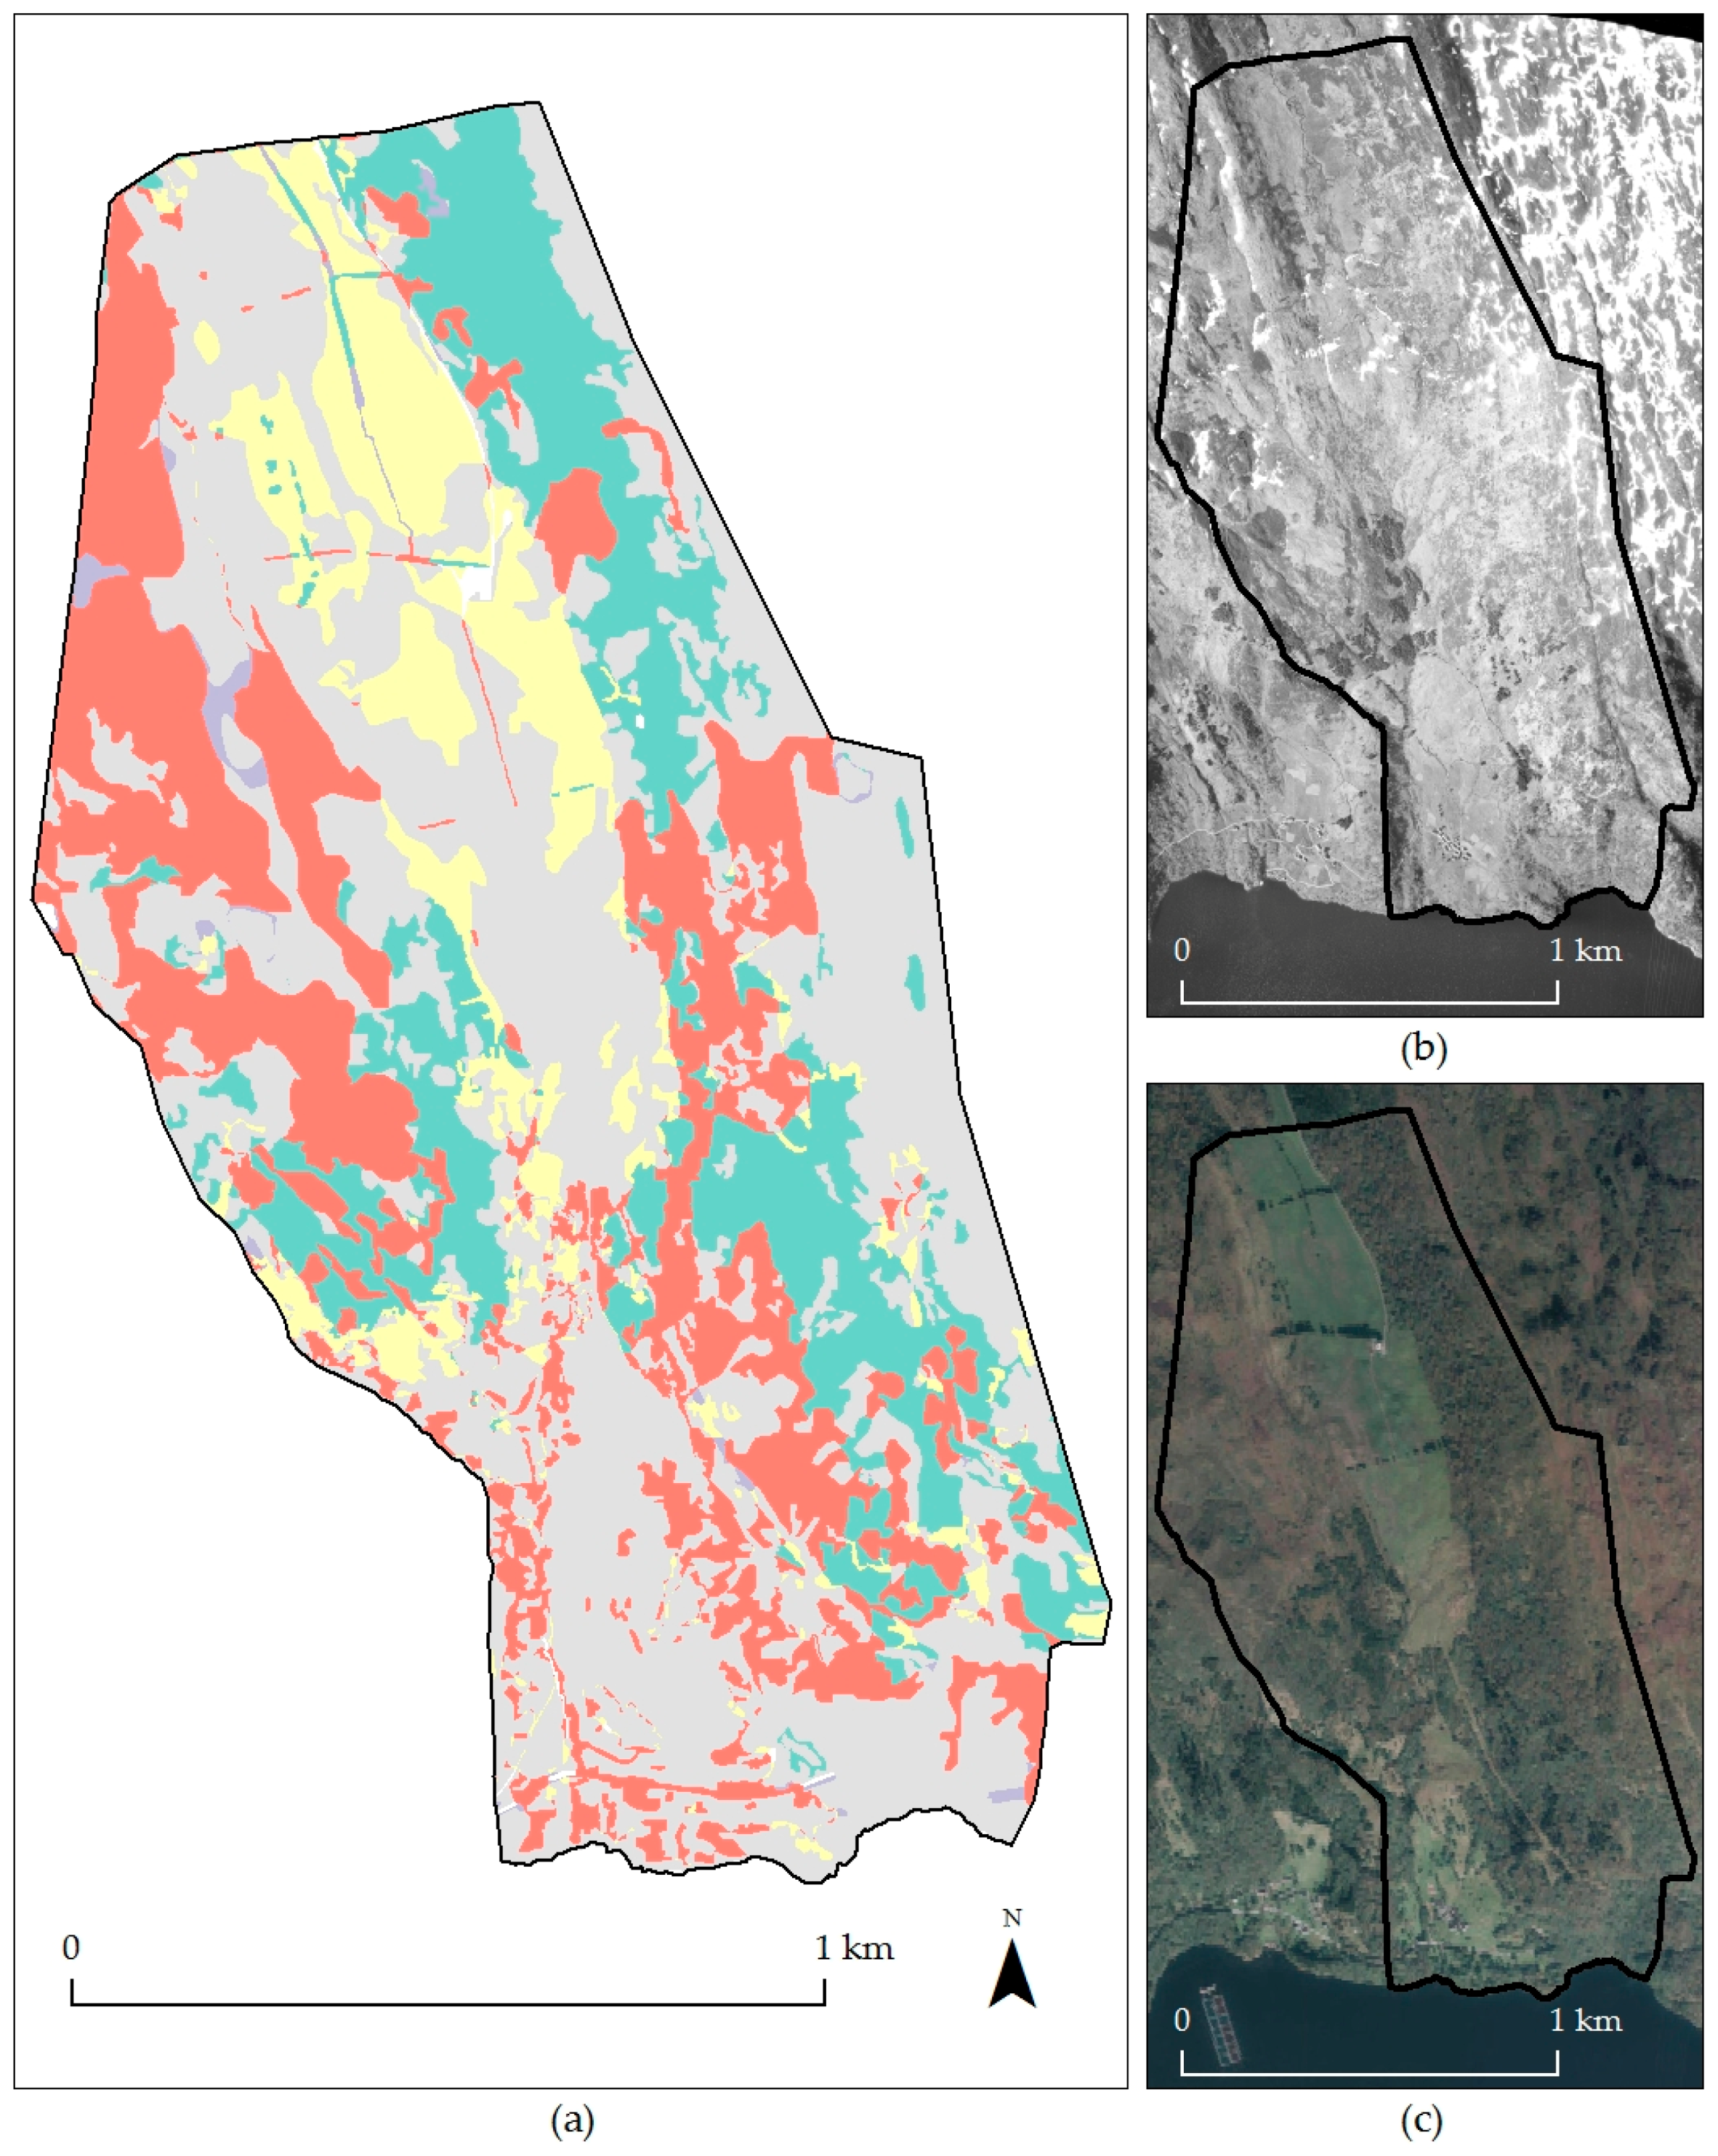
Figure 3.
Land cover change map (a), resulting from an overlay of interpretations of aerial photographs from 1951 (b) and 2013 (c). Grey signifies areas that have the same land type in both years. Red shows areas that were used for agriculture in 1951 but have been converted to other land types in 2013. Yellow shows the opposite change, conversion to agriculture. Green shows forestation of unmanaged open land or wetlands, whilst purple shows the opposite change (see also Table 3). Aerial photos: https://norgeibilder.no.

Figure 4.
Photographs taken from a pre-defined (quantitative) photo-point towards north (a), east (b), south (c), west (d), and in a freely chosen direction, southeast (e). Views include buildings, terrace walls and other valued landscape elements. Photos: Frode Bentzen / NIBIO.
Figure 4.
Photographs taken from a pre-defined (quantitative) photo-point towards north (a), east (b), south (c), west (d), and in a freely chosen direction, southeast (e). Views include buildings, terrace walls and other valued landscape elements. Photos: Frode Bentzen / NIBIO.

Figure 5.
Photographs taken from a pre-defined (quantitative) photo-point towards north (a), east (b), south (c), west (d), and into a freely chosen direction, southeast (e). The photos do not show details of prominent landscape elements of defined value, but nevertheless document aspects of landscape character. Photos: W.F./NIBIO.

Figure 6.
Photographs taken from a supplementary (qualitative) photo-point into an originally chosen direction, in this case east, in 1950 (a1) and 2015 (a2), and additionally towards north (b), south (c), and west (d) and into a freely chosen direction, west-southwest (e). Photos: Sverre Mo (1950), O.P./NIBIO.

Figure 7.
Registered use of the 56 intact buildings at Havrå (19 ruins are excluded).

Figure 8.
Use of intertwined juniper branches as wall cladding material was common in pre-industrial times, and still maintained on buildings in the Cultural Heritage Environment. See the example in Figure 6a. Aerial photo: https://norgeibilder.no.
Figure 8.
Use of intertwined juniper branches as wall cladding material was common in pre-industrial times, and still maintained on buildings in the Cultural Heritage Environment. See the example in Figure 6a. Aerial photo: https://norgeibilder.no.


Table 1.
Protected cultural heritage environments in Norway.
| Name | Landscape Type | Area (land) km2 | County, Location in Norway | Year of Protection |
|---|---|---|---|---|
| Havrå | Farm with clustered farmstead in mountain and fjord landscape | 2.0 (2.0) | Hordaland, W | 1998 |
| Utstein | Medieval monastery and farm | 2.5 (2.5) | Rogaland, SW | 1999 |
| Neiden | Ethnic Sámi seasonal settlement area | 0.2 (0.1) | Finnmark, N | 2000 |
| Kongsberg | Silver mine | 30.6 (30.6) | Buskerud, SE | 2003 |
| Sogndalstrand | Coastal trade settlement | 1.2 (0.8) | Rogaland, SW | 2005 |
| Birkelunden | Late-19th century city quarter | 0.1 (0.1) | Oslo, E | 2006 |
| Sør-Gjæslingan | Fishing settlement archipelago | 14.2 (1.4) | Trøndelag, C | 2010 |
| Bygdøy | Royal farm and urban recreation area | 2.2 (>1.8) | Oslo, E | 2012 |
| Tinfos | 19th century industrial settlement | 0.5 (0.5) | Telemark, SE | 2014 |
| Ny-Hellesund | Outer coast harbour settlement | 0.5 (0.3) | Vest-Agder, S | 2016 |
| Levanger | Early-20th century urban environment with wooden buildings | 0.2 (0.2) | Trøndelag, C | 2018 |
| Skudeneshavn | Early-19th to mid-20th century coastal town | 0.1 (0.1) | Rogaland, SW | 2018 |
Table 2.
Central terms for long-term monitoring of protected Cultural Heritage Environments.
| Term | Definition | Example (Havrå) |
|---|---|---|
| Year of protection | Year when the Rule of Protection is enacted | 1998 |
| Reference period | Approximate time period of the desired ‘ideal’ status of the landscape, according to the Rule of Protection | 1950 |
| Support year(s) | Any year(s) between the reference period and year zero when data were generated that are valuable for understanding the development of the area | 1992 |
| Year zero | Year when 1st survey for monitoring is conducted | 2015 |
Table 3.
Land cover changes [% of total area] in Havrå Cultural Heritage Environment 1951–2013, summarised into five main land types. Grey signifies areas that have the same land type in both years. Red shows areas that were used for agriculture in 1951 but have been converted to other land types in 2013. Yellow shows the opposite change, conversion to agriculture. Green shows forestation of unmanaged open land or wetlands, whilst purple shows the opposite change (see also Figure 3).
| 2013 | Total 1951 | ||||||
|---|---|---|---|---|---|---|---|
| Agriculture | Open Land | Wetland | Forest | Built-up | |||
| 1951 | Agriculture | 21.5 | 12.2 | 0.1 | 11.5 | 0.2 | 45.6 |
| Open land | 5.4 | 14.7 | 0.1 | 17.1 | 0.2 | 37.6 | |
| Wetland | 3.3 | 0.6 | 1.3 | 0.2 | 0 | 5.5 | |
| Forest | 1.7 | 0.2 | 0.0 | 9.1 | 0.1 | 11.1 | |
| Built-up | 0 | 0 | 0 | 0 | 0.2 | 0.2 | |
| Total 2013 | 32.0 | 27.8 | 1.6 | 38.0 | 0.6 | 100 | |
| Change 1951–2013 | −13.6 | −9.8 | −3.9 | 26.9 | 0.4 | 0 | |
Table 4.
Number and total length of selected linear landscape elements registered in Havrå Cultural Heritage Environment in 1951 and 2013/15, and change over time.
Table 4.
Number and total length of selected linear landscape elements registered in Havrå Cultural Heritage Environment in 1951 and 2013/15, and change over time.
| Landscape Element | 1951 | 2013/15 | Change [%] 1951–2013/15 | |||
|---|---|---|---|---|---|---|
| no. | m | no. | m | no. | m | |
| Stream | 57 | 4345 | 70 | 4160 | 23 | −4 |
| Drainage ditch | 1 | 137 | 19 | 1310 | 1800 | 856 |
| Stone wall | 44 | 1411 | 50 | 1410 | 14 | 0 |
| Other fence | 13 | 607 | 37 | 2626 | 185 | 333 |
| Hay-drying rack | 218 | 2320 | 43 | 386 | −80 | −83 |
| Terrace wall | 77 | 1008 | 80 | 1005 | 4 | 0 |
| Path | 45 | 4219 | 45 | 5237 | 0 | 24 |
© 2019 by the authors. Licensee MDPI, Basel, Switzerland. This article is an open access article distributed under the terms and conditions of the Creative Commons Attribution (CC BY) license (http://creativecommons.org/licenses/by/4.0/).
Share and Cite
MDPI and ACS Style
Eiter, S.; Fjellstad, W.; Puschmann, O.; Krøgli, S.O. Long-Term Monitoring of Protected Cultural Heritage Environments in Norway: Development of Methods and First-Time Application. Land 2019, 8, 75. https://doi.org/10.3390/land8050075
AMA Style
Eiter S, Fjellstad W, Puschmann O, Krøgli SO. Long-Term Monitoring of Protected Cultural Heritage Environments in Norway: Development of Methods and First-Time Application. Land. 2019; 8(5):75. https://doi.org/10.3390/land8050075
Chicago/Turabian StyleEiter, Sebastian, Wendy Fjellstad, Oskar Puschmann, and Svein Olav Krøgli. 2019. "Long-Term Monitoring of Protected Cultural Heritage Environments in Norway: Development of Methods and First-Time Application" Land 8, no. 5: 75. https://doi.org/10.3390/land8050075
Note that from the first issue of 2016, this journal uses article numbers instead of page numbers. See further details here.