Article

Soil Erosion and Deposition Rate Inside an Artificial Reservoir in Central Italy: Bathymetry versus RUSLE and Morphometry

by
Margherita Bufalini
1,
Marco Materazzi
1,*,
Chiara Martinello
2,
Edoardo Rotigliano
2,
Gilberto Pambianchi
1,
Michele Tromboni
3 and
Marco Paniccià
4
1
School of Sciences and Technology, Geology Division, University of Camerino, Via Gentile III da Varano, 7, 62032 Camerino, Italy
2
Department of Earth and Marine Sciences, University of Palermo, Via Archirafi, 22, 90123 Palermo, Italy
3
Consorzio di Bonifica delle Marche, Sede Legale Via Guidi, 39, 61121 Pesaro, Italy
4
School of Pharmacy, University of Camerino, Via Madonna delle Carceri, 9, 62032 Camerino, Italy
*
Author to whom correspondence should be addressed.
Land 2022, 11(11), 1924; https://doi.org/10.3390/land11111924
Submission received: 19 September 2022 / Revised: 18 October 2022 / Accepted: 20 October 2022 / Published: 28 October 2022

Abstract

:
This study, using different direct and indirect methodologies, evaluated the sedimentation rate in an artificial reservoir in central Italy. This reservoir is regionally representative and was built in the 1960s for hydroelectric purposes; it has experienced a strong decrease in trap efficiency and a loss of over 70% of the stored water volume. Direct measurements of the lake bottom bathymetry, carried out in 2006 and 2015, and 3D reconstructions performed in a GIS environment, made it possible to calculate the volume of filling material and to verify an increasing trend in the sedimentation rate since 2006. The sample reservoir denudation rate was compared with that obtained using the Revised Universal Soil Loss Equation method to calibrate the fundamental and critical factors of the method itself, and verify the contribution of a hydrological “direct” (through new channels or gullies) or “diffuse” (overland flow) connectivity. Furthermore, the comparison with the results obtained from past studies on ten other artificial regional reservoirs, performed with morphometric analysis, demonstrated a good relationship between soil erosion rate, stream frequency, and contributing area size. The study highlighted how a correct estimate of soil erosion and/or solid transport rates within a hydrographic basin is fundamental for the assessment of the trap efficiency of a reservoir, in a period in which the availability of water resources is becoming more and more vital.

1. Introduction

Reservoirs serve four purposes for people: (i) irrigation, industrial use of water, and drinking water; (ii) flood control; (iii) electricity and power production; and, (iv) leisure. Moreover, artificial reservoirs built along watercourses undoubtedly represent a strategic infrastructure system for nations, both for the management of the accumulated water resource and, increasingly, as a defense for the hydraulic safety of downstream areas [1]. Artificial reservoirs play an important role in organic carbon storage, with an accumulation rate often higher than that existing in natural environments or the oceans [2], and are thus considered helpful in checking climate change. Therefore, any loss of efficiency of these water supplies and regulation systems, linked to pollution or, more often, to the problem of progressive “trap efficiency” loss due to filling, can cause large damage to the economy or to the ecological status of the river itself [3,4,5,6,7,8,9]. Moreover, trap efficiency is challenging due to the need for a long-term dataset, which are not available in many parts of the world due to the lack of measurements and the fact that most of the reservoirs have been constructed recently.
The numbers of these losses are worrying; according to FAO (Food and Agriculture Organization of the United Nations, 2002 [10]) approximately 1% of the total water volume stored in major world reservoirs is lost annually due to sedimentation and this corresponds to approximately 60 km3 of water. Human activities carried out upstream of the reservoir are usually responsible for this sediment accumulation. The reservoir siltation is mainly related to the high, non-sustainable erosion rates that are measured in agricultural land [11,12,13,14,15] even though erosion processes, especially in the Mediterranean, are also attributed to forest fires that remove the vegetation cover and induce changes in the erodibility of soils [16,17]; the amount and accumulation rate, finally, depends on the hydro-geomorphological characteristics of the basin and the fluvial regime.
The sediment abundance in a stream, however, is a complex management problem and represents a strategic objective, even for the European Community. The European Water Framework Directive (WFD, Directive 2000/60/EC), although it does not deal specifically with sediments, clearly identifies a link between sediment monitoring in a river catchment and the achievement of the WFD objective (good status of all European water resources by 2015). Nevertheless, the implementation of the WFD shifts the scope from local sediment management (dredged material) to river basin scale sediment management; therefore, recently the European Sediment Network (SedNet) successfully raised attention about this issue by making it essential to integrate sustainable sediment management in WFD—River Basin Management Plans (2016).
The situation in Europe is one of the worst worldwide because European reservoirs are old, and reservoir siltation is a problem in the Mediterranean due to the high erosion rates [18,19,20]. In particular, Italy is ranked third in Europe for the number of artificial reservoirs (approx. 570) with a volume exceeding 1 million cubic meters, after Spain (approx. 1200) and the UK (approx. 580); the average infrastructure system age is over 50 y and the remaining life can be estimated to be a few tens of years, for which a significant reduction in the productivity is expected if adequate actions and works are not adopted [21,22].
Although the problem is extremely topical, few data are available, largely because of the costs related to bathymetric studies. Most of the data have, therefore, been obtained using indirect methodologies and assessments. The Revised Universal Soil Loss Equation (RUSLE) method [23,24,25] is certainly one of the most commonly used, due to both its versatility and, after more than 40 years since its first formulations, the high number of applications and study cases. The reliability of this method, however, particularly its correlation (where possible) with direct field measurements, is often uncertain, especially due to the difficulty in estimating some parameters that may significantly influence the final score. One of these is the parameter P, used to quantify the influence of human activities and works on soil erosion processes. Although some authors have proposed ranges of values based on morphological parameters (slope angle) or land use (type of crops) [1,25,26,27,28,29,30], these classifications are not uniquely applicable.
The present study is a novel attempt to analyze reservoir siltation in central Italy. Through the comparison between direct (bathymetric) and indirect measurements (RUSLE method), this investigation seeks to contribute to the evaluation of the soil quantities eroded from a sample watershed (the San Rocco watershed), which is primarily responsible for filling an artificial basin used for drinking water and electric power production.
Through geomorphological assessments and bathymetric data processing in a GIS environment, it was possible to calculate the denudation rate and its trend since 1963 (the year of reservoir construction). Moreover, by comparing the results obtained using the RUSLE method, calibration of the RUSLE parameters was attempted; among these, specific attention was paid to the parameter P, which is related to anthropogenic pressures and is fundamental to estimating soil erosion quantities. The denudation rate thus calculated was compared with data obtained, approximately 30 years ago, from 10 artificial basins located along the main rivers on the Adriatic side of central Italy. Given the strong heterogeneity of both the size and bedrock composition of the feeding basins, the correlation was attempted through the use of morphometric parameters such as the Denudation Index [31], the Relief Ratio [32], and the Stream Frequency [33], all expressed as a function of the source basin area.
The obtained results demonstrate that, in the absence of direct measures of the soil erosion rate, the combined use of indirect methods (RUSLE) and morphometric analyses of the feeder basins is certainly an excellent compromise, provided the availability of a significant number of data and a proper calibration of the methods adopted.

2. Materials and Methods
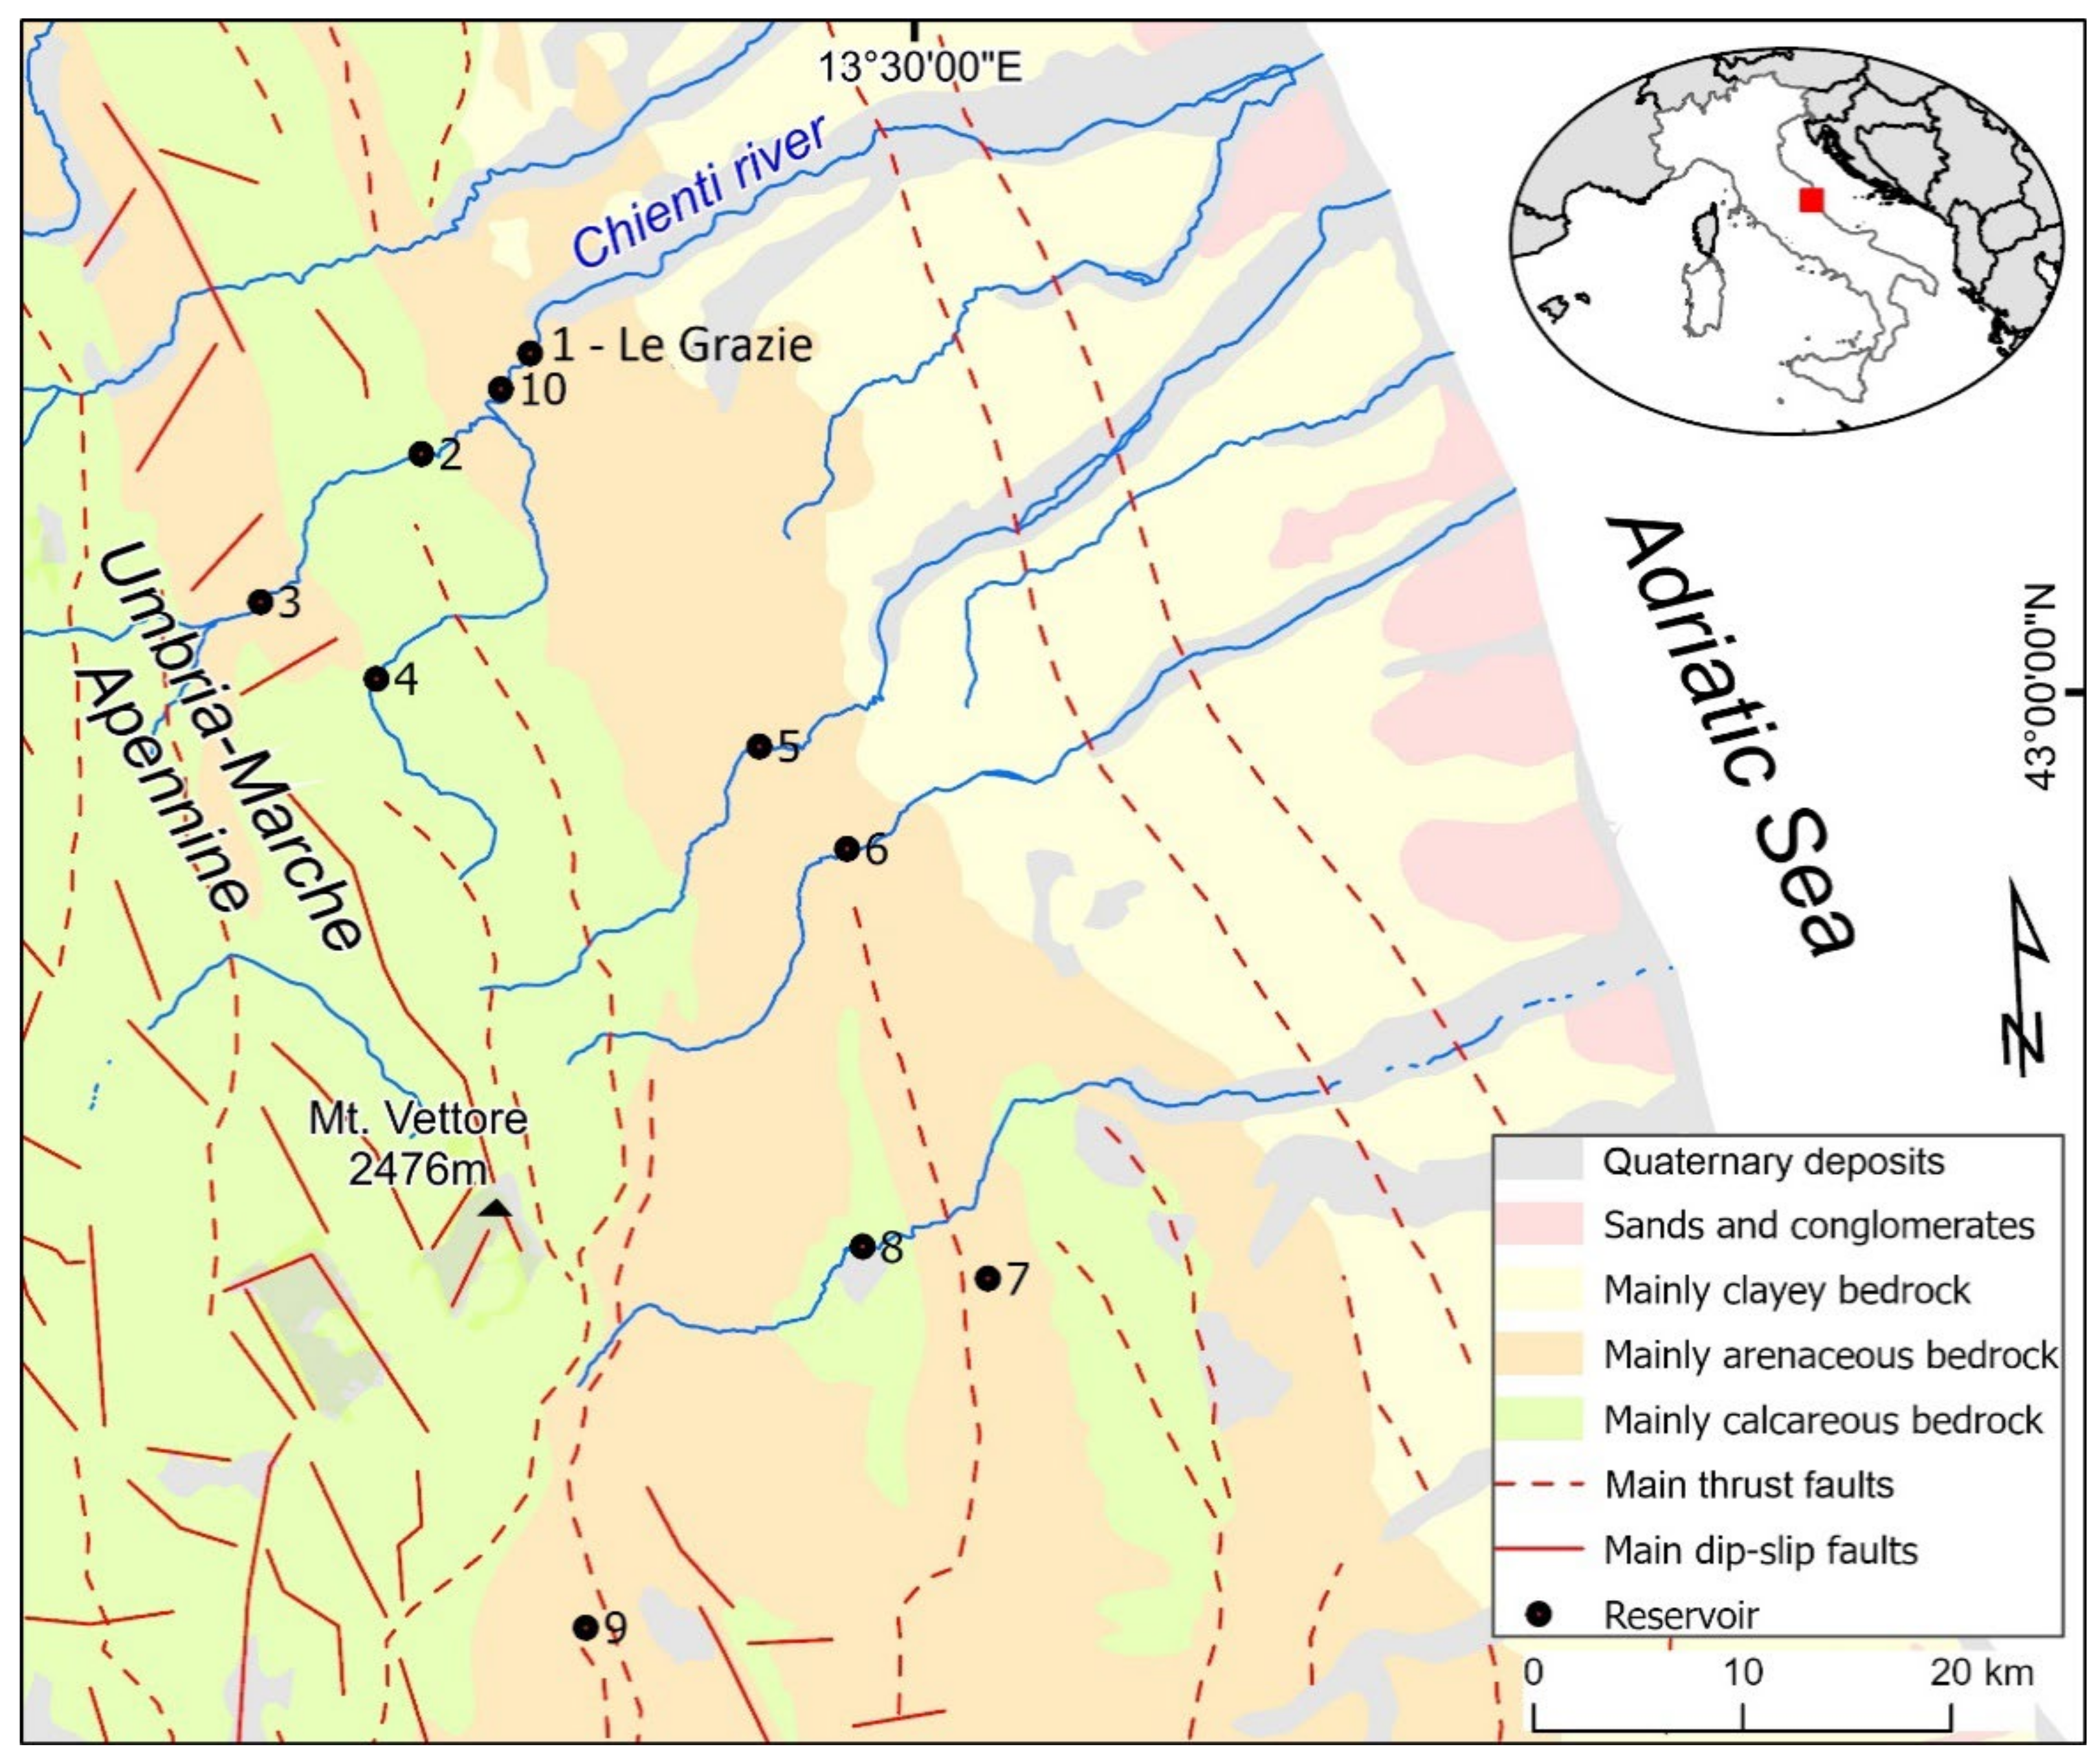
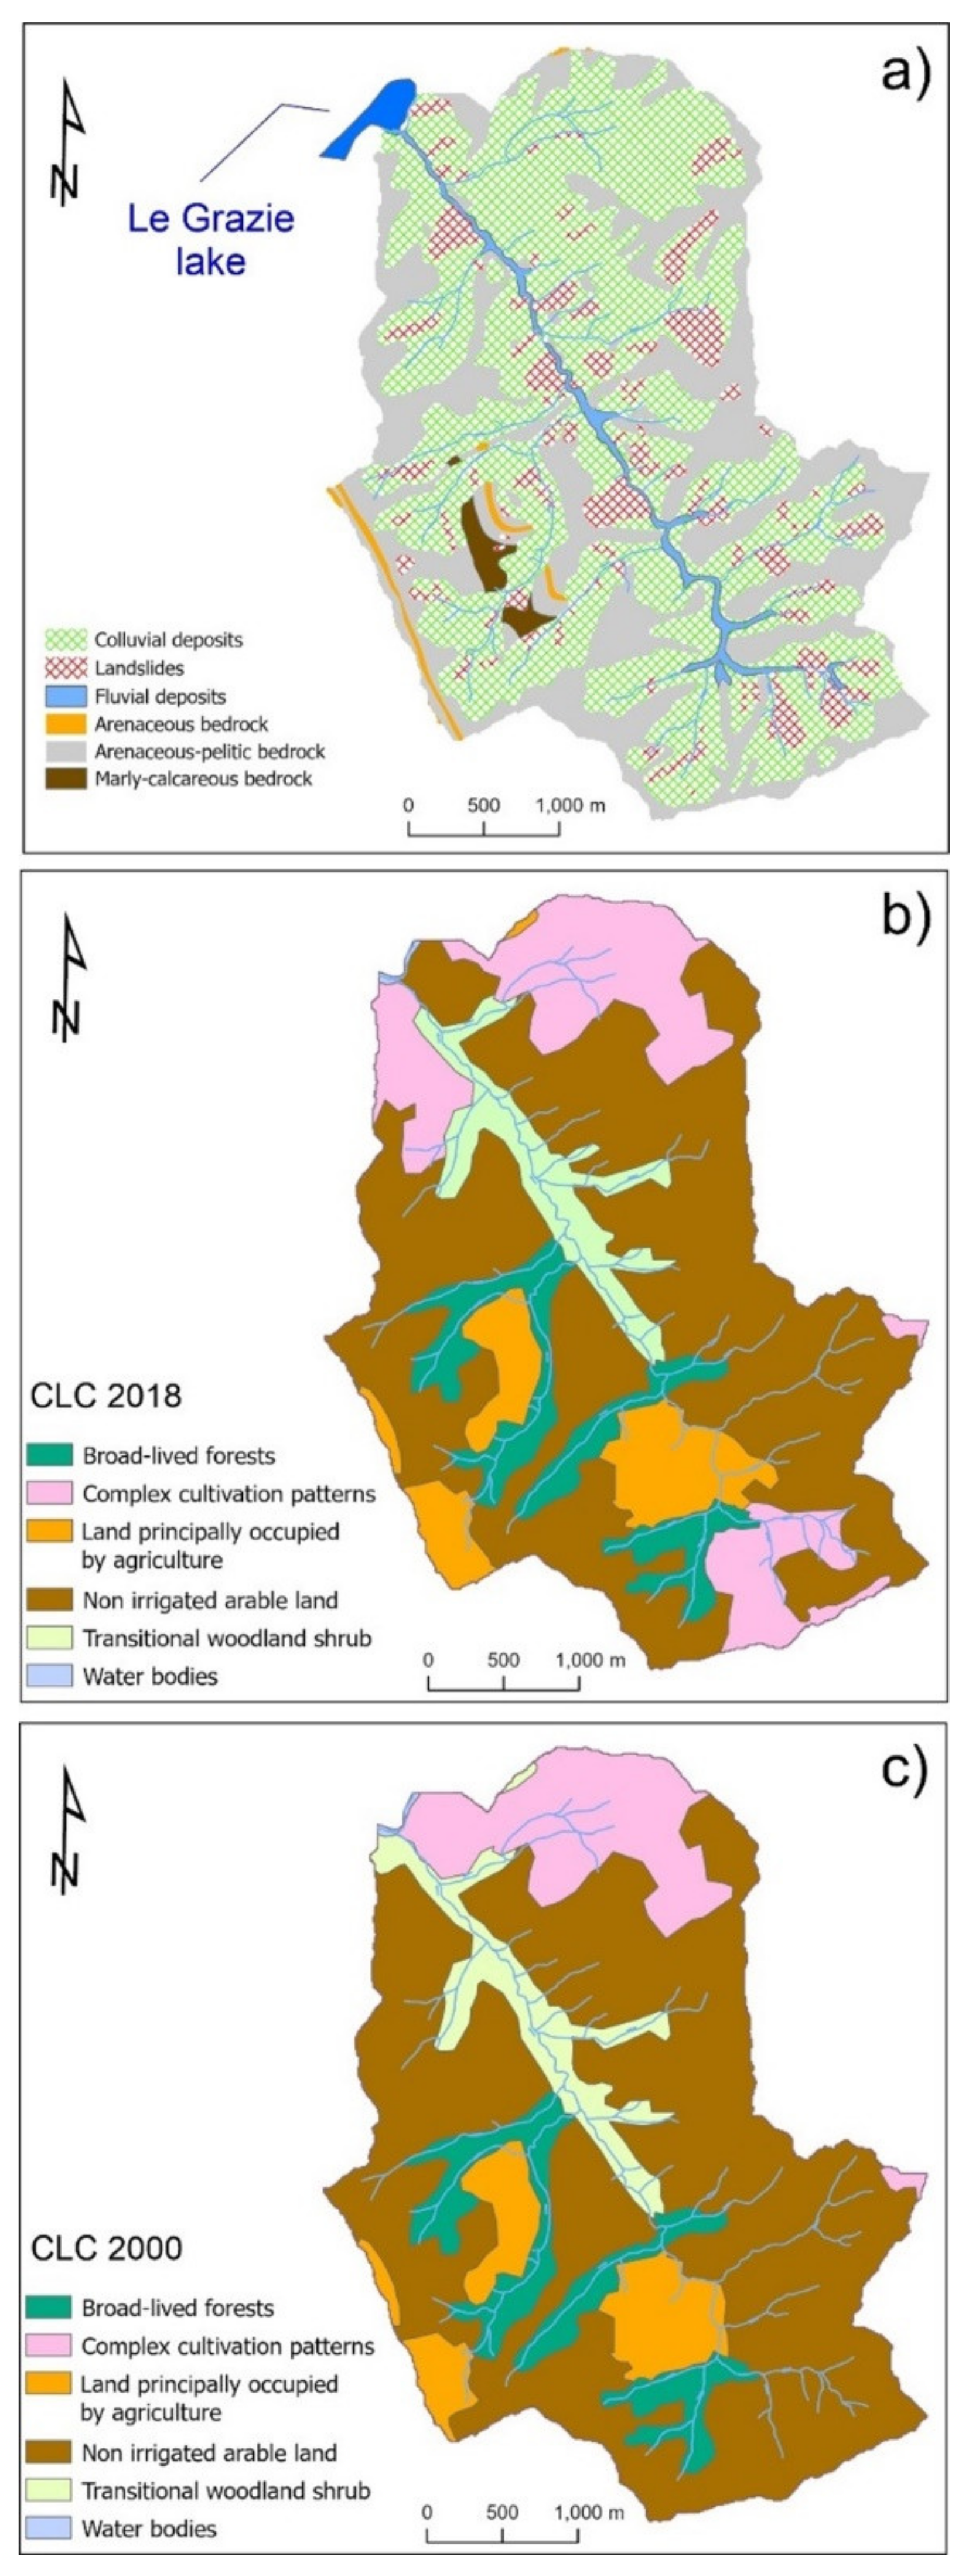
2.1. Study Area

The study area is located in the Marche Region, on the Adriatic side of central Italy (Figure 1). The landscape is mostly hilly, with typically small and narrow alluvial plains. The highest elevations (up to the 2476 m a.s.l. of Mount Vettore) are present along the Apennine Ridge to the west, while they progressively decrease eastwards towards the Adriatic Sea. All rivers follow the regional altitudinal gradient, flowing almost perpendicular to the coastline. No lakes are present, even though there are many artificial reservoirs of different sizes exploited for drinking water, electric power production, or both.
This portion of the Marche region is characterized by a typical Mediterranean climate defined as Adriatic-sublittoral [34]. During the year, the region experiences temperatures between 16–17 °C and 4–5 °C, with mean temperatures ranging between 12 and 15.5 °C; the highest values are recorded near the coast, while the lowest correspond to the highest peaks of the Apennine ridge [35]. Rapid spatial variations in temperature, however, are not rare and are caused by the orographic influence, which modifies the thermal conditions of the air masses that hit the region. Even precipitation follows a similar trend, ranging from 600–800 mm along the coast up to 1100–1700 mm in the mountain [36,37,38].
Geologically (Figure 1), the study area is characterized by the presence of mainly calcareous formations in the mountains, turbiditic deposits in the central part, and alternating clays, sands, and conglomerates near the coast [39,40].
The main geomorphological features are those connected with slope and fluvial processes: mass movements of different types, sizes, states of activity, and ages are very widespread along the slopes [41,42], while several orders of Quaternary fluvial deposits [43] characterize the valley floors.
Within this sector, the San Rocco Stream, a right tributary of the Chienti River, is located in the central Marche Region and flows roughly N–S into the Le Grazie Lake, one of five artificial reservoirs built within the Chienti River Basin (Figure 1 and Figure 2). The San Rocco watershed (around 13 km2) shows a typically hilly morphology, with gentle slopes and elevations ranging between 220 and 510 m a.s.l. The bedrock outcrops only locally, mostly in correspondence with the water divides and is made by alternating predominantly arenaceous-pelitic and pelitic-arenaceous levels. Quaternary deposits are mostly constituted of medium-fine colluvial deposits; however, gravitational phenomena (shallow and of medium depth) are also numerous, both active and dormant, consisting of rotational slides, flows, and solifluctions [44] (Figure 2a).
Land use is predominantly agricultural. According to the CORINE Land Cover (2018) dataset, approximately 62.3% of the basin consists of non-irrigated arable land, while complex cultivation patterns alternating with significant areas of natural vegetation represent approximately 21.5% of the basin; the remaining part of the watershed is composed of broad-leaved forests and transitional woodland shrubs, which are only visible along the main incisions (Figure 2b). This crop setting has remained almost unchanged for at least the past twenty years; in Figure 2c, according to the CORINE Land Cover of the year 2000, it is possible to note that only small areas of the basin have changed land use from “non irrigated arable land” to “complex cultivation patterns”.
Specific soil characteristics have been extrapolated from the soil map of the Marche Region at a 1:250,000 scale and according to the World Reference Base for Soil Resources (WRB; IUSS Working Group, Rome, Italy, 2015). The study basin is almost totally characterized by the presence of Calcaric Cambisols, which are very common in temperate and boreal regions: this category is represented by brownish, well-drained soils, with fine to medium textures and the presence of a cambic horizon (Bw), below the organic-mineral one.

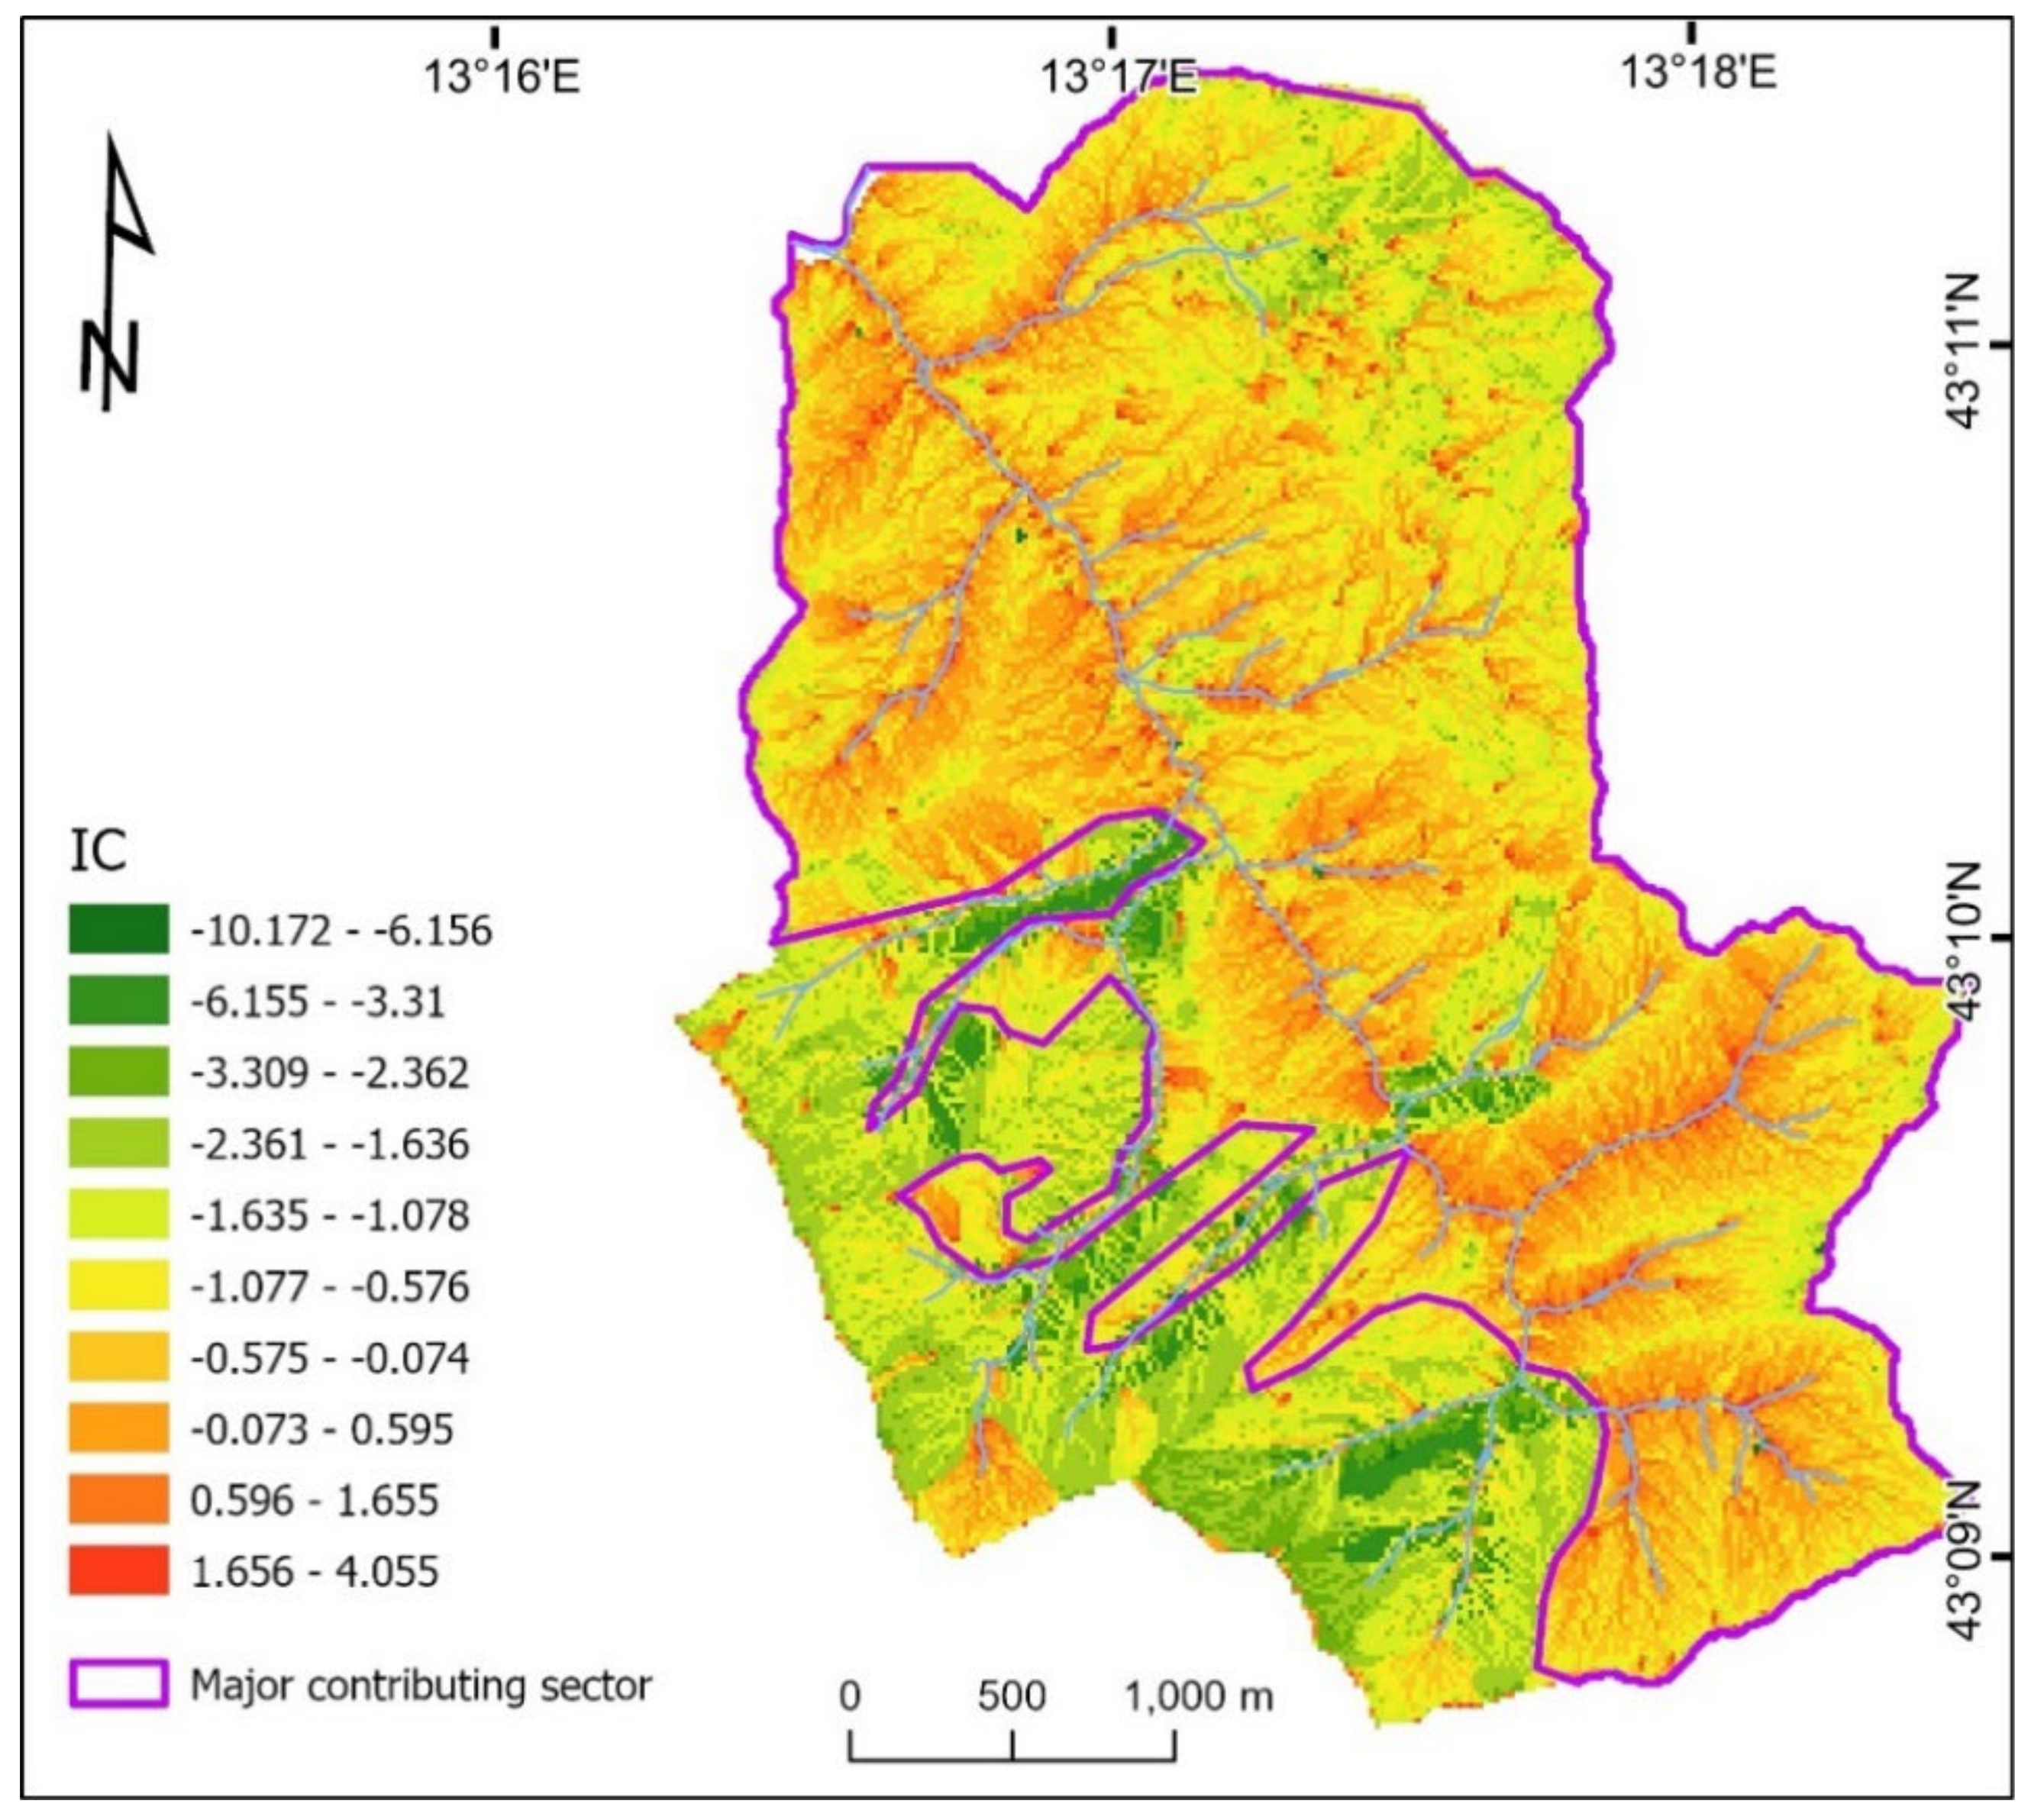
2.2. Sediment Connectivity

Sediment (or flow) connectivity is a term used to describe the internal linkages between runoff and sediment sources in the upper parts of catchments and the corresponding sinks. The following [45] two types of connectivity can be distinguished: direct connectivity via small channels or gullies, and diffuse connectivity via overland flow pathways towards the stream network; in general, however, if a system is characterized by a high degree of connectivity, it is also characterized by high mass transfer capacity [46,47,48,49].
In this study, sediment connectivity was used in combination with RUSLE to verify the correspondence between areas at the greatest risk of erosion (calculated by RUSLE) and areas of origin and sediment transfer (high connectivity). Specifically, we evaluated a Connectivity Index (IC) following the GIS-based approach proposed by [47]; starting from a DTM (LIDAR) with 1 × 1 m resolution, we choose a weighting factor W (which represents the impedance to runoff and sediment fluxes), based on the C factor of USLE-RUSLE models ([24,25], as described in Section 2.4) in turn derived from the Third Level of the Corine Land Cover 2018. The C factor represents the crop/vegetation factor used to determine the relative effectiveness of crop management systems in terms of soil loss.
The formula used to calculate IC was:
I C   =   log 10 W × S × A i d i W i S i
with:
W = average weighing factor of the upslope contributing area (dimensionless)
S = average slope gradient of the upslope contributing area (m/m)
A = upslope contributing area (m2)
di = length of the ith cell along the downslope path (in m)
Wi = weight of the ith cell (dimensionless)
Si = slope gradient of the ith cell (m/m)
The GIS procedure, performed using ESRI ArcGIS Pro 2.9.2, reflects, as mentioned previously, that described by [47] to produce a set of intermediary raster maps:
Slope map without null value (zeros are replaced with 0.005);
Flow direction map;
Flow accumulation map;
Weight map represented by the raster map of the C parameter (from RUSLE);
Flow length map.
The IC map is finally evaluated using the general formula.

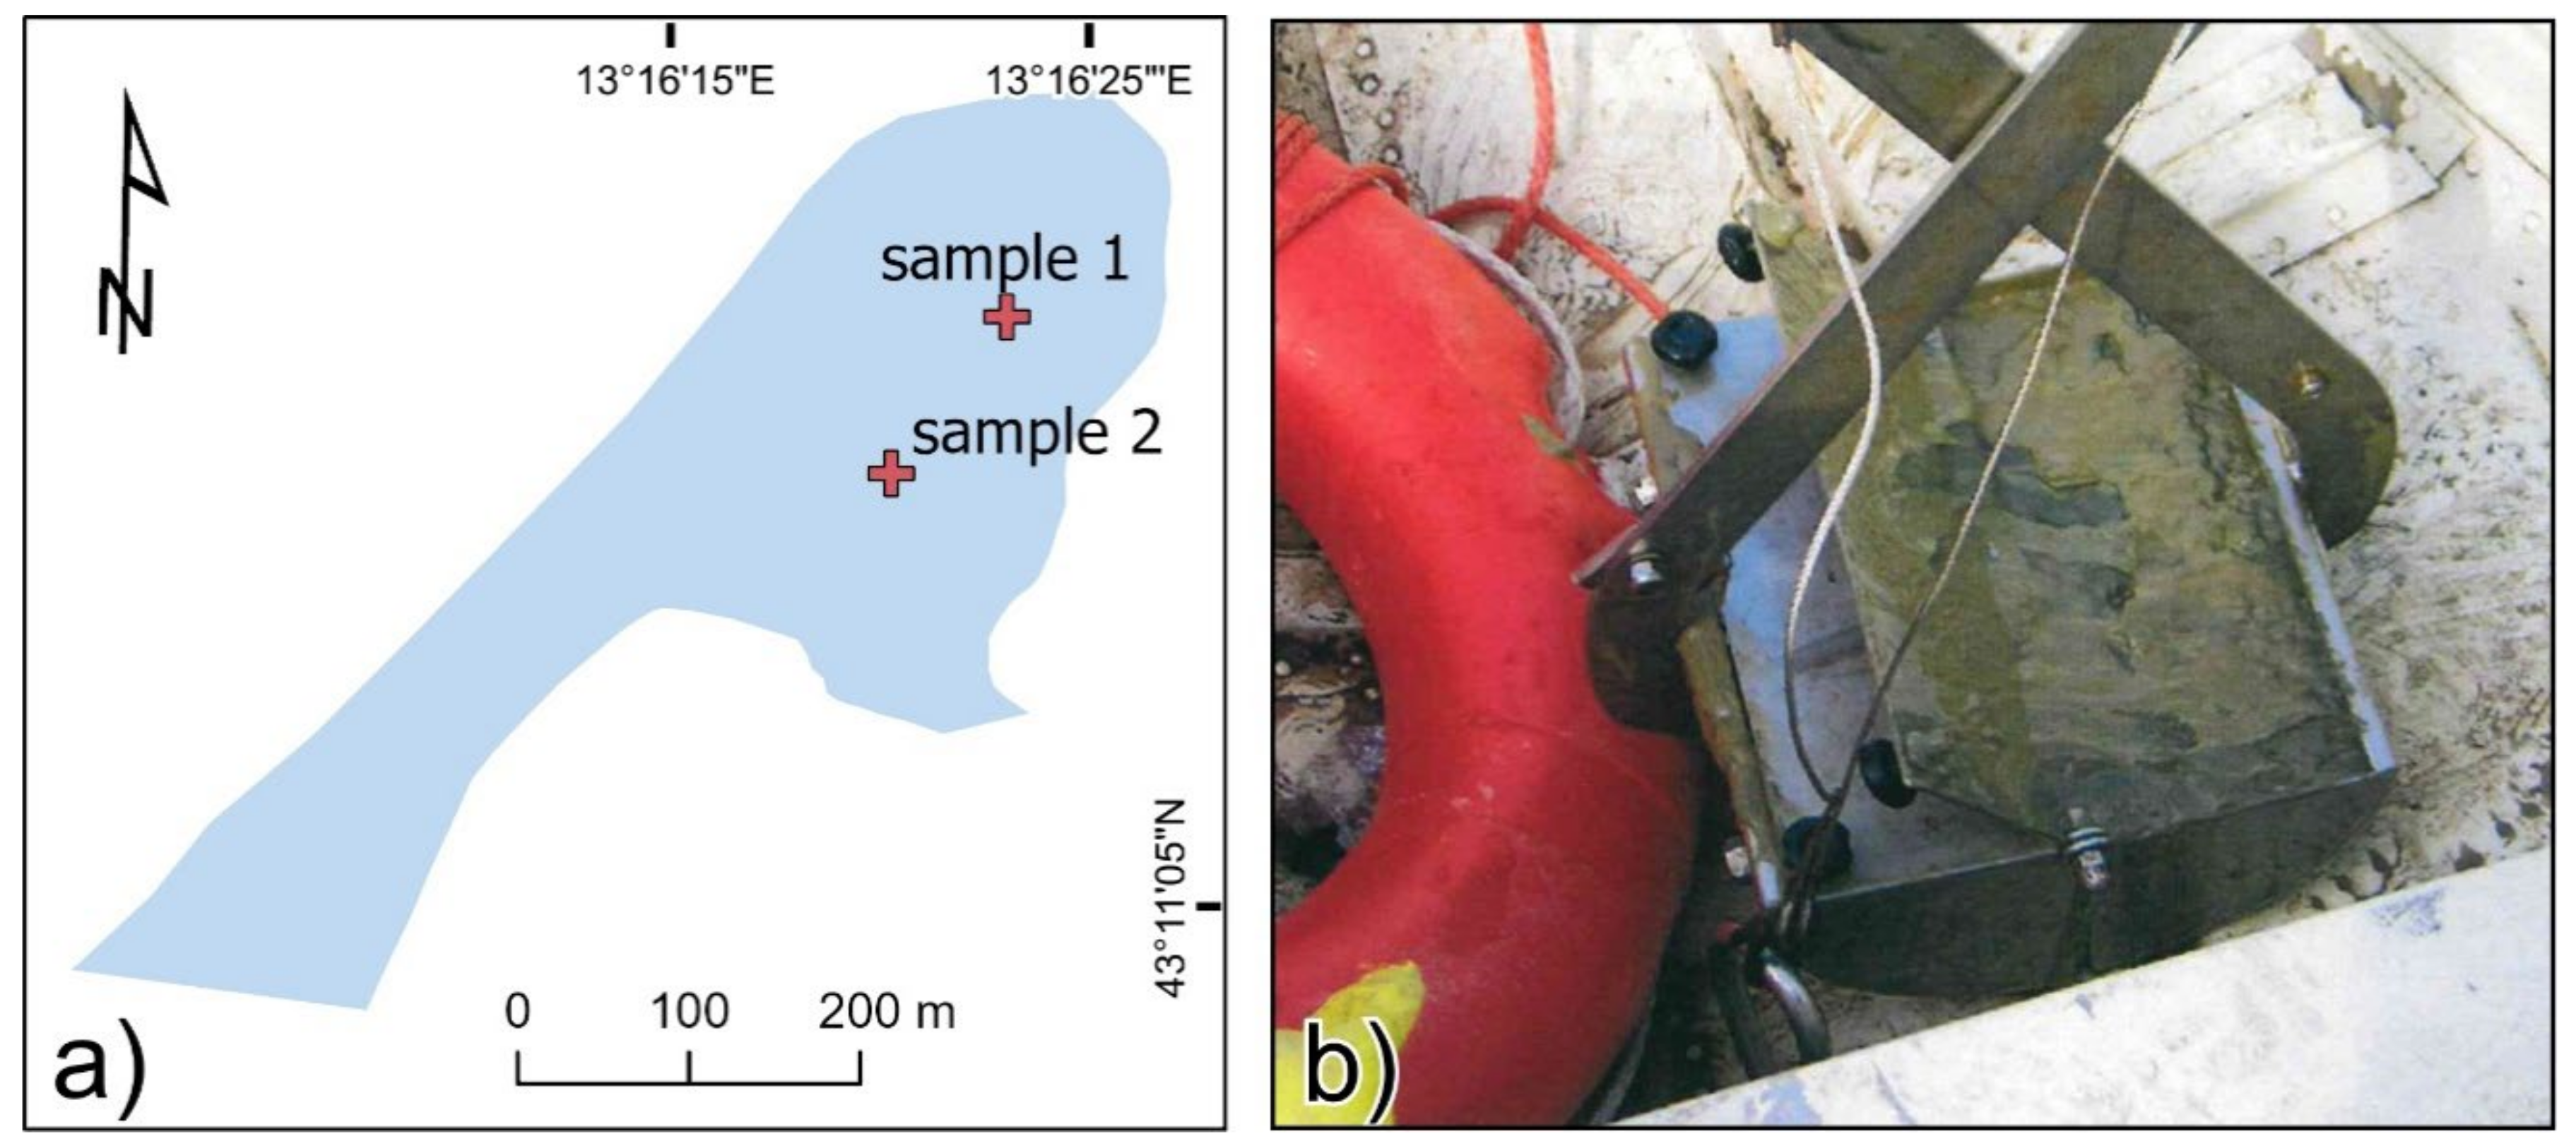
2.3. Bathymetric Surveys and Sediment Characteristics

Bathymetric surveys are useful for estimating reservoir volumes of water (and sediments) and corresponding surface areas at a particular elevation [13]. Three sets of reservoir topographic maps were used for this study: one referred to the period of realization of Le Grazie Lake, which shows the lake condition immediately after the dam construction in 1963, and the others based on data collected during the 2006 and 2015 bathymetric surveys, performed using a multibeam “Reson” echo sounder (240 kHz) [50,51].
The data collected were initially processed in a GIS environment using ESRI ArcGIS Pro 2.9.2 to reconstruct the isobathic lines of the lake bottom and then the digital terrain models (DTM) corresponding to the three analyzed periods. In a second phase, through the ArcGIS-3D Analyst extension, math analyses were performed to calculate the variations in stored water volume and, consequently, in the sediment volumes deposited inside the basin. It must be emphasized that the analysis does not consider the sediment quantities drained from the dam during periodic management activities. Further data on the volume of sediments present within the Le Grazie lake were then obtained from a study carried out by [52] for an initial assessment of the loss of productivity of the hydroelectric plants connected with 10 reservoirs in the Marche region.
The characteristics of sediments stored inside the reservoir (Atterberg limits, textures, soil density, etc.) were derived from laboratory analyses performed on two samples of material taken from the bottom of the lake (Figure 3).

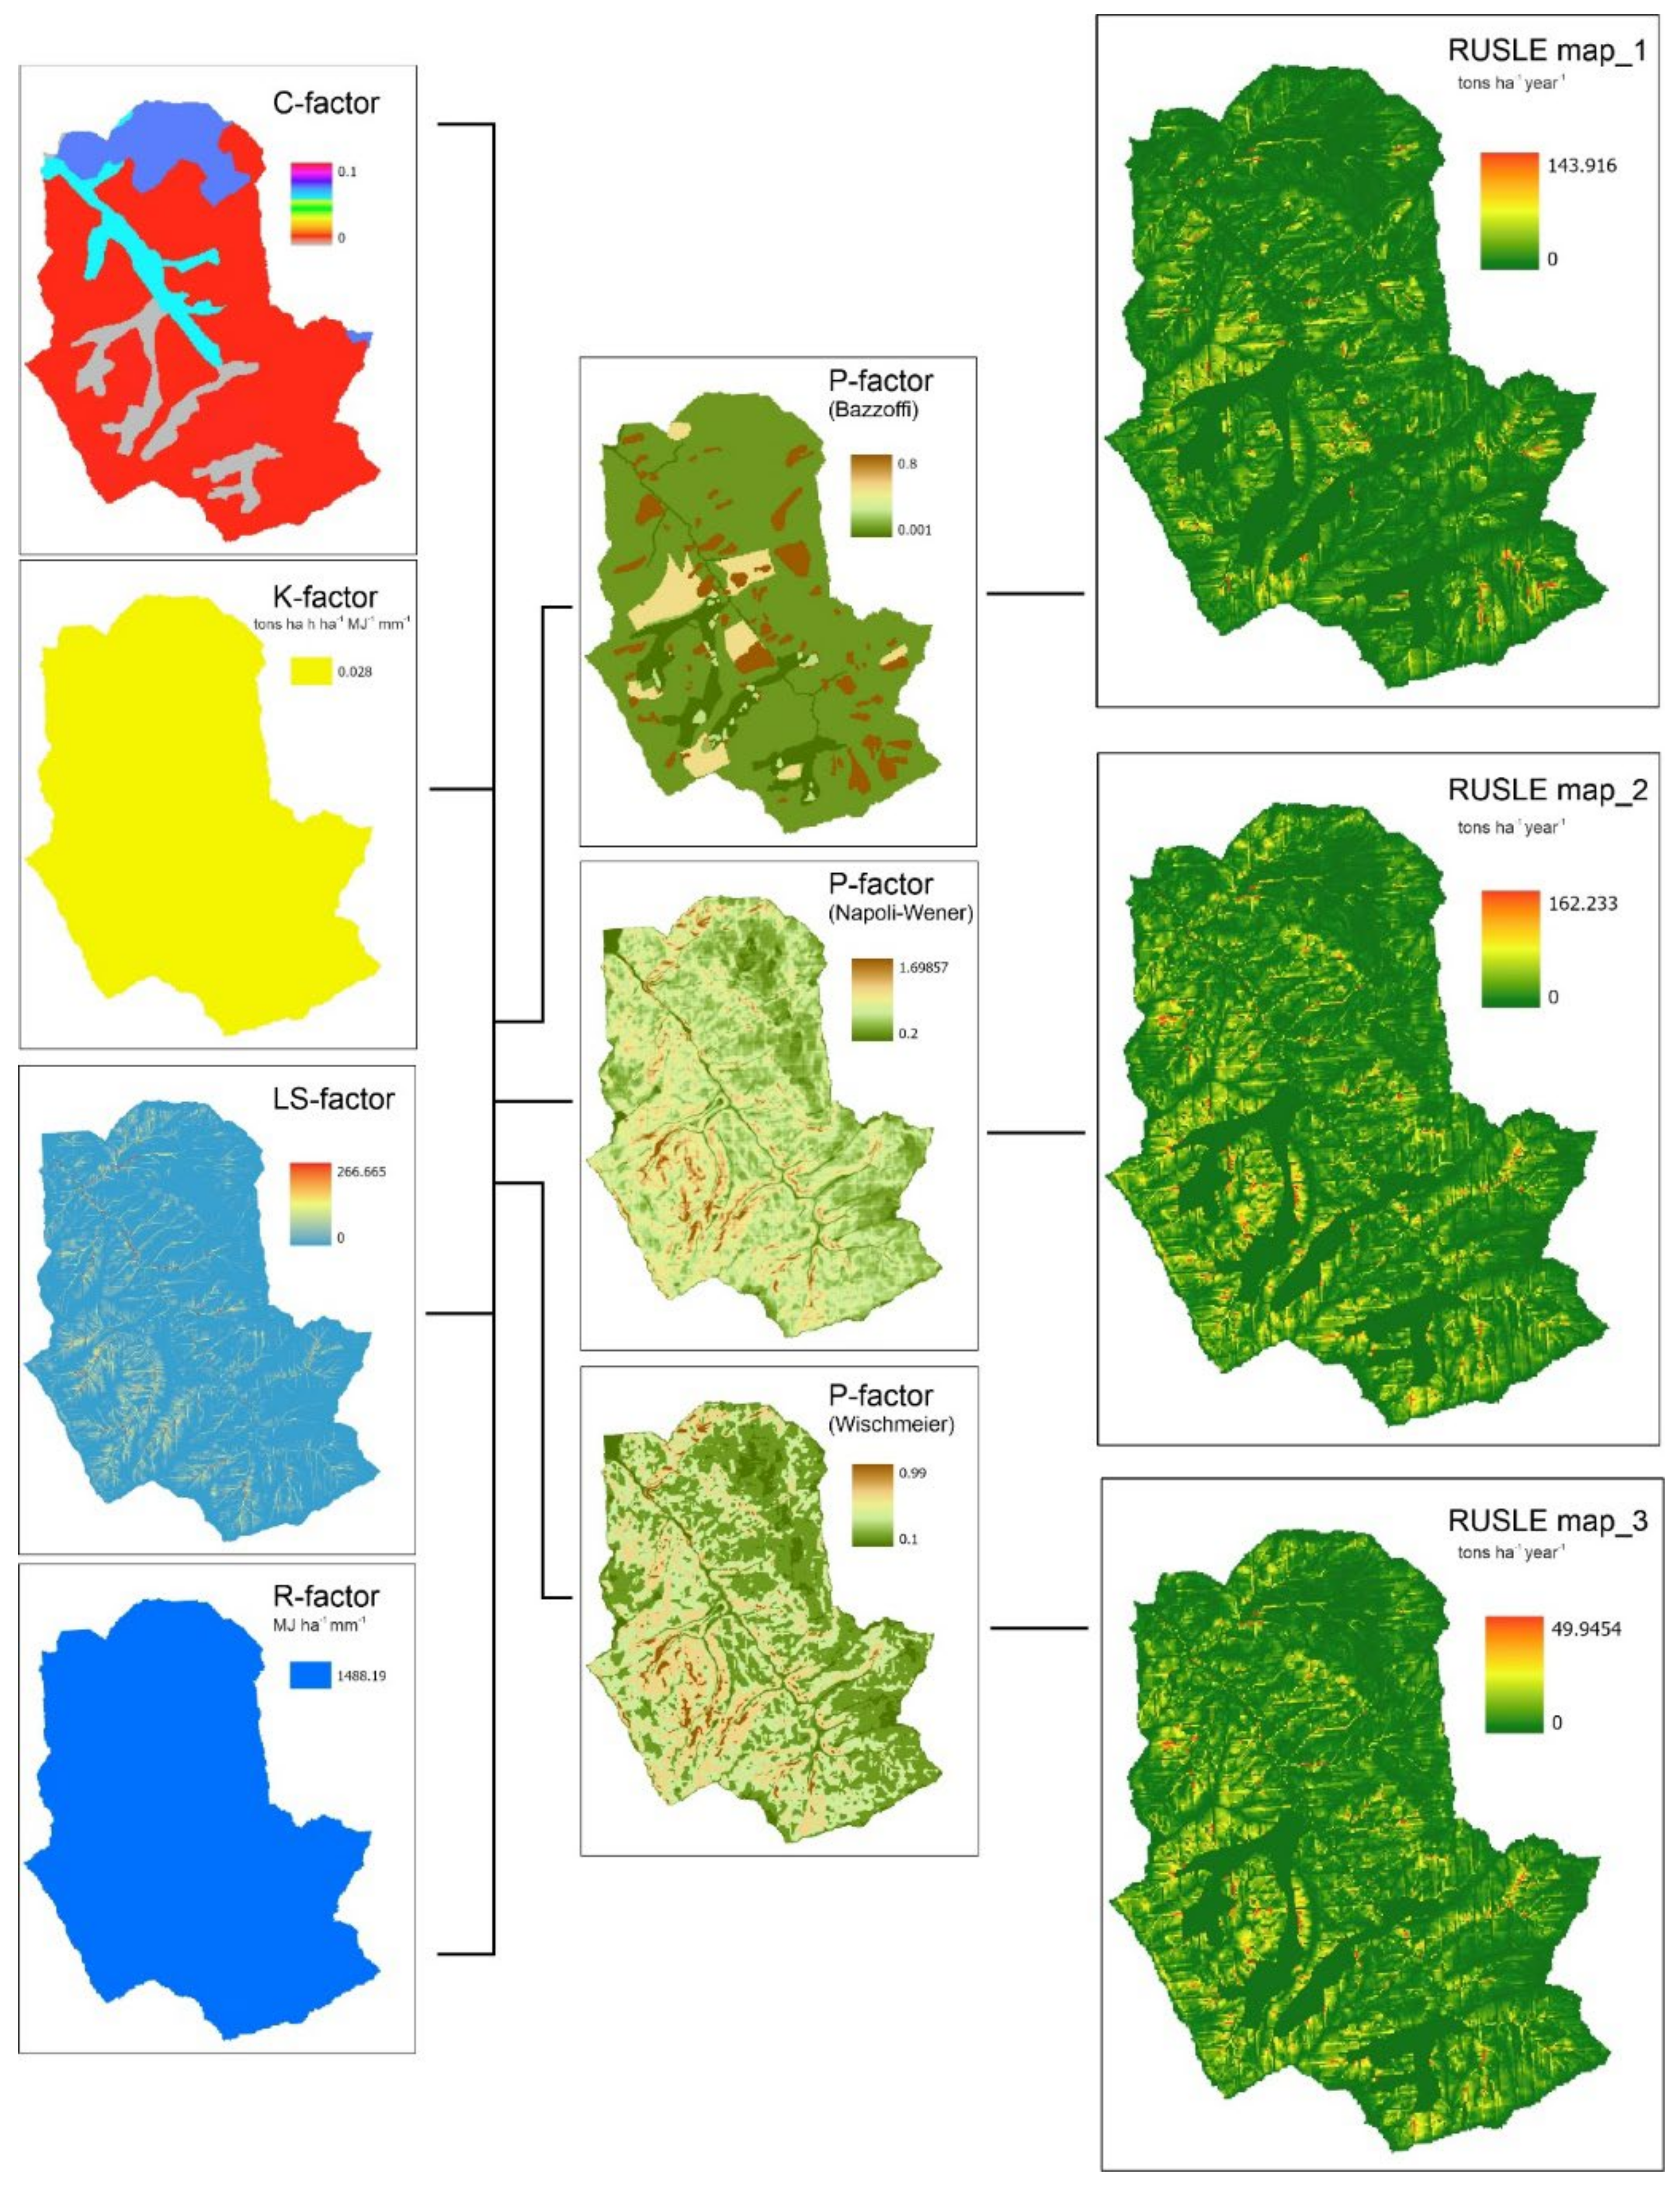
2.4. Revised Universal Soil Loss Equation (RUSLE)

RUSLE [24] is an empirically based model founded on the Universal Soil Loss Equation (USLE) [25], and consists of mathematical equations that estimate average annual soil loss and sediment yield resulting from inter-rill and rill erosion.
Coupling RUSLE and GIS analysis, which allows the processing of considerable quantities of spatial data, has been shown to often be an effective approach for estimating river basin soil loss [13]. Five major factors (rainfall pattern, soil type, topography, crop system, and management practices) are used in RUSLE for computing the expected average annual erosion through the following equation [23,24]:
A   =   R * K * L S * C * P
where A is the computed spatial average soil loss and temporal average soil loss per unit area (tons ha−1 year−1), K the soil erodibility factor (tons ha h ha−1 MJ−1 mm−1), R the rainfall–runoff erosivity factor (MJ ha−1 mm−1), L the slope length factor, S the slope steepness factor, P the conservation support practice factor, and C the cover management factor; L, S, C, and P are all dimensionless.
The Erosivity factor R, also called the “Index of aggressiveness of the rain”, expresses the climatic influence in the erosion phenomenon through the combined effect of the raindrop impact and the runoff phase, both sheetflow and rills. For its evaluation, it is possible to follow different procedures based on the analysis of heavy rainfall recorded in a substantial number of years. In this work, the R value was computed using the Arnoldus equation:
R   =   ( 4.17 * F ) 152 * 17.02
where F is Fournier Index, which is defined as:
F   =   J   =   1 12 P J 2 P
where P J 2 is the average monthly rainfall for the J t h month and P is the mean annual rainfall in millimeters. For the study area, a 64-year (1951–2015) data inventory from the rain gauge of Tolentino located in the neighboring Le Grazie reservoir was used.
The K factor is an empirical measure of soil erodibility as affected by intrinsic soil properties [27,53]. The main properties affecting K are soil texture, organic matter, structure, and permeability of the soil profile. The first three characteristics were estimated through laboratory analyses performed on soil samples collected from the neighboring watershed while qualitative analyses were used for the evaluation of the permeability.
The K value based on basic soil property variables can be expressed in mathematical terms [25,54] as follows:
K   =   2.1 * 10 4 12 S O M * M 1.14 + 3.25 * S t 2 + 2.5 * P 3 / 100
where M = silt (%) + very fine sand (%) * (100-clay (%)), S t and P are the soil structure and permeability class, respectively, and SOM is soil organic matter content (%).
The effect of topography on soil erosion in RUSLE was evaluated using the LS factor, which combines the effects of a hillslope-length factor L, and a hillslope-gradient factor S. It is important to notice that when hillslope length and/or hillslope gradient increase, soil loss increases.
In this study, LS was calculated using the Unit Stream Power Erosion and Deposition (USPED) method, and a product between raster maps in a GIS environment (ESRI ArcGIS Pro 2.9.2,).
The L factor for point 𝑖 on a slope was calculated as follows:
L   =   m + 1 λ A 22.1 m
where L is the slope-length factor at some point on the landscape, λA is the area of upland flow, 22.1 is the unit plot length, and m is a value depending on the soil’s susceptibility to erosion.
The calculation of S is shown in the following Equation:
S   =   sin 0.01745 * θ d e g 0.09 n
where θ is the slope in degrees, 0.09 is the slope gradient constant, and n is an adjustable value depending on the soil’s susceptibility to erosion. Designations for exponents m and n can be found in the literature [24,55,56,57]. In this project, m = 0.4 and n = 1.4 were used.
The vegetation cover and management factor C represents the effect of cropping and management practices in agricultural management, and the effect of the ground, tree, and grass cover on reducing soil loss in non-agricultural situations. An increase in vegetation cover decreases soil loss. According to [23,58,59], vegetation cover, slope steepness, and length factors are most sensitive to soil loss; therefore, detailed knowledge of land use and typology of soil should be first considered. The C factor was evaluated starting from the 3rd level of the CORINE Land Cover inventory (CORINE, 2018), which classifies the land use for all the European countries according to the experimental values from [60].
The P factor quantifies the effects of the conservation practices and, in particular, considers the ratio of soil loss by a support practice to that of straight-row farming up and down the slope. The correct evaluation of the P factor represents a crucial point of the whole RUSLE method. Since this parameter ranges between 0 and 1, it appears evident that its relative weight within the formula may determine even considerable differences in the final result. Despite this limitation, few studies have focused on this aspect, often leaving the P factor evaluation only to the experience and sensitivity of the authors (and not to a real objective calculation); in many cases, the value is taken conventionally as 1.
In this study, three methods for P factor estimation are considered:
In the first procedure (“Napoli-Wener” method), as reported by several authors [1,26,27,28], the P Factor is calculated as follows:
P   =   0.2 + 0.03 θ
where θ is the slope in degrees.
In the second procedure (“Wischmeier method”), P is calculated based on the slope as a percentage [25] as shown in Table 1:
Finally, (“Bazzoffi method”) P is calculated based on the “Corine Land Cover–CLC” land use map [29,30] (Table 2).

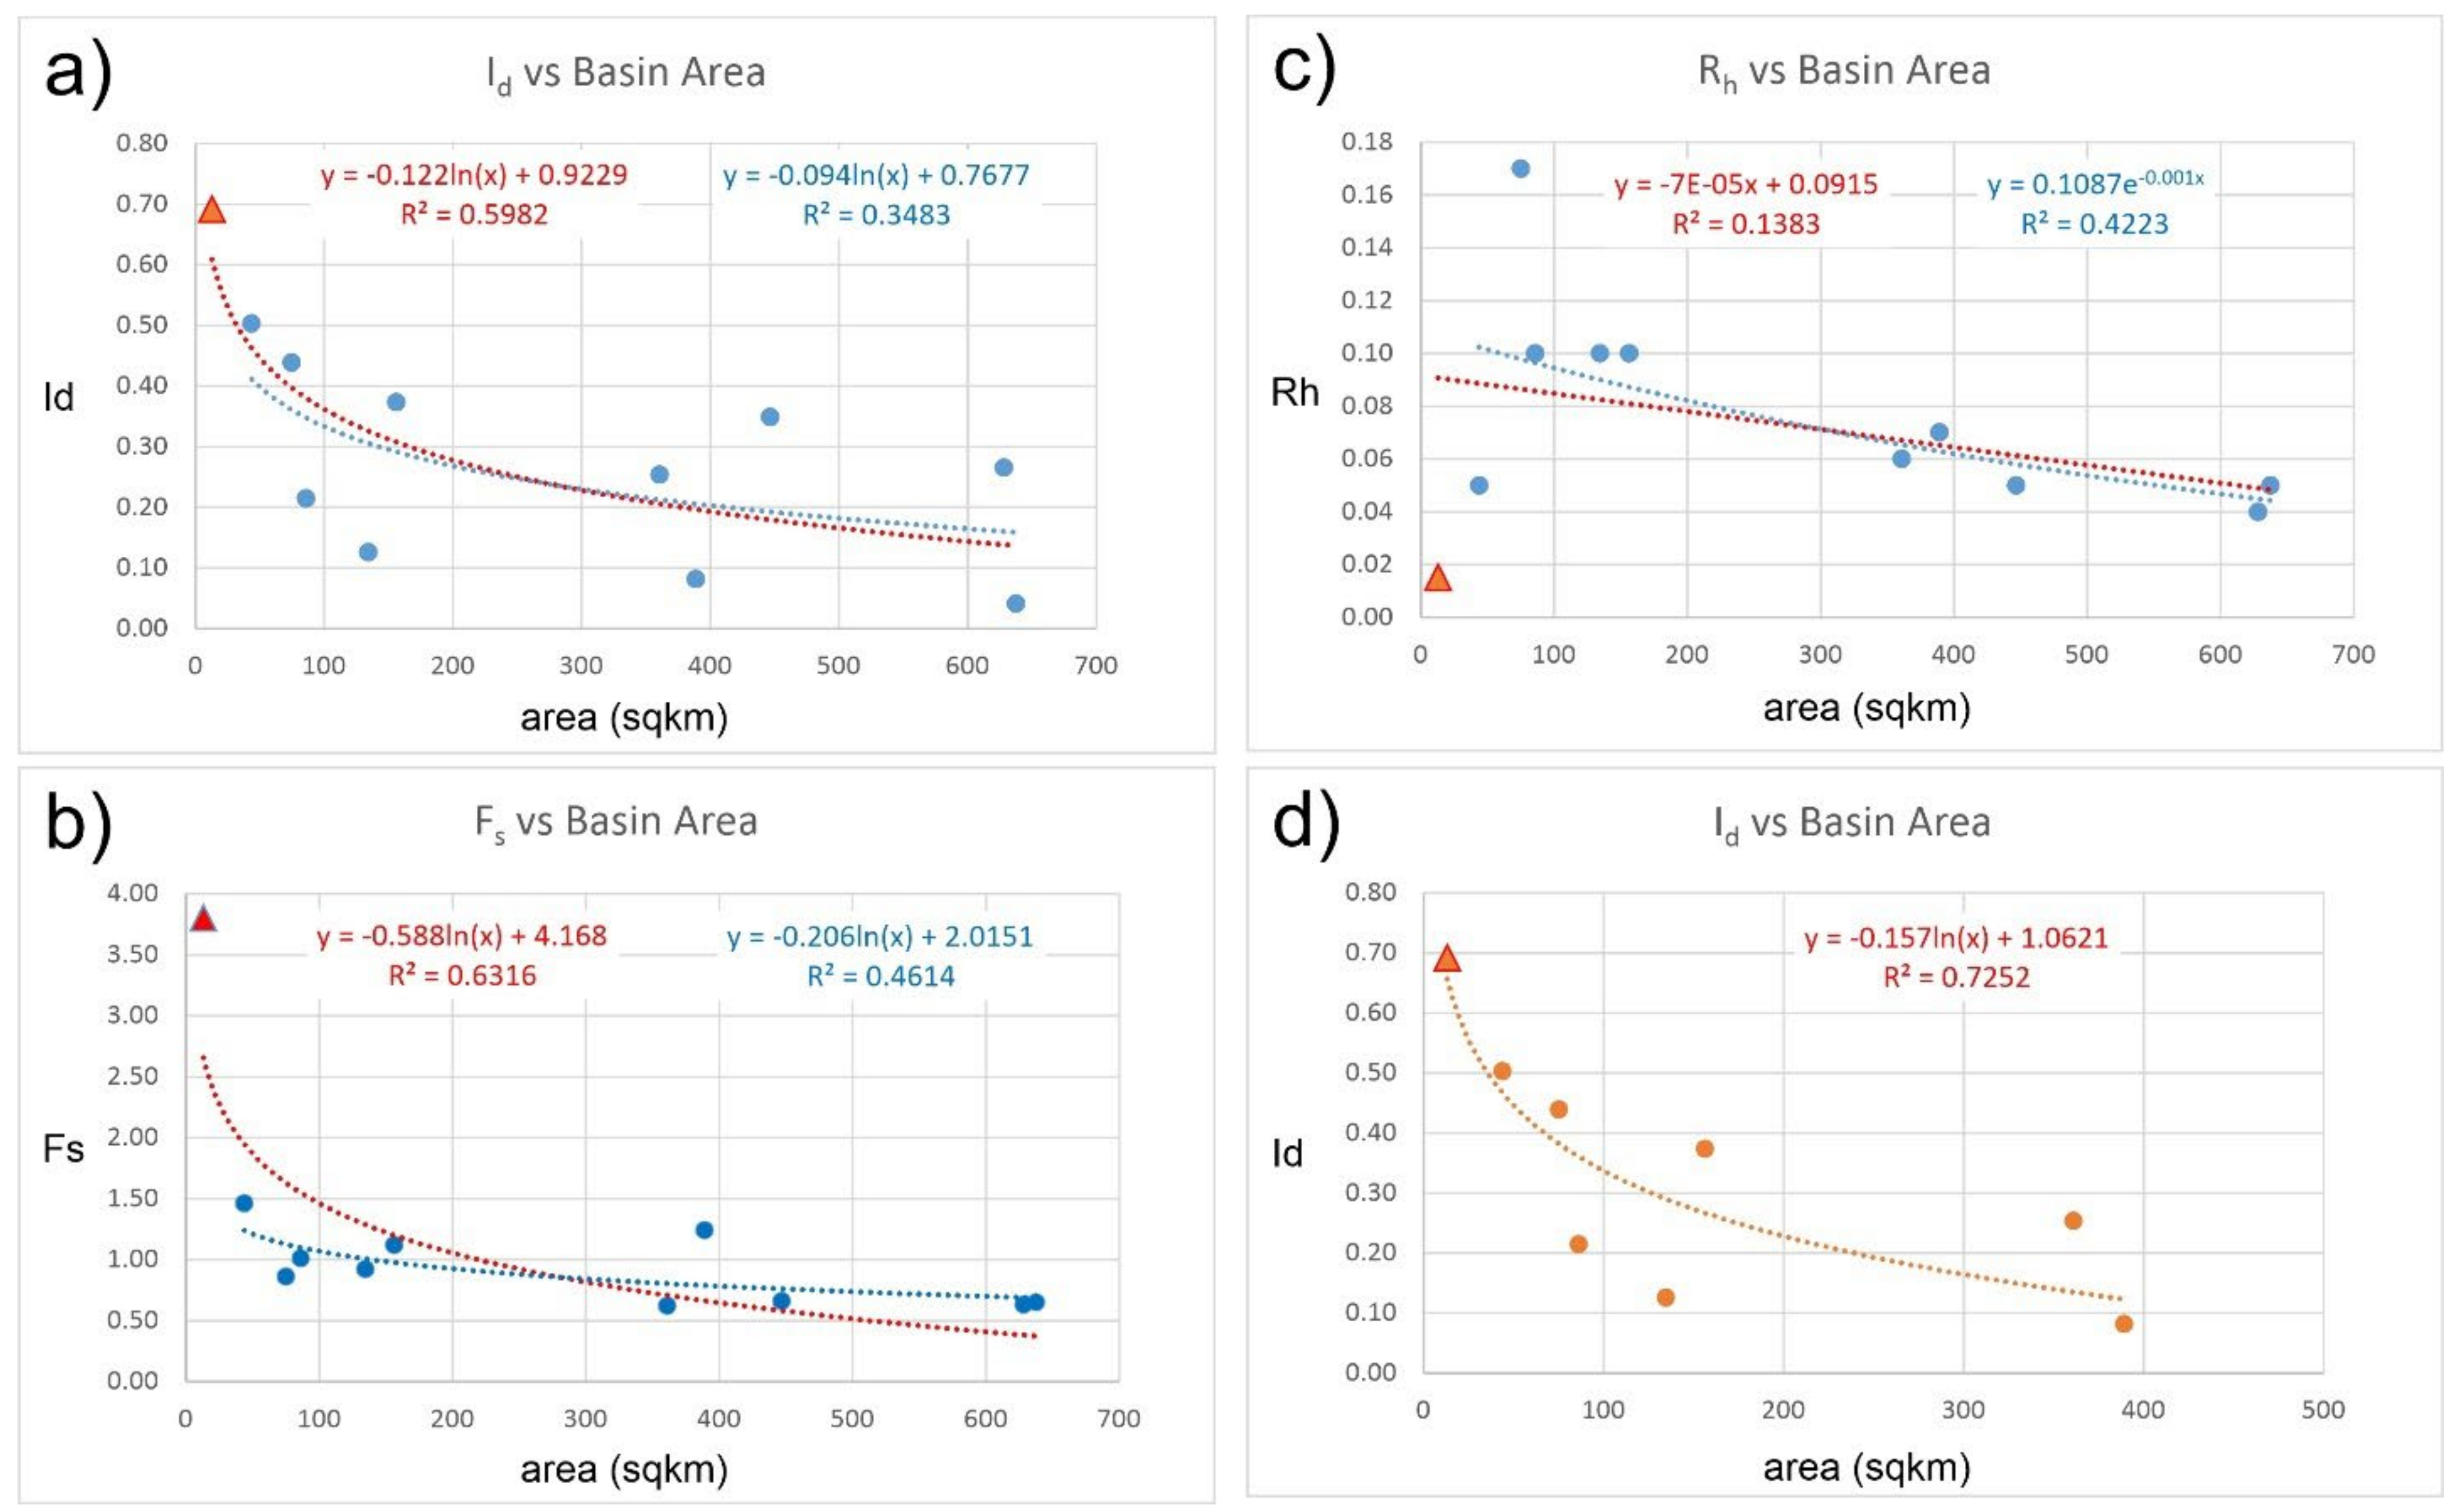
2.5. Morphometric Analysis

Together with the assessments described above, morphometric analysis was performed on the San Rocco and 10 other river basins that feed artificial reservoirs in the study area and which have shown similar trap efficiency loss in recent years (Figure 1). The main purpose was to verify if some morphometric parameters, mainly the expression of the erosion rate, slope, and degree of river basin hierarchization, were dependent on the basin area itself. Data used for the analysis were partly extrapolated from previous studies conducted in the early 1980s when it was possible to make a first direct measure of the filling rate inside some artificial reservoirs from the date of their operation [52,61]. However, the values obtained were underestimated, as the reservoir management agencies have implemented systematic, albeit not frequent or completely effective, sediment removal procedures over time.
Three morphometric parameters were considered, calculated from the Italian official topographic map at a 1:25,000 scale:
The Stream Frequency (Fs) [33]:
F s   =   μ A
where μ is the total number of river segments of each hierarchical order and A is the area (km2) of the contributing basin;
The Relief Ratio (Rh) [32]:
R h   =   Δ h L
where ∆h is the difference in height between max and min elevation of the basin and L is the length of the main reach (dimensionless); and
The Mean Annual Denudation Index (Id) [31]:
I d   =   V A
usually expressed in millimeters, where V is the mean annual volume of trapped sediment and A is the basin area. Subsequently, the existence of a possible correlation with the area of the contributing basin was verified for each morphometric parameter.

3. Results

3.1. Connectivity Analysis

As described in Section 2.2, the evaluation of the Connectivity Index (IC) was carried out starting from the DTM (LIDAR) at 1 × 1 m resolution and using the C factor of the RUSLE as a weighting factor; the latter was obtained using the values derived from the Soil and Landscape Map of the Marche Region [60] and by reclassifying the soil classes of the third level of the Corine Land Cover 2018 (Table 3 and Figure 4).
The result of the procedure, shown in Figure 5, demonstrates how the IC ranges from a minimum of −10 to a maximum of 4; the highest values are concentrated along the main reaches except for some segments located in the southwestern portion of the basin where areas characterized by broad-leaved forests and permanent crops predominate and the Connectivity Index falls generally under the value of 0. It should be remembered, however, that the IC does not express an absolute value but only provides a differentiation on a qualitative basis of the mass transfer efficiency of a stream network.

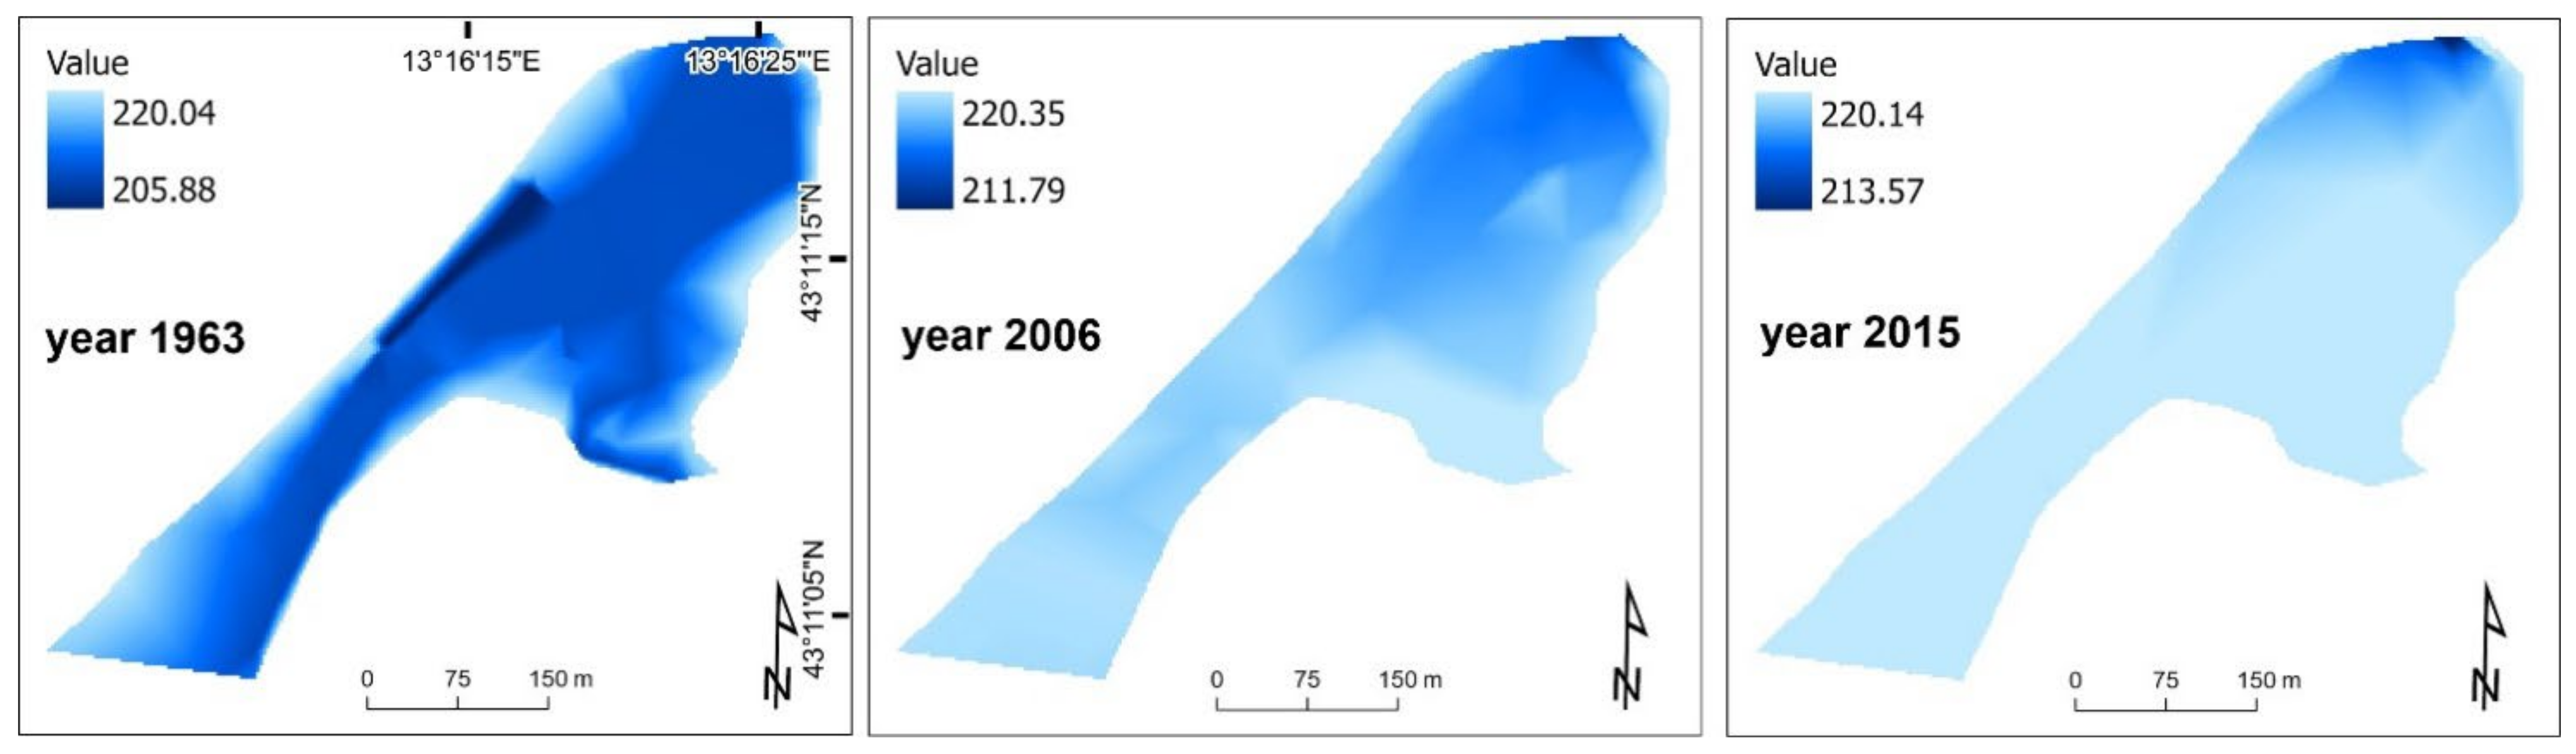
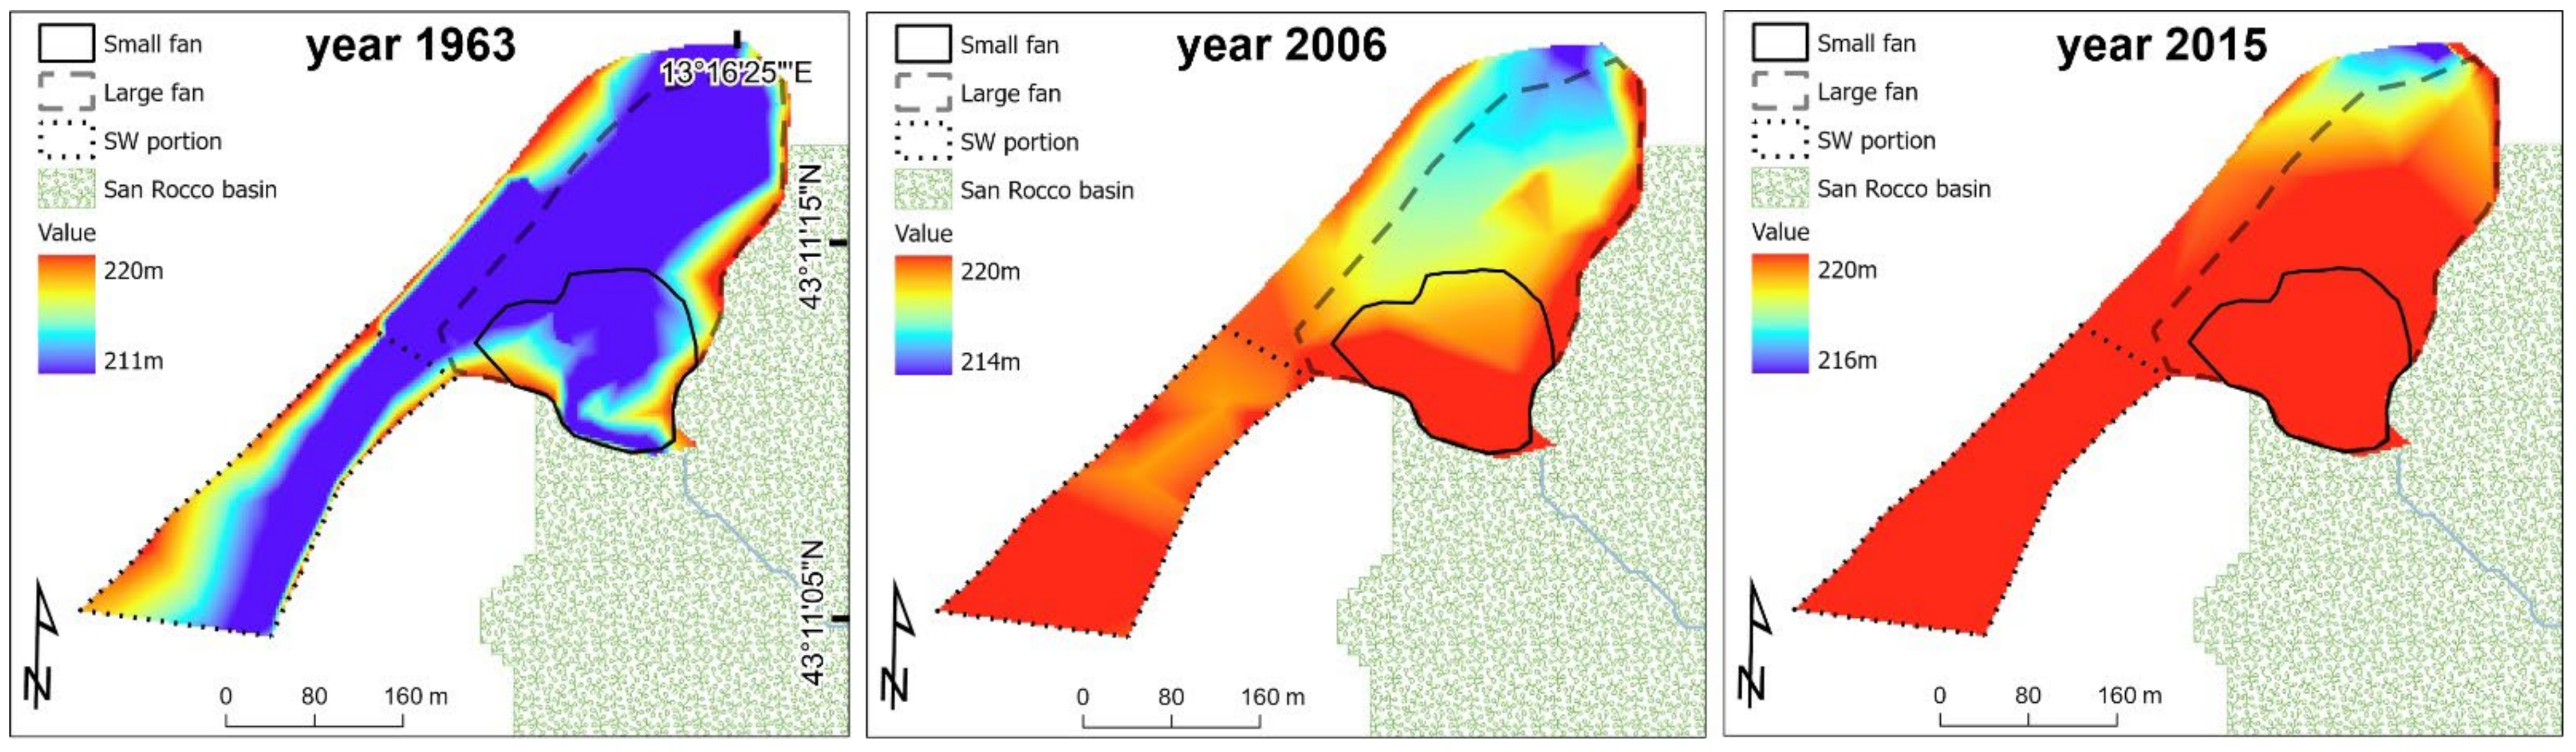
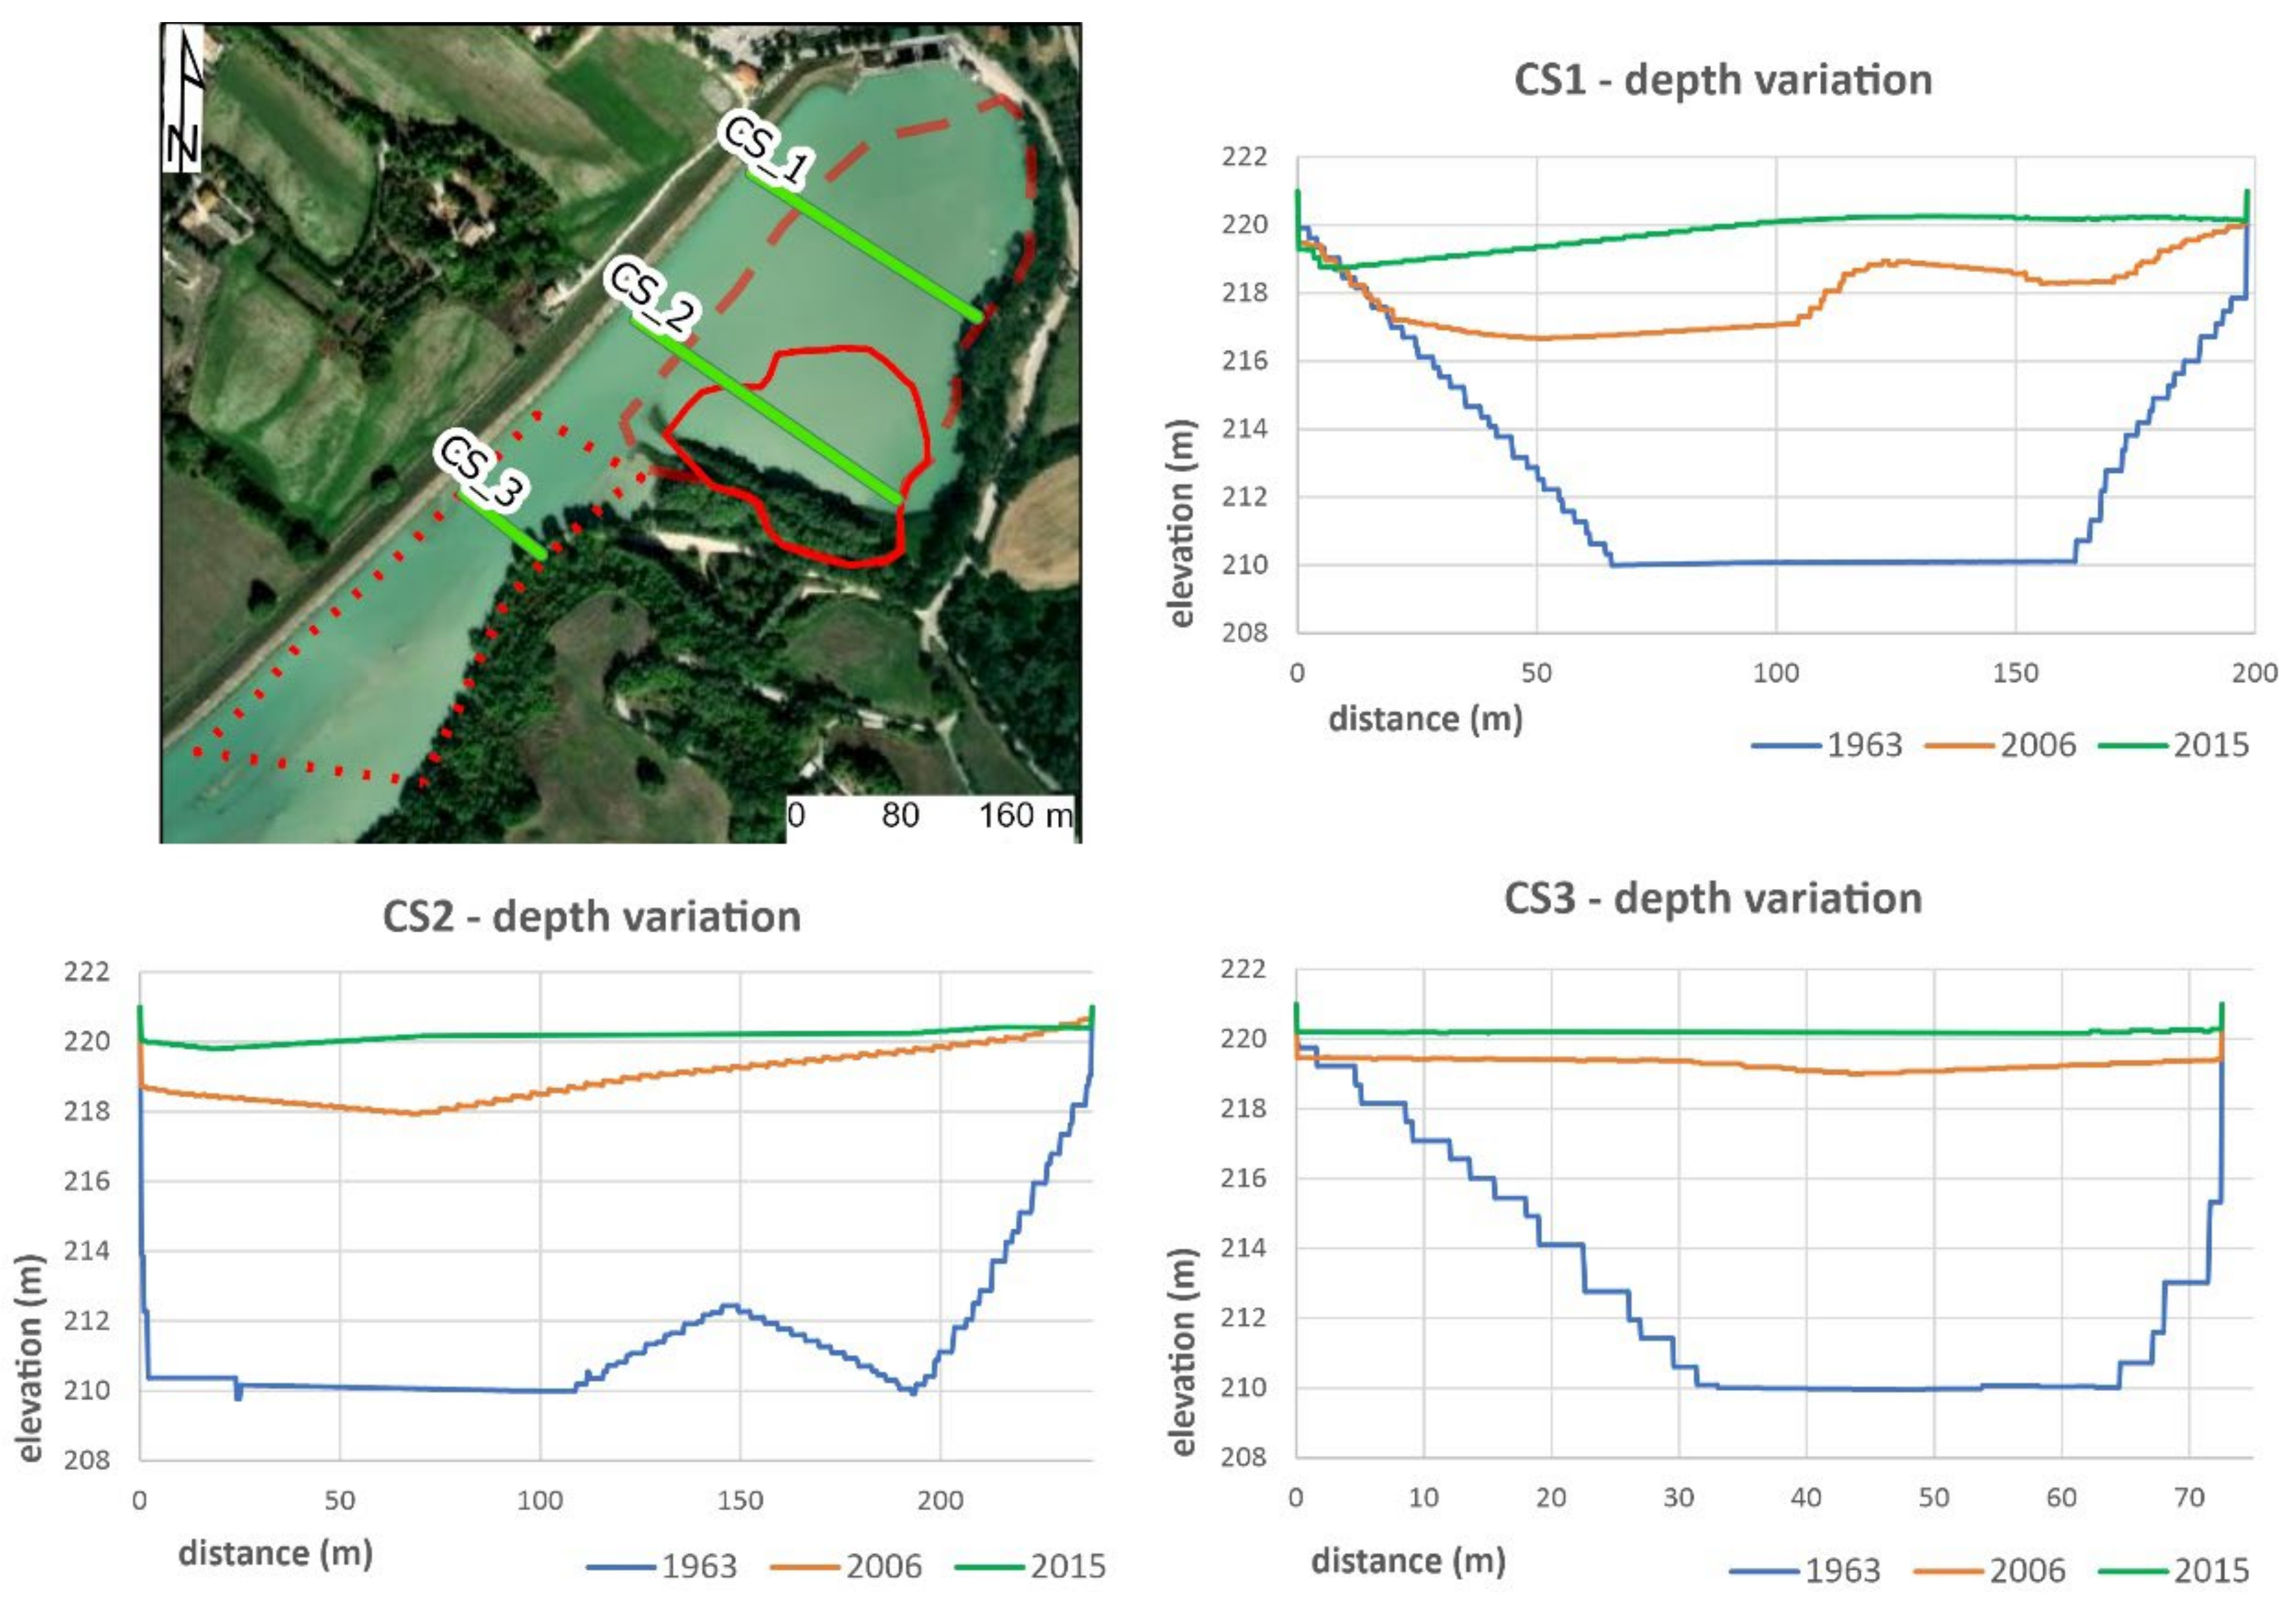
3.2. Bathymetric Analysis

The comparison between the results of the bathymetric surveys carried out in 1963, 2006, and 2015 made it possible to evaluate the progressive filling of the Le Grazie reservoir and the relative deposition rate over time.
The bathymetry reconstructed for the year 1963 (Figure 6 and Table 4) shows how the reservoir at the time of its construction had total water storage of around 940,000 m3 at its standard elevation of 220 m a.s.l and a reference surface of 0.11 km2.
The sediment volume calculation performed in a GIS environment shows that, between 1963 and 2015, around 770,000 m3 of material was globally deposited within the Le Grazie reservoir, with a mean rate of 128.38 mm/year. This caused the loss of approximately 82% of the reservoir’s storage capacity. The filling rate, however, was not constant; comparing the bathymetries of 1963, 2006, and 2015, a clear, albeit limited, increase during 2006–2015 compared to the one in 1963–2006 (147.21 mm/year versus 124.44 mm/year) was recorded.
The values obtained are also in line with those calculated in a previous study [53], which calculated, for the period 1963–1982, a volume of sediments of about 26,100 m3, equivalent to a mean sedimentation rate of 131.81 mm/year.
However, the above results must be treated with care, as they are subject to a certain degree of uncertainty linked to (i) a different method of acquisition of the bathymetric data between the study of 1982 and the present one, and (ii) the activation of systems and procedures, especially during flood events, that provide for the outflow of water from the bottom of the reservoir to facilitate solid transport; unfortunately, no detailed documentation of these procedures was kept.
A further factor of uncertainty in the estimation of sedimentation rates inside the Le Grazie reservoir is linked to the presence, in series, of three other artificial lakes along the Chienti river upstream, which could certainly influence the solid transport.
A more reliable estimate can be made by limiting the analysis to single sectors of the lake. By observing the progressive filling of Le Grazie reservoir, a fan-like morphology at the confluence between the San Rocco Stream and the lake emerges (“minor fan”); additionally, it is possible to delimit the sediment volume coming from the whole San Rocco Basin in contact with the reservoir along the southern side (“major fan”) (Figure 7).
From the analysis of the sedimentation rates in correspondence with these two specific sectors, interesting information emerges on the origin of the materials that constitute the filling of the reservoir (Table 4). Firstly, if referring to the period 1963–2015, the rates are significantly higher (on average between 142 and 153 mm/year compared to 124 mm/year for the entire basin). The difference is even more marked if the same values are compared with those obtained considering only the SW sector of the reservoir (Figure 7 and Table 4) and if the 2006–2015 time span is used.
During this period, in particular, the NE sector of the reservoir shows sedimentation rates around 157 mm/year against 14 mm/year in the SW portion; almost all the contribution is linked to the area identified as “large fan”, while the contribution of the “small fan” drops drastically from around 157 mm/year in the period 1963–2006 to around 45 mm/year in the 2006–2015 interval.
The results demonstrate that, during the entire observation period, but especially in the last decade, the major contribution to the reservoir’s silting is linked to the action of the San Rocco basin and, in particular, its main channel (through the “small fan”); subsequently, as evidenced by the satellite image and by the three cross-sections made transversely to the reservoir (Figure 8), this contribution is less evident due to the progressive filling of this sector and the consequent advancement of the stream mouth.
Finally, as described in Section 2.3, the characteristics of sediments stored inside the reservoir were derived from laboratory analyses performed on two samples of material taken in the center of the lake, approximately at a distance of 130 and 250 m from the dam. The results are shown in Figure 9.
The samples analyzed show very similar characteristics, testifying to almost homogeneous sedimentation inside the reservoir. More specifically, the data show sediment where the silty (around 66%) fraction prevails over the clayey (around 29%) and sandy (around 3%) ones. The Atterberg limits, on the other hand, indicate a material characterized by a medium degree of plasticity (Plasticity Index PI = 12%), while the density γ of the material, fundamental for the subsequent calculation of the quantities of soil eroded by RUSLE, ranges between 1.64 and 1.71 g/cm3.

3.3. RUSLE Analysis

The results of the application of the RUSLE method for soil erosion rate evaluation are shown in Figure 10. As described in Section 2.4, the maps of the R, LS, K, and C factors for the San Rocco basin were initially processed in the GIS environment; subsequently, three different erosion maps (RUSLE) were produced, combining these with the P factor maps elaborated using the three methods described (“Wischmeier”, “Bazzoffi” and “Napoli-Wener”).
Concerning the contribution area, the calculation of the RUSLE was carried out in two different areas: the first corresponding to the entire San Rocco basin and the second taking into account only the portion with the highest value of the Connectivity Index (positive values) as shown in Figure 5.
The resulting values (normalized for the area) are summarized in Table 5.
At first glance, the results obtained from the application of the RUSLE method (with any value of the P factor considered) are considerably underestimated, especially when compared to the sector identified as “large fan”. This discrepancy could be certainly linked to the difficulty of estimating and calibrating some fundamental method parameters, such as K (soil erodibility) and C (cover management), as mentioned in Section 2.4 and highlighted by many authors [62,63]. Furthermore, the contribution of sediments transported by the Chienti river (main tributary of the reservoir) also has to be considered; although limited upstream (as mentioned) by the presence of other artificial basins, it can carry significant quantities of material.
The comparison is certainly more realistic if one compares the values of the erosion rate with those deposited in the sector defined as “small fan”. By analyzing the results obtained using the three different values of the P factor, it is possible, initially, to exclude those produced by the application of the “Napoli-Wener” method (RUSLE map_2): the P factor values obtained (Figure 10) are generally not admissible (higher than 1), probably due to the algorithm that uses a “Slope” map in degrees instead of in percentage.
Concerning the other two methods, the values obtained using the “Bazzoffi” method (RUSLE Map_1), although slightly lower, seem more in line with those obtained from direct surveys, confirming the essential role of land use in the evaluation of the P factor (average value for the whole basin equal to 0.31). On the other hand, the use of a morphometric parameter such as “slope” (envisaged in the “Wischmeier” method, RUSLE Map_3) in a basin such as San Rocco characterized by smooth morphologies, results in significantly lower P factor values (average value 0.18).
The role of sediment connectivity in this context seems less relevant. The erosion rate values calculated on the sector with the highest IC (Figure 5 and Table 5) are significantly lower than those of the entire San Rocco basin (about 30% less both using the “Wischmeier” and the “Bazzoffi” method); while taking into account that even in the case of the “small fan” a percentage of the accumulated sediment could be linked to transport by the Chienti river, the quantities are, however, too different. A possible explanation could be linked to the fact that IC has a relative and not an absolute value; consequently, even negative values would not exclude a good degree of connectivity.

3.4. Morphometric Analysis

The morphometric analysis, as mentioned, was carried out on 10 reservoirs located along the main rivers on the Adriatic side of central Italy. Specifically, for each reservoir, data concerning years of operation, bathymetry, and filling rate were collected (starting from [52] or evaluated ex novo). After this, following the formulas described in Section 2.5, some fundamental morphometric indexes such as Stream Frequency, Relief Ratio, and Mean Annual Denudation Index were calculated. A synthesis of these procedures is shown in Table 6.
Taking into account the different geological-geomorphological and land use conditions of the contribution areas, a correlation between the various morphometric indices was attempted by normalizing the results based on the area itself. The results are shown in Figure 11.
By observing the graphs (red and blue lines indicate the correlation with or without considering the San Rocco basin, respectively), we can note a clear inverse correlation between the Denudation Index and the area of the basins, also evidenced by a significant (although not high) coefficient of determination R2 (around 0.60, Figure 11a). Analogous correlation can be observed between the “Stream Frequency” and the basin area, (coefficient of determination R2 around 0.63, Figure 11b). On the contrary, the trend of the “Relief Ratio” is not very significant when compared with the area (coefficient of determination R2 between 0.4 and 0.14, Figure 11c). The correlation between Denudation Index and the area is even more evident (coefficient of determination R2 around 0.72, Figure 11d) if we exclude the data relating to Le Grazie reservoir (if referring to the upstream basin) and those of Borgiano and S. Maria; since the upstream reservoirs serve as sediment traps that affect sediment transport and deposition, it is reasonable to assume that the data on solid transport and, consequently, the sedimentation rate, can be significantly influenced.
Table 6 also reports an estimate (where possible) of the life of the reservoir (based on the ratio between the initial volume stored and the filling rate) and of the “Remaining life”; the latter considers the reference year (2015), the year of construction of the reservoir, and the above-mentioned estimated life. The results obtained indicate, for all the basins analyzed, a critical condition as regards the trap efficiency loss. Except for the Borgiano reservoir, all the others have exceeded 70% of their global capacity and, in two cases (Santa Maria and Le Grazie) they would have reached the 100% level. Although the situation is serious, this condition has not been actually achieved since, as mentioned in Section 3.2, the activation of systems and procedures that provide for the outflow of water from the bottom of the reservoir to facilitate solid transport were not considered due to the lack of data.

4. Discussion

The results of the above surveys allow us to define a fairly clear framework of limits and problems connected to the estimation of the soil erosion rates in the sample basins using direct and indirect methods; in particular, they confirm the complexity of the problem, which results from the numerous variables that are often difficult to evaluate.
In the case of the Le Grazie basin, the bathymetric analyses, while providing a direct measurement of the solid transport inside the reservoir through the drainage network, often show considerable limits when (i) the volume of material drained from the bottom of the reservoir itself through bottom drains and/or dredging operations is unknown, or (ii) as in the case of the present study, other reservoirs or, in general, transverse barriers limiting sediment transport, are present upstream. Furthermore, it is important to evaluate the role of the minor hydrographic network which, as in the case of Le Grazie, can substantially contribute to solid transport when flowing directly into the reservoir.
Although some factors can be determined with substantial reliability as they are based on the acquisition of direct data (by lab analyses and/or field measures), this is not possible for the P factor, which evaluates the effect of anti-erosive practices on soil loss. In the case of the present study, the three methods used (“Wischmeier”, “Bazzoffi”, and “Napoli-Wener”) provided deeply different and in one case (“Napoli-Wener”) unacceptable results, as they were outside the admissible range of values. Although the “Bazzoffi” method, in the specific case, was the closest to the values obtained from the bathymetric analyses, this does not reduce the reliability of the other two methods; on the contrary, it highlights the need for comparison between these or other approaches for the estimation of a factor which, because of its wide range of variability, can decisively influence the result of the entire RUSLE method.
In this context, the value of sediment connectivity, as it provides a substantially qualitative value, must also be carefully considered. Although it gives very useful indications of the mass transfer capacity of the different sectors of a catchment, even a partial quantification of the processes, without measures of solid transport along the different sections of the river network, becomes difficult.
The use of some morphometric indexes, often underestimated and/or considered a dated method, for the evaluation of the erosive capacity of a catchment, can, on the contrary, be re-evaluated when used preliminarily and/or in the total absence of data or support of other methods. As verified by the present study, when a good relationship between some of them (in this specific case, Stream Frequency and Denudation Index) and the catchment area is found, it is possible to make estimates in similar contexts, although only on a local–regional scale.
The erosion rate calculated in the study area using RUSLE was finally compared with that obtained using the same methodology and available in the literature for Italy, the Mediterranean, and Europe (Table 7).
Although basins of quite different sizes and environmental contexts are compared, the values obtained in the present study can be considered significant; in all cases, the areas have a strong agricultural vocation (over 60%) and/or a high percentage of forest cover (>20%). Moreover, even though no data on the morphometry of these hydrographic basins are available, the values appear comparable, especially among those of similar size. A more accurate analysis that considers these aspects would certainly provide useful indications in the future to better understand the dynamics of erosive processes and the role played by the various contributing factors, often in a contrasting way, to soil removal and transport within the river basins.

5. Conclusions

The results of this study provide interesting insights into the applicability and limits of some direct and indirect methodologies for the evaluation of soil erosion rates; in particular:
(i) no approach or method can be considered totally reliable if used individually;
(ii) direct methods such as bathymetric analyses inside reservoirs can be strongly influenced by the presence of dredging operations carried out over time and almost never quantified; furthermore, any samplings used for the geotechnical characterization of the sediments are not very representative if few in number;
(iii) the RUSLE method can certainly provide interesting results only if calibrated, albeit preliminarily, with direct measurements;
(iv) sediment connectivity and morphometric parameters can be particularly useful in the preliminary stages of a study or in the absence of detailed data.
This study also highlighted how a correct estimate of soil erosion and/or solid transport rates within a hydrographic basin is fundamental for the assessment of the trap efficiency of a reservoir, in a period in which the availability of water resources for hydroelectric or drinking water purposes is becoming more and more vital.

Author Contributions

Conceptualization, M.B. and M.M.; methodology, M.B. and M.M.; software, M.M.; validation, C.M., E.R. and M.P.; formal analysis, M.M.; resources, M.B. and C.M.; data curation, M.M.; writing—original draft preparation, B.M and M.M.; writing—review and editing, M.M. and M.B.; vis-ualization, E.R., G.P. and M.T.; supervision, C.M., E.R., G.P. and M.T. All authors have read and agreed to the published version of the manuscript.

Funding

No funding has been received for the writing of the article.

Institutional Review Board Statement

Not applicable.

Informed Consent Statement

Not applicable.

Data Availability Statement

The data that support the findings of this study are available on request from the corresponding author. The data are not publicly available due to privacy or ethical restrictions.

Acknowledgments

The authors want to thank the Consorzio di Bonifica delle Marche for kindly providing all the data. Also, the authors wish to thank the editors and the anonymous expert reviewers for the useful suggestions, which significantly improved the final version of the manuscript.

Conflicts of Interest

The authors declare no conflict of interest.

Software

All data processing necessary to produce the maps was performed using ESRI-ArcGisPRO 2.8. The figures in the document were created using CorelDraw Home&Student 2019.

References

  1. Terranova, O.; Antronico, L.; Coscarelli, R.; Iaquinta, P. Soil erosion risk scenarios in the Mediterranean environment using RUSLE and GIS: An application model for Calabria (southern Italy). Geomorphology 2009, 112, 228–245. [Google Scholar] [CrossRef]
  2. Mulholland, P.J.; Elwood, J.W. The role of lake and reservoir sediments as sinks in the perturbed global carbon cycle. Tellus 1982, 34, 490–499. [Google Scholar] [CrossRef]
  3. Alighalehbabakhani, F.; Miller, C.J.; Selegean, J.P.; Barkach, J.; Sadatiyan Abkenar, S.M.; Dahl, T.; Baskaran, M. Estimates of sediment trapping rates for two reservoirs in the Lake Erie watershed: Past and present scenarios. J. Hydrol. 2017, 544, 147–155. [Google Scholar] [CrossRef]
  4. Mekonnen, M.; Keesstra, S.D.; Baartman, J.E.; Ritsema, C.J.; Melesse, A.M. Evaluating Sediment Storage Dams: Structural Off-Site Sediment Trapping Measures In Northwest Ethiopia. Cuad. Investig. Geográfica Geogr. Res. Lett. 2015, 41, 7–22. [Google Scholar] [CrossRef] [Green Version]
  5. Issa, I.E.; Al-ansari, N.; Knutsson, S.; Sherwany, G. Monitoring and Evaluating the Sedimentation Process in Mosul Dam Reservoir Using Trap Efficiency Approaches. Engineering 2015, 7, 190–202. [Google Scholar] [CrossRef] [Green Version]
  6. Kummu, M.; Lu, X.X.; Wang, J.J.; Varis, O. Geomorphology Basin-wide sediment trapping efficiency of emerging reservoirs along the Mekong. Geomorphology 2010, 119, 181–197. [Google Scholar] [CrossRef]
  7. Kummu, M.; Taka, M.; Guillaume, J.H.A. Gridded global datasets for Gross Domestic Product and Human Development Index over 1990–2015. Sci. Data 2018, 5, 180004. [Google Scholar] [CrossRef] [Green Version]
  8. Mulu, A.; Dwarakish, G.S. Different Approach for Using Trap Efficiency for Estimation of Reservoir Sedimentation. An Overview. Aquat. Procedia 2015, 4, 847–852. [Google Scholar] [CrossRef]
  9. Yang, X.; Lu, X.X. Geomorphology Estimate of cumulative sediment trapping by multiple reservoirs in large river basins: An example of the Yangtze River basin. Geomorphology 2014, 227, 49–59. [Google Scholar] [CrossRef]
  10. FAO. Acqua per le Colture-Ogni Goccia D’acqua Conta; FAO: Rome, Italy, 2002. [Google Scholar]
  11. Rodrigo-Comino, J. Five decades of soil erosion research in “terroir”. The State-of-the-Art. Earth-Sci. Rev. 2018, 179, 436–447. [Google Scholar] [CrossRef]
  12. Keesstra, S.D.; Rodrigo-comino, J.; Novara, A.; Giménez-morera, A.; Pulido, M. Catena Straw mulch as a sustainable solution to decrease runo ff and erosion in glyphosate-treated clementine plantations in Eastern Spain. An assessment using rainfall simulation experiments. Catena 2019, 174, 95–103. [Google Scholar] [CrossRef]
  13. Moges, M.M.; Abay, D.; Engidayehu, H. Investigating reservoir sedimentation and its implications to watershed sediment yield: The case of two small dams in data-scarce upper Blue Nile Basin, Ethiopia. Lakes Reserv. Res. Manag. 2018, 23, 217–229. [Google Scholar] [CrossRef]
  14. Ranzi, R.; Hung, T.; Cristina, M. A RUSLE approach to model suspended sediment load in the Lo river (Vietnam): Effects of reservoirs and land use changes. J. Hydrol. 2012, 422–423, 17–29. [Google Scholar] [CrossRef]
  15. Bufalini, M.; Omran, A.; Bosino, A. Assessment of Badlands Erosion Dynamics in the Adriatic Side of Central Italy. Geosciences 2022, 12, 208. [Google Scholar] [CrossRef]
  16. Cerdà, A.; Esteban, M.; Borja, L.; Úbeda, X.; Martínez-murillo, J.F.; Keesstra, S. Forest Ecology and Management Pinus halepensis M. versus Quercus ilex subsp. Rotundifolia L. runoff and soil erosion at pedon scale under natural rainfall in Eastern Spain three decades after a forest fire. For. Ecol. Manag. 2017, 400, 447–456. [Google Scholar] [CrossRef] [Green Version]
  17. Del Monte, M.; Vergari, F.; Brandolini, P.; Capolongo, D.; Cevasco, A.; Ciccacci, S.; Conoscenti, C.; Fredi, P.; Melelli, L.; Rotigliano, E.; et al. Multi-method Evaluation of Denudation Rates in Small Mediterranean Catchments. In Engineering Geology for Society and Territory-Volume 1; Springer International Publishing: Cham, Switzerland, 2015; Volume 1, pp. 563–567. [Google Scholar]
  18. Valero-Garces, B.L.; Navas, A.; Machın, J.; Walling, D. Sediment sources and siltation in mountain reservoirs: A case study from the Central Spanish Pyrenees. Geomorphology 1999, 28, 23–41. [Google Scholar] [CrossRef] [Green Version]
  19. Krasa, J.; Dostal, T.; Van Rompaey, A.; Vaska, J.; Vrana, K. Reservoirs’ siltation measurments and sediment transport assessment in the Czech Republic, the Vrchlice catchment study. CATENA 2005, 64, 348–362. [Google Scholar] [CrossRef]
  20. Conoscenti, C.; Martinello, C.; Alfonso-Torreño, A.; Gómez-Gutiérrez, Á. Predicting sediment deposition rate in check-dams using machine learning techniques and high-resolution DEMs. Environ. Earth Sci. 2021, 80, 380. [Google Scholar] [CrossRef]
  21. Bazzoffi, P.; Vanino, S. L’interrimento degli Invasi ad uso irriguo nelle Regioni Meridionali: Rilievi Diretti, Metodologie e Modellistica; INEA: Rome, Italy, 2010; p. 76. [Google Scholar]
  22. Patro, E.R.; De Michele, C.; Granata, G.; Biagini, C. Assessment of current reservoir sedimentation rate and storage capacity loss: An Italian overview. J. Environ. Manage. 2022, 320, 115826. [Google Scholar] [CrossRef]
  23. Kouli, M.; Soupios, P.; Vallianatos, F. Soil erosion prediction using the Revised Universal Soil Loss Equation (RUSLE) in a GIS framework, Chania, Northwestern Crete, Greece. Environ. Geol. 2008, 57, 483–497. [Google Scholar] [CrossRef]
  24. Renard, K.G.; Foster, G.R.; Weesies, D.K.; McCool, D.K.; Yoder, D.C. Predicting Soil Erosion. In U.S. Department of Agriculture, Agriculture Handbook; Science and Education Administration United States Department of Agriculture, Southwest Watershed Research Center: Tucson, AZ, USA, 1997; p. 384. ISBN 0-16-048938-5. [Google Scholar]
  25. Wischmeier, W.H.; Smith, D.D. Predicting Rainfall EROSION Losses—A Guide to Conservation Planning; U.S. Department of Agriculture, Science and Education: Tucson, AZ, USA, 1978; p. 69. [Google Scholar]
  26. Lufafa, A.; Tenywa, M.M.; Isabirye, M.; Majaliwa, M.J.G.; Woomer, P.L. Prediction of soil erosion in a Lake Victoria basin catchment using a GIS-based Universal Soil Loss model. Agric. Syst. 2003, 76, 883–894. [Google Scholar] [CrossRef]
  27. Fu, B.J.; Zhao, W.W.; Chen, L.D.; Zhang, Q.J.; Lü, Y.H.; Gulinck, H.; Poesen, J. Assessment of soil erosion at large watershed scale using RUSLE and GIS: A case study in the Loess Plateau of China. Land Degrad. Dev. 2005, 16, 73–85. [Google Scholar] [CrossRef]
  28. Napoli, M.; Cecchi, S.; Orlandini, S.; Mugnai, G.; Zanchi, C.A. Simulation of field-measured soil loss in Mediterranean hilly areas (Chianti, Italy) with RUSLE. Catena 2016, 145, 246–256. [Google Scholar] [CrossRef]
  29. Bazzoffi, P.; Abbattista, F.; Vanino, S.; Napoli, R.; Fais, A.; Nino, P. Loss of water storage capacity of reservoirs in Southern Italy: Economic implications of sedimentation. In Proceedings of the OECD Workshop on Agriculture and Water: Sustainability Markets and Policies, Adelaide, Australia, 14–18 November 2005. [Google Scholar] [CrossRef]
  30. Aiello, A.; Adamo, M.; Canora, F. Remote sensing and GIS to assess soil erosion with RUSLE3D and USPED at river basin scale in southern Italy. Catena 2015, 131, 174–185. [Google Scholar] [CrossRef]
  31. Lupia Palmieri, E. Il problema della valutazione dell’entità dell’erosione nei bacini fluviali. In Proceedings of the XXIII Congresso Geografico Italiano, Catania, Italy, 9–13 May 1983; pp. 143–176. [Google Scholar]
  32. Schumm, S.A. Origin of the Chuska Sandstone, Arizona-New Tertiary Eolian Sediment. Geol. Soc. Am. Bull. 1956, 67, 597–646. [Google Scholar] [CrossRef]
  33. Horton, R.E. Drainage-basin characteristics. Eos. Trans. Am. Geophys. Union 1932, 13, 350–361. [Google Scholar] [CrossRef]
  34. Amici, M.; Spina, R. Campo medio della precipitazione annuale e stagionale sulle Marche per il periodo 1950–2000; Osservatorio Geofisico Sperimentale: Macerata, Italy, 2002; 103 p. [Google Scholar]
  35. Gentilucci, M.; Bufalini, M.; Materazzi, M.; Barbieri, M.; Aringoli, D.; Farabollini, P.; Pambianchi, G. Calculation of potential evapotranspiration and calibration of the hargreaves equation using geostatistical methods over the last 10 years in central Italy. Geosciences 2021, 11, 348. [Google Scholar] [CrossRef]
  36. Gentilucci, M.; Bufalini, M.; D’aprile, F.; Materazzi, M.; Pambianchi, G. Comparison of data from rain gauges and the IMERG product to analyse precipitation in mountain areas of central Italy. ISPRS Int. J. Geo-Inf. 2021, 10, 795. [Google Scholar] [CrossRef]
  37. Gentilucci, M.; Materazzi, M.; Pambianchi, G.; Burt, P.; Guerriero, G. Temperature variations in Central Italy (Marche region) and effects on wine grape production. Theor. Appl. Climatol. 2020, 140, 303–312. [Google Scholar] [CrossRef]
  38. Materazzi, M.; Bufalini, M.; Gentilucci, M.; Pambianchi, G.; Aringoli, D.; Farabollini, P. Landslide hazard assessment in a monoclinal setting (Central italy): Numerical vs. geomorphological approach. Land 2021, 10, 624. [Google Scholar] [CrossRef]
  39. Pierantoni, P.; Deiana, G.; Galdenzi, S. Stratigraphic and structural features of the sibillini mountains(Umbria-Marche Apennines, Italy). Ital. J. Geosci. 2013, 132, 497–520. [Google Scholar] [CrossRef]
  40. Centamore, E.; Deiana, G.; Micarelli, A.; Potetti, M. Il Trias-Paleogene delle Marche. In Studi Geologici Camerti, Volume Speciale “La Geologia delle Marche”; Università di Camerino: Camerino, Italy, 1986; pp. 9–27. [Google Scholar]
  41. Aringoli, D.; Gentili, B.; Materazzi, M.; Pambianchi, G. Landslides: Causes, Types and Effects—Mass Movements in Adriatic Central Italy: Activation and Evolutive Control Factors; Werner, E.D., Ed.; Nova Science Publishers: New York, NY, USA, 2010; pp. 1–71. ISBN 9781607412588. [Google Scholar]
  42. Buccolini, M.; Bufalini, M.; Coco, L.; Materazzi, M.; Piacentini, T. Small catchments evolution on clayey hilly landscapes in Central Apennines and northern Sicily (Italy) since the Late Pleistocene. Geomorphology 2020, 363, 107206. [Google Scholar] [CrossRef]
  43. Gentili, B.; Pambianchi, G.; Aringoli, D.; Materazzi, M.; Giacopetti, M. Pliocene-Pleistocene geomorphological evolution of the Adriatic side of Central Italy. Geol. Carpathica 2017, 68, 6–18. [Google Scholar] [CrossRef] [Green Version]
  44. Bufalini, M.; Materazzi, M.; De Amicis, M.; Pambianchi, G. From traditional to modern ‘full coverage’ geomorphological mapping: A study case in the Chienti river basin (Marche region, central Italy). J. Maps 2021, 17, 17–28. [Google Scholar] [CrossRef]
  45. Croke, J.; Mockler, S.; Fogarty, P.; Takken, I. Sediment concentration changes in runoff pathways from a forest road network and the resultant spatial pattern of catchment connectivity. Geomorphology 2005, 68, 257–268. [Google Scholar] [CrossRef]
  46. Bracken, L.J.; Croke, J. The concept of hydrological connectivity and its contribution to understanding runoff-dominated geomorphic systems. Hydrol. Process. 2007, 21, 1749–1763. [Google Scholar] [CrossRef]
  47. Borselli, L.; Cassi, P.; Torri, D. Prolegomena to sediment and flow connectivity in the landscape: A GIS and field numerical assessment. Catena 2008, 75, 268–277. [Google Scholar] [CrossRef]
  48. Hooke, J. Coarse sediment connectivity in river channel systems: A conceptual framework and methodology. Geomorphology 2003, 56, 79–94. [Google Scholar] [CrossRef]
  49. Cavalli, M.; Trevisani, S.; Comiti, F.; Marchi, L. Geomorphometric assessment of spatial sediment connectivity in small Alpine catchments. Geomorphology 2013, 188, 31–41. [Google Scholar] [CrossRef]
  50. Geomarine Rilievi batimetrici e campionamento del sedimento del Lago Le Grazie nel Comune di Tolentino (MC). Relazione Tecnica. 2006.
  51. Geomarine Rilievi batimetrici. Lago Le Grazie—Comune di Tolentino (MC). Relazione Tecnica. 2015.
  52. Aquater. Regione Marche. Studio generale per la difesa delle coste: Prima fase. 1982, Vol. 1 (Relazione Generale), 176; Vol. 2 (Rapporti Settore), 706.
  53. Liu, W.; Wang, L.; Zhou, J.; Li, Y.; Sun, F.; Fu, G.; Li, X.; Sang, Y.F. A worldwide evaluation of basin-scale evapotranspiration estimates against the water balance method. J. Hydrol. 2016, 538, 82–95. [Google Scholar] [CrossRef] [Green Version]
  54. Morgan, R.P.C.; Quinton, J.N.; Smith, R.E.; Govers, G.; Poesen, J.W.A.; Auerswald, K.; Chisci, G.; Torri, D.; Styczen, M.E. The European Soil Erosion Model (Eurosem): A Dynamic Approach for Predicting Sediment Transport from Fields and Small Catchments. Earth Surf. Process. Landf. 1998, 23, 527–544. [Google Scholar] [CrossRef]
  55. McCool, D.K.; Wischmeier, W.H.; Johnson, L.C. Adapting the universal soil loss equation to the Pacific Northwest. Trans. Am. Soc. Agric. Eng. 1982, 25, 928–934. [Google Scholar] [CrossRef]
  56. Moore, I.D.; Burch, G.J. Modelling Erosion and Deposition: Topographic Effects. Trans. Am. Soc. Agric. Eng. 1986, 29, 1624–1630. [Google Scholar] [CrossRef]
  57. Moore, I.D.; Wilson, J.P. Length-slope factors for the revised universal soil loss equation: Simplified method of estimation. J. Soil Water Conserv. 1992, 47, 423–428. [Google Scholar]
  58. Benkobi, L.; Trlica, M.J.; Smith, J.L. Evaluation of a refined surface cover subfactor for use in RUSLE. J. Range Manag. 1994, 47, 74–78. [Google Scholar] [CrossRef] [Green Version]
  59. Biesemans, J.; Van Meirvenne, M.; Gabriels, D. Extending the RUSLE with the Monte Carlo error propagation technique to predict long-term average off-site sediment accumulation. J. Soil Water Conserv. 2000, 55, 35–42. [Google Scholar]
  60. Suoli e Paesaggi delle Marche: Programma Interregionale Agricoltura e Qualità, Misura 5, Carta dei Suoli, Scala 1:250.000 (dD.G.R. n. 2805 del 18/12/2000); ASSAM: Ancona, Italy, 2005; p. 41.
  61. Gentili, B.; Pambianchi, G. Erosione e sedimentazione negli alti bacini fluviali delle Marche centro-meridionali.pdf. Boll. Mus. St. Nat. Lunigiana 1988, 35–40. [Google Scholar]
  62. Cerdan, O.; Govers, G.; Le Bissonnais, Y.; Van Oost, K.; Poesen, J.; Saby, N.; Gobin, A.; Vacca, A.; Quinton, J.; Auerswald, K.; et al. Rates and spatial variations of soil erosion in Europe: A study based on erosion plot data. Geomorphology 2010, 122, 167–177. [Google Scholar] [CrossRef]
  63. Conforti, M.; Buttafuoco, G.; Rago, V.; Aucelli, P.P.C.; Robustelli, G.; Scarciglia, F.; Conforti, M.; Buttafuoco, G.; Rago, V.; Aucelli, P.P.C. Soil loss assessment in the Turbolo catchment. J. Maps 2015, 12, 815–825. [Google Scholar] [CrossRef]
  64. Borrelli, P.; Märker, M.; Panagos, P.; Schütt, B. Modeling soil erosion and river sediment yield for an intermountain drainage basin of the Central Apennines, Italy. Catena 2014, 114, 45–58. [Google Scholar] [CrossRef]
Figure 1. Geological sketch of the study area (numbers indicate the artificial reservoirs analyzed within the paper). (1) Le Grazie; (2) Borgiano; (3) Polverina; (4) Fiastrone; (5) San Ruffino; (6) Gerosa; (7) Villa Pera; (8) Talvacchia; (9) Colombara (10) Scandarello.
Land 11 01924 g001
Figure 2. San Rocco basin. (a) Schematic geological and geomorphological map; (b) land use map based on the CLC classification of 2018; (c) land use map based on the CLC classification of 2000.
Land 11 01924 g002
Figure 3. (a) Location of sampling sites; (b) “Van Veen” type bucket used for sediment sampling.
Land 11 01924 g003
Figure 4. San Rocco basin. Map of the RUSLE C factor.
Land 11 01924 g004
Figure 5. Map of sediment connectivity for the San Rocco basin.
Land 11 01924 g005
Figure 6. Water depth (depth to the top of the sediment infill) reconstruction for Le Grazie reservoir in the years 1963, 2006, and 2015.
Land 11 01924 g006
Figure 7. Progressive filling of sediments of Le Grazie reservoir in the period 1963–2015; two fan-like morphologies result evident in the SE portion of the lake.
Land 11 01924 g007
Figure 8. Bathymetric profiles showing the progressive filling of Le Grazie reservoir in the period 1963–2015.
Land 11 01924 g008
Figure 9. Geotechnical and sedimentological characteristics of two samples of sediment taken from the basin (see Figure 3 for the location). 2.
Land 11 01924 g009
Figure 10. The RUSLE procedure for soil erosion rate evaluation in the San Rocco basin.
Land 11 01924 g010
Figure 11. Relationship between some morphometric parameters and the basin area calculated on 10 artificial reservoirs and 11 contribution basins. Red and blue lines in frames (ac) indicate the correlation with or without considering the San Rocco basin respectively: (a) Mean Annual Denudation Index (Id) vs. Area; (b) Stream Frequency (Fs) vs Area; (c) Relief Ratio (Rh) vs. Area; (d) Mean Annual Denudation Index (Id) vs. Area (only 8 contributing basins).
Land 11 01924 g011
Table 1. Relationship between slope (%) and the P factor value for different land uses following the “Wischmeier” method.
Agricultural LandsOther Land Uses
Slope (%)0–55–1010–2020–3030–5050–1000–100
P factor0.10.120.140.190.250.331
Table 2. Relationship between CORINE Land Cover Class and P factor value for different land uses following the “Bazzoffi” method.
CLC Class (III Level)
2.1.12.4.22.4.33.1.13.2.4
P-factor0.80.25–0.50.2
Table 3. Relationship between CLC soil classes and C factor for the San Rocco basin.
Corine Land Cover
Level 1Level 2Level 3C Factor
2. Agricultural areas2.1 Arable land2.1.1 Non irrigated arable land0.1
2.4 Heterogeneous agricultural areas2.4.2 Complex cultivation patterns0.05
2.4.3 Land principally occupied by agriculture0.07
3. Forests and seminatural areas3.1 Forest3.1.1 Broad-leaved forests0.001
3.2 Shrub and/or
herbaceous vegetation
associations
3.2.4 Transitional woodland shrub0.04
5. Water bodies5.1 Continental waters5.1.2 Water bodies0
Table 4. Storage capacity and filling rate of Le Grazie reservoir in the years 1963, 2006, and 2015.
Water Budget
196320062015
Water volume [m3]940,666323,085170,167
Volume lost [m3] 617,581770,499
Volume lost (%) 65.65%81.91%
Sediment Budget and Deposition Rate
1963–20151963–20062006–2015
m3/yearmm/ yearm3/yearmm/yearm3/yearmm/year
Le Grazie (entire reservoir)14,817128.3814,362124.4416,991147.21
Le Grazie (reservoir-SW sector)4153123.383676109.2247013.97
Le Grazie (large fan)9266153.309157151.519520157.50
Le Grazie (small fan)3125142.813455157.8899945.63
Table 5. Comparison between deposition rate calculated with direct measures and soil erosion rate evaluated by RUSLE.
Deposition Rate (Bathymetric Analysis)
1963–20151963–20062006–2015
m3/yeartons/yearm3/yeartons/yearm3/yeartons/year
Le Grazie (large fan)926615,567915715,384952015,232
Le Grazie (small fan)31255250345558049991678
Soil erosion rate (RUSLE)
P-factor method
Wischmeier (tons/year)Napoli-Wener (tons/year)Bazzoffi (tons/year)
San Rocco basin242178834066
IC-based ontribution basin165853652800
Table 6. Synthesis of the data collected and of the morphometric analysis concerning the reservoirs described in the present study. The asterisk (*) indicates uncalculated fields.
ReservoirSourceYear of ConstructionInitial Volume Stored (Mm3)Bathymetric Studies (Period of Observation)n. YearsBasin Area (km2)Stream Frequency (Fs) (km-2)Relief Ratio (Rh)Sediment Volume (Mm3)Fillling Rate (m3/year)Mean Annual Denudation Index (Id) (mm/year)Estimated Life of the Reservoir (Years)Estimated Remaining Life (Years)Trap Efficiency Loss (at 2015) (%)
Fiastrone[52]1955unknown1955–19822775.000.860.170.8932,9000.44***
Polverina[52]19675.801967–198215360.940.620.061.3791,6000.25631576%
Borgiano[52]19545.051954–198228446.870.660.050.8831,2500.3516210138%
S. Maria[52]19550.561955–198227628.130.630.040.3010,9700.2751-9100%
S. Ruffino[52]1957unknown1957–198225134.500.920.100.4216,9000.13* *
Villa Pera[52]1955unknown1955–19822785.941.010.100.5018,4000.21* *
Scandarello[52]1924unknown1924–19825843.751.460.051.2822,0000.50* *
Colombara[52]1955unknown1955–198227389.061.240.070.269,7000.08* *
Talvacchia[52]1962unknown1962–198220156.251.120.101.1758,3300.37* *
Le Grazie (entire basin)[52]19631.121963–198219637.500.650.050.5026,1000.0443-9100%
Le Grazie (entire basin)Present study19631.121963–200643637.500.650.050.7300.00661479%
Le Grazie (entire basin)Present study19631.122006–20159637.500.650.050.1200.00823064%
Le Grazie (entire basin)Present study19631.121963–201552637.500.650.050.8516,4180.03681676%
Le Grazie (S. Rocco wat.)Present study1963*1963–20064313.153.800.020.399,0950.69***
Le Grazie (S. Rocco wat.)Present study1963*2006–2015913.153.800.020.078,2210.63***
Le Grazie (S. Rocco wat.)Present study1963*1963–20155213.153.800.020.478,9440.68***
Table 7. Comparison of erosion rates (weighted mean) for different land uses and different study sites (Mediterranean area, European countries, and the present study).
SiteArea (km2)BedrockLand UseClimateMean Erosion Rate (ton/ha/year)References
European CountriesUnknownvariousarableVarious-continental6.33[62]
European CountriesUnknownvariousforestVarious-continental0.84[62]
Mediterranean countriesUnknownvariousarableMediterranean0.00[62]
Mediterranean countriesUnknownvariousforestMediterranean0.18[62]
Turano basin (Italy)466.7variousforest (60%) arable (8%) grassland and pastures (8%), various (24%)Mediterranean~11[64]
Turano basin (Italy)59.2variousarableMediterranean25.40[64]
Turano basin (Italy)288.7variousforestMediterranean3.90[64]
Tombolo basin (Italy)30Sandstones and claysvariousMediterranean-subhumid5.65[63]
Tombolo basin (Italy)~13Sandstones and claysarableMediterranean-subhumid~38[63]
Tombolo basin (Italy)~8Sandstones and claysforestMediterranean-subhumid~1[63]
San Rocco basin (Italy)~13Sandstones and claysarable (62%) forest and shrub (38%)Mediterranean3.12Present study
Publisher’s Note: MDPI stays neutral with regard to jurisdictional claims in published maps and institutional affiliations.

