Article

Analysis of the Spatiotemporal Variation of Landscape Patterns and Their Driving Factors in Inner Mongolia from 2000 to 2015

State Key Laboratory of Earth Surface Processes and Resource Ecology, School of Natural Resources, Faculty of Geographical Science, Beijing Normal University, Beijing 100875, China
*
Author to whom correspondence should be addressed.
Land 2022, 11(9), 1410; https://doi.org/10.3390/land11091410
Submission received: 27 July 2022 / Revised: 23 August 2022 / Accepted: 24 August 2022 / Published: 27 August 2022
(This article belongs to the Special Issue Monitoring and Simulation of Wetland Ecological Processes)

Abstract

:
Understanding the spatiotemporal changes in landscape patterns and their driving factors in Inner Mongolia can benefit land use and ecological environment management in this region. This study used the county landscape index and multiple regression analysis to reveal the temporal and spatial evolutions of landscape patterns and their driving factors in Inner Mongolia from 2000 to 2015 with multitemporal land use data. The results showed that (1) grassland was the main landscape type in Inner Mongolia. Grassland and unused land decreased, and cropland expanded from 2000 to 2015. Grassland degradation has slowed since 2005. (2) At the class level, the dominance of grassland decreased, and the degree of landscape fragmentation of cropland, forestland, and grassland increased gradually. At the landscape level, the landscape shape was more complex, the landscape connectivity was worse, and the landscape diversity gradually enhanced. (3) This study revealed that climatic factors influenced the evolution of landscape patterns, and human activities were the key driving factors of landscape-level metrics. The results of this study provide scientific bases for land management strategies.

1. Introduction

A landscape pattern is an important manifestation of land use and land cover (LULC) and is mainly defined by landscape heterogeneity and diversity [1]. Landscape diversity involves the backgrounds of other levels of biodiversity and restricts the spatiotemporal patterns and their change processes [2]. The shrinkage or expansion of LULC types is accompanied by the aggregation and dispersion of landscape patches, resulting in changes in the spatial configuration and pattern characteristics of landscape patches [3]. Changes in land use and land cover (LUCC) can affect landscape patterns and lead to landscape fragmentation [4]. Landscape patterns explain both the ecological significance of an area and the land-use patterns [5]. Landscape patterns affect ecosystems and landscape connectivity, and fragmentation plays an important role in ecosystem services [6]. Therefore, studying the dynamic changes in landscape patterns is beneficial to regional sustainable development and regional ecosystem conservation and management. Changes in landscape patterns are usually quantified by traditional landscape indices and moving window methods [1,7]. The landscape index is a quantitative index that reflects landscape composition and spatial configuration [8] and can quantitatively describe the spatial characteristics of landscape patterns at the patch, class, and landscape levels [9]. Although many scholars have quantified changes in landscape patterns in previous studies, few studies have quantified changes in landscape patterns at the county scale. We chose county-level administrative boundaries as spatial units, which are appropriate for land management.
Land use is the most direct manifestation of the interaction between human activities and the natural environment [10], so the interaction of various factors, such as climate and human activities, will affect changes in landscape patterns [11,12]. Previous studies have found that human activities (population, GDP, and livestock numbers) and climatic factors (temperature, precipitation) are key driving factors of changes in landscape patterns [7,13,14,15]. The high variability of precipitation and temperature in arid regions has an important impact on landscape patterns [16]. The current quantitative analysis methods used to evaluate the driving factors of landscape patterns include multiple regression analysis, correlation analysis, principal component analysis, and geographical detectors [17,18,19]. Few scholars have comprehensively quantified the driving factors of landscape patterns. Liu et al. (2021) revealed the temporal and spatial dynamics of the landscape patterns in Jinghe County, Xinjiang, by using the moving window method and analyzing the driving factors, but the quantitative analysis of driving factors is lacking. The results showed that the biodiversity of cropland in the study area decreased, the aggregation degree increased, and the forestland fragmentation increased in the time series. It was roughly determined that human activities were the main driving factors causing landscape pattern changes in this region through qualitative analysis and correlation analysis. Fan and Ding (2016) studied the landscape patterns of Fengqiu in Henan and conducted qualitative and quantitative analyses of the driving factors through the principal component analysis. The results of the study found that the landscape heterogeneity in the study area decreased, and population growth was the main driving force of landscape change in the study area. However, systematic and quantitative analyses are still lacking. Thus, it is necessary to quantitatively analyze the driving factors (climatic factors and human activities) affecting landscape pattern changes.
The objectives of this study were to: (1) analyze the spatiotemporal changes in landscape types, (2) analyze the spatiotemporal changes in landscape patterns, and (3) explore the driving factors of landscape patterns. Thus, the spatiotemporal dynamic changes in landscape-type changes and county-level landscape patterns in Inner Mongolia from 2000 to 2015 were revealed and the driving factors of landscape patterns from the aspects of climatic and socioeconomic factors were quantitatively analyzed. Our results can improve our understanding of landscape patterns in Inner Mongolia and provide a basis for sustainable land management.

2. Materials and Methods
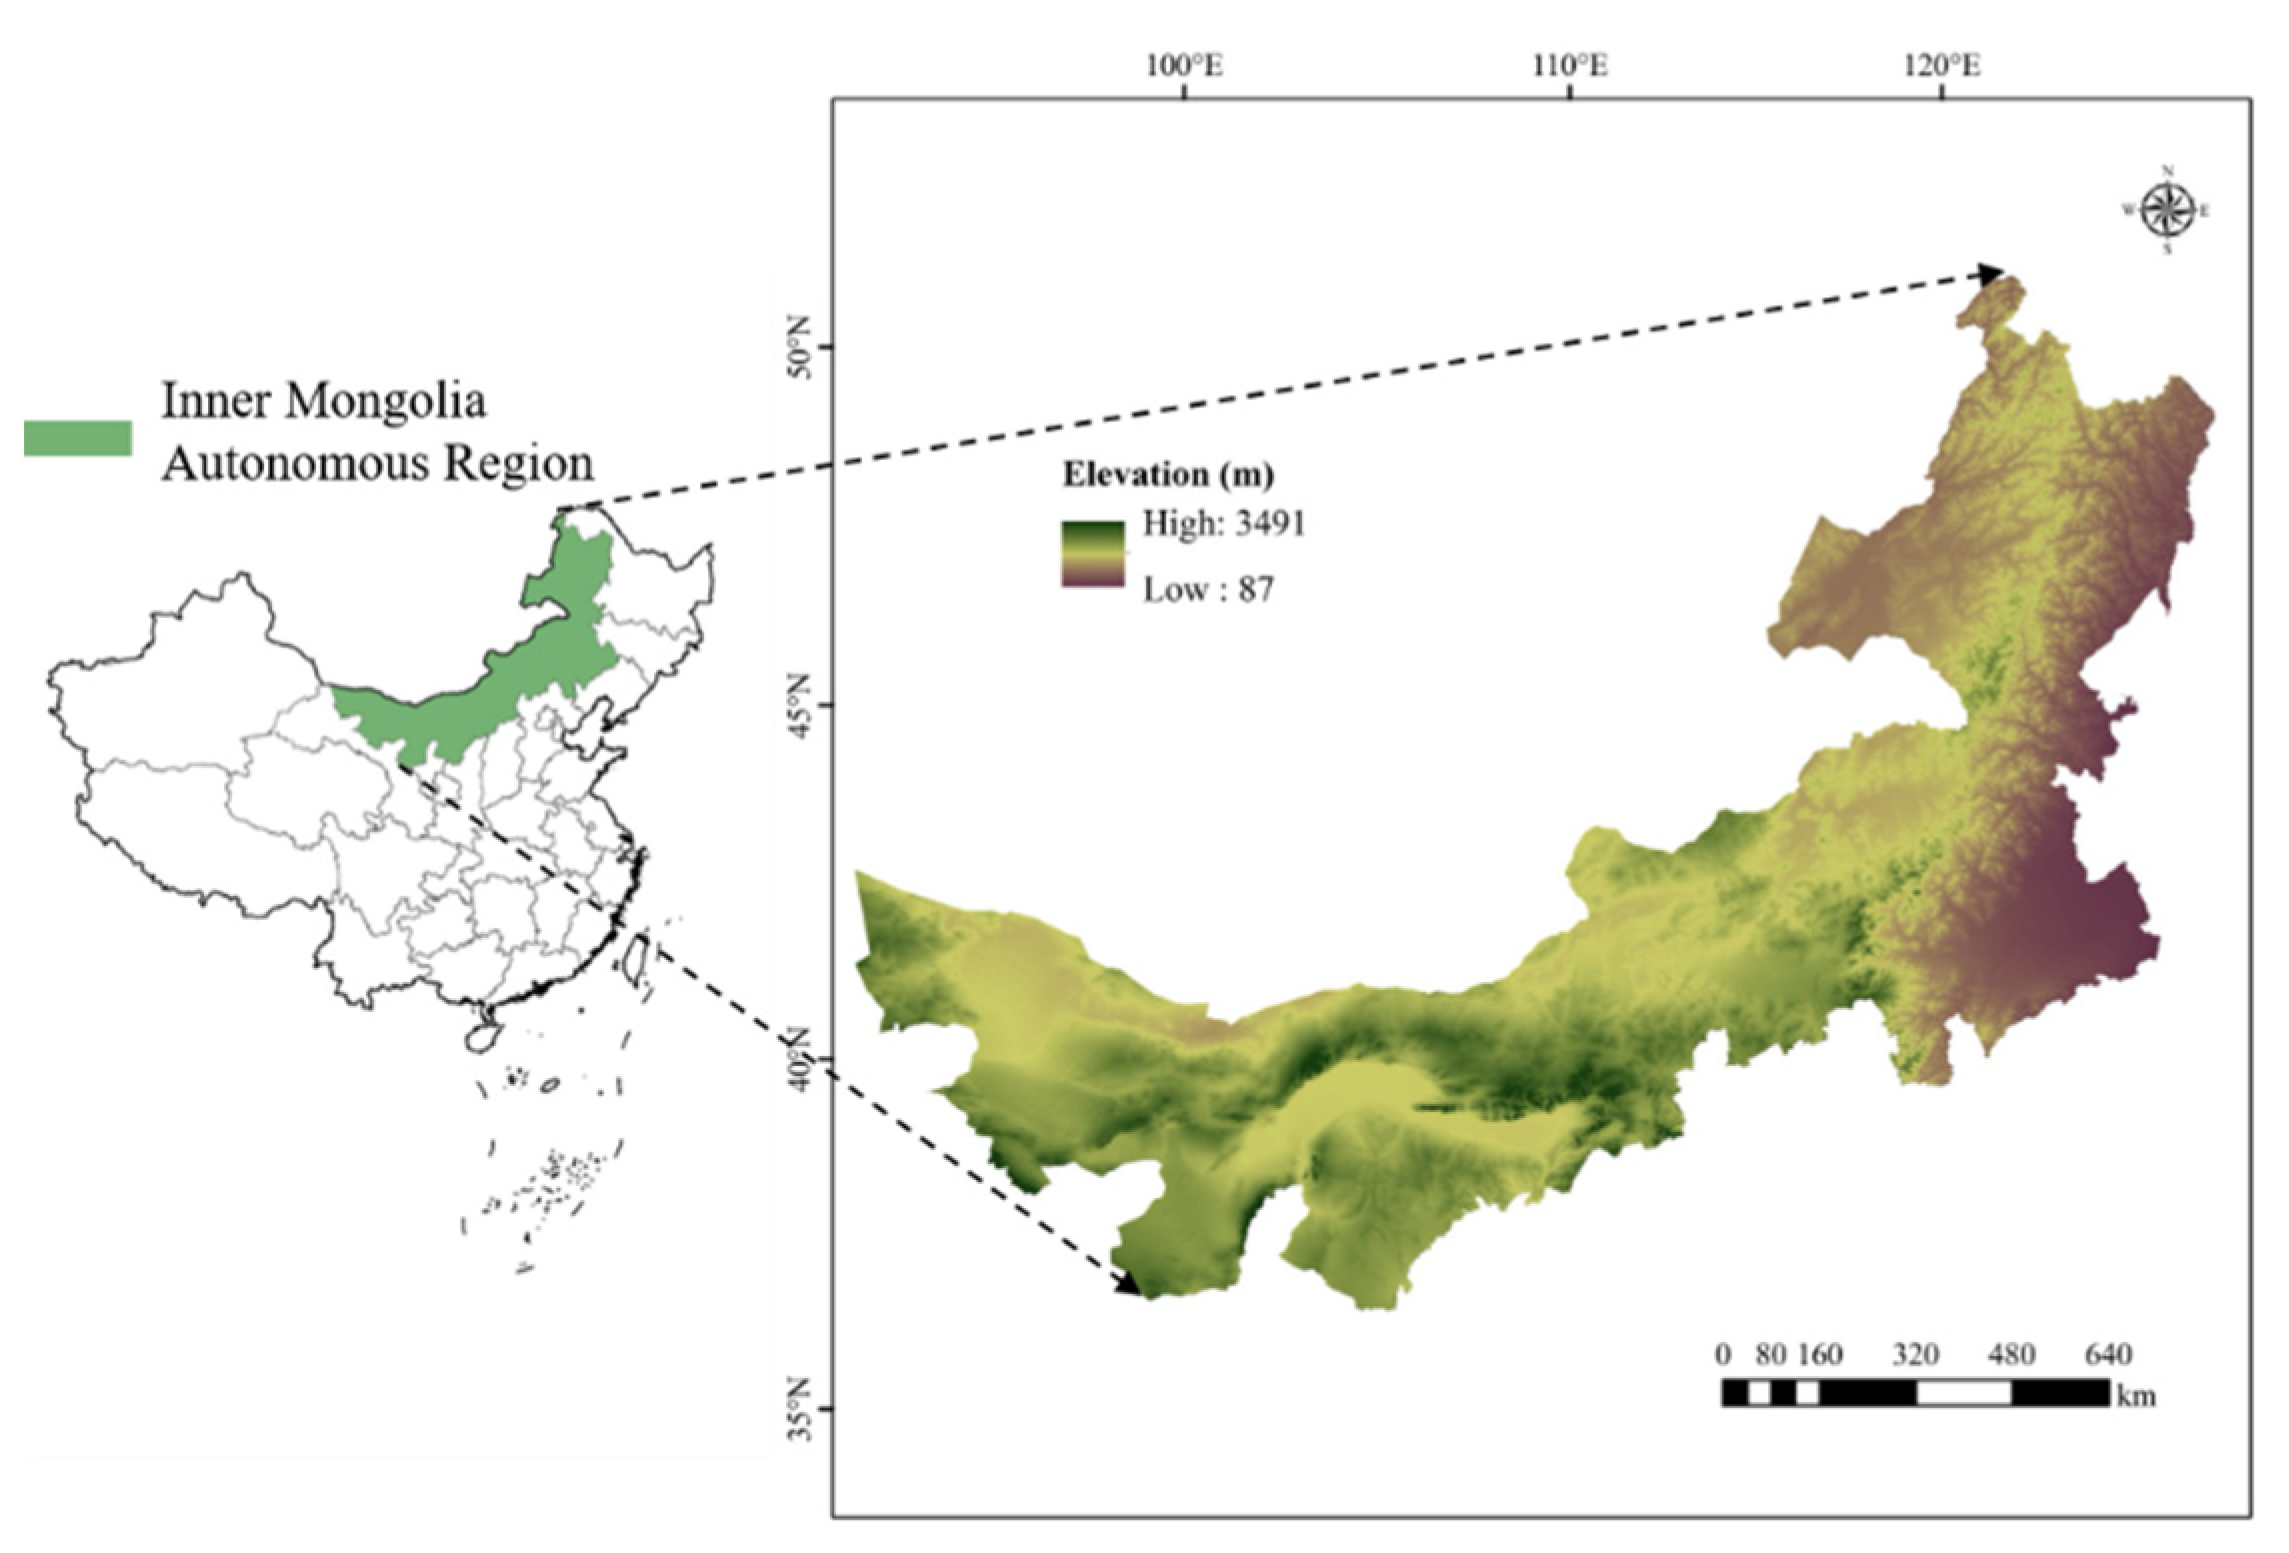
2.1. Study Area

Inner Mongolia is located in northern China (37° N~53° N, 97° E~126° E); it is one of the largest arid and semiarid regions in the world and an important ecological barrier in northern China. The grassland covers an area of 8.8 million km2, accounting for 22% of the total grassland in the country [20]. It is also the main livestock production base. Due to unreasonable land use, such as overgrazing, the landscape pattern has changed greatly, and the resulting ecological impacts are serious [16]. To protect the grassland ecosystem, it is necessary to study the landscape pattern of Inner Mongolia and its influencing factors at the county scale. Inner Mongolia is 2400 km from the east to west and 1700 km from the north to south, covering an area of 1.18 million km2 (Figure 1). The elevation gradually decreases from southwest to northeast, and there is a significant hydrothermal gradient. The altitude is 700–1400 m, and the climate is mainly a temperate continental monsoon climate. The annual average temperature is −2~6 °C, and the annual average precipitation is 40–450 mm [16]. Due to the gradients in rainfall and temperature, the vegetation types, from west to east, are desert, grassland, and forest [21]. We considered the county scale as the spatial unit; there are 101 counties, of which the largest county is Ejin Banner (82,159.5 km2), and the smallest county is Erenhot city (488.2 km2).

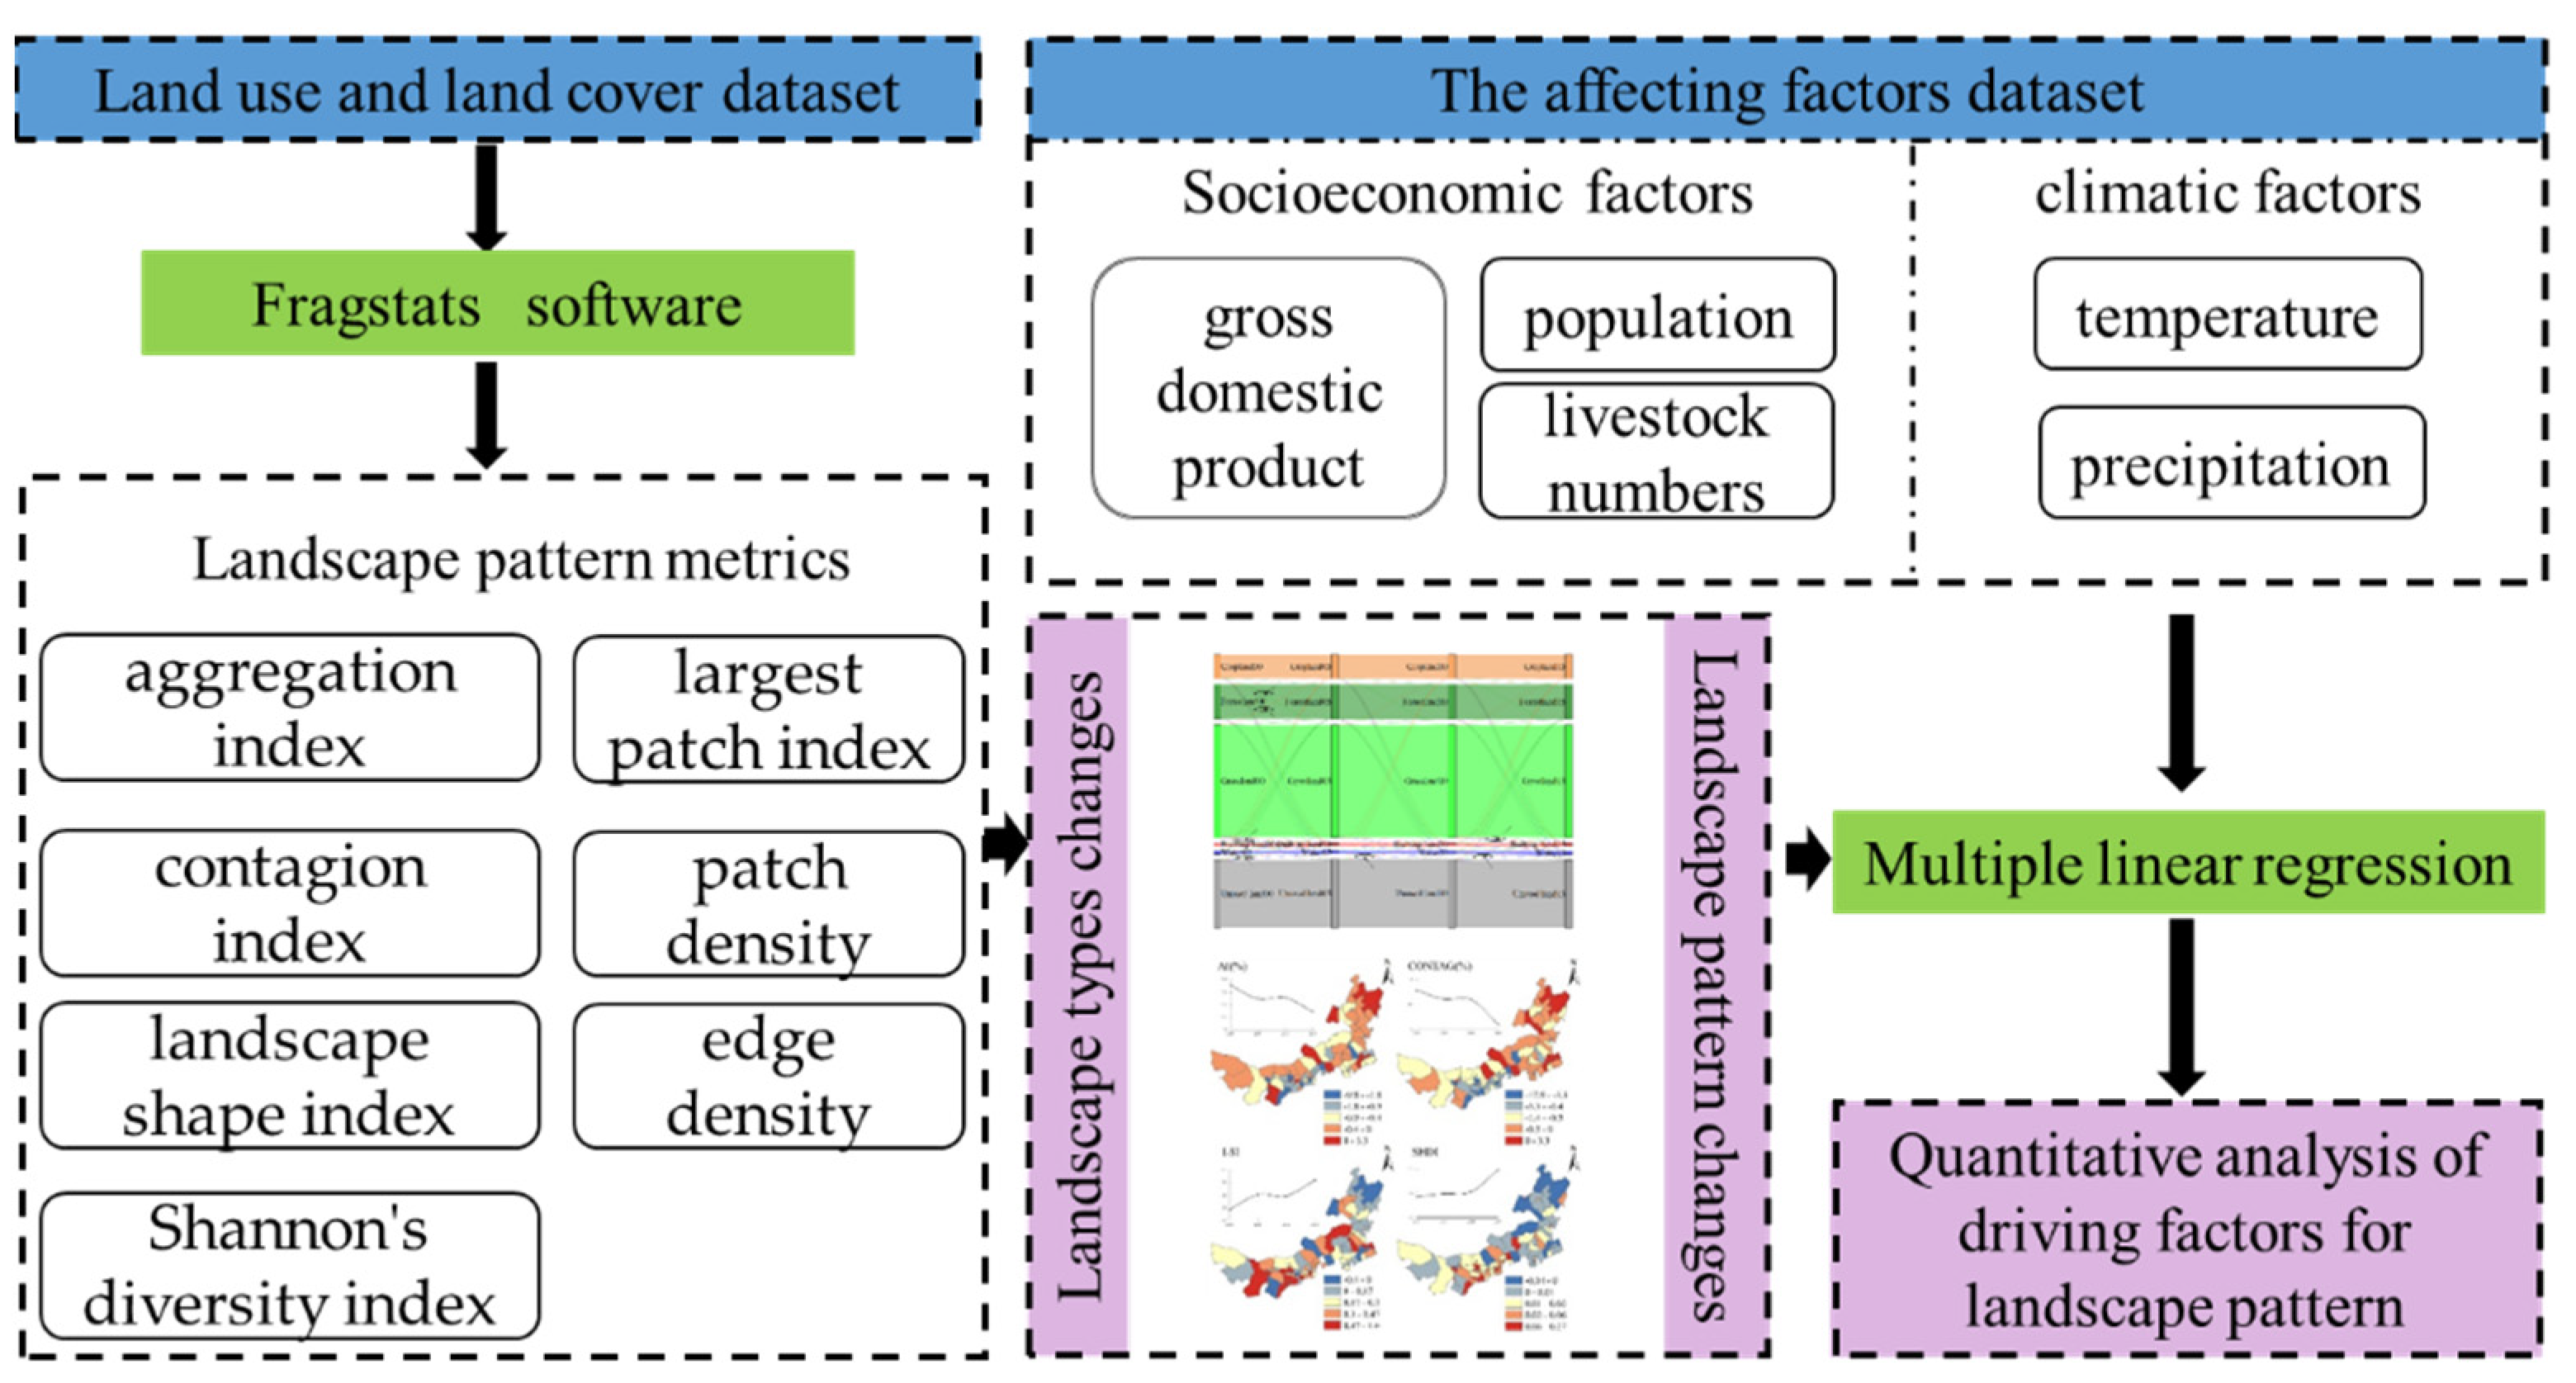
2.2. Methodological Framework

The methodological framework used for analyzing landscape patterns and their driving factors is shown in Figure 2. Land use data, socioeconomic data, and climate data were basic data. Landscape indices were used to assess landscape patterns and multiple linear regression was used to analyze impact factors.

2.2.1. Data Sources and Processing

The land use data used in this paper (2000/2005/2010/2015) came from the Chinese Academy of Sciences Resource and Environmental Science Data Center (http://www.resdc.cn/, accessed on 10 January 2022), and the resolution was 1 km. The land use types were divided into six categories: cropland, forestland, grassland, water, built-up land, and unused land. The annual average temperature and annual total precipitation data were from the National Earth System Science Data Center, National Science & Technology Infrastructure of China (http://www.geodata.cn, accessed on 12 March 2022 ), with a resolution of 1 km. The socioeconomic data of Inner Mongolia and its counties from 2000 to 2015, including population, gross domestic product (GDP), and livestock numbers, were from the Inner Mongolia Statistical Yearbook.

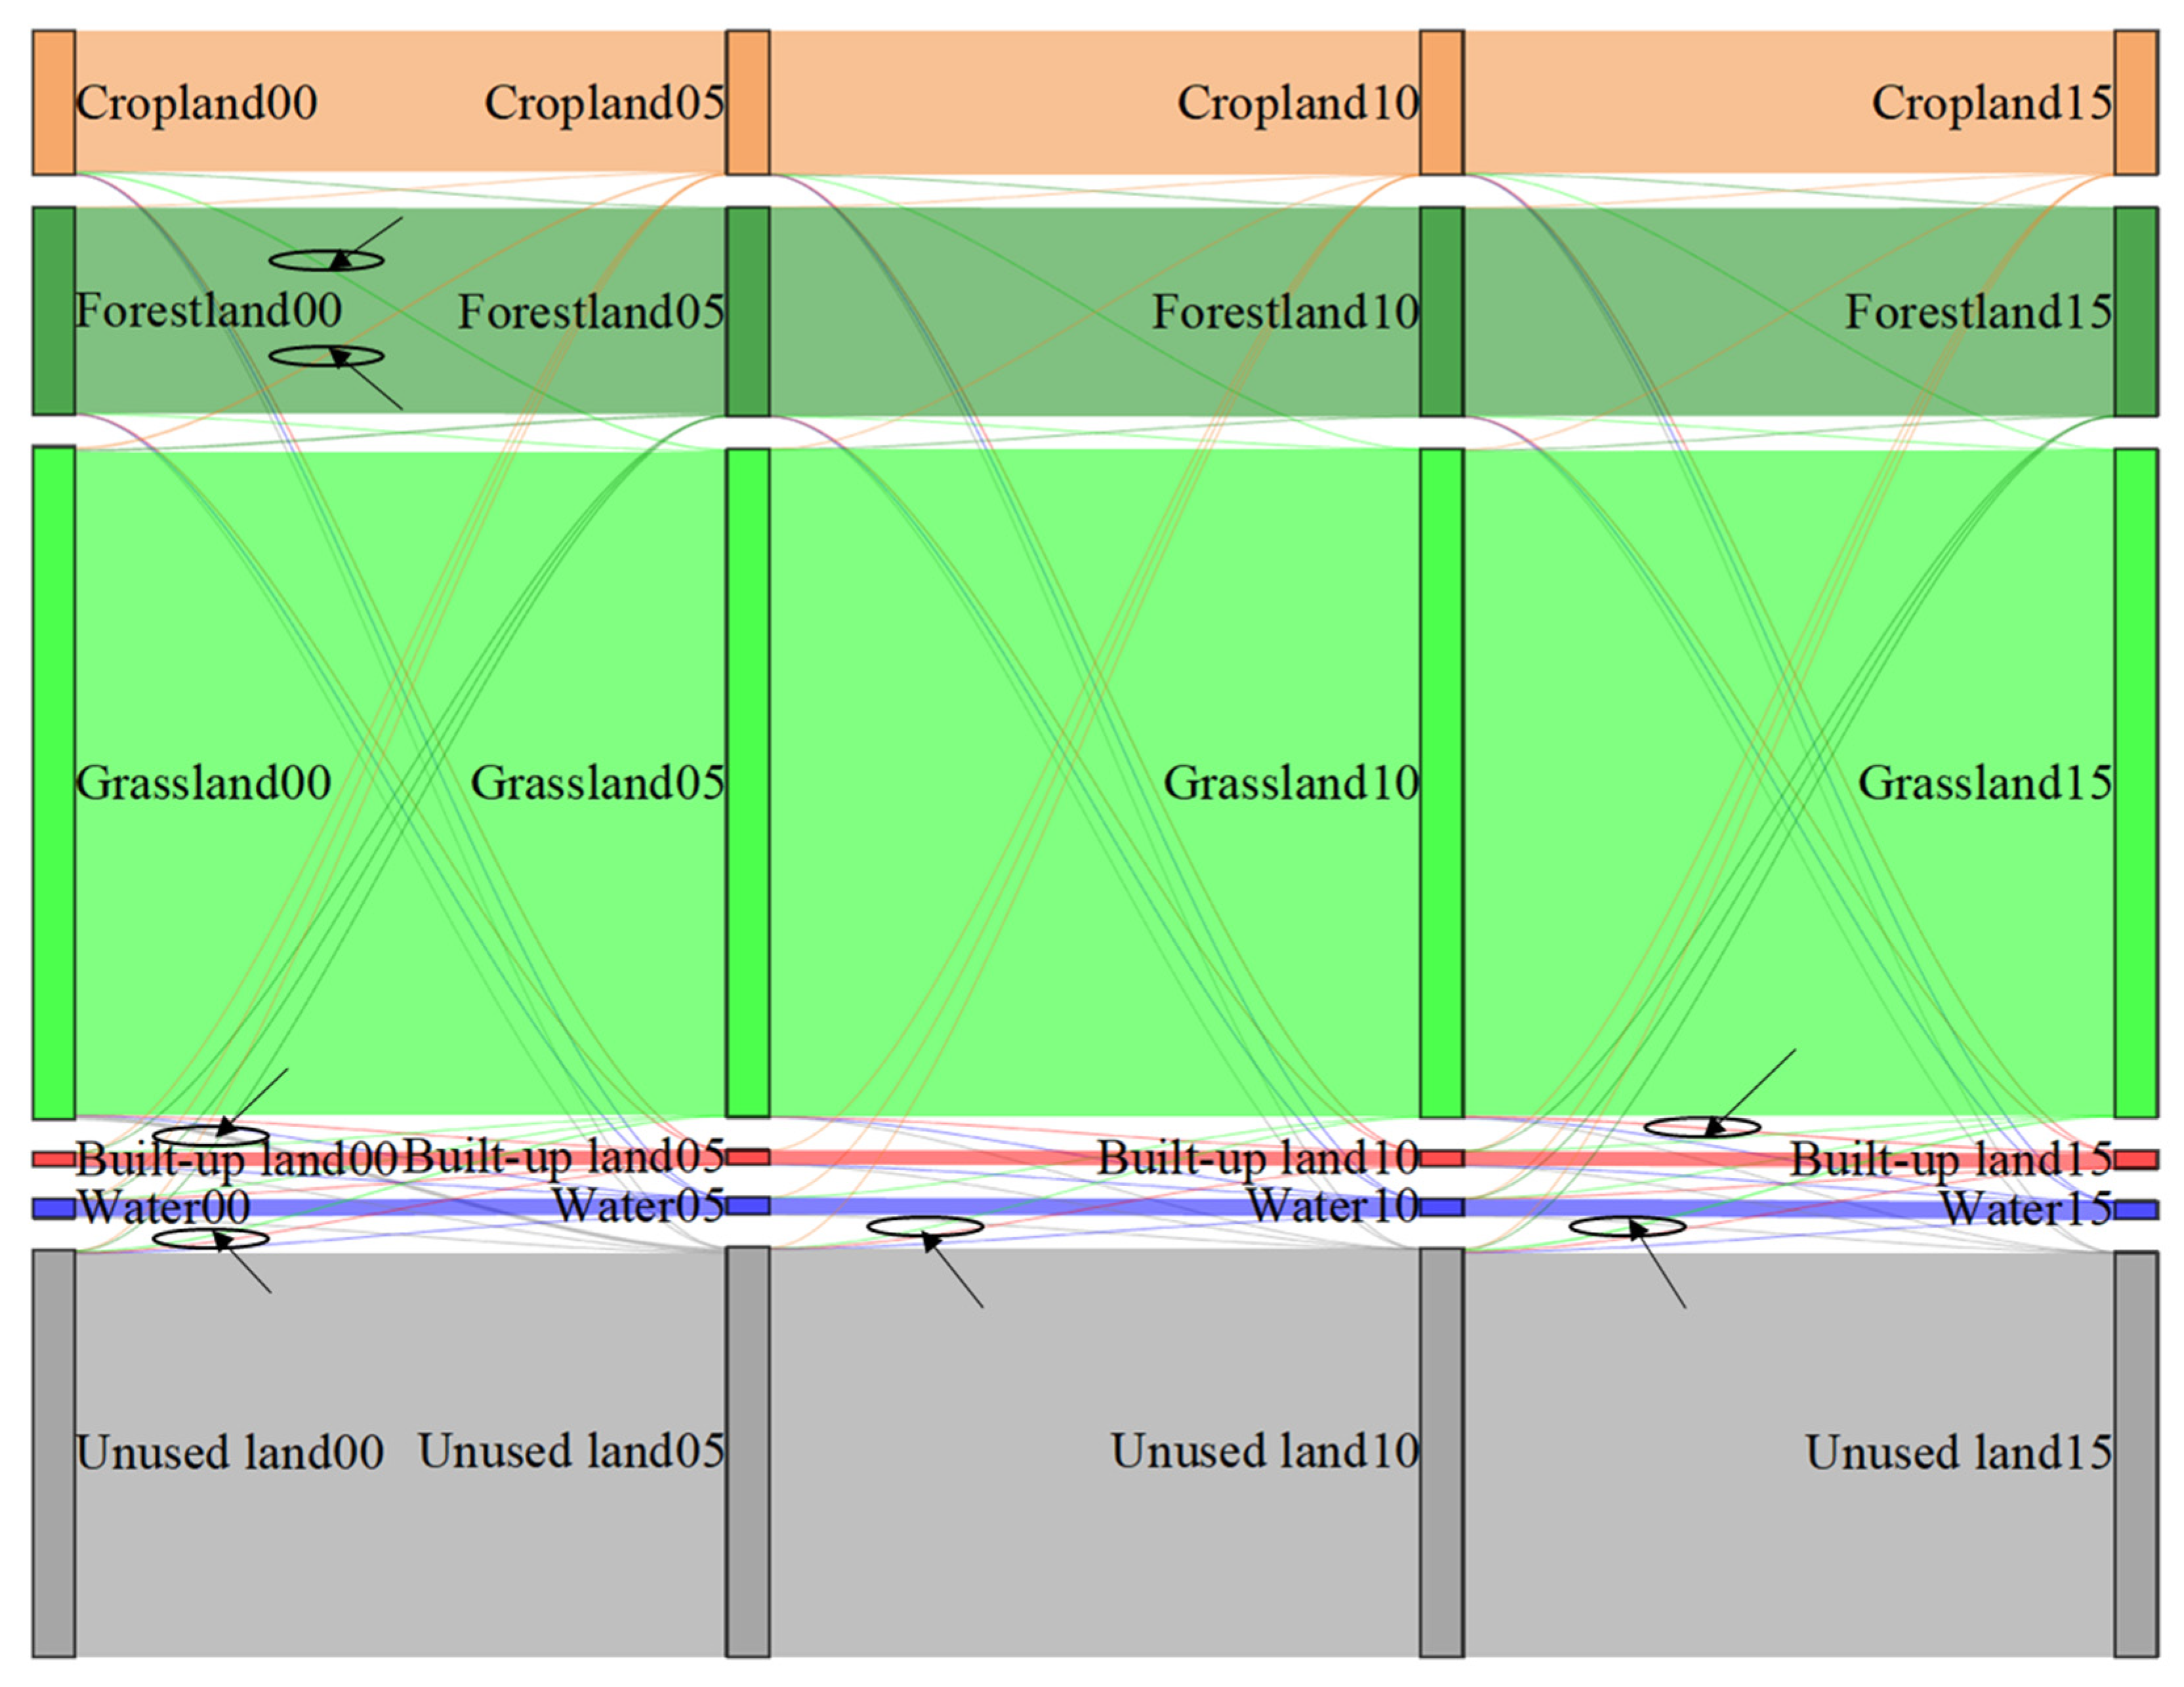
2.2.2. Transition Matrix of Landscape Types

The transition matrix refers to the transition between different landscape types within a certain period. In this study, the transition matrix quantitatively described the transformation of six landscape types, including cropland, forestland, grassland, water, built-up land, and unused land, in different periods (2000–2005, 2005–2010, 2010–2015, and 2000–2015). Furthermore, we created a landscape-type distribution map.

2.2.3. Landscape Pattern Changes

This paper analyzed the changes in landscape patterns at the class level and landscape level. The landscape index at the class level (cropland, forestland, grassland) selected the largest patch index (LPI), patch density (PD), and edge density (ED), and the landscape index at the landscape level selected the aggregation index (AI), contagion index (CONTAG), landscape shape index (LSI), and Shannon’s diversity index (SHDI). A detailed description of the landscape index is shown in Table 1. These landscape metrics represent different aspects of landscape patterns: aggregation (represented by LPI and AI), patch complexity (represented by PD, ED, and LSI), connectivity (represented by CONTAG), and landscape diversity (represented by SHDI) [22]. FRAGSTATS 4.2 software [23,24] was used to calculate the landscape metrics of each county in Inner Mongolia from 2000 to 2015 and to analyze the spatiotemporal distribution of the landscape pattern in Inner Mongolia.

2.2.4. Quantitative Analysis of Driving Factors for Landscape Pattern

Significant relationships between factors and landscape indices were determined by the multiple linear regression model [29,30]. The model included the following variables: the impact factors, which were the independent variables, and the landscape pattern indices, which were the dependent variables. The factors affecting the landscape patterns were divided into climate and human activities. Climate factors included the annual average temperature and total precipitation. Human activity factors included the population, GDP, and livestock numbers. The interannual changes in climate and socioeconomic variables in Inner Mongolia are shown in Figure S1 (Inter-annual variability of (a) precipitation and temperature, (b) population and GDP, and (c) livestock in the study area from 2000 to 2015). The average values of the data from 2000 to 2015 in the county of Inner Mongolia were used in the subsequent driving factor analysis.

3. Results

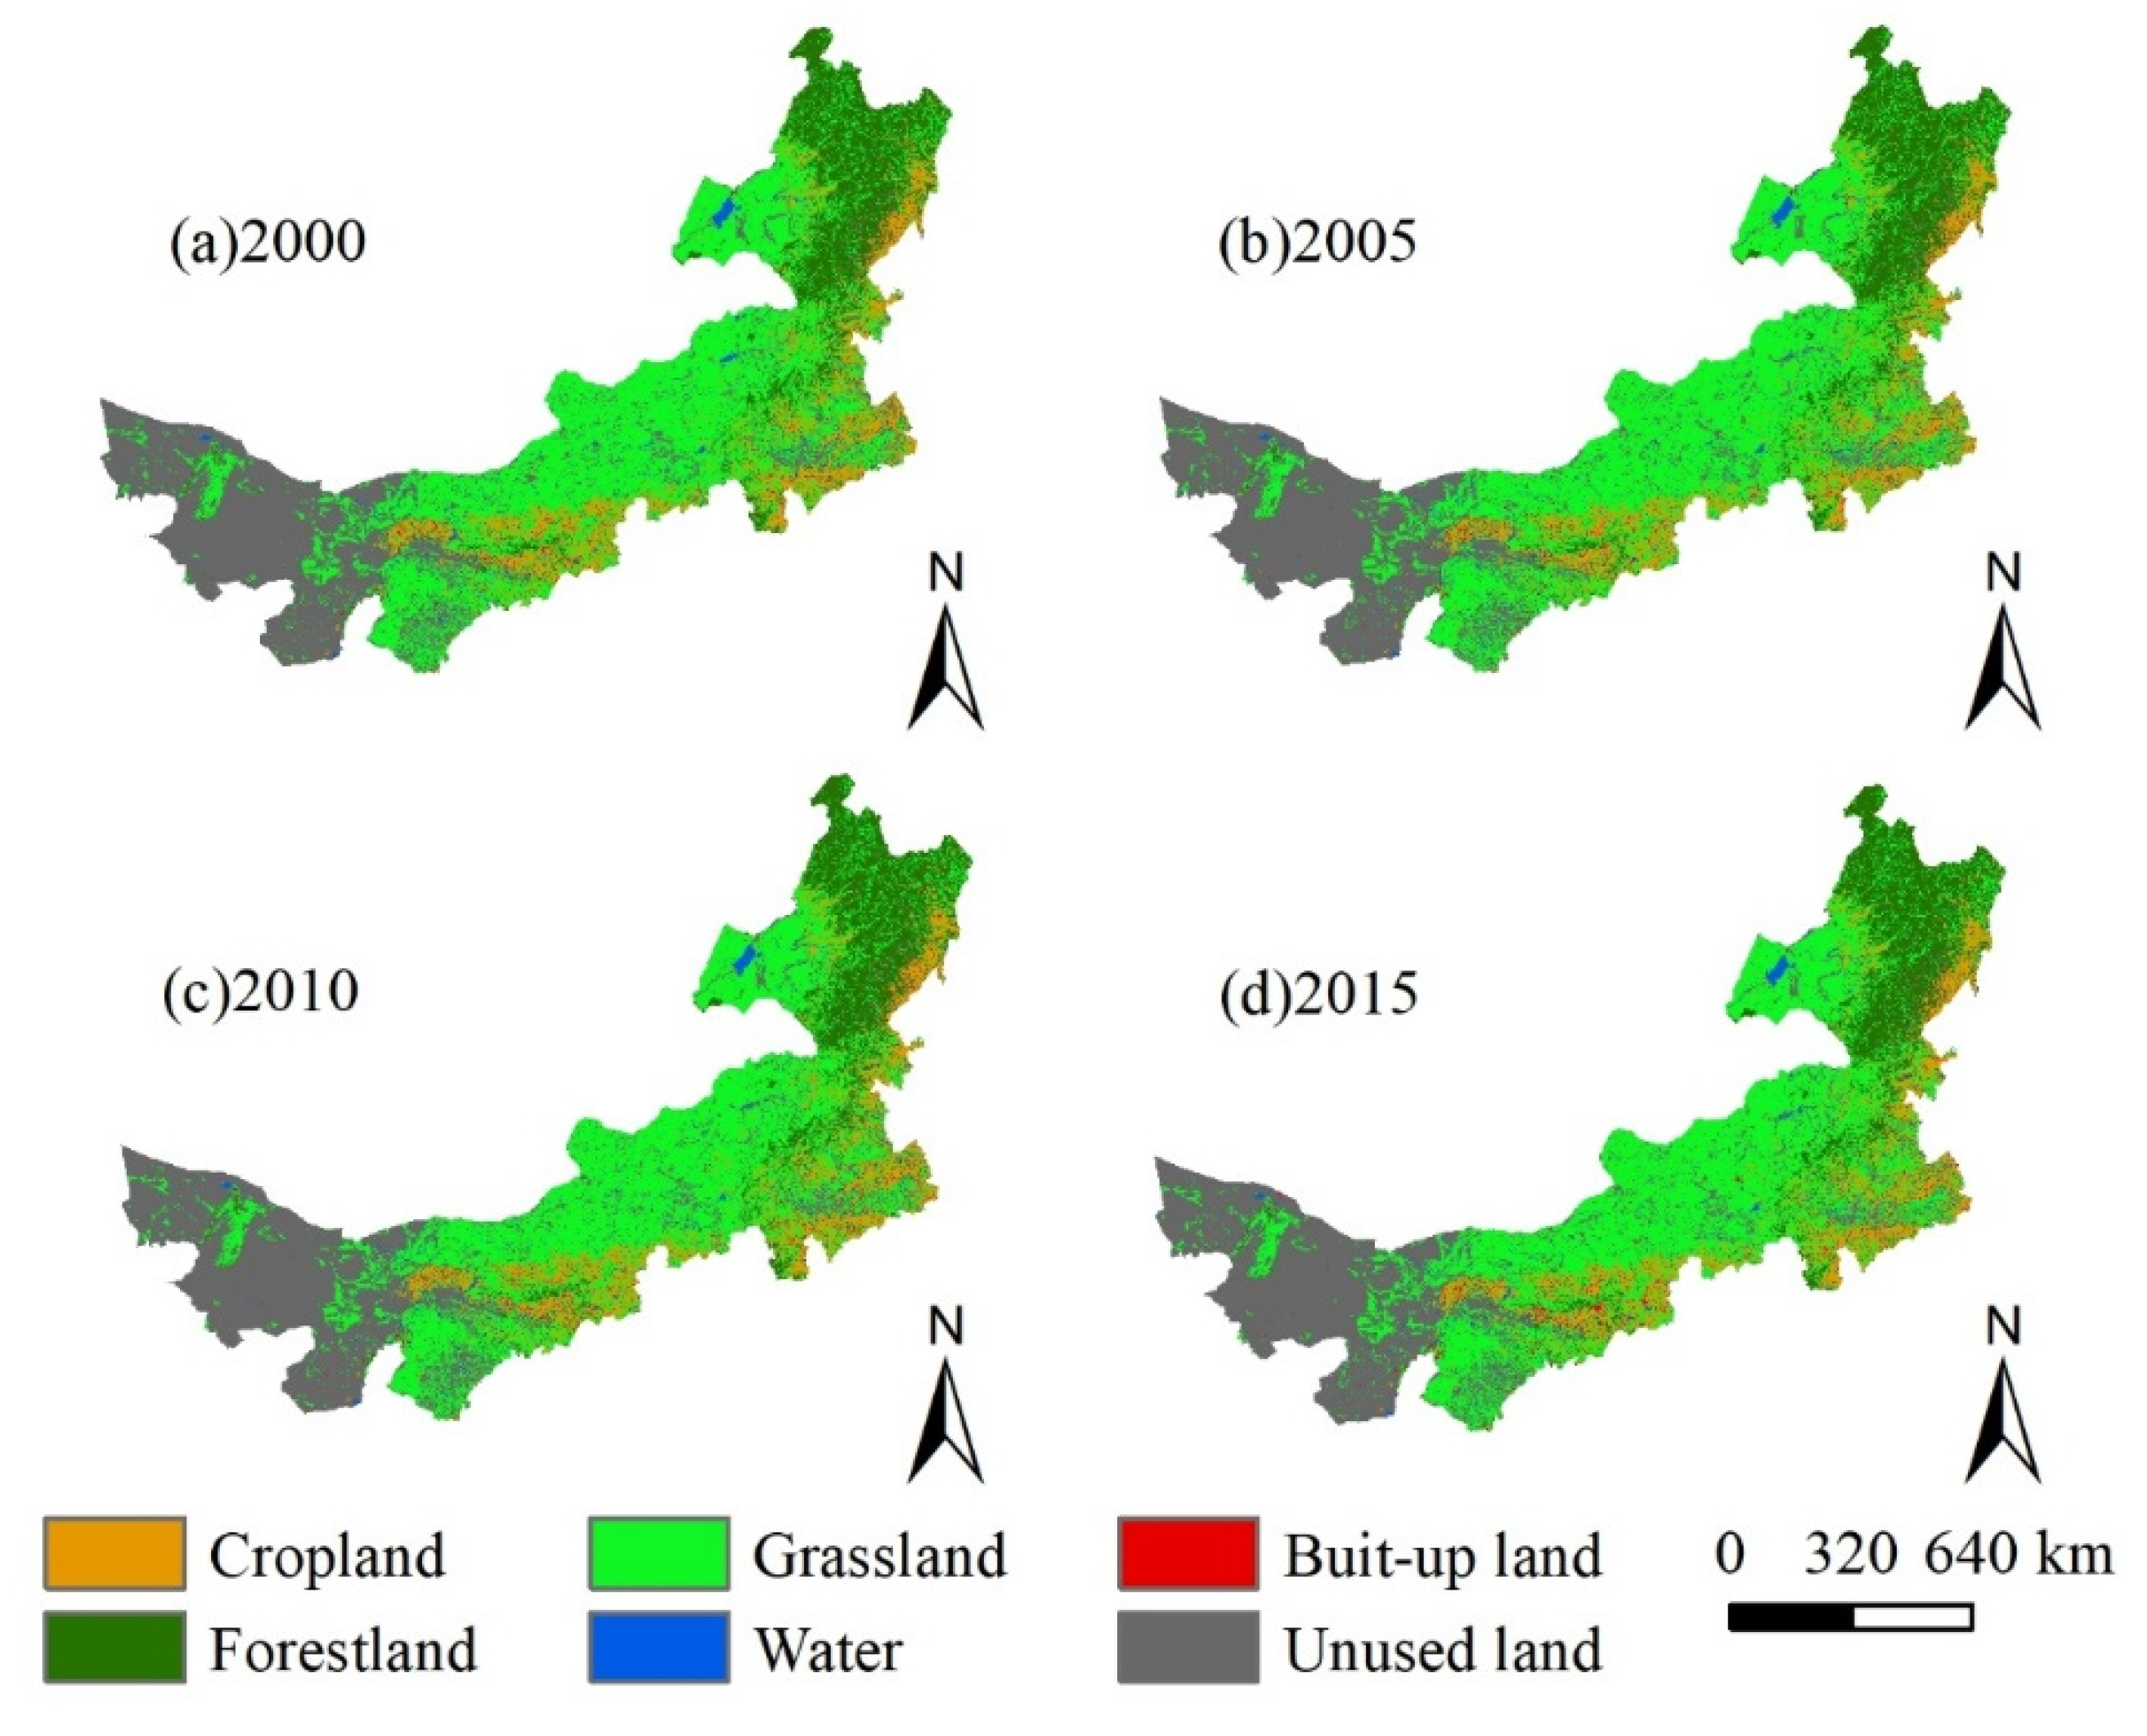
3.1. Spatiotemporal Changes in Landscape Types

The distribution of landscape types in Inner Mongolia from 2000 to 2015 is shown in Figure 3. According to the distribution map of landscape types, we obtained the transition matrix of landscape types by using the statistical analysis function of ArcGIS 10.2 (Table 2) and drew a Sankey diagram of the landscape type transition matrix from 2000 to 2015, which can more intuitively reflect the changes between different landscape types (Figure 4).
The distribution map of landscape types from 2000 to 2015 showed that grassland was mainly distributed in the three major grassland areas in central Inner Mongolia. Forestland, cropland, and unused land (barren land and desert) were mainly distributed in the northeast, south, and west of Inner Mongolia, respectively. The landscape type transition matrix can quantitatively reflect the transition between various landscape types. During the period from 2000 to 2015, there were transitions in and out of various landscape types, and the transition between the same landscape types was the main pattern. Among the different types of conversion, the main ones were the conversion between cropland and grassland and the conversion between grassland and unused land. From 2000 to 2015, the area of cropland converted to grassland was lower than that of grassland converted to cropland, and the cropland showed an expansion state. The conversion of unused land to grassland was 4101 km2, the conversion of grassland to unused land was 3338 km2, and the area of unused land decreased.
The curve of the Sankey diagram represents the transfer between landscape types, and the thickness of the curve represents the amount of transfer. The thicker the curve is, the greater the amount of transfer, and vice versa. According to the Sankey diagram, we found that a dramatic transformation occurred between grassland and cropland from 2000 to 2005 and between grassland and unused land from 2000 to 2015 (the black circles with arrows in Figure 4). Grassland decreased sharply, mainly converted to bare land and sandy land, and partly converted to cropland from 2000 to 2005 (Figure 4).

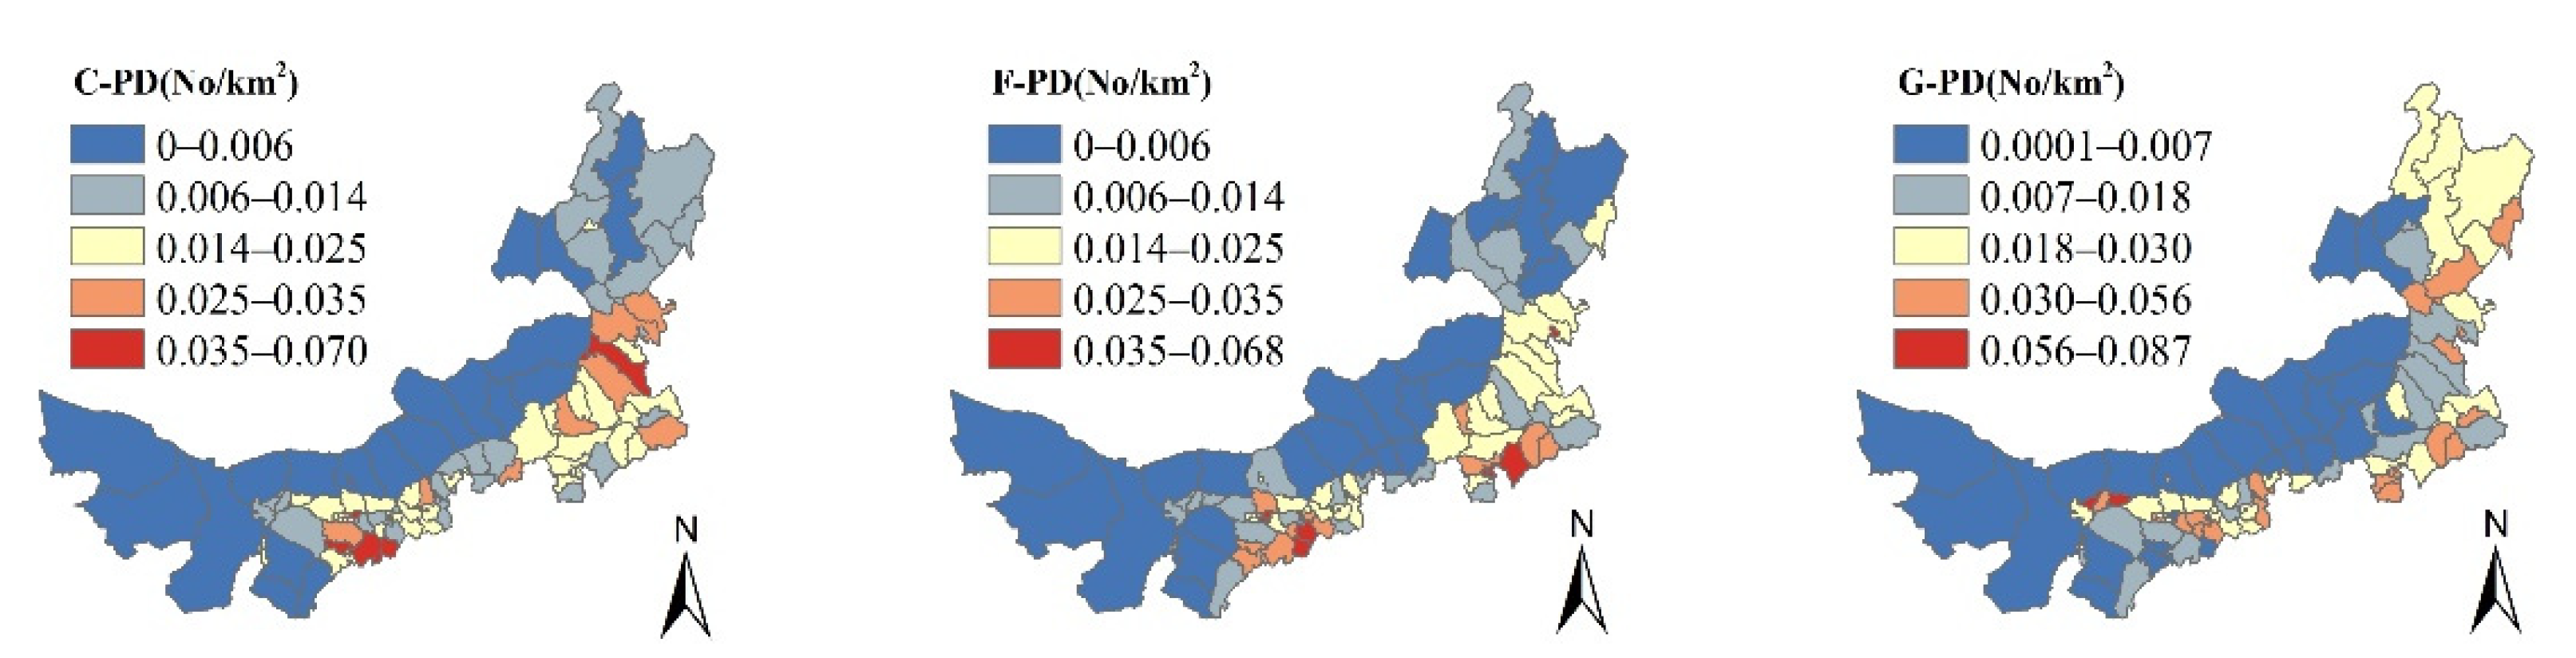
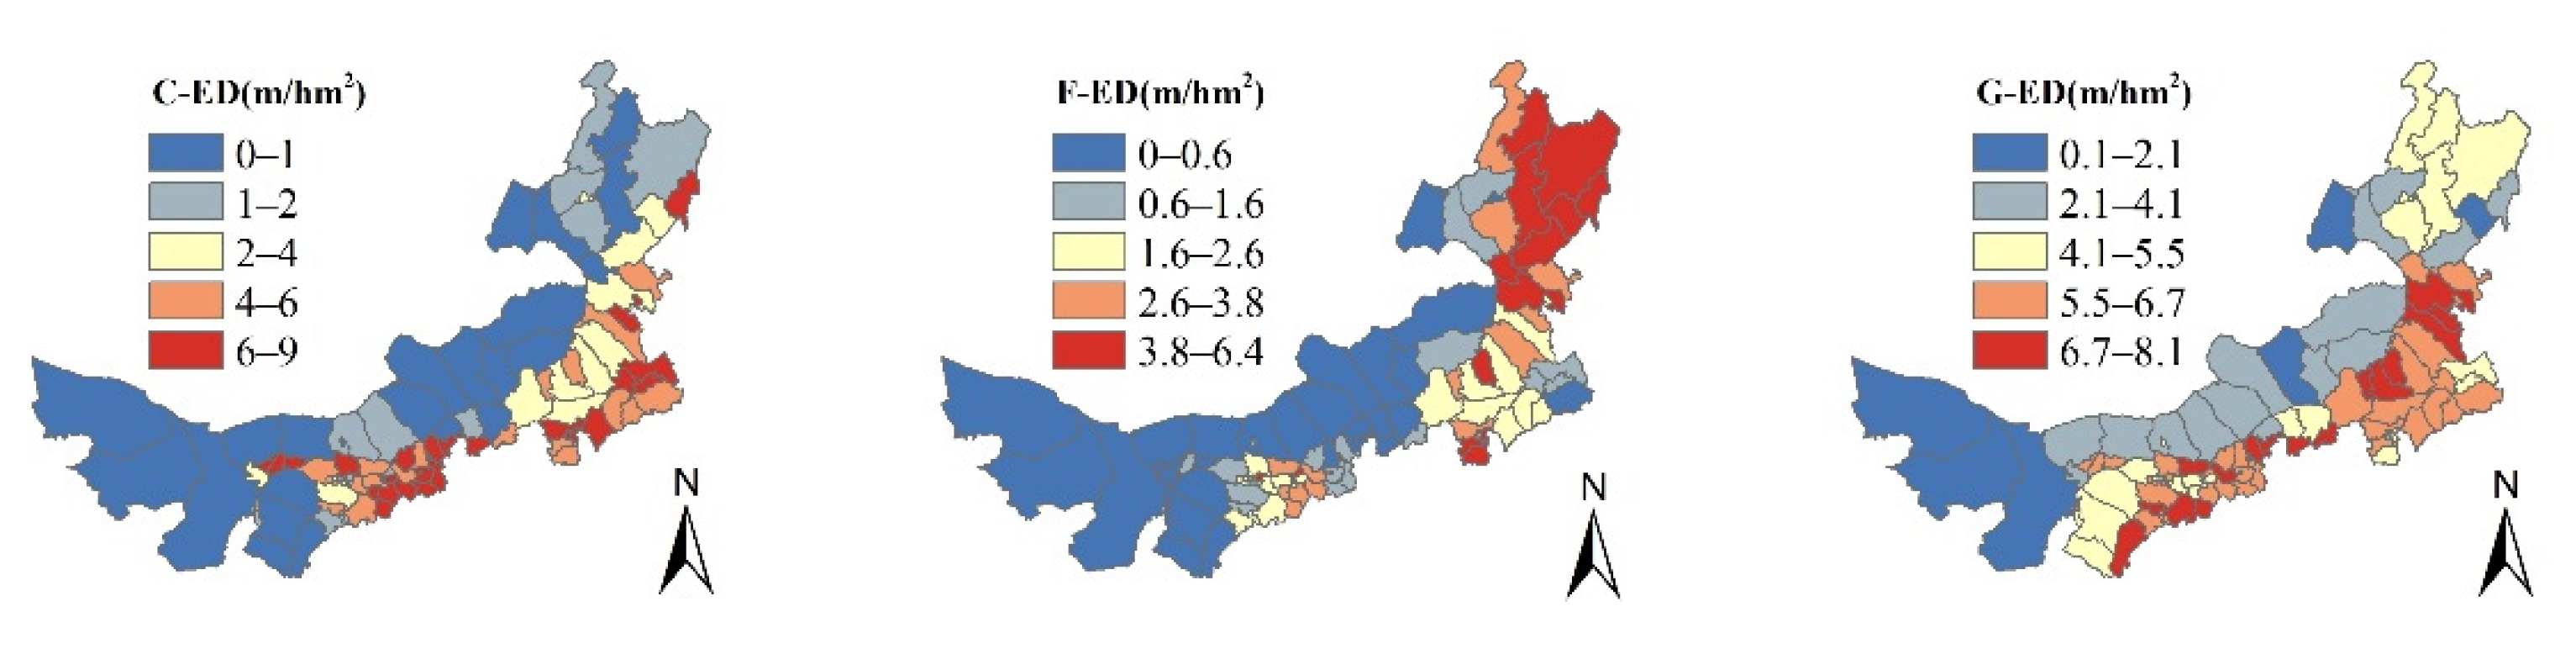
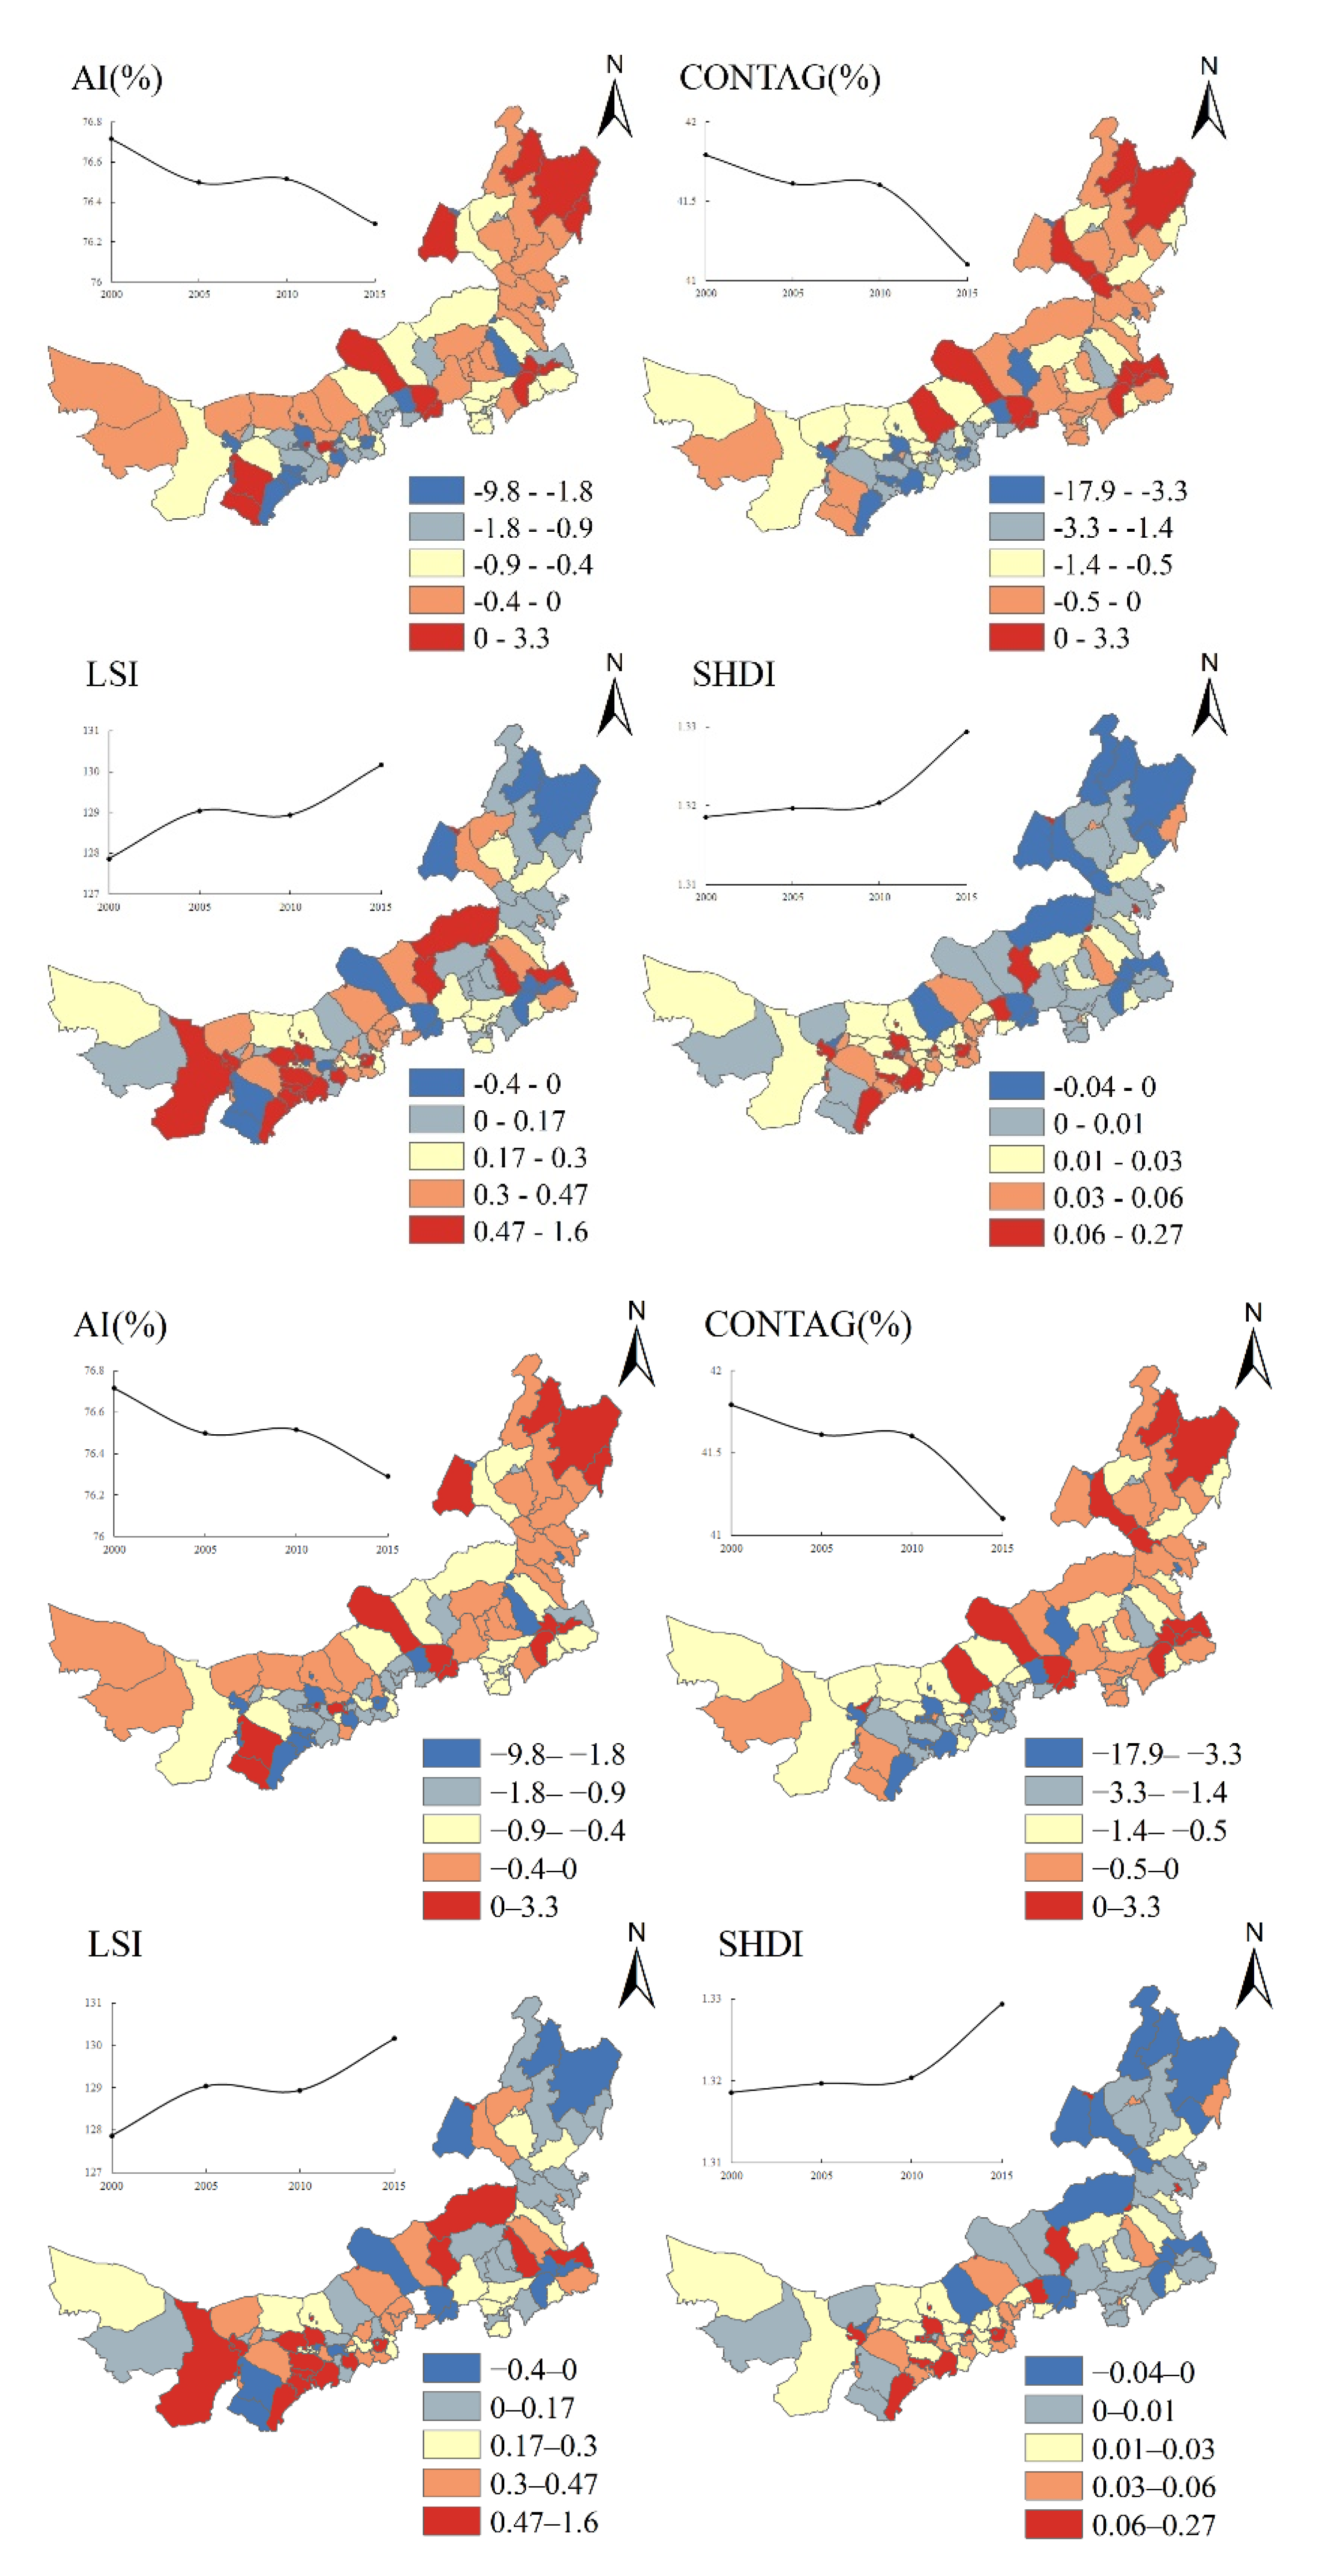
3.2. Spatiotemporal Changes in Landscape Pattern

We analyzed the landscape indices at the class level and landscape level to further understand the landscape pattern in Inner Mongolia. From 1995 to 2015, grassland was the most dominant cover in Inner Mongolia, followed by unused land, forestland, and cropland (Figure 3). The decrease in grassland area and the expansion of cropland were the main LUCCs in Inner Mongolia (Table 2). Grassland, forestland, and cropland were correlated with human activities. Therefore, we analyzed the landscape indices at the class level for three landscape types: cropland, forestland, and grassland; the results are shown in Figure 5, Figure 6, Figure 7 and Figure 8.
The spatial distribution of the LPI at the county scale in Inner Mongolia is shown in Figure 5 and Figure S2. The LPI of grassland was much higher than that of the other landscape types. The high-value area of cropland was distributed in the south, the high-value area of grassland was distributed in the middle, and the high-value area of forestland was distributed in the east, indicating that cropland, grassland, and forestland were the main landscape types in the south, middle, and east, respectively.
The spatial distribution of PD at the county scale in Inner Mongolia is shown in Figure 6 and Figure S3. The high-value areas of cropland and forestland were distributed in the southern part of Hinggan League, Tongliao, most counties of Chifeng, and part of Ordos city. The high-value areas of grassland were mainly distributed in Hulunbuir city in the northern region. The low-value areas of cropland, forestland, and grassland were mainly distributed in the Alxa League and Xilingol League regions.
The spatial distribution of ED at the county scale in Inner Mongolia is shown in Figure 7 and Figure S4. The low-value areas of cropland were distributed in northwestern Inner Mongolia, mainly Alxa, Xilingol League, and Hulunbuir city, and the high-value areas were distributed in the southeast. The low-value areas of forestland were mainly distributed in Alxa and Xilingol League, and the high-value areas were mainly distributed in the eastern region. The low-value areas in the grassland were distributed in the northwest, and the high-value areas were distributed in the southeast.
The temporal and spatial dynamic changes in the landscape indices at the landscape class level at the county level in Inner Mongolia from 2000 to 2015 are shown in Figure 8. The LPI of cropland first increased and then decreased from 2000 to 2015. The LPI of forestland decreased significantly in 2005 and then became relatively stable. The LPI of grassland decreased gradually, indicating that the dominance of grassland in the study area decreased. However, the LPI of grassland was still the highest among the landscape types, indicating that grassland was the main landscape type in Inner Mongolia. The PD of the grassland was the highest, indicating that the grassland was more fragmented. The PD of cropland and grassland did not change significantly, while the PD of forestland changed the most, increasing in 2005 compared with 2000, indicating increased fragmentation. The ED increased with time.
The spatial distributions of landscape indices (AI/CONTAG/LSI/SHDI) at the landscape level at the county scale in Inner Mongolia are shown in Figure 9 and Figure S5. The high-value areas of AI and CONTAG were distributed in the northwest, and the main landscape types were grassland, forestland, and desert. This area is relatively less affected by human activities, and the aggregation and connectivity of landscape patches were relatively good. The low-value areas were distributed in the southeast, and the main landscape types were cropland, grassland, and built-up land. The high-value area of the LSI was distributed in the east, indicating that the eastern landscape had a high degree of complexity, and the low-value area was distributed in the desert. The low-value area of the SHDI was in the northwest, where the landscape type is single forestland, grassland, or desert. The southeast has a mixture of built-up land, cropland, and grassland, so the SHDI value was higher and the diversity was greater.
The temporal and spatial dynamic changes in the landscape indices at the landscape level at the county level in Inner Mongolia from 2000 to 2015 are shown in Figure 10. By comparing the values of these landscape metrics in 2000 and 2015, we found that the AI and CONTAG showed a decreasing trend from 2000 to 2015, indicating that the landscape patches were dispersed and that the connectivity of the landscape worsened. The LSI and SHDI showed an increasing trend from 2000 to 2015, indicating that the landscape shape became complicated, the landscape heterogeneity increased, and the distribution of each landscape type became increasingly uniform. The growth of the SHDI was the fastest from 2010 to 2015.

3.3. Quantitative Analysis of the Relationships between Landscape Pattern Evolution and Driving Factors

Climatic and socioeconomic factors explained 39%, 38%, and 42% of the variability in C-LPI, F-LPI, and G-LPI, respectively (Table 3). The C-LPI was significantly negatively correlated with GDP and livestock (p < 0.01) and significantly positively correlated with the population (p < 0.01) and temperature (p < 0.05). The F-LPI was significantly negatively correlated with temperature (p < 0.001). The G-LPI was significantly positively correlated with GDP (p < 0.01) and livestock (p < 0.001) and significantly negatively correlated with the population (p < 0.001) and temperature (p < 0.05). Climate and socioeconomic factors accounted for 26%, 39%, and 32% of the variability in C-PD, F-PD, and G-PD, respectively. There was a significant positive correlation between climatic factors and C-PD and F-PD (p < 0.001). There was a significant positive correlation between GDP and C-PD (p < 0.01). Livestock was significantly negatively correlated with F-PD (p < 0.001). There was a significant positive correlation between population and G-PD (p < 0.001) and a significant negative correlation between GDP (p < 0.05), livestock (p < 0.001), and G-PD. Climatic and socioeconomic factors explained 41%, 40%, and 28% of the variability in C-ED, F-ED, and G-ED, respectively. There was a significant positive correlation between climatic factors and C-ED and G-ED (p < 0.01). Among socioeconomic factors, the population was significantly positively correlated with C-ED (p < 0.001) and F-ED (p < 0.05), GDP was significantly negatively correlated with C-ED (p < 0.01), and livestock was significantly negatively correlated with F-ED (p < 0.05).
Climate and socioeconomic factors influenced the LSI/CONTAG/AI/SHDI, which explained 60%, 50%, 49%, and 48% of the variability, respectively (Table 4). Livestock and precipitation were significantly positively correlated with the LSI (p < 0.001). Population and climate factors were all significantly negatively correlated with CONTAG (p < 0.001), and livestock was significantly positively correlated with CONTAG (p < 0.001). Climate factors were significantly negatively correlated with the AI (p < 0.001), the population was significantly negatively correlated with the AI (p < 0.001), and livestock was significantly positively correlated with the AI (p < 0.05). The SHDI was significantly positively correlated with climatic factors and population (p < 0.001) and was significantly negatively correlated with livestock (p < 0.05).

4. Discussion

Understanding the spatial and temporal dynamics of the landscape pattern in Inner Mongolia and its influencing factors can help identify regional sustainable development strategies [16]. We quantified the landscape index at the county level and quantified the relationships between the landscape index and multiple factors. We found that the overall landscape of Inner Mongolia has become more dispersed in structure (increased PD and ED and decreased AI) and more complex in shape (increased LSI) since 2000. Climatic and socioeconomic factors have had important impacts on landscape patterns. Previous studies on landscape patterns and driving factors have focused mostly on a single spatial range, analyzing the temporal differentiation of the landscape pattern, and few studies have focused on spatial differentiation. The analysis of driving factors has been mostly qualitative, and these approaches cannot determine the contribution of different influencing factors [7,13,31]. In this study, we carried out a quantitative study on the driving factors of different temporal and spatial scales through the multiple linear regression of the county’s landscape pattern, county-level statistical data, and meteorological data, which has good practical significance.

4.1. Spatial Variation in Land Use, Land Cover, and Landscape Pattern

Shortly after the implementation of the Grain to Green Program, grassland still showed a decreasing tendency from 2000 to 2005 (Table 2). The conversion of different landscape types from 2000 to 2015 mainly occurred between grassland and cropland, unused land, and built-up land. Due to the implementation of the Western Development Strategy and to meet the material needs of the increasing population, there has been extensive land reclamation, and, with the development of cropland, the result was the degradation and reduction of grassland with an increase in cropland, built-up land, and unused land [32,33]. The fragmentation and homogenization of landscape patterns contributed to the encroachment of cropland and built-up land on grassland.
In the time series, the increase in population and livestock from 2000 to 2015 led to an increase in the demand for food, the expansion of cropland, and overgrazing, which led to a gradual decline in the LPI-G and the decreased degree of grassland landscape dominance, which became the main reason for the decrease in grassland area (Figure S1 and Figure 8). Because the landscape structure was complex and the degree of fragmentation was high in Hulunbuir, the PD value of the grassland was high. The Alxa landscape was dominated by desert, and the Xilingol League landscape was dominated by grassland. The landscape pattern here was relatively complete, and the degree of fragmentation was low, so the PD values of cropland, grassland, and forestland were low. Compared with cropland and grassland, the PD of forestland changed the most, indicating that forestland was susceptible to environmental influences. During the 1990s–2000s, China’s grassland decollectivization and privatization policies changed the grazing style from nomadic to sedentary pastoralism, leading to the fragmentation of the grassland landscape [34].
The AI and CONTAG were relatively large, while the LSI and SHDI were relatively small in the northwest. However, this pattern was reversed in the southeast. This result indicated that the landscape in the southeast area was more heterogeneous and fragmented than the landscape in the northwest area, with a higher interference and lower dominance [35]. The southeast area should be taken seriously by relevant stakeholders. The SHDI of grassland mostly increased. The heterogeneity of grassland may be enhanced due to uneven degradation or cultivation of artificial grasslands [14]. CONTAG is related to the degree of fragmentation at the landscape level [36]. CONTAG decreased from 2000 to 2015, indicating that the fragmentation degree of the landscape in Inner Mongolia increased, the connectivity of various landscape types was weakened, and the exchange function of matter and energy among landscapes was weakened [37]. To alleviate or even reverse landscape fragmentation in Inner Mongolia, we suggest that the government pay attention not only to regional economic development but also to the sustainable development of the ecosystem.

4.2. Relative Influence of Climatic Factors and Human Activities on Landscape Pattern Evolution

In terms of spatial differentiation, in the area with a higher population, the LPI of cropland increased, and in the area with more livestock, the LPI of grassland increased, and the LPI of cropland decreased (Table 4), which was related to the land use patterns of different areas. To achieve the goal of economic development, urbanization will expand, and the increase in cities will lead to the reduction of cropland, so GDP was significantly negatively correlated with C-LPI [37]. The increase in precipitation helps to alleviate the shortage of water for vegetation growth, and it helps to convert bare land into grassland. The increase in temperature also helps the vegetation growth of cropland, forestland, and grassland. Therefore, temperature and precipitation were significantly positively related to the PD and ED of most croplands, forestlands, and grasslands [3]. The significant positive correlation between population and G-PD and C-ED was due to the fragmentation of grassland and cropland that has been exacerbated by human activities.
The significant positive correlation between livestock and the LSI showed that the LSI was easily affected by grazing, and the more livestock there were, the more irregular the LSI was. The significant negative correlation between population and the CONTAG, AI, and SHDI showed that as the population increased, landscape fragmentation increased and landscape diversity strengthened, which was consistent with the study by Xin et al. (2020) [38]. The driving factor analysis found that the change in landscape patterns in the study area was the result of the combined actions of natural and socioeconomic factors. Although climate had a certain influence on the landscape-level landscape index, socioeconomic factors were the key driving factors leading to the change in the landscape indices, which was consistent with the study by Xia et al. (2020).

4.3. Limitations

Although this study quantitatively evaluated the landscape pattern of Inner Mongolia and analyzed the influencing factors, thus providing a systematic integration and deepening of previous studies, there are still several limitations. We selected relatively important landscape indices based on previous research and combined them with the ecological significance of landscape indices, but there are inevitably missing indices. Therefore, in future research, the principal component analysis and other methods can be used to select appropriate landscape indices [39]. This study quantitatively analyzed the impacts of climate and socioeconomic factors on landscape patterns, and only qualitatively describes the impacts of policies. A quantitative analysis of policy factors should be added to follow-up research. Landscape patterns have major influences on the provision of ecosystem services and policy interventions [4]; therefore, the relationship between landscape patterns and ecosystem services should be given more attention in the future, which can provide scientific guidance to better maintain and manage ecosystem services for the sustainable development of ecosystems.

5. Conclusions

This paper assessed landscape patterns at the county level based on a time series of land use data from 2000 to 2015 and revealed its spatial variation. In addition, we analyzed climatic factors and socioeconomic factors that were responsible for this variation. The conclusions are as follows:
(1)
From 2000 to 2005, cropland showed a trend of expansion, mainly from the conversion of grassland. Policies, such as the Grain to Green Program, have increased the area of forestland and converted unused land into grassland, slowing grassland degradation. However, population growth and economic development have also led to the conversion of grassland into built-up land, and the area of grassland is still declining.
(2)
The landscape pattern in the northwest area was relatively concentrated, with good connectivity, low fragmentation, and relatively regular landscape shapes. The southeastern area had a complex landscape structure and a high SHDI. Moreover, the landscape was more fragmented and heterogeneous. Therefore, we thought that spatial heterogeneity should be considered in land use management and policy making.
(3)
This study showed that the higher precipitation, temperature, and population increased the fragmentation of the landscape in the study area. Both climate and human activities played important roles in the impacts of landscape patterns. Human activity was a key driver of the landscape-level landscape index. This study can provide a reference for the balance between ecological environmental protection and socioeconomic development.
The research results are of great significance for grassland sustainable development, which helps policymakers clearly understand the current situation and problems of local landscape patterns, as well as guide policymakers in clarifying the regional differences.

Supplementary Materials

The following supporting information can be downloaded at: https://www.mdpi.com/article/10.3390/land11091410/s1, Figure S1: Inter-annual variability of (a) precipitation and temperature, (b) population and GDP, and (c) livestock in the study area from 2000 to 2015; Figure S2: The spatio-temporal evolution of LPI in Inner Mongolia from 2000 to 2015. Note: C, cropland; F, forestland; G, grassland; Figure S3: The spatio-temporal evolution of PD in Inner Mongolia from 1995 to 2020. Note: C, cropland; F, forestland; G, grassland; Figure S4: The spatio-temporal evolution of ED in Inner Mongolia from 1995 to 2020. Note: C, cropland; F, forestland; G, grassland; Figure S5: The spatio-temporal evolution of landscape metrics at the landscape level in Inner Mongolia from 2000 to 2015.

Author Contributions

Conceptualization, M.L. and X.L. (Xiaobing Li); methodology, M.L., D.D. and S.L.; software, M.L., K.W. and H.D.; validation, M.L., X.L. (Xiaobing Li) and S.L.; formal analysis, M.L. and X.L. (Xiaobing Li); data curation, M.L., X.L. (Xin Lyu), H.D. and K.W.; writing—original draft preparation, M.L., S.L. and X.L. (Xiaobing Li); writing—review and editing, M.L., S.L. and X.L. (Xiaobing Li); visualization, M.L.; supervision, X.L. (Xiaobing Li); project administration, X.L. (Xiaobing Li); funding acquisition, X.L.(Xiaobing Li). All authors have read and agreed to the published version of the manuscript.

Funding

This research was funded by the Key Science & Technology Special Program of Inner Mongolia, grant numbers 2021ZD0011 and 2021ZD0015; the State Key Laboratory of Earth Surface Processes and Resource Ecology, grant numbers 2022-ZD-02.

Institutional Review Board Statement

Not applicable.

Informed Consent Statement

Not applicable.

Data Availability Statement

Not applicable.

Acknowledgments

The authors would like to thank the Data Center for Resources and Environmental Sciences, Chinese Academy of Sciences (RESDS, http://www.resdc.cn, accessed on 10 January 2022) for providing the land use dataset.

Conflicts of Interest

The authors declare no conflict of interest.

References

  1. Li, P.; Zuo, D.; Xu, Z.; Zhang, R.; Han, Y.; Sun, W.; Pang, B.; Ban, C.; Kan, G.; Yang, H. Dynamic changes of land use/cover and landscape pattern in a typical alpine river basin of the Qinghai-Tibet Plateau, China. Land Degrad. Dev. 2021, 32, 4327–4339. [Google Scholar] [CrossRef]
  2. Gergel, S.E.; Turner, M.G.; Miller, J.R.; Melack, J.M.; Stanley, E.H. Landscape indicators of human impacts to riverine systems. Aquat. Sci. 2002, 64, 118–128. [Google Scholar] [CrossRef]
  3. Huang, F.; Ochoa, C.G.; Jarvis, W.T.; Zhong, R.; Guo, L. Evolution of landscape pattern and the association with ecosystem services in the Ili-Balkhash Basin. Environ. Monit. Assess. 2022, 194, 1–18. [Google Scholar] [CrossRef]
  4. Khadka, S.; Gyawali, B.R.; Shrestha, T.B.; Cristan, R.; Banerjee, S.B.; Antonious, G.; Poudel, H.P. Exploring relationships among landownership, landscape diversity, and ecological productivity in Kentucky. Land Use Policy 2021, 111, 105723. [Google Scholar] [CrossRef]
  5. Deng, X.; Gibson, J.; Wang, P. Relationship between landscape diversity and crop production: A case study in the Hebei Province of China based on multi-source data integration. J. Clean Prod. 2017, 142, 985–992. [Google Scholar] [CrossRef]
  6. Xia, H.; Kong, W.; Zhou, G.; Sun, O.J. Impacts of landscape patterns on water-related ecosystem services under natural restoration in Liaohe River Reserve, China. Sci. Total Environ. 2021, 792, 148290. [Google Scholar] [CrossRef] [PubMed]
  7. Shang, C.; Wu, J. A legendary landscape in peril: Land use and land cover change and environmental impacts in the Wulagai River Basin, Inner Mongolia. J. Environ. Manage. 2022, 301, 113816. [Google Scholar] [CrossRef] [PubMed]
  8. Chen, C.; Zhang, Z.; Lu, C.; Wang, L.; Chen, H.; He, X.; Chu, Y.; Chen, J. Changes of the spatial and temporal characteristics of land-use landscape patterns using multi-temporal Landsat satellite data: A case study of Zhoushan Island, China. Ocean Coast. Manag. 2021, 213, 105842. [Google Scholar] [CrossRef]
  9. Yang, M.; Gong, J.; Zhao, Y.; Wang, H.; Zhao, C.; Yang, Q.; Yin, Y.; Wang, Y.; Tian, B. Landscape Pattern Evolution Processes of Wetlands and Their Driving Factors in the Xiong’an New Area of China. Int. J. Environ. Res. Public Health 2021, 18, 4403. [Google Scholar] [CrossRef]
  10. Deng, Z.; Cao, J.; Hu, Y. Spatial and temporal evolution of landscape pattern in downtown area of Jixi City, China. Eur. J. Remote Sensing 2020, 53, 104–113. [Google Scholar] [CrossRef] [Green Version]
  11. Li, H.; Wang, J.; Zhang, J.; Qin, F.; Hu, J.; Zhou, Z. Analysis of Characteristics and Driving Factors of Wetland Landscape Pattern Change in Henan Province from 1980 to 2015. Land 2021, 10, 564. [Google Scholar] [CrossRef]
  12. Guo, S.; Bai, H.; Meng, Q.; Zhao, T.; Huang, X.; Qi, G. Landscape pattern changes of woodland and grassland and its driving forces in Qinling Mountains. Acta Ecologica Sinica. 2020, 40, 130–140. [Google Scholar]
  13. Fan, Q.; Ding, S. Landscape pattern changes at a county scale: A case study in Fengqiu, Henan Province, China from 1990 to 2013. Catena. 2016, 137, 152–160. [Google Scholar] [CrossRef]
  14. Liu, C.J.; Zhang, F.; Johnson, V.C.; Duan, P.; Kung, H.T. Spatio-temporal variation of oasis landscape pattern in arid area: Human or natural driving? Ecol. Indic. 2021, 125, 107495. [Google Scholar] [CrossRef]
  15. Xiao, F.; Gao, G.; Shen, Q.; Wang, X.; Ma, Y.; Lü, Y.; Fu, B. Spatio-temporal characteristics and driving forces of landscape structure changes in the middle reach of the Heihe River Basin from 1990 to 2015. Landsc. Ecol. 2019, 34, 755–770. [Google Scholar] [CrossRef]
  16. Wu, J.; Zhang, Q.; Li, A.; Liang, C. Historical landscape dynamics of Inner Mongolia: Patterns, drivers, and impacts. Landsc. Ecol. 2015, 30, 1579–1598. [Google Scholar] [CrossRef]
  17. Liang, P.; Yang, X. Landscape spatial patterns in the Maowusu (Mu Us) Sandy Land, northern China and their impact factors. Catena. 2016, 145, 321–333. [Google Scholar] [CrossRef]
  18. Liu, D.; Chen, J.Q.; Ouyang, Z.T. Responses of landscape structure to the ecological restoration programs in the farming-pastoral ecotone of Northern China. Sci. Total Environ. 2020, 710, 136311. [Google Scholar] [CrossRef]
  19. Zhao, C.; Gong, J.; Zeng, Q.; Yang, M.; Wang, Y. Landscape Pattern Evolution Processes and the Driving Forces in the Wetlands of Lake Baiyangdian. Sustainability. 2021, 13, 9747. [Google Scholar] [CrossRef]
  20. Dou, H.S.; Li, X.B.; Li, S.K.; Dang, D.L.; Li, X.; Lyu, X.; Li, M.Y.; Liu, S.Y. Mapping ecosystem services bundles for analyzing spatial trade-offs in inner Mongolia, China. J. Clean Prod. 2020, 256, 15. [Google Scholar] [CrossRef]
  21. Tong, S.; Dong, Z.; Zhang, J.; Bao, Y.; Guna, A.; Bao, Y. Spatiotemporal Variations of Land Use/Cover Changes in Inner Mongolia (China) during 1980–2015. Sustainability. 2018, 10. [Google Scholar] [CrossRef] [Green Version]
  22. Xi, Y.; Thinh, N.; Li, C. Spatio-Temporal Variation Analysis of Landscape Pattern Response to Land Use Change from 1985 to 2015 in Xuzhou City, China. Sustainability. 2018, 10. [Google Scholar] [CrossRef]
  23. Garrabou, J.; Riera, J.; Zabala, M. Landscape pattern indices applied to Mediterranean subtidal rocky benthic communities. Landsc. Ecol. 1998, 13, 225–247. [Google Scholar] [CrossRef]
  24. McGarigal, K.; Marks, B.J. Fragstats: Spatial pattern analysis program for quantifying landscape structure. Gen. Tech. Rep. 1995, 351, 1–122. [Google Scholar]
  25. Zhang, J.; Lei, G.; Qi, L.; Ding, X.; Cheng, C.; Liu, X. The landscape pattern and ecological service value in Danjiangkou City under land use change from 2003 to 2018. Acta Ecol. Sin. 2021, 41, 1280–1290. [Google Scholar]
  26. Grande, T.O.; Aguiar, L.M.S.; Machado, R.B. Heating a biodiversity hotspot: Connectivity is more important than remaining habitat. Landsc. Ecol. 2020, 35, 639–657. [Google Scholar] [CrossRef]
  27. Tran, D.X.; Pearson, D.; Palmer, A.; Lowry, J.; Gray, D.; Dominati, E.J. Quantifying spatial non-stationarity in the relationship between landscape structure and the provision of ecosystem services: An example in the New Zealand hill country. Sci. Total Environ. 2021, 808, 152126. [Google Scholar] [CrossRef]
  28. Gao, B.; Gong, P.; Zhang, W.; Yang, J.; Si, Y. Multiscale effects of habitat and surrounding matrices on waterbird diversity in the Yangtze River Floodplain. Landsc. Ecol. 2021, 36, 179–190. [Google Scholar] [CrossRef]
  29. Wu, X.; Wang, S.; Fu, B.; Liu, J. Spatial variation and influencing factors of the effectiveness of afforestation in China’s Loess Plateau. Sci. Total Environ. 2021, 771, 144904. [Google Scholar] [CrossRef]
  30. Le Bagousse-Pinguet, Y.; Soliveres, S.; Gross, N.; Torices, R.; Berdugo, M.; Maestre, F.T. Phylogenetic, functional, and taxonomic richness have both positive and negative effects on ecosystem multifunctionality. Proc. Natl. Acad. Sci. USA 2019, 116, 8419–8424. [Google Scholar] [CrossRef]
  31. Zubaida, M.; Xia, J.; Polat, M.; Shi, Q.; Zhang, R. Spatiotemporal changes of land use/cover from 1995 to 2015 in an oasis in the middle reaches of the Keriya River, southern Tarim Basin, Northwest China. Catena 2018, 171, 416–425. [Google Scholar] [CrossRef]
  32. Shen, G.; Yang, X.; Jin, Y.; Luo, S.; Xu, B.; Zhou, Q. Land Use Changes in the Zoige Plateau Based on the Object-Oriented Method and Their Effects on Landscape Patterns. Remote Sensing. 2019, 12, 14. [Google Scholar] [CrossRef]
  33. Zhang, T.; Zhang, Y.; Yang, L.; Bao, N.; Sheng, L.; Zhu, Y. Dynamics and driving forces of landscape patterns in Huhhot City of Inner Mongolia Autonomous Region from 1990 to 2010. Bull. Soil Water Conserv. 2018, 38, 217–222. [Google Scholar]
  34. Li, A.; Wu, J.; Zhang, X.; Xue, J.; Liu, Z.; Han, X.; Huang, J. China’s new rural “separating three property rights” land reform results in grassland degradation: Evidence from Inner Mongolia. Land Use Policy 2018, 71, 170–182. [Google Scholar] [CrossRef]
  35. Zhu, Z.; Liu, B.; Wang, H.; Hu, M. Analysis of the Spatiotemporal Changes in Watershed Landscape Pattern and Its Influencing Factors in Rapidly Urbanizing Areas Using Satellite Data. Remote Sensing. 2021, 13, 1168. [Google Scholar] [CrossRef]
  36. Dai, E.; Wu, Z.; Du, X. A gradient analysis on urban sprawl and urban landscape pattern between 1985 and 2000 in the Pearl River Delta, China. Front. Earth Sci. 2017, 12, 791–807. [Google Scholar] [CrossRef]
  37. Yang, H.; Zhong, X.; Deng, S.; Nie, S. Impact of LUCC on landscape pattern in the Yangtze River Basin during 2001–2019. Ecol. Inform. 2022, 69, 101631. [Google Scholar] [CrossRef]
  38. Xin, Y.; Cao, W.; Wang, S.; Liu, Y.; Hao, Y.; Wang, J.; Li, W. Landscape pattern changes and their driving factors in the farming-pasture ecotone, Eastern Qilian Mountains, from 1988 to 2018. Pratacultural Sci. 2020, 37, 1941–1951. [Google Scholar]
  39. Yao, Y.; Zhang, S.; Shi, Y.; Xu, M.; Zhang, J.; Zhang, Y.; Zhao, J. Landscape Pattern Change of Impervious Surfaces and Its Driving Forces in Shanghai during 1965–2010. Water 2021, 13, 1956. [Google Scholar] [CrossRef]
Figure 1. The location of the study area.
Land 11 01410 g001
Figure 2. Methodological framework.
Land 11 01410 g002
Figure 3. Landscape-type distribution map in Inner Mongolia from 2000 to 2015.
Land 11 01410 g003
Figure 4. Sankey diagram of the landscape transfer matrix (km2).
Land 11 01410 g004
Figure 5. The spatiotemporal evolution of the LPI in Inner Mongolia from 2000 to 2015. Note: C, cropland; F, forestland; G, grassland; LPI, largest patch index.
Land 11 01410 g005
Figure 6. The spatiotemporal evolution of PD in Inner Mongolia from 2000 to 2015. Note: C, cropland; F, forestland; G, grassland; PD, patch density.
Land 11 01410 g006
Figure 7. The spatiotemporal evolution of ED in Inner Mongolia from 2000 to 2015. Note: C, cropland; F, forestland; G, grassland; ED, edge density.
Land 11 01410 g007
Figure 8. Changes in landscape metrics at the class level in Inner Mongolia from 2000 to 2015. Note: C, cropland; F, forestland; G, grassland; LPI, largest patch index; PD, patch density; ED, edge density.
Land 11 01410 g008
Figure 9. The spatiotemporal evolution of landscape metrics at the landscape level in Inner Mongolia from 2000 to 2015. Note: AI, aggregation index; CONTAG, contagion; LSI, landscape shape index; SHDI, Shannon’s diversity index.
Land 11 01410 g009
Figure 10. Changes in landscape metrics at the landscape level in Inner Mongolia from 2000 to 2015. Note: AI, aggregation index; CONTAG, contagion; LSI, landscape shape index; SHDI, Shannon’s diversity index.
Land 11 01410 g010
Table 1. Landscape metrics and the associated ecological significance.
LevelMetricsAbbr.RangeEcological SignificanceReferences
ClassLargest patch indexLPI/%(0,100]The proportion of the largest patch in a certain landscape type to the entire landscape area. It determines the dominant patch in the landscape.[25]
Patch densityPD/(No/km2)>0The number of a certain patch type per unit area reflects the density of the patch.[26]
Edge densityED/(m/hm2)≥0The edge length per unit area reflects the fragmentation degree of the landscape.[27]
LandscapeAggregation indexAI/%(0,100]It indicates the aggregation degree of the landscape; the larger value indicates more aggregation.[26]
ContagionCONTAG/%(0,100]It indicates the degree of aggregation and extension of the landscape type; a high extension value indicates that a certain dominant patch type has good connectivity.[14]
Landscape shape indexLSI≥1It reflects the degree of dispersion and regularity of the landscape shape, which increases as the landscape shape becomes irregular.[26]
Shannon’s diversity indexSHDI>0It reflects the heterogeneity of the landscape. The larger the value is, the higher the heterogeneity, the balanced distribution of each patch type in the landscape, the richer the land use, and the higher the degree of fragmentation.[28]
Table 2. Landscape transfer matrix in Inner Mongolia from 2000 to 2015 (km2).
TimeLandscapeCroplandForestlandGrasslandWaterBuilt-Up LandUnused Land
2000–2005Cropland111,707618157082125144
Forestland235163,1245221628106
Grassland18871675525,5411722853283
Water1443420013,3759929
Built-up land24836311,1649
Unused land27380151917726319,042
2005–2010Cropland114,110348573319
Forestland35165,392733414
Grassland42016528,60810878159
Water37-6313,631-94
Built-up land4--911,6213
Unused land29-11509311322,230
2010–2015Cropland113,17216545710069348
Forestland145164,855276169623
Grassland941295526,7042021516284
Water4988113,64945100
Built-up land337401011,6486
Unused land1413041822387516319,339
2000–2015Cropland110,5616901791198838168
Forestland338162,70470961109110
Grassland29161868522,42542018763338
Water2003830413,11846985
Built-up land4912492011,09816
Unused land4173224101547547315,183
Table 3. Relationships between landscape metrics at the class level and the driving factors.
PopulationGDPLivestockTemperaturePrecipitationR2adj
Standardized regression coefficientC-LPI0.63 ***−0.24 **−0.23 **0.23 *0.050.39
F-LPI0.17−0.01−0.17−0.55 ***0.150.38
G-LPI−0.63 ***0.3 **0.34 ***−0.22 *−0.10.42
C-PD−0.230.29 **−0.070.34 **0.55 ***0.26
F-PD0.120.09−0.31 ***0.42 ***0.47 ***0.39
G-PD0.6 ***−0.23 *−0.34 ***0.170.00030.32
C-ED0.44 ***−0.21 **−0.160.36 ***0.3 **0.41
F-ED0.22 *0.005−0.21 *−0.180.46 ***0.4
G-ED−0.0080.05−0.090.32 **0.59 ***0.28
*** p < 0.001, ** p < 0.01, * p < 0.05. LPI, largest patch index; PD, patch density; ED, edge density.
Table 4. Relationships between landscape metrics at the landscape level and the driving factors.
PopulationGDPLivestockTemperaturePrecipitationR2adj
Standardized regression coefficientLSI−0.11−0.060.58 ***−0.030.51 ***0.6
CONTAG−0.41 ***−0.060.21 ***−0.37 ***−0.33 ***0.5
AI−0.31 ***0.030.2 *−0.43 ***−0.46 ***0.49
SHDI0.44 ***0.08−0.18 *0.33 ***0.27 ***0.48
*** p < 0.001, * p < 0.05. Note: AI, aggregation index; CONTAG, contagion; LSI, landscape shape index; SHDI, Shannon’s diversity index.
Publisher’s Note: MDPI stays neutral with regard to jurisdictional claims in published maps and institutional affiliations.

