
Quantifying and Characterizing Urban Leisure Activities by Merging Multiple Sensing Big Data: A Case Study of Nanjing, China


1
Key Laboratory of Virtual Geographic Environment, Ministry of Education, Nanjing Normal University, Nanjing 210023, China
2
State Key Laboratory Cultivation Base of Geographical Environment Evolution, Nanjing 210023, China
3
Jiangsu Center for Collaborative Innovation in Geographical Information Resource Development and Application, Nanjing 210023, China
*
Author to whom correspondence should be addressed.
Land 2021, 10(11), 1214; https://doi.org/10.3390/land10111214
Submission received: 13 October 2021
/
Revised: 5 November 2021
/
Accepted: 6 November 2021
/
Published: 9 November 2021
Abstract
:Studying the spatiotemporal pattern of urban leisure activities helps us to understand the development and utilization of urban public space, people’s quality of life, and the happiness index. It has outstanding value for improving rational resource allocation, stimulating urban vitality, and promoting sustainable urban development. This study aims at discovering the spatiotemporal distribution patterns and people’s behavioral preferences of urban leisure activities using quantitative technology merging ubiquitous sensing big data. On the basis of modeling individual activity traces using mobile signaling data (MSD), we developed a space-time constrained dasymetric interpolation method to refine the urban leisure activity spatiotemporal distribution. We conducted an empirical study in Nanjing, China. The results indicate that leisure plays an essential role in daily human life, both on weekdays and weekends. Significant differences exist in spatiotemporal and type selection in urban leisure. The weekend afternoon is the breakout period of leisure, and entertainment is the most popular leisure activity. Furthermore, the correlation between leisure resource allocation and leisure activity participation was argued. Our findings confirm that data-driven approaches would be a promising method for analyzing human behavior patterns; therefore, assisting in land planning decisions and promoting social justice and sustainability.
1. Introduction
Leisure activities refer to the behaviors performed for pleasure, relaxation, and other emotional benefits [1]. As an integral part of people’s daily lives, participation in leisure activities positively correlates with quality of life and subjective well-being [2,3,4]. Owing to the rapid development of the economy and society, people’s consumption demands for culture and spiritual products is increasing day by day [5]. The scope of people’s leisure activities is constantly expanding. Leisure pursuits are inherently spatial [6]. Urban public space plays a prominent role in enhancing social cohesion, alleviating racial tensions and conflicts [7], increasing urban diversity, and promoting the coordinated development of economy and cultural undertakings [8,9]. It also leads to the proliferation and blind development of leisure space [2,10].
Quantifying and characterizing urban leisure space and leisure activity patterns reveal the spatial distribution of leisure resources and people’s behavior preferences. It can provide tailor-made guidance for reasonable urban resource allocation [11], space form design [12], and green sustainable development. Hence, it has methodological value for tourism and leisure behavior studies and provides a practical guide for intelligent spatial planning. Furthermore, it is also helpful to reveal spatial development imbalances and social justice issues [13].
Questionnaire and travel surveys have always been used as an essential data source for leisure activity research. However, such data require a lot of workforce and time cost; meanwhile, self-reported data usually overestimate leisure activities, since respondents tend to exaggerate the intensity of their participation in leisure activities [14]. With the global wave of information technology and the rise of concepts such as urban computing [15], the value of emerging big data is increasingly being recognized, and data-driven strategies are being applied in urban planning and design [16]. Digital footprints are usually derived from GPS tracking [17,18], geotagged social media data [19,20], mobile phone location data [21,22], and smart card data [23]. These data were adopted to study tourists’ spatial-temporal behaviors, residence commuting behaviors, and daily human motifs at destination.
Several studies have pioneered using big human sensing data to explore urban leisure activity characteristics in the above context. van Weerdenburg et al. (2019) proposed a method to capture leisure activity potentials from web text using supervised learning models [24]. Liu et al. (2020) used nighttime light (NTL) images to map urban night leisure spaces and distinguish their social functions with the help of point-of-interest (POI) data [25]. Kim et al. (2019) used a GPS-based mobile exercise application dataset to explore the spatiotemporal patterns of visitors’ activities in a national park [26]. Geolocated social media data (SMD) have also been used to study social activities in urban third places [27]. However, the above works exposed the following limitations: (1) the NTL images are restricted to night scenes, and do not always establish a connection between human gatherings and night-light intensity in many public spaces and (2) SMD and web text are usually discrete, fragmented, and subjectively random. Meanwhile, most of their user groups are young people embracing the Internet.
According to the latest relevant literature, the current quantitative metrics and analysis of urban leisure activities are faced with two major dilemmas. First, the related literature does not present suitable, reliable data for urban leisure participants, and the datasets used in current studies have serious sample bias. Second, a single data source appears inadequate for analyzing complex social phenomena and human behavior at large scales. To fill these gaps, we aim to design an effective framework for characterizing the spatiotemporal dynamics of leisure participation by merging multisource social sensing big data.
MSD has been widely used to investigate the spatial structure of cities at multiple scales [28], the spatial distribution of population [29,30], human socioeconomic activities [29,30], urban diurnal dynamics [31,32,33,34,35], and travel patterns [36,37]. Modeling human daily movement processes and labeling their activities based on MSD with extremely high population coverage is adequate for travel survey data. With the popularity of social media and location-based service (LBS) apps in the mobile Internet era [38,39], consumer behavior choices have a lot to do with online word of mouth (WOM) or guidance from reviews [40]. These construct an interrelated bridge for the physical and cyberspace [41]. In the physical space, land use is intimately related to human activities [42,43]. Urban leisure activities are confined to specific areas based on land-use constraints. Therefore, human tracking big data, online review data, and geospatial data are expected to be collected and merged to map human leisure activities and reflect urban leisure dynamics.
Accordingly, the challenge of this study is how to estimate the leisure activity distribution at a fine scale. The spatial uncertainty of mobile phone cellular positioning is the core problem when estimating user distribution and inferring the type of user activities. The built environmental metrics and human online behavior analysis by obtaining multisource big data provide excellent ancillary information for filling the gap of the uncertainty position and the real distribution of leisure activities. We propose a quantitative estimation method based on the fusion of personal mobility process modeling of MSD and a series of spatial and temporal ancillary data. The dasymetric interpolation technique [44] is used to refine urban leisure activity spatiotemporal distribution. This method has been successfully applied for enhancing the population estimation spatial accuracy of MSD [45,46,47].
In general, in this study, we aim to provide a valuable quantitative analysis framework to examine urban leisure space and the spatiotemporal dynamic characteristics of human leisure activities. We apply the proposed framework to analyze urban leisure activity patterns in Nanjing, China. The contributes of this study are the following:
- We developed an urban leisure district (ULD) detection method that was used to precisely define the spatial extent of people’s leisure activities.
- A spatiotemporal dasymetric interpolation tech framework was designed for refining human leisure spatial and temporal distribution based on merging multidimensional ancillary data.
- The time and space participation in leisure activities of a developing country city was deeply analyzed, and its formation mechanism was preliminarily diagnosed.
2. Case Study Area and Data
2.1. Study Area
Nanjing, a member of the Yangtze River Delta city cluster, lies in the middle and lower reaches of Eastern China (118°22′–119°14′ E and 31°14′–32°37′ N). By the end of 2019, the permanent population of Nanjing was 8.5 million, and the urbanization rate reached 83.2% [48]. It has been classified as a beta-level city in the 2020 global city rankings compiled by the Globalization and World Cities Research Network, on par with Athens and Abu Dhabi [49]. It has a well-developed transportation network, convenient services, a large population, and a thriving economy, and Nanjing is also a world-famous historical and cultural city, which attracted more than 10 million domestic and foreign tourists in 2019. According to the Nanjing Master Plan (2010–2020), creating an international and vibrant city with distinctive cultural characteristics and a beautiful living environment has become the government’s goal. Therefore, it is of great practical value to characterize the leisure and tourism activities in this area. As a polycentric city, the main center area (main city) and three subcenter areas (secondary city) of Nanjing were selected as our study area, as shown in Figure 1.
2.2. Data
2.2.1. Description of MSD and Preprocessing
We obtained the original MSD from a major Chinese operation provider covering 1–14 April 2019. The telecommunication provider has approximately 3.36 million users in Nanjing. It captures 45,072 base transceiver station (BTS) towers’ communication logs when users make calls, send SMS, surf the Internet, and activate handshake in silent state (every half hour). According to the density of BTS towers, the positioning accuracy is approximately 50–500 m. Our MSD contains six fields, and Table 1 shows two samples of the original MSD. The “MDN” is the user’s anonymous code, and “Cell-ID” is the number of BTS towers.
Considering the uncertainty positioning and signal propagation oscillation of MSD, we performed two-step preprocessing for the raw data. In Step 1, the DBSCAN method was used to merge near base stations within 50 m and MSD records were merged (according to our previous study [50]). In Step 2, cases of switching back and forth between neighboring BTSs in a short timeframe (known as the ”ping-pong” effect [51], 15 min) were identified. Their locations were corrected to the position that occurred most frequently.
2.2.2. Areas of Interest (AOIs), Points of Interest (POIs), and Buildings
POIs and AOIs are examined to detect the spatial scope of leisure activities, which also determines the potential activity types. The POI and AOI data both contain spatial location and attributes (such as the address, type, name, and opening time) of various functional land uses (commercial and industrial, etc.) within the city. The former is a point geographical element, and the latter is an area geographical entity. POIs are widely used to capture acceptable urban land usage [52]. We obtained 9079 AOIs and 553,487 POIs from the AMAP (https://ditu.amap.com, accessed on 3 November 2021) and Baidu Map (https://map.baidu.com, accessed on 3 November 2021) in Nanjing during February 2020, among which 772 AOIs (approximately 8.5% of total AOIs) and 121,937 POIs (about 22% of total POIs) were related to leisure services. All AOIs had corresponding POIs, while the opposite was not true.
However, the categories of POIs and AOIs are formulated for the scenario of map navigation; therefore, they need to be reclassified to meet leisure research needs. Although leisure sites have no uniform classification yet, this has been discussed in some related research. Combining with the existing taxonomy of leisure venues [1,53], we classified the AOIs and POIs into four categories: the cultural type (e.g., museums, libraries, and theaters), sportive type (e.g., stadiums and golf course), sightseeing type (e.g., zooms, park, and scenic spots), and recreational type (e.g., shopping mall, restaurant, and playground). Table 2 details the correspondence between leisure types and POI (AOI) types.
Generally, an AOI is the approximate spatial extent of leisure areas without vertical height information; high-rise and high-density buildings are the basic characteristics of modern metropolises in China. Here, 157,474 building profiles with floor heights are obtained from AMAP to characterize the urban surface accurately.
2.2.3. Dianping Data
The Dianping website (www.dianping.com, accessed on 3 November 2021) is the largest public online community that publishes user reviews and ratings of shops or various life service venues in China. As an independent third-party consumer review website, these merchants’ reputation data truly reflect the service quality and popularity. These data have been successfully applied to explore urban economic vitality and the mechanisms shaping it [54]. We calculated the number of comments on the Dianping website to quantify the spatial popularity from the perspective of human social preference. The number of reviews for 11,123 shops was also collected in February 2020 using Python projects.
3. Methods
According to the analysis in the Introduction, fine-scale dynamic distribution estimation of urban leisure activities based on MSD faces two major problems. First, complex human behaviors bring challenges to leisure activity identification. Second, uncertain cellular positioning methods greatly increase the difficulty of spatializing the number of leisure activities. Taking these into account, we defined the “urban leisure activity” that would be inferred by using MSD as follows:
Definition 1.
Urban leisure activities are recreational pastimes that take place in urban leisure sites, and they can be tourism activities, cultural experiences, sportive and recreational activities. They involve the health and well-being of people.
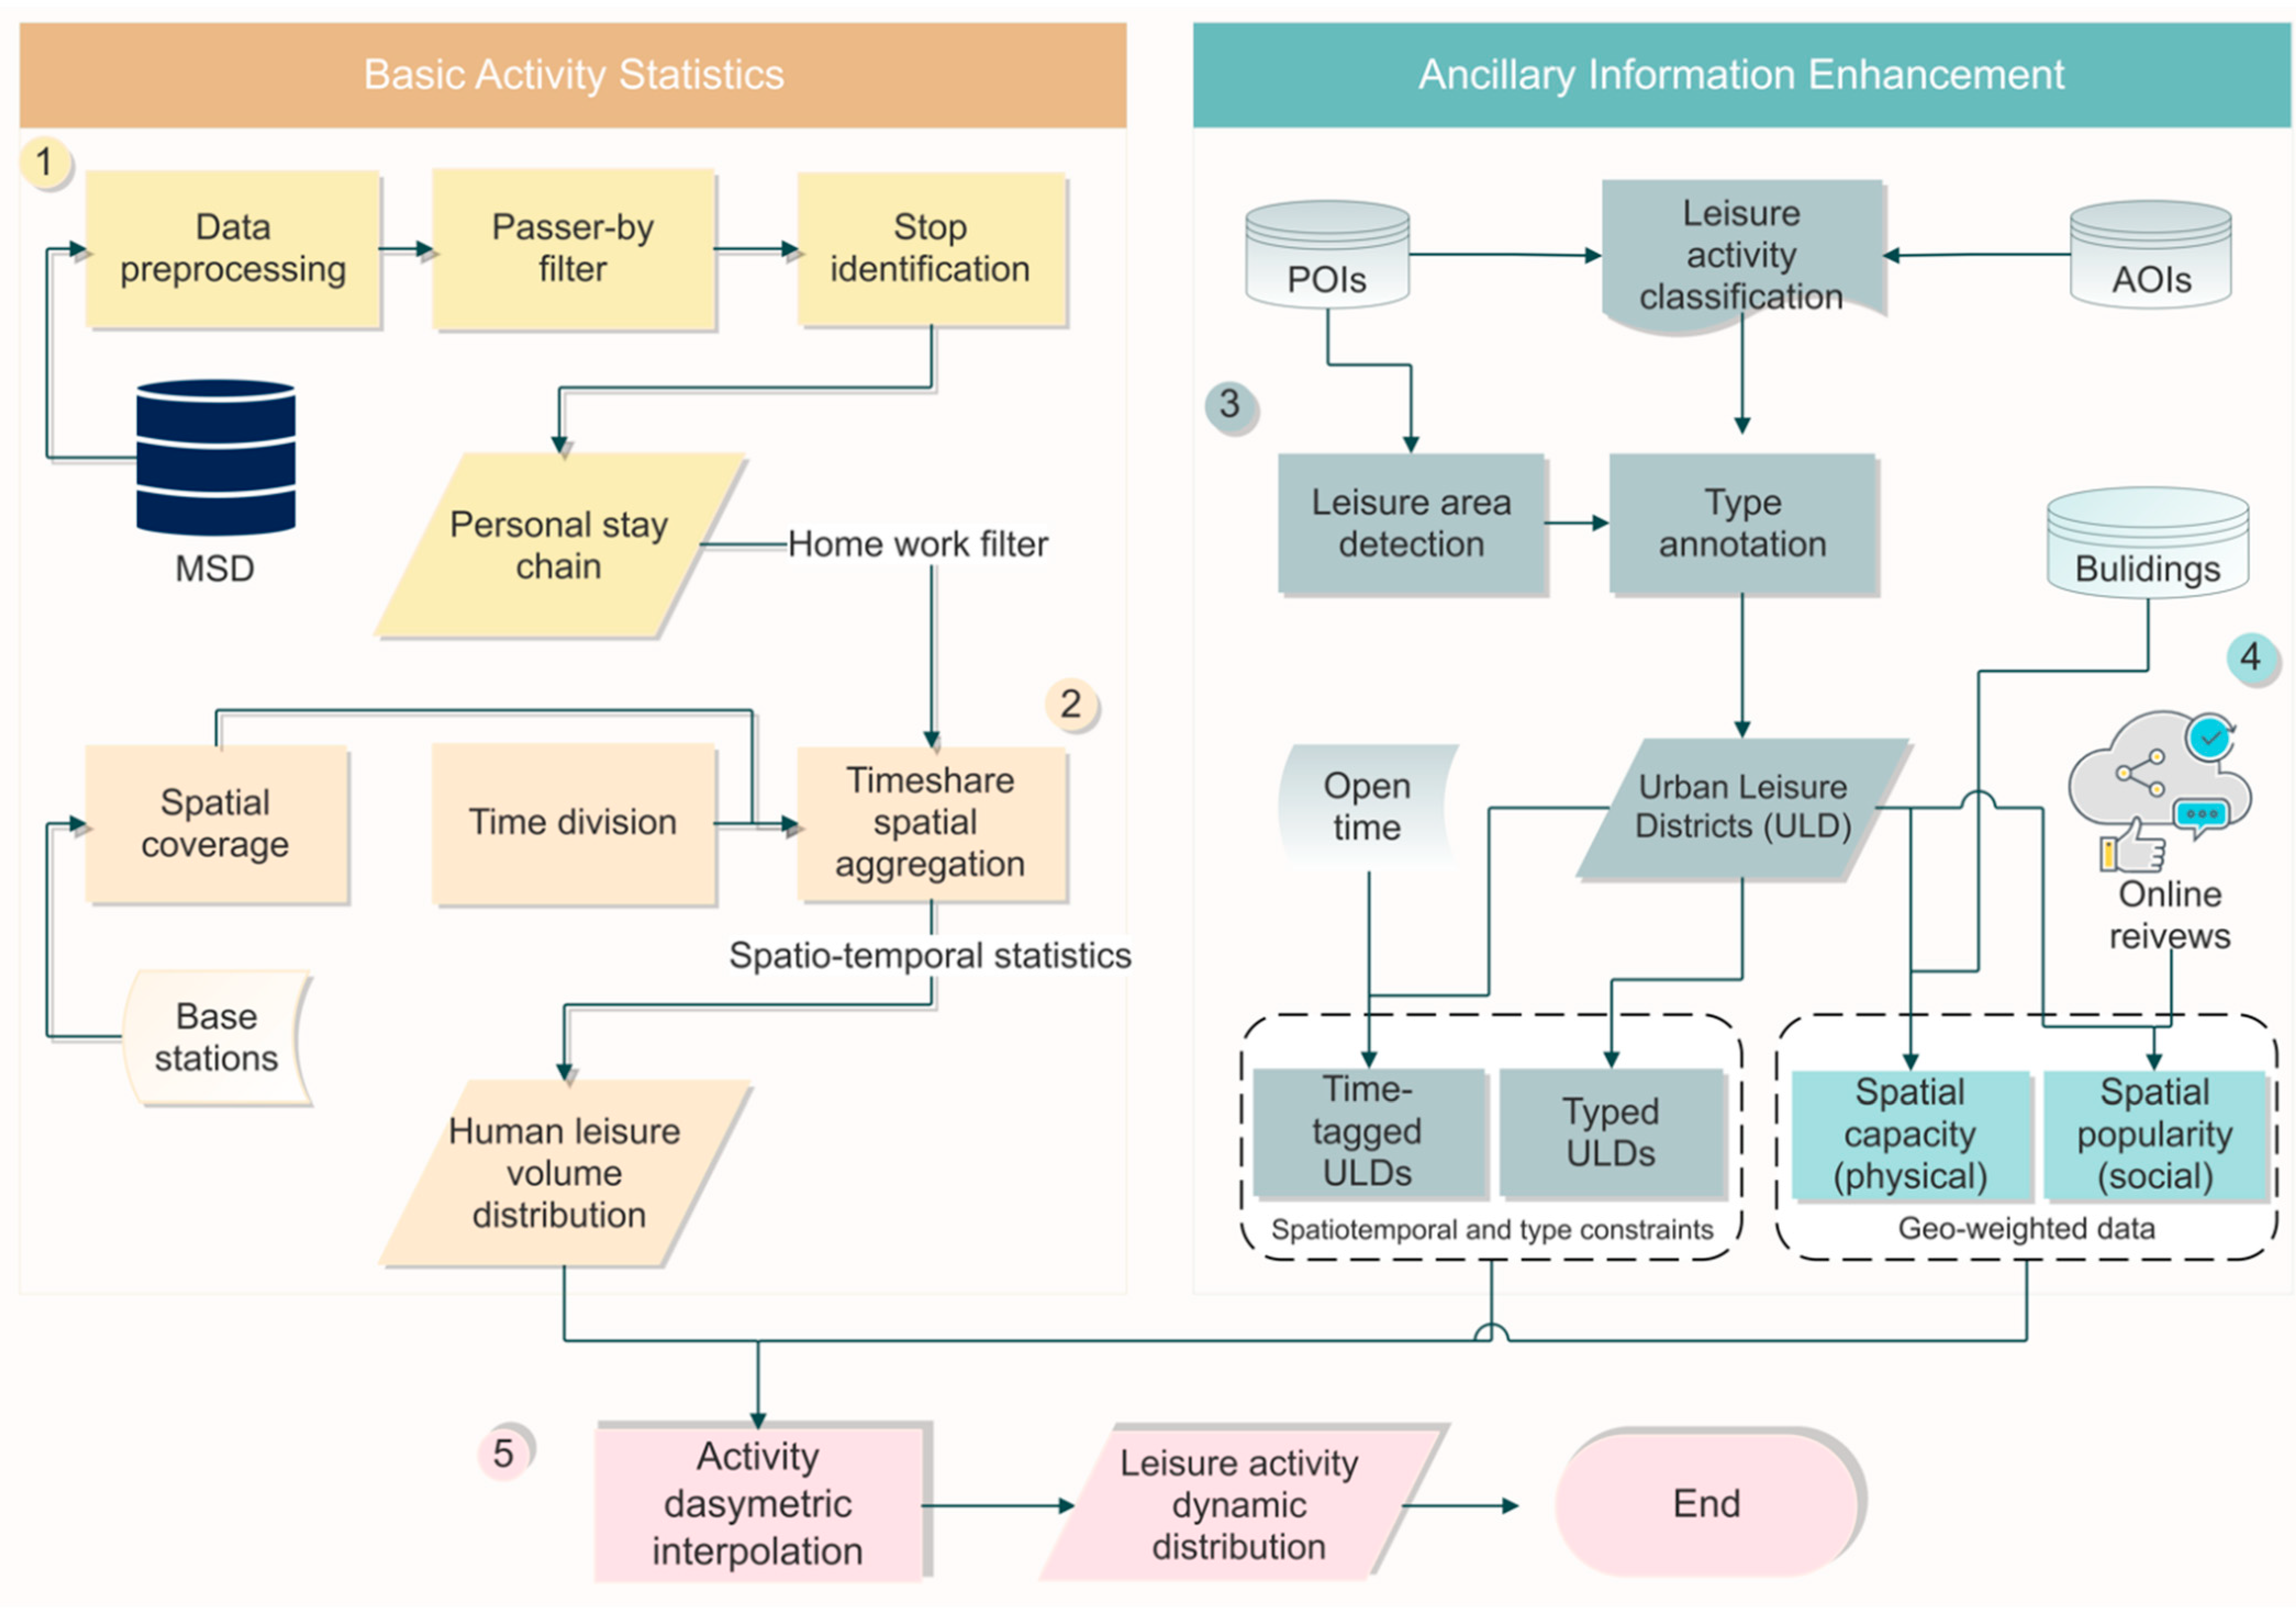
According to the above definition, home leisure (such as reading and surfing the Internet) and relaxation in the office (such as drinking coffee and talking) are not within the scope of our discussion. In addition, those whose work location is not fixed may be misidentified as leisure activities when staying in the leisure area, for example, police officers or cab drivers. In order to overcome the existing two challenges, the Urban Leisure Districts (ULD) were detected to constrain the spatial scope and an interpolation method based on multi ancillary data was proposed to refine the spatiotemporal distribution of leisure activities. The innovative estimation technique framework for quantifying urban leisure activities integrating multisource big data is shown in Figure 2.
Our framework contained five core steps: (1) Personal stop chains were constructed using MSD, which is the basis for inferring and calculating human leisure activities. (2) Filtering out the two most frequent activities of home and work, and the number of crowd activities was counted for four equal periods in a day using base station coverage as spatial units. (3) The ULDs were detected, combining POIs and AOIs, which acted as the spatial and type constraints for urban leisure activity. (4) The spatial capacity and spatial popularity were quantified using building data and Dianping data. These decided the spatial weights for the activity distribution. (5) Using the above data as inputs, the dasymetric interpolation method was designed to obtain fine-scale urban leisure activity spatiotemporal distribution.
3.1. Personal Activity Chain Construction
The user’s daily activity chain from MSD is considered to be a proxy for a user’s travel diary. We adopted a speed and distance filter method to recognize user’s stops, and the original MSD data were reorganized as the following formula:
where is the -th user’s daily stop chain, and is his (her) -th stay during the day; it includes the location of the station, its ID and coordinates, the user’s arrival time, and their stay time.
Firstly, we filtered the passers-by in preprocessed MSD, which is described in Section 2.2.1. A user with a time difference between the latest and earliest occurrence of fewer than 6 h was regarded as a passer-by. Then, according to the original MSD and BTS density analysis in our study area, the speed threshold of 5.43 km/h (average walking speed of adults) was adopted to identify user stops. Finally, 4,679,093 individuals’ daily stay chains were obtained.
3.2. Home-Work Identification and Activities Timeshare Aggregation
As the two most common daily activities [22], home and work should be excluded from leisure activity estimation. We made the following rules to detect users’ homes and workplaces based on a frequent itemset.
First, all users were divided into locals and visitors. A user present in the city for more than 9 days in 2 weeks was considered to be a local. Otherwise, he/she was treated as a visitor.
Second, the total length of Stay (TLOS) for each user in each stay area during the daytime (09:00~17:00) and nighttime (00:00~07:00) was counted separately.
Third, the places with maximum TLOS were identified as local users’ workplaces or homes, and we only tagged visitors’ residences (hotel or friend’s home). The building type (residence area or business area) with the maximum TLOS was used to determine the user’s home and workplace.
Fourth, the daily trips involving work and home spaces were assigned as commuting trips. These were removed from users’ daily stay chain datasets. In addition, the sum of daytime and nighttime stay time less than 30 min per day was also deducted, as it provided insufficient information to identify user activities.
After processing, we removed 1,575,794 users who only displayed commuting trips or short stays in the user daily chain datasets. Overall, 80.6% of the users were locals, all users had their home labeled, and 76.98% had their workplace labeled. The maximum stay times at home and work during the two weeks for local users and visitors are shown in Table 3.
In order to explore the spatiotemporal characteristics of leisure activities, personal stays needed to be aggregated into different spatial and temporal units. According to the mobile phone positioning accuracy research based on comparing cell phone positioning and GPS ground truth location data [42,55], cellular positioning accuracy was positively correlated with the distribution density of base stations. By using the kernel density estimation (KDE) method, we generated buffers of 200 and 500 m in high-density (>14.73 points/km2) and low-density BTS areas, respectively. They were used as the spatial statistical units for the leisure activities of mobile phone users. Then, we aggregated the users’ spatial stays at these buffers into four time periods (refer to [26]): early morning (0:00~6:00), morning (6:00~12:00), afternoon (12:00~18:00), and night (18:00~24:00). Stays longer than 30 min among the remaining unmarked activity types (not home and work) were aggregated into a potential leisure activity dataset, in the form of the following equation:
where is the potential leisure activity scales of each BTS during the period of , is the four time periods of a day, and is the number of stays that are active in the -th BTS during the period of .
3.3. Urban Leisure Districts (ULD) Extraction and Afford Leisure Type
Urban leisure venues are the core service configuration for leisure activities. The leisure POIs faithfully portray the spatial characteristics of urban leisure space [53]. The leisure AOI only contains single functional areas, which often does not fully represent the urban leisure activity area. The functions of many buildings are not always singular. For example, residential buildings and office spaces are often accompanied by dining and entertainment venues. The DBSCAN algorithm [56] was used to detect the ULDs and expand the area of leisure venue data to obtain the entire urban leisure districts. It can quickly and efficiently find clusters of arbitrary shapes and identify abnormal points. The clusters’ convex hulls are generated as the ULDs.
This algorithm has two parameters that decide the identity quality of the ULDs. We chose a typical sample region in the study area with multiple densities POIs and land types for testing the clustering effect to obtain suitable parameters. The silhouette coefficient [57] was used as an indicator for parameter selection. The silhouette coefficient is defined the intra-cluster and inter-cluster dissimilarity to evaluate the result. The larger the value, the more desirable the result. In this study, we used a multifunctional land area located in the Dongshan secondary city as the training area, and different parameter sets were applied in the clustering algorithm. The results (Figure 3) suggest that achieved the best performance for our study area.
After clustering, 1454 clusters and 21,490 noises were produced. The concave hulls [58] of these clusters were generated (Figure 4), which is a better method to describe the shape of the point cloud than the convex hull. The “Concave Hull” plugin of QGIS Software was used to obtain these ULDs. Meanwhile, each identified leisure district’s affordable activities determined the leisure activities in these places. Here, their leisure type was inferred by the maximum ratio of POI’s type. Integrating the collected leisure AOIs and the generated leisure POI-based hulls, we obtained the final ULDs, including 78 cultures, 203 sightseeing, 50 sport, and 1582 recreation service sites. In particular, water was wiped out from the ULDs, which, in most cases, are considered physically distinct from human activities.
- a
- Spatiotemporal Capacity and Attraction Enhancement for ULDs
The spatial heterogeneity of an urban physical environment largely causes the uneven distribution of human activity. The built status of each ULD is not always the same, and buildings often affect the potential population. Hence, we evaluated the capacity of ULDs by matching them with buildings. The capacity of a ULD was calculated using Equation (3). If the actual use of a ULD was singular (AOI), its capacity was determined by means of a combination of the building footprint and its respective number of floors. Otherwise, its capacity was the area of ground space. In addition, social space and cyberspace have an increasingly significant impact on people’s lives in this digital era. A quantitative indicator (popularity) was designed to measure the space’s attractiveness using online reviews of POIs. This value is the sum of review numbers of all those leisure venues that fall in a ULD (see Equation (4)), assuming that there are leisure points in this ULD:
The opening time is an essential temporal constraint for the dynamic distribution of human leisure activities. For example, museums and scenic spots often open during the day. Therefore, we use “Openness” to reflect this feature. This is calculated by how long all points located in the ULD are open during a period, which is described in Section 3.2. In Equation (5), the numerator is the opening time of the -th point falling in the period of , and the denominator is the duration of :
- b
- Urban Leisure Estimation Using the Dasymetric Spatiotemporal Interpolation
The above steps afforded a physical surface and multi-period headcount statistics for estimating leisure activities distribution. The spatial difference and temporal constraints of each ULD were also quantified. Consequently, the number of leisure activities for those ULDs were calculated by merging the aggregated number of potential leisure activities of the BTSs and the spatiotemporal ancillary information. The BTS-based population offers coarse-accuracy spatiotemporal statistical data. The ancillary information is constructed as the weight coefficients to improve the estimation accuracy of urban leisure activities. In a BTS coverage area, we obtained the weights of capacity ( and popularity () for each ULD using Equations (6) and (7).
In the above two equations, represents the capacity of interacted space between the -th ULD and the -th BTS buffer, while is the capacity ratio of the -th district in all the districts within the -th BTS buffer. represents the popularity of the -th ULD; and indicate that there are ULDs that are connected with the -th BTS in space. Then, the spatiotemporal interpolation result of district (ULD) during the period can be defined by Equations (8) and (9). Finally, the number of leisure population in each ULD is obtained as:
4. Results
4.1. Intracity Regional Unevenness in the Distribution of Leisure Activities
The proportions of the various activities are shown in Table 4 using the proposed methods. To eliminate the influence of high and low abnormal values on the analysis results, we use the average numbers for Tuesday and Wednesday (9 and 10 April 2019) and the average numbers for Saturday and Sunday (13 and 14 April 2019) to explore the daily pattern of leisure activities during weekdays and weekends. It is evident that the proportion of work decrease, and the ratio of leisure activities increase during the weekend. Home life is relatively stable, and it is commonly the center of people’s daily activities.
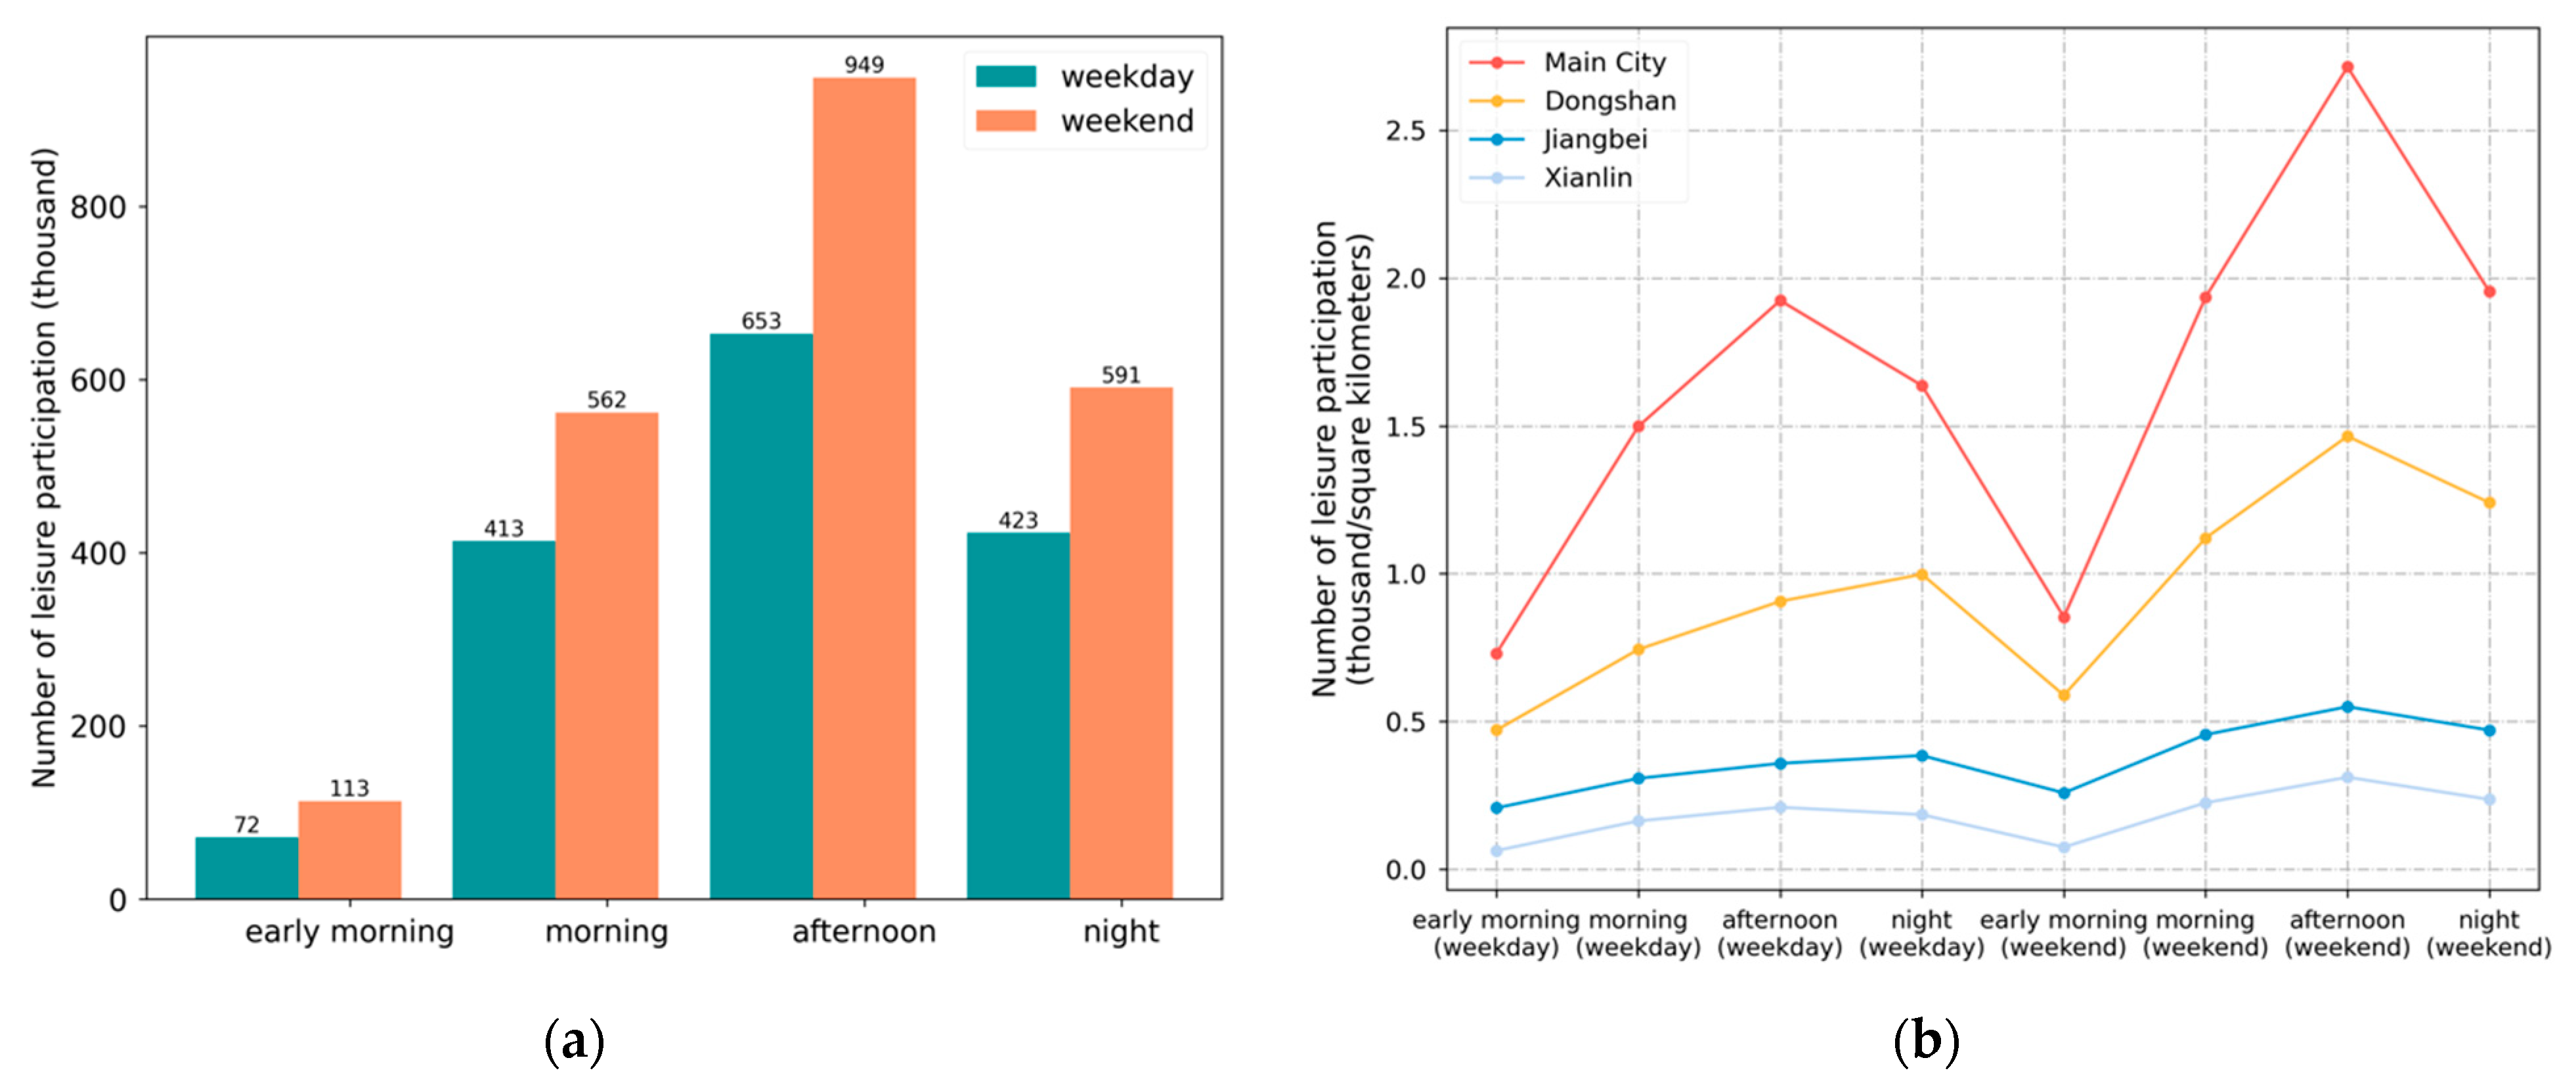
The spatial unevenness and temporal single-peak pattern of leisure activities are uncovered by counting the number of leisure activity participants during different weekdays and weekends. Leisure in the afternoon is the most popular among people, followed by in the evening. This differs from the results of García-Palomares, Juan Carlos et al.’s study of urban dynamics in Madrid based on Twitter data by García-Palomares, Juan Carlos et al. (2018) [59], who identified the morning and evening as peak hours for tourism and cultural activities, respectively.
According to Figure 5b, the order of leisure activity intensities is the main city, Dongshan secondary city, Jiangbei secondary city, and Xianlin secondary city. On the one hand, leisure activity participation corresponds to the spatial heterogeneity in the construction of leisure facilities, and ULD densities (number of ULDs per km2) are 3.92, 2.27, 1.17, and 0.71, respectively. On the other hand, it is also closely related to urban functional planning. The main city is the core of Nanjing city, equipped with complete service resources and attracting a large population. The Dongshan district has many scientific and technological companies, automobile production and trade industries, and green waterfront open spaces such as the Qinhuai River and Niushou Mountain. Since 2014, Jiangbei has become the focus of Nanjing’s urban development strategy to build an ecologically low-carbon, livable, and sustainable urban area. Due to a relatively late start, the intensity of people’s leisure activities has not yet reached the level of the central and southern urban areas (Dongshan). In contrast, Xianlin is mainly positioned as an “Educational Technology Innovation Center”, and the daily activities of the abundant college students are carried out on the university campus.
4.2. Dynamic Changes in Behavioral Preferences for Leisure Activities
Excluding the scientific taxonomy and reasonable time segmentation statistics, the experimental results show that people’s leisure behavior choices change over time. Table 5 shows the changes in the proportion of four types of urban leisure activities over the course of a day. The most popular leisure activity is recreation and sightseeing. It is inseparable from people’s life enjoyment and social needs. The proportion of sightseeing, sport, and cultural activities in the early morning is reduced because many leisure venues are no longer open in the early morning. The proportion of sightseeing and cultural activities also dropped significantly at night. However, the proportion of recreation activities was increased at night, which is consistent with Zhang’s results [60] based on the survey of 680 residents in Beijing. In the same period, the proportion of sports activities on weekdays was always no less than that on weekends. This indicates that physical exercise is listed in many people’s daily plans. In comparison, people are more willing to travel and participate in cultural activities than sports, and the weekend mornings are the most popular time.
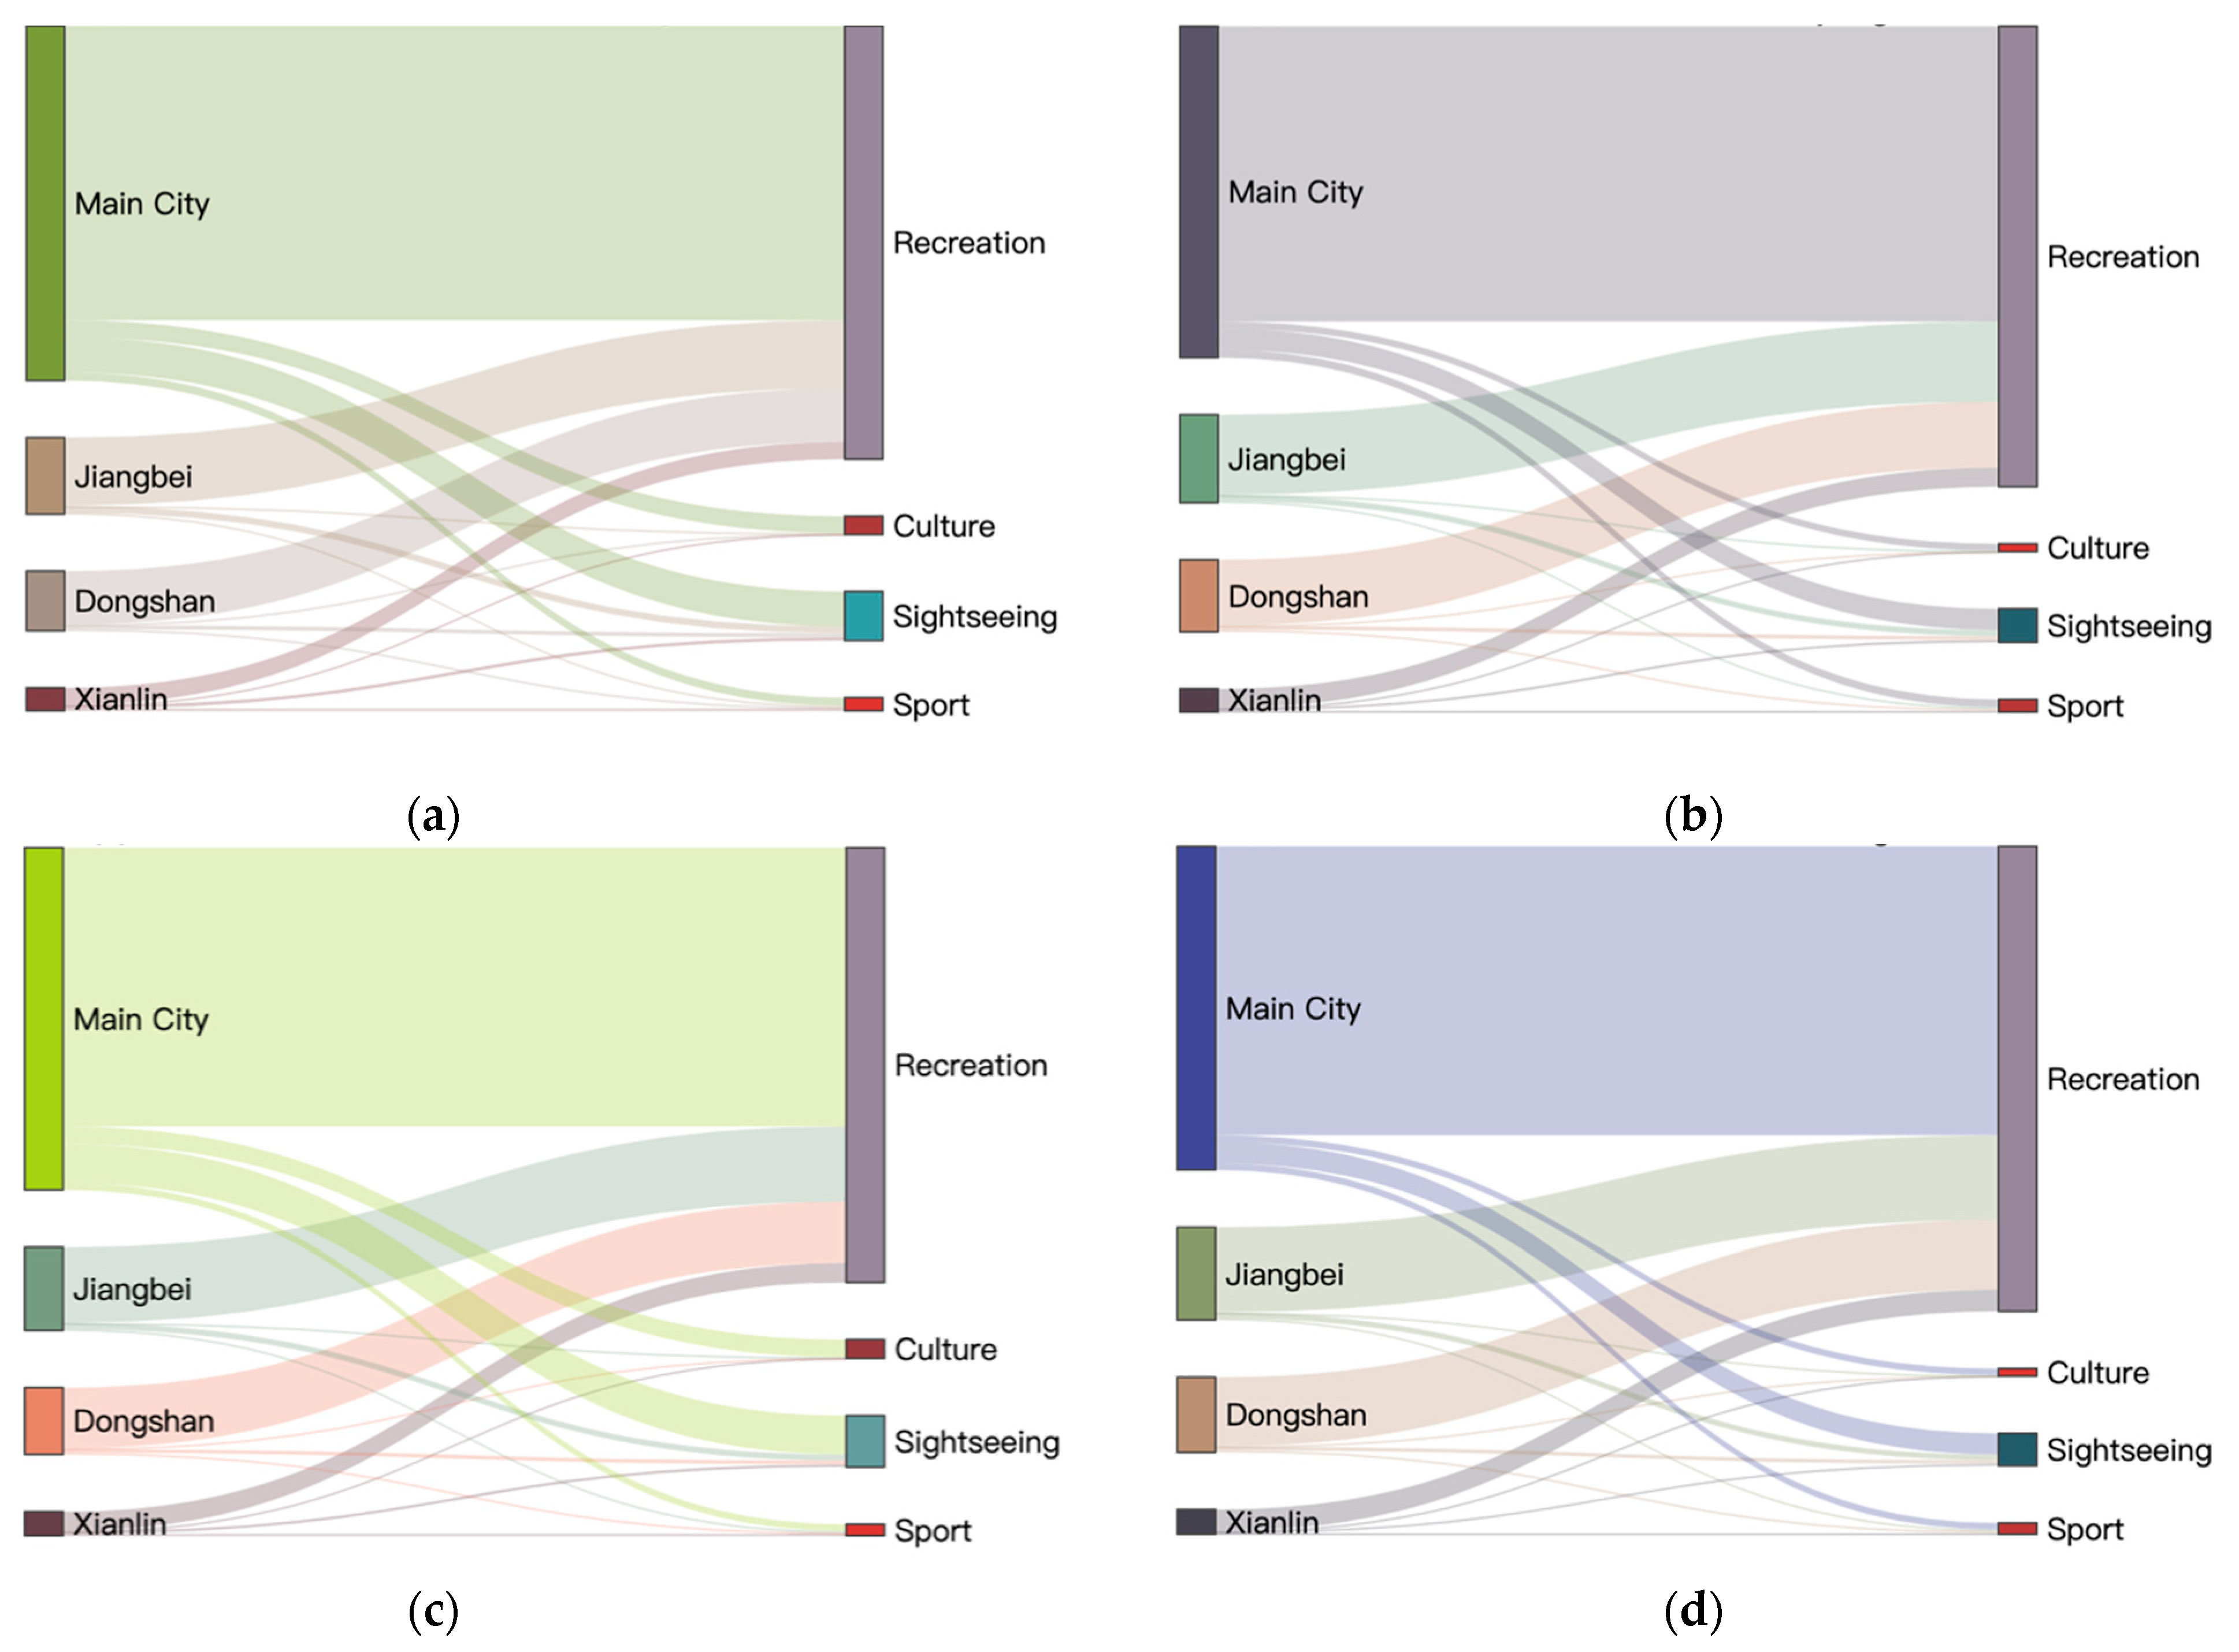
We compare the leisure activity preferences in different districts during the day (afternoon) and at night regarding the spatial dimension. As shown in Figure 6, the main city is the core attraction area of leisure activities during the day and night. Still, its core position declined because night leisure followed the rules of short trip activities as much as possible. The proportion of night cultural activities was also significantly reduced. There was a significant increase in leisure activities during weekends in the sub-city area. Various recreation activities (e.g., catering and shopping malls) fill people’s leisure life and are the main pillar of the leisure industry. Although the proportion of people traveling at night declined, it is an important component of nighttime leisure activities. These results provide a tailor-made policy aid for the development of the urban leisure industry.
4.3. Spatiotemporal Differences of Urban Leisure Activities
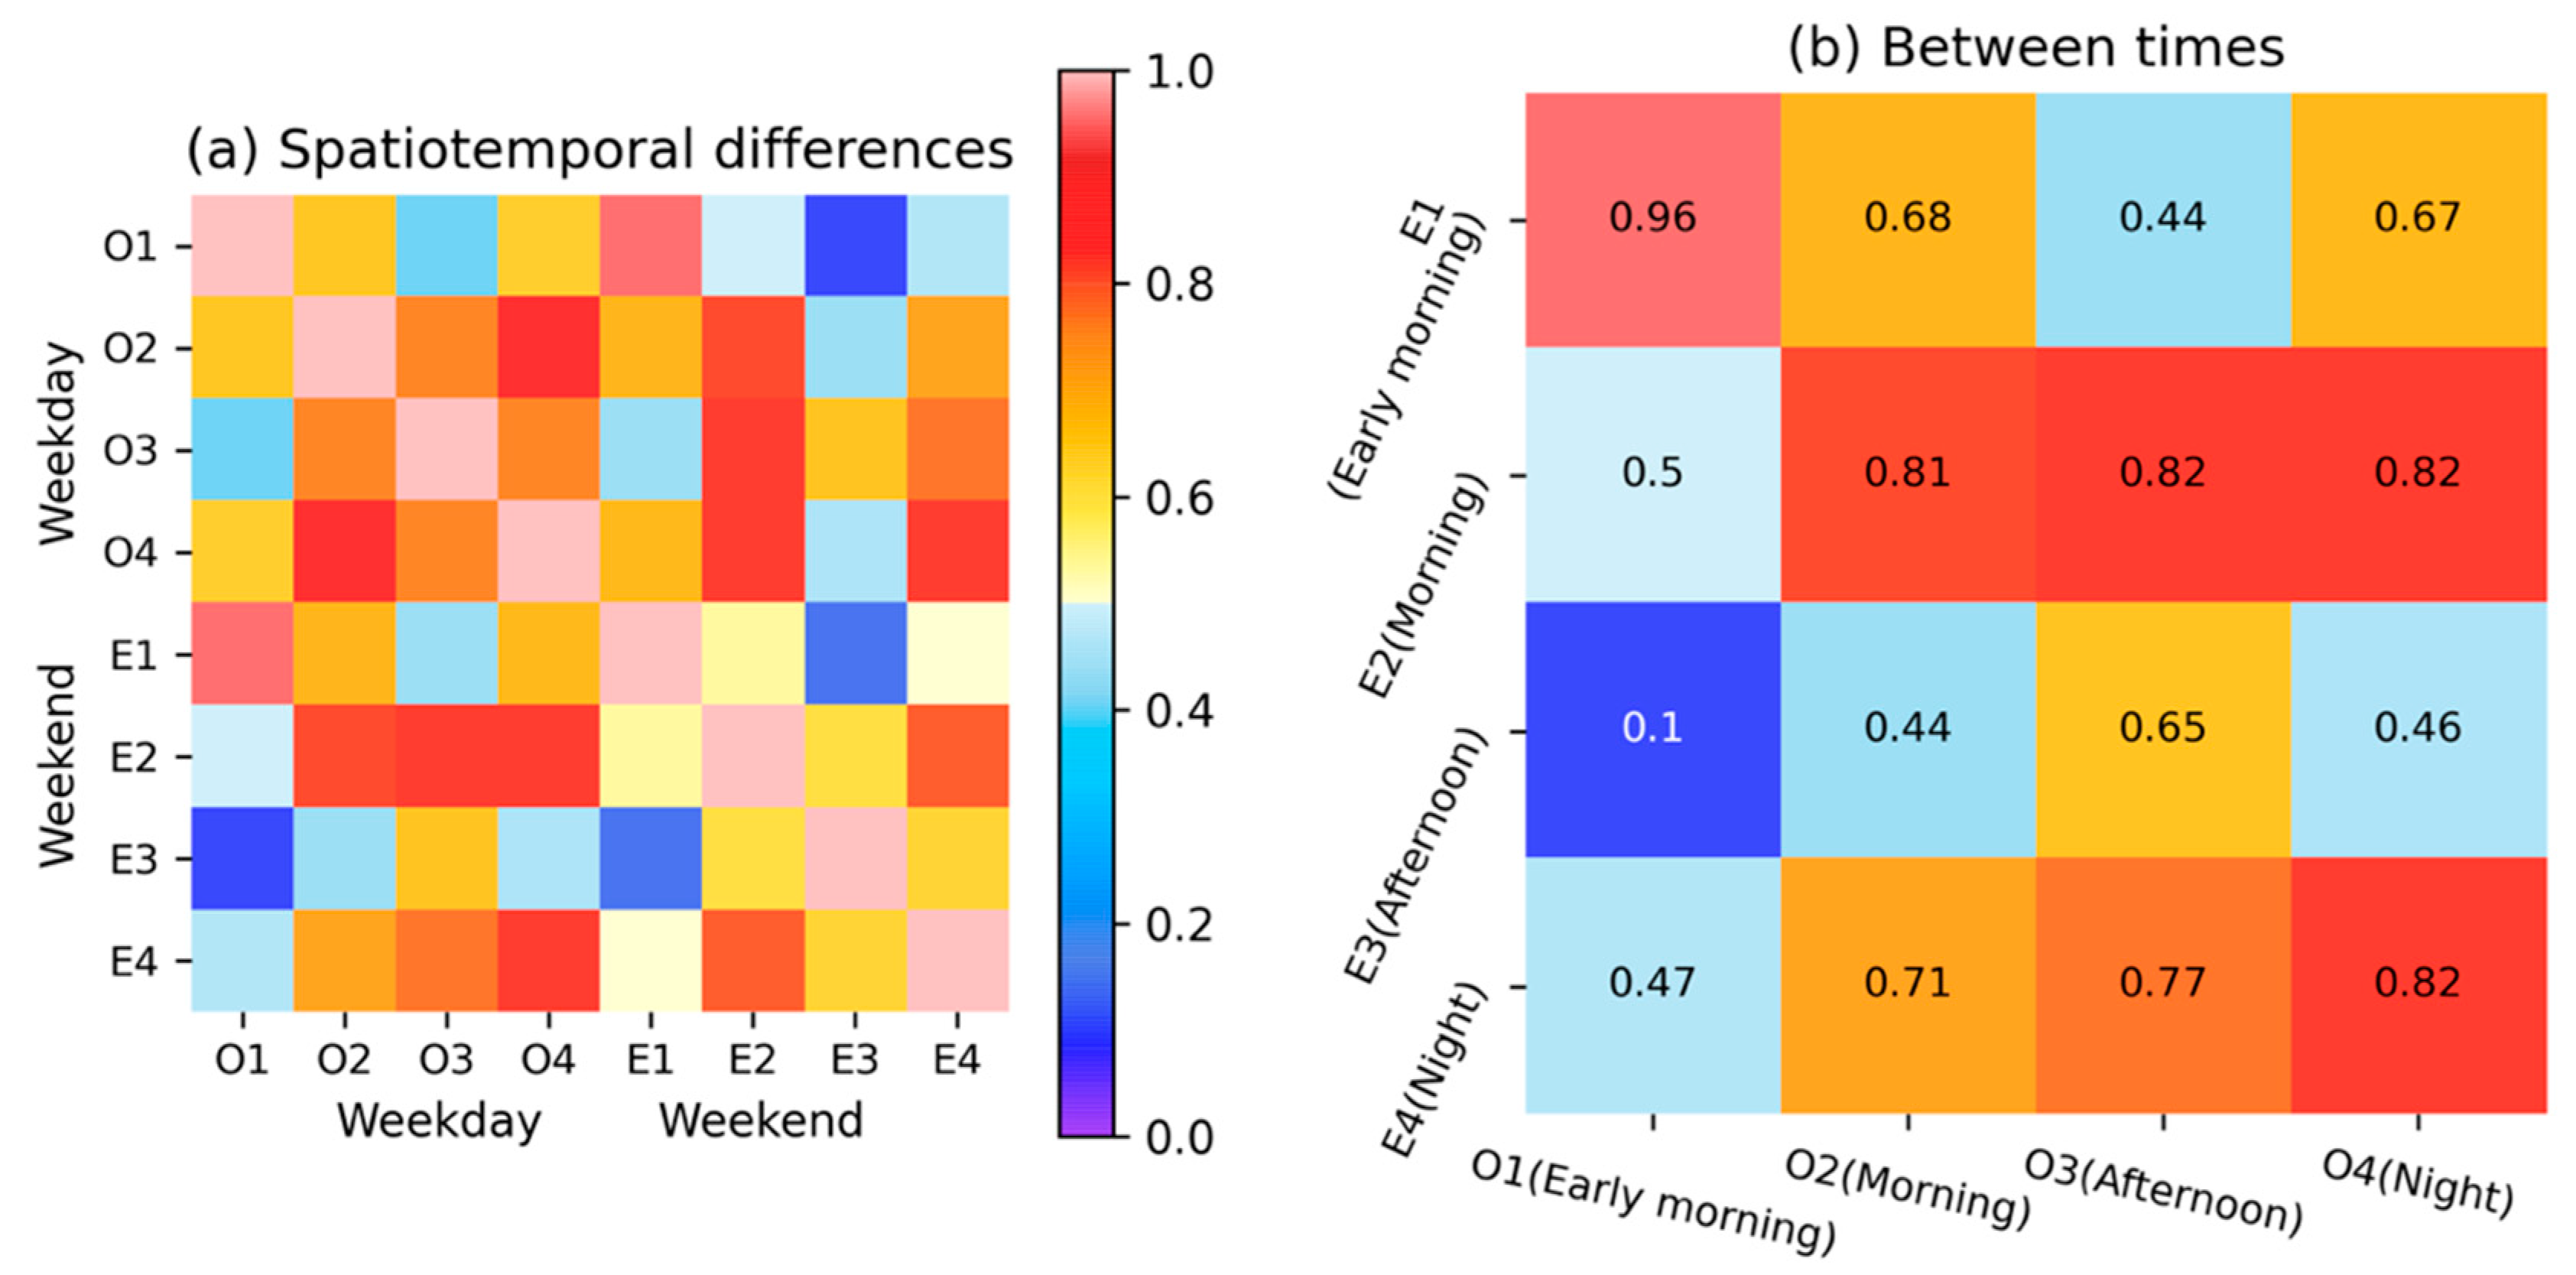
According to the above results, leisure activities’ diurnal changes manifested as a diffusion process to contraction from morning to deep night on weekdays and weekends. We define the similarity indicator to characterize the evolution patterns to represent the spatiotemporal dynamics better. Here, we calculated the cumulative absolute value of the difference between different periods and compared it with each point reaching the maximum value in all periods. The spatiotemporal similarity is visualized as a heatmap in Figure 7.
Firstly, as shown in Figure 7a, the similarity between different periods of the weekday (O2 to O4) is significantly higher than that of the weekend (E2 to E4), and the differences between the early morning hours and other periods are very prominent. Secondly, by comparing the same activity period on weekends and weekdays (Figure 7b), it can be found that the distribution of leisure activities in the afternoon has the largest difference (35%), and the leisure activities in the early morning have the most similarity (96%). Lastly, based on the cross-comparison of different periods, the activity patterns in the evenings of weekdays and weekends are closer to each other. The activity pattern in the morning on weekends is similar to that at other times of the weekdays. In particular, leisure activities in the early morning on weekdays and in the afternoon on weekends show a completely different picture.
On the basis of the above analysis, the characteristics of urban leisure activities during the morning and afternoon with remarkable differences between weekdays and weekends should be further examined as follows:
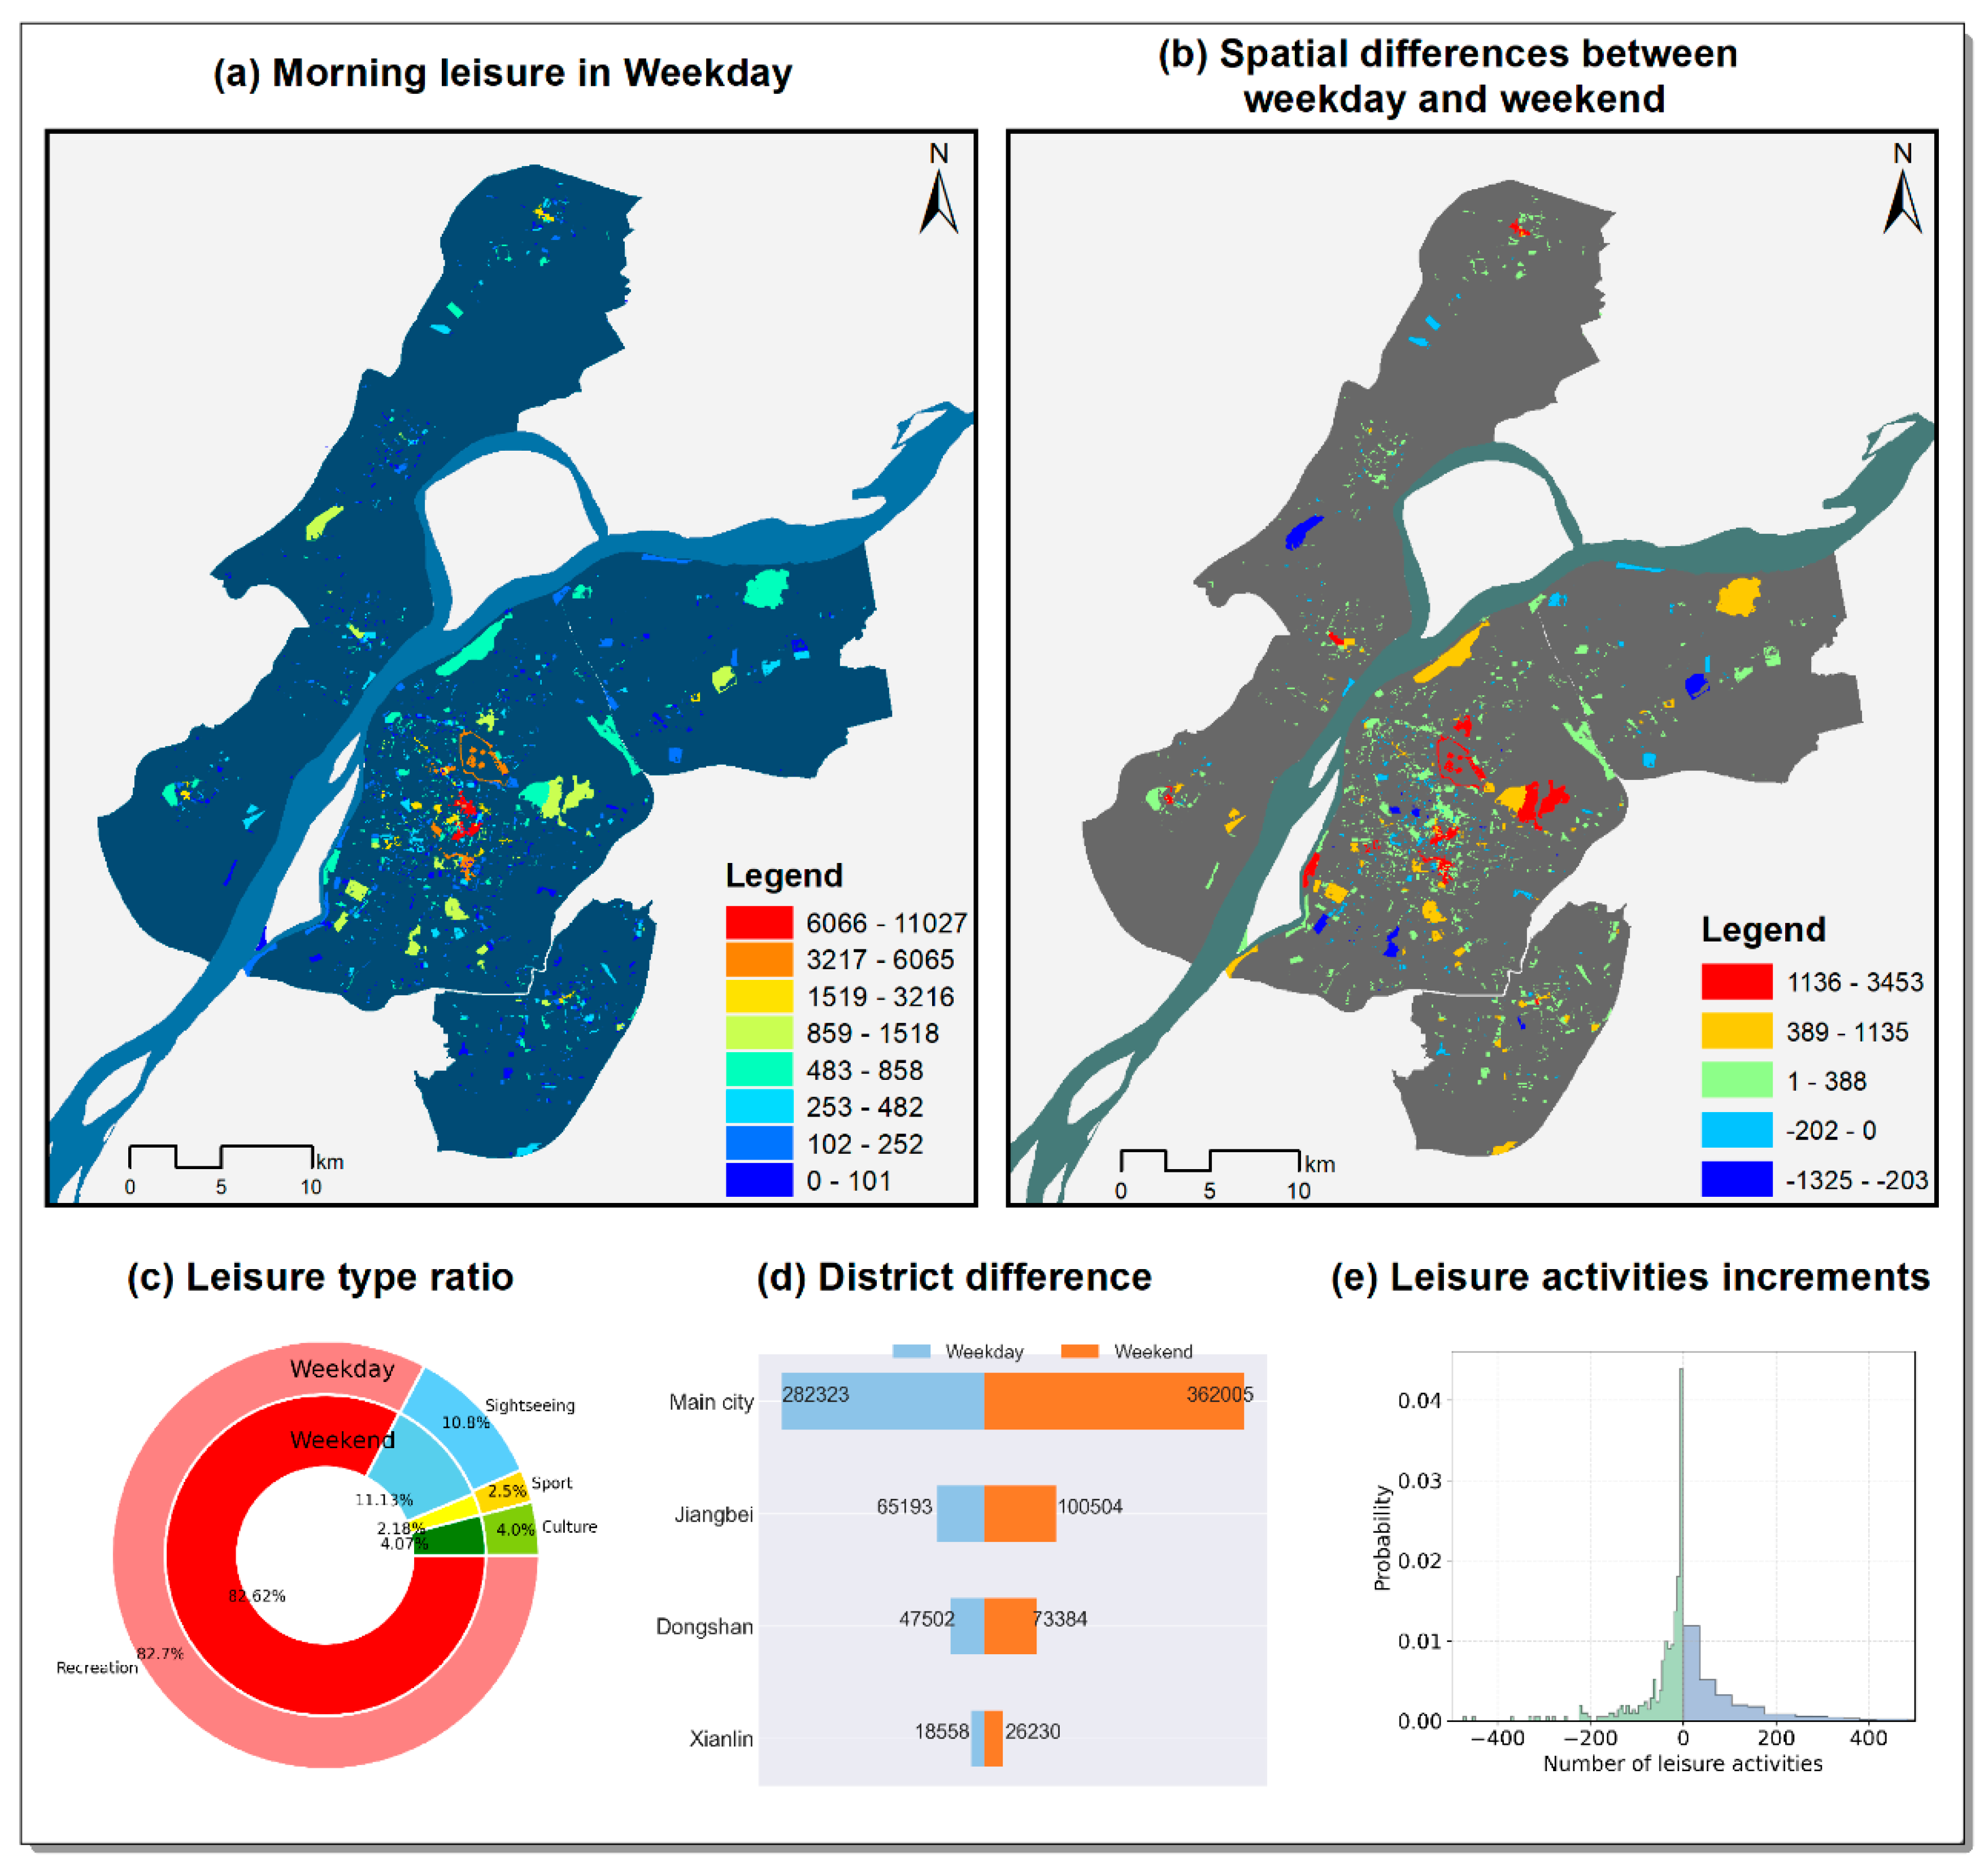
(1) Urban leisure activity characteristics during the morning.
The most vibrant leisure area is mainly clustered in the center of the main city. Jiangbei is the second-ranked urban leisure district (Figure 8d). The overall leisure activity spatial distribution during the morning is relatively similar (81%). While sightseeing activities increased from 10.8% (weekday) to 11.13%, they are distributed in the main city and the Jiangbei district. The activity increment is mainly distributed in the range of 0~200 (Figure 8e), and the reduction is concentrated in the range of 0~100. The proportion of sports activities decreased, while cultural activities increased slightly (0.07%).
(2) Leisure participation during the afternoon.
In the afternoon, the overall scale of leisure activities greatly increased as compared with the morning (according to Figure 8a and Figure 9a). The main city contributes the most (the number of leisure activities increased by more than 387 thousand), and Figure 9f shows these change characteristics. Sightseeing and cultural leisure became more popular as compared with weekdays. The activities increment value is mainly distributed in (−250, 0) and (0, 500). Most urban leisure venues ushered in more patrons during this period, as shown in Figure 9b.
5. Discussion and Conclusions
This research designed a new technical technique framework for evaluating the development of urban leisure and human leisure behaviors from a refined and spatiotemporal perspective. It aims to fill in the current research gaps regarding participation in various leisure activities at the urban scale. Our study confirms that the combination of multisource social sensing big data contributes greatly to mining and explaining human social behavior. Below, we discuss the new findings and methodological contributions of this study, the practical significance of empirical analysis results to guide managers and operators in the leisure industry, as well as the shortcomings of this study, and future work.
5.1. Contributions and Findings
As compared with the state-of-the-art research, this study extended the methods to measure urban leisure space and discover the dynamic patterns of people’s participation in urban leisure activities. The main contributions of our research main include the following three aspects:
(1) An advanced framework is proposed to characterize urban leisure behaviors.
In this study, we propose an advanced framework for quantifying and characterizing urban leisure activities at a fine scale based on multisource big data fusion. This activity distribution estimation method is specifically developed for leisure behavior and has higher accuracy than generalized population distribution mapping [29,61]. The proposed framework could be applied to analyze the spatiotemporal patterns of urban leisure activities. It can also be extended to map the distribution of other activities such as family and work.
(2) The proposed ULDs portray the urban leisure space more precisely.
The ULDs defined and detected in this study (Figure 4) represent urban leisure spatial configuration more effectively than density-based spatial pattern analysis studies. Those density-based studies [8,53,62] only discovered the general pattern of urban leisure space, such as the regularity of the gradient variation of leisure sites in Jing’s work [53]. Their findings verified the urban polycentric plain and major leisure resources gathering area. The proposed ULDs can provide reliable ground truth data for understanding urban leisure space patterns. The results of ULD detection in Nanjing show that the spatial distribution of various leisure resources is uneven, especially since cultural venues are only concentrated in the main urban area. These findings support urban planners for rational construct of urban public activity places.
(3) A new urban leisure activity distribution model is established.
With real population activity footprints, in this study, we use multisource merged interpolation methods to break through the current shortcomings of some recent studies [8,53] that used POI density to represent the actual distribution of urban leisure activities. Meanwhile, our method can analyze the dynamic distribution pattern of urban leisure activity over multiple periods without being limited to the analysis of specific times (e.g., nighttime leisure and potential leisure [24,25]). The temporal and spatial patterns of four types of leisure activities in Nanjing are examined. It goes beyond many analyses for a single type. For example, Cui et al. (2016) analyzed the spatial clustering effect of karaoke bars in Nanjing [62] and Xu et al. (2018) explored the spatial agglomeration pattern of recreation resources in Nanjing [63].
According to the case study of Nanjing, leisure activities are an indispensable part of life (leisure activities on weekdays and weekends account for around 20% of all activities). The urban diurnal leisure activity shows a “single peak” pattern, and the afternoon is the concentrated outbreak period of urban leisure. More importantly, urban leisure participation shows significant spatial unevenness, temporal variability, and diversity of leisure type choice:
Firstly, participation in leisure activities was highest in the main city and lowest in the Xianlin secondary city. The role of resource agglomeration has the greatest impact on the main urban area, while other potential factors also exist as leisure drivers in the Xianlin area.
Secondly, the diurnal differences in leisure activities are the most prominent, which is more prominent on weekends than weekdays.
Thirdly, recreation activities are the main force that creates prosperous urban leisure; the development of culture and sport leisure business is not satisfactory. People lack enthusiasm for participating in cultural tourism activities at night.
Lastly, regional unevenness in the distribution of urban leisure activities is significantly correlated with the configuration of leisure and recreation service sites.
5.2. Practical Implications
On the basis of the analysis of spatial distribution, spatiotemporal differences, and type preference for urban leisure activities, new insights were obtained regarding the spatiotemporal patterns of urban leisure behavior. These results could help urban planners and businesses with some decision support.
For the government, the uneven distribution of urban leisure should be improved. Managers should facilitate the matching of leisure resource supply and demand to make it easier for people to participate in urban leisure activities. It also aligns with the Chinese government’s carbon neutrality target [64] and sustainable development strategy. Specifically, the cultural and sports recreation resources of Nanjing’s suburban areas should be properly developed. Managers should appropriately increase the opening of cultural venues and tourist attractions at night to promote the prosperous development of the city’s nighttime tourism and cultural markets. At the same time, in order to meet the growth of the weekend leisure scale in the Jiangbei secondary city and the main city, their transportation conditions and event reception capacity should be upgraded accordingly.
For leisure industry merchants and operators, precise site selection and business strategies can be developed based on activities’ temporal and spatial preferences. For example, in response to the booming entertainment activities in Nanjing, night tours can be developed to achieve dislocation competition. Science, education and entertainment industrirs that are adapted to the Xianlin secondary city should be strongly advocated and reasonably laid out.
Many studies used leisure facilities as the proxy of urban leisure activity space, which cannot represent human leisure activity participation. To what extent can we assume that the abundance of leisure resources represents participation in urban leisure activities? We use spatial regression modeling to build the associations between them. The ordinary least squares (OLS) model reveals the relationship between leisure activities and the configuration of leisure facilities (expressed by leisure POI). As shown in Table 6, the status of leisure facility configuration has the highest degree of explanation for the main area (72.2% and 78.4% for day and night, respectively), and daytime leisure activities are more attracted by the distribution of resources (the coefficient reached 8.6442). The current status of facility construction provides the lowest level of explanation for leisure activities in the Xianlin area, which confirms that the development of leisure resources and public activity space in the Xianlin area faces a severe shortage.
5.3. Limitations and Future Works
The two main limitation of this study are: (1) We defined “urban leisure activities” as suitable for MSD data mining. Nevertheless, the spatiotemporal uncertainty of cellular positioning [65] can lead to some unavoidable recognition errors. For example, short periods of relaxation or non-stationary office occupants working in leisure areas may be incorrectly counted. (2) The personal behaviors of traveling distance, frequency of leisure activities, and mobility pattern have not yet been discussed. This discussion is important for the study of human predictability [66]. (3) Considering privacy protection issues, the impact of demographic characteristics on human leisure behavior is not explored in this study. In the future, we hope to obtain open access to information such as age, gender, and education level with anonymization.
To address the above limitations, we intend to classify human communities according to their long-term behaviors in our future research. This may help us to reduce the error of behavior recognition. In addition, we will further investigate the driving mechanism (such as population density, traffic accessibility, and individual emotions) of human leisure activity distribution and preference. This will support the optimization of the layout of urban leisure resources and scientific site selection for businesses.
Author Contributions
Conceptualization, S.L. and Y.L.; methodology, S.L.; software, S.L.; validation, S.L., L.Z., and Y.L.; formal analysis, S.L. and Y.L.; investigation, L.Z.; resources, L.Z.; data curation, S.L. and H.L.; writing—original draft preparation, S.L.; writing—review and editing, S.L. and L.Z.; visualization, S.L. and Y.L.; supervision, S.L.; project administration, S.L.; funding acquisition, L.Z. All authors have read and agreed to the published version of the manuscript.
Funding
This research was funded by the National Natural Science Foundation of China (42171403).
Institutional Review Board Statement
Ethical review and approval were waived for this study due to the fact that the analyzed datasets were properly anonymized, and no participant could be identified.
Informed Consent Statement
Written informed consent was waived due to the fact that the analyzed datasets were properly anonymized, and no participant could be identified.
Data Availability Statement
Not applicable.
Conflicts of Interest
The authors declare no conflict of interest.
References
- Liu, Y.; Zhang, Y.; Jin, S.T.; Liu, Y. Spatial pattern of leisure activities among residents in Beijing, China: Exploring the impacts of urban environment. Sustain. Cities Soc. 2020, 52, 101806. [Google Scholar] [CrossRef]
- Lloyd, K.; Auld, C. Leisure, public space and quality of life in the urban environment. Urban Policy Res. 2003. [Google Scholar] [CrossRef]
- Hills, P.; Argyle, M. Positive moods derived from leisure and their relationship to happiness and personality. Pers. Individ. Dif. 1998. [Google Scholar] [CrossRef]
- Newman, D.B.; Tay, L.; Diener, E. Leisure and Subjective Well-Being: A Model of Psychological Mechanisms as Mediating Factors. J. Happiness Stud. 2014, 15, 555–578. [Google Scholar] [CrossRef]
- Molitor, G.T.T. Part I: Oncoming” leisure era”: How we are getting there. J. Future Stud. 2008, 12, 109–120. [Google Scholar]
- Johnson, A.J.; Glover, T.D. Understanding Urban Public Space in a Leisure Context. Leis. Sci. 2013. [Google Scholar] [CrossRef]
- Peters, K. Being together in urban parks: Connecting public space, leisure, and diversity. Leis. Sci. 2010. [Google Scholar] [CrossRef]
- He, S.; Yu, S.; Wei, P.; Fang, C. A spatial design network analysis of street networks and the locations of leisure entertainment activities: A case study of Wuhan, China. Sustain. Cities Soc. 2019, 44, 880–887. [Google Scholar] [CrossRef]
- Guo, H.; Zhang, L.; Song, H. Coordinated Development of Leisure Sports Industry and Urban Culture under the Concept of “Casual City”. In Proceedings of the Advances in Intelligent Systems and Computing, Zbarazh, Ukraine, 23–26 September 2020. [Google Scholar]
- Deng, Y.; Liu, J.; Luo, A.; Wang, Y.; Xu, S.; Ren, F.; Su, F. Spatial mismatch between the supply and demand of urban leisure services with multisource open data. ISPRS Int. J. Geo-Inf. 2020, 9, 466. [Google Scholar] [CrossRef]
- Kolny, B. The Role of Leisure in Sustainable Development. In Handbook of Sustainable Development and Leisure Services; Springer: Berlin/Heidelberg, Germany, 2021; pp. 39–50. [Google Scholar]
- Scott, D.M.; Horner, M.W. The role of urban form in shaping access to opportunities: An exploratory spatial data analysis. J. Transp. Land Use 2008, 1, 89–119. [Google Scholar] [CrossRef]
- Stewart, W. Leisure Research to Enhance Social Justice. Leis. Sci. 2014, 36, 325–339. [Google Scholar] [CrossRef]
- Gershuny, J. Time-Use Surveys and the Measurement of National Well-Being; University of Oxford: Oxford, UK, 2011. [Google Scholar]
- Zheng, Y.; Capra, L.; Wolfson, O.; Yang, H. Urban computing: Concepts, methodologies, and applications. ACM Trans. Intell. Syst. Technol. 2014, 5, 1–55. [Google Scholar] [CrossRef]
- Sailer, K.; Pomeroy, R.; Haslem, R. Data-driven design—Using data on human behaviour and spatial configuration to inform better workplace design. Corp. Real Estate J. 2015, 4, 249–262. [Google Scholar]
- Modsching, M.; Kramer, R.; Hagen, K.T.; Gretzel, U. Using Location-based Tracking Data to Analyze the Movements of City Tourists. Inf. Technol. Tour. 2008, 10, 31–42. [Google Scholar] [CrossRef]
- De Cantis, S.; Ferrante, M.; Kahani, A.; Shoval, N. Cruise passengers’ behavior at the destination: Investigation using GPS technology. Tour. Manag. 2016, 52, 133–150. [Google Scholar] [CrossRef]
- Girardin, F.; Dal Fiore, F.; Ratti, C.; Blat, J. Leveraging explicitly disclosed location information to understand tourist dynamics: A case study. J. Locat. Based Serv. 2008, 21, 41–56. [Google Scholar] [CrossRef] [Green Version]
- Kadar, B. Measuring tourist activities in cities using geotagged photography. Tour. Geogr. 2014, 16, 88–104. [Google Scholar] [CrossRef]
- Ahas, R.; Aasa, A.; Roose, A.; Mark, Ü.; Silm, S. Evaluating passive mobile positioning data for tourism surveys: An Estonian case study. Tour. Manag. 2008, 29, 469–486. [Google Scholar] [CrossRef]
- Schneider, C.M.; Belik, V.; Couronné, T.; Smoreda, Z.; González, M.C. Unravelling daily human mobility motifs. J. R. Soc. Interface 2013, 10, 20130246. [Google Scholar] [CrossRef] [PubMed] [Green Version]
- Ma, X.; Liu, C.; Wen, H.; Wang, Y.; Wu, Y.J. Understanding commuting patterns using transit smart card data. J. Transp. Geogr. 2017, 58, 135–145. [Google Scholar] [CrossRef]
- van Weerdenburg, D.; Scheider, S.; Adams, B.; Spierings, B.; van der Zee, E. Where to go and what to do: Extracting leisure activity potentials from Web data on urban space. Comput. Environ. Urban Syst. 2019, 73, 143–156. [Google Scholar] [CrossRef]
- Liu, J.; Deng, Y.; Wang, Y.; Huang, H.; Du, Q.; Ren, F. Urban nighttime leisure space mapping with nighttime light images and POI data. Remote Sens. 2020, 12, 541. [Google Scholar] [CrossRef] [Green Version]
- Kim, J.; Thapa, B.; Jang, S. GPS-based mobile exercise application: An alternative tool to assess spatio-temporal patterns of visitors’ activities in a national park. J. Park Recreat. Adm. 2019, 37, 1. [Google Scholar] [CrossRef]
- Adelfio, M.; Serrano-Estrada, L.; Martí-Ciriquián, P.; Kain, J.H.; Stenberg, J. Social Activity in Gothenburg’s Intermediate City: Mapping Third Places through Social Media Data. Appl. Spat. Anal. Policy 2020, 13, 985–1017. [Google Scholar] [CrossRef] [Green Version]
- Zhang, W.; Fang, C.; Zhou, L.; Zhu, J. Measuring megaregional structure in the Pearl River Delta by mobile phone signaling data: A complex network approach. Cities 2020, 104, 102809. [Google Scholar] [CrossRef]
- Deville, P.; Linard, C.; Martin, S.; Gilbert, M.; Stevens, F.R.; Gaughan, A.E.; Blondel, V.D.; Tatem, A.J. Dynamic population mapping using mobile phone data. Proc. Natl. Acad. Sci. USA 2014, 111, 15888–15893. [Google Scholar] [CrossRef] [PubMed] [Green Version]
- Picornell, M.; Ruiz, T.; Borge, R.; García-Albertos, P.; de la Paz, D.; Lumbreras, J. Population dynamics based on mobile phone data to improve air pollution exposure assessments. J. Exp. Sci. Environ. Epidemiol. 2019, 29, 278–291. [Google Scholar] [CrossRef]
- Liu, L.; Biderman, A.; Ratti, C. Urban Mobility Landscape: Real Time Monitoring of Urban Mobility Patterns. In Proceedings of the 11th International Conference on Computers in Urban Planning and Urban Management, Hong Kong, China, 16–18 June 2009; pp. 1–16. [Google Scholar]
- Wei, S.; Wang, L. Examining transportation network structures through mobile signaling data in urban China: A case study of Yixing. J. Spat. Sci. 2020, 1–18. [Google Scholar] [CrossRef]
- Tu, W.; Cao, J.; Yue, Y.; Shaw, S.L.; Zhou, M.; Wang, Z.; Chang, X.; Xu, Y.; Li, Q. Coupling mobile phone and social media data: A new approach to understanding urban functions and diurnal patterns. Int. J. Geogr. Inf. Sci. 2017, 31, 2331–2358. [Google Scholar] [CrossRef]
- Candia, J.; González, M.C.; Wang, P.; Schoenharl, T.; Madey, G.; Barabási, A.L. Uncovering individual and collective human dynamics from mobile phone records. J. Phys. A Math. Theor. 2008, 41, 224015. [Google Scholar] [CrossRef] [Green Version]
- Ahas, R.; Aasa, A.; Yuan, Y.; Raubal, M.; Smoreda, Z.; Liu, Y.; Ziemlicki, C.; Tiru, M.; Zook, M. Everyday space–time geographies: Using mobile phone-based sensor data to monitor urban activity in Harbin, Paris, and Tallinn. Int. J. Geogr. Inf. Sci. 2015, 29, 2017–2039. [Google Scholar] [CrossRef]
- Nakanishi, W.; Yamaguchi, H.; Fukuda, D. Feature extraction of inter-region travel pattern using random matrix theory and mobile phone location data. Transp. Res. Procedia 2018, 34, 115–122. [Google Scholar] [CrossRef]
- Jiang, S.; Ferreira, J.; Gonzalez, M.C. Activity-Based Human Mobility Patterns Inferred from Mobile Phone Data: A Case Study of Singapore. IEEE Trans. Big Data 2017, 3, 208–219. [Google Scholar] [CrossRef] [Green Version]
- Hirota, M.; Shirai, M.; Ishikawa, H.; Yokoyama, S. Detecting relations of hotspots using geo-tagged photographs in social media sites. In Proceedings of the 1st International ACM Workshop on Managing and Mining Enriched Geo-Spatial Data, GeoRich 2014—In Conjunction with SIGMOD 2014, Snowbird, UT, USA, 27 June 2014. [Google Scholar]
- Huang, B.; Zhou, Y.; Li, Z.; Song, Y.; Cai, J.; Tu, W. Evaluating and characterizing urban vibrancy using spatial big data: Shanghai as a case study. Environ. Plan. B Urban Anal. City Sci. 2020, 47, 1543–1559. [Google Scholar] [CrossRef]
- Stephen, A.T. The role of digital and social media marketing in consumer behavior. Curr. Opin. Psychol. 2016, 10, 17–21. [Google Scholar] [CrossRef]
- Croitoru, A.; Wayant, N.; Crooks, A.; Radzikowski, J.; Stefanidis, A. Linking cyber and physical spaces through community detection and clustering in social media feeds. Comput. Environ. Urban Syst. 2015, 53, 47–64. [Google Scholar] [CrossRef]
- Phithakkitnukoon, S.; Horanont, T.; Di Lorenzo, G.; Shibasaki, R.; Ratti, C. Activity-aware map: Identifying human daily ac-tivity pattern using mobile phone data. In Proceedings of the Lecture Notes in Computer Science (including subseries Lec-ture Notes in Artificial Intelligence and Lecture Notes in Bioinformatics), Istanbul, Turkey, 22 August 2010; Volume 6219, pp. 14–25. [Google Scholar]
- Toole, J.L.; Ulm, M.; González, M.C.; Bauer, D. Inferring land use from mobile phone activity. In Proceedings of the ACM SIGKDD International Workshop on Urban Computing, UrbComp@KDD 2012, Beijing, China, 12 August 2012; 12, p. 1. [Google Scholar] [CrossRef] [Green Version]
- Eicher, C.L.; Brewer, C.A. Dasymetric mapping and areal interpolation: Implementation and evaluation. Cartogr. Geogr. Inf. Sci. 2001, 28, 125–138. [Google Scholar] [CrossRef]
- Järv, O.; Tenkanen, H.; Toivonen, T. Enhancing spatial accuracy of mobile phone data using multi-temporal dasymetric interpolation. Int. J. Geogr. Inf. Sci. 2017, 31, 1630–1651. [Google Scholar] [CrossRef]
- Kubíček, P.; Konečný, M.; Stachoň, Z.; Shen, J.; Herman, L.; Řezník, T.; Staněk, K.; Štampach, R.; Leitgeb, Š. Population distribution modelling at fine spatio-temporal scale based on mobile phone data. Int. J. Digit. Earth 2019, 12, 1319–1340. [Google Scholar] [CrossRef]
- Liu, L.; Peng, Z.; Wu, H.; Jiao, H.; Yu, Y. Exploring urban spatial feature with dasymetric mapping based on mobile phone data and LUR-2SFCAe method. Sustainability 2018, 10, 2432. [Google Scholar] [CrossRef] [Green Version]
- YiMagazine New First-Tier Cities. Available online: https://www.cbnweek.com/topics/10 (accessed on 3 November 2021).
- World City Classification Ranking According to GaWC. Available online: https://www.lboro.ac.uk/gawc/world2018t.html (accessed on 3 November 2021).
- Liu, S.; Zhang, L.; Long, Y. Long Urban Vitality Area Identification and Pattern Analysis from the Perspective of Time and Space Fusion. Sustainability 2019, 11, 4032. [Google Scholar] [CrossRef] [Green Version]
- Vajakas, T.; Vajakas, J.; Lillemets, R. Trajectory reconstruction from mobile positioning data using cell-to-cell travel time information. Int. J. Geogr. Inf. Sci. 2015, 29, 1941–1954. [Google Scholar] [CrossRef]
- Yao, Y.; Li, X.; Liu, X.; Liu, P.; Liang, Z.; Zhang, J.; Mai, K. Sensing spatial distribution of urban land use by integrating points-of-interest and Google Word2Vec model. Int. J. Geogr. Inf. Sci. 2017, 31, 825–848. [Google Scholar] [CrossRef]
- Jing, Y.; Liu, Y.; Cai, E.; Yi, L.; Zhang, Y. Quantifying the spatiality of urban leisure venues in Wuhan, Central China—GIS-based spatial pattern metrics. Sustain. Cities Soc. 2018, 40, 638–647. [Google Scholar] [CrossRef]
- Long, Y.; Huang, C.C. Does block size matter? The impact of urban design on economic vitality for Chinese cities. Environ. Plan. B Urban Anal. City Sci. 2019, 46, 406–422. [Google Scholar] [CrossRef] [Green Version]
- Ahas, R.; Laineste, J.; Aasa, A.; Mark, Ü. The Spatial Accuracy of Mobile Positioning: Some experiences with Geographical Studies in Estonia. In Location Based Services and TeleCartography; Springer Science & Business Media: Berlin/Heidelberg, Germany, 2007. [Google Scholar]
- Ester, M.; Kriegel, H.-P.; Sander, J.; Xu, X. A Density-Based Algorithm for Discovering Clusters in Large Spatial Databases with Noise. In Proceedings of the 2nd International Conference on Knowledge Discovery and Data Mining, Portland, OR, USA, 2–4 August 1996. [Google Scholar]
- Rousseeuw, P.J. Silhouettes: A graphical aid to the interpretation and validation of cluster analysis. J. Comput. Appl. Math. 1987, 20, 53–65. [Google Scholar] [CrossRef] [Green Version]
- Moreira, A.; Santos, M.Y. Concave hull: A Jt-Nearest neighbours approach for the computation of the region occupied by a set of points. In Proceedings of the 2nd International Conference on Computer Graphics Theory and Applications, Barcelona, Spain, 8–11 March 2007. [Google Scholar]
- García-Palomares, J.C.; Salas-Olmedo, M.H.; Moya-Gómez, B.; Condeço-Melhorado, A.; Gutiérrez, J. City dynamics through Twitter: Relationships between land use and spatiotemporal demographics. Cities 2018, 72, 310–319. [Google Scholar] [CrossRef]
- Zhang, W.; Ji, C.; Yu, H.; Zhao, Y.; Chai, Y. Interpersonal and Intrapersonal Variabilities in Daily Activity-Travel Patterns: A Networked Spatiotemporal Analysis. ISPRS Int. J. Geo-Inf. 2021, 10, 148. [Google Scholar] [CrossRef]
- Ratti, C.; Frenchman, D.; Pulselli, R.M.; Williams, S. Mobile landscapes: Using location data from cell phones for urban analysis. Environ. Plan. B Plan. Des. 2006, 33, 727–748. [Google Scholar] [CrossRef]
- Liu, Y.; Jing, Y.; Cai, E.; Cui, J.; Zhang, Y.; Chen, Y. How leisure venues are and why? A geospatial perspective in Wuhan, Central China. Sustainability 2017, 9, 1865. [Google Scholar] [CrossRef] [Green Version]
- Cui, C.; Wang, J.; Wu, Z.; Ni, J.; Qian, T. The socio-spatial distribution of leisure venues: A case study of karaoke bars in Nanjing, China. ISPRS Int. J. Geo-Inform. 2016, 5, 150. [Google Scholar] [CrossRef] [Green Version]
- Xu, D.; Huang, Z.; Lv, L.; Chen, X.; Cao, F. Research on Spatial Characteristic of Urban Leisure Tourism Based on POI Mining: A Case Study of Nanjing City. Geogr. Geo-Inform. Sci. 2018, 34, 59–64. [Google Scholar]
- Jia, Z.; Lin, B. How to achieve the first step of the carbon-neutrality 2060 target in China: The coal substitution perspective. Energy 2021, 233, 121179. [Google Scholar] [CrossRef]
- Iovan, C.; Olteanu-Raimond, A.-M.; Couronné, T.; Smoreda, Z. Moving and calling: Mobile phone data quality measurements and spatiotemporal uncertainty in human mobility studies. In Geographic Information Science at the Heart of Europe; Springer: Berlin/Heidelberg, Germany, 2013; pp. 247–265. [Google Scholar]
Figure 1.
Study area and the distribution of leisure-related POIs and AOIs.

Figure 2.
The quantitative estimation framework of urban leisure activity dynamic distribution merging multiple big data. The five core steps are drawn using different colors.
Figure 2.
The quantitative estimation framework of urban leisure activity dynamic distribution merging multiple big data. The five core steps are drawn using different colors.

Figure 3.
The results of clustering parameter training in the typical sample region.

Figure 4.
Recognition results of the ULDs in Nanjing (a) and the implementation details of the ULD recognition method in the selected sample region (b), which is the magnification of the red frame in (a). (b) shows the ULDs generated by leisure POI clusters, and the leisure area near the residence was successfully identified.

Figure 5.
The statistical distribution of the number of urban leisure on weekdays and weekends: (a) Shows the hull number of leisure groups; (b) shows the leisure density (number of leisure activities per km2) in different districts.
Figure 5.
The statistical distribution of the number of urban leisure on weekdays and weekends: (a) Shows the hull number of leisure groups; (b) shows the leisure density (number of leisure activities per km2) in different districts.

Figure 6.
Leisure activity choices of the four districts: (a,b) show the leisure activity choices during weekday afternoons and nights; (c,d) show the leisure activity choices during weekend afternoons and weekend nights.
Figure 6.
Leisure activity choices of the four districts: (a,b) show the leisure activity choices during weekday afternoons and nights; (c,d) show the leisure activity choices during weekend afternoons and weekend nights.

Figure 7.
Heatmap for the spatiotemporal similarity of leisure activities. The closer the value is to 1, the higher the similarity. Axis labels starting with “O” indicate weekdays, and those starting with “W” indicate weekends.
Figure 7.
Heatmap for the spatiotemporal similarity of leisure activities. The closer the value is to 1, the higher the similarity. Axis labels starting with “O” indicate weekdays, and those starting with “W” indicate weekends.

Figure 8.
Comparison of morning urban leisure activity participants between weekday and weekend.

Figure 9.
Comparison of afternoon urban leisure activity participants between weekday and weekend.


Table 1.
Examples of the MSD (the MDNs are anonymized).
| Time | MDN | Latitude | Longitude | Cell-ID | City Code |
|---|---|---|---|---|---|
| 2020-03-31 03:30:22 | 58cd96fec3db50f7b330fd314843a0aadb834c7d | 32.457848 | 119.94319 | 23215 | 1 |
| 2020-04-01 06:10:32 | 58cd96fec3db50f7b330fd314843a0aadb834c7d | 32.457325 | 119.91334 | 4212 | 1 |
| … | … | … | … | … | … |
Table 2.
Classification of leisure-related POIs and AOIs, and statistics on the number of these data collected in Nanjing.
Table 2.
Classification of leisure-related POIs and AOIs, and statistics on the number of these data collected in Nanjing.
| Leisure Type | POI (AOI) Types | AOI Number | POIs Number |
|---|---|---|---|
| Culture | Theatres, libraries, cultural palaces, libraries, museums, art galleries, concert halls, arboretums, zoos, aquariums, temples, churches, memorial halls, exhibition halls | 76 | 1586 |
| Sport | Stadiums, pools, tennis courts, football fields, badminton courts, taekwondo stadiums, basketball halls, table tennis halls, bowling rooms, skating rinks, gymnasiums, picking gardens, fishing parks, campgrounds, golf courses, racetracks | 50 | 3489 |
| Sightseeing | Holiday resorts, urban scenic spots, parks | 199 | 1928 |
| Recreation | amusement parks, shopping malls, shopping streets, supermarkets, SPA, barbershops, restaurants, bakeries, cold drink shops, bars, cafes, dessert shops, teahouses, KTV, gaming rooms, Internet cafés, nightclubs, urban squares, flower markets, home building materials markets, home appliance stores, bath and massage houses | 447 | 114,934 |
Table 3.
Statistical description for maximum stay times (minutes) during the day and at night for locals and visitors.
Table 3.
Statistical description for maximum stay times (minutes) during the day and at night for locals and visitors.
| Statistical Indexes | Locals | Visitors | ||||
|---|---|---|---|---|---|---|
| Number of people | 2,501,352 | 601,947 | ||||
| Stay time | Days | Home | Work | Days | Daytime | Nighttime (Home) |
| Mean | 13 | 1734.47 | 3198.01 | 3 | 221.49 | 578.46 |
| Min | 10 | 300 | 300 | 1 | 15 | 16 |
| 25% | 14 | 747 | 2053 | 2 | 82 | 385 |
| 50% | 14 | 1371 | 3073 | 3 | 145 | 420 |
| 75% | 14 | 2436 | 4325 | 4 | 269 | 817 |
| Max | 14 | 6720 | 5880 | 5 | 2400 | 2100 |
Table 4.
Recognition results of the number and proportion of urban human activities.
| Period | Home | Work | Leisure | Others | |
|---|---|---|---|---|---|
| Number of activities | Weekday | 7,600,138 | 3,290,164 | 2,651,669 | 916,158 |
| Ratio | 52.6% | 22.8% | 18.3% | 6.3% | |
| Number of activities | Weekend | 8,132,912 | 2,373,945 | 3,268,313 | 1,047,321 |
| Ratio | 54.9% | 16.0% | 22.0% | 7.1% |
Table 5.
The proportion of four types of leisure activity participants during different periods.
| Time | Periods | Recreation | Sightseeing | Sport | Culture |
|---|---|---|---|---|---|
| Early morning | Weekday | 0.974 | 0.007 | 0.01 | 0.009 |
| Weekend | 0.974 | 0.007 | 0.01 | 0.009 | |
| Morning | Weekday | 0.827 | 0.108 | 0.025 | 0.04 |
| Weekend | 0.826 | 0.111 | 0.022 | 0.041 | |
| Afternoon | Weekday | 0.844 | 0.095 | 0.026 | 0.036 |
| Weekend | 0.842 | 0.099 | 0.022 | 0.036 | |
| Night | Weekday | 0.896 | 0.065 | 0.024 | 0.015 |
| Weekend | 0.901 | 0.062 | 0.022 | 0.015 |
Table 6.
Geographical spatial regression modeling of leisure activities and density of leisure facilities.
Table 6.
Geographical spatial regression modeling of leisure activities and density of leisure facilities.
| Period | Districts | Results of OLS Spatial Regression | ||||
|---|---|---|---|---|---|---|
| Coefficient | Adjusted R2 | Koenker (BP) | Joint Wald Statistic | Joint F-Statistic | ||
| Afternoon (weekend) | Main city | 8.6442 | 0.7223 | 0.000000 * | 0.000000 * | 0.000000 * |
| Jiangbei | 5.4166 | 0.6983 | 0.000000 * | 0.000000 * | 0.000000 * | |
| Dongshan | 5.7598 | 0.6412 | 0.000000 * | 0.000000 * | 0.000000 * | |
| Xianlin | 9.0109 | 0.4842 | 0.000000 * | 0.021588 * | 0.000000 * | |
| Night (weekend) | Main city | 5.5404 | 0.7824 | 0.000000 * | 0.000000 * | 0.000000 * |
| Jiangbei | 3.0202 | 0.5968 | 0.000000 * | 0.000000 * | 0.000000 * | |
| Dongshan | 3.8880 | 0.6450 | 0.000003 * | 0.000000 * | 0.000000 * | |
| Xianlin | 6.1764 | 0.5025 | 0.000000 * | 0.018414 * | 0.000000 * | |
Note: * represents the significance level of 1%.
Publisher’s Note: MDPI stays neutral with regard to jurisdictional claims in published maps and institutional affiliations. |
© 2021 by the authors. Licensee MDPI, Basel, Switzerland. This article is an open access article distributed under the terms and conditions of the Creative Commons Attribution (CC BY) license (https://creativecommons.org/licenses/by/4.0/).
Share and Cite
MDPI and ACS Style
Liu, S.; Long, Y.; Zhang, L.; Liu, H. Quantifying and Characterizing Urban Leisure Activities by Merging Multiple Sensing Big Data: A Case Study of Nanjing, China. Land 2021, 10, 1214. https://doi.org/10.3390/land10111214
AMA Style
Liu S, Long Y, Zhang L, Liu H. Quantifying and Characterizing Urban Leisure Activities by Merging Multiple Sensing Big Data: A Case Study of Nanjing, China. Land. 2021; 10(11):1214. https://doi.org/10.3390/land10111214
Chicago/Turabian StyleLiu, Shaojun, Yao Long, Ling Zhang, and Hao Liu. 2021. "Quantifying and Characterizing Urban Leisure Activities by Merging Multiple Sensing Big Data: A Case Study of Nanjing, China" Land 10, no. 11: 1214. https://doi.org/10.3390/land10111214
Note that from the first issue of 2016, this journal uses article numbers instead of page numbers. See further details here.