
Mapping the Medieval Wall System of China and Mongolia: A Multi-Method Approach
by
 , , ,
, , ,
Michael Storozum
1,*, 
Dan Golan
1,
Ido Wachtel
2,
Zhidong Zhang
3 ,
,
Johannes S. Lotze
1 and 
Gideon Shelach-Lavi
1 1
Department of Asian Studies, The Hebrew University of Jerusalem, Mt. Scopus, Jerusalem 9190501, Israel
2
Institute of Archaeology, The Hebrew University of Jerusalem, Mt. Scopus, Jerusalem 9190501, Israel
3
Department of Bible Studies, The Hebrew University, Mt. Scopus, Jerusalem 9190501, Israel
*
Author to whom correspondence should be addressed.
Land 2021, 10(10), 997; https://doi.org/10.3390/land10100997
Submission received: 12 August 2021
/
Revised: 18 September 2021
/
Accepted: 19 September 2021
/
Published: 23 September 2021
(This article belongs to the Special Issue 100 Years of Archaeological Research in China (1921-2021): A Space-Based Perspective)
Abstract
:The Medieval Wall System of China and Mongolia is one of the longest wall systems in the world, but its specific chronology, function, and purpose remain ambiguous. Constructed at various points throughout the 10th to 13th centuries CE, this network of walls, forts, and enclosures covers an estimated 4000 km and spans a wide range of ecozones, from the deserts of western China to the steppes of northern Mongolia and the Khingan mountain range. In this article we used historical atlases, topographic maps, and an array of different kinds of data derived from satellite remote sensing, to produce one of the first accurate maps of the Medieval Wall System. Through this large-scale mapping program, we are now able to evaluate previous work that estimates the length of the wall system and different areas of construction. By measuring the structures associated with the wall and the length of the wall itself, we identified at least three different areas of construction along the Medieval Wall System. Future studies may be able to use similar tools to develop more accurate maps of other wall systems throughout Eurasia to further advance the comparative study of ancient wall systems.
1. Introduction
Many ancient wall systems have been found throughout Eurasia, but there are surprisingly few studies that search for the cross-cultural similarities and differences among them [1,2]. For example, the Roman limes and the Sasanian Gorgān and Tammīsheh walls are all fairly well-studied wall systems in their own right, but due to their spatial and temporal distance from one another, they are rarely discussed within a comparative framework [3,4,5]. The general lack of comparative studies may be in part caused by the fact that ancient wall systems are oftentimes immense architectural installations that frequently cross modern political boundaries, rugged topography, and diverse ecosystems, making it difficult for archaeologists to accurately map them, let alone excavate their numerous auxiliary structures. For all of these reasons, archaeological research on long-walls and other types of border markings and fortifications in antiquity is usually based on fragmentary historical records and partial archaeological excavations, limiting the potential for cross-cultural comparison.
Since ancient wall systems pose many challenges for archaeological and historical study, new methods are required to study these systems and their role in shaping and creating frontier zones. Remote sensing technologies now enable archaeologists to map and quantify the length, width, and function of ancient walls and the array of auxiliary structures associated with them [6]. Moreover, the widespread availability of many varieties of geographic data now makes mapping ancient wall systems possible. These new technologies and datasets provide archaeologists with the tools to develop a better understanding of specific wall systems and generate theories regarding the driving forces behind wall constructing behaviors [7,8,9,10].
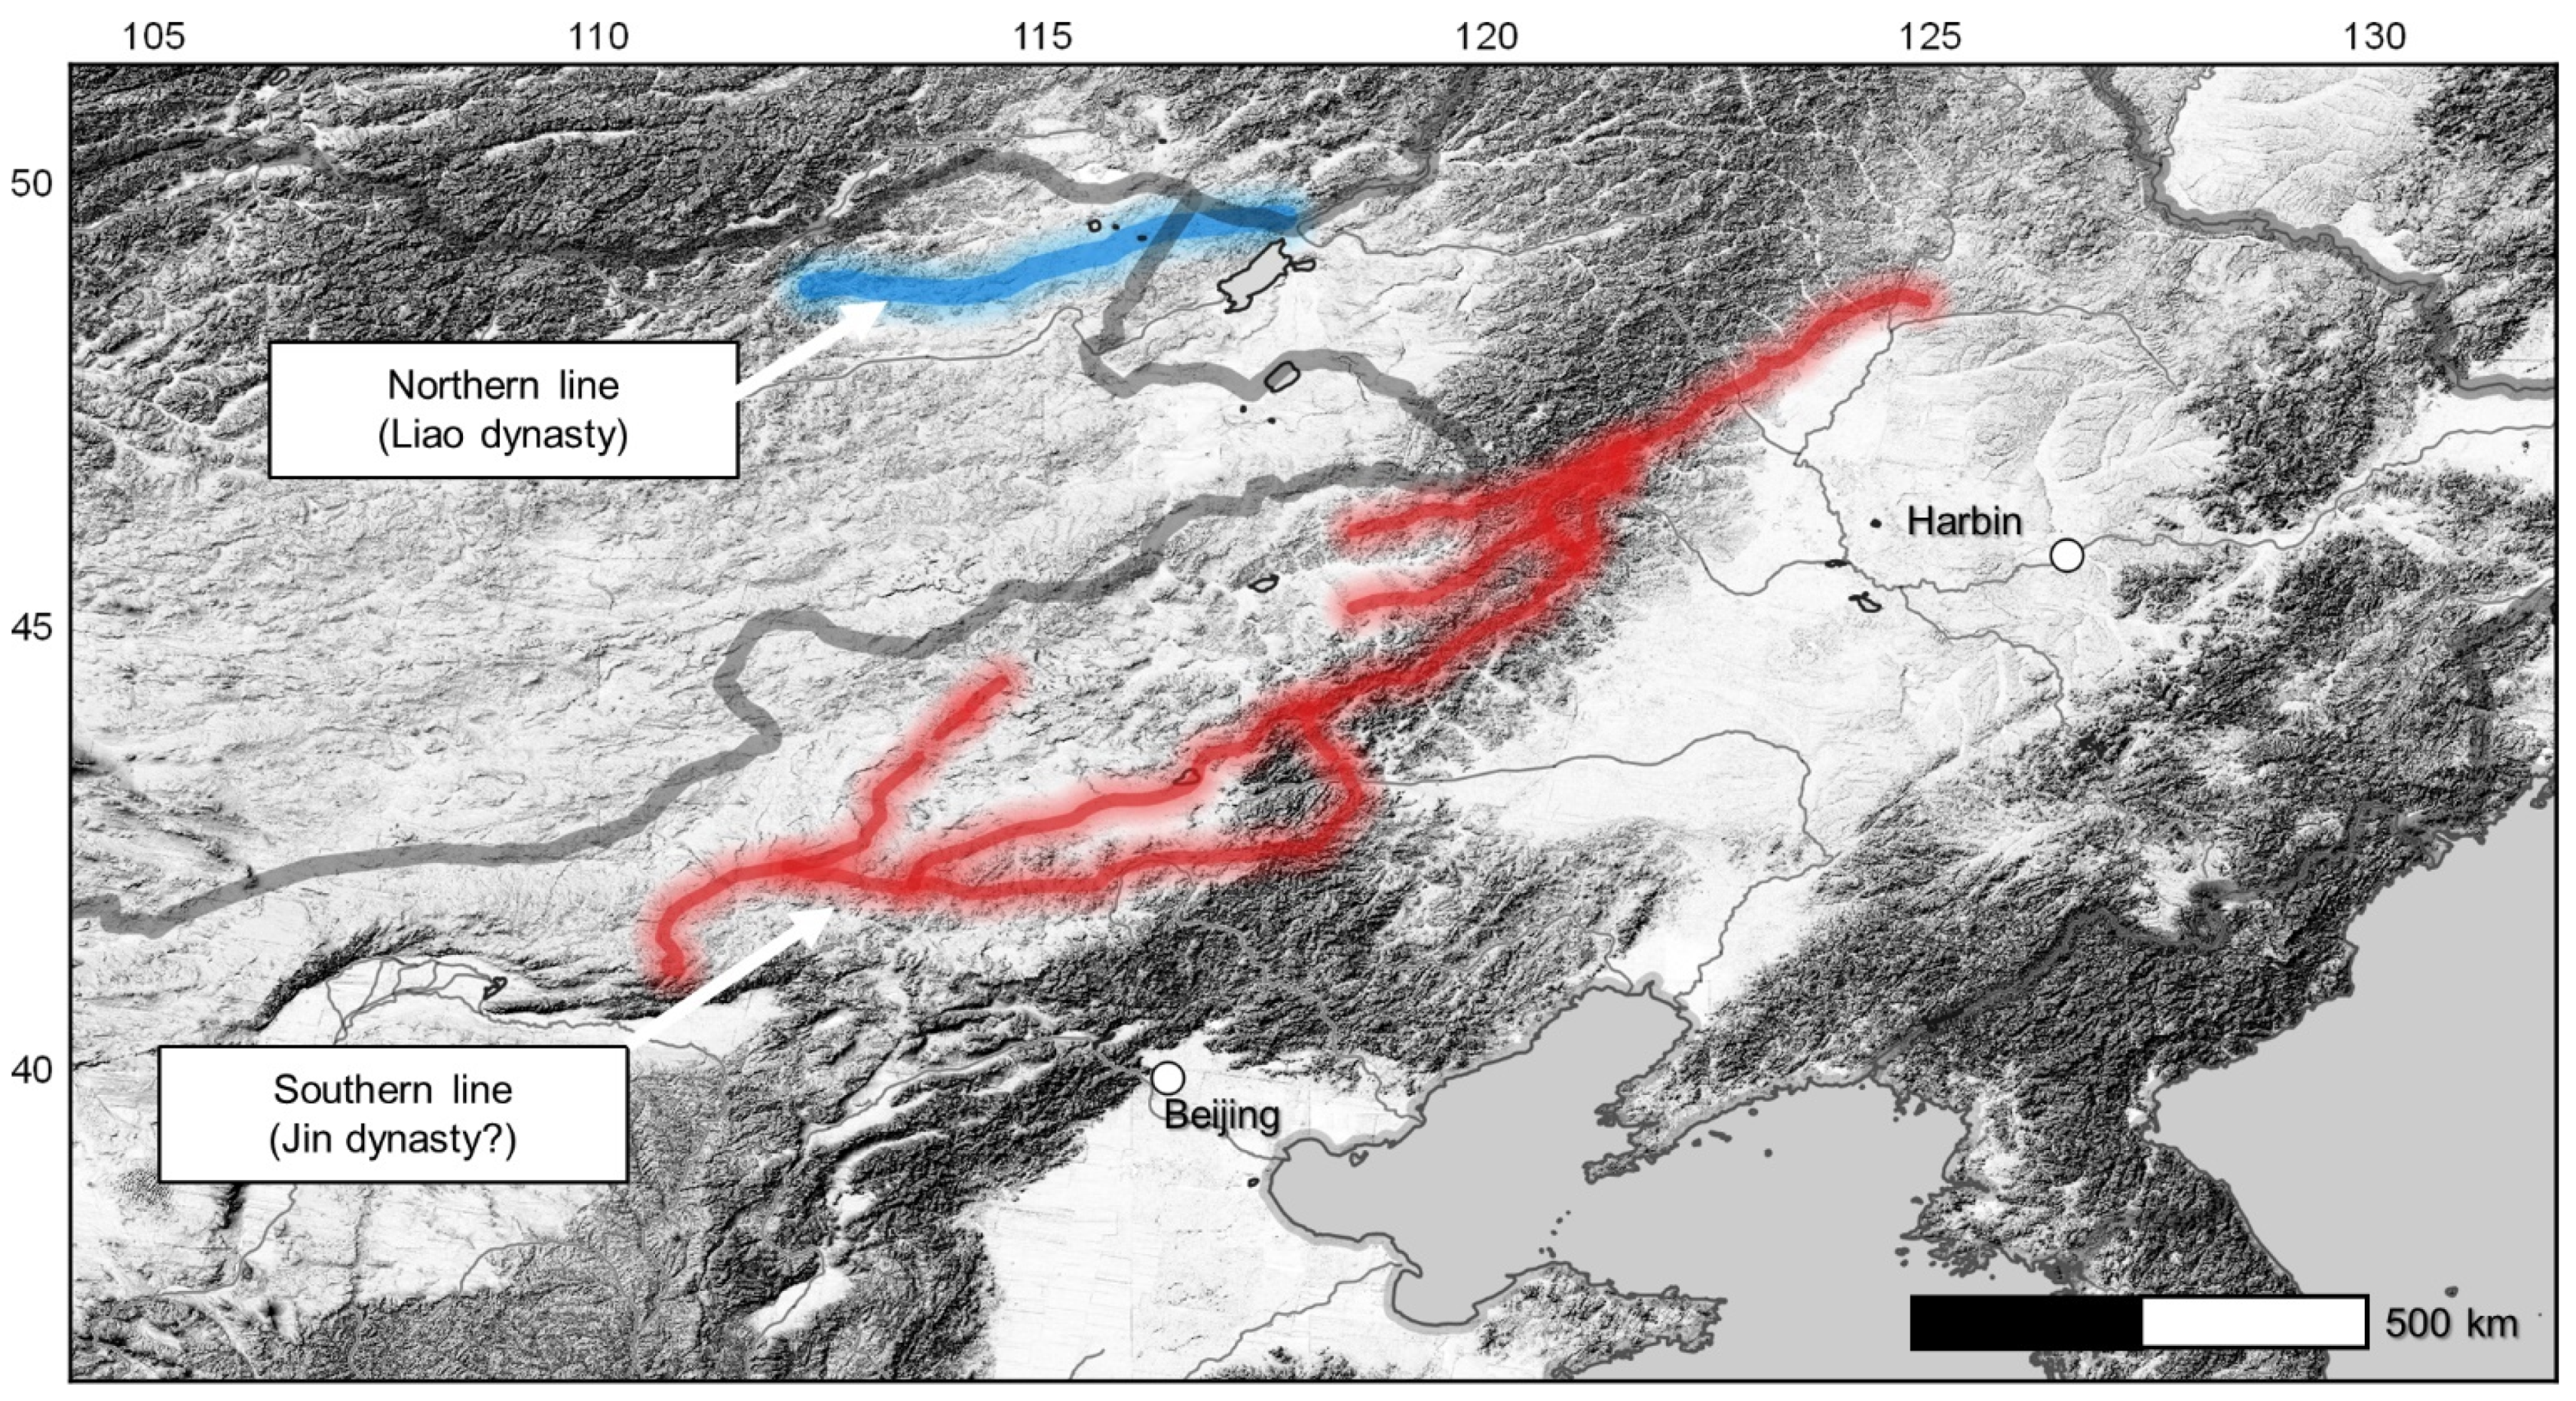
Recent research on the so-called “Great Wall,” the longest and most complex set of walls constructed in history, exemplifies many of the methodological and theoretical advances that remote sensing technologies and geospatial analyses now enable [11,12]. While the majority of this research work focuses on the most well-known parts of the “Great Wall,” namely the Han (202 BCE–220 CE) or Ming dynasties’ (1368–1644 CE) sections of the wall, the “Great Wall” is actually a colloquial term used to refer to all major episodes of wall construction in China and Mongolia. Of all the different parts of the “Great Wall,” the Jin border trench (Jin Jiehao in Chinese), which is usually associated with the Jin dynasty (1115–1234 CE), is one of the least understood [13,14,15,16] (Figure 1). Archaeological research, historical records, and limited radiocarbon evidence place its construction between around 1000 to 1230 CE [17,18,19], but different sections of this fortification were likely built at different times for different reasons. The Jin border trench is a complex system of walls and trenches that extends from northeastern China through to Mongolia, covering roughly 4000 km. Additionally, alongside the wall lines and the ditches there are also hundreds of large auxiliary structures such as forts and beacon towers. Even though scholars have studied this wall for at least a hundred years [20], there is still no consensus on when exactly this wall system was built, who built it, and for what purpose. Given this persistent unclearness, rather than name this wall after a specific dynasty such as the Jin, we call this wall system the “Medieval Wall System,” or the MWS, to denote the temporal ambiguity of this immense architectural installation.
From a historical perspective, the motives behind the construction of the MWS are highly relevant for understanding China and Mongolia on the eve of Chinggis Khan’s rise to power in 1206 CE [14]. The dynastic empires most likely to have constructed the MWS are the Liao (916–1125 CE) and the Jin (1115–1234 CE) dynasties, both of which were founded by nomadic or semi-nomadic peoples. Accordingly, these semi-nomadic peoples may have had a different concept of empire, having more to do with control over people, many of them nomads, rather than forming clearly defined land borders [21]. Previous scholarship has assumed that all “Great Walls” were fortified border lines designed to stop military incursions, but this may not have been the exclusive function of the MWS [17,20,22]. Our work along the so-called “Wall of Chinggis Khan,“ or the northern line of the MWS which stretches across 734 km in the border area of northeast Mongolia, southern Siberia, and north China, suggests that the location of the wall and the auxiliary structures associated with it are not compatible with what we might expect from a military installation intended to defend the border against invading armies [13,14]. Based on this preliminary information, an alternative hypothesis suggests that the MWS, and maybe other episodes of “Great Wall” construction in East Asian history, were built to monitor, and sometimes stop, movements of people, rather than armies.
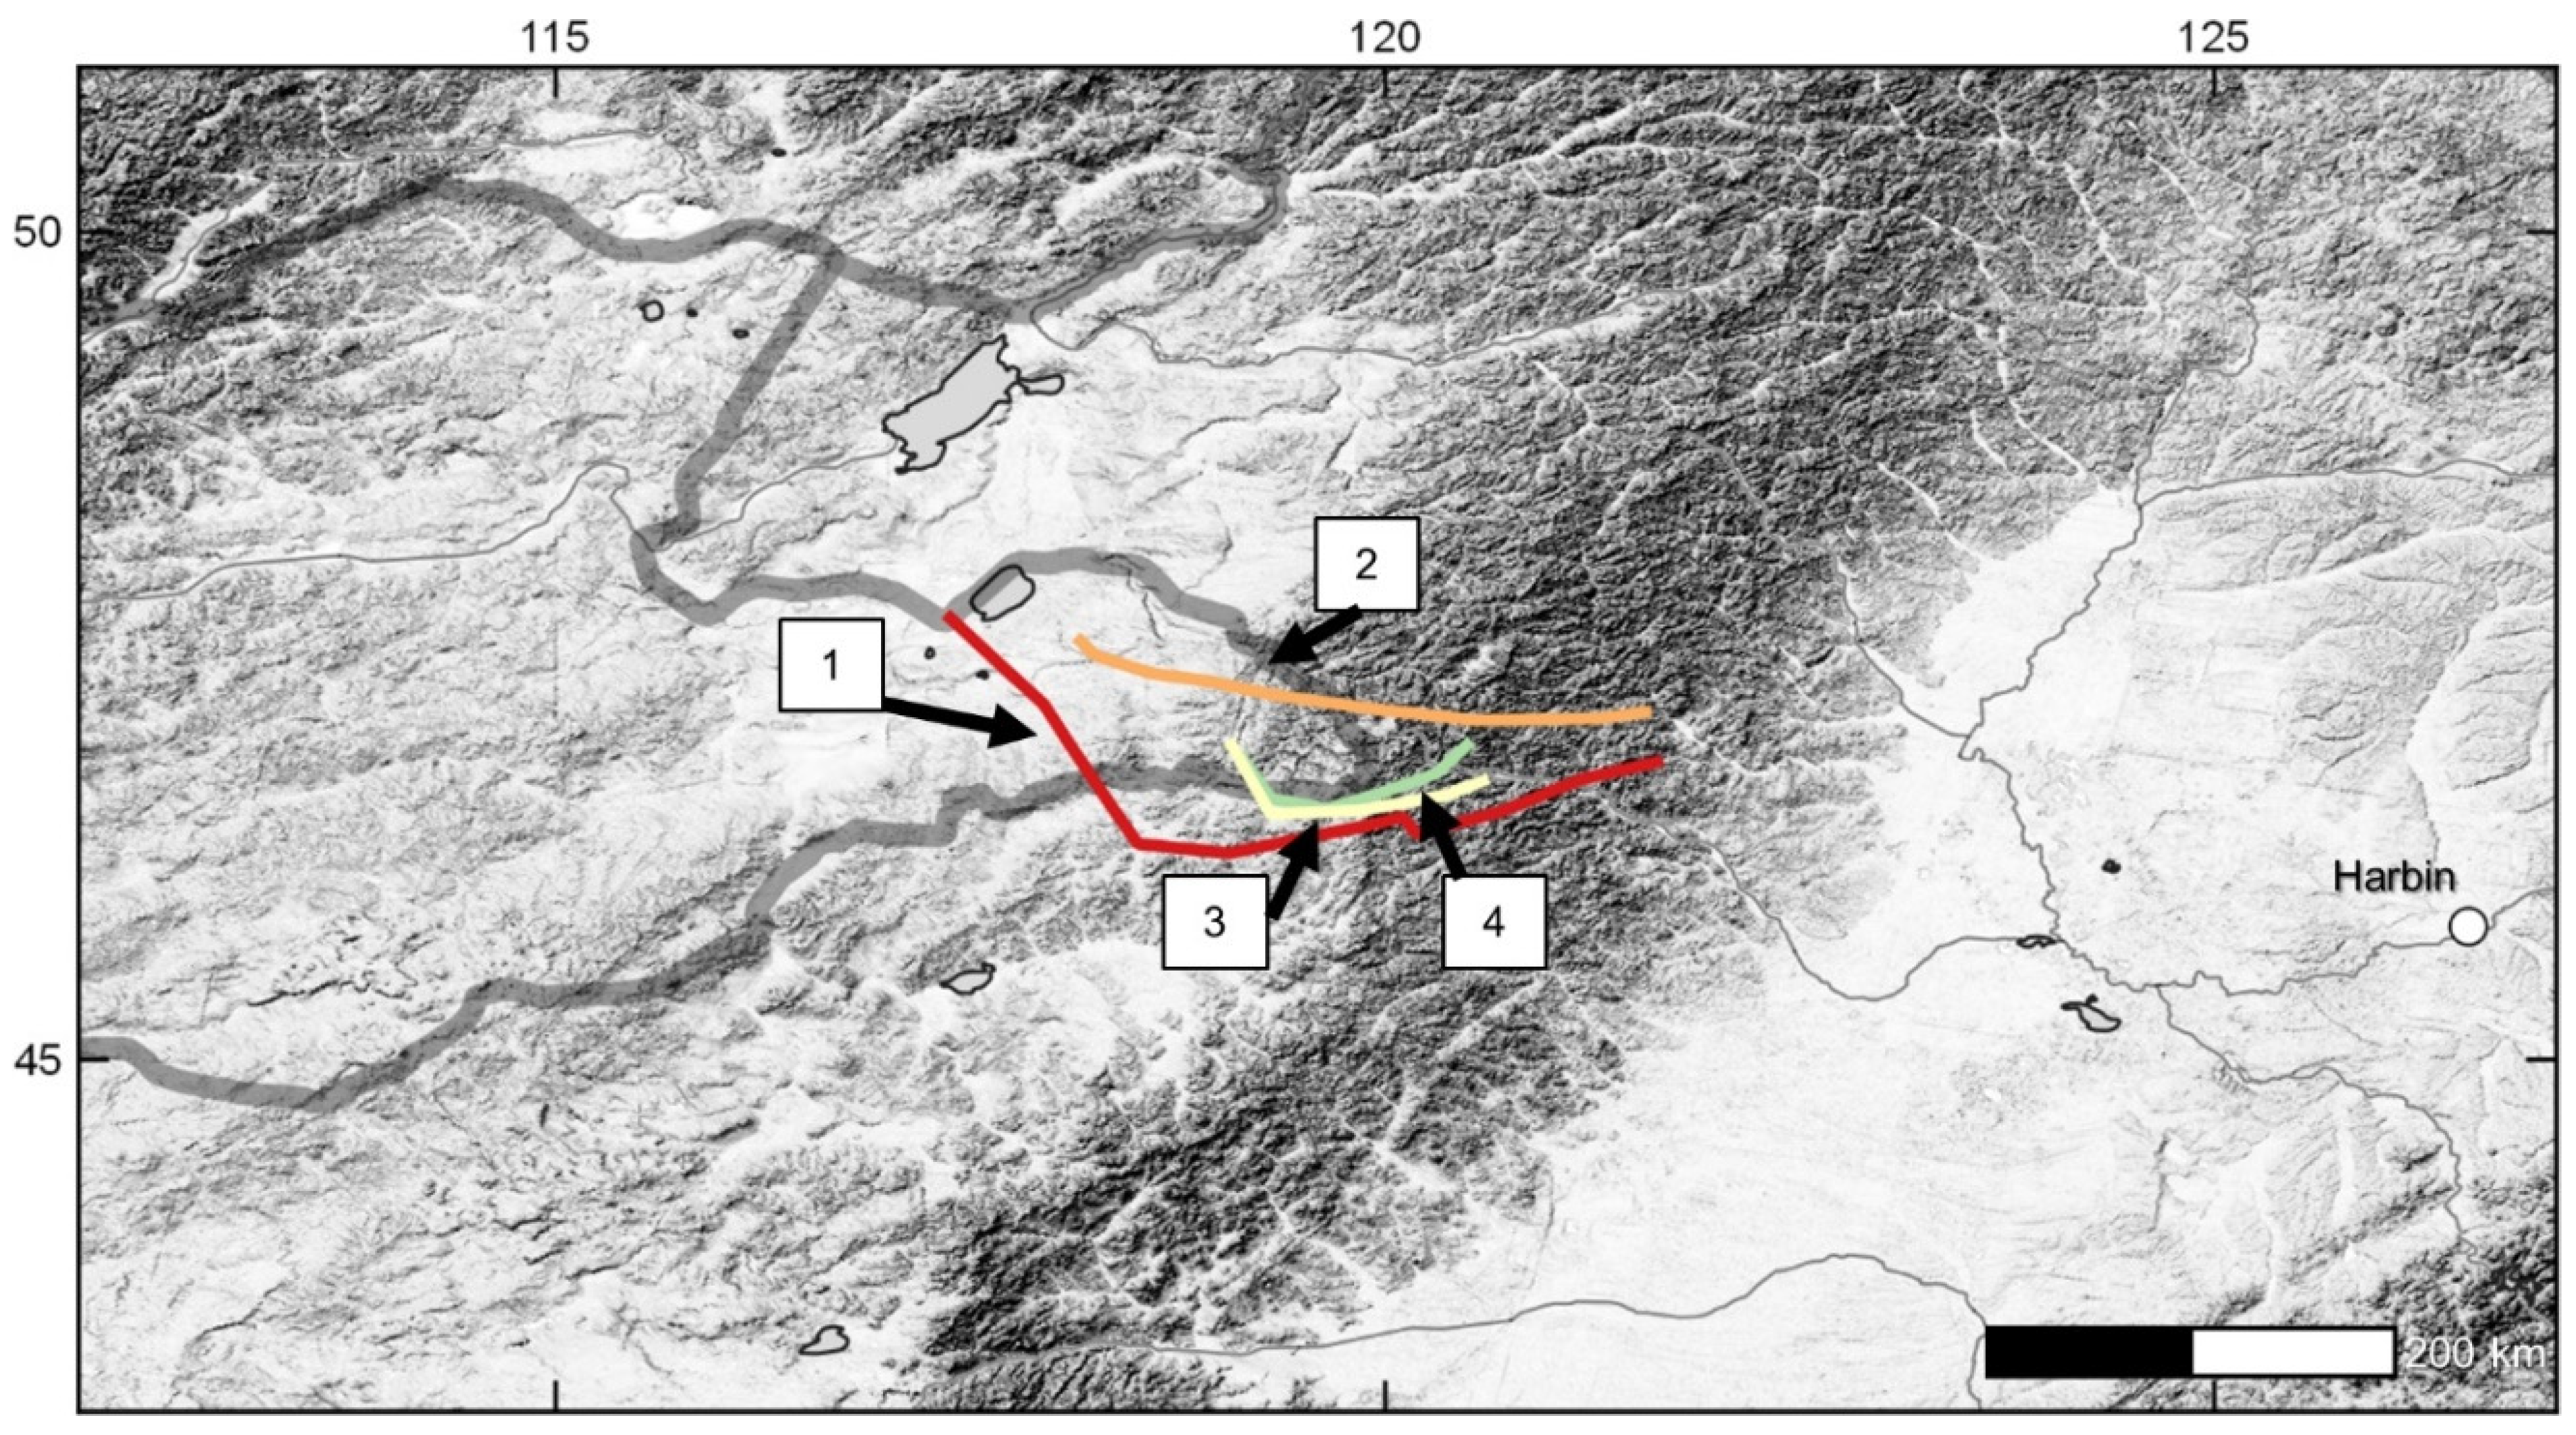
Although the chronology and function of the northern line is gradually coming into focus through recent archaeological work, the exact location and chronology of the southern part of the MWS remains ambiguous. Archaeologists and historians generally credit the Jin dynasty with constructing the southern line of the MWS. The southern line presumably acted as a defense against the rising Mongol threat to the north and the Western Xia kingdom (1038–1227 CE) to the west. Over the past several decades archaeological surveys and historical investigations have attempted to pinpoint the location of the southern sections of the MWS [23,24,25,26], but this geographic data is frequently contradictory (Figure 2). Even estimates of the total length of the MWS vary considerably [22,27,28,29]. In one of the earliest studies published on the MWS, Shou [30] estimated that the MWS in the Gobi Desert alone is longer than 3000 km. Feng [27] argues that the entire wall, including parallel lines, is some 6500 km long, whereas Jing and Miao [17] estimated that the MWS is 3500 km long. In the most recent book published on the MWS, the authors estimated that the wall (including the ditches) is more than 4000 km long [26], matching the estimate provided by the Bureau of Cultural Relic’s official report on the Great Wall [31].
Given all of this uncertainty surrounding the length and location of the southern portion of the MWS, a comprehensive and accurate map of the different sections of the southern portion of the MWS is a necessary prerequisite for answering questions concerning the wall itself and for developing a comparative study of ancient walls systems. Therefore, the primary aim of this study is to develop a methodology to complete one of the first geospatially accurate maps of the MWS. We use georeferenced atlases, Synthetic Aperture Radar (SAR), and CORONA images from the 1970s, to determine if the MWS extends across northern China and Mongolia. After clearly resolving the location and architectural characteristics of the MWS, we explore the potential for geostatistical approaches to identify spatial patterns in construction methods, wall length and style, and fort size. Through this multi-method approach, we aim to rectify inconsistencies in maps of the MWS and provide a revised foundation from which to address many of the outstanding questions related to the chronology, function, and purpose of the MWS. After developing this multi-method approach, we propose that similar approaches may be useful for furthering comparative research on ancient wall systems throughout Eurasia.
2. Materials and Methods
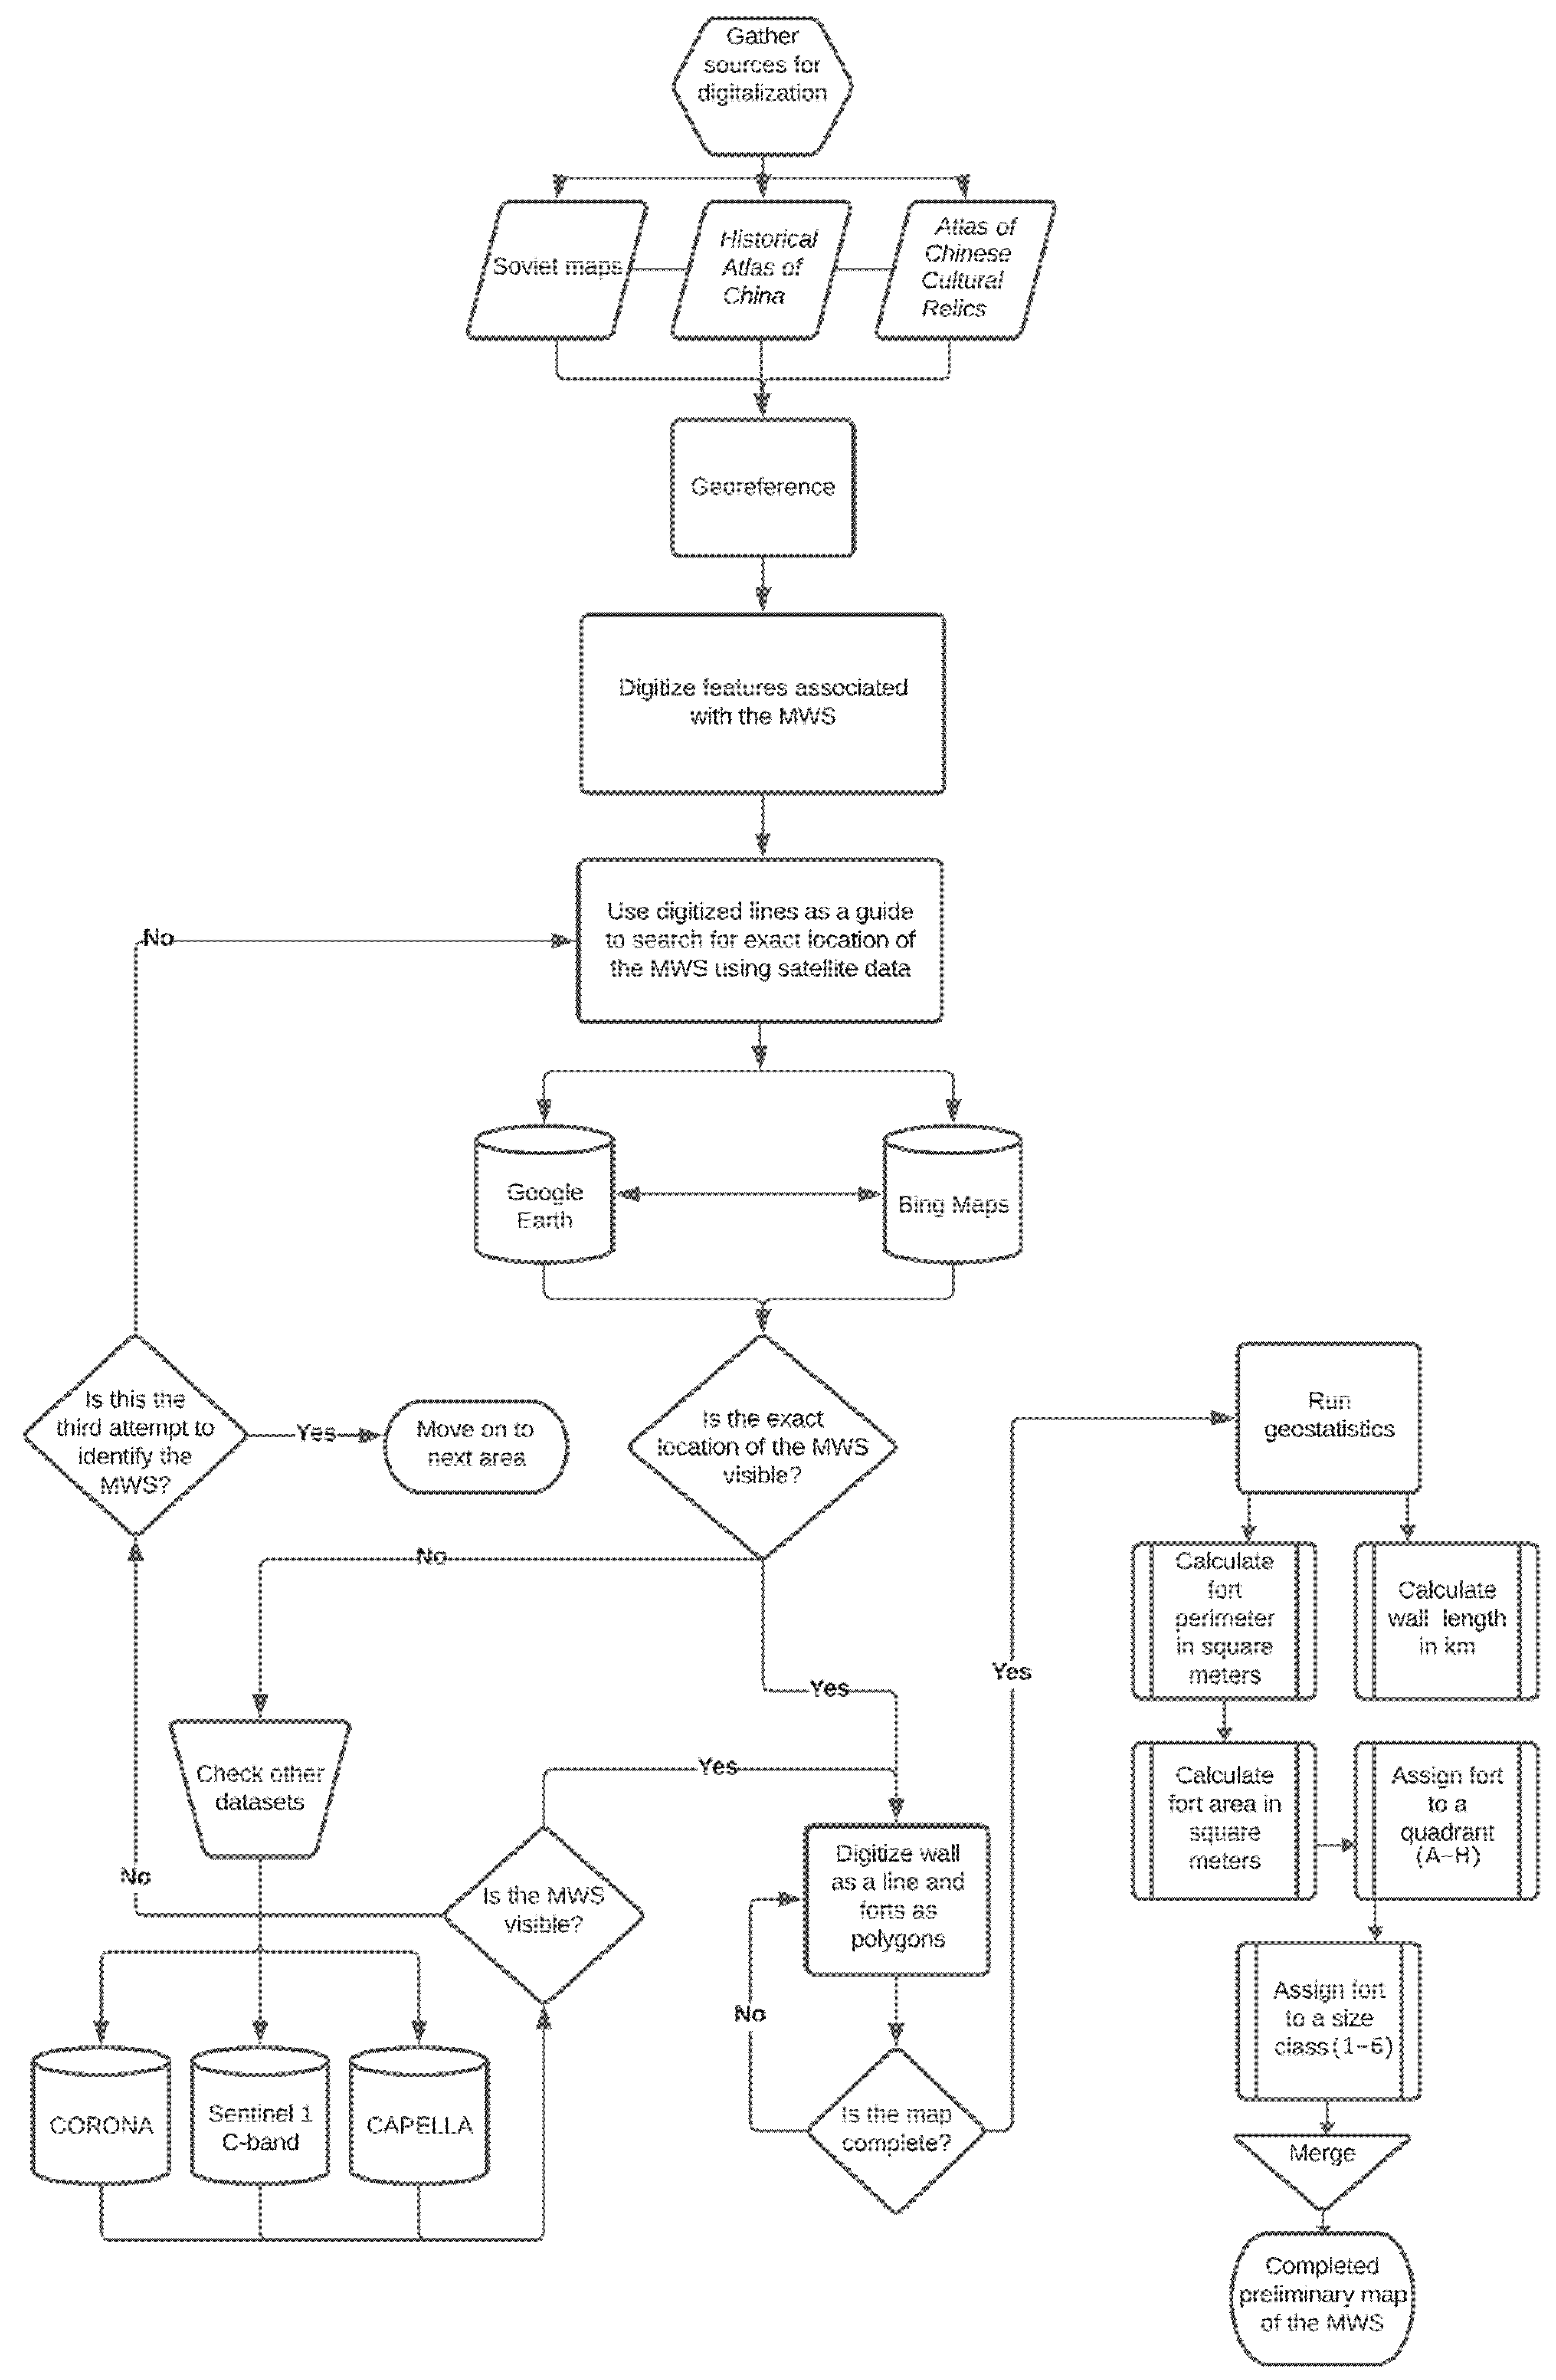
Creating a comprehensive map of the MWS requires the use of a wide range of remote sensing datasets and a thorough survey of the primary and secondary literature on the archaeology and history of the region. In Figure 3, we illustrate our work flow to identify and validate the locations of the walls and forts associated with the MWS. We start with georeferencing and digitizing archaeological and historical maps of the region. Once we established a database of these historical and archaeological studies, we then digitized the wall lines in QGIS, where we used these sources as guides to search for and acquire exact coordinates of the wall fragments and forts that are part of the MWS. When we were unable to locate ancient walls or structures on the satellite imagery base maps provided by Google Earth or Bing Maps, we explored the potential of SAR data and CORONA imagery for identifying the exact location of the MWS.
2.1. Historical Maps and Atlases
The first step in this multi-method approach is to use the atlases, historical sources, and archaeological investigations to map the current state of knowledge of the MWS. Specifically, as we are interested in the southern portion of the MWS, we focused our literature survey on source material that describes the MWS in these areas. We used an extensive number of secondary historical texts but in general relied on two books, Tan Qixiang’s Historical Atlas of China [16] and the Atlas of Chinese Cultural Relics [32] (Figure 4a,b). Tan Qixiang’s Historical Atlas of China provides a useful approximation of the historical boundaries between polities, the location of major cities, river courses, and parts of the MWS, but its accuracy is limited by the small scale of the maps. The Atlas of Chinese Cultural Relics is a product of the Chinese government’s attempt to survey all of the archaeological and historical sites within the country. Although this dataset is widely used and contains a range of useful data on the locations and time periods of certain sites, the dataset has many issues: the data were not collected in a systematic and unbiased manner, it is largely incomplete, and only offers a vague indication of the exact geographic location, chronology, and size, of most of the archaeological sites mentioned in the text [33]. Moreover, the small scale of the map only provides a rough guideline for locating the MWS. Since these two sources often rely on prior scholarship, these maps occasionally propagate errors, requiring validation through other map sources and remote sensing data. Nevertheless, these two core sources, along with other archaeological reports, provide a useful starting point for locating the exact spatial coordinates of the MWS (Supplemental Table S1).
In addition to using archaeological and historical maps, we also georeferenced and digitized the wall lines plotted by the Soviet topographic mapping program, which was in operation from the 1940s through to 1991 [34,35]. The Soviet maps are highly standardized and include symbology and labels designed for the “Wall of Chinggis Khan” (val Chingis-Khana, вaл Чингиc-Xaнa). While the Soviets mapped most of China, Soviet maps of Mongolia and especially the border regions of Mongolia and China are less numerous. Nevertheless, we were able to analyze 46 maps that had wall markings on them (Figure 4c, Supplemental Table S1). After georeferencing these maps, we found that the positions of ancient walls and forts on these Soviet maps were highly accurate.
2.2. Satellite Remote Sensing
Once we identified the general location of the wall from these georeferenced maps, we then imported these lines into QGIS to serve as guidelines for locating the exact position of the southern portion of the MWS on base map imagery provided by Google Earth and Bing Maps [10]. In the case that the available satellite imagery’s resolution was insufficient for identifying segments of the wall, or the wall was obscured by modern development and not visible, we used other freely available remote sensing data, including data from the CORONA missions and SAR (Sentinel-1 C-band), to map the MWS. Each of these data sources have their own particular strengths in different types of environments. We used these different methods in areas where we have gaps in geospatial data derived from the secondary historical source material (Table 1).
In areas that either did not have high resolution imagery available on Google Earth or Bing Maps, or were heavily affected by agriculture or other forms of modern land use, we used imagery from the CORONA missions to “turn back the clock” several decades. The CORONA missions were conducted by the United States of America from the late 1960s through the 1970s and produced a near global dataset of high-resolution photographs of the Earth’s surface from an altitude of over 160 km [36]. However, given the difficulty of removing the distortions from these photographs, archaeologists have only extensively used CORONA imagery as a tool for archaeological prospection in the desertic environments of the Middle East and northern Africa because archaeological sites are often clearly visible on the surface [37]. Nevertheless, in recent years, some archaeologists have used CORONA imagery to identify archaeological sites in China prior to widespread urbanization [38,39,40,41]. We followed previously published methods to orthorectify and georeference CORONA Keyhole 4-B imagery [37,42,43]. Since the resolution of many CORONA images (sub 2 m) are comparable to the imagery provided by Google Earth, we are able to clearly identify sections of the MWS destroyed over the past fifty years as a consequence of land use and development (Supplemental Table S2).
In desertic areas where prior surveys have reported the MWS but the exact location is not visible on Google Earth, we used SAR. Unlike other optical sensors that passively absorb light, SAR is a type of active data collection, whereby a sensor emits energy towards the Earth and records the amount of energy reflected back. Received differences in the energy signal are a product of moisture, soil type, and geological structures. Archaeologists have used SAR for archaeological prospection for decades, particularly in the Maya lowlands [44]; however, the recent availability of fairly high resolution SAR data through the Sentinel-1 mission now makes it possible to examine wide swaths of the world previously too costly to investigate using aerial-mounted sensors [45,46]. In particular, modern SAR sensors mounted on satellites have the ability to penetrate beneath the ground surface by several centimeters, enabling a limited view into the subsurface archaeological record. This works particularly well in the sandy environments of northwestern China and southern Mongolia where dune fields are common. By peering beneath these dune fields, this radar technology enables us to locate segments of the MWS that are extremely difficult to find using true color satellite imagery. Specifically, we evaluated the capacity of publicly available data—Sentinel-1 C-band SAR imagery (10 m), through the use of Google Earth Engine and SAR data available on request from Capella Space, a private company that supplies high resolution (0.5 m) SAR data on demand, multi-looked nine times to achieve high quality, low noise performance—to estimate the data resolution needed to locate the MWS.
2.3. Digitization and Geostatistics
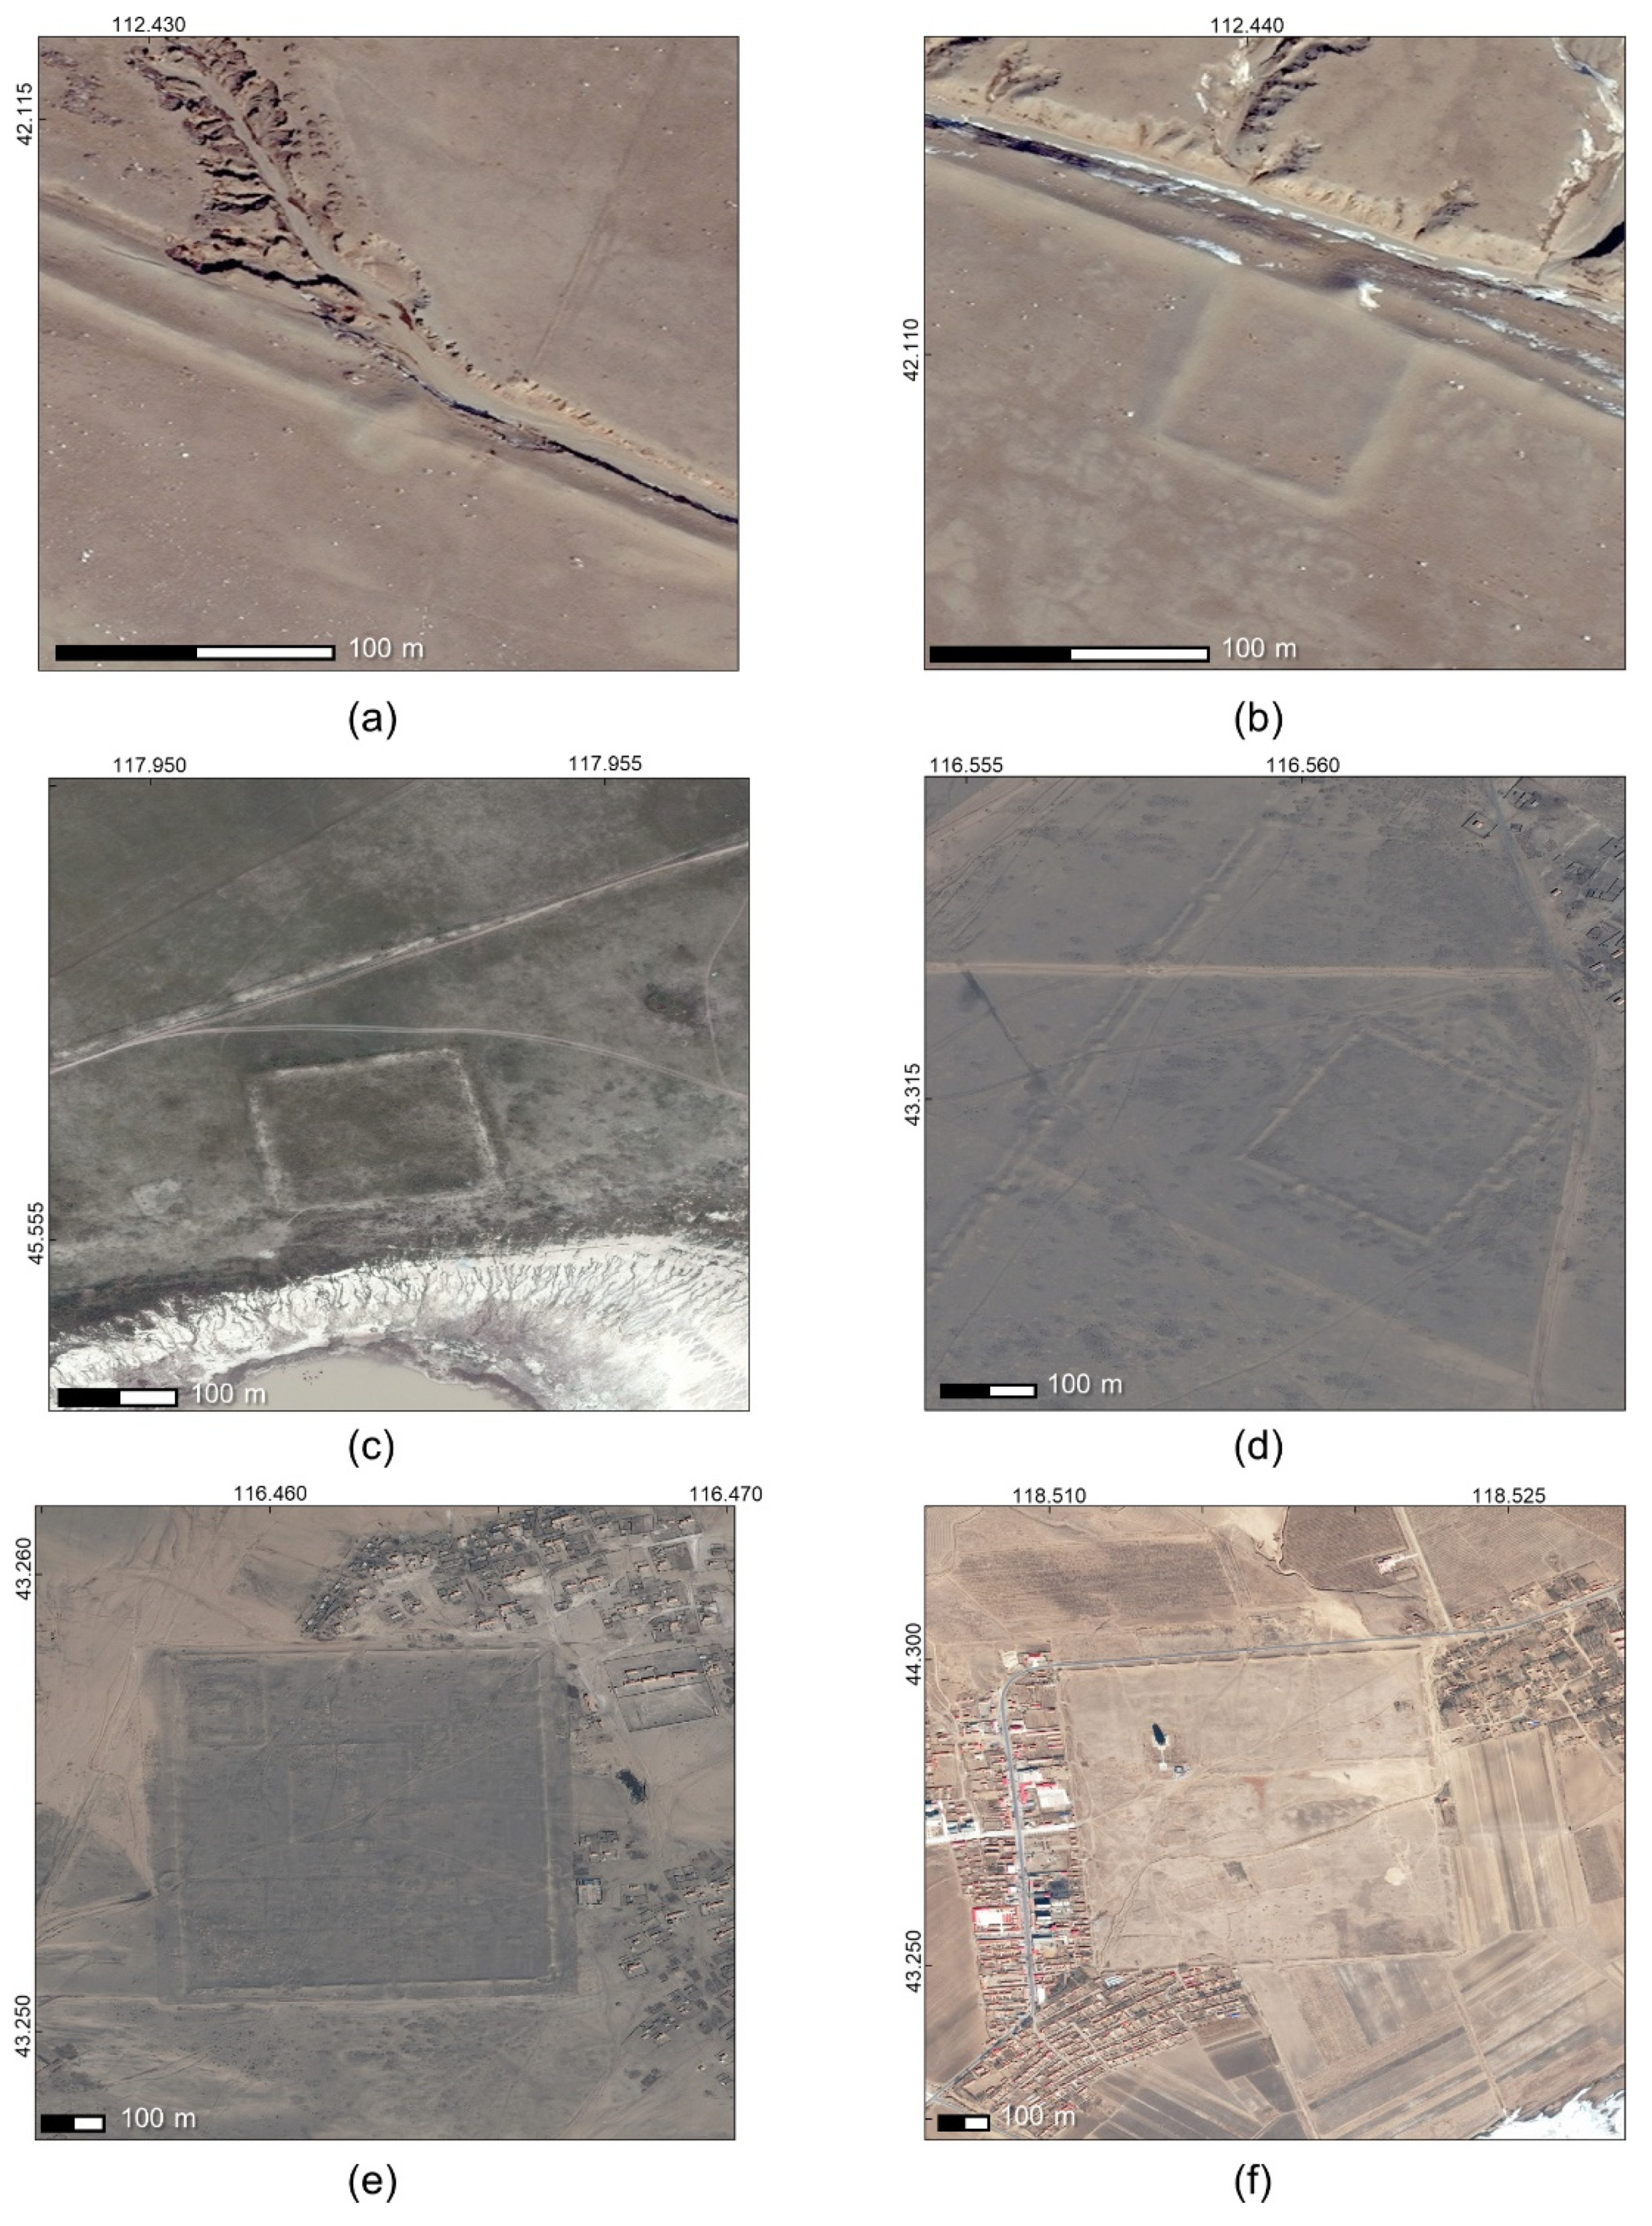
After using these different sources of imagery to locate the wall, we traced over the exact position of the wall and polygonised all the structures identified in association with the MWS. We tentatively label these structures “forts” although their exact purpose remains unclear. We classified each one of these “forts” based on our certainty that they are related to the MWS, with one being the most certain and three being the least certain that these structures are part of the MWS. Only forts assigned a value of one were included in our analysis. We then drew a polygon over each fort assigned a value of one. From these polygons, we then used the QGIS field calculator function to compute the area and perimeter of each fort polygon. Next, we generated centroids for polygons associated with each fort, and joined the area and perimeter data to each centroid point. We divided the forts into different size classes following Xie’s [26] prior work (Figure 5). Following this step, we overlayed a 500 km square grid on top of the southern portion of the wall to divide the MWS into large, contiguous, sections. Each square was assigned a code number and, using the join by location function, this code number was added to the attribute table of the fort centroids. All of these steps were done to identify differences among the size classes of forts in 500 km quadrants, which act as a proxy for function.
3. Results
One of the key findings of our multi-method mapping program is that the MWS stretches from northeastern China, through Mongolia, and into western China, spanning an inferred total of 4800 km, suggesting a high degree of pre-planning and standardization (Figure 6). Of the 4800 km long MWS, only 2940 km remains intact, or around 60% of the total wall. We have also identified 525 forts of varying sizes and styles that extend from the northeastern most corner of the MWS to northwestern China and southern Mongolia, providing clear evidence that the MWS was a geographically extensive yet still highly standardized network of walls, forts, and beacon towers that acted as an impediment to traversal across an enormous swath of the eastern Eurasian landmass. Moreover, while previous mapping efforts show the western terminus of the MWS is located in Shaanxi Province, right at the historical boundary between the Western Xia kingdom and Jin dynasty, we argue that the western line shown in Figure 6 may have been connected to the southeastern line of the MWS at one point during its use life. Since most historical atlases place the boundary between the Jin dynasty and the Western Xia kingdom to the immediate west of the border wall in Shaanxi, it is possible that these two sections of the MWS were built by different polities, the Jin dynasty and the Western Xia. Recent research has recovered radiocarbon evidence that roughly dates some of the forts in the western line to the Western Xia and perhaps even earlier to the Han dynasty [47,48]. Even though additional archaeological and historical investigation will be necessary to determine the exact chronology and function of these different sections of the MWS, our study has demonstrated that high-resolution satellite imagery and historical maps enable accurate mapping of these immense wall systems. To highlight the effectiveness of our multi-method approach, we focus on three areas where we needed to use different sources of remote sensing data because of gaps in the coverage of the high-resolution imagery provided by Google Earth and Bing Maps. Using these methods, we generated a geospatial database on the MWS to provide an empirical baseline from which to test hypotheses regarding the chronology and function of the MWS.
3.1. Remote Sensing
The first area is the Gobi Desert. Here, shifting sand dunes and wind erosion have either buried or destroyed many of the contiguous sections of the wall. Once we identified the basic outline of the wall from historical maps, we validated their presence using Google Earth, only to find discontinuous fragments of wall. In an effort to see how much of the wall remained intact buried beneath the sand dunes, we used SAR Sentinel-1 C-band products, but the resolution (ca. 10 m) is barely capable of resolving the wall and associated features in many locations (Figure 7a–c). We explored the potential for CAPELLA SAR data (sub 0.5 m resolution) to determine if these data are a more effective means for mapping the contiguous nature of the wall line. Using the CAPELLA SAR data, we were able to identify small sections (8 km) of the wall in areas where there are no clear records of the MWS (Figure 7c–e). This experiment indicates the potential of the CAPELLA SAR data, or similarly high-resolution SAR data, for the identification of extensive structures buried under sand dunes.
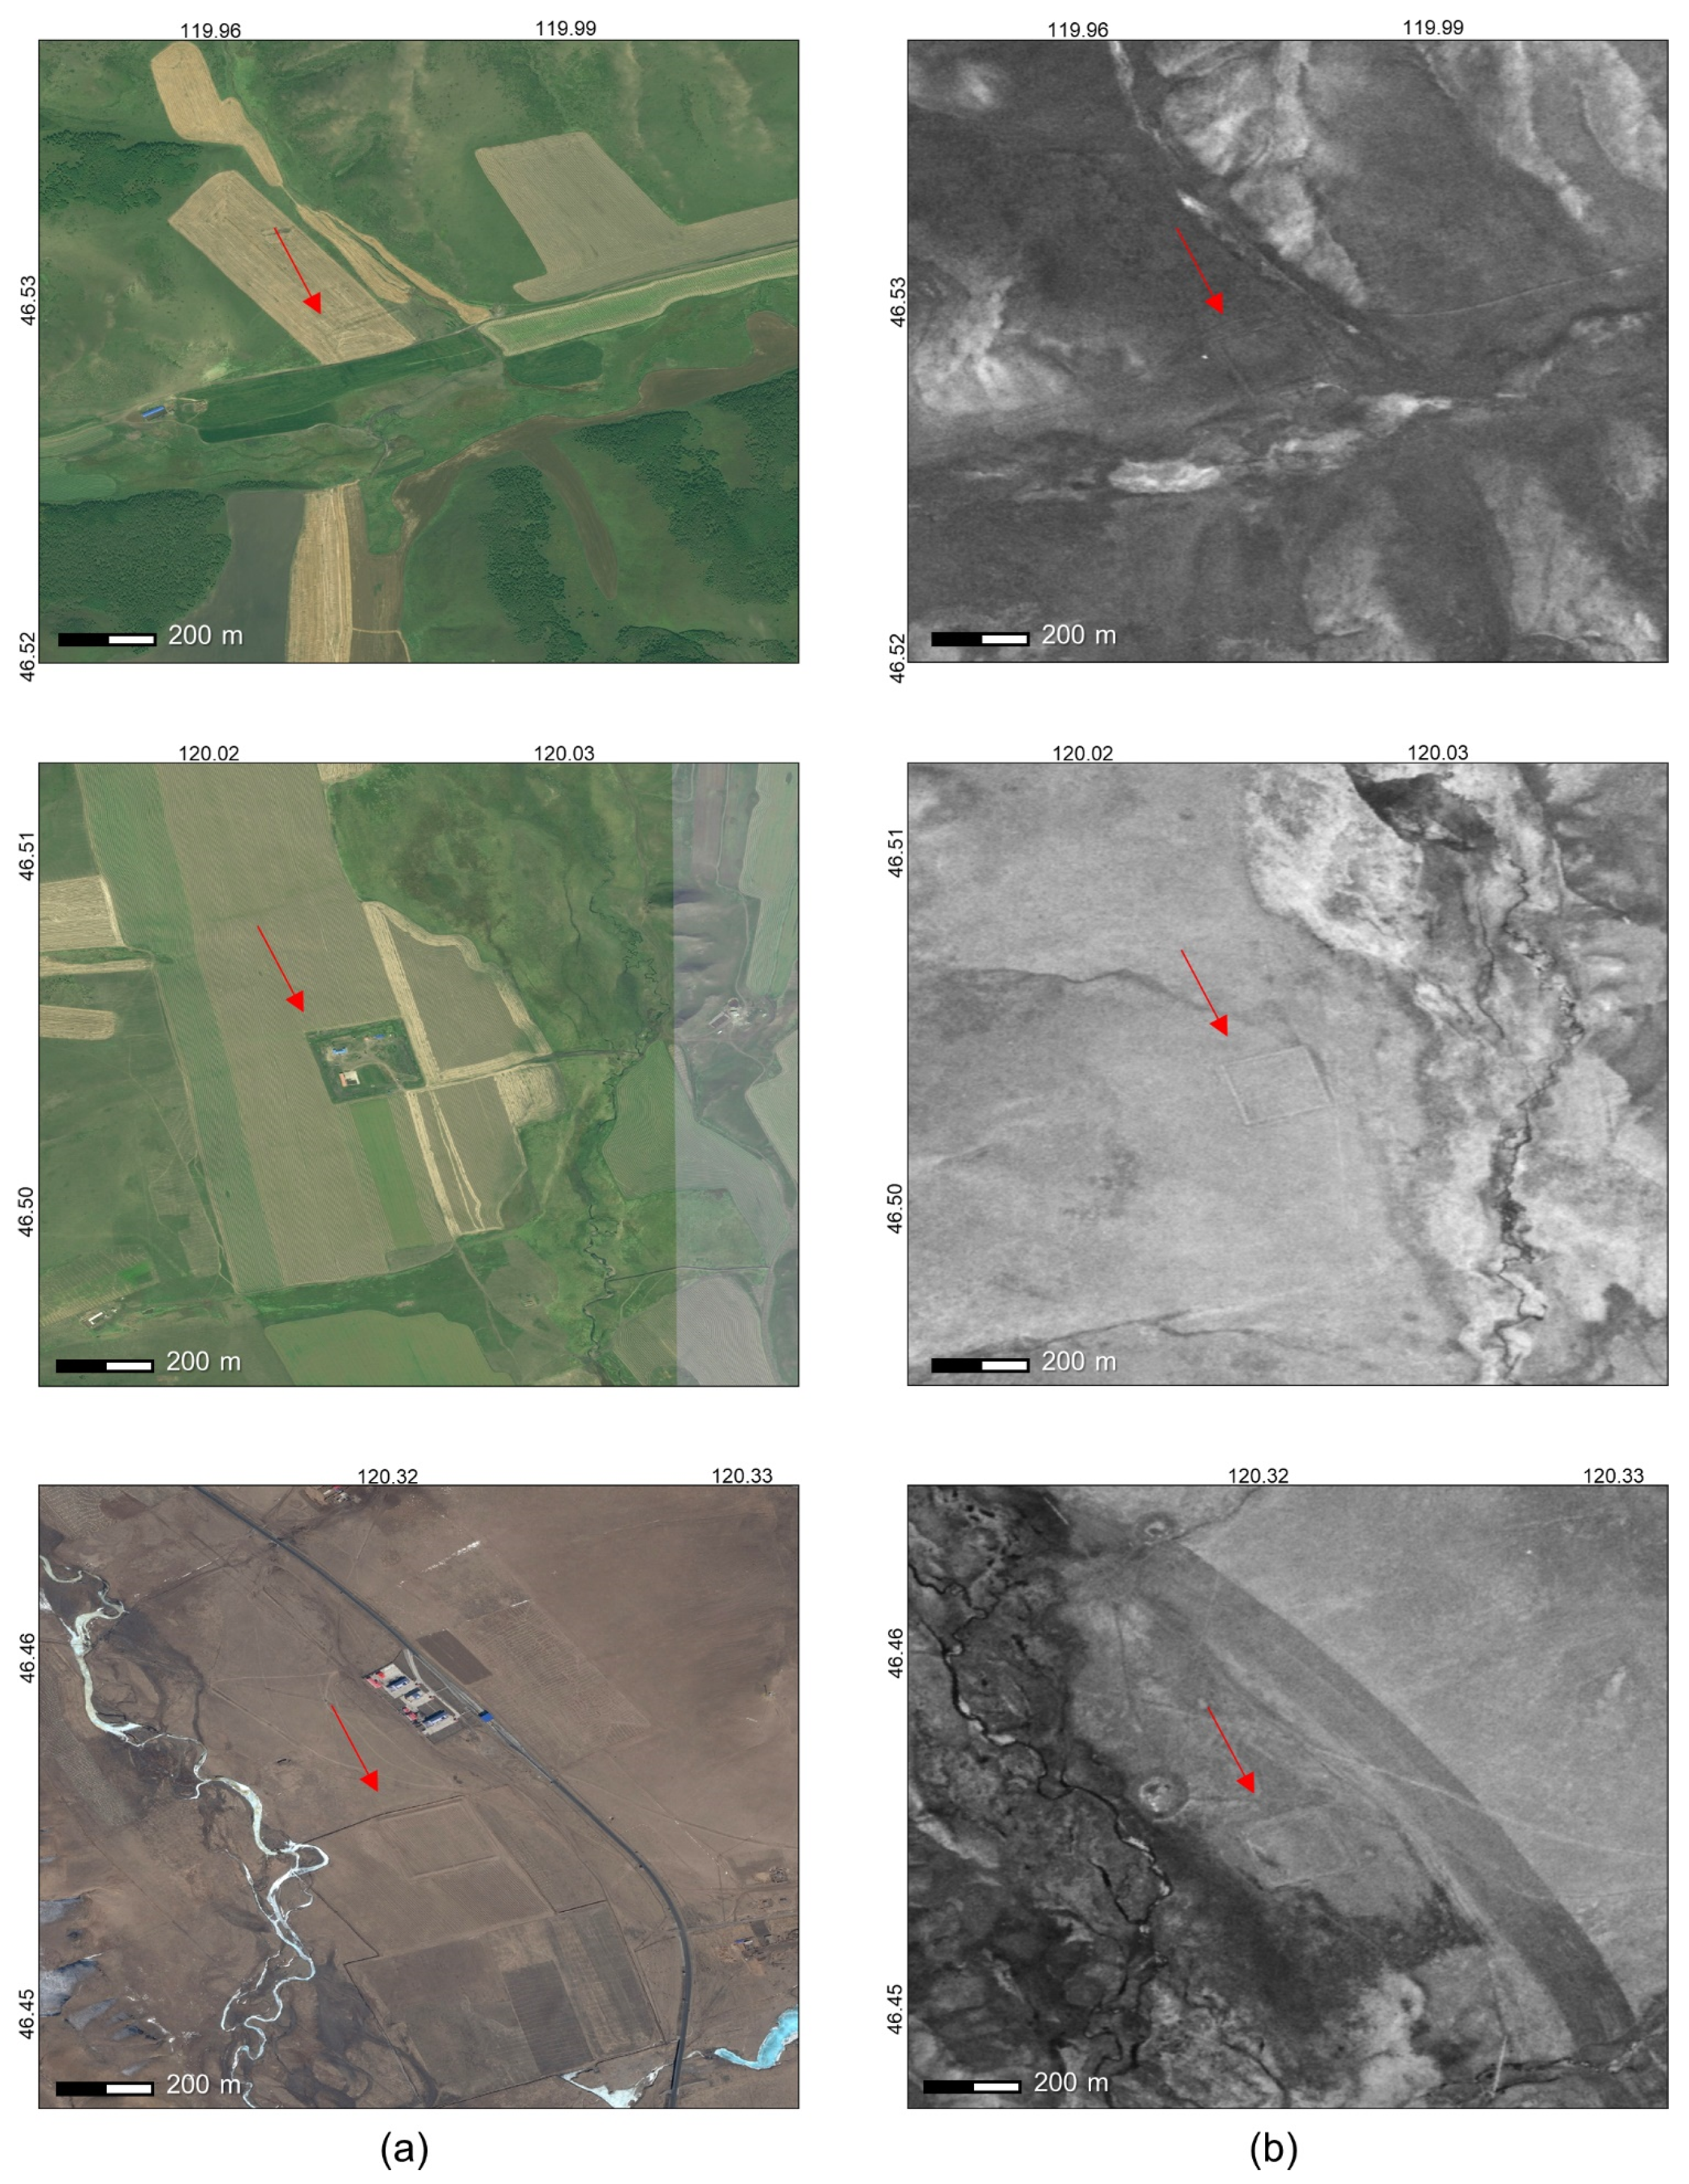
The second location we examined is an area we call the “Mongolian Arch” because of the arch-like shape of the border between Mongolia and China. In the past several decades, this area has undergone significant development and the resolution of available imagery on Bing Maps and Google Earth is insufficient for our purposes (Figure 8a). Moreover, the eastern border between Mongolia and China is a difficult area to conduct a pedestrian survey due to the rugged terrain, meaning that the archaeological reports and atlases we consulted display divergent locations for the MWS in this area (see Figure 2). For these reasons, we used CORONA imagery to map the complete line of the MWS through the border of northeastern China and into Mongolia (Figure 8b). As seen in Figure 8b, the forts are clearly identifiable in the CORONA imagery, enabling us to accurately map the location of the MWS.
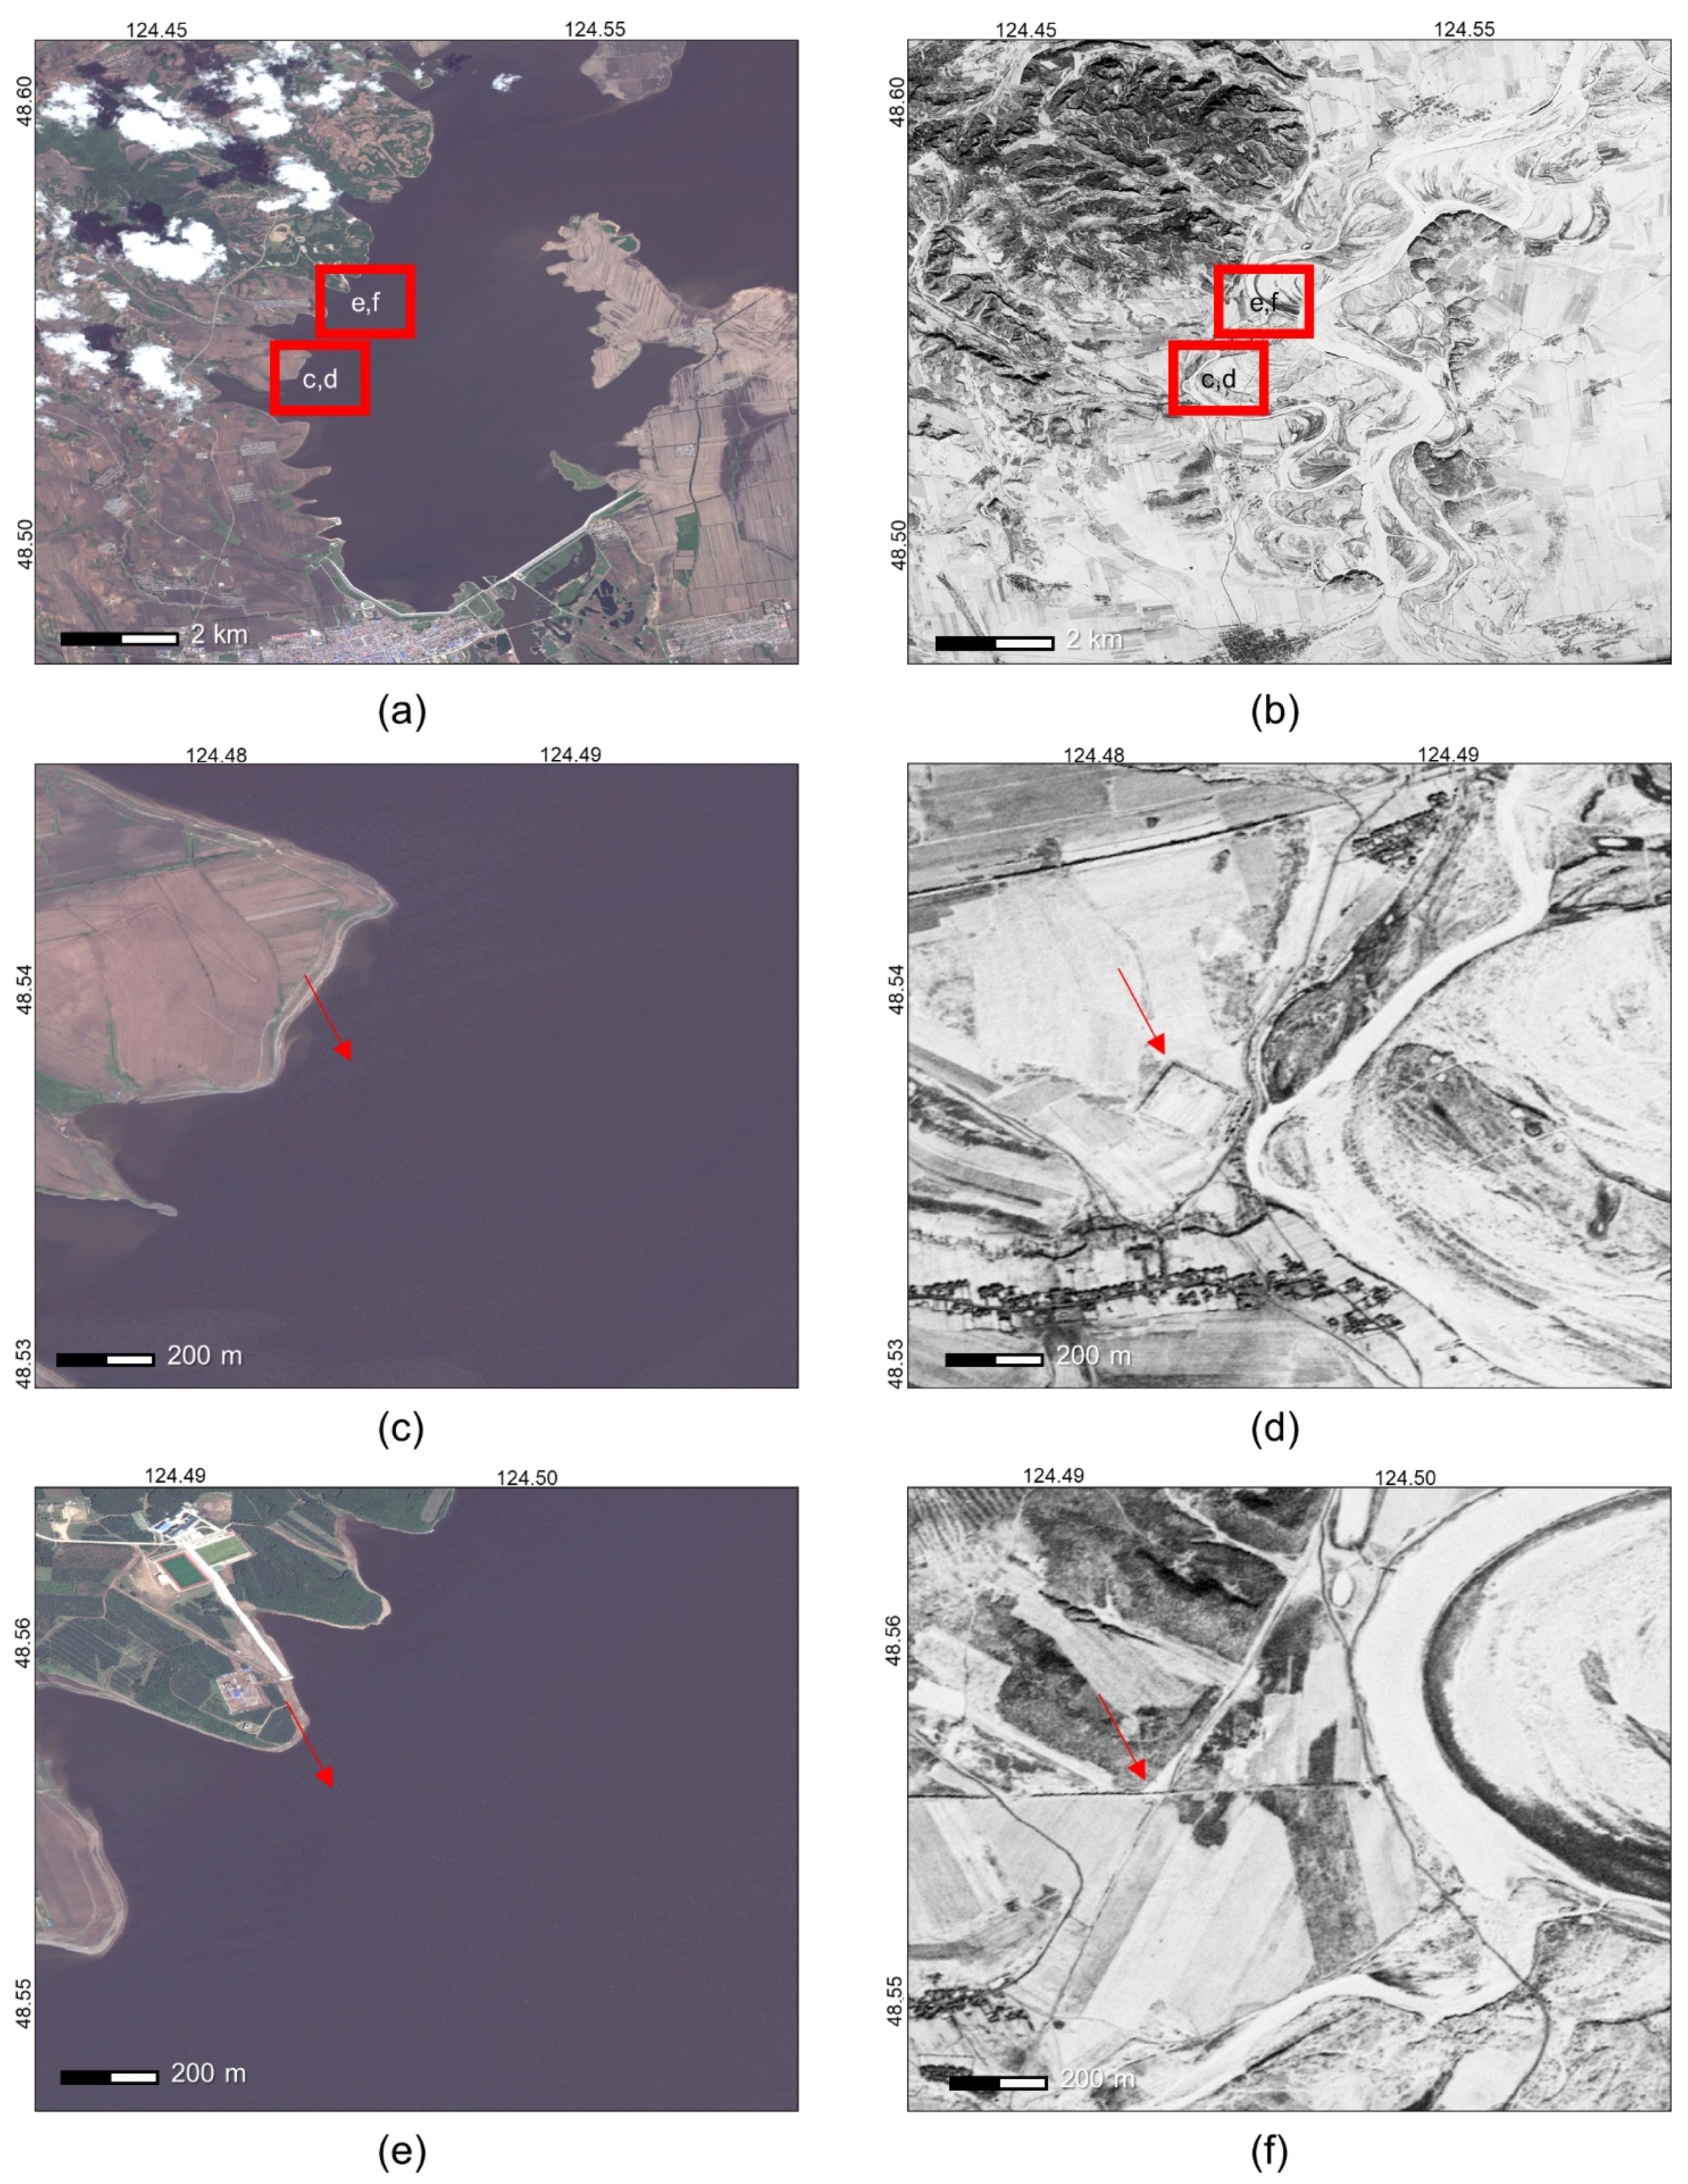
The third area we investigated is the eastern terminus of the MWS. The atlases and archaeological reports we consulted show that the eastern edge of the MWS is located at the Nen River. However, this location is now underwater because the Nen River was dammed in 2004 (Figure 9a,b). Since satellite imagery of the area before 2004 was significantly lower resolution than the satellite data currently available on Google Earth, it is impossible to confirm previous reports that the MWS ended at the now dammed Nen River. By using CORONA imagery, we were able to “remove” the dam from the area to measure how much of the wall was affected by the artificial lake (Figure 9c–f). Using this method, we found two forts and confirmed previous archaeological surveys that report that the eastern-most terminus of the MWS is located at the Nen River.
3.2. Geostatistical Analysis of Structures Associated with the Medieveal Wall System
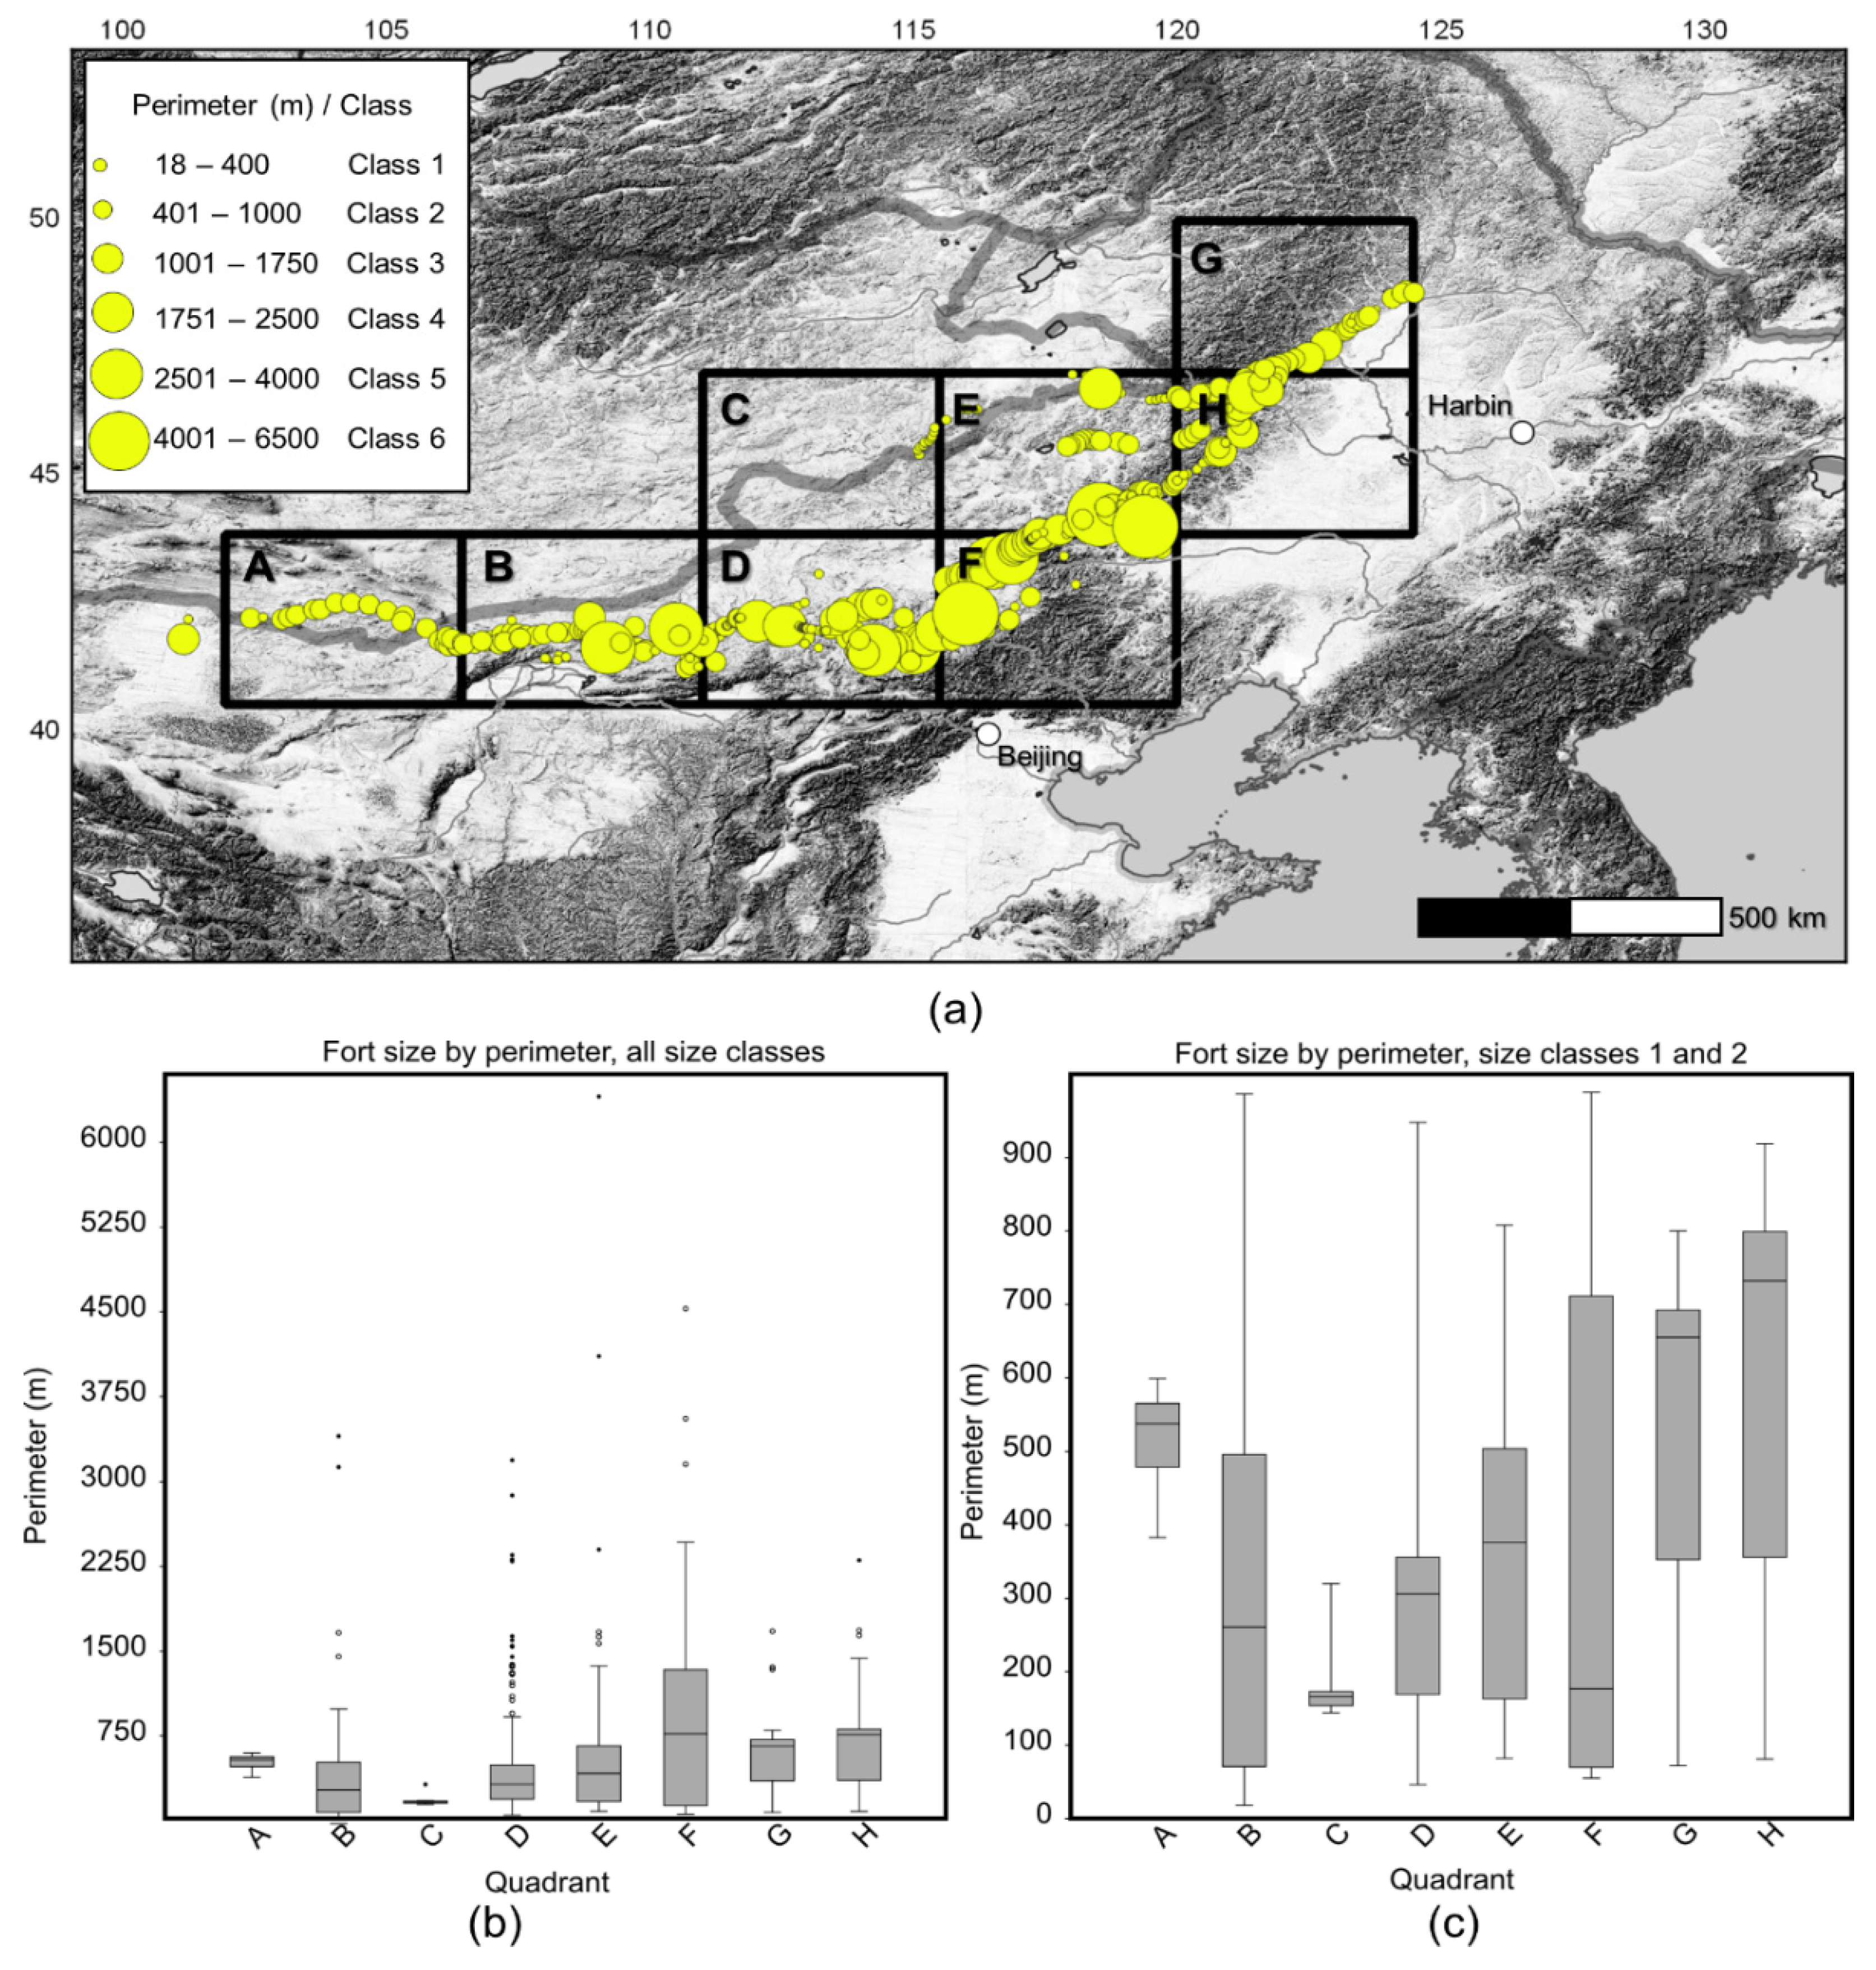
In total, we identified 525 structures that we tentatively define as “forts.” that are associated with the MWS. Our dataset is not an exhaustive survey of all forts known to be associated with the wall, as prior work includes several forts that we have been unable to identify. Moreover, our dataset also includes many walled cities, labeled as “forts.” that likely have a different function than most of the “forts.” Since the exact purpose of these structures is difficult to determine from remote sensing alone, we have grouped all of these structures together and sort them by size class rather than function (Table 2 and Table 3, Figure 10). Geostatistical analysis of the size of these structures may demonstrate differences in construction method and function along the MWS. As we are comparing such a wide variety of different structures, there is significant variability in their sizes across the MWS. In Figure 10b, we group all the forts together, and in Figure 10c we show the fort size of only size classes 1 and 2. The standard deviation in fort perimeter is 622 m, much larger than median fort size of 382 m. The largest outliers, which have a perimeter of over 3000 m, significantly increase the standard deviation, median, and mean fort perimeter. Nevertheless, the vast majority of forts have a perimeter less than 1000 m, with most forts having a perimeter of less than 400 m. Given the large differences in fort perimeter across the MWS, we also investigated fort size by quadrant to determine which areas have the largest fort perimeter or the smallest fort perimeter. In general, fort perimeter to the west is smaller and more evenly distributed, whereas fort perimeter to the east is larger. The western portion of the MWS, located primarily in southern Mongolia and western Inner Mongolia contains forts that are roughly the same size as one another and there are no forts that are significantly larger than one another (Quadrant A). Along the southeastern section of the MWS fort size is much more variable (Quadrant E, F). Most of the extremely large “forts,” in fact likely walled cities, are concentrated in center-eastern part of the southern section of the wall. Along the outer wall, the median fort size is much smaller than along the inner wall (Quadrants C). Overall, fort perimeter by quadrant appears to be a useful metric to evaluate differences in the MWS.
In total, we identified 525 structures that we tentatively define as “forts.” that are associated with the MWS. Our dataset is not an exhaustive survey of all forts known to be associated with the wall, as prior work includes several forts that we have been unable to identify. Moreover, our dataset also includes many walled cities, labeled as “forts.” that likely have a different function than most of the “forts.” Since the exact purpose of these structures is difficult to determine from remote sensing alone, we have grouped all of these structures together and sort them by size class rather than function (Table 2 and Table 3, Figure 10). Geostatistical analysis of the size of these structures may demonstrate differences in construction method and function along the MWS. As we are comparing such a wide variety of different structures, there is significant variability in their sizes across the MWS. In Figure 10b, we group all the forts together, and in Figure 10c we show the fort size of only size classes 1 and 2. The standard deviation in fort perimeter is 622 m, much larger than median fort size of 382 m. The largest outliers, which have a perimeter of over 3000 m, significantly increase the standard deviation, median, and mean fort perimeter. Nevertheless, the vast majority of forts have a perimeter less than 1000 m, with most forts having a perimeter of less than 400 m. Given the large differences in fort perimeter across the MWS, we also investigated fort size by quadrant to determine which areas have the largest fort perimeter or the smallest fort perimeter. In general, fort perimeter to the west is smaller and more evenly distributed, whereas fort perimeter to the east is larger. The western portion of the MWS, located primarily in southern Mongolia and western Inner Mongolia contains forts that are roughly the same size as one another and there are no forts that are significantly larger than one another (Quadrant A). Along the southeastern section of the MWS fort size is much more variable (Quadrant E, F). Most of the extremely large “forts,” in fact likely walled cities, are concentrated in center-eastern part of the southern section of the wall. Along the outer wall, the median fort size is much smaller than along the inner wall (Quadrants C). Overall, fort perimeter by quadrant appears to be a useful metric to evaluate differences in the MWS.
4. Discussion
Our multi-method approach enabled us to map the southern part of the MWS. By identifying destroyed or buried fort structures in early satellite imagery and by peering beneath the sand dunes of the Gobi Desert to find wall fragments, we have produced one of the most accurate maps of the MWS to date. Using these data, we are now able to evaluate the effectiveness of these remote sensing methods and discuss some of our preliminary observations regarding the construction of the southern portion of the MWS.
4.1. Evaluating the Effectiveness of the Multi-Method Approach
Overall, while some archaeological research provides a general overview of the location of the MWS, the most important sources for mapping the MWS have been the Soviet maps of Mongolia and China and the Atlas of Chinese Cultural Relics. Although both of these sources have their own limitations, when georeferenced, they proved to be effective guides to locating the MWS on Google Earth or Bing Maps. In general, we found that the Soviet maps are quite accurate, whereas the maps within the Atlas of Chinese Cultural Relics have a significant margin of error, likely due to the scale at which they are mapped, making them a more general source of information on the location of the wall rather than a highly accurate dataset. Moreover, the mismatched resolution of these datasets and the time-consuming process of digitization and georeferencing means that these sources require calibration and fine tuning to identify the MWS. While we found the historical atlases and Soviet maps were always a useful starting point for identifying fragments of the MWS, these maps required further validation from a wide range of different data sources, including, but not limited to, Sentinel-1 C-band SAR data and the CORONA missions.
After identifying the MWS from the georeferenced maps, we discovered several “gaps” in the imagery available on Google Earth and Bing Maps that necessitated using other sources of Earth imagery. Specifically, we checked the freely available datasets on Google Earth Engine and determined that most of these data do not have the resolution needed to locate the MWS. However, close examination of the Sentinel-1 C-band SAR data reveals faint traces of the MWS in the Gobi Desert, but elsewhere the resolution is too low to locate the MWS. Likely, sub 5 m to even sub 1 m resolution SAR imagery is necessary to accurately identify the MWS. For instance, the CAPELLA SAR data provides a compelling case study of the power of high-resolution SAR data to resolve these features. As high-resolution SAR data becomes more widely available in the future, we anticipate that these data products will be an effective tool for mapping geographically extensive features like ancient wall systems. On the other hand, while the CORONA imagery has the necessary spatial resolution to resolve forts and wall fragments, as demonstrated in the Mongolian Arch and Nierji Dam examples, CORONA imagery remains difficult to process at large scales, at present inhibiting its widespread use. In the future, additional work using CORONA imagery and high-resolution SAR data will be able to produce a complete map of the segments of the MWS that remain missing from our map.
Based on our results, the Soviet maps and archaeological data provided the clearest, easiest to access, and most accurate dataset for the mapping and identification of the segments of the MWS. Similar types of data may be useful for mapping other ancient wall systems in Eurasia. For instance, Soviet maps of Ukraine may include sections of the Serpent’s Wall, built during the 7th century BCE [49]. Additionally, we find that the application of remote sensing technologies, such as SAR and CORONA, produce high quality data that enables researchers to locate obscured sections of wall systems. In the future, we anticipate that CORONA and SAR remote sensing data will continue to play an important role in the discovery of new archaeological sites and geographically extensive ancient structures, like wall systems.
4.2. Exploring the Function of the MWS through Geostatistics
Now that we have proposed our multi-method approach and highlighted its advantages for identifying the exact location of the MWS, we discuss our preliminary observations regarding the spatial distribution of the MWS. Our analysis of fort size reveals several intriguing patterns in their spatial distribution. Before we begin our discussion however, we must note that our data is still incomplete as more “forts” and wall lines continue to be found throughout China and Mongolia.
Nevertheless, our analysis of this preliminary dataset has revealed several key insights. The finding of the most importance, perhaps, is that the largest forts on the southern portion of the wall system are located nearby strategically critical mountain passes that lead into the heartland of the Jin dynasty’s territory. For example, our analyses indicate Quadrant E may have been a significant strategic location since it has several of the largest forts and walled cities. Here, the wall line terminates at this location once it enters an impassable swampy area. In contrast to Quadrant E, Quadrant C has the smallest sized forts which are located along the outer line of the wall system. Since there are so few forts in Quadrant C, and they are particularly small, we hypothesize that this section may have been the first part of the MWS, before further additions made the wall more complex and extensive.
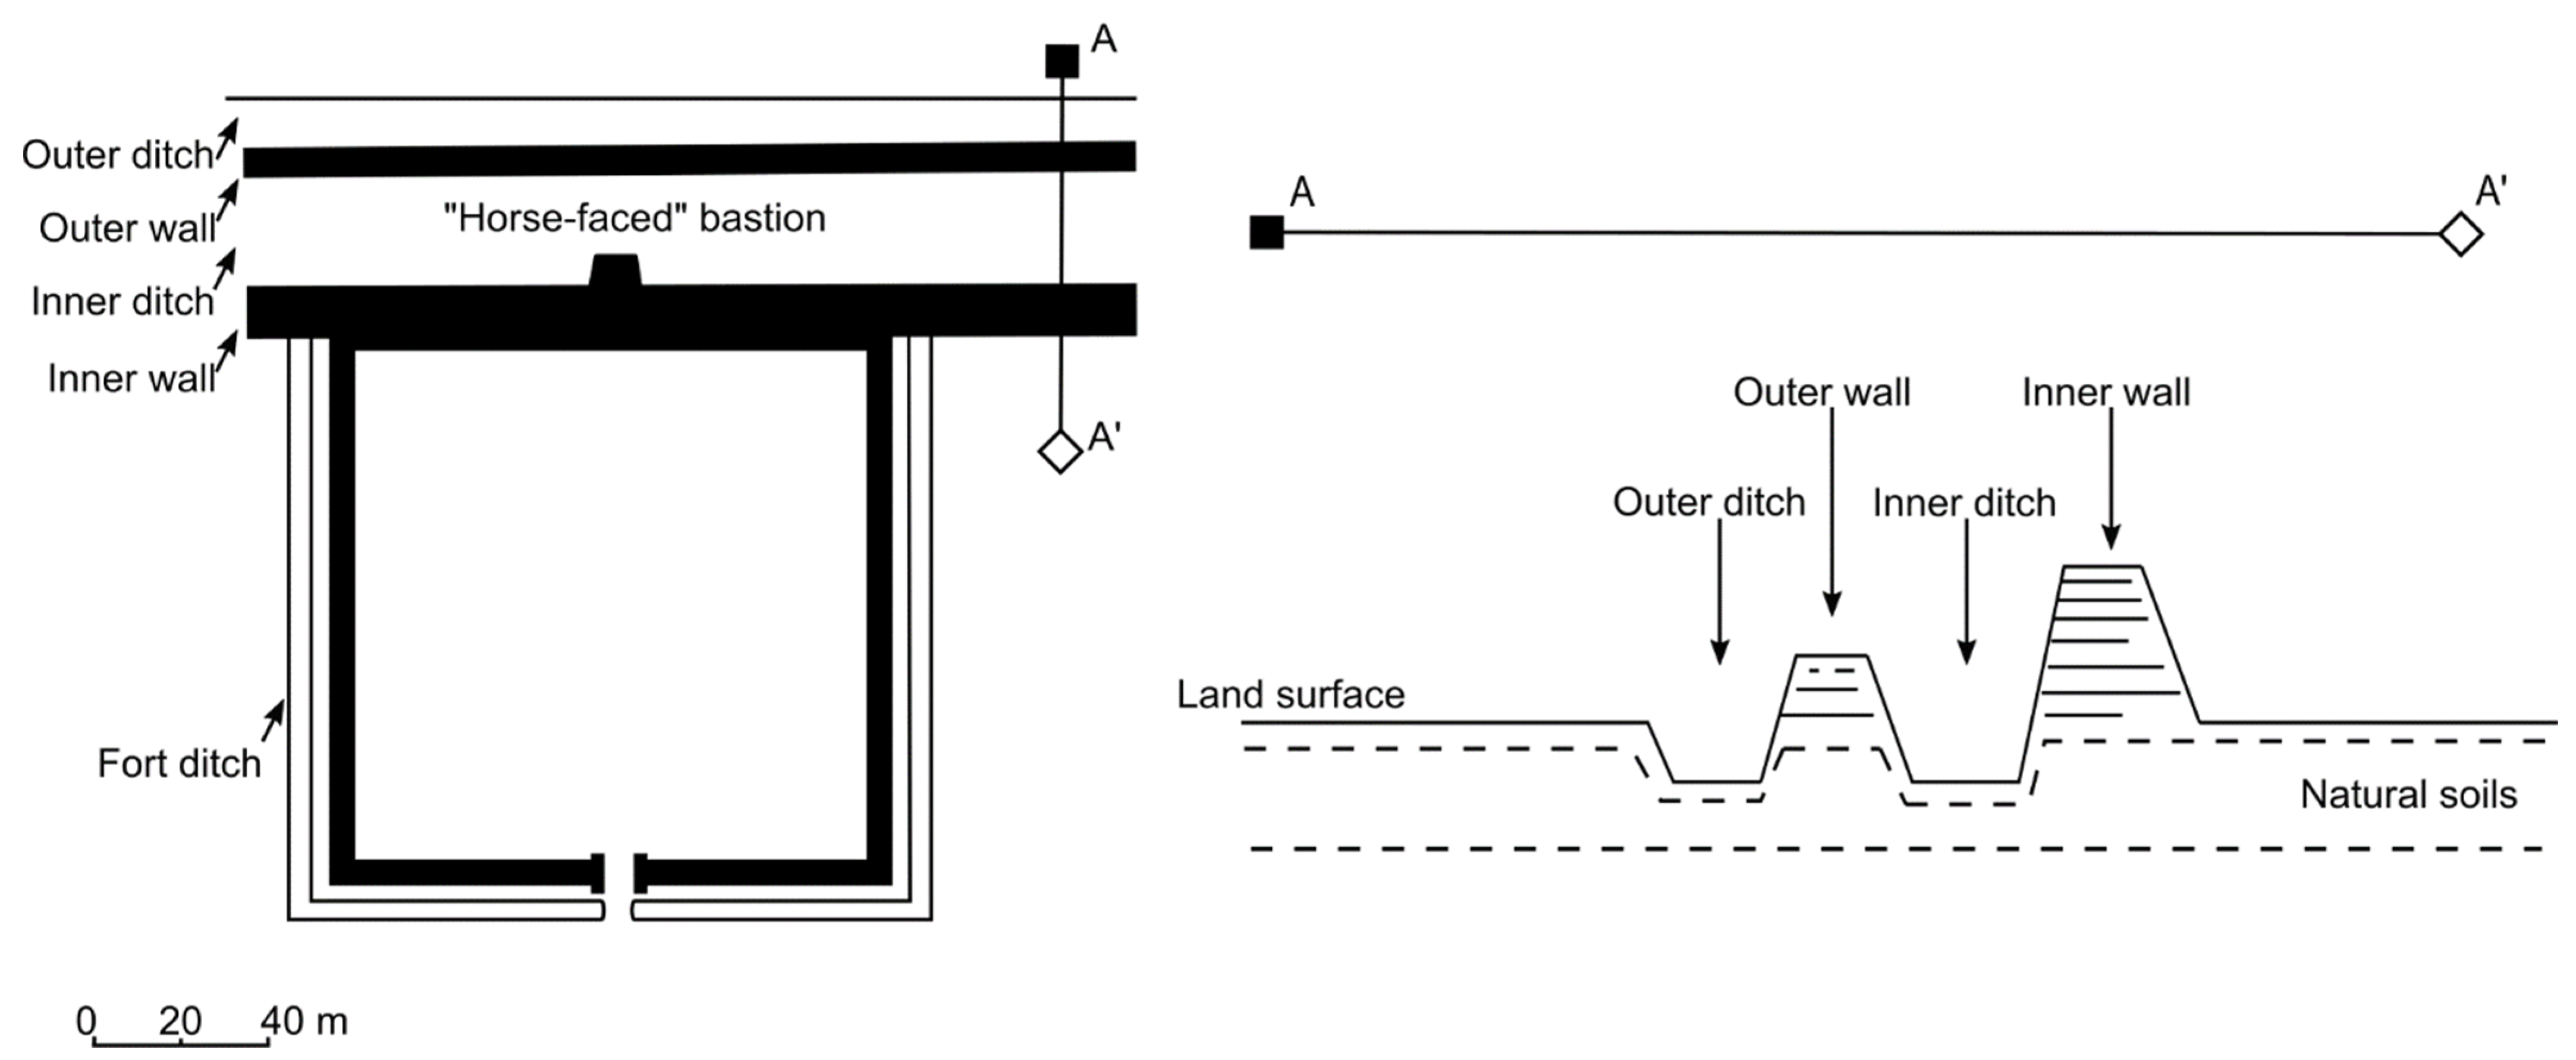
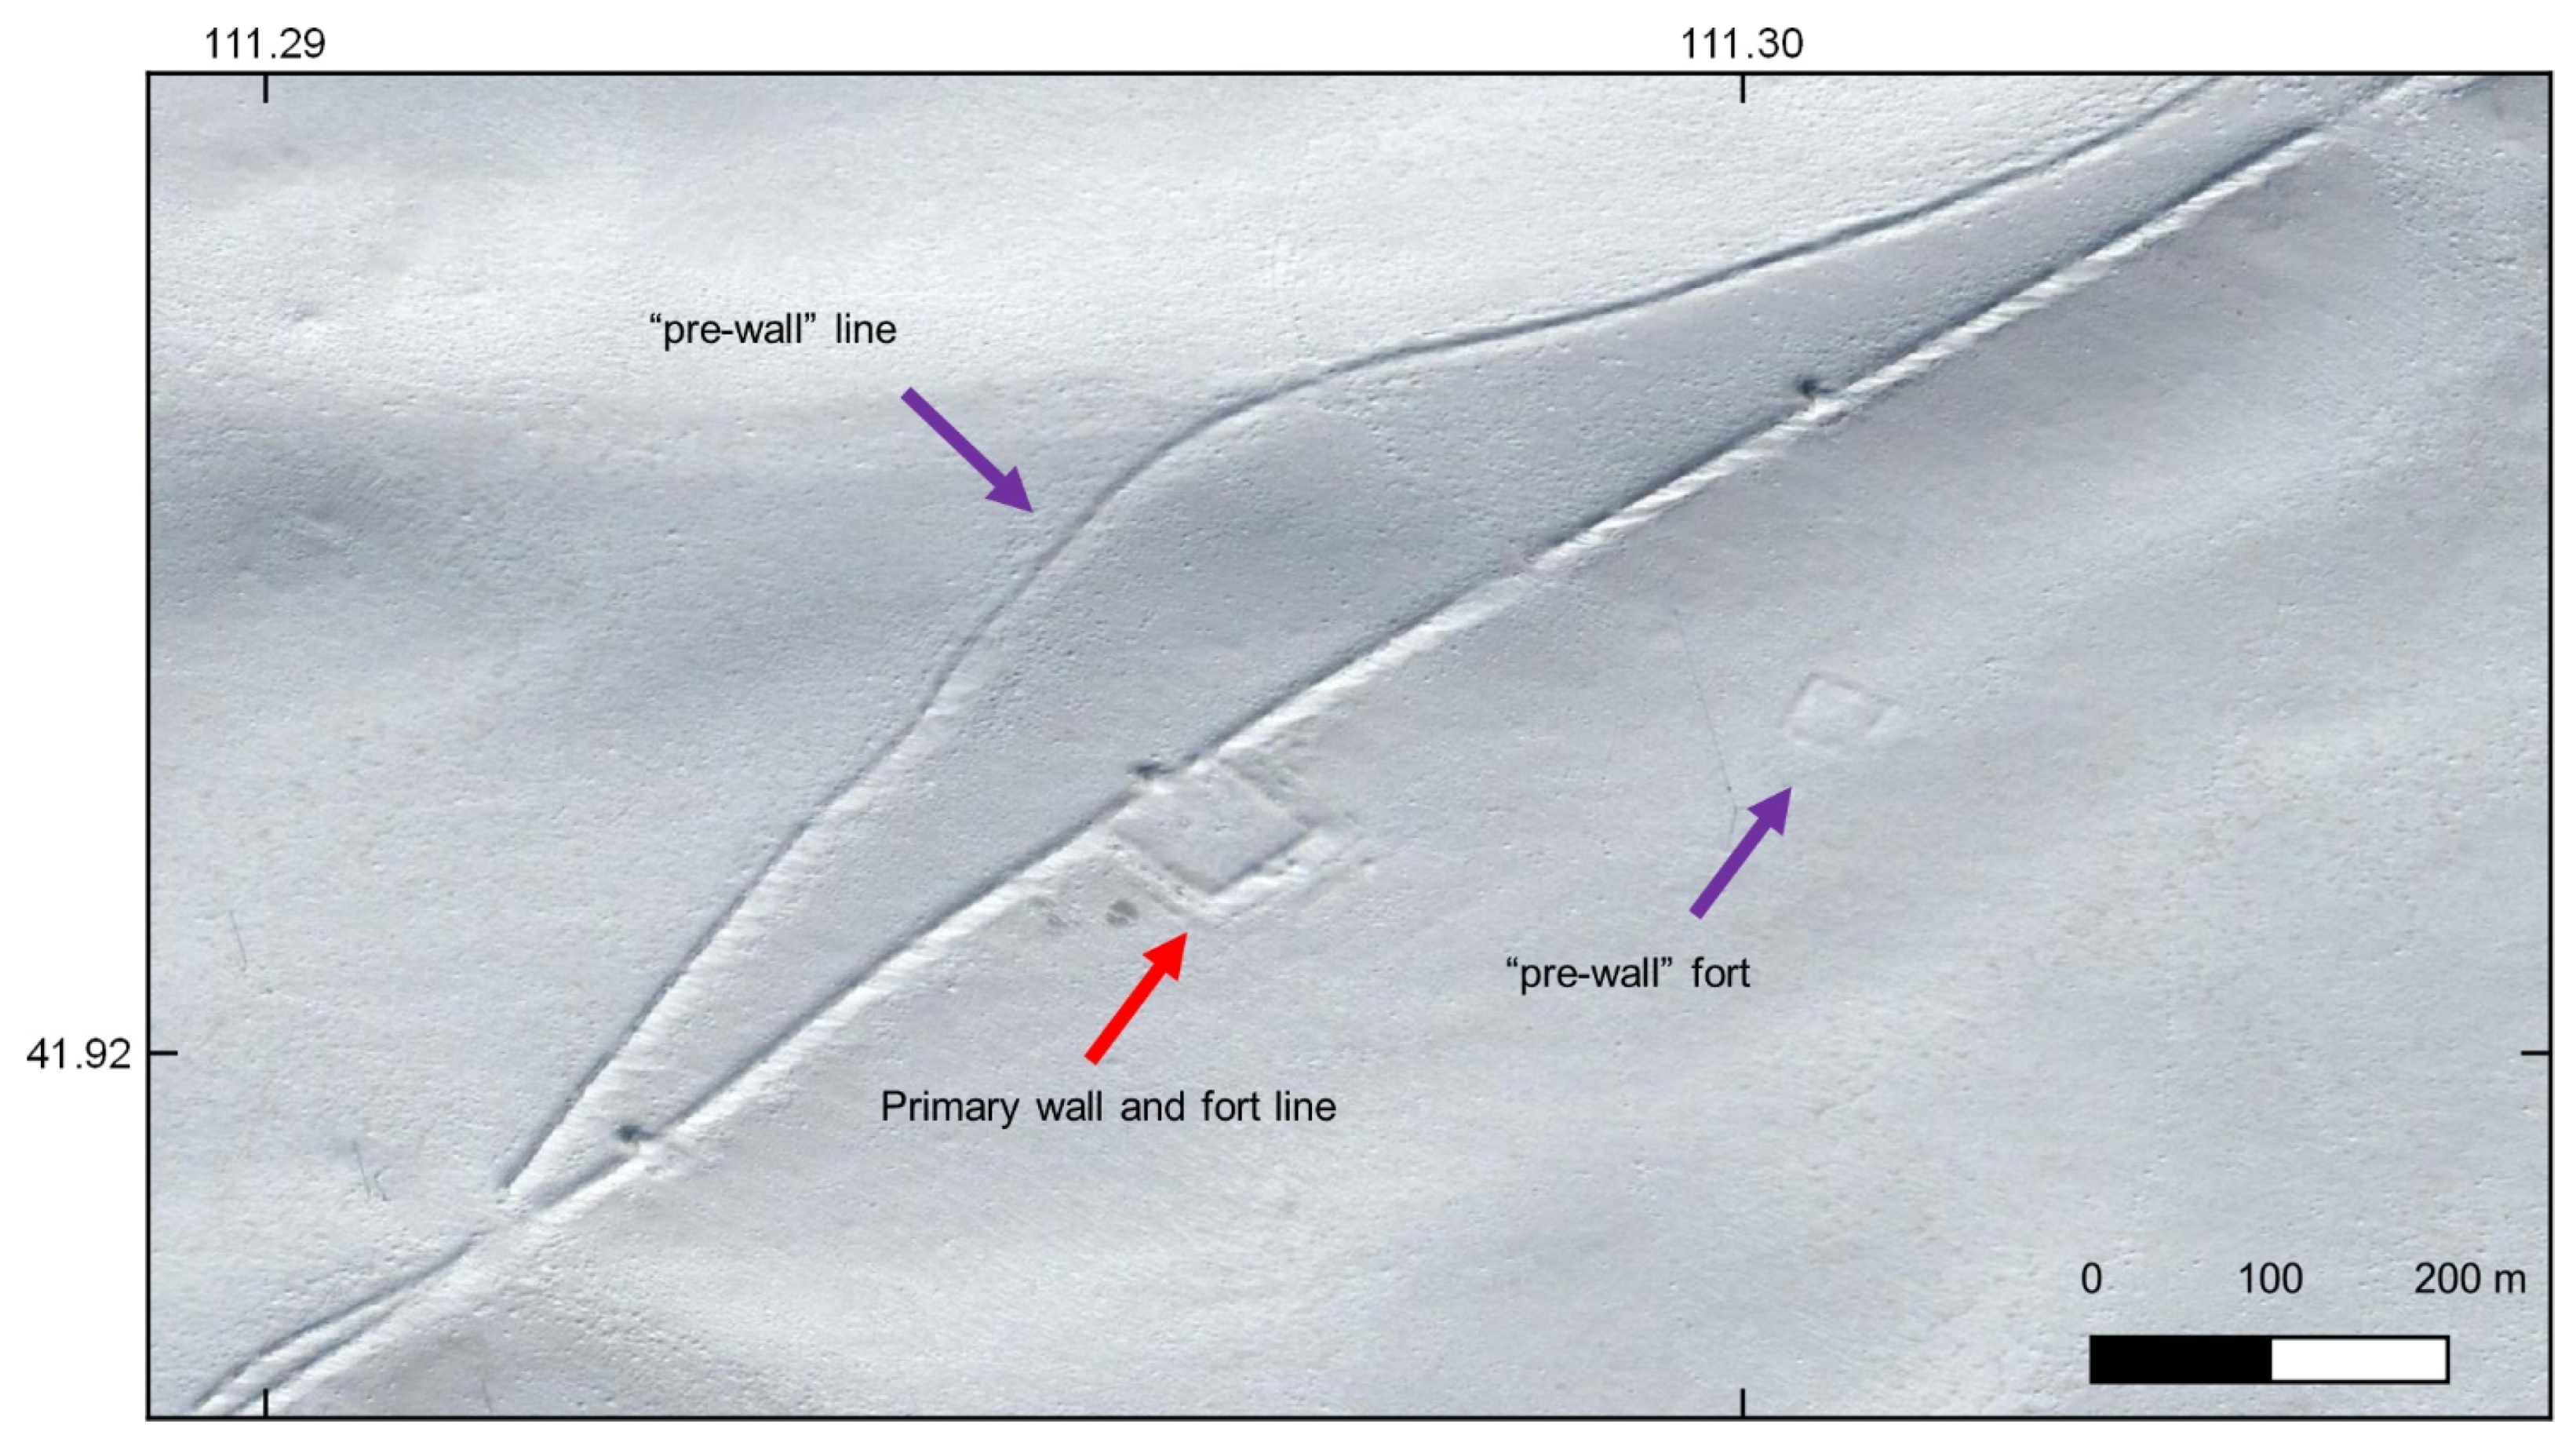
Additional evidence supporting this hypothesis comes from examining the spatial distribution of the wall itself. In previous scholarship on the MWS, the different phases of wall construction were never systematically studied leading some scholars to assume that all of the forts are part of one complete defensive system [26,32]. However, in some parts of the MWS, we encountered walls that were composed of one, two, or sometimes even three parallel lines and the forts themselves are either attached or separate from the wall, an indication that these walls may have been re-used or modified over an indeterminate period of time. These wall lines are often interpreted as being a diagnostic feature of the so-called Jin border trench and the double wall system is argued to have been an intentional improvement to the defensive capacities of the MWS [50] (Figure 11). While the double or triple wall line may have improved the defensive capacity of the MWS, it is unclear if these walls were all built at the same time or if they represent different phases of wall construction. In several places, there are two wall lines, a main wall and a secondary deteriorated wall. The secondary wall line seems at some places to stem out of the main wall, stretch away, run parallel for some distance and merge back into the main medieval wall. The variety of types of wall line indicate different episodes or styles of wall construction. Since the single line merges with the double line of the MWS, we argue that this secondary wall preceded the so-called Jin wall. For convenience, we refer to this secondary wall as the “preceding wall” (pre-wall).
Based on the appearance of the wall in the satellite images and our typology of its main features, we hypothesize that the pre-wall is probably a wall line constructed prior to the main wall line, and in some places, the main medieval wall line was built on top of or parallel to the pre-wall. The main medieval wall is well preserved compared to the deteriorated secondary wall (Figure 12). The best preserved, and most-studied, sections of the MWS are relatively large and located adjacent to the wall or close to it. Forts associated with the pre-wall are smaller, deteriorated, and located farther away from the wall. The orientation of the forts of the main wall line is with one side of the fort parallel to the wall, while forts of the pre-wall have one corner pointing towards the pre-wall line.
In the future, additional geospatial work will enable more sophisticated analyses to test hypotheses regarding the chronology and function of the MWS. Stylistic differences in structure may indicate different periods of construction. Viewshed and least cost path analyses will be used to test the hypothesis that the wall was primarily built as a military fortification. Recent work along the Ming section of the Great Wall has produced interesting results that enable a more systematic investigation of the interrelationship among the structures that comprise the Ming dynasty “Great Wall,” examining distances in “travel time” from one structure to another, thereby exploring the interrelationship between different structures along the Ming dynasty “Great Wall” [11]. After further refining this dataset, we will conduct similar types of analyses that explore the logic behind the construction of different sections of the MWS, and why people constructed forts and walls in these locations. Additionally, we hope to use methods to calculate the energetic cost, or the amount of construction hours, that would have been required to build the MWS [14]. Using energetics, we can compare the amount of labor or input required to build the MWS to other wall systems in China or around the world. Conducting these kinds of analyses requires accurate maps of the wall and forts obtained from measurements based on satellite imagery. Therefore, we suggest that archaeologists use a multi-method approach to create and share accurate maps of ancient wall systems to facilitate cross-cultural comparison of ancient wall systems.
Nevertheless, the multi-method approach used here can only take the analysis of the MWS and its many features so far. Archaeological field work at these locations is the only way to ascertain the MWS age and function. Without chronometric data, it is impossible to know the exact sequence of wall construction, and any geospatial analyses that differentiate areas of construction or use must be ground-truthed by archaeological excavation. More fieldwork is necessary to understand how all these different structures and types of wall construction may or may not be related to one another.
5. Conclusions
Despite their cross-cultural prevalence and importance to global history, ancient wall systems remain a rarely discussed topic in archaeology and archaeological science. We argue that one of the primary impediments in furthering the archaeological study of wall systems is a lack of accurate maps and geospatial data. Our multi-method approach for mapping the extent of the MWS in China and Mongolia underscores the potential to combine historical geography with remote sensing methods to produce accurate maps of ancient wall systems. By using this approach, we developed the first geospatially accurate map of the MWS, demonstrating that the wall system follows a continuous course from China through to Mongolia. Moreover, through the use of spatial statistics, we were able to identify different areas of fort construction along the MWS, revealing that the outer portions of the MWS contain fewer and smaller forts than the portions of the MWS closer to the agricultural heartland of the North China Plain. Future work will involve the creation of a comprehensive database available for researchers to conduct more detailed and advanced analyses on the wall and structures associated with it. In conclusion, we hope that more archaeologists and historians take advantage of the availability of high-quality remote sensing data to systematically map and compare ancient wall systems around the world, furthering our understanding of wall systems, both ancient and modern.
Supplementary Materials
The following Supplementary Materials are available online at https://www.mdpi.com/article/10.3390/land10100997/s1. These data include all geospatial data necessary to replicate our analyses, as well as Supplemental Table S1: Maps and atlases consulted and Supplemental Table S2: Corona imagery metadata.
Author Contributions
Conceptualization, M.S., D.G., I.W., and G.S.-L.; methodology, M.S., D.G., I.W., and Z.Z.; software, M.S., D.G., I.W., and Z.Z.; validation, M.S., D.G., I.W., Z.Z., and G.S.-L.; formal analysis, M.S. and I.W.; investigation, M.S., D.G., I.W, Z.Z., and J.S.L.; resources, M.S., D.G., I.W., and Z.Z.; data curation, M.S., D.G, I.W., and Z.Z.; writing—original draft preparation, M.S.; writing—review and editing, M.S., D.G., I.W., Z.Z., J.S.L., and G.S.-L.; visualization, M.S.; supervision, G.S.-L.; project administration, G.S.-L.; funding acquisition, G.S.-L. All authors have read and agreed to the published version of the manuscript.
Funding
This project has received funding from the European Research Council (ERC) under the European Union’s Horizon 2020 research and innovation programme (“The Wall” project, grant agreement No 882894).
Data Availability Statement
The data is contained with the Supplementary Material associated with this article. Please note that this data represents a work in progress and since not all data has been verified, there may be potential errors.
Acknowledgments
We gratefully acknowledge Capella Space for providing us with a sample product of the high-resolution SAR imagery displayed here.
Conflicts of Interest
The authors declare no conflict of interest.
References
- Spring, P. Great Walls and Linear Barriers; Pen and Sword: Barnsley, UK, 2015. [Google Scholar]
- Vernon, V.; Zimmermann, K.F. Walls and fences: A journey through history and economics. In The Economic Geography of Cross-Border Migration; Kourtit, K., Newbold, B., Nijkamp, P., Partridge, M., Eds.; Springer: Berlin/Heidelberg, Germany, 2021; pp. 33–54. [Google Scholar] [CrossRef]
- Nokandeh, J.; Sauer, E.W.; Rekavandi, H.O.; Wilkinson, T.; Abbasi, G.A.; Schweninger, J.-L.; Mahmoudi, M.; Parker, D.; Fattahi, M.; Usher-Wilson, L.S.; et al. Linear barriers of northern Iran: The Great Wall of Gorgan and the Wall of Tammishe. Iran 2006, 44, 121–173. [Google Scholar] [CrossRef] [Green Version]
- Sauer, E.W.; Nokandeh, J.; Pitskhelauri, K.; Rekavandi, H.O. Innovation and stagnation: Military infrastructure and the shifting balance of power between Rome and Persia. Sasanian Persia Between Rome Steppes Eurasia 2017, 241–267. [Google Scholar] [CrossRef]
- Isaac, B. The meaning of the terms Limes and Limitanei. J. Rom. Stud. 1988, 78, 125–147. [Google Scholar] [CrossRef]
- Bachagha, N.; Wang, X.; Luo, L.; Li, L.; Khatteli, H.; Lasaponara, R. Remote sensing and GIS techniques for reconstructing the military fort system on the Roman boundary (Tunisian section) and identifying archaeological sites. Remote Sens. Environ. 2019, 236, 111418. [Google Scholar] [CrossRef]
- Opitz, R.; Herrmann, J. Recent trends and long-standing problems in archaeological remote sensing. J. Comput. Appl. Archaeol. 2018, 1, 19–41. [Google Scholar] [CrossRef] [Green Version]
- Agapiou, A.; Alexakis, D.D.; Hadjimitsis, D.G. Potential of virtual Earth observation constellations in archaeological research. Sensors 2019, 19, 4066. [Google Scholar] [CrossRef] [Green Version]
- Luo, L.; Wang, X.; Guo, H.; Lasaponara, R.; Zong, X.; Masini, N.; Wang, G.; Shi, P.; Khatteli, H.; Chen, F.; et al. Airborne and spaceborne remote sensing for archaeological and cultural heritage applications: A review of the century (1907–2017). Remote Sens. Environ. 2019, 232, 111280. [Google Scholar] [CrossRef]
- Luo, L.; Wang, X.; Guo, H.; Lasaponara, R.; Shi, P.; Bachagha, N.; Li, L.; Yao, Y.; Masini, N.; Chen, F.; et al. Google Earth as a powerful tool for archaeological and cultural heritage applications: A review. Remote Sens. 2018, 10, 1558. [Google Scholar] [CrossRef]
- Du, Y.; Chen, W.; Cui, K.; Guo, Z.; Wu, G.; Ren, X. An exploration of the military defense system of the Ming Great Wall in Qinghai province from the perspective of castle-based military settlements. Archaeol. Anthr. Sci. 2021, 13, 1–18. [Google Scholar] [CrossRef]
- Luo, L.; Bachagha, N.; Yao, Y.; Liu, C.; Shi, P.; Zhu, L.; Shao, J.; Wang, X. Identifying linear traces of the Han Dynasty Great Wall in Dunhuang using Gaofen-1 satellite remote sensing imagery and the Hough transform. Remote Sens. 2019, 11, 2711. [Google Scholar] [CrossRef] [Green Version]
- Shelach-Lavi, G.; Wachtel, I.; Golan, D.; Batzorig, O.; Amartuvshin, C.; Ellenblum, R.; Honeychurch, W. Medieval long-wall construction on the Mongolian Steppe during the eleventh to thirteenth centuries AD. Antiquity 2020, 94, 724–741. [Google Scholar] [CrossRef]
- Shelach-Lavi, G.; Honeychurch, W.; Chunag, A. Does extra-large equal extra-ordinary? The ‘Wall of Chinggis Khan’ from a multidimensional perspective. Humanit. Soc. Sci. Commun. 2020, 7, 1–10. [Google Scholar] [CrossRef]
- Kradin, N.N. The Great Wall of Khitan: North Western Wall of Chinggis Khan; Nauka—Vostochnaya Literatura: Moscow, Russia, 2019. [Google Scholar]
- Tan, Q. Zhongguo Lishi Dituji Di Liuce: Song Liao Jin Shiqi (The Historical Atlas of China, Volume 6: Song Dynasty, Liao Dynasty, Jin Dynasty); Cartographic Publishing House: Beijing, China, 1982; Volume 6. (In Chinese) [Google Scholar]
- Jing, A.; Miao, T. Liao Jin Bianhao yu Changcheng (The Great Wall and Border Marker of the Liao and Jin). Dongbei Shidi 2008, 6, 18–31. (In Chinese) [Google Scholar]
- Li, H. Jin Jiehao yu Changcheng (The Jin Border Trench and the Great Wall). Zhongguo Bianjian Shidi Yanjiu 2008, 1, 1–9. (In Chinese) [Google Scholar]
- Feng, Y. Jin Changcheng de kaogu faxian yu yanjiu (Archaeological discovery and research of the Jin Great Wall). In Jin Changcheng Yanjiu Lunji Xiace (Collected Works on the Jin Great Wall Volume 2); Sun, W., Wang, Y., Eds.; Jilin Wenshi Chubanshe: Changchun, China, 2009; Volume 2, pp. 88–166. (In Chinese) [Google Scholar]
- Wang, G. Jin Jiehao kao (Examining the Jin Border Trench). In Jin Changcheng Yanjiu Lunji Shangce (Collected Works on the Jin Great Wall Volume 1); Sun, W., Wang, Y., Eds.; Jilin Wenshi Chubanshe: Changchun, China, 2009; Volume 1, pp. 257–268. (In Chinese) [Google Scholar]
- Standen, N. Unbounded Loyalty: Frontier Crossings in Liao China; University of Hawaii Press: Honolulu, HI, USA, 2006. [Google Scholar]
- Li, Y. Jin Jiehao nanxian yiji zhi kaocha (Investigations on the remains of the southern line of the Jin Border Trench). In Jin Changcheng Yanjiu Lunji Shangce (Collected Works on the Jin Great Wall Volume 1); Sun, W., Wang, Y., Eds.; Jinlin Wenshi Chubanshe: Changchun, China, 2009; Volume 1, pp. 192–208. (In Chinese) [Google Scholar]
- Kovalev, A.A.; Erdenebeaatar, D. About Chinggis Khan’s wall in Mongolia. Nomadic Stud. 2010, 17, 28–33. [Google Scholar]
- Lunkov, A.V.; Harinskii, A.V. The frontier fortification of the Liao Empire in eastern Transbaikalia. Silk Road 2011, 9, 104–121. [Google Scholar]
- Sun, W.; Wang, Y. Jin Changcheng Yanjiu Lunji (Collected Works on the Jin Great Wall); Jilin Wenshi Chubanshe: Changchun, China, 2009. (In Chinese) [Google Scholar]
- Xie, D.; Yukun, Z.; Li, Y. Jin Changcheng Fangyuxi yu Junshi Juluo (The Defensive Structure and Military Settlements of the Jin Great Wall); Zhongguo Jianzhu Gongye Chubanshe: Beijing, China, 2020. (In Chinese) [Google Scholar]
- Feng, Y. Jin Changcheng de kaogu yu faxian (The archaeology and discovery of the Jin Great Wall). Dongbei Shidi 2006, 4, 28–35. (In Chinese) [Google Scholar]
- Jia, Z. Jin Changcheng chuyi (A preliminary discussion on the Jin Great Wall). In Jin Changcheng Yanjiu Lunji Shangce (Collected Works on the Jin Great Wall Volume 1); Sun, W., Wang, Y., Eds.; Jinlin Wenshi Chubanshe: Changchun, China, 2009; Volume 1, pp. 269–281. (In Chinese) [Google Scholar]
- Feng, Y. Jin Changcheng (The Jin Great Wall). In Jin Changcheng Yanjiu Lunji Xiace (Collected Works on the Jin Great Wall Volume 2); Sun, W., Wang, Y., Eds.; Jilin Wenwu Chubanshe: Changchun, China, 2009; Volume 2, pp. 45–87. (In Chinese) [Google Scholar]
- Shou, P. Lidai Changcheng kao (Textual research on the Great Wall). In Changcheng Yanjiu Ziliao Liang Zhong (Research on the Great Wall: Volume 2); Wang, G., Shou, P., Eds.; Longmen Shudian: Hong Kong, China, 1978; pp. 1–27. (In Chinese) [Google Scholar]
- Wenwuju, G. Changcheng Baohu Zongti Guihua (A Comprehensive Plan to Protect the Great Wall); Wenhua he Luyoubu Guojia Wenwuju: Beijing, China, 2019. (In Chinese) [Google Scholar]
- Wenwuju, G. Zhongguo Wenwu Dituji Neimenggu Fence (Atlas of Chinese Cultural Relics Inner Mongolia Edition); Zhongguo Ditu Chubanshe: Beijing, China, 2007. (In Chinese) [Google Scholar]
- Jaffe, Y.Y.; Castellano, L.; Shelach-Lavi, G.; Campbell, R.B. Mismatches of scale in the application of paleoclimatic research to Chinese archaeology. Quat. Res. 2020, 99, 14–33. [Google Scholar] [CrossRef]
- Davies, J.; Kent, A.J. The Red Atlas: How the Soviet Union Secretly Mapped the World; University of Chicago Press: Chicago, IL, USA, 2020. [Google Scholar]
- Rondelli, B.; Stride, S.; García-Granero, J.J. Soviet military maps and archaeological survey in the Samarkand region. J. Cultural Heritage 2013, 14, 270–276. [Google Scholar] [CrossRef]
- Casana, J. Global-scale archaeological prospection using CORONA satellite imagery: Automated, crowd-sourced, and expert-led approaches. J. Field Archaeol. 2020, 45, S89–S100. [Google Scholar] [CrossRef] [Green Version]
- Ur, J. CORONA satellite photography and ancient road networks: A northern Mesopotamian case study. Antiquity 2003, 77, 102–115. [Google Scholar] [CrossRef] [Green Version]
- Min, L. Archaeological landscapes of China and the application of Corona images. In Mapping Archaeological Landscapes from Space; Springer: Berlin/Heidelberg, Germany, 2013; pp. 45–54. [Google Scholar]
- Lasaponara, R.; Yang, R.; Chen, F.; Li, X.; Masini, N. Corona satellite pictures for archaeological studies: A review and application to the lost Forbidden City of the Han–Wei dynasties. Surv. Geophys. 2018, 39, 1303–1322. [Google Scholar] [CrossRef]
- Watanabe, N.; Nakamura, S.; Liu, B.; Wang, N. Utilization of Structure from Motion for processing CORONA satellite images: Application to mapping and interpretation of archaeological features in Liangzhu Culture, China. Archaeol. Res. Asia 2017, 11, 38–50. [Google Scholar] [CrossRef]
- Hu, N.; Li, X.; Luo, L.; Zhang, L. Ancient irrigation canals mapped from Corona imageries and their implications in Juyan Oasis along the Silk Road. Sustainability 2017, 9, 1283. [Google Scholar] [CrossRef] [Green Version]
- Casana, J.; Cothren, J. Stereo analysis, DEM extraction and orthorectification of CORONA satellite imagery: Archaeological applications from the Near East. Antiquity 2008, 82, 732–749. [Google Scholar] [CrossRef] [Green Version]
- Fowler, M.J.F. Archaeology through the keyhole: The serendipity effect of aerial reconnaissance revisited. Interdiscip. Sci. Rev. 2004, 29, 118–134. [Google Scholar]
- Pope, K.O.; Dahlin, B.H. Ancient Maya wetland agriculture: New insights from ecological and remote sensing research. J. Field Archaeol. 1989, 16, 87. [Google Scholar] [CrossRef]
- Chen, F.; You, J.; Tang, P.; Zhou, W.; Masini, N.; Lasaponara, R. Unique performance of spaceborne SAR remote sensing in cultural heritage applications: Overviews and perspectives. Archaeol. Prospect. 2017, 25, 71–79. [Google Scholar] [CrossRef]
- Tapete, D.; Cigna, F. Trends and perspectives of space-borne SAR remote sensing for archaeological landscape and cultural heritage applications. J. Archaeol. Sci. Rep. 2017, 14, 716–726. [Google Scholar] [CrossRef] [Green Version]
- Kovalev, A.A. The northern border of the Tangut state of Xi Xia according to archaeological and written sources. In The Tanguts in Central Asia: Collected Articles in Honor of the 80th Anniversary of Professor, E.I. Kychanov; Popov, I.F., Ed.; Institute of Oriental Manuscripts of the Russian Academy of Sciences: Moscow, Russia, 2012; pp. 154–185. (In Russian) [Google Scholar]
- Xing, Y. Yaoguan Neiminggu Han wai changcheng nanxian Zhangsai yizhi (Remote sensing of the Zhangsai site, the southern line of the outer great wall of the Han in Inner Mongolia). Gujin Lunheng 2020, 34, 78–128. [Google Scholar]
- Daragan, M. About appearance of mega-hillforts in the Ukrainian forest-steppe in the Early Scythian time: The search for an explanatory model. Tyragetia Ser. Nouă 2020, 29, 117–139. [Google Scholar]
- Jia, Z. Jindai Changcheng (The Great Wall of the Jin Dynasty). In Jin Changcheng Yanjiu Lunji Shangce (Collected Works on the Jin Great Wall Volume 1); Sun, W., Wang, Y., Eds.; Jilin Wenwu Chubanshe: Changchun, China, 2009; Volume 1, pp. 282–297. (In Chinese) [Google Scholar]
Figure 1.
The location of the northern and southern lines of the Medieval Wall System. The southern line is the focus of this study. The locations of this wall are derived from Xie [26].
Figure 1.
The location of the northern and southern lines of the Medieval Wall System. The southern line is the focus of this study. The locations of this wall are derived from Xie [26].

Figure 2.
An example of four wall lines drawn by various scholars that are presumably associated with the MWS in previous publications. None of these lines correctly place the MWS: 1 [22], 2 [27], 3 [28], and 4 [29].

Figure 3.
Workflow diagram of the multi-method approach used to precisely plot the location of the MWS.
Figure 3.
Workflow diagram of the multi-method approach used to precisely plot the location of the MWS.

Figure 4.
(a) Tan Qixiang’s Historical Atlas of China, (b) Atlas of Chinese Cultural Relics, and (c) the Soviet maps of the area.
Figure 4.
(a) Tan Qixiang’s Historical Atlas of China, (b) Atlas of Chinese Cultural Relics, and (c) the Soviet maps of the area.

Figure 5.
The different size classes as defined by Xie (2020): (a) Class 1, very small; (b) Class 1, normal fort size; (c) Class 2; (d) Class 3; (e) Class 5, a walled city; (f) Class 6, a walled city.
Figure 5.
The different size classes as defined by Xie (2020): (a) Class 1, very small; (b) Class 1, normal fort size; (c) Class 2; (d) Class 3; (e) Class 5, a walled city; (f) Class 6, a walled city.

Figure 6.
Our comprehensive map of the MWS, with areas investigated using remote sensing: Area 1 is the Gobi Desert, Area 2 is the Mongolian Arch, and Area 3 is the Nierji Dam.
Figure 6.
Our comprehensive map of the MWS, with areas investigated using remote sensing: Area 1 is the Gobi Desert, Area 2 is the Mongolian Arch, and Area 3 is the Nierji Dam.

Figure 7.
SAR imagery of the Gobi Desert: (a) Area 1, the Gobi Desert using Sentinel-1 C-band SAR imagery showing a faint outline of the MWS; (b) Google Earth imagery of the same extent; (c) Sentinel-1 C-band of wall line; (d) CAPELLA SAR imagery; (e) Google Earth imagery showing ambiguous line.
Figure 7.
SAR imagery of the Gobi Desert: (a) Area 1, the Gobi Desert using Sentinel-1 C-band SAR imagery showing a faint outline of the MWS; (b) Google Earth imagery of the same extent; (c) Sentinel-1 C-band of wall line; (d) CAPELLA SAR imagery; (e) Google Earth imagery showing ambiguous line.

Figure 8.
Forts in the Mongolian Arch area: (a) forts on Bing Maps and (b) forts on CORONA imagery.

Figure 9.
Forts destroyed by the Nierji Dam: (a) overview of dammed area, (b) image before dam construction, (c) dam construction, (d) fort on CORONA image before dam construction, (e) fort location on Bing Maps, (f) wall line on CORONA image.
Figure 9.
Forts destroyed by the Nierji Dam: (a) overview of dammed area, (b) image before dam construction, (c) dam construction, (d) fort on CORONA image before dam construction, (e) fort location on Bing Maps, (f) wall line on CORONA image.

Figure 10.
(a) Map of fort size by perimeter and 500 km quadrant (the squares labelled A–H), (b) box plot of all fort size classes by perimeter (m) and 500 km quadrant (A–H) and (c) box plot of fort classes 1 and 2 by perimeter (m) and quadrant (A–H). All the data necessary to replicate these figures are included within the Supplemental Material.

Figure 11.
Typical construction method found along the main line of the MWS (figure adapted from ([50], pp. 293–294)).
Figure 11.
Typical construction method found along the main line of the MWS (figure adapted from ([50], pp. 293–294)).

Figure 12.
Examples of the main line with forts and bastions repurposing the “pre-wall” wall line and forts.
Figure 12.
Examples of the main line with forts and bastions repurposing the “pre-wall” wall line and forts.


Table 1.
Types of remote sensing data and maps used to locate the MWS.
| Data Source | Type | Scale/Resolution |
|---|---|---|
| Soviet maps | Paper map | 1:500,000–1:100,000 |
| Historical Atlas of China | Paper map | 1:490,000 |
| Atlas of Chinese Cultural Relics | Paper map | 1:200,000–1:50,000 |
| Sentinel-1 C-band | Synthetic Aperture Radar (SAR) | 10 m |
| Capella Space | Synthetic Aperture Radar (SAR) | 0.5 m |
| Google Earth | Optical imagery | <5 m |
| Bing Maps | Optical imagery | <5 m |
| CORONA KH-4B | Optical imagery | 1.8 m |
Table 2.
Number of forts in each size classes by quadrant.
| Size Class | Perimeter (m) | Number of Forts in Each Quadrant | Total | |||||||
|---|---|---|---|---|---|---|---|---|---|---|
| A | B | C | D | E | F | G | H | |||
| 1 | Perimeter < 400 | 1 | 82 | 10 | 98 | 41 | 17 | 9 | 14 | 272 |
| 2 | 1000 > Perimeter > 401 | 20 | 49 | 0 | 22 | 38 | 11 | 20 | 31 | 191 |
| 3 | 1750 > Perimeter > 1001 | 0 | 2 | 0 | 19 | 7 | 17 | 3 | 5 | 53 |
| 4 | 2500 > Perimeter > 1751 | 0 | 0 | 0 | 0 | 0 | 0 | 0 | 0 | 0 |
| 5 | 4000 > Perimeter > 2501 | 0 | 2 | 0 | 2 | 0 | 2 | 0 | 0 | 6 |
| 6 | Perimeter > 4001 | 0 | 0 | 0 | 0 | 2 | 1 | 0 | 0 | 3 |
| Total | 21 | 135 | 10 | 141 | 88 | 48 | 32 | 50 | 525 | |
Table 3.
Summary statistics of fort size by perimeter (m) organized by quadrant.
| Quadrant | Number | Min | Max | Mean | Std. Error | Variance | Stand. Dev | Median |
|---|---|---|---|---|---|---|---|---|
| A | 21 | 383 | 599 | 517 | 13 | 3684 | 61 | 538 |
| B | 135 | 18 | 3404 | 348 | 38 | 199,478 | 447 | 270 |
| C | 10 | 144 | 320 | 177 | 16 | 2650 | 51 | 166 |
| D | 141 | 46 | 3191 | 503 | 47 | 314,706 | 561 | 323 |
| E | 88 | 82 | 6406 | 580 | 90 | 713,298 | 845 | 424 |
| F | 48 | 55 | 4527 | 931 | 136 | 887,339 | 942 | 776 |
| G | 32 | 72 | 1676 | 616 | 63 | 128,201 | 358 | 658 |
| H | 50 | 81 | 2305 | 686 | 61 | 188,373 | 434 | 761 |
| Total | 525 | 18 | 6406 | 534 | 27 | 387,512 | 623 | 382 |
Publisher’s Note: MDPI stays neutral with regard to jurisdictional claims in published maps and institutional affiliations. |
© 2021 by the authors. Licensee MDPI, Basel, Switzerland. This article is an open access article distributed under the terms and conditions of the Creative Commons Attribution (CC BY) license (https://creativecommons.org/licenses/by/4.0/).
Share and Cite
MDPI and ACS Style
Storozum, M.; Golan, D.; Wachtel, I.; Zhang, Z.; Lotze, J.S.; Shelach-Lavi, G. Mapping the Medieval Wall System of China and Mongolia: A Multi-Method Approach. Land 2021, 10, 997. https://doi.org/10.3390/land10100997
AMA Style
Storozum M, Golan D, Wachtel I, Zhang Z, Lotze JS, Shelach-Lavi G. Mapping the Medieval Wall System of China and Mongolia: A Multi-Method Approach. Land. 2021; 10(10):997. https://doi.org/10.3390/land10100997
Chicago/Turabian StyleStorozum, Michael, Dan Golan, Ido Wachtel, Zhidong Zhang, Johannes S. Lotze, and Gideon Shelach-Lavi. 2021. "Mapping the Medieval Wall System of China and Mongolia: A Multi-Method Approach" Land 10, no. 10: 997. https://doi.org/10.3390/land10100997
Note that from the first issue of 2016, this journal uses article numbers instead of page numbers. See further details here.