
Microbial Respiration and Enzyme Activity Downstream from a Phosphorus Source in the Everglades, Florida, USA


1
Department of Earth and Environment, Florida International University, Miami, FL 33199, USA
2
Southeast Environmental Research Center, Institute of Environment, Florida International University, Miami, FL 33199, USA
*
Author to whom correspondence should be addressed.
Land 2021, 10(7), 696; https://doi.org/10.3390/land10070696
Submission received: 17 May 2021
/
Revised: 24 June 2021
/
Accepted: 25 June 2021
/
Published: 1 July 2021
(This article belongs to the Special Issue Celebrating 25 Years of World Wetlands Day)
Abstract
:Northeast Shark River Slough (NESS), lying at the northeastern perimeter of Everglades National Park (ENP), Florida, USA, has been subjected to years of hydrologic modifications. Construction of the Tamiami Trail (US 41) in 1928 connected the east and west coasts of SE Florida and essentially created a hydrological barrier to southern sheet flow into ENP. Recently, a series of bridges were constructed to elevate a portion of Tamiami Trail, allow more water to flow under the bridges, and attempt to restore the ecological balance in the NESS and ENP. This project was conducted to determine aspects of soil physiochemistry and microbial dynamics in the NESS. We evaluated microbial respiration and enzyme assays as indicators of nutrient dynamics in NESS soils. Soil cores were collected from sites at certain distances from the inflow (near canal, NC (0–150 m); midway, M (150–600 m); and far from canal, FC (600–1200 m)). Soil slurries were incubated and assayed for CO2 emission and β-glucoside (MUFC) or phosphatase (MUFP) activity in concert with physicochemical analysis. Significantly higher TP contents at NC (2.45 times) and M (1.52 times) sites than FC sites indicated an uneven P distribution downstream from the source canal. The highest soil organic matter content (84%) contents were observed at M sites, which was due to higher vegetation biomass observed at those sites. Consequently, CO2 efflux was greater at M sites (average 2.72 µmoles g dw−1 h−1) than the other two sites. We also found that amendments of glucose increased CO2 efflux from all soils, whereas the addition of phosphorus did not. The results indicate that microbial respiration downstream of inflows in the NESS is not limited by P, but more so by the availability of labile C.
1. Introduction
Wetlands are considered to be both sources and sinks of terrestrial C and play an important role in the global C cycle. Wetlands are estimated to contain approximately 20–30% of the global C pool [1]. The total amount of C stored in wetlands in the conterminous US is about 11.52 Pg [2]. The nutrient dynamics and biogeochemistry of soils in wetlands are more complex than in uplands, specifically because of the intermittent anaerobic and semi-aerobic conditions. Microbial respiration and enzyme assays can be considered as potential indicators of soil health, nutrient enrichment, availability, and mineralization in wetlands [3,4,5]. Induced enzyme activity (EA) links environmental nutrient availability and microbial biomass stoichiometry [6]. For instance, higher EA in soil indicates low availability of labile nutrient contents. Additionally, small changes in the decomposition rate and enzyme activity will be able to alter both recalcitrant and labile C pools, impacting the long-term soil C stocks. Extracellular enzymes such as glucosidase and phosphatase are majorly studied for their ability to mineralize C from plant litter and P from nucleic acids, respectively, whereas the lability of soil organic matter (SOM) can be determined through the production of CO2 in aerobic incubations [7]. These indicators are also helpful in predicting nutrient status in soils under varying hydrologic conditions. This short-term research study was conducted in the Florida Everglades, the largest wetland in the USA, and is internationally recognized by several organizations including the United Nations Educational, Scientific, and Cultural Organization (UNESCO). Hydrologic modifications enabling anthropogenic development of South Florida have greatly reduced the water flow in Northeast Shark River Slough (NESS) at the northeastern border of Everglades National Park (ENP). The construction of the Tamiami Trail (US highway 41) in 1928 to connect the Florida Coasts created a significant hydrologic barrier (shorter hydroperiod) between NESS and the remaining Everglades to the north. Additionally, nutrient loading from the northern border of NESS resulted in a phosphorus gradient consistent with that seen in other areas of the Everglades in proximity to discharge canals [8]. Studies have suggested that native periphytons (calcareous, filamentous blue-green algal communities), primary producers of Everglades ecosystem, are highly sensitive to P concentrations and small changes in P loading can create rapid changes in the periphyton community [9]. Overall, the reduced hydroperiods in much of the Everglades as a result of water diversion have resulted in net soil C loss [10]. Altered hydroperiods are responsible for the replacement of native aquatic plant species with non-native species [11] and the shifting of native periphyton communities, consequently hampering the long-term ecological balance in the Everglades; however, limited infrastructure, including culverts under the Tamiami Trail, were constructed to allow water to flow southward into the NESS. Since the water flow through the culverts was not sufficient, two large bridges were constructed in 2012 and 2019 to increase water flow into the NESS and to partially restore the hydrology and ecological structure and function.
Historically, the Everglades has largely been a P-limited system [12]; however, nutrient runoff from agricultural and urban development areas may have changed the dynamics of nutrient availability in NESS soils, specifically in nutrient-rich pockets. We contend that using biological indicators in the NESS region will help identify potential ecological and biogeochemical imbalances. The results from this study will be able to provide insights about the nutrient dynamics of NESS specifically after the construction of new bridges. We hypothesized that microbial respiration and enzymatic assays in response to current hydrological changes will be able to indicate the lability of organic matter and P biogeochemistry at certain distances downstream in the NESS. The specific objectives of this study were: (a) to characterize total P (TP), total C (TC) contents and other physicochemical properties of NESS soils at locations with at certain distances from the inflow; (b) to evaluate the potential of microbial respiration (CO2 efflux) and extracellular enzyme activity as predictors of nutrient status in the NESS.
2. Materials and Methods
2.1. Site Location and Sample Collection
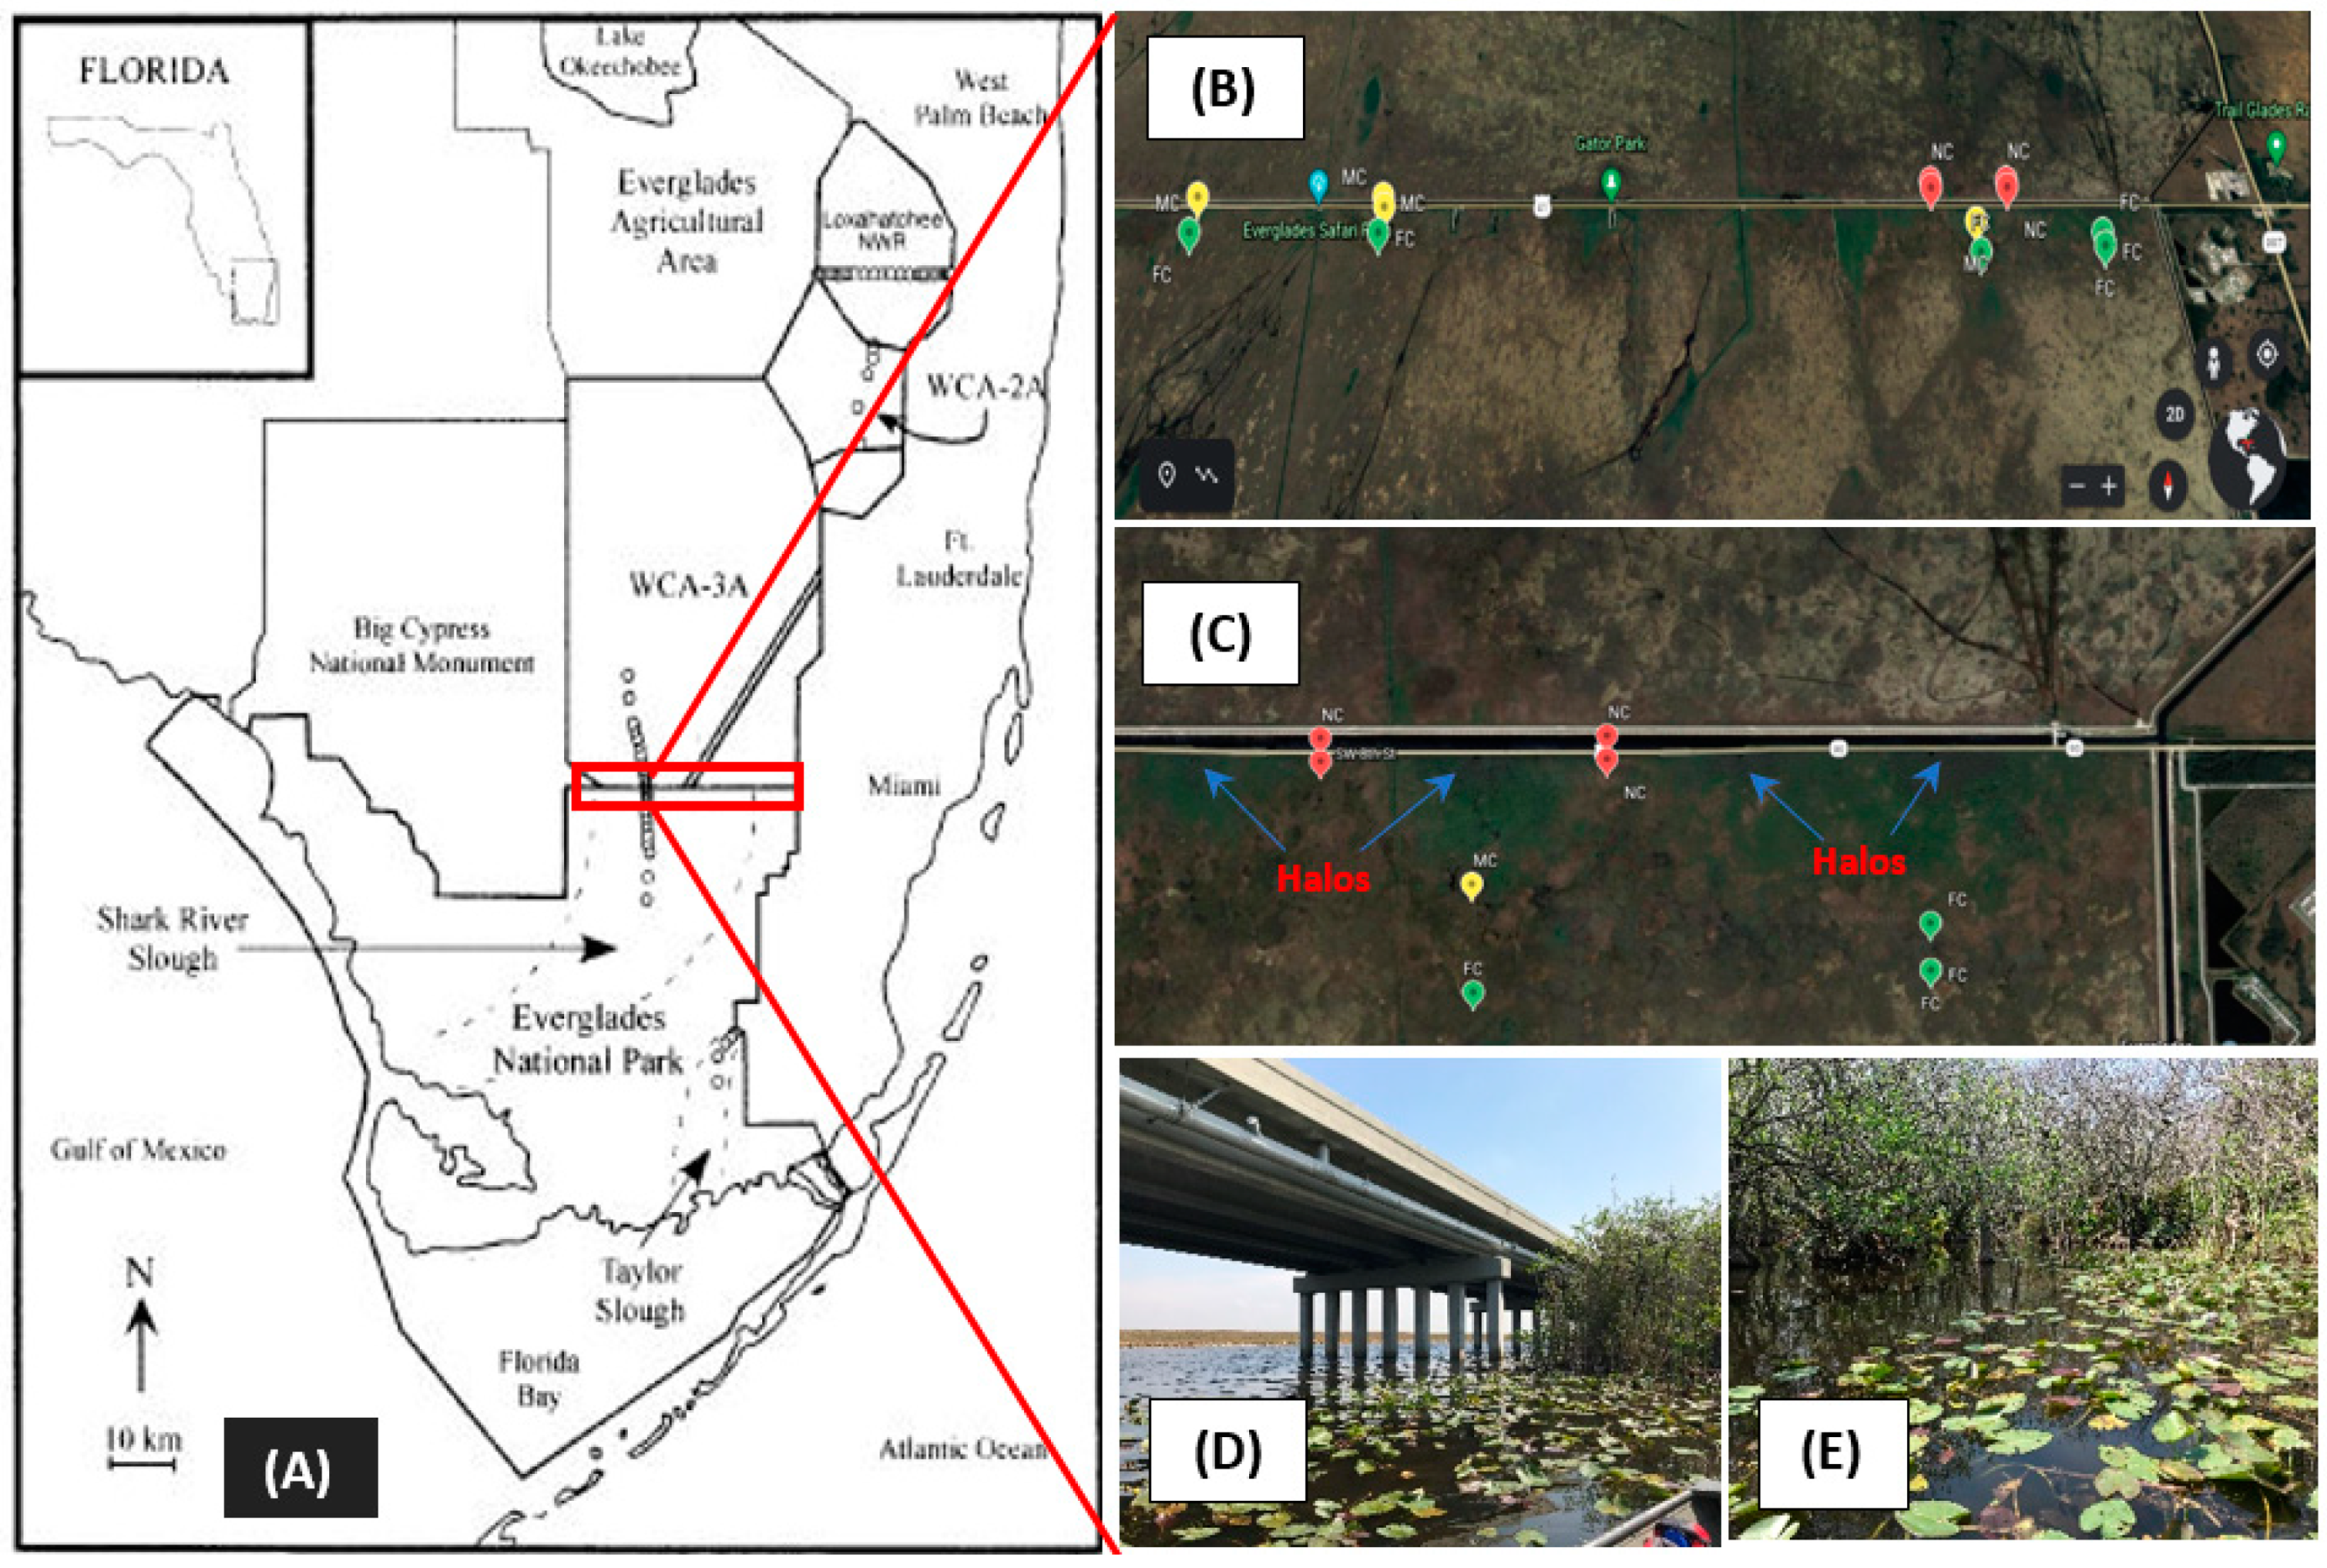
Soils were collected from NESS sites at certain distances from the bridge (inflow) on the Tamiami Trail (Figure 1). Sample collection locations included near-canal (n = 28), midway (n = 24), and far from canal (n = 24) sites that were about 0–150, 150–600, and 600–1200 m downstream, respectively. Intact soil cores (0 to 10 cm) were collected by inserting plastic tubes of a known diameter (surface area) into the soil. Additional care was taken to minimize compaction during collection. Subsamples of known mass fresh soils were used in CO2 efflux incubations and enzyme activity analysis. Additional subsamples were dried, ground, and used in physicochemical analysis. Water depths during each sampling were measured using a standard ruler (one meter stick) to the nearest cm as the depths between the surface of the water and the resistance of the soil.
2.2. Laboratory Analyses
The ability of soil microbes to generate CO2 under controlled conditions was assessed by adding a known mass of fresh 1:1 soil slurries (soil/solution) to 20 mL CO2-free air purged from headspace incubation vials (triplicate) and subjected to dark incubation at 25 °C for 72 h. Gas samples collected from headspace vials were then injected into a HP 5890 Series II gas chromatograph equipped with a flame ionization detector and a Shimadzu MTN-1 methanizer. The measured CO2 efflux was expressed as µmoles per unit mass of dry soil following the methods described by [7,13].
Four treatments were evaluated, including a non-amended control (C) and amendments of 1.2 mmol L−1 of glucose (G), 0.4 mmol L−1 of phosphorus (P), and a combination of phosphorus and glucose (P + G). Treatment strengths were calculated following the method proposed [7] and our previous experiments in NESS soil.
Enzyme activities were determined for each of the four treatments (C, G, P, and P + G) by adding moieties of the fluorogenic substrate, 4-methylumbelliferyl (MUF; either -β-glucoside (MUF-C) or MUF–phosphatase (MUF-P)), to soil solutions made by diluting slurries to a final 10−3 dilution. Diluted samples (200 µL) were pipetted into 8 wells of a 96-well plate, to which 50 µL of either MUF-P or MUF-C substrates were added to obtain final concentrations of 10 µM. Plates were then incubated in the dark for 2 h (MUF-P) or 24 h (MUF-C). Substrates were added to replicate wells after incubation and immediately before fluorometric analysis to determine the initial fluorescence (i.e., t0). No substrate was added to rows or columns containing standards or background blanks. A Synergy HT microplate reader was used for fluorometric determination with enzyme activity regressed from standard curves.
Total carbon (TC) and total nitrogen (TN) levels of oven dried soil samples were analyzed using a Carlo-Erba NA-1500 CNS analyzer [14]. Determination of Total P was done via oxidation (dry combustion) and hydrolysis to soluble forms (soluble reactive, ortho-P; SRP) using MgSO4/H2SO4 and HCl [15], followed by standard colorimetric analysis using USEPA method 365.1 [16]. Dry bulk density (g cm−3) and organic matter (%) levels of soil were measured following the standard methods of ASTM D4531-86 and ASTM D2974-87, respectively.
We analyzed and cleaned the data (using interquartile range calculation) outliers before performing statistical analyses. One-way analysis of variance (ANOVA) was carried out independently on treatments at certain distances and four treatments were carried out between distances using the SAS9.4 PROC MIXED procedure. Tukey–Kramer post-hoc tests were conducted to compare mean separation levels at p < 0.05 among treatments and between distances. Pearson correlation coefficient analysis was performed on soil characteristics at p < 0.05 (two-tailed).
3. Results and Discussion
The construction of the Tamiami Canal and Highway bisected the natural north-to-south sheet flow of water into the ENP. The nutrient-enriched canal water that flowed southward was funneled through a series of culverts and established the long-term P gradient evident in our analysis, whereby soil TP content decreased with distance (Table 1). The soil TP from near-canal (NC) and midway (M) sites were significantly higher (p < 0.05) by about 2.45 and 1.52 times, respectively, than far from canal (FC) sites. Additionally, certain samples with high TP contents (as high as 2630 µg g−1 dw) in NC sites were proximal to “halos” (enriched pockets), areas of increased water depth, nutrient content, and plant biomass at the outfall of culverts (Figure 1). Soil organic matter (SOM) was highest (average 87%) at M sites, which resulted in lowest bulk density values (ranged from 0.11 to 0.16 g dw cm−3) in those soils. A possible explanation would be the presence of the higher vegetation cover in M sites as compared to NC and FC sites. The Pearson analysis (Table 2) of selected soil physicochemical parameters indicated that SOM was highly correlated with TC and TN, which was expected for high organic “peaty” wetland soils [17,18] where soil nutrients are largely in organic forms. Consequently, TN and TC contents were also highest in midway (M) soil samples. In unimpacted Everglades soils (those not influenced by allochthonous sources of P), TP is often correlated with TC [19]; however, this was not the case in our analysis, indicating the possibility of an influence of external P loading (causing a biogeochemical disconnect) from agricultural areas [20].
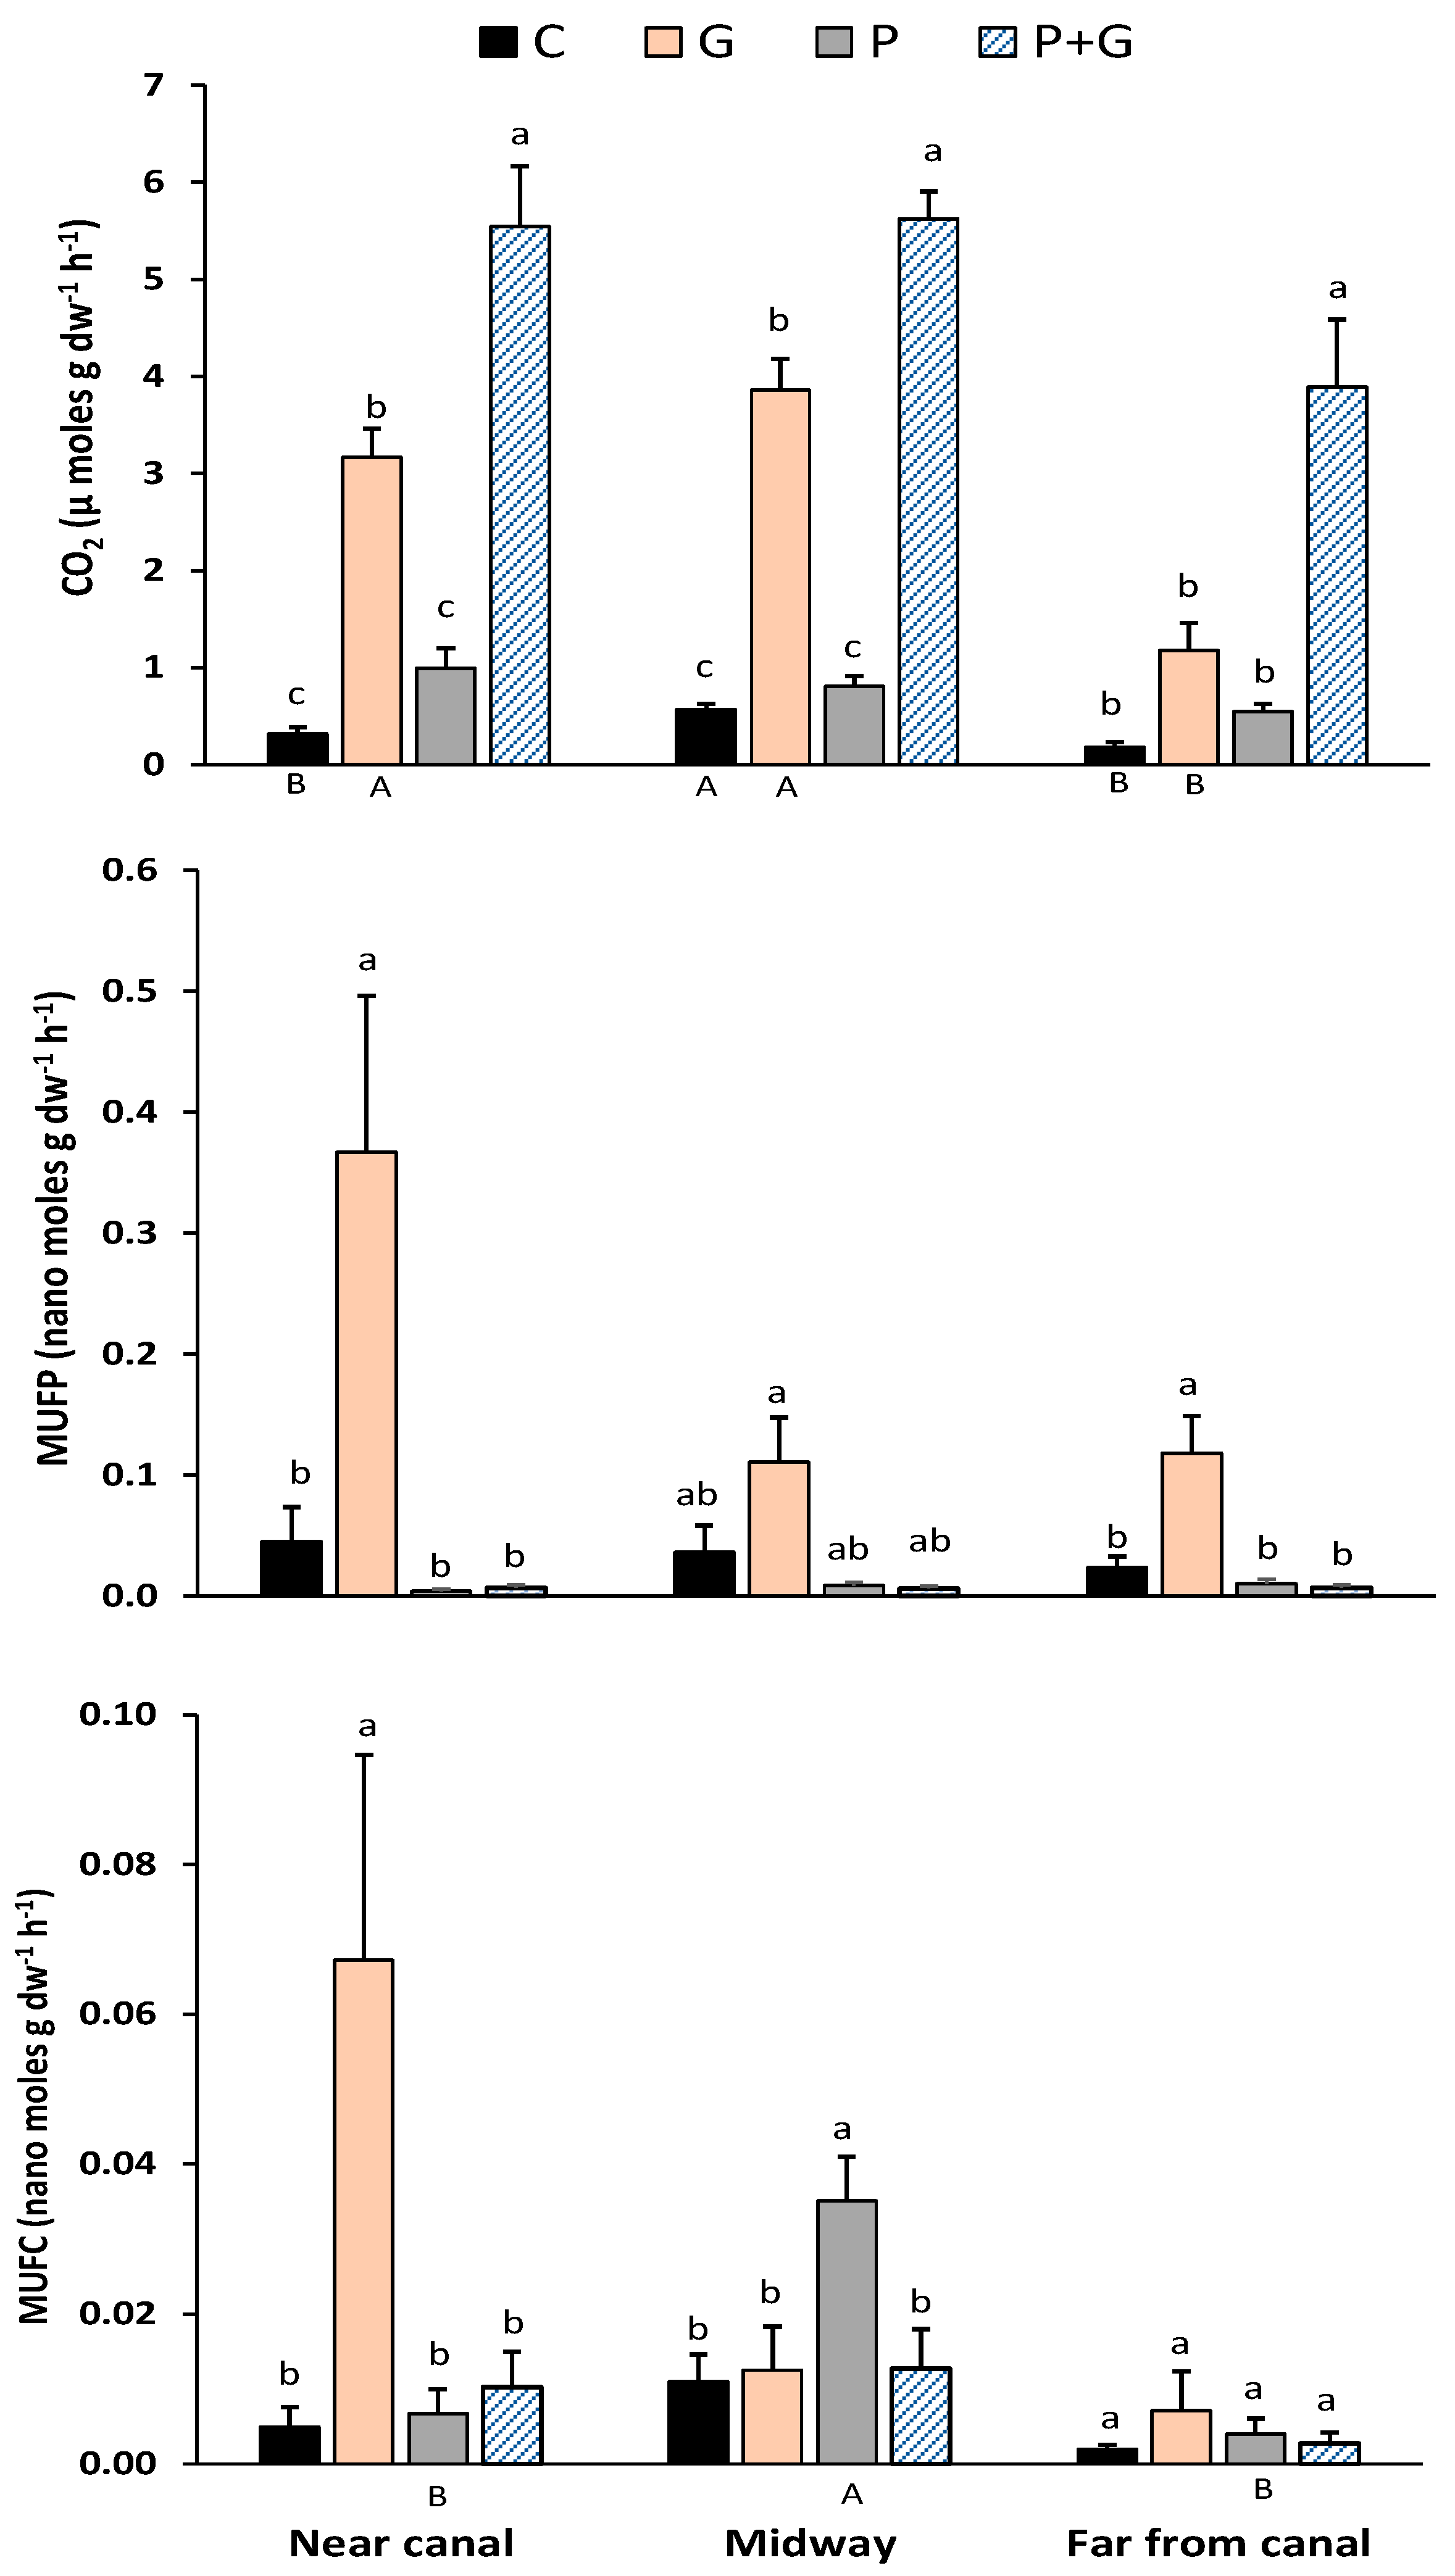
Soil organic matter accumulates in wetlands when C-fixation during photosynthesis exceeds decomposition through mineralization and respiration [21]. Several factors influence this balance, including those that affect fixation, decomposition, and the lability or stability of SOM [22,23]. Previous studies have suggested that decomposition of litter and belowground biomass in the oligotrophic Everglades is P-limited [24], as is the oft-cited P-limited productivity [12,25]. The hypothetical influence of P limitation and variations in SOM lability were studied in our CO2 evolution experiment, where the CO2 fluxes ranged from 0.18 in unamended controls to 5.62 (µmol CO2 g−1 dw soil h−1) under doubly-amended (P + G) treatments for all three locations along the gradient (Figure 2). The addition of P alone as an amendment did not significantly increase CO2 emissions compared to the unamended controls at any location, suggesting that SOM respiration in these soils was not P-limited. Even in the FC sites that had the lowest TP contents (Table 1), where P addition might be suspected to have the greatest influence, P addition did not affect respiration. It should be noted that average TP contents at FC sites (467 mg g−1 dw) were much higher than the previously reported TP concentrations in unimpacted NESS soils (approximately 218 mg g−1 dw; 8). In unamended soils, CO2 production was significantly greater (p < 0.05, as indicated by different capital letters) at the M sites than at the other sites. This could be reflective of the greater overall SOM content at this site rather than differences in the lability of the SOM. The addition of glucose (G) increased respiration relative to the unamended controls at the NC and M sites but not for FC sites (Figure 2). Adding a labile C source (glucose amendment) supports the hypothesis that the efflux of CO2 from NESS soil is at least partially dependent on the SOM carbon quality. As might be expected, a major portion of the SOM present in the NESS soil is in more recalcitrant forms compared to labile glucose [7]. In a recent study conducted at Everglades National Park, [26] found that regardless of restoration activities, the decomposition and microbial respiration were limited by labile C rather than soil P. A potential ecological consequence of recalcitrant SOM under the influence of hydrologic restoration and concurrently longer hydroperiods would be an increase in peat accretion. An abundance of recalcitrant C indicates a healthy and productive wetland ecosystem [27]. In our study, across all treatments at all sites, the combination of phosphorus and glucose (P + G) produced significantly higher CO2 than other treatments, suggesting readily available (labile) C and P increased microbial activity in the soils and caused a “priming effect”, as reported in other studies [7].
Enzyme assays were conducted to determine the activity levels of β-glucosidase and phosphatase enzymes in NESS soils. Soil microbes produce β-glucosidase or phosphatase enzymes to cleave the esterase bond between complex organic molecules and the glucose or phosphate, respectively, allowing these compounds to become available for uptake and degrade organic compounds in the process. Availability of nutrients in the soil can alter enzyme activity and soil respiration. In this study, the addition of G increased MUFP activity above the unamended controls at all sites (significantly so at NC and F sites), additionally indicating potential labile C limitation across all sites. Added labile C enhanced the microbial community to increase phosphatase production, likely as a response to a growing microbial population to take advantage of the added food source. In all sites, the MUFP responses were similar for each treatment, as they did not significantly differ for sites within treatments. Although not statistically significant, the addition of P appeared to reduce the phosphatase activity compared to controls at all sites, as would be expected for an inducible enzyme. The addition of glucose at the NC sites, where SOM was lowest and P content highest, significantly increased the MUFC activity over that of the controls, while P addition significantly increased this activity at the M sites, where SOM was highest relative to other locations. There were no other between-site differences regarding MUFC activity for any other treatments.
The biogeochemistry of P has major implications in controlling soil C dynamics in wetlands. The external addition of nutrients can potentially impact the enzyme activity and microbial respiration, specifically when those nutrients are not readily available in the soil; however, our soils had abundant P content (considering more than 450 mg g−1 dw TP contents in FC sites), so phosphatase enzyme activity was negligible when additional P sources were applied. We also observed that heterotrophic microbial activity was more responsive to additional food sources; therefore, the outcomes of this experiment indicated that respiration and extracellular enzyme activity, at least downstream of inflows in the NESS, are not limited by P, but rather by the availability of labile C.
Author Contributions
Conceptualization: S.D., S.C., L.J.S.; Methodology: S.D., S.C.; Formal analysis: S.D., S.C.; Resources: L.J.S.; Data curation: S.D.; Writing original draft: S.D.; Writing review and editing: S.D., S.C., L.J.S.; Funding acquisition: L.J.S. All authors have read and agreed to the published version of the manuscript.
Funding
This research was funded by Florida Coastal Everglades—National Science Foundation, grant number DEB-1832229.
Institutional Review Board Statement
Not applicable.
Informed Consent Statement
Not applicable.
Data Availability Statement
All data is available in the manuscript.
Acknowledgments
This research was partially supported by a task agreement between FIU and Everglades National Park (P14AC01639 and P16AC0032). The authors would like to thank Alex Crow and Diana Johnson for their assistance during laboratory analyses. This material was developed in collaboration with the Florida Coastal Everglades Long-Term Ecological Research Program under National Science Foundation Grant no. DEB-1832229. This is contribution number 1023 from the Southeast Environmental Research Center in the Institute of Environment at Florida International University.
Conflicts of Interest
The authors declare no conflict of interest.
References
- Lal, R. Carbon sequestration. Philos. Trans. R. Soc. B Biol. Sci. 2008, 363, 815–830. [Google Scholar] [CrossRef]
- Nahlik, A.M.; Fennessy, M.S. Carbon storage in US wetlands. Nat. Commun. 2016, 7, 13835. [Google Scholar] [CrossRef] [Green Version]
- Nielsen, M.N.; Winding, A.; Binnerup, S. Microorganisms as Indicators of Soil Health. 2002. Available online: https://www.dmu.dk/1_Viden/2_Publikationer/3_Fagrapporter/rapporter/FR388.pdf (accessed on 30 June 2021).
- Cabugao, K.G.; Timm, C.M.; Carrell, A.A.; Childs, J.; Lu, T.Y.S.; Pelletier, D.A.; Weston, D.J.; Norby, R.J. Root and rhizosphere bacterial phosphatase activity varies with tree species and soil phosphorus availability in Puerto Rico tropical forest. Front. Plant. Sci. 2017, 8, 1834. [Google Scholar] [CrossRef] [Green Version]
- Margalef, O.; Sardans, J.; Fernández-Martínez, M.; Molowny-Horas, R.; Janssens, I.A.; Ciais, P.; Goll, D.; Richter, A.; Obersteiner, M.; Asensio, D.; et al. Global patterns of phosphatase activity in natural soils. Sci. Rep. 2017, 7, 1337. [Google Scholar] [CrossRef] [Green Version]
- Sinsabaugh, R.L.; Lauber, C.L.; Weintraub, M.N.; Ahmed, B.; Allison, S.D.; Crenshaw, C.; Contosta, A.R.; Cusack, D.; Frey, S.; Gallo, M.E.; et al. Stoichiometry of soil enzyme activity at global scale. Ecol. Lett. 2008, 11, 1252–1264. [Google Scholar] [CrossRef] [PubMed]
- Pisani, O.; Scinto, L.J.; Munyon, J.W.; Jaffé, R. The respiration of flocculent detrital organic matter (floc) is driven by phosphorus limitation and substrate quality in a subtropical wetland. Geoderma 2015, 241, 272–278. [Google Scholar] [CrossRef]
- Childers, D.L.; Doren, R.F.; Jones, R.; Noe, G.B.; Rugge, M.; Scinto, L.J. Decadal change in vegetation and soil phosphorus pattern across the Everglades landscape. J. Environ. Qual. 2003, 32, 344–362. [Google Scholar] [CrossRef] [PubMed]
- Gaiser, E. Periphyton as an indicator of restoration in the Florida Everglades. Ecol. Indic. 2009, 9, S37–S45. [Google Scholar] [CrossRef]
- Malone, S.L.; Starr, G.; Staudhammer, C.L.; Ryan, M.G. Effects of simulated drought on the carbon balance of Everglades short-hydroperiod marsh. Glob. Chang. Biol. 2013, 19, 2511–2523. [Google Scholar] [CrossRef]
- Brown, P.; Wright, A.L. The Role of Periphyton in the Everglades. (2013, February). Available online: http://edis.ifas.ufl.edu/pdffiles/SS/SS52200.pdf (accessed on 30 June 2021).
- Noe, G.B.; Childers, D.L.; Jones, R.D. Phosphorus biogeochemistry and the impact of phosphorus enrichment: Why is the Everglades so unique? Ecosystems 2001, 4, 603–624. [Google Scholar] [CrossRef]
- Dattamudi, S.; Wang, J.J.; Dodla, S.K.; Viator, H.P.; DeLaune, R.; Hiscox, A.; Darapuneni, M.; Jeong, C.; Colyer, P. Greenhouse gas emissions as influenced by nitrogen fertilization and harvest residue management in sugarcane production. Agrosyst. Geosci. Environ. 2019, 2, 1–10. [Google Scholar] [CrossRef] [Green Version]
- Nelson, D.W.; Sommers, L.E. Total carbon, organic carbon, and organic matter. In Methods of Soil Analysis: Part 3 Chemical Methods; Sparks, D.L., Ed.; SSSA Book Series 5; SSSA: Madison, WI, USA, 1996; pp. 961–1010. [Google Scholar]
- Solorzano, L.; Sharp, J.H. Determination of total dissolved phosphorus and particulate phosphorus in natural waters. Limnol. Oceanogr. 1980, 25, 754–758. [Google Scholar] [CrossRef]
- O’Dell, J.W. Method 365.1—Determination of Phosphorus by Semi-Automated Colorimetry; USEPA, Environmental Monitoring Systems Laboratory, Office of Research and Development: Cincinnati, OH, USA, 1993. [Google Scholar]
- Rivero, R.G.; Grunwald, S.; Osborne, T.Z.; Reddy, K.R.; Newman, S. Characterization of the spatial distribution of soil properties in Water Conservation Area 2A, Everglades, Florida. Soil Sci. 2007, 172, 149–166. [Google Scholar] [CrossRef] [Green Version]
- Steinmuller, H.E.; Stoffella, S.L.; Vidales, R.; Ross, M.S.; Dattamudi, S.; Scinto, L.J. Characterizing hydrologic effects on soil physicochemical variation within tree islands and marshes in the coastal florida everglades. Soil Sci. Soc. Am. J. 2021. [Google Scholar] [CrossRef]
- Irick, D.L.; Li, Y.C.; Inglett, P.W.; Harris, W.G.; Gu, B.; Ross, M.S.; Wright, A.L.; Migliaccio, K.W. Characteristics of soil phosphorus in tree island hardwood hammocks of the southern Florida Everglades. Soil Sci. Soc. Am. J. 2013, 77, 1048–1056. [Google Scholar] [CrossRef]
- Schade-Poole, K.; Möller, G. Impact and mitigation of nutrient pollution and overland water flow change on the Florida Everglades, USA. Sustainability 2016, 8, 940. [Google Scholar] [CrossRef] [Green Version]
- DeBusk, W.F.; Reddy, K.R. Nutrient and hydrology effects on soil respiration in a northern Everglades marsh. J. Environ. Qual. 2003, 32, 702–710. [Google Scholar] [CrossRef]
- DeBusk, W.F.; Reddy, K.R. Litter decomposition and nutrient dynamics in a phosphorus enriched everglades marsh. Biogeochemistry 2005, 75, 217–240. [Google Scholar] [CrossRef]
- Pisani, O.; Gao, M.; Maie, N.; Miyoshi, T.; Childers, D.L.; Jaffé, R. Compositional aspects of herbaceous litter decomposition in the freshwater marshes of the Florida Everglades. Plant. Soil 2018, 423, 87–98. [Google Scholar] [CrossRef]
- Amador, J.A.; Jones, R.D. Response of carbon mineralization to combined changes in soil moisture and carbon-phosphorus ratio in a low phosphorus histosol. Soil Sci. 1997, 162, 275–282. [Google Scholar] [CrossRef]
- Wetzel, P.R.; Van Der Valk, A.G.; Newman, S.; Coronado, C.A.; Troxler-Gann, T.G.; Childers, D.L.; Orem, W.H.; Sklar, F.H. Heterogeneity of phosphorus distribution in a patterned landscape, the Florida Everglades. Plant. Ecol. 2009, 200, 83–90. [Google Scholar] [CrossRef] [Green Version]
- Medvedeff, C.A.; Inglett, K.S.; Inglett, P.W. Patterns and controls of anaerobic soil respiration and methanogenesis following extreme restoration of calcareous subtropical wetlands. Geoderma 2015, 245, 74–82. [Google Scholar] [CrossRef]
- Lane, R.R.; Mack, S.K.; Day, J.W.; DeLaune, R.D.; Madison, M.J.; Precht, P.R. Fate of soil organic carbon during wetland loss. Wetlands 2016, 36, 1167–1181. [Google Scholar] [CrossRef]
Figure 1.
Locations of sampling sites in Northeast Shark Slough (NESS), Florida, USA (A), in proximity to a bridge constructed to partially restore southward water flow into Everglades National Park (ENP). Red tags are near-canal sites (0–150 m downstream of canal), yellow tags are midway (150–600 m), and green tags are far from the canal (600–1200 m) (B,C). Remnant vegetation “halos” (increased biomass and nutrients) are identified and show the locations of pre-bridge culverts (C). Google Earth images were used for context. Photographic images of the bridge (near-canal) (D) and sampling site (E).

Figure 2.
Carbon dioxide (CO2) efflux and enzyme activity (phosphatase or MUFP and glucosidase or MUFC) analyses of incubated soil slurries collected at certain distances (near-canal, midway, and far from canal) downstream from the inflow in the Northeast Shark River Slough, ENP. Treatments included a control (C), glucose (G), phosphorus (P), and a combination of phosphorus and glucose (P + G). Lowercase letters indicate significant differences (p < 0.05) between treatments (within a distance), while uppercase letters indicate the treatment difference sacross distances (NC, M, and FC). Uppercase letters not used in this figure were for treatments with no significant difference between distances.


Table 1.
Physiochemical parameters (mean ± SD), including water depth, soil bulk density (BD), organic matter (SOM), total P (TP), total N (TN), and total C (TC), at increasing distances from a source canal in the NESS. Different lowercase letters indicate significant differences (p < 0.05) between sites.
| Sites | n | Water Depth | BD | SOM | TP | TN | TC |
|---|---|---|---|---|---|---|---|
| cm | g dw cm−3 | % | ug g−1 dw | mg g−1 dw | |||
| Near canal | 28 | 19 ± 8 a | 0.140 ± 0.035 a | 54 ± 19 b | 1143 ± 273 a | 2.2 ± 0.9 b | 32 ± 6 c |
| Midway | 24 | 12 ± 4 a | 0.129 ± 0.029 a | 84 ± 17 a | 712 ± 151 b | 3.4 ± 0.3 a | 46 ± 8 a |
| Far from canal | 24 | 8 ± 4 a | 0.149 ± 0.052 a | 67 ± 11 b | 467 ± 87 c | 2.8 ± 0.4 a | 40 ± 9 b |
Table 2.
Pearson’s (two-tailed) correlation analysis between different physicochemical soil properties (bulk density, BD; total P, TP; total N, TN; total C, TC; soil organic matter, SOM) for all NESS sites combined.
Table 2.
Pearson’s (two-tailed) correlation analysis between different physicochemical soil properties (bulk density, BD; total P, TP; total N, TN; total C, TC; soil organic matter, SOM) for all NESS sites combined.
| Parameters | TP | Soil Moisture | TN | TC | SOM |
|---|---|---|---|---|---|
| BD | −0.33 | −0.60 * | −0.35 | −0.50 | −0.51 |
| TP | 0.25 | −0.28 | −0.29 | −0.21 | |
| Soil moisture | 0.39 * | 0.44 * | 0.53 * | ||
| TN | 0.95 * | 0.95 * | |||
| TC | 0.99 * |
Note: * significant at α ≤ 0.05.
Publisher’s Note: MDPI stays neutral with regard to jurisdictional claims in published maps and institutional affiliations. |
© 2021 by the authors. Licensee MDPI, Basel, Switzerland. This article is an open access article distributed under the terms and conditions of the Creative Commons Attribution (CC BY) license (https://creativecommons.org/licenses/by/4.0/).
Share and Cite
MDPI and ACS Style
Dattamudi, S.; Chanda, S.; Scinto, L.J. Microbial Respiration and Enzyme Activity Downstream from a Phosphorus Source in the Everglades, Florida, USA. Land 2021, 10, 696. https://doi.org/10.3390/land10070696
AMA Style
Dattamudi S, Chanda S, Scinto LJ. Microbial Respiration and Enzyme Activity Downstream from a Phosphorus Source in the Everglades, Florida, USA. Land. 2021; 10(7):696. https://doi.org/10.3390/land10070696
Chicago/Turabian StyleDattamudi, Sanku, Saoli Chanda, and Leonard J. Scinto. 2021. "Microbial Respiration and Enzyme Activity Downstream from a Phosphorus Source in the Everglades, Florida, USA" Land 10, no. 7: 696. https://doi.org/10.3390/land10070696
Note that from the first issue of 2016, this journal uses article numbers instead of page numbers. See further details here.