
An Easy Mixed-Method Analysis Tool to Support Rural Development Strategy Decision-Making for Beekeeping


Department of Agricultural, Forest and Food Sciences (DISAFA), University of Torino, 10095 Grugliasco, Italy
*
Author to whom correspondence should be addressed.
†
First and second authors have contributed equally.
Land 2021, 10(7), 675; https://doi.org/10.3390/land10070675
Submission received: 3 June 2021
/
Revised: 22 June 2021
/
Accepted: 23 June 2021
/
Published: 26 June 2021
(This article belongs to the Special Issue Ecosystem Services, Sustainable Rural Development and Protected Areas)
Abstract
:The EU has long-recognised the functions and contributions of beekeeping in sustainable rural area development. In 2018, the EU adopted the Pollinator Initiative to strengthen its pollinator conservation policies. To support the design of effective rural development actions, this work describes and tests an easy-to-apply, mixed-method tool for use with SWOT analysis. A two-step methodology was trialled with beekeepers in Piedmont Region (NW Italy). In step one, two independent groups of beekeepers operating in separate protected and intensive agricultural areas completed a SWOT matrix. In step two, three expert panels (beekeeper association leaders, honey market organisation leaders, and entomologists) prioritised the effects of the SWOT items with a quantitative weighting and rating process. Results suggest that the sector needs better-targeted incentives and that ‘soft’ policies on extension, advisory, and institutional measures could play a relevant role. The method was also confirmed as suitable for use with non-expert evaluators, such as policy officers and practitioners.
1. Introduction
Beekeeping is an important agricultural activity globally that contributes to sustainable rural area development in two ways—economic (income) support and ecological support from honey bees [1,2,3,4,5].
From an income perspective, beekeeping as either a main or secondary income source is especially an opportunity for marginal rural areas [6]. In such places, beehive products, livestock, and pollination services have the potential to generate and diversify income quickly on farms with little land and/or limited capital [7,8]. The beehive product market is sizeable. In 2019, there were 18.2 million hives in the European Union (EU) and 1.6 million hives in Italy, managed by about 612,000 (EU) and 56,000 (Italy) beekeepers [9]. Although approximately 95% of European beekeepers are non-professionals (only 3% own more than 150 beehives), Europe produced the second largest amount of honey in the world after China in 2018 (283,000 tons). Italy produced about 23,000 tons of different honey types [10,11,12]. The sector generates not only an annual value of EUR 1 billion in Europe, but pollinators also contribute at least EUR 22 billion to European agriculture by ensuring crop yields [13].
Beekeeping activities also contribute to rural-area environmental and social goals by providing multiple ecosystem services [5,6]. Pollinators provide provisioning, regulating, and cultural ecosystem services [14,15]. The best-known service is pollination, which ensures crop yields and conserves wild plant biodiversity [16,17,18,19,20,21,22]. Honey bees, as the most significant pollinators, suppliers of food, and providers of a wide range of benefits to society, also bear cultural and social values [5,14,15,23]. Moreover, they are used in research studies on environmental issues, including those on heavy metal and chemical environmental contamination [24,25].
The flow of market and public goods and services provided by honey bees and beekeeping activity is threatened by several anthropic and biotic stresses, such as diseases, pesticides, land-use changes, and agricultural intensity [14,15,26,27,28,29,30]. Recent studies have highlighted significant losses to honey bee colonies due to the direct and indirect effects of climate change [31,32,33], as well as the consequent alteration of the plant-insect interactions on pollination synchrony and mutualism [34,35].
In 2018, the European Commission adopted a Communication on the first-ever EU initiative on pollinators [36]. The EU Pollinators Initiative set strategic objectives and actions to be taken at different levels in Europe to address pollinator decline while promoting their conservation. The initiative called for EU policy strategies to increase pollinator conservation in the coming years through an integrated approach using effective existing tools and policies.
For market products, climate change effects in recent years have led to unpredictable fluctuations in honey yields and alarming decreases in honey production, particularly recorded in the principal-producing countries of Southern and Eastern Europe. Negative effects have concerned high-value honey varieties, such as acacia honey [37,38]. Similarly, climate change stresses in Italy, such as drought, late frosts, and high temperatures, have recently caused considerable damage to the beekeeping sector. In various areas, a real zeroing of the honey production occurred, such as the case of acacia honey. It has been estimated that the loss of revenues for this honey variety amounted in 2019 to more than € 55 million in Italy with a massive impact on beekeeping profitability [37].
Few studies exist on the impact of beekeeper perceptions of direct and indirect climate change on beekeeping activities [39,40]. In light of this, local beekeepers in the Piedmont Region (NW Italy) completed a qualitative survey under the auspices of the Interreg V-A Alcotra project between Italy and France “CClimaTT—Climate Changes within Cross-Border Territories” (2017–2020). The general aim of this work was to analyse the perceptions of climate change effects held by local beekeepers and the adaptation strategies they adopted to handle those changes [40]. Part of the analysis identified the main favourable and unfavourable factors affecting beekeeping to perform a SWOT (Strengths, Weaknesses, Opportunities, Threats) matrix based on current challenges to the sector. The research was intended to provide a tool for identifying strategies aimed at maintaining or strengthening beekeeping farm viability and sector capacity to tackle its main threats, and climate change, in particular.
SWOT analysis is the standard approach to considering problems and issues, but is limited by its subjective and qualitative nature [41]. By producing a list of equally important and unrelated items, the method fails to prioritise among items, to explain the extent to which a favourable factor can reduce the effect of an unfavourable one (and vice versa), or to evaluate the overall effect of the SWOT items [42]. To supplement the qualitative result of SWOT analysis, a quantitative technique was integrated into the analysis to prioritise items in the matrix and to generate strategies based on the relationships among items.
Many studies have indicated that SWOT analysis could be enhanced with a determination of the relative importance of items and ranking relevant strategies. Typically, these studies develop hybrid approaches that combine classic SWOT analysis with quantitative models [43]. Some authors have utilised the so-called A’WOT technique, which integrates SWOT analysis with an analytic hierarchy process (AHP) [44,45,46,47,48]. As a means by which to consider the mutual effects of SWOT factors and their potential relationships and dependencies, other authors have introduced the analytic network process (ANP) to quantify SWOT analyses (e.g., [49,50,51,52]). Several mixed methods have also been created that integrate SWOT and many other Multi Criteria Decision Making methods (MCDM), including those introducing fuzzy set theory to deal with the uncertainty caused by unquantifiable, incomplete, or unobtainable information (see [43,53]).
To date, these methods have contributed greatly to the scientific literature across many fields [48], including apiculture [54,55]. Operationally, they require advanced methodological and statistical skills and/or specific software. This paper offers an easy-to-apply mixed method that requires a relatively low cognitive effort to weight and rank SWOT items. Furthermore, simple calculations can be completed by non-expert evaluators to obtain quick preliminary prioritisations.
In the following sections, the methodology is presented and applied as a tool to formulate rural development strategies for beekeeping. Preceding the discussion is an excursus on current sector policies within the framework of the EU Common Agricultural Policy (CAP).
2. Beekeeping in the Common Agricultural Policy
EU policymakers recognise the multi-functional role of beekeeping, by appreciating that the sector contributes to the development of rural areas, whilst honey bee colonies are indispensable for agriculture and the environment, ensuring pollination services and conserving biodiversity [9]. Thus, measures aimed at supporting beekeeping fall under both pillars of the CAP. The first pillar concerns market measures and direct payments (i.e., annual payments to farmers to stabilise revenues) and the second pillar pertains to rural development policies aimed at balancing territorial development, environmentally-sustainable farming, competition, and innovation.
The post-2013 Common organization of the markets (CMO) in agricultural products was regulated by Regulation (EU) No. 1308/2013. For beekeeping, regulation preliminary considerations have focused on the rise of hive invasions (varroosis, in particular) and their effects on honey production. Specifically, the regulation requires Member States to draw up three-year national apiculture programmes in collaboration with sector organisations to enhance the production and marketing of apiculture products. Moreover, the regulatory framework permits grants to beekeepers and/or their associations for many measures: technical assistance, varroa mite control, transhumance rationalisation (i.e., hive re-siting to better nutritive sources and climatic conditions), apiculture product laboratory analysis, hive restocking support, applied apiculture research programme access, market monitoring, and product quality enhancement. As for programme funding, the EU and the Member State each bear half.
In Italy, the three-year national programmes are defined by the Ministry of Agricultural, Food and Forestry Policies (MiPAAF) under national legislation Ministerial Decree No. 2173/2016. This decree allows regional administrations to develop their own regional apiculture programmes that arise from the specificity of their territories and/or local beekeeping sector. The over-arching goal of the EU-based regulation is to help beekeepers at all levels to exploit the market potential of their products. Market measures aimed at this goal also contribute to rural area beekeeping economic sustainability by reducing production costs and improving sector competitiveness. Additionally, they support the entire system of economic activities related to beekeeping [9].
Beekeeping support can also be included in the Rural Development Programs (RDPs) financed across the Member States and the regions of the Union within the first pillar of the CAP. These strategies are implemented through a set of measures defined for the 2014–2020 programming period by Regulation (EU) No. 1305/2013 on rural development support. These policies reinforce CAP market measures and income supports with actions designed to strengthen EU agri-food and forestry sectors, environmental sustainability, and rural area well-being generally [56]. A range of rural development measures can benefit beekeepers: knowledge and information transfer actions, advisory services, farm management and relief services (in particular, those targeting farm economic resilience), agricultural product schemes, and/or physical asset investments (honey extraction laboratory, equipment for bee product packaging, processing, and marketing). To ensure the effective and efficient use of the EU funds for apiculture, the Commission established rules to avoid double funding between Member States’ and RDPs.
In 2018, the EU used the Omnibus Regulation (Regulation (EU) No. 2017/2393) to modernise and simplify the CAP regulations on direct payments, rural development, common market organisations, and horizontal regulation. The Omnibus Regulation, implemented by the Commission, amended EU budget-related financial rules and strengthened existing EU rules on a wide range of agricultural issues [57,58]. The Omnibus regulation indirectly affects the apiculture sector since it introduces improved environmental measures, and in particular, those related to ecological focus areas (EFAs). EFAs are farm areas of ecological interest that receive direct payments to safeguard and improve farm biodiversity, as established under “greening of the CAP” (Regulation (EU) No. 1307/2013). The Omnibus regulation recognised land lying fallow for melliferous plants (i.e., pollen and nectar rich species) as a distinct ecological focus area type, since this vegetation coverage may positively affect biodiversity. In addition to pollination services and biodiversity, conserving pollinator habitat can enhance the provision of other ecosystem services: soil protection and water quality through runoff and soil erosion mitigation, rural aesthetics, and pest control [20].
The EU has confirmed its support of apiculture for the 2021–2027 programming period, although the approach for the delivery of the new policies will be different. The main novelty is that Member States shall submit only one strategic plan, covering income support, sectorial strategies, and rural development. The Commission will provide a toolbox of broad policy measures for EU countries to shape around their own needs and capabilities to ease execution and reduce administration [59].
While waiting for the new policy tools, Member States have already submitted their national apicultural programmes to the EU for 2020–2022. With the Commission Implementing Decision (EU) No. 2019/974, the European Commission approved and devoted EUR 120 million Union contribution for the national plans. Therefore, total spending, including the Member State contributions, to implement the programmes in the current three-year period is EUR 240 million, an 11% increase over 2017–2019 funding [9].
3. Materials and Methods
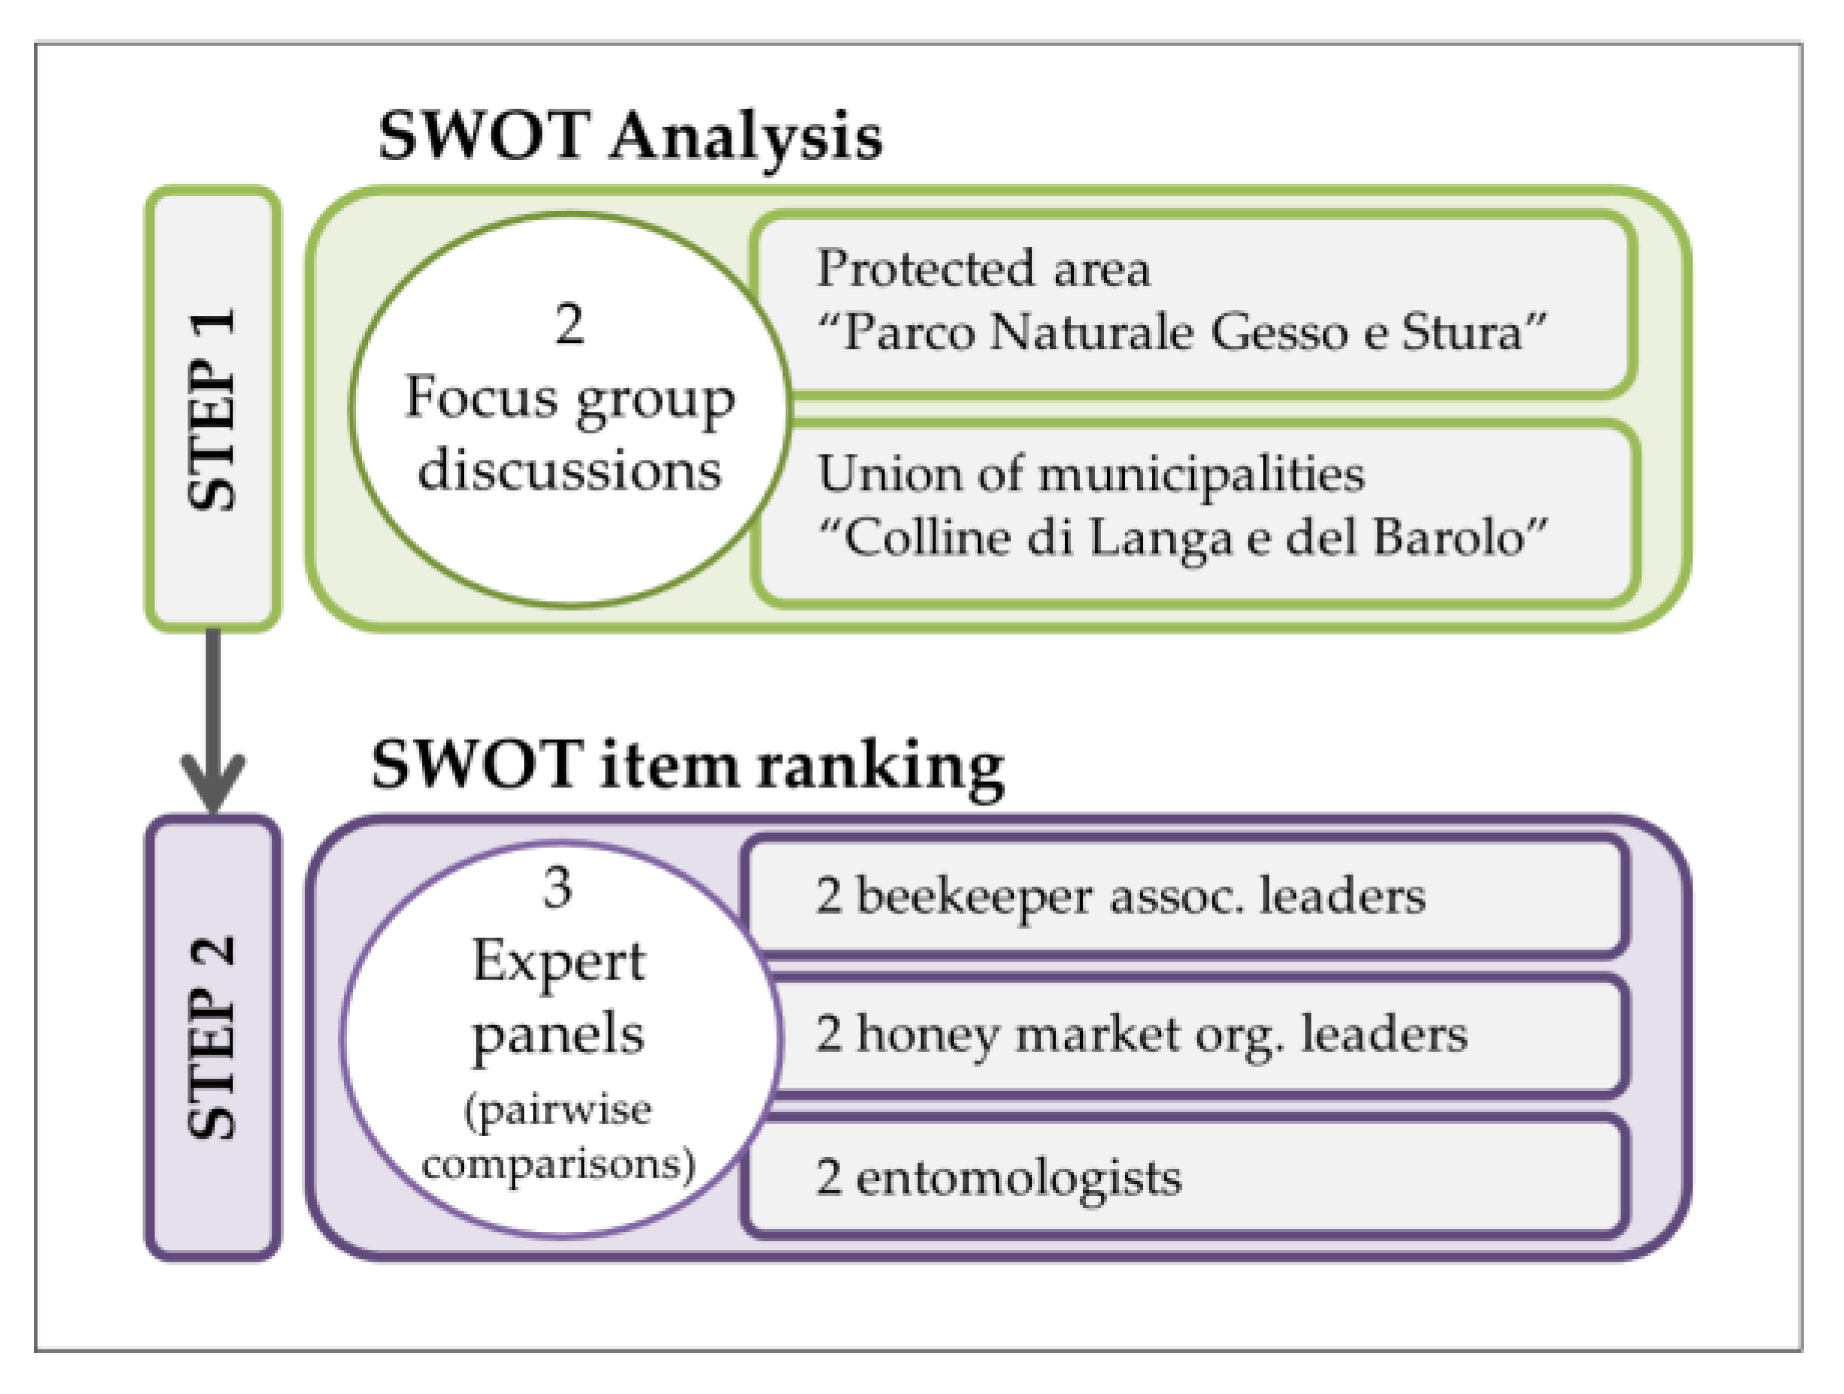
An easy-to-apply mixed method to integrate results from a SWOT analysis on the state of the beekeeping sector with the relative ranking of its items was created and trialled in the Piedmont Region located in northwestern Italy. The analysis was conducted in two steps as shown in Figure 1.
In step one, beekeepers completed a SWOT matrix designed to elicit their perceptions of the favourable and unfavourable factors affecting the sector, able to enhance or diminish bee farm resilience to many threats, and in particular, climate change. The source of this information came from that collected in focus group discussions (FGDs) organised within the CClimaTT Project [42]. The FGDs were conducted in November 2018 in two areas in Cuneo province (Piedmont Region, Italy). The areas are characterised by different governance, land uses, and economic opportunities.
One group of beekeepers operated in “Parco Naturale Gesso e Stura”, a protected river park balancing conservation of a river ecosystem and the human activities practiced there for centuries. The part-flat and part-hilly area is a mosaic of river environments, agricultural lands, and forests, where several professional beekeepers own large farms, manage permanent apiaries, and practice transhumance. The second group of participants was located in the administrative union of municipalities “Colline di Langa e del Barolo”. The mostly hilly area is an intensive wine-growing area, with a prevalence of vineyards inter-mixed with hazelnut orchards and wooded patches. The beekeeping is mainly conducted in permanent apiaries as a secondary activity by part-time beekeepers on small to medium-sized farms.
The literature suggests six to eight participants for focus groups and no more than 12 [60,61,62]. On the other hand, some authors endorse groups of just three to four when the group shares specialised knowledge or experience [62,63,64]. Based on the prevalence of beekeeping in the two areas, 11 River Park beekeepers and five intensive wine-growing area beekeepers were recruited from a network of local beekeepers previously involved in CClimaTT project activities. Each group included small and large farms (15 to 1200 managed beehives) and varying levels of beekeeping expertise (5 to 50 years of activity).
FDGs were used to explore perceptions held by beekeepers about the effects of climate change on honey bees and beekeeping. The first portion of the meetings discussed climate change effects noted by the beekeepers during the last 10 years and the management and practice adaptations made in response [40]. A second set of discussions were undertaken for the present paper. The focus of these conversations was to elicit the positive aspects and principal difficulties of beekeeping given the challenges to the sector. The major topics and issues were identified from a transcription of the discussion using a scissor-and-sort technique [65,66]. The topics were divided into internal factors (strengths and weaknesses) that sector operators have some control over and can try to change or manage and external factors (opportunities and threats) derived from the environment, market, or regulations outside beekeeper control [67].
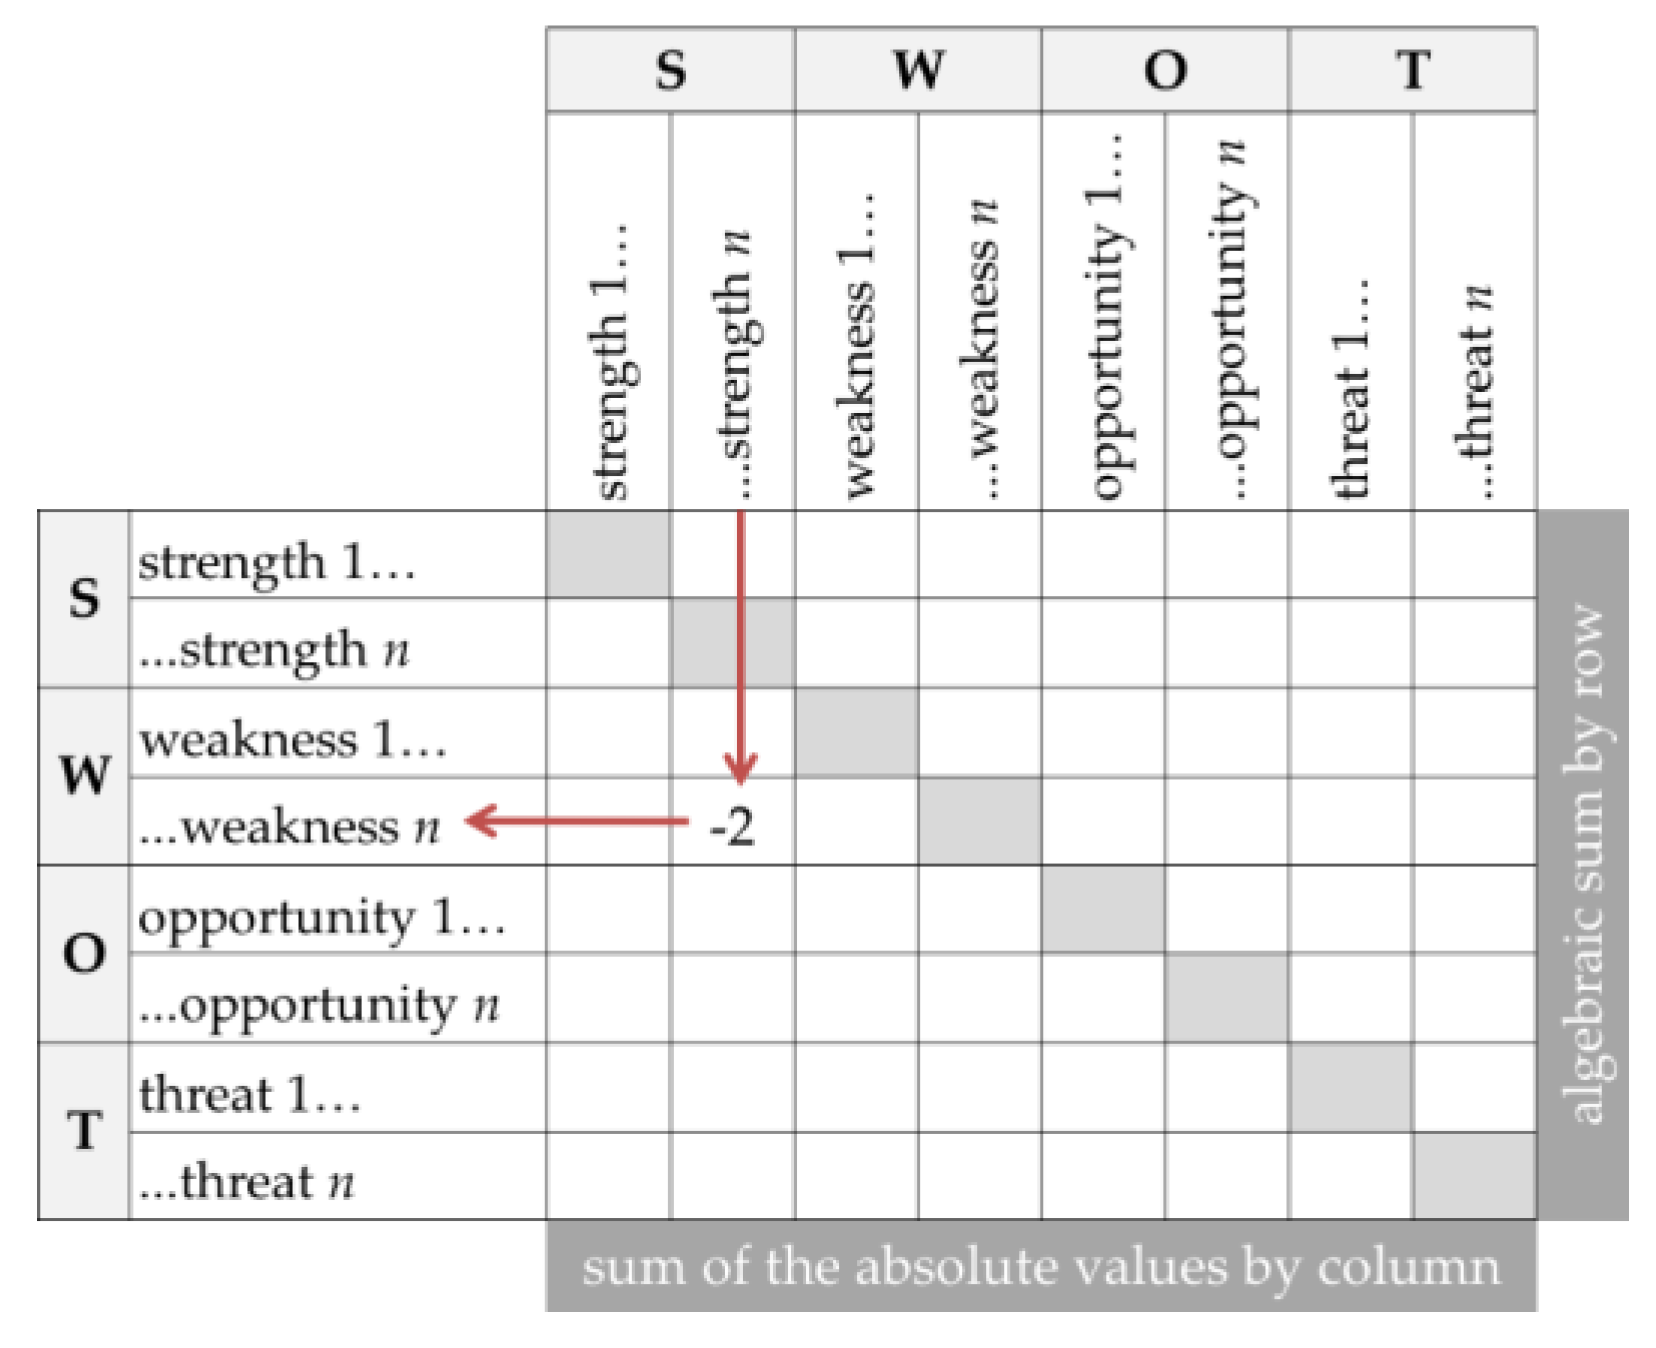
To exceed a simple qualitative examination of the internal and external items, the SWOT analysis was integrated with an easy-to-apply quantitative technique during step two. Specifically, the SWOT matrix was combined with a simple pairwise comparison of items using basic computations in an Excel® spreadsheet [68,69] using three panels of evaluators, each comprised of two beekeeping experts. The experts were asked to perform a pairwise comparison of the SWOT items and to weight and rate their mutual effects to identify relationships among strengths, weaknesses, opportunities, and threats.
All of the SWOT items were displayed on both the column and row headers in a double-entry table (Figure 2).
Panel participants were asked to compare each item in the column headers with all the other items in the row headers, irrespective of type (i.e., strength, weakness, opportunity, or threat), and to assign a score of between −2 and +2 to each couple. A positive value indicates that the effect of the item in the row is increased by the effect of the column item, while a negative value implies that the column item impedes or decreases the effect of the item in the row. Scoring criteria were as follows:
- −2 = the effects of the row item are strongly hampered by the column item,
- −1 = the effects of the row item are hampered by the column item,
- 0 = the two items are independent,
- +1 = the effects of the row item are increased by the column item,
- +2 = the effects of the row item are strongly increased by the column item.
Figure 2 presents an example in which the n-th strength strongly reduced the effect of the n-th weakness.
Rating the impact that each item of the SWOT matrix has on any other item, and then summing the scores along the rows and columns allowed identification of items that are more influenced by the overall effect of other items and which items more effectively influence others. In brief, the algebraic sum along the rows indicates the net capacity of the row items to exert their effects as a result of the influence of all the other items. This is true because some of them reinforce the effect of the row item and others weaken it, making the SWOT items in the rows dependent variables. Summing the absolute values of the scores in the columns weights the strength with which the column items are able to influence the other elements, strengthening or weakening them. In this case, the column items are analysed as independent (or explanatory) variables.
With this approach, two rankings are compiled with the SWOT elements. When ranking was based on row sums, beekeeping farm resilience depended on the positioning at the top of the rank of favourable conditions (strengths/opportunities) or unfavourable conditions (weaknesses/threats). On the other hand, ranking based on column sums highlighted elements that could be leveraged to boost strengths/opportunities and limit weaknesses/threats.
To complete the exercise, two representatives from each of three groups were invited to participate in the process: two from beekeeper associations (one operating in northern Italy and one in central Italy), two honey market experts (one from a producers’ cooperative and one from the Italian National Honey Observatory), and two entomologists. Association, cooperative, and observatory representatives were board leaders in their respective organisations. The expected result was to collect different views on the state of the beekeeping sector, based on the different backgrounds, experiences, and perspectives of the participants. To facilitate the weighting process and to clarify the reasoning behind the evaluations, each panel of experts was asked to discuss the scores assigned to each couple of items and to come to a consensus on the relevant rating.
4. Results
In the following sections, after proposing a synthesis of the results of the first part of the FGDs (see details in [40]), the SWOT matrix discussed by the beekeepers and the SWOT item ranking were displayed.
4.1. Beekeeper Perceptions of Climate Change and Adaptation Strategies Adopted
In order to introduce the general context of the analysis, it seems worthy to recap the main results from the beekeeper FDGs on the perceived effects of climate change and the management adaptations adopted [40].
Groups operating in both areas claimed that climate change has reduced the availability of the nectar, pollen, and honeydew essential for honey bees, and indicated that the weakened or reduced colonies produced less or no honey. They ascribed the increase in varroa mite infestations and the spreading of new diseases to mild winters. The main strategies adopted by each group to ensure the colony survival and to cope with higher temperatures, drought, and spring frosts were also similar. Beekeepers have begun to practice intense transhumance and increased the provision of season-specific supplemental feeding (sugar syrup or candy), even during nectar flow. These strategies all add farm labour and management cost. Moreover, beekeepers have increased varroa mite control treatments, practiced winter season biotechniques, and undertaken professional practices that add expense and decrease revenues (e.g., honey production falls as actions are taken to ensure colony survival).
4.2. SWOT Analysis
During the FGD section to analyse the favourable and unfavourable factors affecting beekeeping, beekeepers discussed actions that strengthened/weakened sector resilience to a variety of threats and climate change, in particular. The transcribed discussion was analysed for presence and frequency of topic/issue, topic order (i.e., top of mind topics are generally expressed early), and elapsed time on a given topic [66]. This approach allowed the beekeepers to select issues in accordance with their perceived relevance and to set the discussion order for Step 2 of the method.
Table 1 shows the final SWOT matrix based on the selected criteria. The matrix also reports which group emphasised each specific item (1 = protected area; 2 = intensive vine-growing area).
For both groups, unfavourable factors related mostly to different types of external stresses (climatic, anthropic, and biotic) and institutional or market issues (lack of adequate institutional and financial support, competition with cheap, poor quality products). Beekeepers also emphasised long-standing organisational and structural internal issues, such as the lack of (family or skilled) labour and financial resources. Furthermore, they complained that the effects of these weaknesses are worsening due to new challenges related to climate change. For instance, new practices to control the varroa mite are labour intensive, especially in the protected area. Other farm practices, such as supplemental feeding and intensive transhumance, entail higher variable operating costs.
Based on the FGDs, the strength to cope with these weaknesses and threats rests with the beekeepers themselves. They stated that they are motivated to address these challenges based on their commitment to beekeeping. Along with their passion and satisfaction for the work, beekeepers operating in the protected area also recognised the fundamental collaborative spirit between and within generations of beekeepers. Both groups shared the opinion that these internal factors are boosted by the growing public interest in honey bees as environmental sentinels and by the growing consumer demand for typical honey productions (e.g., mountain blossom honey). Honey product price increases experienced during the 2018 that resulted from a lower supply due to colony declines was welcomed by beekeepers. At the same time, the opportunity was understood to relate to price volatility in the global market.
4.3. Ranking of the SWOT Items
As described, three panels of experts discussed the items highlighted by the beekeepers. The experts then completed the matrices reported in Appendix A through pairwise comparison of the column and rows items using the prescribed scoring criteria.
The sign and value of the score assigned to each item couple arises from the differing perceptions and opinions of the panels. For example, honey market organisation leaders assigned a −2 to the couple “strong motivation of beekeepers (S) + lack of financial resources to bear higher management costs (W)” (Table A2) to indicate their belief that the motivation of beekeepers strongly reduces the negative effect from the high cost of rescue operations. That is, honey market experts believe the determination of beekeepers incentivises them to find effective strategies for adapting to the challenge with a cost-efficient practice. On the contrary, association leaders believe that beekeeper motivation strongly increases (+2), or in the case of entomologists somewhat increases (+1) management costs (Table A1 and Table A3). They observed that sometimes beekeepers, driven by their enthusiasm, do everything possible to save their colonies before considering more efficient strategies.
The algebraic sums of the scores along the rows quantify the net effect of SWOT items as if they were dependent variables with their outcomes able to be increased or decreased as a consequence column item influence. For instance, the honey market experts and the entomologists rate the threat of insufficient and mis-targeted public support as mitigated by the overall effect of the other items (Table A2 and Table A3), while beekeeper association leaders hold the opposite as true (Table A1). The sum of the absolute values in each column indicates the capacity of the items to exert their effect on the other items, considering them as independent variables. From this quantification, the panels identified different items as most influential: association leaders identified higher management costs, honey market experts found strong motivation of beekeepers, and entomologists named recently increased retail prices of bee products (Table A1, Table A2 and Table A3).
To reduce the value variability and facilitate comparison of the rankings, the sums of the scores by row and by column were normalised to a common scale (0–1) using a simple min-max normalisation technique [70]1. Table 2 shows the ranking of the mutual effects of the SWOT items based on the normalised values of the algebraic sums per row, according to each expert panel. The coloured cells indicate the highest values (those ranked between 0.666 and 1.000) and highlight favourable items in green and unfavourable items in red. An indicator of farm resilience to handle particular challenges is based on the top position rank of favourable (strengths/opportunities) or unfavourable conditions (weaknesses/threats). From this perspective, producer representatives were most pessimistic about the state of the sector. In their opinion, many issues may jeopardize beekeeping success; in particular, they identified expensive and time-consuming rescue operations, reduced strength of the colonies, and honey price competition from foreign competitors. To both entomologists and market organisation leaders, the state of beekeeping seems less precarious, with the entomologists having ranked an even number of favourable and unfavourable items as top (important) factors. Honey market organisation leaders were also positive, and more so than the entomologists. Despite these differences, all panels placed the collaboration among beekeepers among the top factors affecting beekeeping farm resilience, namely their networking capacity to share their know-how and assets.
Table 3 shows the ranking of the mutual effects of items based on the normalised values of the sums per column. Again, the highest values are highlighted in green and red for favourable and unfavourable, respectively. The ranking weights the strength with which the SWOT items are able to influence the other elements, strengthening or weakening them. The resulting general framework shows that the most influential aspects are mostly negative. In particular, those that scored higher in more than one panel were high costs for rescue operations and the reduced strength of the colonies. Again, the evaluation given by the representatives of producers was more pessimistic, since they placed all unfavourable items as top factors able to affect other items adversely. Alternatively, entomologists ranked ‘recently increased retail prices’ and market experts ranked ‘strong motivation of beekeepers’, both favourable items, at the top of their rankings.
5. Discussion
SWOT analysis is instrumental for development strategy formulation [41]. Although originally used as a private sector organisational method, the EU now mandates that it be employed to draft or evaluate regional and national strategic plans [69,71]. SWOT analysis in rural development programming has been summarised by Knierim and Nowicki [72], who highlighted its potential use in participatory decision-making.
Apiculture programmes as well have turned to ex ante evaluation of SWOT analysis to determine sector strategic approaches [73]. In Italy the apiculture programmes were developed by MiPAAF and regional administrations in cooperation with representative organisations of the beekeeping sector. Conversely, in our study, a bottom-up approach was used to directly involve local beekeepers in SWOT matrix definition. Then, the analysis was complemented with an expert-based approach aimed at ranking the SWOT item effects.
The FGDs revealed two important facts that honey bees and the beekeeping sector are facing from now-evident climate change effects. One is that the effects have placed additional constraints on the capacity of the honey bees and beekeeping to cope with new and traditional stresses, such as agricultural intensity, pesticides, and diseases. Second is that any adaptations to these stresses require additional labour and/or variable operating cost outlays. Nevertheless, both the intensity of the impacts and the resilience of the sector depend on the local environmental and institutional conditions. Beekeepers operating in the two areas showed different capacities to face these adversities. Despite the institutional and economic constraints (e.g., extensive and less profitable farming), those operating in the protected area benefit from the favourable ecological and environmental conditions of the park. Close mountain proximity reduces transhumance costs and allows typical and higher-priced honey types to be produced. Moreover, landscape heterogeneity and a consequent richer and longer blossom period, improve colony strength and reduce supplemental feeding costs. Different economic and environmental conditions also influence the type of farming adopted by beekeepers. In the protected area, beekeeping is practiced mostly by medium and large specialised beekeeping farms, as opposed to the beekeeping practised as complementary to other farming (specialist vineyards or mixed vineyard and hazelnut farms types) in the intensive wine-growing area.
All expert panels ranked reduced strength of the honey bee colonies and higher management costs as the most important issues to tackle. They were ranked among the top items, both for their capacity to influence other items and for the strength of their negative effects as a result of other items. Nonetheless, the three expert groups held different views on the state of the sector. Specifically, the item prioritisation projected by the beekeeper association leaders was far more dismal than that resulting from prioritisation by the honey market organisation leaders and entomologists. One explanation for this result may rest with the fact that beekeeper association representatives work closely with producers, which may make them more aware of the day-to-day difficulties and sector challenges. In this way, the involvement of different expert types and the interplay of top-down and bottom-up strategies have the potential to enrich the analysis [74], and minimise the criticism that SWOT is a top-down approach that separates ‘those who think’ and ‘those who do’ [75].
In the face of higher variable operating costs, beekeepers have complained of insufficient and mis-targeted public support. Moreover, the experts also scored higher costs and inefficient support as items that compounded the adverse effects of one another. Beekeepers stressed that EU grants for the sector mainly support capital investment activities (e.g., machine and equipment purchase). Instead, they believe that additional operating cost support would be more appropriate to meet the out-of-pocket running costs of climate change-related adaptations, such as supplemental feeding and hive transhumance.
These results show that if the needs of rural communities are not correctly addressed, then the intended policy effects may not be fully achieved. In light of this, the post-2020 CAP approach guarantees EU countries more flexibility to align their needs and fund allocation design within EU standards and rules. While not yet defined, compensation tools already provided to farmers through the second pillar of CAP will be part of the strategic national plans post-2020 that will integrate income support, CMOs, and rural development. One anticipated legal challenge to these changes is operating cost reimbursement inclusion, as it may be considered to distort production and trade and lead to unfair competition. This is why, as of today, examples of such an approach in Italy are few and usually implemented as exceptional and temporary measures. In 2019, the Friuli Venezia Giulia Region (NE Italy) provided grants to professional beekeepers in the form of reimbursement for supplemental feeding product expenditures through Regional Law No. 6/2010. In Piedmont Region, similar measures were adopted in 2020 and introduced into the 2014–2020 RDP to support farmers particularly affected by the COVID-19 crisis. Commercial bee farms managing more than 52 beehives were included in this exceptional support scheme. During an extended period of limited movement of seasonal labour, transhumance, pollination services, direct selling, and so on, beekeepers suffered considerable colony losses as they struggled to maintain and feed their bees. The support consisted of a one-time payment to cover ordinary bee farm operating costs [73].
Although EU competition rules may be a constraint, beekeepers believe that the costs associated with adaptation strategies should be steadily subsidised both in farms where beekeeping is the main income source (specialised farms) and in areas where maintenance of biodiversity and conservation of wild flora and fauna is a valued service to the ecosystem.
Focus group participants identified the extraordinary value of strong beekeeper motivation and their willingness to collaborate (resource sharing, input purchasing, and technical information exchanging). A collaborative spirit was unanimously recognised by all expert panels as the item most enhanced by the effects of other items, followed by public and consumer interest in honey bee health and hive products. In the case of beekeeper association leaders, personal motivation was indicated as the main item to leverage with targeted policies.
To optimise these unique qualities while avoiding hasty and inefficient management choices, advisory and institutional measures (technical assistance and extension) are considered the best tools to inform beekeepers of cost-efficient practices to cope with climate change. Extension services are also great guarantors of the labour, organisational, and marketing skills necessary to block farm management mistakes and sector threats. Advisory measures could also be used to address consumer education issues. For example, a campaign, built on the interest and demand of consumers for typical honey productions might reduce the strong net negative capacity effect identified by all three expert panels as attributable to the market influx of low-priced, low-quality honey supplied by foreign competitors. Improved labelling to identify local and high-quality products would serve both consumers and the sector well [76,77].
Several comments are worth noting on use of the method to weight and rank SWOT item effects. While easy to implement, the method also allows the mutual dependencies of the items to be analysed, making it possible for any outcomes from an item to be considered both as causes and effects of other items. This technique has already been applied in Italy in the field of policy programming and evaluation, e.g., for context analysis in the ex ante evaluation of the Friuli Venezia Giulia and Sardinia Region RDPs 2014–2020, involving a partnership of institutional, economic, social and environmental representatives both for the definition of the SWOT matrix and the prioritisation task [78,79].
In the analysis in this application, the experts of each panel discussed and agreed on the scores to be assigned to the pairwise comparisons. Matrices were completed in about two hours. Expert feedback on the task was positive; they remarked that once the scoring mechanism was made clear, the task could be performed without researcher assistance. The number of pairwise comparisons was found to be reasonable and not burdensome, although the method is certainly limited by the number of SWOT items included in the analysis. Techniques based on pairwise comparison demand a high level of cognitive effort from its participants, affecting the outcome quality [80] and making these methods hard to implement when many alternatives are available [81,82]. In this instance, only items indicated by the FGDs as most relevant were included to preserve exercise practicability and validity. Nonetheless, less relevant items may play an important role by decreasing or increasing the effects of others.
6. Conclusions
Beekeeping is a unique activity, able to support rural economies and communities without negative environmental consequences [6]. Honey bees guarantee society a mix of ecological functions and benefits by provisioning and supporting ecosystem services (agricultural production, food security, and biodiversity) [14,23]. Estimates of the economic value of pollinator ecosystem services over the past decade have risen and are still believed to be under-estimated [83]. As scientists have refined their contribution calculations, honey bee colonies have declined due to agricultural intensification and diseases, recently made worse by increasingly-evident climate change effects [40].
The situation demands conservation and land-use planning agenda to be strengthened to protect the provision of such services from anthropogenic actions [83]. Rural development measures within the post-2020 CAP can play a strategic role, as the maintenance of a viable beekeeping sector in rural areas is fundamental for the support of local economies and the flow of ecological services provided by honey bees. In an increasingly budget-constrained context [84], beekeeping policy should exploit key levers able to efficiently affect the entire system.
In this study, a simple mixed-method tool was trialled in which a pairwise comparison was added to a SWOT analysis-produced list of items. The SWOT analysis integrated with additional information, provides a framework by which policymakers can mould their needs and strategies to maintain or strengthen beekeeping farm viability and the capacity of the sector to contribute to sustainable rural development.
Study results challenged the belief that adverse climatic effects seem less severe and more manageable in protected areas versus intensive agricultural areas. In fact, from the two distinct beekeeper locations considered, a general need for better-targeted incentives, technical assistance, and extension was revealed. Such measures should not only cover the specific costs of climate change-related adaptation strategies, but also be more cost-effective to free beekeepers from self-reliance alone. Although the legal issues involved in the enforcement of competition law represent a constraint for implementation of the desired measures, the approach adopted in this study may contribute to define a ‘strategic agenda’ for the sector. That is to say, a list of needs and coherent actions adapted to the local context, wherein different types of measures could be classified into categories of support (e.g., permitted, permitted under conditions, and forbidden, based on the World Trade Organisation model). The technique used for prioritising the SWOT items allowed consideration of the mutual effects of the items, as they were dependent or explanatory variables. Limited by the number of pairwise comparisons, application of the method confirmed the relatively-low cognitive effort required to weight and rank SWOT items, as well as its suitability for quick and preliminary analysis by non-skilled evaluators, such as policy officers and practitioners.
Author Contributions
Conceptualisation, S.N. and M.V.; methodology, S.N.; formal analysis, S.N. and M.V.; investigation, S.N. and M.V.; data curation, S.N. and M.V.; writing—original draft preparation, S.N.; writing—review and editing, S.N., M.V. and C.F.; project administration, C.F.; funding acquisition, C.F. All authors have read and agreed to the published version of the manuscript.
Funding
This research was carried out with the financial support of “Parco Naturale Gesso e Stura” and “Unione di Comuni Colline di Langa e del Barolo” (Cuneo, Italy) within the framework of Interreg V-A France-Italy (Alcotra) “CClimaTT—Climate Change within Cross-Border Territories”.
Institutional Review Board Statement
All experimental protocols were approved by the ad hoc committee of DISAFA (University of Torino).
Informed Consent Statement
Informed consent was obtained from all subjects involved in the study.
Acknowledgments
The authors are grateful to the study area beekeepers, CClimaTT project staff, “Parco Naturale Gesso e Stura” (Cuneo, Italy), “Unione di Comuni Colline di Langa e del Barolo” (Cuneo, Italy), Seacoop Cooperative (Turin, Italy), and the association “La fabbrica dei suoni” (Cuneo, Italy). Special thanks are given to all involved stakeholders: Vincenzo Panettieri (Mediterranean Beekeepers Federation, Perugia, Italy), Roberto Reggiani (Associazione Apicoltori Reggio Parma, Reggio Emilia, Italy), Alberto Contessi (Osservatorio Nazionale Miele, Bologna, Italy), Ernesto Marengo (Società Agricola Cooperativa Piemonte Miele, Cuneo, Italy), Gaetana Mazzeo (Department of Agriculture, Food and Environment, Di3A, University of Catania, Italy), Ignazio Floris (Department of Agriculture, University of Sassari, Italy). Last, but not least, the authors thank Roberto Cagliero and Paola Ferrazzi for their precious and significant support of this work.
Conflicts of Interest
The authors declare no conflict of interest. Project funders had no role in the study design, collection, analyses, or interpretation of data, writing of the manuscript, or decision to publish the results.
Appendix A

Table A1.
Pairwise comparison of the SWOT items by beekeeper association leaders.
| S | W | O | T | ||||||||
|---|---|---|---|---|---|---|---|---|---|---|---|
| Strong Beekeeper Motivation | Collaboration among Beekeepers | Lack of Time and Labour | Higher Management Costs | Recently Increased Retail Prices of Bee Products | Public and Consumer Interest | Reduced Strength of the Honey Bee Colonies | Insufficient And Mis-Targeted Public Support | Lower Honey Prices from Foreign Competitors | Algebraic Sum by Row | ||
| S | Strong beekeeper motivation | 2 | −2 | −2 | 2 | 2 | −2 | −2 | −2 | −4 | |
| Collaboration among beekeepers | 2 | 2 | 2 | 2 | 2 | 1 | −2 | −2 | 7 | ||
| W | Lack of time and labour | 0 | −1 | 2 | −2 | −1 | 2 | 2 | 2 | 4 | |
| Higher management costs | 1 | −1 | 2 | 0 | 0 | 2 | 2 | 2 | 8 | ||
| O | Recently increased retail prices of bee products | 0 | 0 | 0 | −2 | 0 | −2 | 0 | −2 | −6 | |
| Public and consumer interest | 1 | 0 | 0 | 0 | 0 | 2 | 0 | 0 | 3 | ||
| T | Reduced strength of honey bee colonies | 0 | 0 | 2 | 2 | 0 | 0 | 1 | 1 | 6 | |
| Insufficient and mis-targeted public support | 0 | −1 | 1 | 2 | −1 | −1 | 0 | 2 | 2 | ||
| Lower honey prices from foreign competitors | −2 | −1 | 2 | 2 | 2 | −2 | 2 | 2 | 5 | ||
| Sum of the absolute values by column | 6 | 6 | 11 | 14 | 9 | 8 | 13 | 11 | 13 | ||
Table A2.
Pairwise comparison of the SWOT items by honey market organization leaders.
| S | W | O | T | ||||||||
|---|---|---|---|---|---|---|---|---|---|---|---|
| Strong Beekeeper Motivation | Collaboration among Beekeepers | Lack Of Time and Labour | Higher Management Costs | Recently Increased Retail Prices of Bee Products | Public and Consumer Interest | Reduced Strength of the Honey Bee Colonies | Insufficient and Mis-Targeted Public Support | Lower Honey Prices from Foreign Competitors | Algebraic Sum by Row | ||
| S | Strong beekeeper motivation | 1 | −1 | −1 | 2 | 2 | −1 | −1 | 0 | 1 | |
| Collaboration among beekeepers | 2 | 2 | 0 | 0 | 0 | 0 | 1 | 0 | 5 | ||
| W | Lack of time and labour | −2 | −1 | 0 | 0 | 0 | 1 | 0 | 0 | −2 | |
| Higher management costs | −2 | −1 | 0 | −1 | 0 | 2 | 2 | 2 | 2 | ||
| O | Recently increased retail prices of bee products | 0 | 0 | 0 | 0 | 0 | 0 | 0 | 0 | 0 | |
| Public and consumer interest | 1 | 0 | 0 | 0 | 0 | 2 | 0 | 1 | 4 | ||
| T | Reduced strength of honey bee colonies | −2 | 0 | 0 | 2 | 0 | 0 | 2 | 0 | 2 | |
| Insufficient and mis-targeted public support | 0 | −2 | 0 | 2 | −1 | −1 | 0 | 0 | −2 | ||
| Lower honey prices from foreign competitors | 0 | 0 | 0 | 2 | 2 | −1 | 0 | 1 | 4 | ||
| Sum of the absolute values by column | 9 | 5 | 3 | 7 | 6 | 4 | 6 | 7 | 3 | ||
Table A3.
Pairwise comparison of the SWOT items by entomologists.
| S | W | O | T | ||||||||
|---|---|---|---|---|---|---|---|---|---|---|---|
| Strong Beekeeper Motivation | Collaboration among Beekeepers | Lack of Time and Labour | Higher Management Costs | Recently Increased Retail Prices of Bee Products | Public and Consumer Interest | Reduced Strength of the Honey Bee Colonies | Insufficient and Mis-Targeted Public Support | Lower Honey Prices from Foreign Competitors | Algebraic Sum by Row | ||
| S | Strong beekeeper motivation | 1 | 1 | −1 | 2 | 2 | 0 | 0 | 0 | 5 | |
| Collaboration among beekeepers | 1 | 1 | 1 | −2 | 0 | 1 | 1 | 0 | 3 | ||
| W | Lack of time and labour | −1 | −1 | 1 | −1 | −1 | 1 | 1 | 1 | 0 | |
| Higher management costs | 2 | −2 | 1 | −2 | 0 | 2 | 2 | 2 | 5 | ||
| O | Recently increased retail prices of bee products | 0 | 0 | −1 | −2 | 1 | 2 | −1 | 0 | −1 | |
| Public and consumer interest | 0 | 0 | 0 | 0 | 1 | 2 | 0 | 0 | 3 | ||
| T | Reduced strength of honey bee colonies | 1 | 1 | 2 | −2 | −2 | 0 | 1 | 2 | 3 | |
| Insufficient and mis-targeted public support | −1 | −2 | 0 | 1 | −1 | −1 | 1 | 1 | −2 | ||
| Lower honey prices from foreign competitors | 0 | 0 | 1 | 1 | 0 | −1 | 1 | 1 | 3 | ||
| Sum of the absolute values by column | 6 | 7 | 7 | 9 | 11 | 6 | 10 | 7 | 6 | ||
References
- Ritter, W.; Akratanakul, P. Honey Bee Diseases and Pests: A Practical Guide; FAO: Rome, Italy, 2006. [Google Scholar]
- Estoque, R.C.; Murayama, Y. Suitability Analysis for Beekeeping Sites Integrating GIS & MCE Techniques. In Spatial Analysis and Modeling in Geographical Transformation Process; Springer: Dordrecht, The Netherlands, 2011. [Google Scholar] [CrossRef]
- Damián, G.C. GIS-Based Optimal Localisation of Beekeeping in Rural Kenya. Master Thesis, Geographical Information Sciences Department of Physical Geography and Ecosystems Science, Lund University, Lund, Sweden, 2016. [Google Scholar]
- Sari, F.; Ceylan, D.A.; Özcan, M.M.; Özcan, M.M. A comparison of multicriteria decision analysis techniques for determining beekeeping suitability. Apidologie 2020, 51, 481–498. [Google Scholar] [CrossRef]
- Fedoriak, M.; Kulmanov, O.; Zhuk, A.; Shkrobanets, O.; Tymchuk, K.; Moskalyk, G.; Olendr, T.; Yamelynets, T.; Angelstam, P. Stakeholders’ views on sustaining honey bee health and beekeeping: The roles of ecological and social system drivers. Landsc. Ecol. 2021, 36, 763–783. [Google Scholar] [CrossRef]
- Bekić, B.; Jovanović, M. Beekeeping as a Factor of Danube Region Sustainable Development. In International Scientific Conference Sustainable Agriculture and Rural Development in Terms of the Republic of Serbia Strategic Goals Realization within the Danube Region: Regional Specificities; Institute of Agricultural Economics: Belgrade, Serbia, 2015; pp. 156–172. ISBN 978-86-6269-046-3. [Google Scholar]
- Altunel, T.; Olmez, B. Beekeeping as a rural development alternative in Turkish northwest. Appl. Ecol. Environ. Res. 2019, 17, 6017–6029. [Google Scholar] [CrossRef]
- Blanc, S.; Brun, F.; Di Vita, G.; Mosso, A. Traditional beekeeping in rural areas: Profitability analysis and feasibility of pollination services. Qual. Access Success 2018, 19, 72–79. [Google Scholar]
- European Commission. Honey. Detailed Information on Honey Production, National Apiculture Programmes, Budget and Legal Bases. Available online: https://ec.europa.eu/info/food-farming-fisheries/animals-and-animal-products/animal-products/honey_en (accessed on 20 January 2021).
- European Commission. EU Beekeeping Sector. National Apiculture Programmes 2020–2022. Available online: https://ec.europa.eu/info/sites/info/files/food-farming-fisheries/animals_and_animal_products/documents/honey-apiculture-programmes-overview-2020-2022.pdf (accessed on 20 January 2021).
- Chauzat, M.-P.; Cauquil, L.; Roy, L.; Franco, S.; Hendrikx, P.; Ribière-Chabert, M. Demographics of the European apicultural industry. PLoS ONE 2013, 8, e79018. [Google Scholar] [CrossRef]
- Floris, I. Italian Apiculture, a Journey through History and Honey Diversity. Accademia Nazionale Italiana di Entomologia, Firenze, Italia. 2020. Available online: https://biodiversityassociation.org/it/wba-project/shop/tutti-i-prodotti/italian-apicuture/ (accessed on 20 January 2021).
- European Commission. Evaluation of Measures for the Apiculture Sector. Final Report; DG Agriculture and Rural Development, Framework Contract No 30-CE-0219319/00-20; European Commission: Bruxelles, France, 2013; 170p. [Google Scholar]
- IPBES. The Assessment Report of the Intergovernmental Science-Policy Platform on Biodiversity and Ecosystem Services on Pollinators, Pollination and Food Production; Potts, S.G., Imperatriz-Fonseca, V.L., Ngo, H.T., Eds.; Secretariat of the Intergovernmental Science-Policy Platform on Biodiversity and Ecosystem Services: Bonn, Germany, 2016; p. 552. [Google Scholar]
- Klein, A.M.; Boreux, V.; Fornoff, F.; Mupepele, A.C.; Pufal, G. Relevance of wild and managed bees for human well-being. Curr. Opin. Insect Sci. 2018, 26, 82–88. [Google Scholar] [CrossRef] [PubMed]
- Klein, A.M.; Vaissière, B.E.; Cane, J.H.; Steffan-Dewenter, I.; Cunningham, S.A.; Kremen, C.; Tscharntke, T. Importance of pollinators in changing landscapes for world crops. Proc. R. Soc. Lond. Ser. B 2007, 274, 303–313. [Google Scholar] [CrossRef] [PubMed] [Green Version]
- Gallai, N.; Salles, J.M.; Settele, J.; Vaissière, B.E. Economic valuation of the vulnerability of world agriculture confronted with pollinator decline. Ecol. Econ. 2009, 68, 810–821. [Google Scholar] [CrossRef]
- Hein, L. The economic value of the pollination service, a review across scales. Open Ecol. J. 2009, 2, 74–82. [Google Scholar] [CrossRef]
- Ollerton, J.; Winfree, R.; Tarrant, S. How many flowering plants are pollinated by animals? Oikos 2011, 120, 321–326. [Google Scholar] [CrossRef]
- Wratten, S.D.; Gillespie, M.; Decourtye, A.; Mader, E.; Desneux, N. Pollinator habitat enhancement: Benefits to other ecosystem services. Agric. Ecosyst. Environ. 2012, 159, 112–122. [Google Scholar] [CrossRef]
- Leonhardt, S.D.; Gallai, N.; Garibaldi, L.A.; Kuhlmann, M.; Klein, A.M. Economic gain, stability of pollination and bee diversity decrease from southern to northern Europe. Basic Appl. Ecol. 2013, 14, 461–471. [Google Scholar] [CrossRef]
- Mazzeo, G.; Scavo, A.; Lo Monaco, A.; Longo, S.; Mauromicale, G. Insect pollinators improve seed production in globe artichoke (Cynara cardunculus var. scolymus). Ann. Appl. Biol. 2020, 176, 241–248. [Google Scholar] [CrossRef]
- Potts, S.G.; Imperatriz-Fonseca, V.; Ngo, H.T.; Aizen, M.A.; Biesmeijer, J.C.; Breeze, T.D.; Dicks, L.V.; Garibaldi, L.A.; Hill, R.; Settele, J.; et al. Safeguarding pollinators and their values to human well-being. Nature 2016, 540, 220–229. [Google Scholar] [CrossRef] [PubMed]
- Badiou-Bénéteau, A.; Benneveau, A.; Géret, F.; Delatte, H.; Becker, N.; Brunet, J.L.; Reynaud, B.; Belzunces, L.P. Honeybee biomarkers as promising tools to monitor environmental quality. Environ. Int. 2013, 60, 31–41. [Google Scholar] [CrossRef] [PubMed]
- Bargańska, Z.; Ślebioda, M.; Namieśnik, J. Honey bees and their products: Bioindicators of environmental contamination. Crit. Rev. Environ. Sci. Technol. 2016, 46, 235–248. [Google Scholar] [CrossRef]
- Potts, S.G.; Biesmeijer, J.C.; Kremen, C.; Neumann, P.; Schweiger, O.; Kunin, W.E. Global pollinator declines: Trends, impacts and drivers. Trends Ecol. Evol. 2010, 25, 345–353. [Google Scholar] [CrossRef]
- Goulson, D.; Nicholls, E.; Botías, C.; Rotheray, E.L. Bee declines driven by combined stress from parasites, pesticides, and lack of flowers. Science 2015, 347, 1255957. [Google Scholar] [CrossRef]
- Flores, J.F.; Gil-Lebrero, S.; Gámiz, V.; Rodríguez, M.I.; Ortiz, M.A.; Quiles, F.J. Effect of the climate change on honey bee colonies in a temperate Mediterranean zone assessed through remote hive weight monitoring system in conjunction with exhaustive colonies assessment. Sci. Total Environ. 2019, 653, 1111–1119. [Google Scholar] [CrossRef] [PubMed]
- Bänsch, S.; Tscharntke, T.; Ratnieks, F.L.W.; Härtel, S.; Westphal, C. Foraging of honey bees in agricultural landscapes with changing patterns of flower resources. Agric. Ecosyst. Environ. 2020, 291, 106792. [Google Scholar] [CrossRef]
- Vercelli, M.; Croce, L.; Mancuso, T. An economic approach to assess the annual stock in beekeeping farms: The honey bee colony inventory tool. Sustainability 2020, 12, 9258. [Google Scholar] [CrossRef]
- Le Conte, Y.; Navajas, M. Climate change: Impact on honey bee populations and diseases. Rev. Sci. Tech. Off. Int. Epiz. 2008, 27, 499–510. [Google Scholar]
- Cornelissen, B.; Neumann, P.; Schweiger, O. Global warming promotes biological invasion of a honey bee pest. Glob. Chang. Biol. 2019, 25, 3642–3655. [Google Scholar] [CrossRef] [PubMed] [Green Version]
- Nicholson, C.C.; Egan, P.A. Natural hazard threats to pollinators and pollination. Glob. Chang. Biol. 2020, 26, 380–391. [Google Scholar] [CrossRef] [PubMed]
- Hegland, S.J.; Nielsen, A.; Lázaro, A.; Bjerknes, A.L.; Totland, Ø. How does climate warming affect plant-pollinator interactions? Ecol. Lett. 2009, 12, 184–195. [Google Scholar] [CrossRef]
- Schweiger, O.; Biesmeijer, J.C.; Bommarco, R.; Hickler, T.; Hulme, P.E.; Klotz, S.; Kühn, I.; Moora, M.; Nielsen, A.; Ohlemüller, R.; et al. Multiple stressors on biotic interactions: How climate change and alien species interact to affect pollination. Biol. Rev. 2010, 85, 777–795. [Google Scholar] [CrossRef] [PubMed]
- EU Pollinators Initiative. Communication from the Commission to the European Parliament, the Council, the European Economic and Social Committee and the Committee of the Regions. COM/2018/395 Final. Available online: https://eur-lex.europa.eu/legal-content/EN/TXT/?qid=1528213737113&uri=CELEX:52018DC0395 (accessed on 20 January 2021).
- Ismea. Il Settore Apistico Nazionale; Ismea: Rome, Italy, 2019; 24p. [Google Scholar]
- Copa-Cogeca. Position Paper on the European Honey Market. Action Plan to Rectify the Alarming Situation. Brussels. February 2020. Available online: https://www.copa-cogeca.eu/downloadThread.aspx?threadID=2153212 (accessed on 17 April 2021).
- ParaiÏso, A.A.; Sossou, A.; Iz-Haquou, D.; Yegbemey, N.H.; Sanni, A. Perceptions and adaptations of beekeepers and honey hunters to climate change: The case of the communes of Natitingou and Tanguieta in Northwest of Benin. Afric. Crop Sci. J. 2012, 20, 523–532. [Google Scholar]
- Vercelli, M.; Novelli, S.; Ferrazzi, P.; Lentini, G.; Ferracini, C. A Qualitative Analysis of Beekeepers’ Perceptions and Farm Management Adaptations to the Impact of Climate Change on Honey Bees. Insects 2021, 12, 228. [Google Scholar] [CrossRef]
- European Union. SWOT (Strengths, Weakness, Opportunities, Threats). Available online: https://europa.eu/capacity4dev/evaluation_guidelines/wiki/swot-strenghts-weakness-opportunities-threats-0 (accessed on 20 January 2021).
- Valentin, E.K. Away with SWOT analysis: Use defensive/offensive evaluation instead. J. Appl. Bus. Res. 2005, 21, 91–105. [Google Scholar] [CrossRef] [Green Version]
- Khatir, M.V.; Akbarzadeh, Z. Elucidation of structural relationships of SWOT: A mixed method approach based on FMADM for formulating science and technology strategies. Technol. Soc. 2019, 56, 44–56. [Google Scholar] [CrossRef]
- Kurttila, M.; Pesonen, M.; Kangas, J.; Kajanus, M. Utilizing the analytic hierarchy process (AHP) in SWOT analysis—A hybrid method and its application to a forest-certification case. For. Pol. Econ. 2000, 1, 41–52. [Google Scholar] [CrossRef]
- Akbulak, C.; Cengiz, T. Determining ecotourism strategies using A’WOT hybrid method: Case study of Troia Historical National Park, Çanakkale, Turkey. Int. J. Sustain. Dev. World Ecol. 2014, 21, 380–388. [Google Scholar] [CrossRef]
- Canto-Perello, J.; Curiel-Esparza, J.; Calvo, V. Strategic decision support system for utility tunnel’s planning applying A’WOT method. Tunn. Undergr. Space Technol. 2016, 55, 146–152. [Google Scholar] [CrossRef]
- Kişi, N. A Strategic Approach to Sustainable Tourism Development Using the A’WOT Hybrid Method: A Case Study of Zonguldak, Turkey. Sustainability 2019, 11, 964. [Google Scholar] [CrossRef] [Green Version]
- Bottero, M.; D’Alpaos, C.; Marello, A. An Application of the A’WOT Analysis for the Management of Cultural Heritage Assets: The Case of the Historical Farmhouses in the Aglié Castle (Turin). Sustainability 2020, 12, 1071. [Google Scholar] [CrossRef] [Green Version]
- Catron, J.; Stainback, G.A.; Dwivedi, P.; Lhotka, J.M. Bioenergy development in Kentucky: A SWOT-ANP analysis. For. Pol. Econ. 2013, 28, 38–43. [Google Scholar] [CrossRef]
- Barati, A.A.; Kalantari, K.; Nazari, M.R.; Asadi, A. A hybrid method (ANP-SWOT) to formulate and choose strategic alternatives for development of rural cooperatives in Iran. J. Agric. Sci. Technol. 2017, 19, 757–769. [Google Scholar]
- Starr, M.; Omkar, J.; Rodney, E.W.; Zou, C.B. Perceptions regarding active management of the Cross-timbers forest resources of Oklahoma, Texas, and Kansas: A SWOT-ANP analysis. Land Use Pol. 2019, 81, 523–530. [Google Scholar] [CrossRef]
- Falcone, P.M. Tourism-based circular economy in Salento (South Italy): A SWOT-ANP analysis. Soc. Sci. 2019, 8, 216. [Google Scholar] [CrossRef] [Green Version]
- Grošelj, P.; Hodges, D.G.; Stirn, L.Z. Participatory and multi-criteria analysis for forest (ecosystem) management: A case study of Pohorje, Slovenia. For. Pol. Econ. 2016, 71, 80–86. [Google Scholar] [CrossRef]
- Barry, F.; Seck, D.; Faye, O.; Mbahin, N.; Diawara, I.; Camara, B.; Ciss, I.; Bakou, S.N.; Diouf, A. Beekeeping diagnostic in four production basins in Senegal: An analysis of opportunities and weaknesses. Int. J. Biol. Chem. Sci. 2018, 12, 1186–1198. [Google Scholar] [CrossRef]
- Güngör, E. Determination of optimum management strategy for honey production forest lands using a’wot and conjoint analysis: A case study in turkey. Appl. Ecol. Environ. Res. 2018, 16, 3437–3459. [Google Scholar] [CrossRef]
- European Commission. Rural Development. Protecting the Future of Rural Communities. Available online: https://ec.europa.eu/info/food-farming-fisheries/key-policies/common-agricultural-policy/rural-development (accessed on 20 January 2021).
- European Commission. EU Farm Policy Rules to be Further Simplified. Available online: https://ec.europa.eu/commission/presscorner/detail/en/IP_17_5242 (accessed on 20 January 2021).
- OECD. Agricultural Policy Monitoring and Evaluation 2018; OECD Publishing: Paris, France, 2018; p. 204. [Google Scholar]
- European Commission. Future of the Common Agricultural Policy. Available online: https://ec.europa.eu/info/food-farming-fisheries/key-policies/common-agricultural-policy/future-cap_en (accessed on 20 January 2021).
- Wilkinson, S. Focus group methodology: A review. Int. J. Soc. Res. Methodol. 1998, 1, 181–203. [Google Scholar] [CrossRef]
- Bloor, M.; Frankland, J.; Thomas, M.; Robson, K. Focus Groups in Social Research; Sage Publications: London, UK, 2001; 120p. [Google Scholar]
- Krueger, R.A.; Casey, M.A. Focus Groups: A Practical Guide for Applied Research; Sage Publications: Thousand Oaks, CA, USA, 2014; 280p. [Google Scholar]
- Gibbs, A. Focus groups. Soc. Res. Update 1997, 19, 1–8. [Google Scholar]
- Onwuegbuzie, A.J.; Dickinson, W.B.; Leech, N.L.; Zoran, A.G. A qualitative framework for collecting and analyzing data in focus group research. Int. J. Qual. Meth. 2009, 8, 1–21. [Google Scholar] [CrossRef] [Green Version]
- Oprandi, N. Focus Group: Breve Compendio Teorico-Pratico; Emme&Erre Libri: Padova, Italy, 2001. [Google Scholar]
- Stewart, D.W.; Shamdasani, P.N.; Rook, D.W. Focus Groups; Sage Publications: Thousand Oaks, CA, USA, 2007; 188p. [Google Scholar]
- Gamble, J.; Thompson, A., Jr.; Peteraf, M. Essentials of Strategic Management: The Quest for Competitive Advantage; McGraw-Hill Education: New York, NY, USA, 2019; p. 864. [Google Scholar]
- Bezzi, C. Rendiamo dinamica la SWOT. Rass. Ital. Valutazione 2005, 31, 7–15. [Google Scholar]
- Bolli, M.; Cagliero, R.; Cisilino, F.; Cristiano, S.; Licciardo, L. L’analisi SWOT per la Costruzione Delle Strategie Regionali e Nazionale Della PAC Post-2020. Working Document, Rete Rurale Nazionale 2014–2020; Mipaaf: Roma, Italy, 2019; p. 54. [Google Scholar]
- Jain, A.; Nandakumar, K.; Ross, A. Score normalization in multimodal biometric systems. Patt. Recog. 2005, 38, 2270–2285. [Google Scholar] [CrossRef]
- McEldowney, J.; Kelly, P. CAP Strategic Planning. Operationals Perspectives. EPRS-European Parliamentary Research Service; European Union: Brussels, Belgium, 2019; p. 28. [Google Scholar]
- Knierim, A.; Nowicki, P. SWOT analysis: Appraisal of a new tool in European rural development policies. Outlook Agric. 2010, 39, 65–72. [Google Scholar] [CrossRef]
- Regione Piemonte. Testo Vigente del PSR 2014–2020. Available online: https://www.regione.piemonte.it/web/temi/fondi-progetti-europei/programma-sviluppo-rurale-feasr/gestione-attuazione-psr/testo-vigente-psr-2014-2020 (accessed on 1 March 2021).
- Dyson, R.G. Strategic development and SWOT analysis at the University of Warwick. Eur. J. Operat. Res. 2004, 152, 631–640. [Google Scholar] [CrossRef]
- Al-Araki, M. SWOT analysis revisited through PEAK-framework. J. Intell. Fuzzy Syst. 2013, 25, 615–625. [Google Scholar] [CrossRef]
- Cosmina, M.; Gallenti, G.; Marangon, F.; Troiano, S. Reprint of “Attitudes towards honey among Italian consumers: A choice experiment approach”. Appetite 2016, 106, 110–116. [Google Scholar] [CrossRef] [PubMed] [Green Version]
- Kos Skubic, M.; Erjavec, K.; Klopčič, M. Consumer preferences regarding national and EU quality labels for cheese, ham and honey: The case of Slovenia. Br. Food J. 2018, 120, 650–664. [Google Scholar] [CrossRef]
- Cisilino, F.; Licciardo, F. Il partenariato nel PSR 2014-20 del Friuli Venezia Giulia attraverso la SWOT relazionale partecipata. Agriregionieuropa 2014, 39, 77–79. [Google Scholar]
- Licciardo, F.; Buscemi, V.; Solca, F. La valutazione del contesto di riferimento del PSR 2014-20 della Regione Sardegna attraverso la SWOT relazionale. In Proceedings of the Atti del Congresso, Associazione Nazionale di Valutazione XVIII Congresso Annuale, Genova, Italy, 17–18 April 2015. [Google Scholar] [CrossRef]
- Maida, M.; Maier, K.; Obwegeser, N. Pairwise comparison techniques for preference elicitation: Using test-retest reliability as a quality indicator. In Proceedings of the International Conference on Information Resources Management (Conf-IRM 2012), Vienna, Austria, 21–23 May 2012; p. 65. [Google Scholar]
- Vestola, M. A Comparison of Nine Basic Techniques for Requirements Prioritization; Helsinki University of Technology: Helsinki, Finland, 2010; pp. 1–8. [Google Scholar]
- Cagliero, R.; Bellini, F.; Marcatto, F.; Novelli, S.; Monteleone, A.; Mazzocchi, G. Prioritising CAP Intervention Needs: An Improved Cumulative Voting Approach. Sustainability 2021, 13, 3997. [Google Scholar] [CrossRef]
- Porto, R.G.; de Almeida, R.F.; Cruz-Neto, O.; Tabarelli, M.; Viana, B.F.; Peres, C.A.; Lopes, A.V. Pollination ecosystem services: A comprehensive review of economic values, research funding and policy actions. Food Secur. 2020, 12, 1–18. [Google Scholar] [CrossRef]
- European Parliament. The History of the EU Budget. Available online: https://www.europarl.europa.eu/thinktank/en/document.html?reference=IPOL_IDA (accessed on 1 March 2021).
| 1 | The normalised value of the ith value of the sums per row (or per column) Si is calculated as (Si − Smin) / (Smax − Smin). Where Smin is the minimum value of the sums per row (or per column) and Smax is the maximum value of the sums per row (or per column). |
Figure 1.
Diagram of methodological approach.

Figure 2.
The spreadsheet used for the pairwise comparison of the items.

Table 1.
SWOT matrix of the beekeeping sector in the surveyed areas.
| Strengths | Weaknesses |
|---|---|
|
|
| Opportunities | Threats |
|
|
(1) Protected area “Parco Naturale Gesso e Stura”; (2) Intensive vine-growing area “Colline di Langa e del Barolo”.
Table 2.
Ranking of the mutual effects—algebraic sums of the scores per row (normalised values).
| Item Type | SWOT Item | Beekeeper Assoc. Leaders | Honey Market Org. Leaders | Entomologists |
|---|---|---|---|---|
| S | Strong motivation of beekeepers | 0.143 | 0.429 | 1.000 |
| S | Collaboration among beekeepers | 0.929 | 1.000 | 0.714 |
| W | Lack of time and labour | 0.714 | 0 | 0.286 |
| W | Higher management costs | 1.000 | 0.571 | 1.000 |
| O | Recently increased retail prices of bee products | 0 | 0.286 | 0.143 |
| O | Public and consumer interest | 0.643 | 0.857 | 0.714 |
| T | Reduced strength of honey bee colonies | 0.857 | 0.571 | 0.714 |
| T | Insufficient and mis-targeted public support | 0.571 | 0 | 0 |
| T | Lower honey prices from foreign competitors | 0.786 | 0.857 | 0.714 |
Colours highlight the highest values (0.666–1.000). Green: favourable items; Red: unfavourable items.
Table 3.
Ranking of the mutual effects—sums of the absolute values of the scores per column (normalised values).
Table 3.
Ranking of the mutual effects—sums of the absolute values of the scores per column (normalised values).
| Item Type | SWOT Item | Beekeeper Assoc. Leaders | Honey Market Org. Leaders | Entomologists |
|---|---|---|---|---|
| S | Strong motivation of beekeepers | 0 | 1.000 | 0 |
| S | Collaboration among beekeepers | 0 | 0.333 | 0.200 |
| W | Lack of time and labour | 0.625 | 0 | 0.200 |
| W | Higher management costs | 1.000 | 0.667 | 0.600 |
| O | Recently increased retail prices of bee products | 0.375 | 0.500 | 1.000 |
| O | Public and consumer interest | 0.250 | 0.157 | 0 |
| T | Reduced strength of honey bee colonies | 0.875 | 0.500 | 0.800 |
| T | Insufficient and mis-targeted public support | 0.625 | 0.667 | 0.200 |
| T | Lower honey prices from foreign competitors | 0.875 | 0 | 0 |
Colours highlight the highest values (0.666–1.000). Green: favourable items; Red: unfavourable items.
Publisher’s Note: MDPI stays neutral with regard to jurisdictional claims in published maps and institutional affiliations. |
© 2021 by the authors. Licensee MDPI, Basel, Switzerland. This article is an open access article distributed under the terms and conditions of the Creative Commons Attribution (CC BY) license (https://creativecommons.org/licenses/by/4.0/).
Share and Cite
MDPI and ACS Style
Novelli, S.; Vercelli, M.; Ferracini, C. An Easy Mixed-Method Analysis Tool to Support Rural Development Strategy Decision-Making for Beekeeping. Land 2021, 10, 675. https://doi.org/10.3390/land10070675
AMA Style
Novelli S, Vercelli M, Ferracini C. An Easy Mixed-Method Analysis Tool to Support Rural Development Strategy Decision-Making for Beekeeping. Land. 2021; 10(7):675. https://doi.org/10.3390/land10070675
Chicago/Turabian StyleNovelli, Silvia, Monica Vercelli, and Chiara Ferracini. 2021. "An Easy Mixed-Method Analysis Tool to Support Rural Development Strategy Decision-Making for Beekeeping" Land 10, no. 7: 675. https://doi.org/10.3390/land10070675
Note that from the first issue of 2016, this journal uses article numbers instead of page numbers. See further details here.