
Farmland Use Transition in a Typical Farming Area: The Case of Sihong County in the Huang-Huai-Hai Plain of China


1
Institute of Geographic Sciences and Natural Resources Research, Chinese Academy of Sciences, Beijing 100101, China
2
School of Public Administration, Nanjing University of Finance & Economics, Nanjing 210023, China
3
Key Laboratory of Coastal Zone Exploitation and Protection, Ministry of Natural Resources, Nanjing 210017, China
4
School of Public Administration, Guangxi University, Nanning 530004, China
5
Jiangsu Institute for Land Development and Consolidation, Nanjing 210017, China
*
Author to whom correspondence should be addressed.
Land 2021, 10(4), 347; https://doi.org/10.3390/land10040347
Submission received: 16 February 2021
/
Revised: 21 March 2021
/
Accepted: 22 March 2021
/
Published: 31 March 2021
(This article belongs to the Special Issue Land Use Transitions under Rapid Urbanization)
Abstract
:An in-depth exploration of the dynamics and existing problems in farmland morphology is crucial to formulate targeted protection policies. In this study, we constructed a morphological evaluation index system to identify the characteristics of farmland use transition in Sihong County of the Huang-Huai-Hai Plain, China. The dominant morphology in terms of area and landscape pattern and the recessive morphology focusing on function were considered in this work. Based on this information, the driving factors of farmland use transition were quantitatively analyzed via the mixed regression model. The following major findings were determined: (1) The area showed a U-shaped change trend during 2009–2018. The patch density (PD) showed an upward trend, and the mean patch size (MPS) showed a downward trend, indicating that the degree of farmland fragmentation increased. The implementation of land consolidation projects increased the area and aggregation of farmland, while urbanization and road construction occupied and divided the farmland, leading to a reduction in area and increase in the degree of fragmentation. (2) The crop production, living security, and eco-environmental function of farmland showed a trend of first decreasing and then increasing. Urbanization increased the demand for agricultural products and the degree of large-scale agricultural production and had a positive impact on the crop production and eco-environmental function of farmland. Our research highlights that increasing farmland fragmentation should be addressed in the farming area. Therefore, the government should formulate efficient policies to curb farmland occupation for urban and traffic utilization.
1. Introduction
As an important research element of the Global Land Project (GLP), land use transition has received extensive attention from scholars [1,2]. The concept of land use transition, which refers to the long-term and trend-based changes of regional land use morphology, was first proposed based on studies of forest transition [3,4,5]. Subsequently, research on forest transition as the foci of land use transition was developed, chiefly centering on theoretical progress and empirical studies [2,6,7] in European countries [5,8], as well as Asian [9] and American countries [10,11]. The land use morphology influenced by socio-economic development records the developmental process of the regional human–land system, which in turn affects socio-economic development. The bilateral interaction between these factors has contributed to land use transition [12,13]. Therefore, investigating land-use transition is of great practical value for exploring the methods for managing land resources and promoting the sustainable development of the regional social economy.
Understanding land use morphology is critical for interpreting land use transitions [14]. Land use morphology initially referred to the quantity and spatial structure of land-use types in a certain area within a specific period [3]. With in-depth research on land use transitions, this concept was further developed and expanded to include dominant (quantity and spatial patterns of land-use types) and recessive morphology (quality, property rights, management mode, input, output, etc.) [15]. Recessive morphology is a special type of morphology that relies on dominant morphology but can only be observed using analysis, detection, and investigation [2,15]. Thus, land use transition can be examined based on the changes in dominant land use morphology and recessive land use morphology. Existing studies focus on the theories and hypotheses of land use transition [16], rural housing land [17,18], urban and rural construction land [19], industrial land [20], and other single land-use types [7]; the eco-environmental effects of land use transition [21,22]; the driving mechanisms [23]; and other aspects [24]. Currently, there are many studies on land-use transition based on dominant morphology, but fewer from the perspective of recessive morphology, which is most closely related to land-use management [2].
Farmland is the most important and changeable land-use type in rural areas. Farmland use reflects the evolutionary dynamics of human–land relations in rural areas, as well as the current situation and problems in the development of agriculture and rural society. Therefore, changes in farmland morphology have a crucial impact on regional economic development, food security [25], and ecological security [26]. Recently, farmland use transition has also received significant attention [24]. These studies included the area, proportion, and spatial patterns of farmland [27,28]; farmland losses [29,30]; farmland landscape metrics [31]; farmland production functions [32]; farmland use intensity [33]; and farmland quality [34]. To date, most extant studies have analyzed the temporal and spatial characteristics of farmland use transition from the single perspective of dominant morphology or recessive morphology. However, few studies have comprehensively described the spatiotemporal patterns of farmland use transition combining both dominant and recessive morphology [24]. Moreover, several studies have used cross-section data of land use across different years. However, a lack of continuous data has restricted our understanding of the mechanisms and dynamics of farmland use transition.
The rapid urban–rural transition and development of the Huang-Huai-Hai Plain, whose land area and total population in agricultural areas accounted for 31.7% and 52.6% of China’s plain agricultural areas, respectively, brought about an accelerated transition of land use [23]. Many studies have been conducted on the plain, mainly concentrating on the provincial [35] and cross-regional scales [36,37]. However, few studies used a typical county as the analysis object to carry out a long-term series of farmland use transition research. “County”, the most basic unit of land management in China, is practically significant for the policy design of farmland protection to explore the characteristics of farmland use transition at the county level. This paper selected Sihong County, a typical region in the Huang-Huai-Hai Plain, as the study area. In recent years, the accelerated urbanization of Sihong led to increasing demand for various construction land, which will inevitably occupy farmland. Therefore, it is necessary to prevent the conversion of farmland into non-agricultural land and to ensure the sustainable use of land resources. This concern is the main problem facing the region at present, so the present study will comprehensively analyze the farmland use transition of Sihong from two complementary perspectives: (1) the spatial transition of farmland (the change in dominant morphology) and (2) the functional transition of farmland (the change in recessive morphology). By analyzing the spatial and functional evolution of the farmland in Sihong County, we further explore the driving factors behind this evolution. The present study will also have a broad implication for creating better land use policy design to optimize the allocation and regulation of regional land resources.
2. Materials and Methods
2.1. Study Area
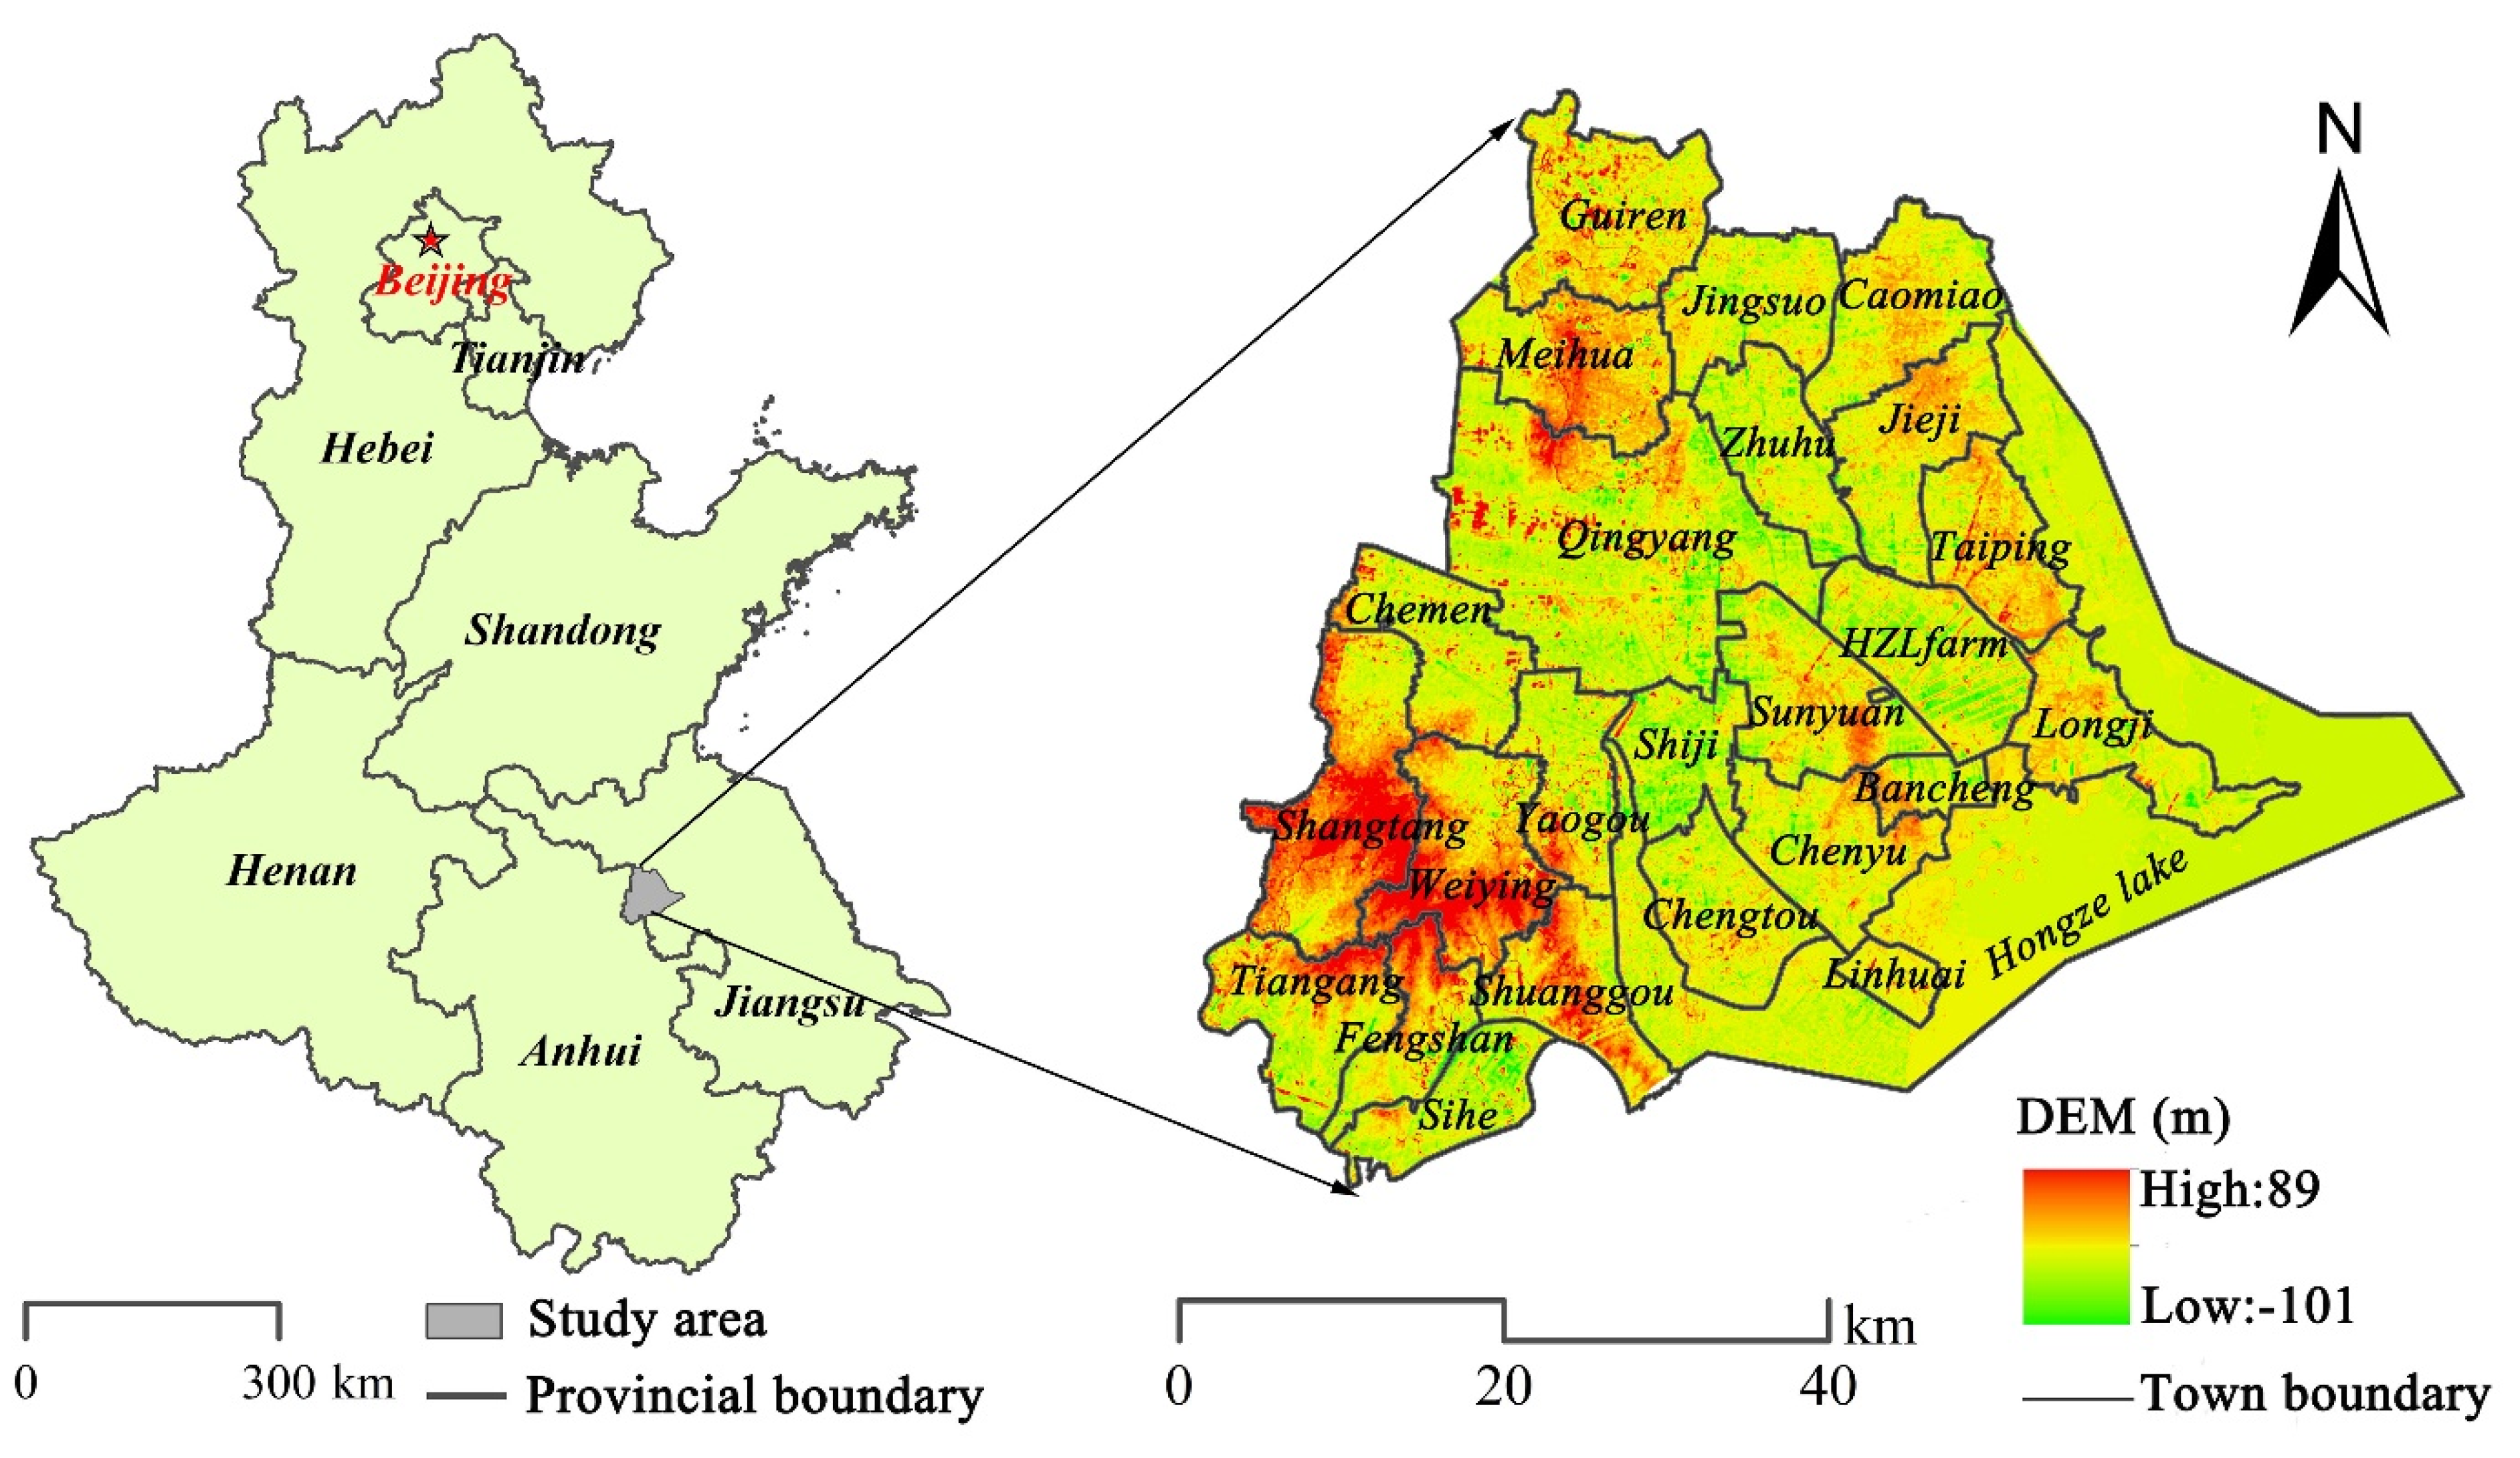
Sihong County (33°08′–33°44′ N, 117°56′–118°46′ E) is located in the northwest area of Jiangsu Province, one of the typical agricultural regions in the Huang-Huai-Hai Plain in China (Figure 1). The terrain in this area is dominated by plains and hilly regions and covers about 2693.91 km2, with an average elevation of 21.5 m. This area has an average annual temperature of 14.6 °C, and annual precipitation of 893.9 mm. In 2019, Sihong County contained 24 towns and 326 administrative villages, with a population of about 1.095 million, and the population density in this area was about 334 persons/km2, with the rural population accounting for 43% of the total population. In 2019, the GDP per capita of Sihong County amounted to CNY 55,111, which was lower than that of China (CNY 70,892) during the same period, and the shares of primary industry, secondary industry, and tertiary industry in the GDP were 16.4%, 37.8%, and 46.1%, respectively. In 2019, the per capita net income of residents was CNY 23,750, which was lower than that of the nation (CNY 30,733) during the same period. This indicates that Sihong can be considered an underdeveloped area in China. Sihong has a long agricultural production history and abundant farmland resources. In 2018, there were 133,091.41 ha of farmland, comprising 49.41% of the total land area of Sihong.
2.2. Data Sources
Due to the consistency and accuracy of land use data since the second national land survey in 2009 [38], our study selected the time span between 2009 and 2018 for farmland use transition analysis. The data were provided by the Department of Natural Resources of Jiangsu Province and adopted the standard land use classification system published in 2007 (GB/T 21010—2007), which consisted of 8 classes and 38 subclasses. Tailored to the needs of this study, land-use data were reclassified to 10 classes: farmland (FL), orchard land (OL), forest land (FRL), grassland (GL), urban land (UL), rural residential land (RL), mining land (ML), transportation land (TL), water body (WB), and other land (OTL). DEM data (spatial resolution: 30 m) for calculating the average elevation and slope of each town were downloaded from the geospatial data cloud website (http://www.gscloud.cn/. Accessed on 27 November 2020). Socio-economic data at the county and town level were mainly taken from the Suqian City Statistical Yearbook and Sihong County Statistical Yearbook. The quantitative data of land consolidation projects representing the intensity of land consolidation were provided by Jiangsu Institute for Land Development and Consolidation. The road data (including provincial road, national road, and highway) were extracted from the land-use data from 2009 to 2018 using ArcGIS 10.3.
2.3. Methods
2.3.1. Measurement of Farmland Dominant Morphology
The assessment of farmland dominant morphologies was mainly based on the landscape pattern and quantity determined by the area of farmland. Based on previous landscape ecological studies [39,40,41,42], three indicators to measure farmland landscape patterns were adopted (Table 1): patch density (PD), mean patch size (MPS), and aggregation index (AI). These indicators were calculated at the class level by FRAGSTATS 4. Patch density (PD) is a measure of the fragmentation of farmland landscape patterns. Low PD values imply fewer patches and indicate farmland continuity, whereas higher values denote more patches, spatial dispersion, and discontinuity. The mean patch size (MPS) mainly describes the morphological changes of patches of farmland, where higher values indicate that the shapes of patches become more concentrated. The aggregation index (AI) reflects the degree of aggregation of patches of farmland. Low AI values indicate fewer aggregation levels of farmland, and vice versa.
2.3.2. Measurement of Farmland Function Morphology
Recessive morphology was described through the farmland function. Based on the previous studies on the multi-functional value of farmland [37,43,44], an evaluation index system covering the crop production, living security, and eco-environmental functions of farmland was established (Table 2). Crop production function refers to the ability of farmland to produce grain, vegetables, melons and fruits, and other crops. The total crop-sown area of Sihong County in 2018 was 1.9849 million ha, and the sown area of grain, oilseeds, vegetables (including vegetable melon), melons (fruit melons), and cotton accounted for 88.44%, 1.50%, 6.43%, 2.26%, and 0.14% of the total sown area, respectively. Since the sown area of cotton was small and presented a decreasing trend, the grain, vegetable, fruit, and oilseed production of the farmland was taken into consideration to evaluate the crop production of the farmland. The living security function included food and employment security functions. The former was reflected by grain yield per unit and per capita farmland area, while the latter was reflected by the proportion of the employees engaging in the plantation industry. The eco-environmental function was greatly affected by the production activities of the farmland; therefore, this function was examined based on the negative effects of the production activities of farmland on the eco-environment. The use intensity of agricultural fertilizer, pesticides, and agricultural plastic film was taken into consideration when selecting indicators to evaluate the eco-environmental function of farmland. The eco-environmental function was expressed by reverse indexes.
Due to the different dimensions of the evaluation indicators, the maximum difference normalization method was employed to standardize the evaluation indicators in the first step:
where fi(k) is the dimensionless value of the ith index in the kth year; ui (k) is the original value of the ith index in the kth year; maxui and minui represent the maximum and minimum values of the ith indicator, respectively; M is the number of indicators; and n is the number of years. Then, each sub-function index was calculated using the formulas below [37]:
where F(crop), F(living), and F(ecol) denote the crop production, living security, and eco-environmental function indexes, respectively. Similarly, W(crop)i, W(living)i, and W(ecol)i represent the weights of index i for each sub-function. This method combines entropy weighting and multiple correlation coefficient weighting to determine the weights of the indexes [37]. f(crop)i, f(living)i, and f(ecol)i represent the respective standardized index values. F(crop), F(living), and F(ecol) range between 0 and 1, where the larger the value is, the higher the function indexes are.
2.3.3. Identifying Potential Important Driving Factors
Identifying major underlying factors of the farmland use transition was necessary for the rational use and management of farmland based on the comprehensive effects of the natural environment, social economy, land use policy, and other factors [35,36,37,44,45,46]. (1) The natural environment mainly included topography and climate. There was little difference in regional factors such as temperature and precipitation across the study area, while topography may have had a more prominent impact on the regional natural environment. Therefore, elevation (El) and slope (Slp) were selected to represent natural conditions. (2) In terms of the level of social and economic development, population density (Pd), urbanization of the population (Urp), farmers’ net income (Fi), per capita GDP (Pgdp), and the total proportion of secondary and tertiary industry output value (Stp) were selected to represent social-economic conditions. (3) Since transportation infrastructure is an important spatial factor driving farmland use transition, road density (Rd) was selected as the measurement for this indicator. (4) The government implemented farmland protection policies through a land consolidation project and ultimately realized the control of farmland use transition directly or indirectly [35]. Therefore, the intensity of land consolidation (Lci, the quantitative data of land consolidation projects) was selected to represent land-use policy.
The influencing factors of farmland use transition were explored using the mixed regression model with data for the three periods of 2009, 2013, and 2018 at the town level. The mixed regression model was formulated as follows [46,47]:
where Ymt is the dependent variable; Xmt is the independent variable matrix; βmt is the regression coefficient; μ and εmt are the intercept and error terms, respectively; m is the town; and t is the year. The model parameters were fitted using the ordinary least squares (OLS) method. To reduce the data fluctuation of variables, a logarithm transformation was carried out when the values of the variable were greater than 10 in the first step. Then, according to the test results of the variance inflation factor (VIF), the VIF of all variables was determined to be below 5, with no multicollinearity.
3. Results
3.1. Characteristics of Farmland Use Transition
3.1.1. Farmland Use Spatial Transition
The area of farmland experienced a continuous reduction and reached a recovery net growth during 2009–2018 in Sihong (Figure 2). The farmland area shrank from 132,470.26 ha in 2009 to 131,987.83 ha in 2013, with a decrease of 482.43 ha. However, the area increased to 133,091.41 ha in 2018. Farmland changed from continuous rapid consumption to low-speed consumption and ultimately achieved recovery with the development of economic and social development.
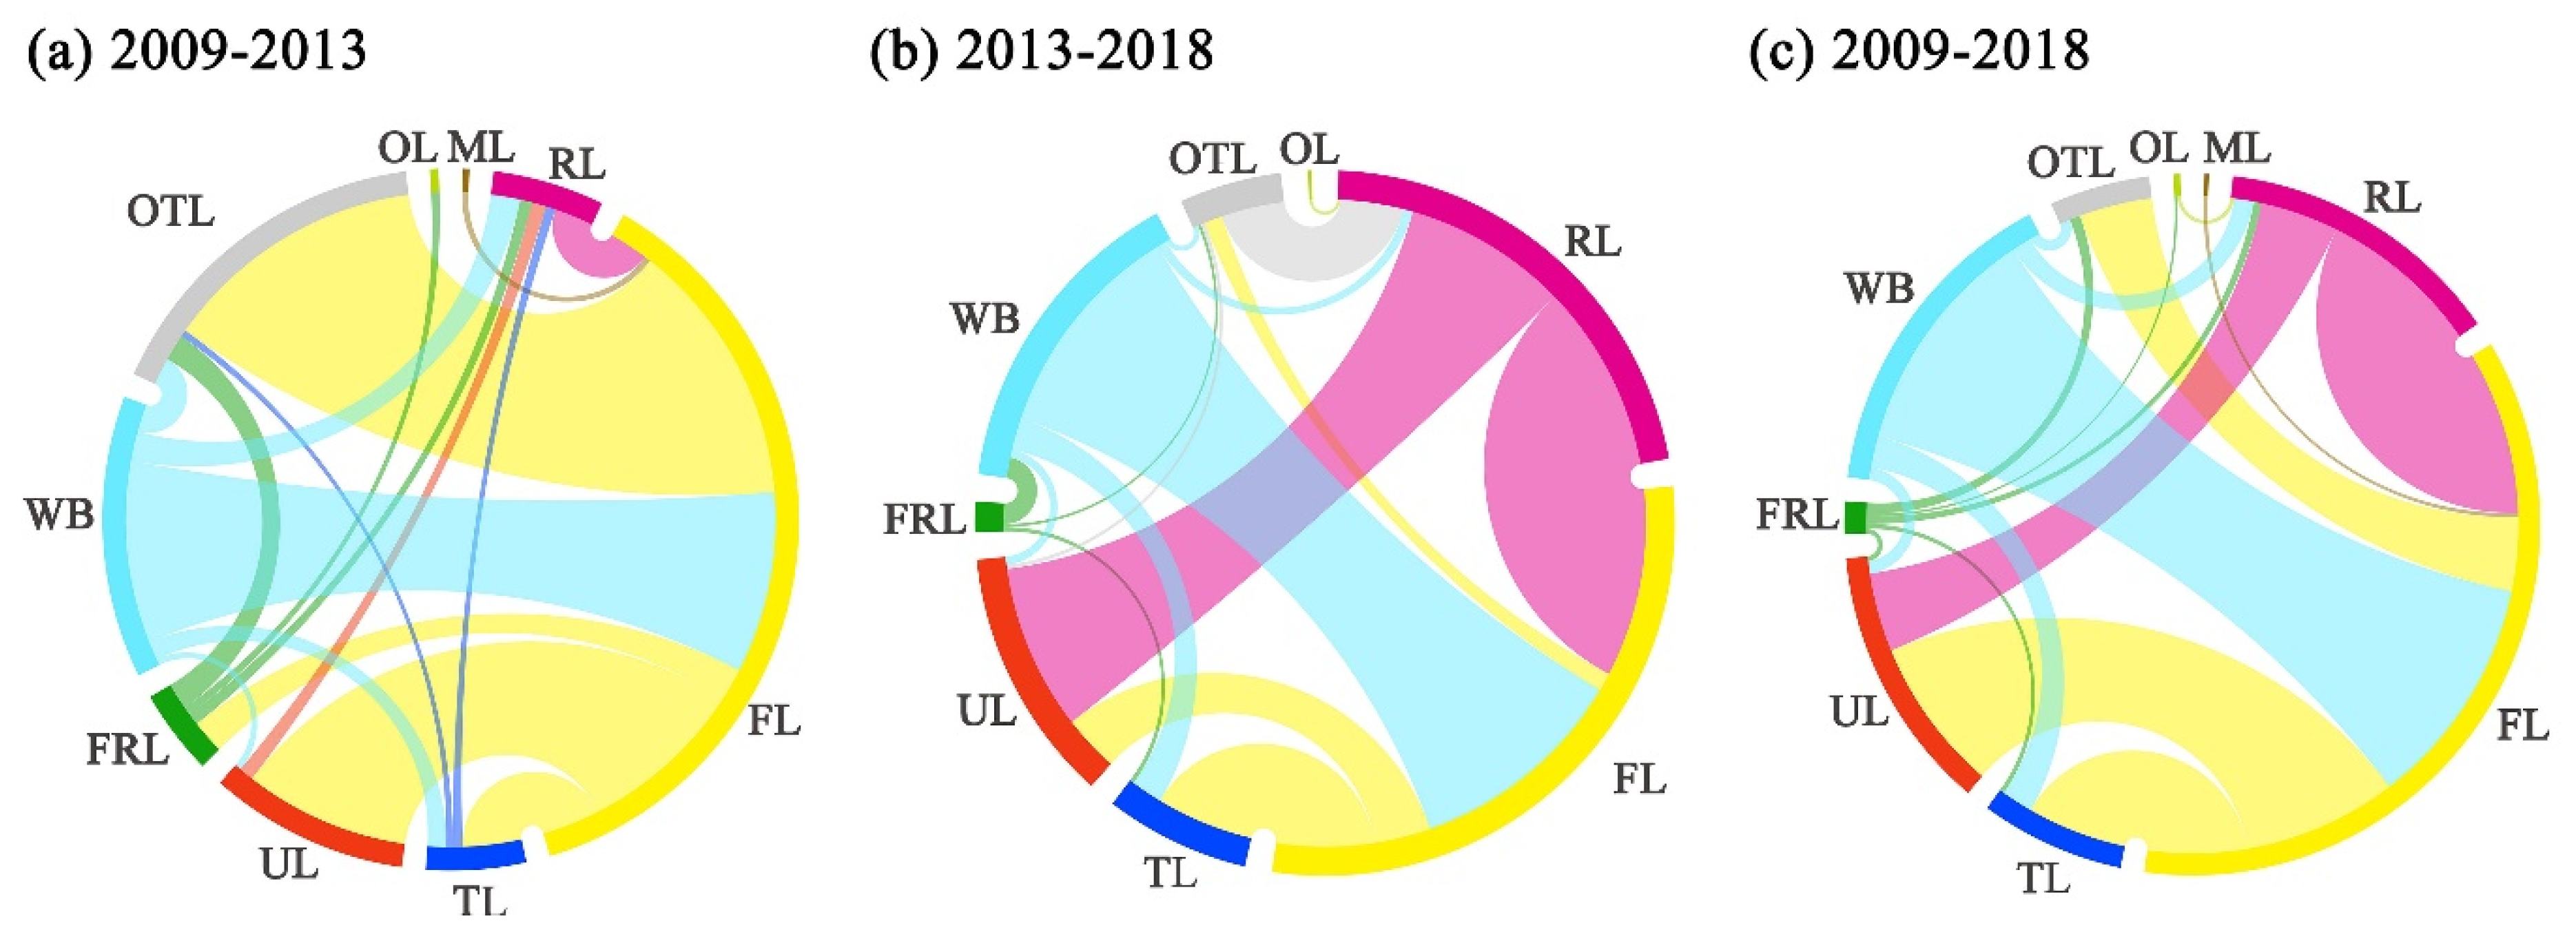
To analyze the internal conversion of farmland in Sihong county, three changing matrixes of farmland were utilized based on the three land use maps (Figure 3). From 2009 to 2013, the main decrease in farmland was mainly due to the occupation of urban land, rural residential land, and transportation land (Figure 4a). From 2013 to 2018, the restorative increase in farmland was caused mainly by the conversion of rural residential land and water bodies (Figure 4b). This occurred because, since 2012, Sihong has carried out the government-led land consolidation project of the “Million Hectares of Fertile Farmland”, which converted rural residential land and water bodies into farmland and increased the farmland area. From 2009 to 2018, the main increase in farmland came from rural residential land and water bodies, with rates of 52.26% and 27.50%, respectively (Figure 4c).
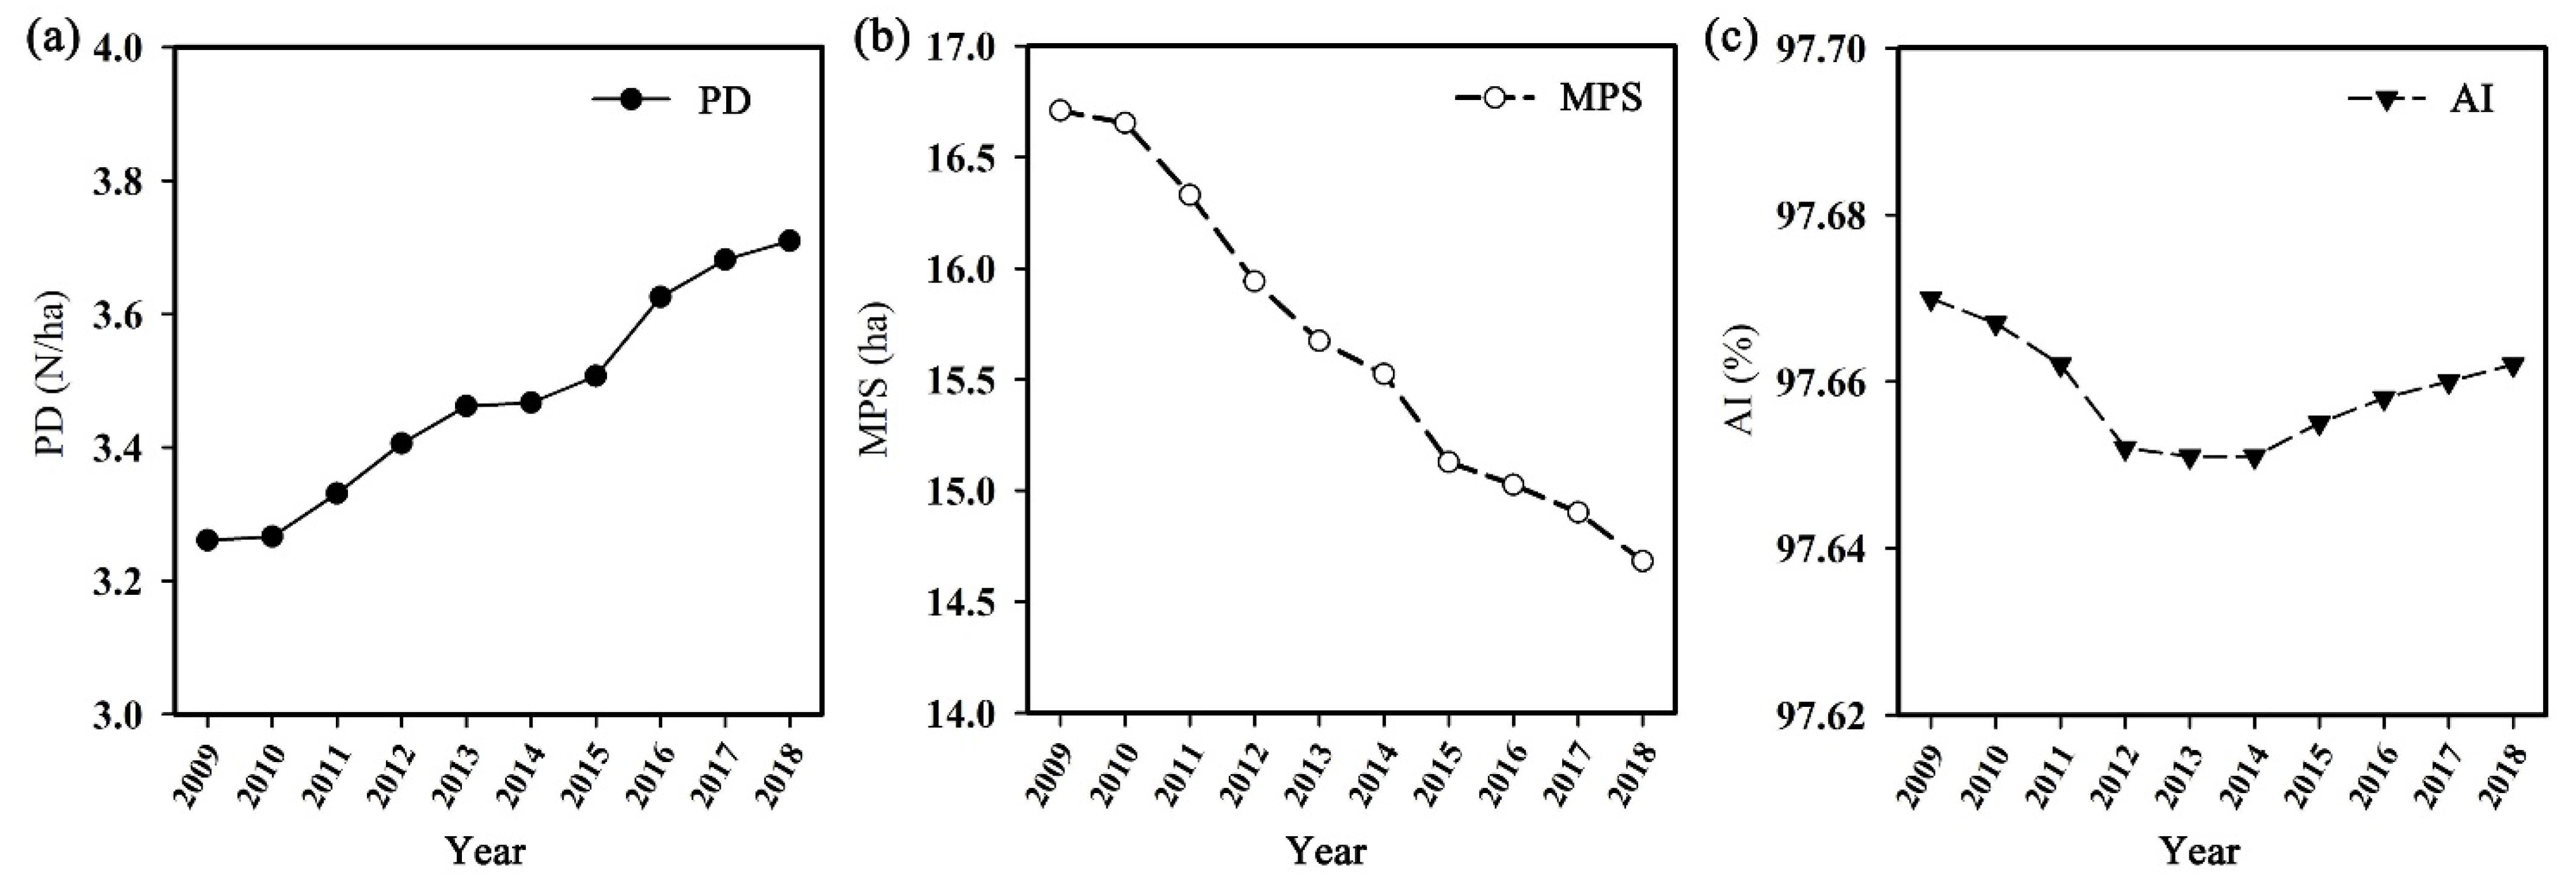
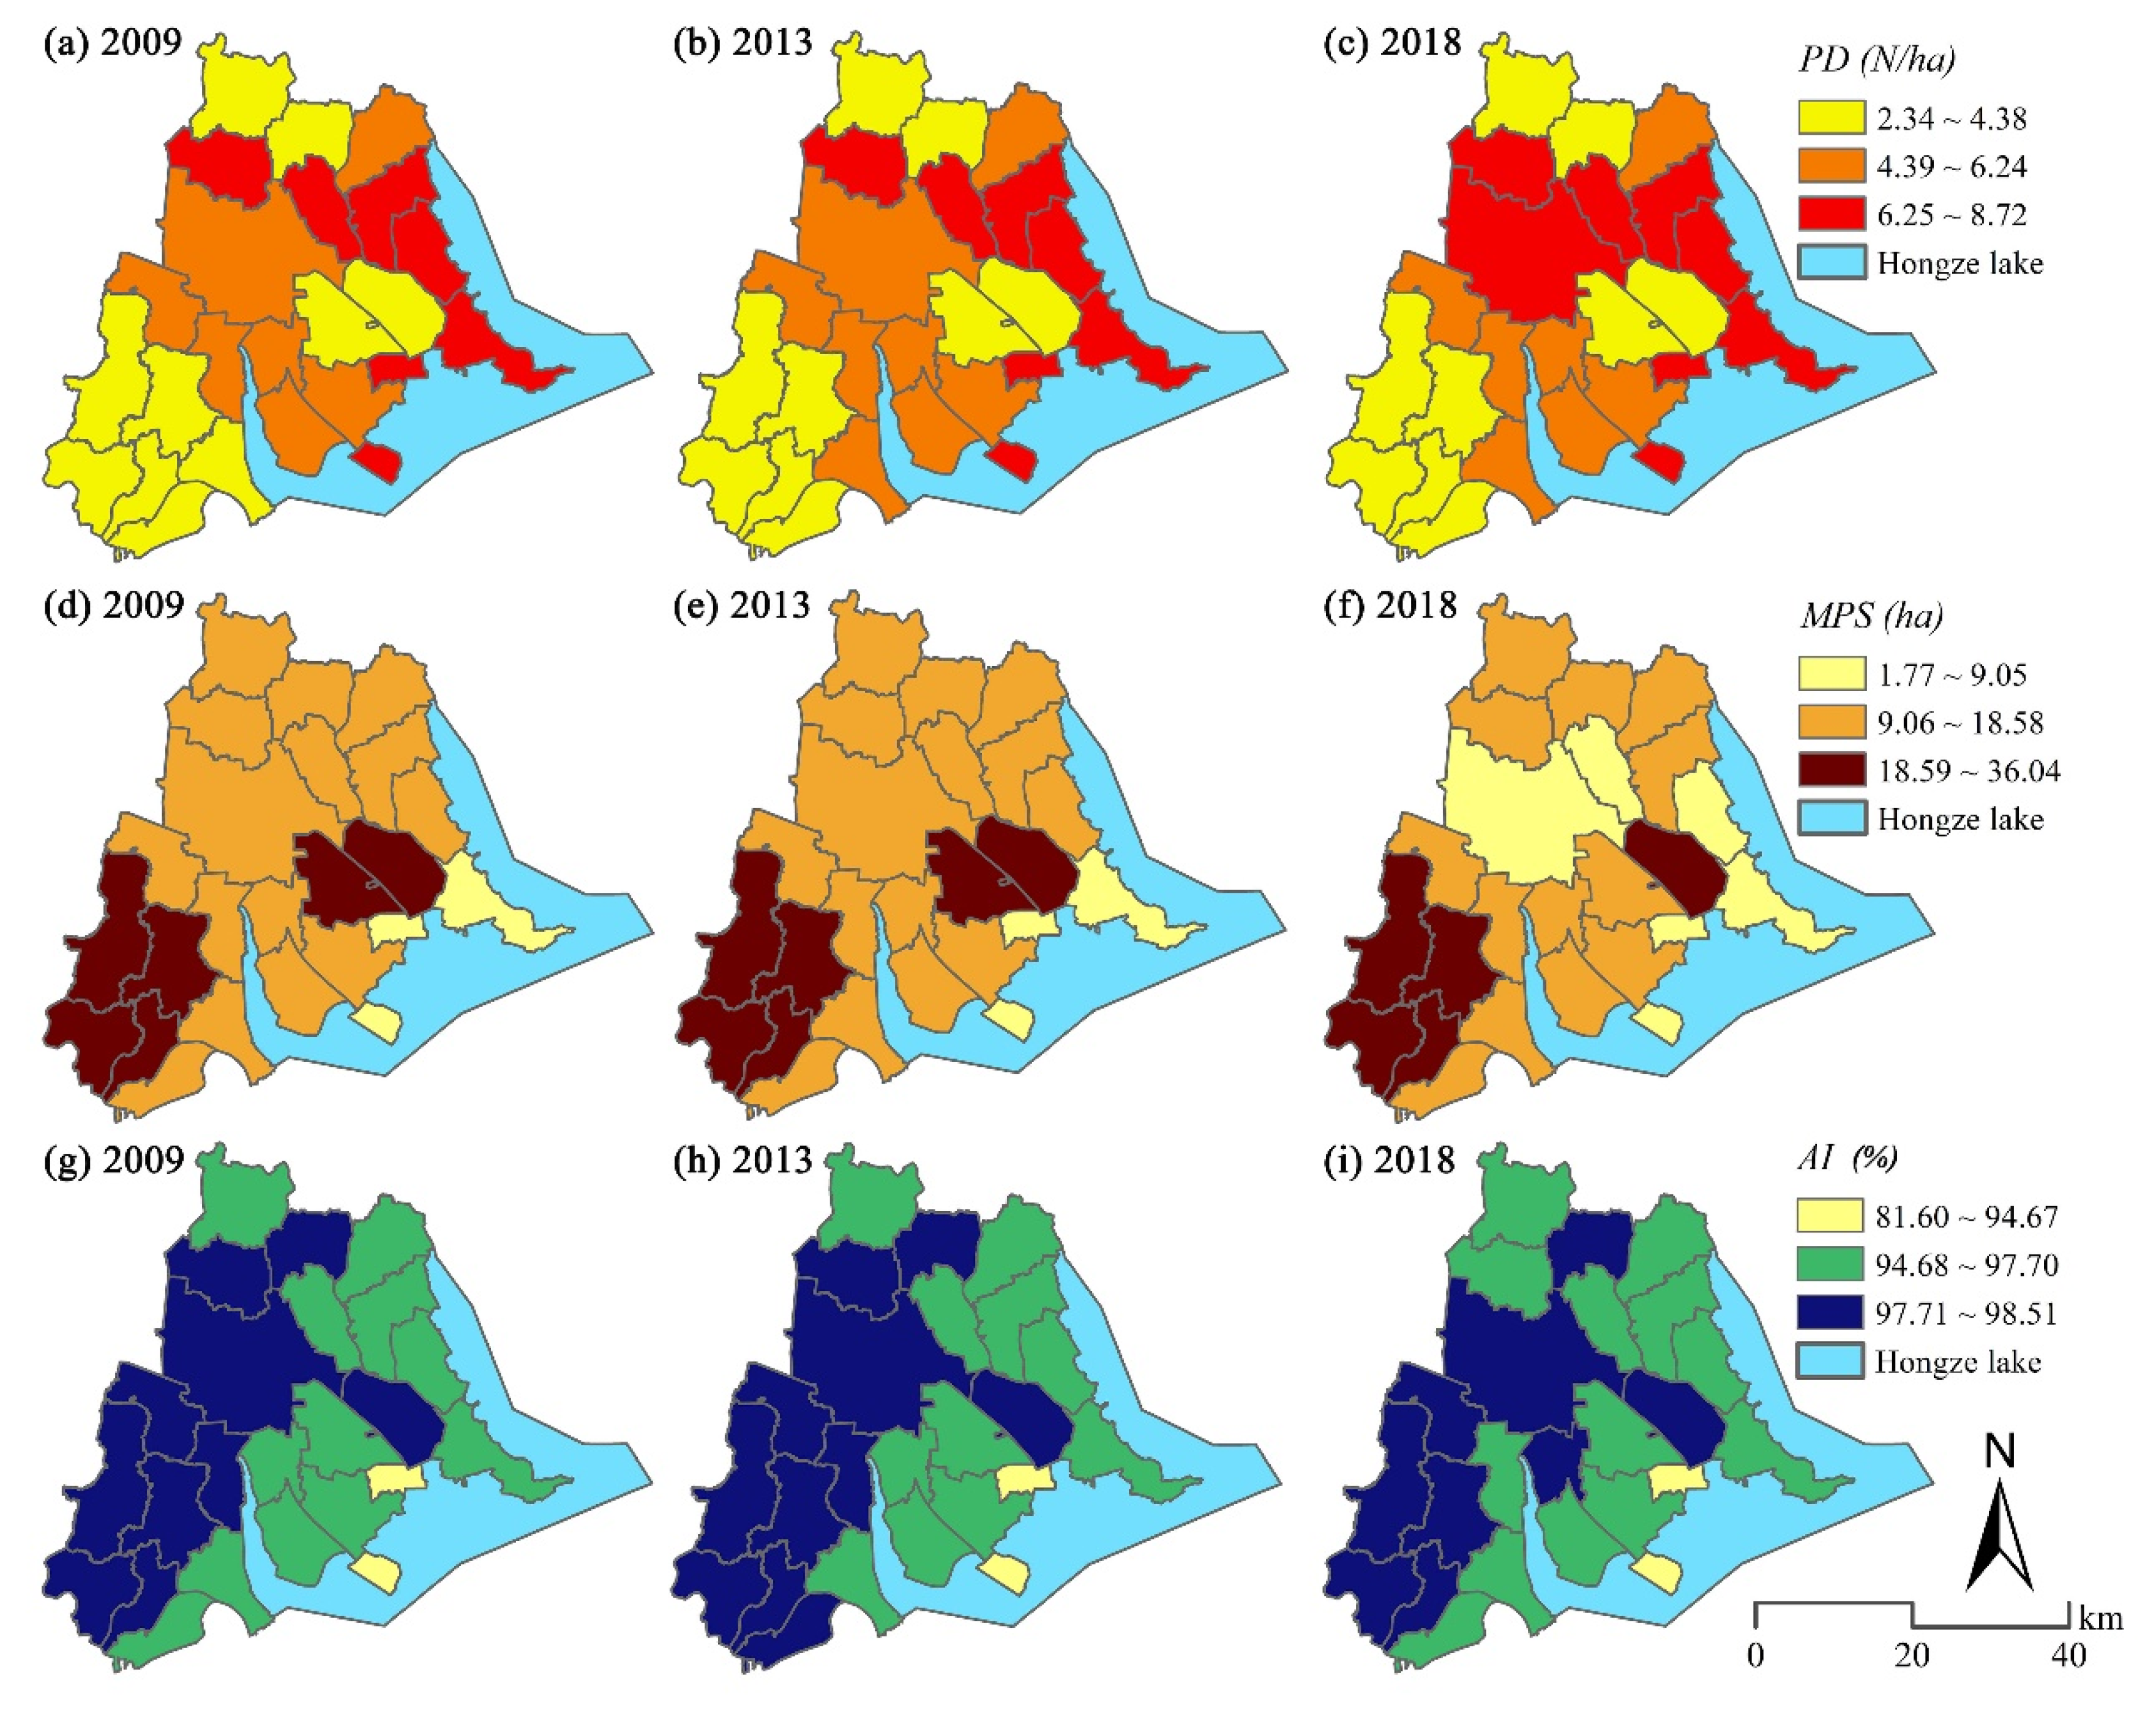
The smallest increase in the PD of farmland was identified at the county scale in Figure 5a. The PD of farmland was 3.26 in 2009 and increased to 3.71 in 2018 (Figure 5a). By comparing the PD of farmland at the township scale in 2009, 2013, and 2018, similar changing characteristics to the county level were observed (Figure 6a–c). The MPS of farmland presented a general downward trend at the county scale and decreased from 16.71 ha in 2009 to 14.68 ha in 2018 (Figure 5b). The number of townships with low MPS values (1.77~9.05) increased from three in 2009 to six in 2018 (Figure 6d–f). This increase in PD and decrease in MPS suggests that the fragmentation degree of farmland increased. This mainly occurred because the farmland was invaded by urban land, villages, and transportation infrastructure construction and was spatially divided into fragmented patches, leading the fragmentation of the farmland to gradually increase. Generally speaking, land consolidation causes an increase in the MPS and decrease in the PD of farmland. However, in the current study area, each land consolidation project is small and dispersed and does not significantly increase the MPS of the farmland. Indeed, each project may have increased the farmland PD. The AI of farmland patches showed a falling and then rising trend (Figure 5c). The AI of farmland decreased from 96.67% in 2009 to 97.65% in 2013 and increased to 97.662% in 2018. This indicates that the degree of aggregation and connectivity possesses a transition characteristic of first decreasing and then increasing. This is mainly because Sihong has carried out the government-led land consolidation project of the “Million Hectares of Fertile Farmland” since 2012, which has improved the agglomeration and connectivity of the farmland landscape. The number of townships with high AI values (97.71–98.51%) decreased by 2 during 2009–2018, which indicates that the AI of farmland in some townships declined (Figure 6g–i).
3.1.2. Farmland Function Transition
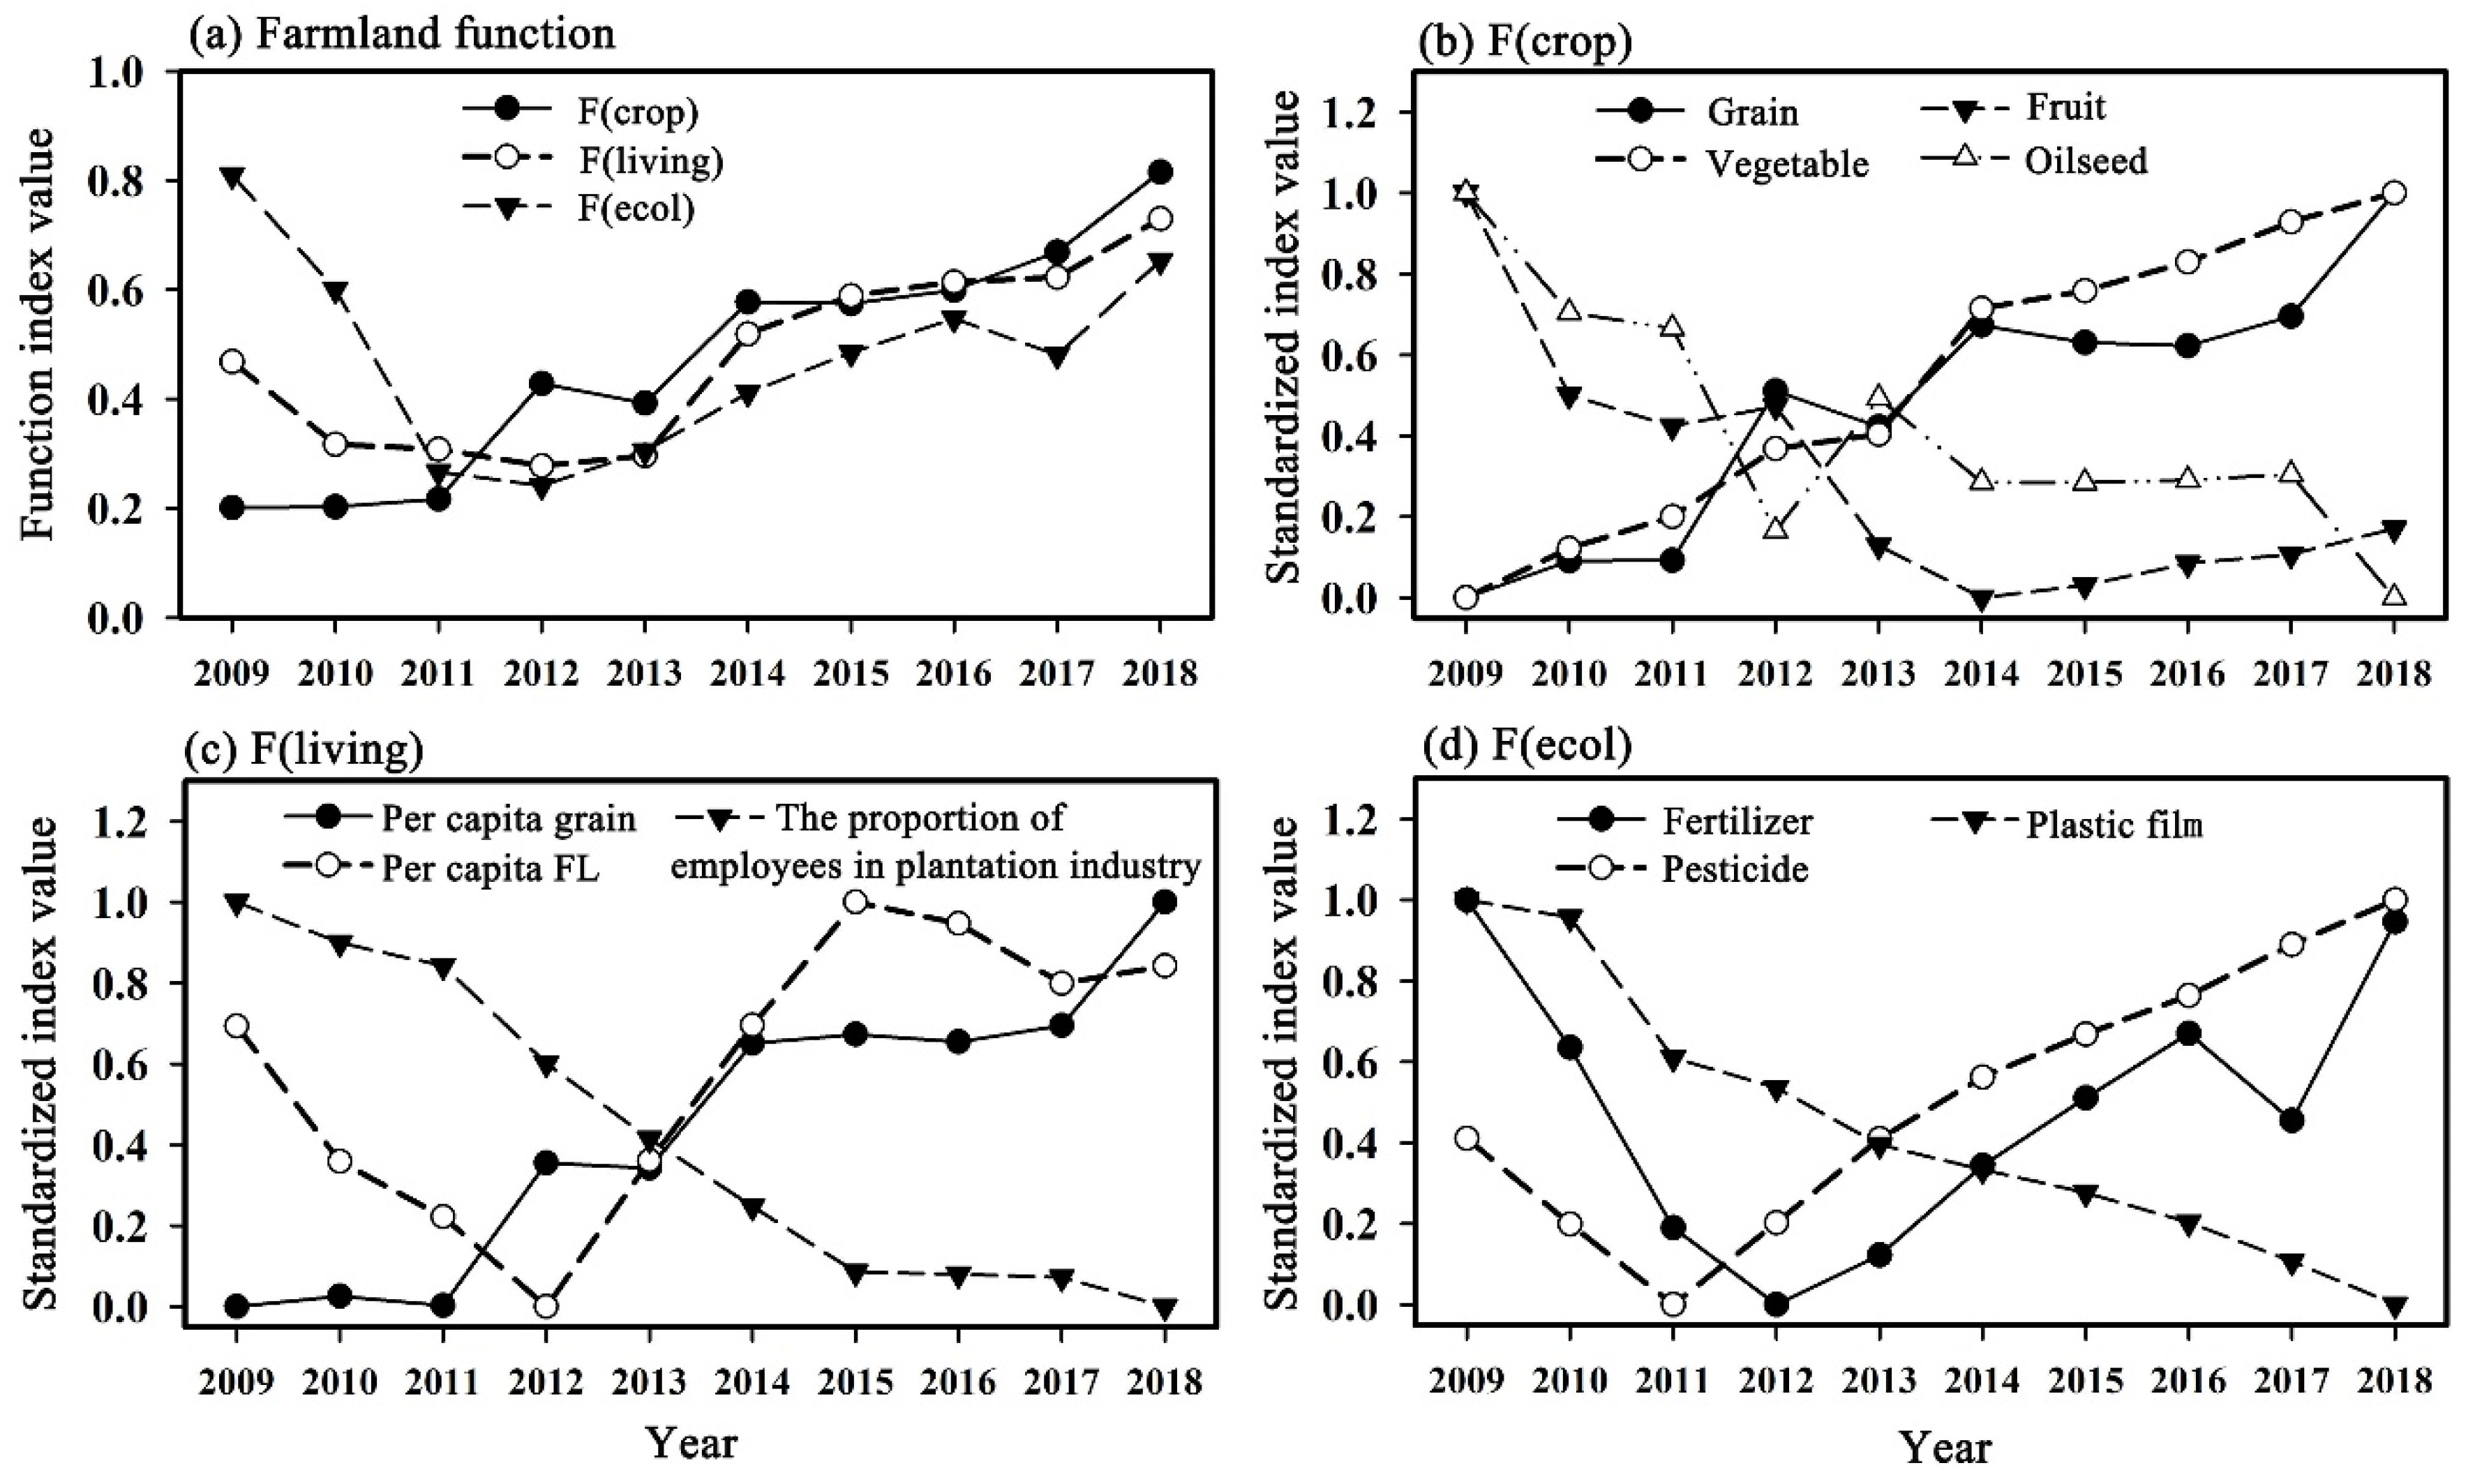
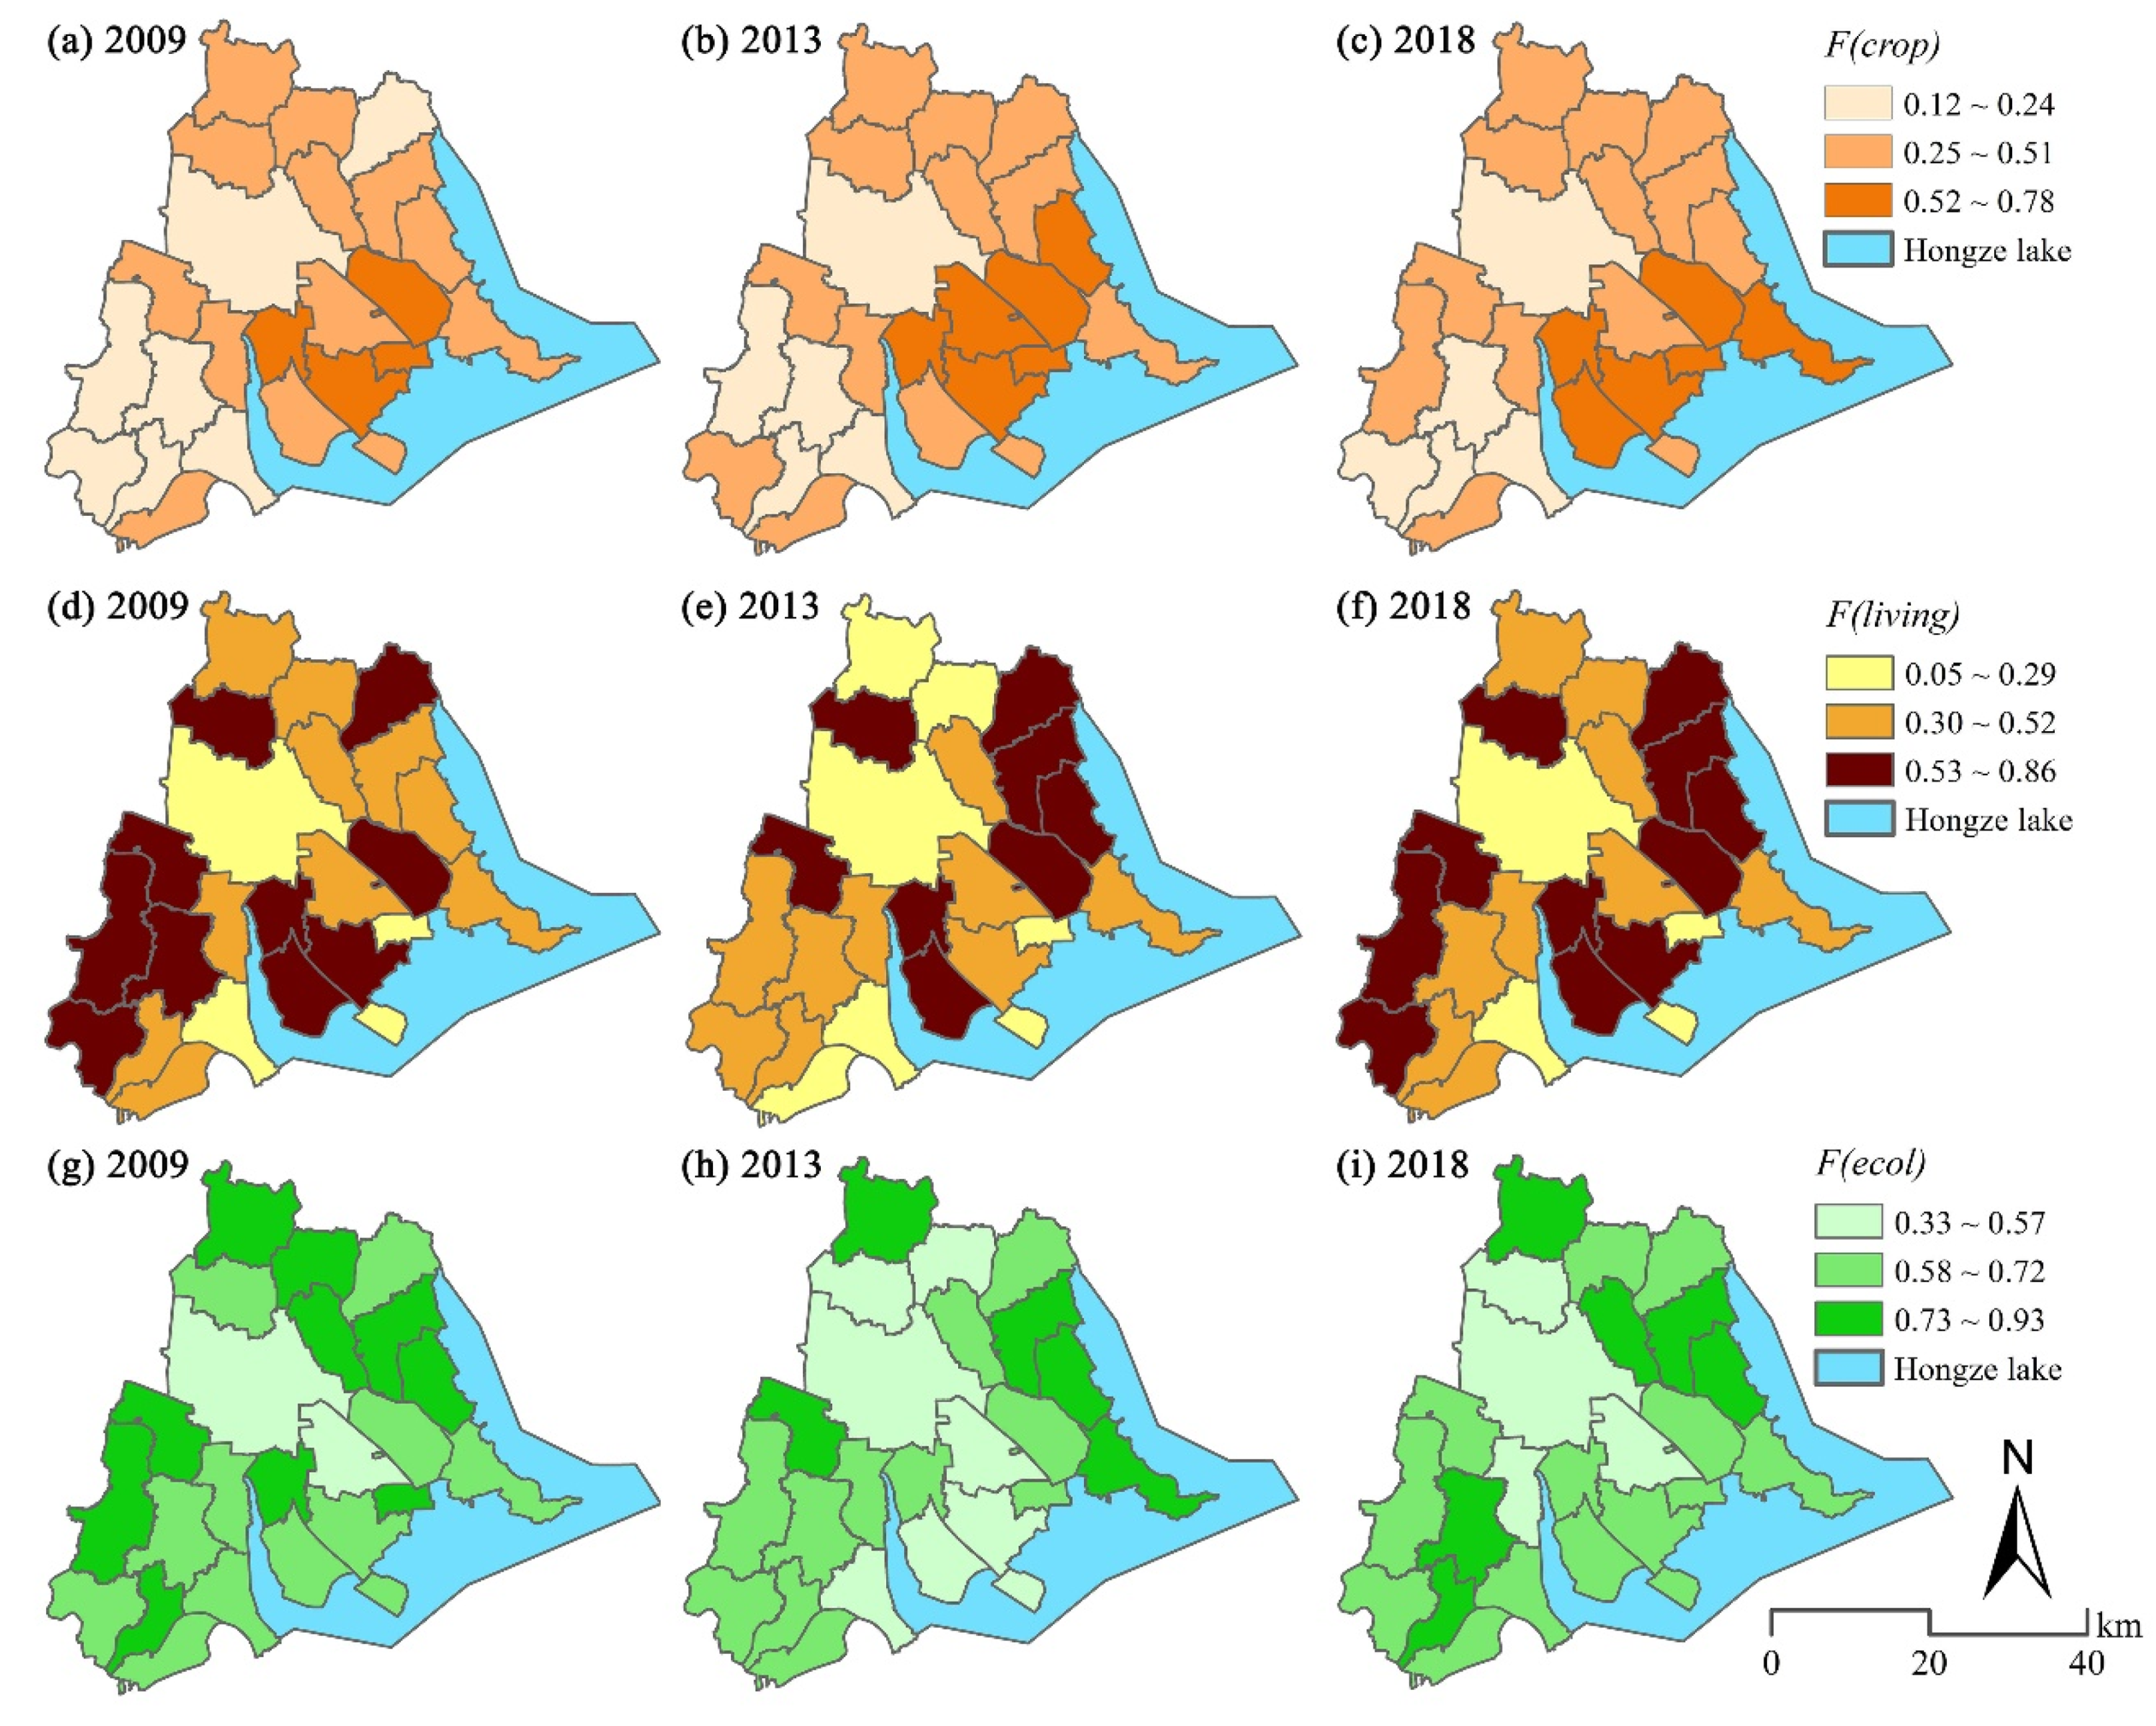
At the county scale, the crop production function of farmland displayed a fall–rise trend during 2009–2018 (Figure 7a), and the index of the crop production function of farmland substantially rose from 0.210 in 2009 to 0.815 in 2018. In particular, the functions of grain and vegetable production of the farmland were substantially improved, while the fruit and oilseed production functions decreased substantially in the study area from 2009 to 2018 (Figure 7b). From the perspective of the township level, the crop production function of farmland in some townships also improved. The number of townships with high F (crop) index values (0.52–0.78) increased from four in 2009 to six in 2018 (Figure 8a–c).
The living security production of farmland showed an initial falling trend and then rising trend during 2009–2018 (Figure 7a), and its index decreased from 0.468 in 2009 to 0.296 in 2013. However, this index increased to 0.729 in 2018 at the county scale. Specifically speaking, the indexes of grain yield per unit and per capita farmland area fluctuated upward, and the proportion of employees in the plantation decreased in the study area from 2009 to 2018. This shows that the function of farmland food security was enhanced, while the function of farmland employment security was significantly weakened (Figure 7c). The number of townships with low F (living) index values (0.05–0.29) increased from four in 2009 to seven in 2013, and these increased townships, including Guiren, Jinsuo, and Sihe, were restored in 2018 (Figure 8d–f). The low-value areas were mainly distributed in accordance with relatively high levels of urbanization.
The eco-environmental function of farmland showed an initial decrease and then increase trend during 2009–2018 (Figure 7a), and the index of the eco-environmental function of farmland decreased from 0.8103 in 2009 to 0.2409 in 2012; then, the index increased to 0.6530 in 2018, but it did not recover to the level in 2009. Specifically, the index of agricultural fertilizer intensity and pesticide intensity first decreased and then increased, indicating that the eco-environmental function of farmland increased in its fluctuation while the index of the use intensity of agricultural plastic film showed a downward trend (Figure 7d). The number of townships with high F(ecol) index values (0.73–0.93) decreased from 10 in 2009 to 5 in 2013, indicating that the eco-environmental function of farmland in some towns declined substantially. During 2013–2018, the number of high-value townships and medium-value townships also increased (Figure 8g–i).
3.2. Driving Factors of Farmland Use Transition
3.2.1. Driving Factors of Farmland Use Spatial Transition
In the results of the regression analysis (Table 3), the standardized regression coefficient showed that the farmland use spatial transition at the town level is largely affected by natural environmental factors (e.g., elevation, slope), economic development factors (e.g., population density, urbanization), transportation infrastructure factors, and land use policy factors. In particular, the farmland area evolution had a positive correlation with the intensity of land consolidation (p < 0.01) and elevation (p < 0.05) and a negative correlation with road density (p < 0.01) and urbanization (p < 0.05). The PD of farmland was positively correlated with road density and urbanization (p < 0.01) but negatively influenced by elevation, slope, and population density (p < 0.01), as well as Stp (p < 0.05). The MPS of farmland was positively correlated with elevation, slope, and population density (p < 0.01). Additionally, the MPS was negatively correlated with urbanization and road density (p < 0.01) and farmers’ net income (p < 0.10). The AI of farmland was positively correlated with slope and the intensity of land consolidation (p < 0.01), as well as Pgdp (p < 0.10), but was negatively correlated with road density and farmers’ net income (p < 0.01).
3.2.2. Driving Factors of Farmland Function Transition
The function transition of farmland use at the town level was largely affected by economic development factors (e.g., population density, urbanization, Pgdp, farmers’ net income) and transportation infrastructure factors (road density) (Table 3). Specifically, the crop production function of farmland was positively related to urbanization (p < 0.01) and farmers’ net income (p < 0.05). The living security function evolution of farmland had a negative correlation with population density and urbanization (p < 0.05). The eco-environmental function of farmland was positively correlated with population density, urbanization, and Pgdp (p < 0.01). The eco-environmental function of farmland was negatively correlated with road density (p < 0.01), as well as farmers’ net income (p < 0.05).
4. Discussion
Socio-economic factors were substantially correlated with farmland use transition individually (Table 3). Particularly, urbanization demonstrated the strongest correlation with almost all the indexes (excluding AI) of farmland morphology. Overall, urbanization caused a decrease in farmland area and MPS and an increase in the PD, mainly because part of the farmland was turned into urban land, which resulted in more fragmented farmland [48,49]. Urbanization was also substantially related to changes in the functional morphology of farmland. To be more specific, the increase in urbanization expanded market demand for local agricultural products and stimulated an increase in the supply capacity of agricultural products, which contributed to an improvement in the crop function of farmland [46]. The progress of the urbanization level prompted the labor force in the plantation industry to shift continuously to secondary and tertiary industries, which have absorbed a large number of rural laborers, making it possible to scale up farmland which came from the rural settlements reclaimed by the government, while the employment opportunities and social security functions of farmland have declined accordingly [50]. Urbanization also advanced agricultural production mechanization, industrialization, and modernization, which have reduced the use of chemical fertilizers and pesticides per unit area of farmland, thereby improving the eco-environmental functions [46,50,51]. However, agricultural production mechanization has also increased the amount of agricultural plastic film and reduced the eco-environmental functions of farmland. Moreover, the difficulties in plastic film decomposition will likely have a long-term impact on the eco-environmental function of farmland in the future [43,52].
Population density is another important socio-economic driving factor of farmland use transition [53,54]. Areas with high population density are generally economically developed areas where the contradiction between people and land is prominent [55] and land use is complex, leading to a high Pd and low MPS of the farmland. In these areas, agricultural employment opportunities are fewer, and the per capita farmland and food possession are too small. Population agglomeration also leads to an increase in demand for crop products and agricultural modernization, which together promote the crop production of farmland and reduce the use of chemical fertilizers and pesticides per unit area of farmland, thereby improving the eco-environmental function of the farmland. Moreover, the increase in farmers’ income has reduced the MPS and AI of the farmland. This occurred because farmers converted their farmland into fishponds to achieve higher income, which resulted in more fragmented farmland. In addition, the increase in farmers’ income also motivated rural laborers to engage in agricultural activities, which further promoted the crop production function of farmland [36].
The farmland protection policies represented by the intensity of land consolidation are also important driving factors of farmland use transition [56,57]. The implementation of consolidation projects has increased the area of farmland and the AI of farmland patches. In response to the large amount of farmland being occupied by construction land and non-agriculturalization in the process of urbanization and industrialization, this research has also demonstrated that the “Requisition–Compensation Balance of Farmland” policy and land consolidation project implemented by the Chinese government has succeeded in restoring the farmland area [58,59]. Sihong has carried out the government-led land reclamation project of the “Million Hectares of Fertile Farmland Reclamation Project” since 2012, which has improved the agglomeration and connectivity of the farmland landscape.
It was noted that the road network density had a significant impact on the regional farmland’s morphological changes. The construction of road networks inevitably consumes and divides farmland, resulting in a decrease of the area of farmland [60], an increase of the density of farmland patches, and a reduction in the mean size and agglomeration of farmland patches. These factors caused an increase in the degree of fragmentation of the farmland. The increase in the degree of fragmentation of farmland constrained agricultural large-scale production and caused an increase in the use intensity of chemical fertilizers and pesticides per unit area of farmland, which eventually led to a decline in the eco-environmental function of the farmland.
Moreover, the regional natural environment had a certain impact on the farmland morphology [39,61], especially the dominant farmland morphologies. In areas with high altitudes and slopes, the possibility of farmland being occupied and divided by urban land was low, which led to a lower PD, higher MPS, and lower AI of farmland. However, due to poor natural conditions, the crop production function of farmland was low. In plain areas, due to the decline in the comparative benefit of agriculture and the increase in labor costs, farmers were more inclined to plant crops through mechanization, while in hilly areas, mechanization was difficult to achieve, so elevation had a negative effect on the crop production capacity of the farmland.
5. Conclusions and Policy Implications
5.1. Conclusions
This study examined the dominant controlling factors and characteristics of the farmland morphology variations in a typical agricultural area in China. From the perspective of the dominant morphological changes in farmland, the area of farmland showed a U-shaped change trend that first decreased and then increased during 2009–2018. However, the PD of the farmland patches showed an upward trend, and the MPS of farmland patches showed a downward trend, indicating that the degree of fragmentation of farmland increased. The spatial differences and dominant morphological changes of farmland were affected by several factors. Among them, the implementation of consolidation projects increased the area of farmland and the concentration of farmland patches, and the increase in urbanization and road density reduced the area and increased the degree of fragmentation of farmland. Elevation, slope, and population density also had a significant impact on the dominant form of cultivated land. Areas with a low altitude and slope and areas with a high population density had more complex land use conditions and a higher degree of cultivated land fragmentation. Regarding the recessive morphological changes of farmland (function morphology), the crop production, living security, and eco-environmental functions of farmland showed a falling and then rising trend. The spatial differences and changes in farmland functions were mainly affected by economic development factors and transportation factors. Urbanization had a positive impact on the crop production and eco-environmental functions of farmland, which reduced the living security function of the farmland. This suggests that urbanization increased the demand for agricultural products and the degree of large-scale agricultural production. These results could be useful for diagnosing the morphology of farmland in other agricultural areas, as morphology is very important for formulating reasonable farmland protection policies.
5.2. Implications for Land Use Policy
To meet the requirements of economic development, food security, and ecological environment security, regions should promptly adjust their land resource management policies and measures according to the current farmland morphology (including dominant and recessive morphology) and existing problems [15]. Our study demonstrated that the area of farmland has experienced a continuous reduction and reached a recovery net growth during 2009–2018 in the study area. This changing trend of farmland conformed to the “U-shaped” trend proposed by Song et al. [14] and Ge et al. [24]. The implementation of local land consolidation projects achieved an increase in the area and provided limited improvement in the function of the farmland. Therefore, it is necessary to scientifically formulate rural spatial planning; promote the implementation of comprehensive land consolidation projects throughout the region; and optimize agricultural, ecological, and construction space.
5.3. Limitation and Further Research
Since the land use data in this study were based on the Second National Land Survey led by the Chinese government (2009) and updated annual investigation (2010–2018), the data were mainly interpreted via high-resolution remote sensing images and field surveys and were obtained with high precision and temporal continuity. Although the Chinese government also conducted a land survey before 2009, it is difficult to effectively compare these surveys due to the inconsistency in land classification standards and accuracy with the second land survey made. Therefore, this study only conducted an analysis of the farmland use transition between 2009 and 2018, which was a relatively short research period. In future research, high-resolution remote sensing images should be adopted to interpret historical land use data and increase the study period to understand the underlying mechanisms and obtain the dynamics of farmland use transition.
The recessive morphology of farmland use is rich in connotations. The present study focuses on the farmland’s functional morphology but does not cover the property rights, quality, and management modes of farmland. Thus, future research should be more systematic in analyzing the recessive morphology of farmland. In addition, although this study concentrated on farmland use transition at the microscopic scales of counties and towns, less attention has been paid at the village scale. The spatial and functional transition of farmland at the village scale are of significance for the formulation of policies to protect farmland and farmers’ livelihoods. Therefore, more in-depth research on farmland use transition at the microscopic scale should be the focus of future research.
Author Contributions
Conceptualization, L.L. and H.L.; methodology, L.L.; software, Z.G.; validation, L.L., X.W. and Y.F.; formal analysis, L.L.; investigation, Z.G. and Y.F.; resources, X.W.; data curation, L.L.; writing—original draft preparation, L.L.; writing—review and editing, H.L.; visualization, L.L. and Z.G.; supervision, H.L.; project administration, L.L.; funding acquisition, H.L. and L.L. All authors have read and agreed to the published version of the manuscript.
Funding
This research was supported by the National Natural Science Foundation of China (Grant Nos. 41731286, 41801169 and 42001225), China Postdoctoral Science Foundation (2018M641456), the MOE (Ministry of Education in China) Project of Humanities and Social Sciences (18YJCZH120), the Natural Science Foundation of Jiangsu Province, China (BK20180819).
Institutional Review Board Statement
Not applicable.
Informed Consent Statement
Not applicable.
Data Availability Statement
Not applicable.
Conflicts of Interest
The authors declare no conflict of interest.
References
- Lambin, E.F.; Meyfroidt, P. Land use transition: Socio-ecological feedback versus socio-economic change. Land Use Policy 2010, 27, 108–118. [Google Scholar] [CrossRef]
- Long, H.L.; Qu, Y. Land use transitions and land management: A mutual feedback perspective. Land Use Policy 2017, 34, 1607–1618. [Google Scholar] [CrossRef]
- Grainger, A. The forest transition: An alternative approach. Area 1995, 27, 242–251. [Google Scholar]
- Mather, A.S.; Fairbairn, J.; Needle, C.L. The course and drivers of the forest transition: The case of France. J. Rural Stud. 1999, 15, 65–90. [Google Scholar] [CrossRef]
- Mather, A.S.; Needle, C.L. The forest transition: A theoretical basis. Area 1998, 30, 117–124. [Google Scholar] [CrossRef]
- Barbier, E.B.; Burgess, J.C.; Grainger, A. The forest transition: Towards a more comprehensive theoretical framework. Land Use Policy 2010, 27, 98–107. [Google Scholar] [CrossRef]
- Grainger, A. Difficulties in tracking the long-term global trend in tropical forestarea. Proc. Natl. Acad. Sci. USA 2008, 105, 818–823. [Google Scholar] [CrossRef] [Green Version]
- Mather, A.S. Forest transition theory and the reforesting of Scotland. Scott. Geogr. J. 2004, 120, 83–98. [Google Scholar] [CrossRef]
- Mather, A.S. Recent Asian forest transitions in relation to forest transition theory. Int. For. Rev. 2007, 9, 491–502. [Google Scholar]
- Grau, H.R.; Aide, M. Globalization and land-use transitions in Latin America. Ecol. Soc. 2008, 13, 16. [Google Scholar] [CrossRef] [Green Version]
- Yeo, I.-Y.; Huang, C. Revisiting the forest transition theory with historical records and geospatial data: A case study from Mississippi (USA). Land Use Policy 2013, 32, 1–13. [Google Scholar] [CrossRef]
- Tuan, Y.F. Geography, phenomenology and the study of human nature. Can. Geogr. 1971, 15, 181–192. [Google Scholar] [CrossRef]
- Long, H.L. Land Use Transitions and Rural Restructuring in China; Springer: Singapore, 2020. [Google Scholar]
- Song, X.Q. Discussion on land use transition research framework. Acta Geogr. Sin. 2017, 72, 471–487. [Google Scholar]
- Long, H.L.; Qu, Y.; Tu, S.S.; Zhang, Y.N.; Jiang, Y.F. Development of land use transitions research in China. J. Geogr. Sci. 2020, 30, 1195–1214. [Google Scholar] [CrossRef]
- Li, X.B. Theoretical hypotheses about agricultural land use changes and the relevant propositions about environmental impacts. Adv. Earth Sci. 2008, 23, 1124–1129. [Google Scholar]
- Long, H.L.; Heilig, G.K.; Li, X.B.; Zhang, M. Socio-economic development and land-use change: Analysis of rural housing land transition in the Transect of the Yangtse River, China. Land Use Policy 2007, 24, 141–153. [Google Scholar] [CrossRef]
- Long, H.L.; Li, T.T. The coupling characteristics and mechanism of farmland and rural housing land transition in China. J. Geogr. Sci. 2012, 22, 548–562. [Google Scholar] [CrossRef]
- Lyu, X.; Huang, X.J.; Zhang, Q.J. A literature review on urban-rural construction land transition. City Plan Rev. 2015, 39, 105–112. [Google Scholar]
- Wang, T.; Kazak, J.; Han, Q.; de Vries, B.A. framework for path-dependent industrial land transition analysis using vector data. Eur. Plan. Stud. 2019, 27, 1391–1412. [Google Scholar] [CrossRef]
- Amin, A.; Fazal, S.; Mujtaba, A.; Singh, S.K. Effects of land transformation on water quality of Dal Lake, Srinagar, India. J. Indian Soc. Remote Sens. 2014, 42, 119–128. [Google Scholar] [CrossRef]
- Asabere, S.B.; Acheampong, R.A.; Ashiagbor, G.; Beckers, S.C.; Keck, M.; Erasmi, S.; Schanze, J.; Sauer, D. Urbanization, land use transformation and spatio-environmental impacts: Analyses of trends and implications in major metropolitan regions of Ghana. Land Use Policy 2020, 96, 104707. [Google Scholar] [CrossRef]
- Liu, Y.Q.; Long, H.L. Land use transitions and their dynamic mechanism: The case of the Huang-Huai-Hai Plain. J. Geogr. Sci. 2016, 26, 515–530. [Google Scholar] [CrossRef] [Green Version]
- Ge, D.Z.; Long, H.L.; Zhang, Y.N.; Ma, L.; Li, T.T. Farmland transition and its influences on grain production in China. Land Use Policy 2018, 70, 94–105. [Google Scholar] [CrossRef]
- Ntihinyurwa, P.D.; de Vries, W.T. Farmland Fragmentation, Farmland Consolidation and Food Security: Relationships, Research Lapses and Future Perspectives. Land 2021, 10, 129. [Google Scholar] [CrossRef]
- Willy, D.K.; Muyanga, M.; Jayne, T. Can economic and environmental benefits associated with agricultural intensification be sustained at high population densities? A farm level empirical analysis. Land Use Policy 2019, 81, 100–110. [Google Scholar] [CrossRef] [PubMed]
- Qin, W.S.; Zhang, Y.F.; Li, G.D. Driving mechanism of cultivated land transition in Yantai Proper, Shandong Province, China. Chin. Geogr. Sci. 2015, 25, 337–349. [Google Scholar] [CrossRef] [Green Version]
- Wang, Q.; Li, Y.B.; Luo, G.J. Spatiotemporal change characteristics and driving mechanism of slope cultivated land transition in karst trough valley area of Guizhou Province, China. Environ. Earth Sci. 2020, 79, 1–18. [Google Scholar] [CrossRef]
- Islam, M.R.; Hassn, M.Z. Losses of agricultural land due to infrastructural development: A study on Rajshahi District. Int. J. Sci. Eng. Res. 2013, 4, 391–396. [Google Scholar]
- Francis, C.A.; Hansen, T.E.; Fox, A.A.; Hesje, P.J.; Nelson, H.E.; Lawseth, A.E.; English, A. Farmland conversion to non-agricultural uses in the US and Canada: Current impacts and concerns for the future. Int. J. Agric. Sustain. 2012, 10, 8–24. [Google Scholar] [CrossRef]
- Sun, B.; Zhou, Q.M. Expressing the spatio-temporal pattern of farmland change in arid lands using landscape metrics. J. Arid Environ. 2016, 124, 118–127. [Google Scholar] [CrossRef]
- Tan, M. The transition of farmland production functions in metropolitan areas in China. Sustainability 2014, 6, 4028–4041. [Google Scholar] [CrossRef] [Green Version]
- You, H.Y.; Hu, X.W.; Wu, Y.Z. Farmland use intensity changes in response to rural transition in Zhejiang province, China. Land Use Policy 2018, 79, 350–361. [Google Scholar] [CrossRef]
- Slee, B.; Brown, I.; Donnelly, D.; Gordon, I.J.; Matthews, K.; Towers, W. The ‘squeezed middle’: Identifying and addressing conflicting demands on intermediate quality farmland in Scotland. Land Use Policy 2014, 41, 206–216. [Google Scholar] [CrossRef]
- Shi, Y.Y.; Lyu, X.; Guo, G.C.; Gong, C. Temporal-spatial pattern and driving mechanism of cultivated land use transition based on GIS and spatial econometric model. China Land Sci. 2019, 33, 51–60. [Google Scholar]
- Fu, H.; Liu, Y.J.; Sun, H.R.; Zhou, G.L. Spatiotemporal characteristics and dynamic mechanism of cultivated land use transition in the Beijing-Tianjin-Hebei region. Prog. Geogr. 2020, 39, 27–40. [Google Scholar]
- Zhang, Y.N.; Long, H.L.; Ma, L.; Ge, D.Z.; Tu, S.S.; Qu, Y. Farmland function evolution in the Huang-Huai-Hai Plain: Processes, patterns and mechanisms. J. Geogr. Sci. 2018, 28, 759–777. [Google Scholar] [CrossRef] [Green Version]
- Zhu, Z.Q.; Kong, X.S.; Li, Y.J. Identifying the Static and Dynamic Relationships Between Rural Population and Settlements in Jiangsu Province, China. Chin. Geogr. Sci. 2020, 30, 810–823. [Google Scholar] [CrossRef]
- Jiang, P.H.; Li, M.C.; Lv, J.C. The causes of farmland landscape structural changes in different geographical environments. Total Environ. 2019, 685, 667–680. [Google Scholar] [CrossRef]
- Zhang, Z.H.; Su, S.L.; Xiao, R.; Jiang, D.W.; Wu, J.P. Identifying determinants of urban growth from a multi-scale perspective: A case study of the urban agglomeration around Hangzhou Bay, China. Appl. Geogr. 2013, 45, 193–202. [Google Scholar] [CrossRef]
- Xu, W.X.; Jin, X.; Liu, J.; Zhou, Y.K. Impact of cultivated land fragmentation on spatial heterogeneity of agricultural agglomeration in China. J. Geogr. Sci. 2020, 30, 1571–1589. [Google Scholar] [CrossRef]
- He, S.W.; Yu, S.; Li, G.D.; Zhang, J.F. Exploring the influence of urban form on land-use efficiency from a spatiotemporal heterogeneity perspective: Evidence from 336 Chinese cities. Land Use Policy 2020, 95, 104576. [Google Scholar] [CrossRef]
- Yang, X.; Tan, M.H. Changes and Relationships of Arable Land Functions in Beijing in Recent Years. J. Nat. Resour. 2014, 29, 733–743. [Google Scholar]
- Song, X.Q.; Huang, Y.; Wu, Z.F.; Ouyang, Z. Does cultivated land function transition occur in China? J. Geogr. Sci. 2015, 25, 817–835. [Google Scholar] [CrossRef]
- Song, X.Q.; Wu, Z.F.; Ouyang, Z. Route of cultivated land transition research. Geogr. Res. 2014, 33, 403–413. [Google Scholar]
- Liu, J.Z.; Fang, Y.G.; Wang, R.R. Spatio-temporal evolution characteristics and driving mechanisms of agricultural multifunctions in Shandong province. J. Nat. Resour. 2020, 35, 2901–2915. [Google Scholar]
- Wooldridge, J.M. Introductory Econometrics: A Modern Approach; Nelson Education: Toronto, ON, Canada, 2016. [Google Scholar]
- Ntihinyurwa, P.D.; de Vries, W.T. Farmland fragmentation and defragmentation nexus: Scoping the causes, impacts, and the conditions determining its management decisions. Ecol. Indic. 2020, 119, 106828. [Google Scholar] [CrossRef]
- Liu, X.L.; Wang, Y.; Li, Y.; Liu, F.; Shen, J.L.; Wang, J.; Xiao, R.L.; Wu, J.S. Changes in arable land in response to township urbanization in a Chinese low hilly region: Scale effects and spatial interactions. Appl. Geogr. 2017, 88, 24–37. [Google Scholar] [CrossRef]
- Ma, L.; Long, H.L.; Tu, S.S.; Zhang, Y.N.; Zheng, Y.H. Farmland transition in China and its policy implications. Land Use Policy 2020, 92, 104470. [Google Scholar] [CrossRef]
- Wang, X.; Shao, S.; Li, L. Agricultural inputs, urbanization, and urban-rural income disparity: Evidence from China. China Econ. Rev. 2019, 55, 67–84. [Google Scholar] [CrossRef]
- Liu, E.K.; He, W.Q.; Yan, C.R. ‘White revolution’ to ‘white pollution’—Agricultural plastic film mulch in China. Environ. Res. Lett. 2014, 9, 091001. [Google Scholar] [CrossRef] [Green Version]
- Xu, Y.Q.; McNamara, P.; Wu, Y.F.; Dong, Y. An econometric analysis of changes in arable land utilization using multinomial logit model in Pinggu district, Beijing, China. J. Environ. Manag. 2013, 128, 324–334. [Google Scholar] [CrossRef] [PubMed]
- Bucała-Hrabia, A. Long-term impact of socio-economic changes on agricultural land use in the Polish Carpathians. Land Use Policy 2017, 64, 391–404. [Google Scholar] [CrossRef]
- Ann, T.W.; Wu, Y.Z.; Zheng, B.B.; Zhang, X.L.; Shen, L.Y. Identifying risk factors of urban-rural conflict in urbanization: A case of China. Habitat Int. 2014, 44, 177–185. [Google Scholar]
- Long, H.L.; Zhang, Y.N.; Tu, S.S. Rural vitalization in China: A perspective of land consolidation. J. Geogr. Sci. 2019, 29, 517–530. [Google Scholar] [CrossRef] [Green Version]
- Qu, Y.B.; Jiang, G.H.; Li, Z.T.; Tian, Y.Y.; Wei, S.W. Understanding rural land use transition and regional consolidation implications in China. Land Use Policy 2019, 82, 742–753. [Google Scholar] [CrossRef]
- Liu, L.; Liu, Z.J.; Gong, J.Z.; Wang, L.; Hu, Y.M. Quantifying the amount, heterogeneity, and pattern of farmland: Implications for China’s requisition-compensation balance of farmland policy. Land Use Policy 2019, 81, 256–266. [Google Scholar] [CrossRef]
- Deng, Z.Q.; Zhao, Q.Y.; Bao, H.X. The Impact of Urbanization on Farmland Productivity: Implications for China’s Requisition–Compensation Balance of Farmland Policy. Land 2020, 9, 311. [Google Scholar] [CrossRef]
- Song, J.; Ye, J.T.; Zhu, E.Y.; Deng, J.S.; Wang, K. Analyzing the impact of highways associated with farmland loss under rapid urbanization. ISPRS Int. J. Geoinf. 2016, 5, 94. [Google Scholar] [CrossRef] [Green Version]
- Fu, M.C.; Hu, Z.Q.; Wu, G.G.; Deng, J.S.; Wang, C. Analysis of evolutionary law rule of farmland landscape. TXN. Chin. Soc. Agric. Eng. 2005, 6, 54–58. [Google Scholar]
Figure 1.
Location of Sihong County in the Huang-Huai-Hai Plain of China.

Figure 2.
Changes in the area of farmland (FL) in Sihong from 2009 to 2018.

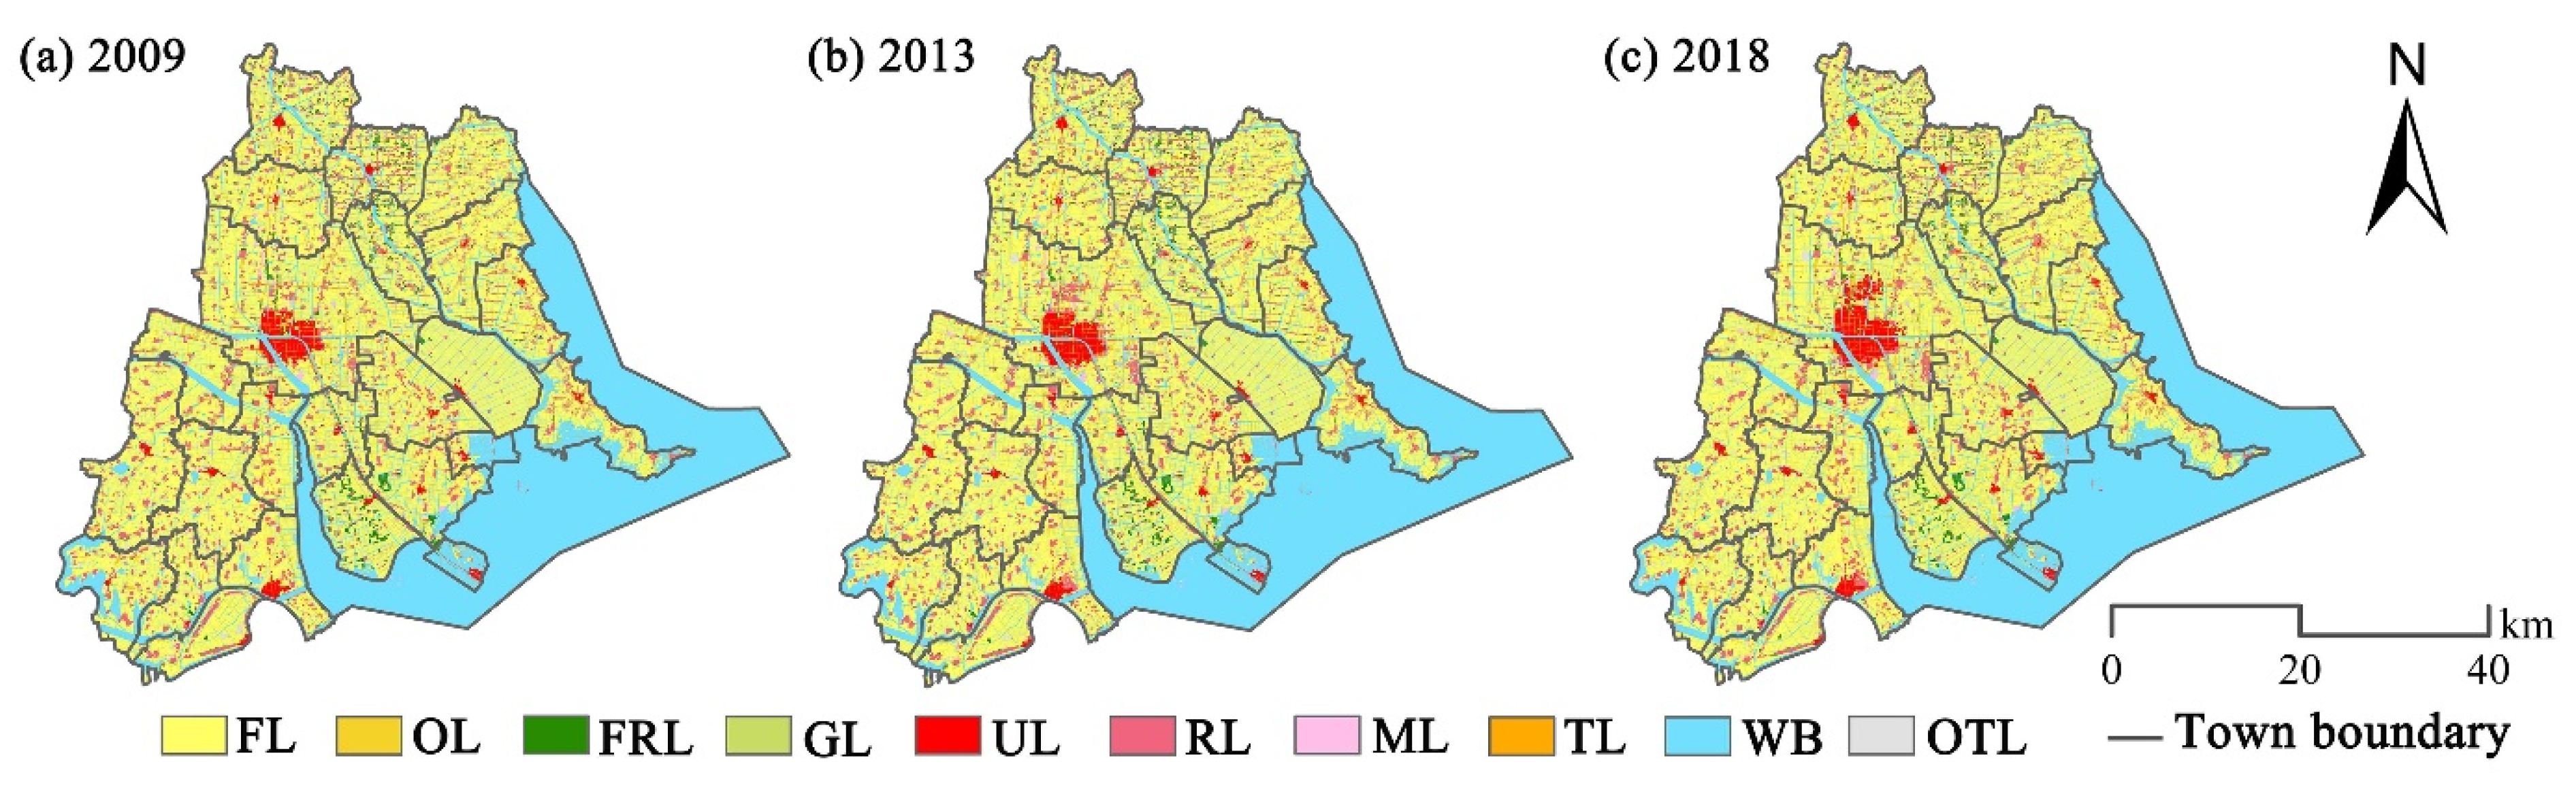
Figure 3.
The land-use patterns of Sihong in 2009 (a), 2013 (b), and 2018 (c). Note: FL, farmland; OL, orchard land; FRL, forest land; GL, grassland; UL, urban land; RL, rural residential land; ML, mining land; TL, transportation land; WB, water body; OTL, other land.
Figure 3.
The land-use patterns of Sihong in 2009 (a), 2013 (b), and 2018 (c). Note: FL, farmland; OL, orchard land; FRL, forest land; GL, grassland; UL, urban land; RL, rural residential land; ML, mining land; TL, transportation land; WB, water body; OTL, other land.

Figure 4.
Land use conversion flows in Sihong during 2009–2013 (a), 2013–2018 (b), and 2009–2018 (c). The sizes of the lines are proportional in width to the contributions of each land-use type to the change.
Figure 4.
Land use conversion flows in Sihong during 2009–2013 (a), 2013–2018 (b), and 2009–2018 (c). The sizes of the lines are proportional in width to the contributions of each land-use type to the change.

Figure 5.
Changes in the PD (a), MPS (b), and AI (c) of farmland in Sihong from 2009 to 2018.

Figure 6.
The spatial patterns of farmland for PD, MPS, and AI in Sihong at the town level in 2009, 2013, and 2018.
Figure 6.
The spatial patterns of farmland for PD, MPS, and AI in Sihong at the town level in 2009, 2013, and 2018.

Figure 7.
Changes in the farmland function in Sihong from 2009 to 2018.

Figure 8.
The spatial patterns of farmland use functions in Sihong at the town level in 2009, 2013, and 2018.
Figure 8.
The spatial patterns of farmland use functions in Sihong at the town level in 2009, 2013, and 2018.


Table 1.
Description of the three indicators to measure farmland landscape patterns.
| Metrics | Formula | Description |
|---|---|---|
| Patch density (PD) | (unit: N/ha) | n = number of farmland patches; A = total landscape area (ha); |
| Mean patch size (MPS) | (unit: ha) | ai = area (ha) of farmland patch i; n = number of farmland patches; |
| Aggregation index (AI) | (unit: Percent) | gii = number of like adjacencies (joins) between pixels of farmland patches (class) i based on the single-count method. max→gii = maximum number of like adjacencies (joins) between pixels of farmland patches (class) i based on the single-count method. |
Table 2.
The evaluation indexes of farmland functions.
| Functional Classification | Index | Unit | Direction | Index Calculation Method | Weight |
|---|---|---|---|---|---|
| Crop production | Grain production | kg/hm2 | + | Grain yield/farmland area | 0.483 |
| Vegetable production | kg/hm2 | + | Total yield of vegetables (including vegetable melons)/farmland area | 0.316 | |
| Melon and fruit production | kg/hm2 | + | The total yield of melons (fruit melons)/farmland area | 0.104 | |
| Oilseed production | kg/hm2 | + | Total oilseed production (peanut and rapeseed)/farmland area | 0.097 | |
| Living security function | Per capita grain | kg/person | + | Grain yield/permanent resident population | 0.317 |
| Per capita farmland area | hm2/person | + | Farmland area/permanent resident population | 0.401 | |
| The proportion of employees in the plantation industry | — | + | Number of employees in plantation/number of rural employees | 0.282 | |
| Eco-environmental function | Agricultural fertilizer use intensity | kg/hm2 | − | Chemical fertilizer consumption/farmland area | 0.350 |
| Pesticide use intensity | kg/hm2 | − | Pesticide consumption/farmland area | 0.322 | |
| The intensity of agricultural plastic film use | kg/hm2 | − | Plastic film consumption/farmland area | 0.328 |
Table 3.
The regression analysis results for the morphology of farmland and the driving factors in Sihong in 2009, 2013, and 2018.
Table 3.
The regression analysis results for the morphology of farmland and the driving factors in Sihong in 2009, 2013, and 2018.
| Factors | Dominant Morphologies | Functional Morphologies | |||||
|---|---|---|---|---|---|---|---|
| Area | PD | MPS | AI | F (crop) | F (living) | F (ecol) | |
| El | 0.248 ** | −0.539 *** | 0.699 *** | 0.127 | −0.636 *** | 0.126 | −0.028 |
| Slp | 0.030 | −0.291 *** | 0.252 *** | 0.363 *** | −0.05 | −0.093 | 0.052 |
| lnPd | 0.185 | −0.438 *** | 0.385 *** | 0.111 | −0.437 *** | −0.297 ** | 0.342 ** |
| Urp | −0.312 ** | 0.465 *** | −0.383 *** | −0.195 | 0.399 *** | −0.492 *** | 0.332 ** |
| lnPgdp | −0.347 | 0.013 | 0.046 | 0.372 * | −0.088 | −0.325 | 0.863 *** |
| lnFi | −0.103 | 0.214 | −0.299 * | −0.773 *** | 0.436 ** | 0.064 | −0.628 ** |
| Stp | 0.096 | −0.32 ** | 0.186 | 0.13 | −0.053 | 0.142 | −0.363 * |
| Rd | −0.425 *** | 0.414 *** | −0.588 *** | −0.758 *** | −0.146 | −0.148 | −0.562 *** |
| Lci | 0.929 *** | 0.071 | 0.169 | 0.604 *** | −0.247 | 0.196 | −0.241 |
| R2 | 0.452 | 0.602 | 0.781 | 0.598 | 0.683 | 0.455 | 0.380 |
| Adjusted R2 | 0.368 | 0.562 | 0.748 | 0.536 | 0.635 | 0.371 | 0.285 |
| F | 5.403 *** | 10.707 *** | 23.372 *** | 9.736 *** | 14.118 *** | 5.464 *** | 4.017 *** |
Note: * Significant at a 10% level; ** Significant at a 5% level; *** Significant at a 1% level. El, Elevation; Slp, Slope; Pd, Population density; Urp, Urbanization rate of population; Fi, Farmers’ net income; Pgdp, Per capita GDP; Stp, The total proportion of secondary and tertiary industry output value; Rd, Road density; Lci, The quantitative data of land consolidation projects.
Publisher’s Note: MDPI stays neutral with regard to jurisdictional claims in published maps and institutional affiliations. |
© 2021 by the authors. Licensee MDPI, Basel, Switzerland. This article is an open access article distributed under the terms and conditions of the Creative Commons Attribution (CC BY) license (http://creativecommons.org/licenses/by/4.0/).
Share and Cite
MDPI and ACS Style
Lyu, L.; Gao, Z.; Long, H.; Wang, X.; Fan, Y. Farmland Use Transition in a Typical Farming Area: The Case of Sihong County in the Huang-Huai-Hai Plain of China. Land 2021, 10, 347. https://doi.org/10.3390/land10040347
AMA Style
Lyu L, Gao Z, Long H, Wang X, Fan Y. Farmland Use Transition in a Typical Farming Area: The Case of Sihong County in the Huang-Huai-Hai Plain of China. Land. 2021; 10(4):347. https://doi.org/10.3390/land10040347
Chicago/Turabian StyleLyu, Ligang, Zhoubing Gao, Hualou Long, Xiaorui Wang, and Yeting Fan. 2021. "Farmland Use Transition in a Typical Farming Area: The Case of Sihong County in the Huang-Huai-Hai Plain of China" Land 10, no. 4: 347. https://doi.org/10.3390/land10040347
Note that from the first issue of 2016, this journal uses article numbers instead of page numbers. See further details here.