
Multi-Level Decision Support System in Production and Safety Management


1
LUM Enterprise S.r.l., S.S. 100-Km.18, Parco il Baricentro, 70010 Bari, Italy
2
Dipartimento di Management, Finanza e Tecnologia, LUM—Libera Università Mediterranea “Giuseppe Degennaro”, S.S. 100-Km.18, Parco il Baricentro, 70010 Bari, Italy
Knowledge 2022, 2(4), 682-701; https://doi.org/10.3390/knowledge2040039
Submission received: 27 October 2022
/
Revised: 25 November 2022
/
Accepted: 7 December 2022
/
Published: 9 December 2022
Abstract
:The proposed paper introduces an innovative approach based on the implementation of a multi-level Decision Support System (DSS) modelling processes in the industry. Specifically, the work discusses a theoretical Process Mining (PM) DSS model gaining digital knowledge by means of logics that are able to select the best decisions. The PM model is applied to an open dataset simulating a working scenario and defining a possible safety control method based on the risk assessment. The application of the PM model provides automatic alerting conditions based on a threshold of values detected by sensors. Specifically, the PM model is applied to worker security systems characterized by the environment with a risk of emission of smoke and gases. The PM model is improved by Artificial Intelligence (AI) algorithms by strengthening information through prediction results and improving the risk analysis. An Artificial Neural Network (ANN) MultilaLayer Perceptron (MLP) algorithm is adopted for the risk prediction by achieving the good computational performance of Mean Absolute Error (MAE) of 0.001. The PM model is first sketched by the Business Process Modelling and Notation (BPMN) method, and successively executed by means of the Konstanz Information Miner (KNIME) open source tool, implementing the process-controlling risks for different working locations. The goal of the paper is to apply the theoretical PM model by means of open source tools by enhancing how the multi-level approach is useful for defining a security procedure to control indoor worker environments. Furthermore, the article describes the key variables able to control production and worker safety for different industry sectors. The presented DSS PM model also can be applied to industry processes focused on production quality.
1. Introduction
Process mapping is a useful approach to optimize production, quality and security across an entire supply chain scenario. In particular, Artificial Intelligence (AI) engines provide further improvements to decision making processes by gaining knowledge and tailoring operation processes: the prediction of variables allows for the addition of information, thus optimizing decisions over the medium and long term. The modelled processes improved by AI are named Process Mining (PM) models [1,2,3]. The union of PM together with AI constitutes a Decision Support System (DSS) system, which is able to predict process quality [4] and worker risks (for example analyzing air quality [5]), and to manage human resources [6]. Business Process Modelling and Notation (BPMN) is a versatile approach for mapping processes as workflows. BPMN is adopted in different applications’ explaining and simulating processes, both for predictive maintenance [7] and for data flow in information systems [8]. Advanced PM models can be sketched by means of BPMN workflows, integrating intelligent logics and AI algorithms, thereby structuring a DSS [9]. A DSS implementing a multi-level logic can be a good solution to improve the efficacy of the monitoring processes regarding health scenarios integrating Artificial Neural Network (ANN) MultiLayer Perceptron (MLP) predictive algorithms [10], as well as for predictive maintenance applications [11]. The literature provides a classic definition of “Process Mining” as an analytical discipline for discovering, monitoring, and improving processes. The paper introduces a new definition of “Process Mining” as the discipline for discovering, monitoring, and improving processes by means of a multi-level DSS behaving as a decision-making engine based on AI algorithms. The DSS allows for the strengthening of the knowledge gain of the industry. The analyzed literature suggests the use of the BPMN tool to sketch an innovative PM workflow oriented, in general, on industry production and, more specifically, on the monitoring and control of worker environments. By considering these goals, the paper is structured according to the following steps:
- A block diagram of a “proof of concept” of PM based on the implementation of a DSS operating on different risk levels is formulated.
- The “proof of concept” of the PM model by a BPMN diagram by simplifying the DSS into three levels is detailed.
- The PM model is applied to a process monitoring risks in worker environments, by processing sensor data and by visualizing graphical risk dashboards.
- Different scenarios suitable for the application of the PM model in production quality assessment and in security process in industry sectors by defining the most important key variables to control are discussed.
The contribution of the paper is to provide a new PM theoretical model based on the concept of a DSS operating at different levels, where each level characterizes an alerting condition. The alerting condition defines a risk level: the first risk level (Level 1) is a minor danger condition; the second risk level (Level 2) is more dangerous, and so on (the last, Level n, is the most dangerous). The PM-DSS multi-level model can be used mainly to classify interventions to perform when an alerting level is enabled. The PM multi-level model can be applied to control the production or safety in industrial processes. More details about the multi-level model are provided in Section 2. In order to explain the model mechanisms, the article discusses an example of safety control in working environments. The topics discussed in the paper are significant for digital transformation of companies. Table 1 summarizes typical problems encountered by the digital transformation process by industries, as well as current solutions, and the aspects of originality introduced in the article.
2. Materials and Methods: Process Mining (PM) Model Implementing a Multi-Level DSS Engine
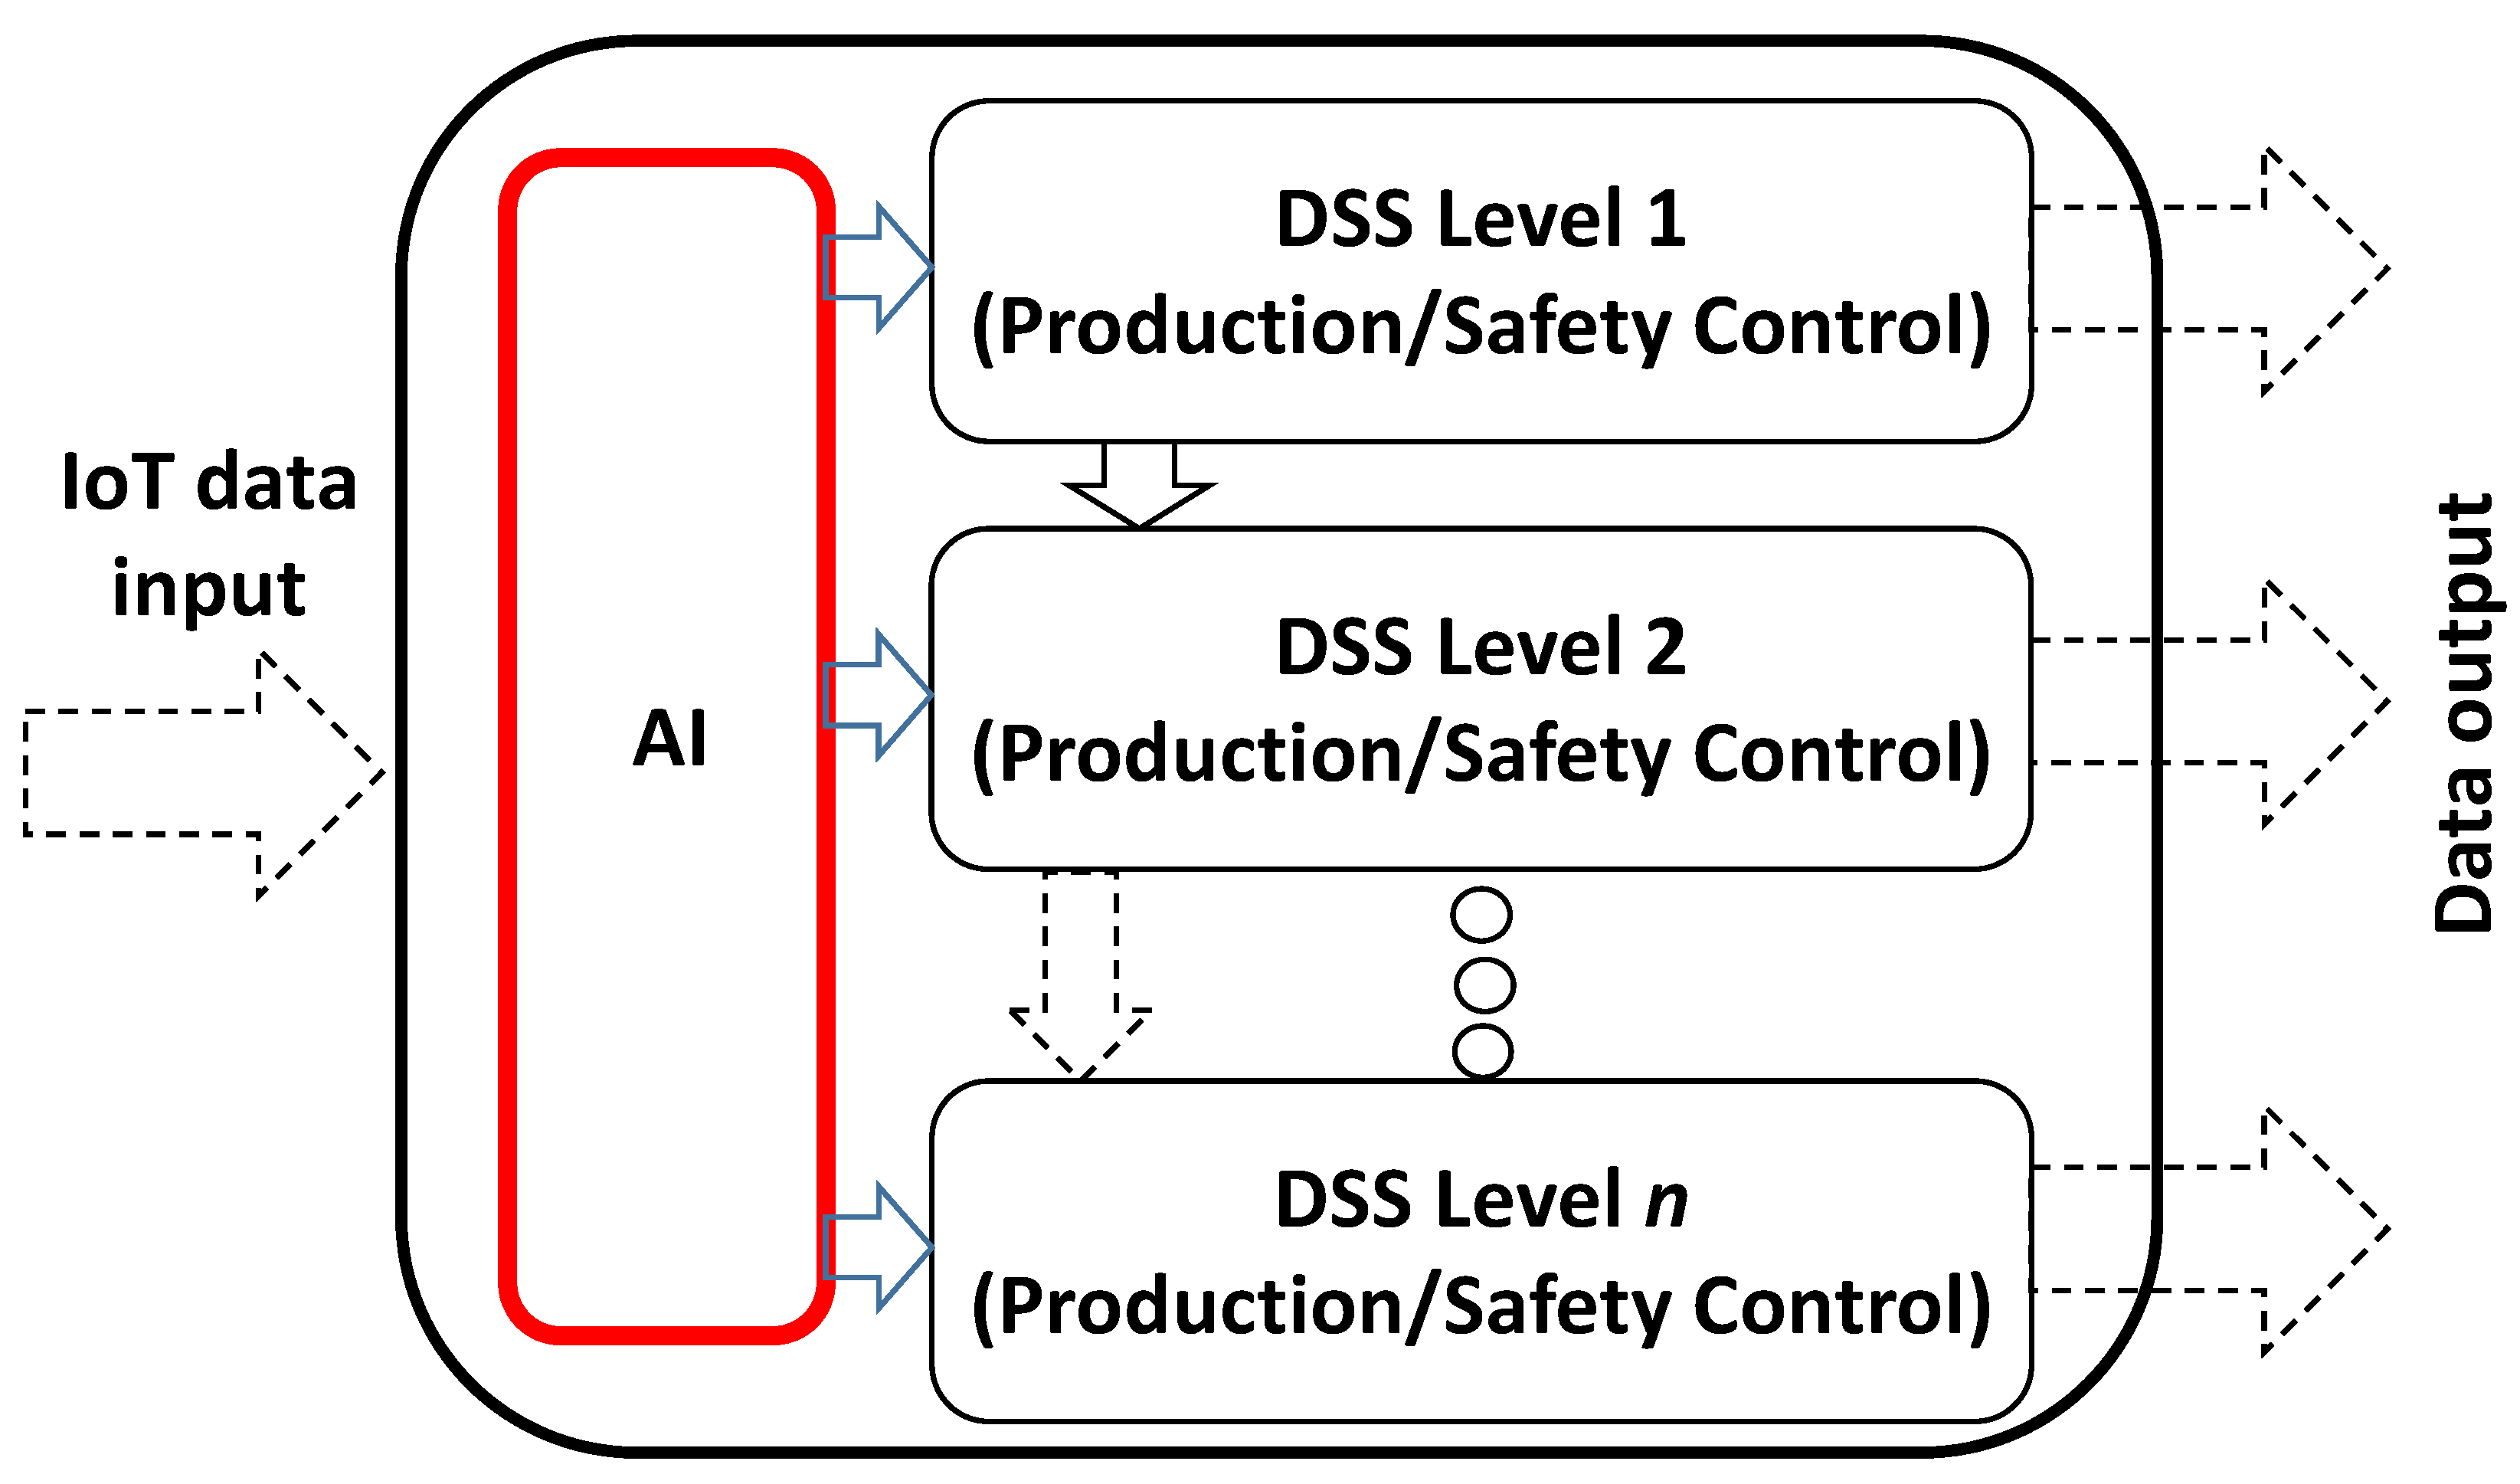
Figure 1 shows the block diagram of the “proof of concept” of the proposed PM multi-level model integrating DSS. The DSS is structured to operate on different data processing levels (n generic levels, depending on the variable to process and on the logic conditions to implement), representing a specific decision-making process. AI algorithms are applied in the main process to control the production and the safety conditions of the working environment, thus gaining knowledge. The inputs of the model are data detected by IoT sensors. The data output of the PM model defines the possible alerting conditions and the procedures to adopt.
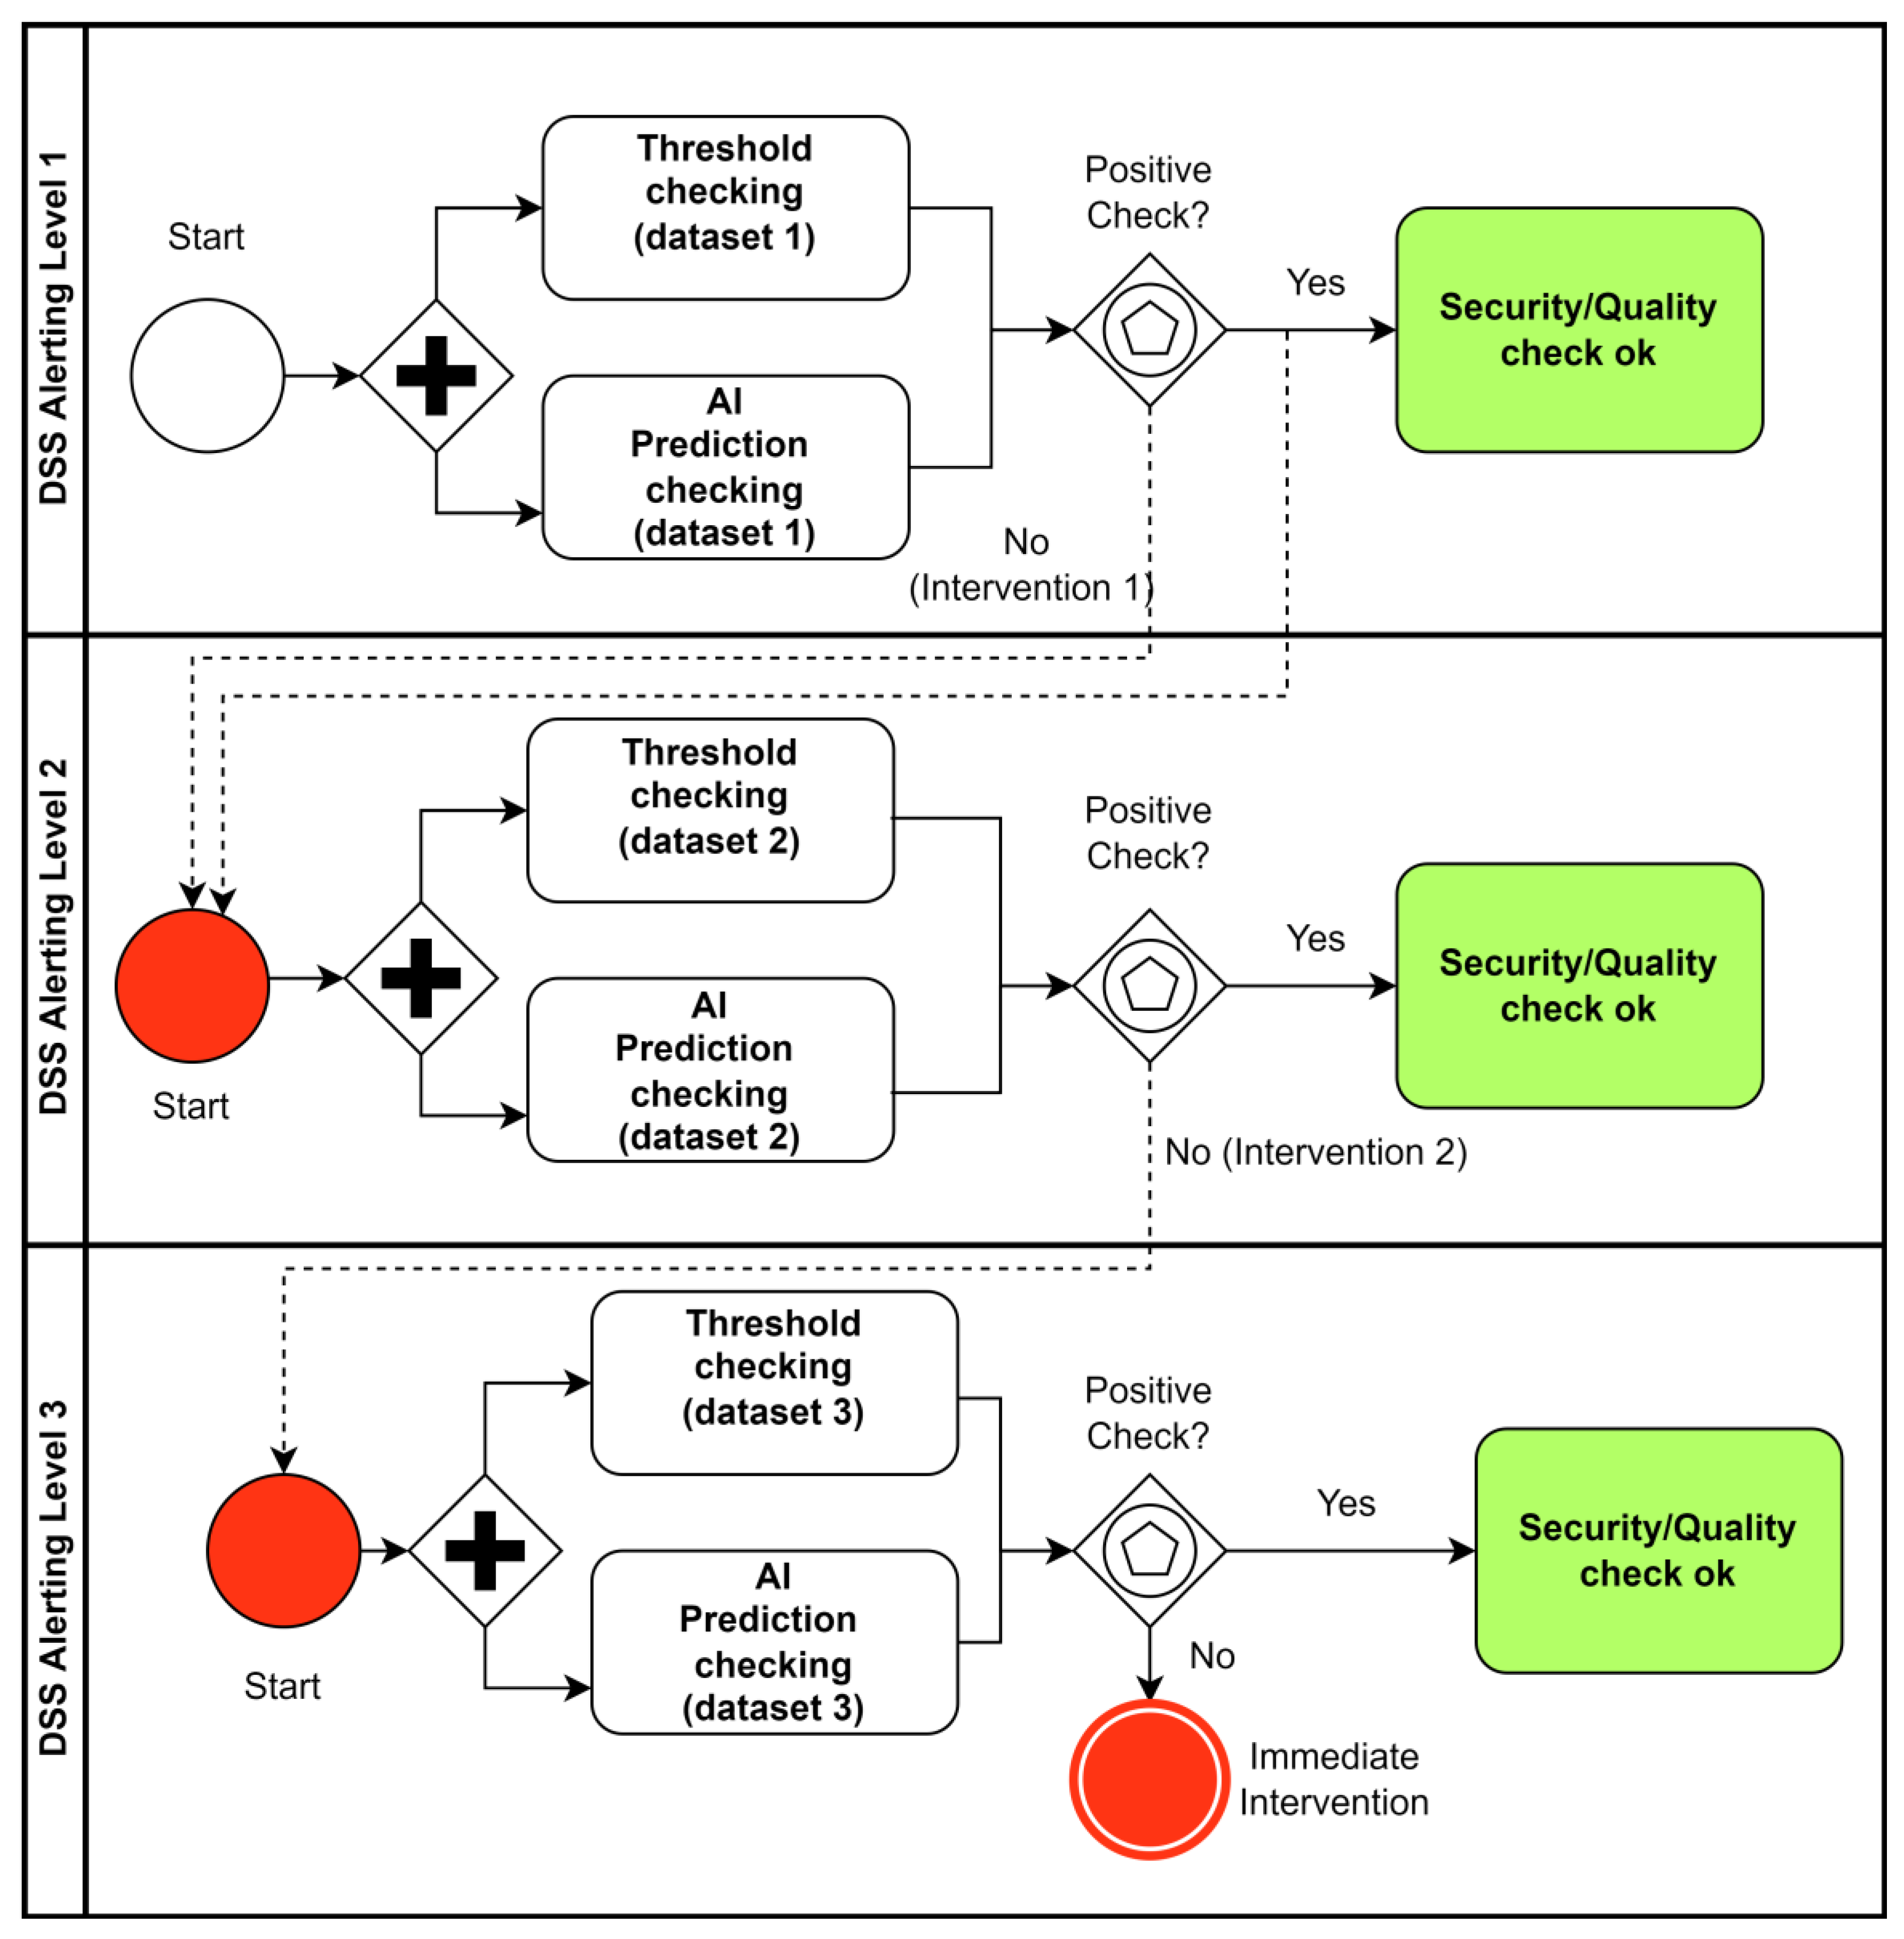
The BPMN method is used to describe the PM diagram of Figure 1 in detail by explaining all the process flows. The tool adopted for the BPMN model of Figure 2 is the open source Draw.io tool [12], having the BPMN symbols available as libraries (BPMN 2.0 downloadable plugin). The symbols to represent the PM workflow of Figure 1 are mainly pools containing sub-processes, tasks (symbols as rectangular boxes), start and stop events, and gateways structuring decisional logics (by means of exclusive event based gateways behaving as decision-making objects) and actions of process splitting (by means of parallel gateways). The BPMN workflow of Figure 2 sketches a model based on three DSS levels, and it is structured by the following elements:
- DSS Alerting Level 1. This sub-workflow represents the first level of the whole PM model. The first alerting level is constituted by a first DSS based on the simultaneous analysis (parallel gateway), threshold check (detection of alert conditions in the short period), and AI prediction supporting the risk evaluation over the medium or long period. The processed dataset is the IoT input dataset or an extraction of the original dataset obtained by filtering the most relevant attributes. The logic condition is modelled by the ‘Exclusive Event Based’ symbol: for a positive check of the monitored variables (values do not overcoming specific thresholds), the production quality (or the security condition) is guaranteed and no interventions are required. Besides, in a negative case, the system provides a first alerting condition, enabling interventions (intervention type 1 named “Intervention 1”), and data are processed in the second DSS level (pool named “DSS Alerting Level 2”), providing more details about worker risks (higher level of the risk). Additionally, in the case of a positive check, for an additional security, the second sub-workflow of Level 2 can be executed.
- DSS Alerting Level 2. This workflow includes the ‘AND’ logic condition between true results of the DSS Alerting Level 1 and other variables. For a positive check of the monitored variables not overcoming specific thresholds, the process is secure. Besides, for a negative case, the system provides a second alerting condition addressing specific interventions (intervention type 2 named “Intervention 2”), and data are processed in the third level DSS analysis (pool named “DSS Alerting Level 3”).
- DSS Alerting Level 3. This last workflow has the same structure of the previous DSS workflows. The final dashboard indicates the entire summary of the results, as well. If the third level also indicates a risk, an immediate intervention is executed (very dangerous risk condition characterized by a higher risk level).
Figure 2.
PM BPMN model describing the “proof of concept” of Figure 1 by considering three DSS levels (model simplified).
Figure 2.
PM BPMN model describing the “proof of concept” of Figure 1 by considering three DSS levels (model simplified).

The execution of the theoretical PM model of Figure 2 is performed by developing the Konstanz Information Miner (KNIME) workflows [13,14]. The KNME workflows are applied to the open dataset of [15] concerning an IoT application (see in Appendix A more details of the analyzed dataset). The open dataset [15] is hypothesized to be acquired into a generic working environment, allowing for a simulation of scenarios of possible risk conditions.
3. Results: Example of PM Application is Safety Management
This section discusses the application of the PM model of Figure 2 by processing the dataset [15] (see Appendix A). The dataset contains the variables which potentially have a major weight concerning worker security, such as carbon monoxide emission (co), liquid petroleum gas (lpg) emission, and the presence of smoke (smoke), indicating a generic malfunction of the plant. The KNIME workflow is executed to implement logic conditions of the three DSS levels and the ANN-MLP algorithm is applied to predict the alerting condition.
3.1. KNIME Model Implementing a Three DSS Level Based on Logic Conditions
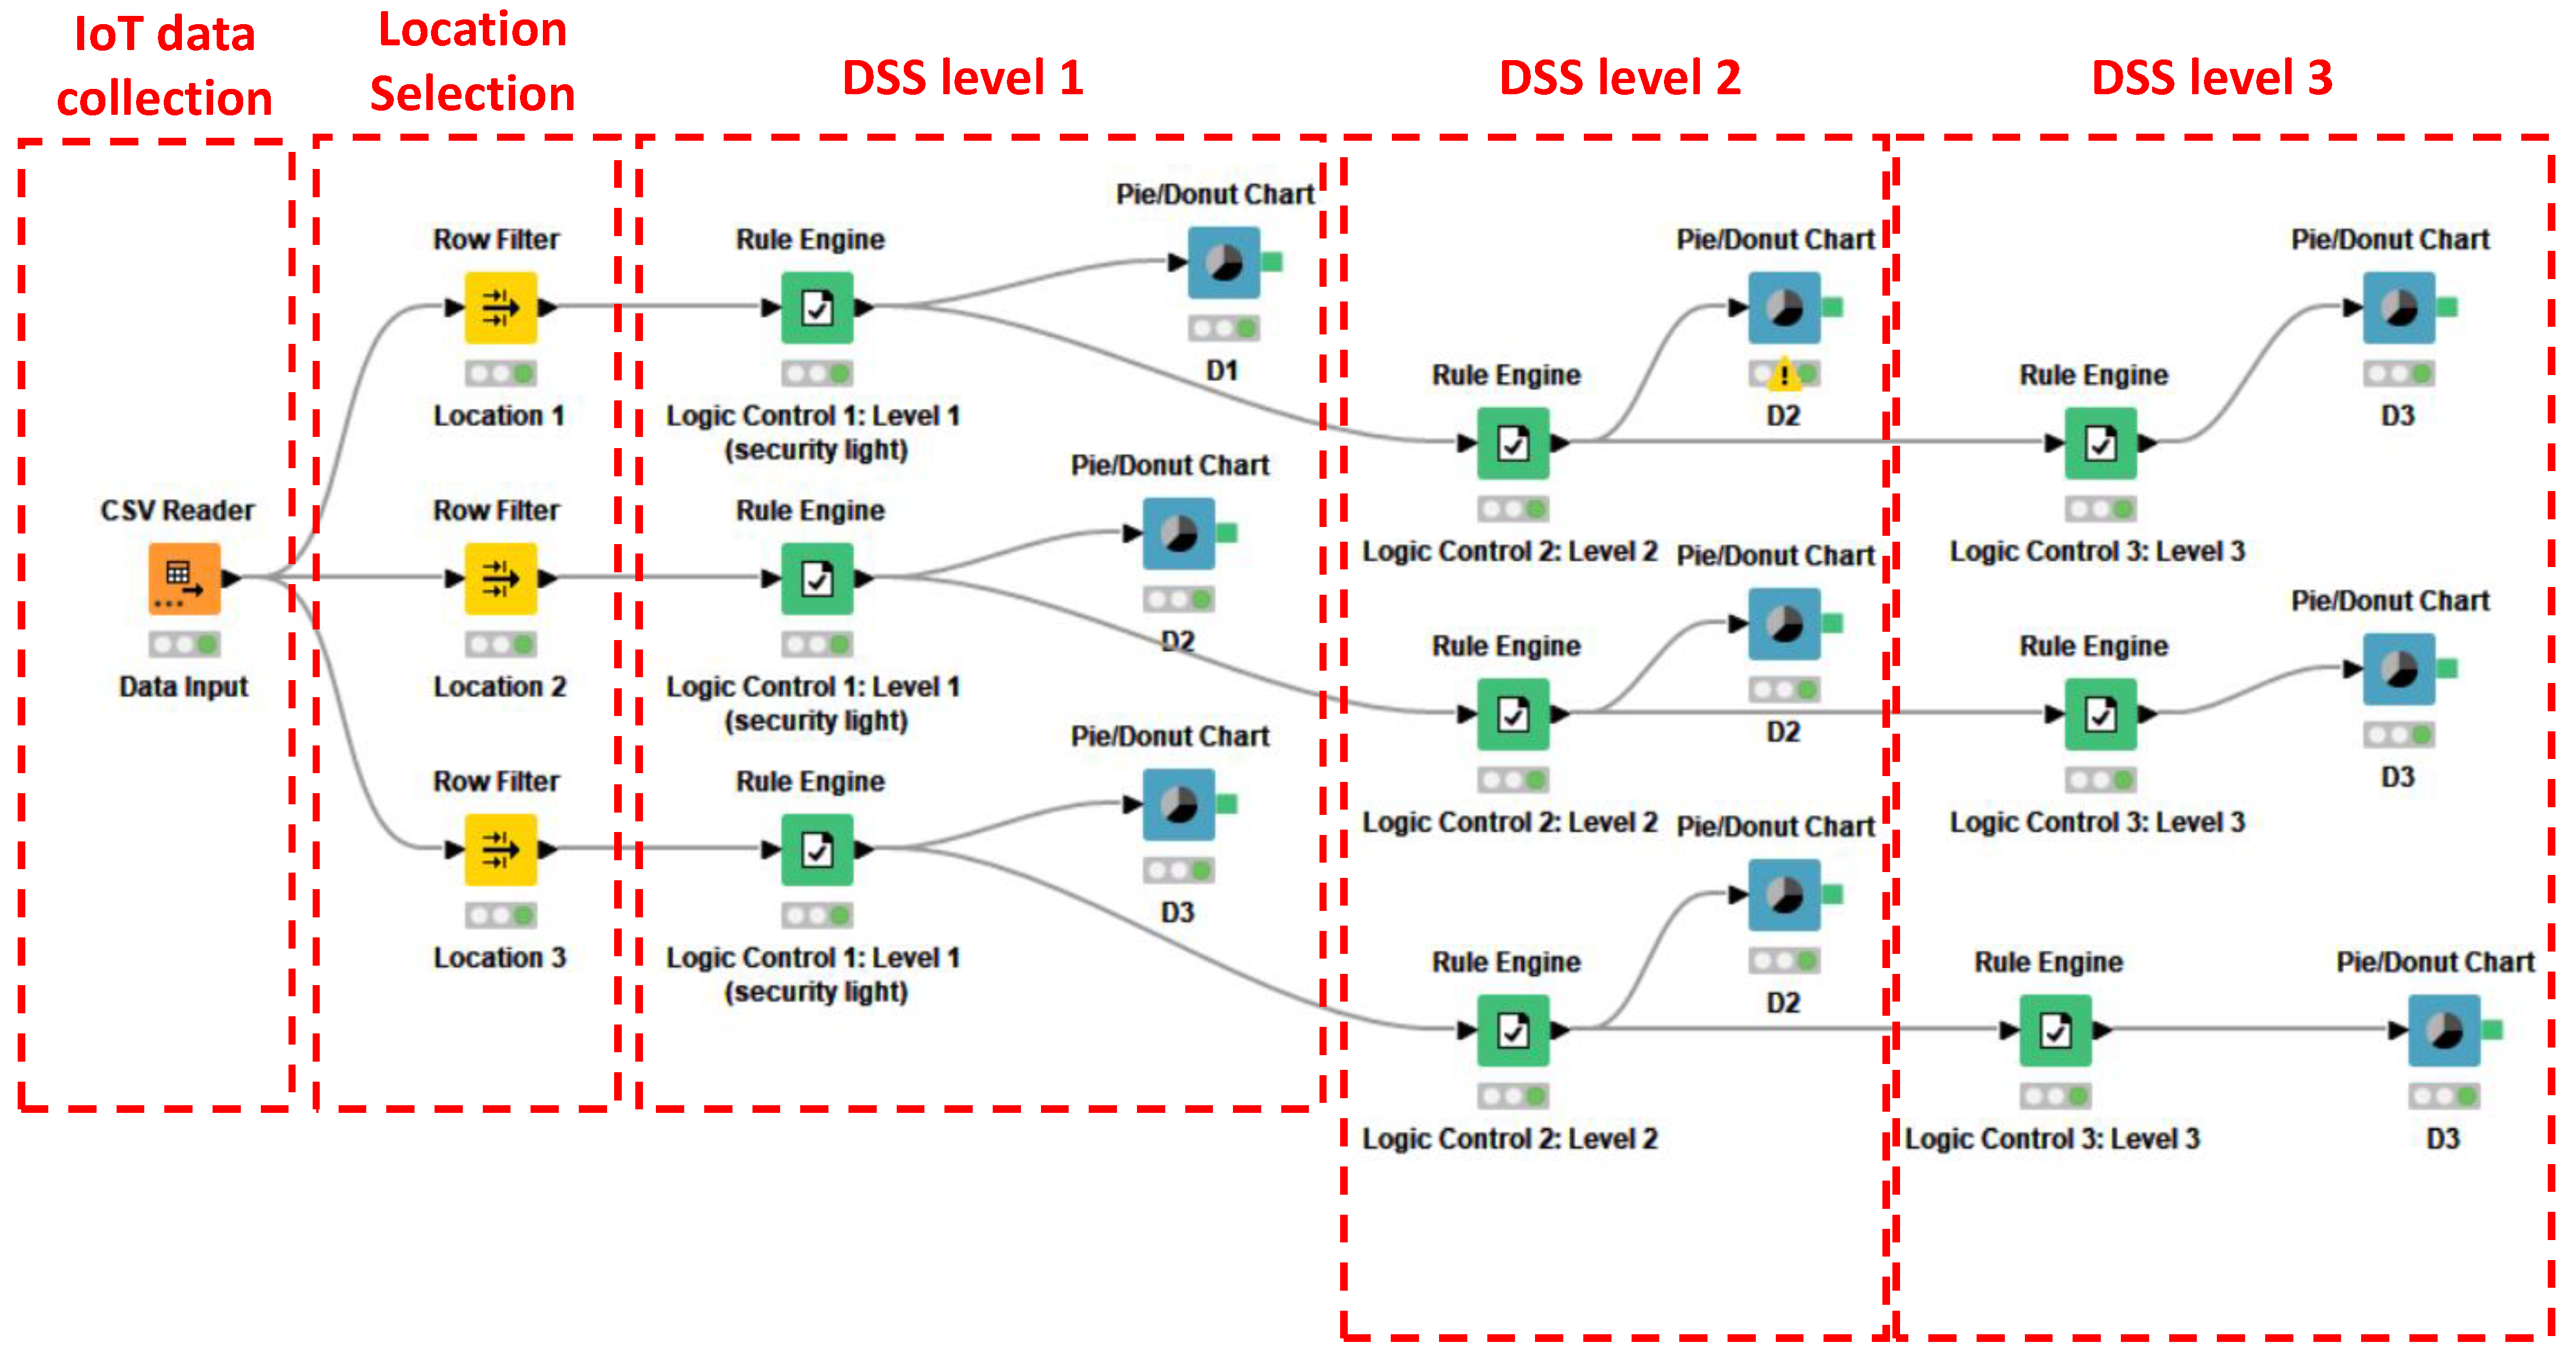
This workflow of Figure 3 ‘translates’ the scheme of Figure 2 by using KNIME blocks. Two different KNIME workflows model the logic conditions (threshold checking action) and the ANN-MLP prediction (AI prediction checking), respectively. The three DSS levels are connected in series by linking the following elements (named KNIME blocks):
- CSV Reader: the dataset [15] is imported in the local repository to be processed by the other blocks;
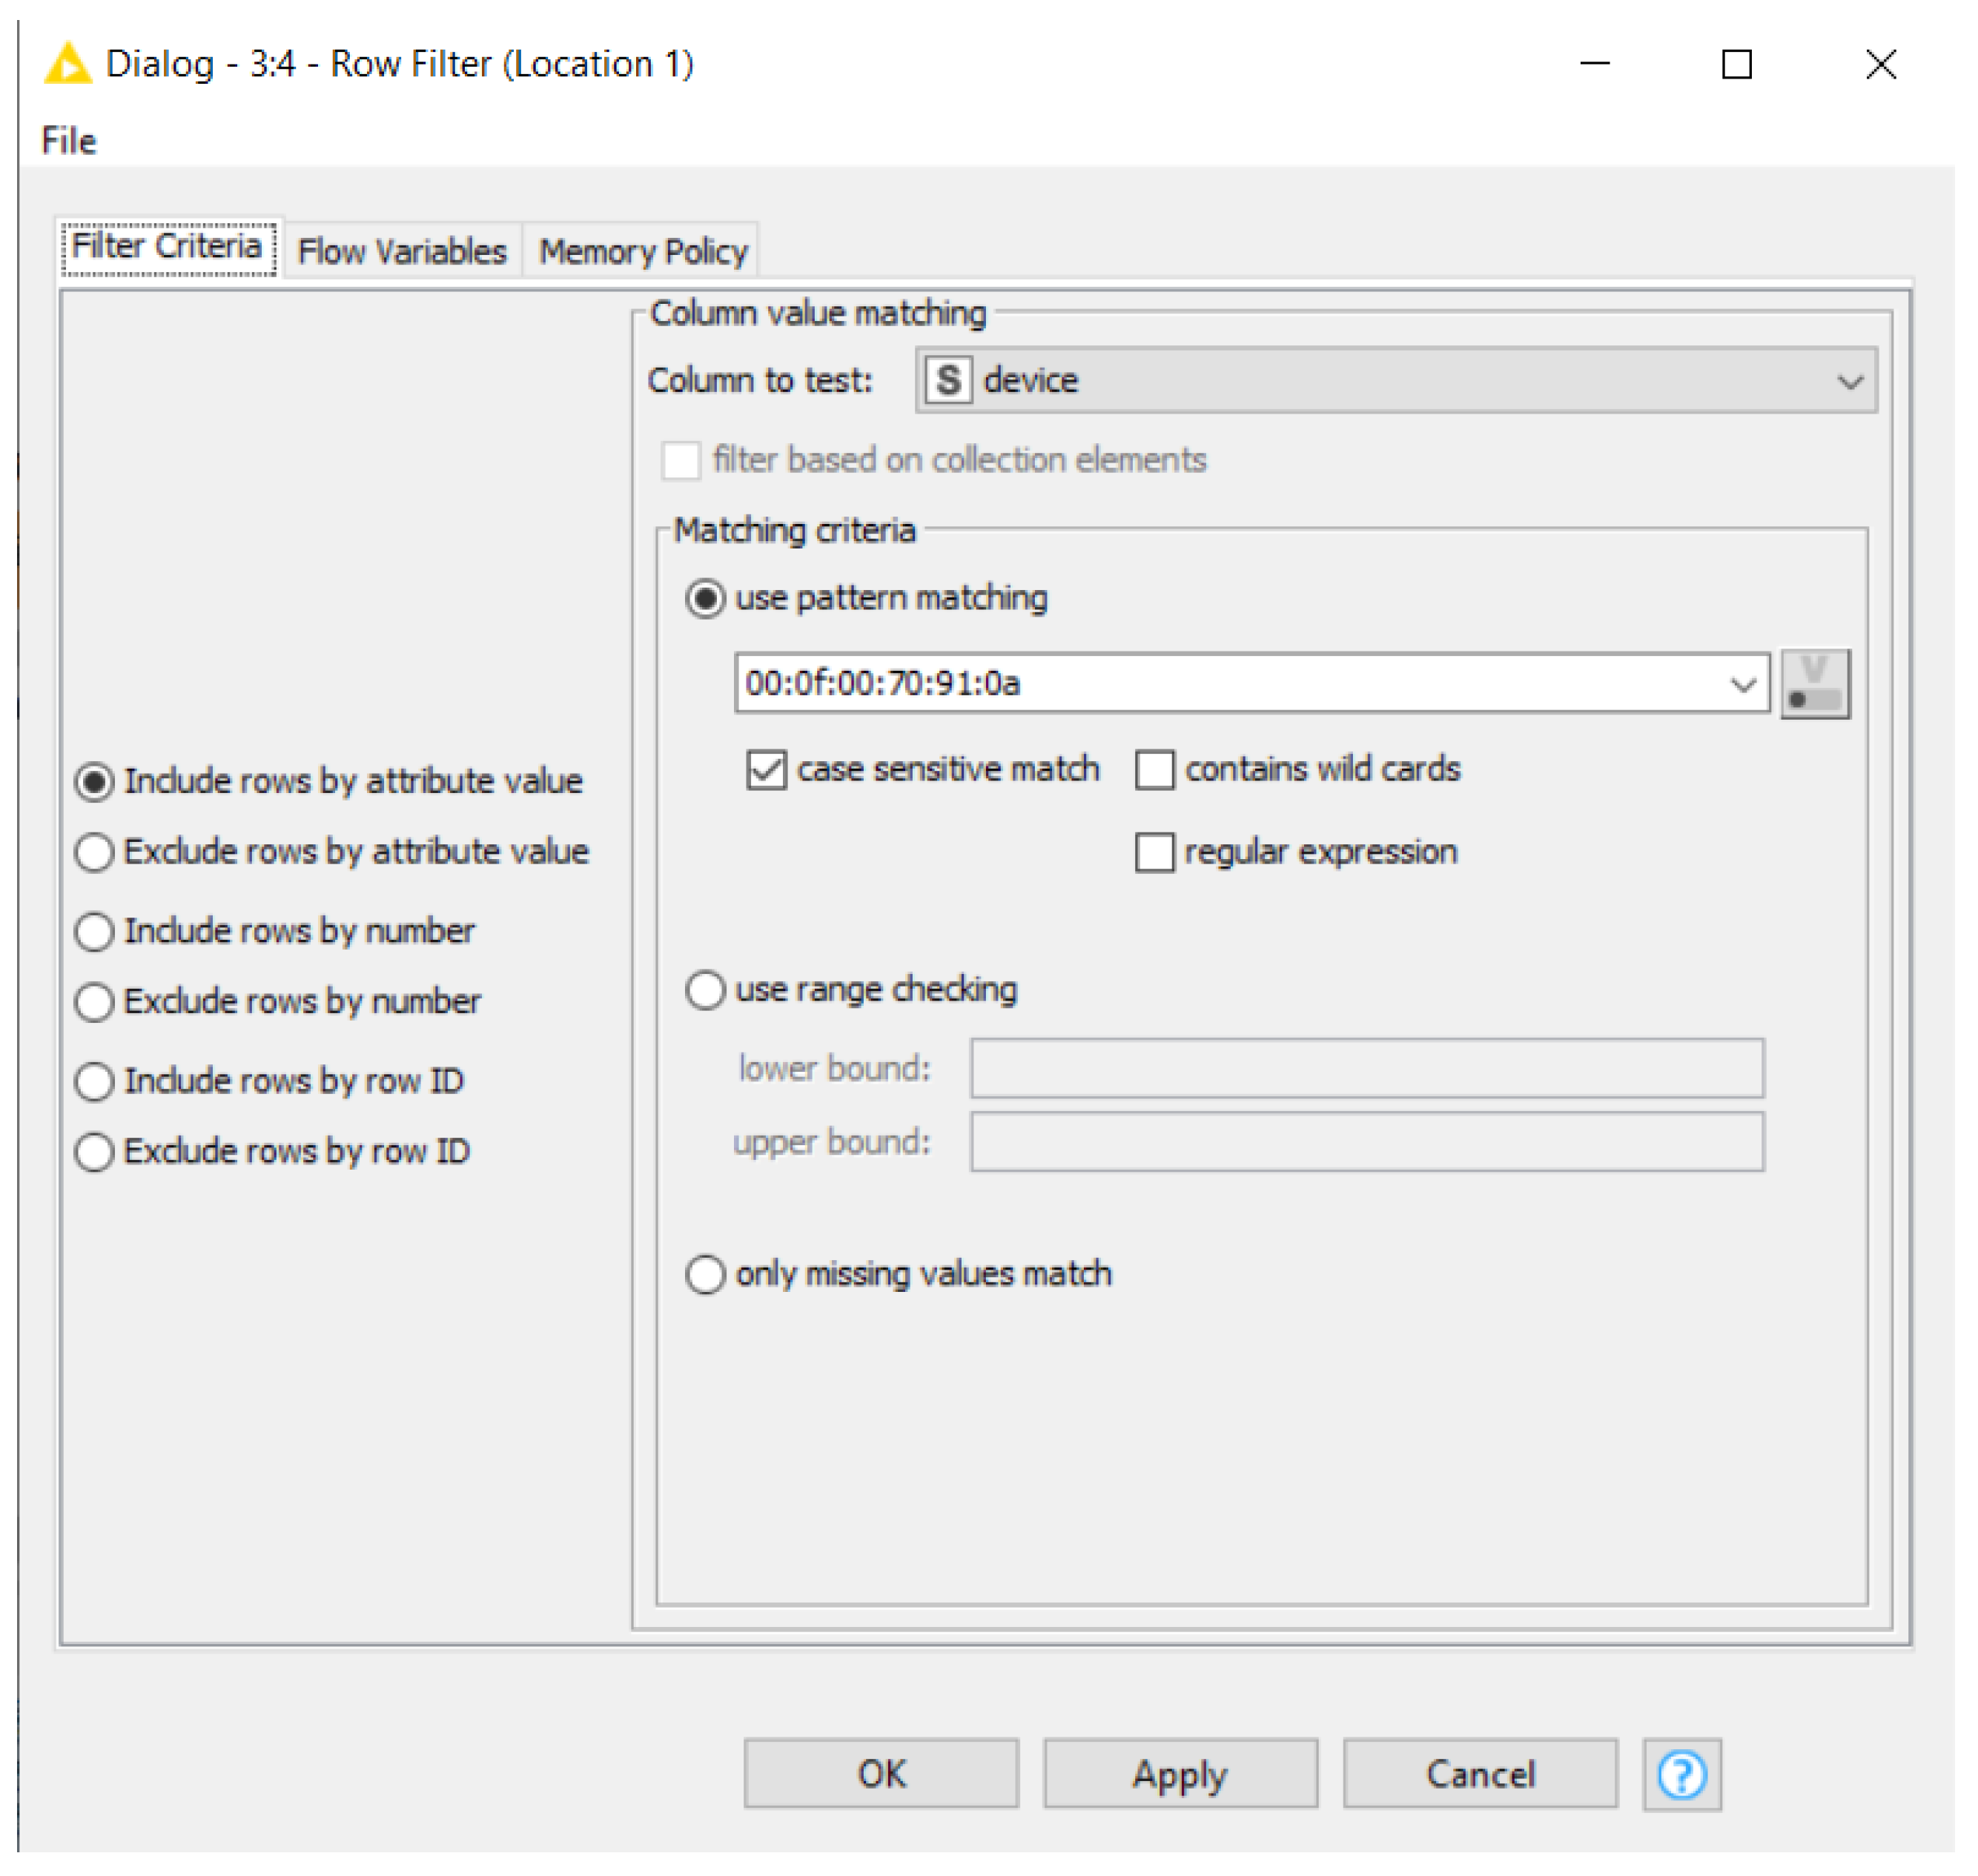
- Row filter: three IoT electronic boards are located in three different work environments (location 1, location 2, and location 3) where the production plant parts are located; each ‘Row Filter’ will select the sensor data of the specific location;
- Role Engine (DSS level 1): the Exclusive Event Based gateway is modelled by this block, enabling logic control of the first level (“DSS Alerting Level 1” of Figure 1); in this case, the basic secure condition is that the light is switched on for the three locations (in the negative case the first alerting condition is enabled, “Alert 1”);
- Pie/Donut Chart: pie charts are used as dashboards for all of the levels;
- Role Engine (DSS level 2): these blocks implement the second logic control (“DSS Alerting Level 2” of Figure 2); the logic condition activates the alerting condition (“Alert 2”) when “Alert 1” AND variable smoke > = 0.02 is True;
- Role Engine (DSS level 3): these blocks implement the third logic control (DSS Alerting Level 3 of Figure 2); the logic condition enabling the final alerting condition (“Alert 3”) is when “Alert 2” AND variable co > = 0.005 AND variable lpg > = 0.008 are True.
The main block configurations (pseudocodes and parameters) are listed in Appendix A.
Figure 3.
KNIME workflow model based on threshold checking and implementing three-DSS levels for worker safety control. The workflow executes the open dataset [15]. The horizontal flux of the KNIME workflows model the vertical BPMN structure of Figure 2.

The implemented logic conditions represent a simulating scenario of working environments with production machines emitting smoke and gases in case of malfunctions. The logic rules are based on the following criteria:
- The first level of alert is the checking of lighting (first condition guaranteeing a basic security level).
- The second level of alert is when the light is switched off and, simultaneously, the smoke variable overcomes a specified threshold (0.02 ppm %).
- The third level of alert (most dangerous condition) is when the second level condition and the carbon monoxide and liquid petroleum gas overcoming specific thresholds are simultaneously checked (0.005 ppm % and 0.008, respectively).
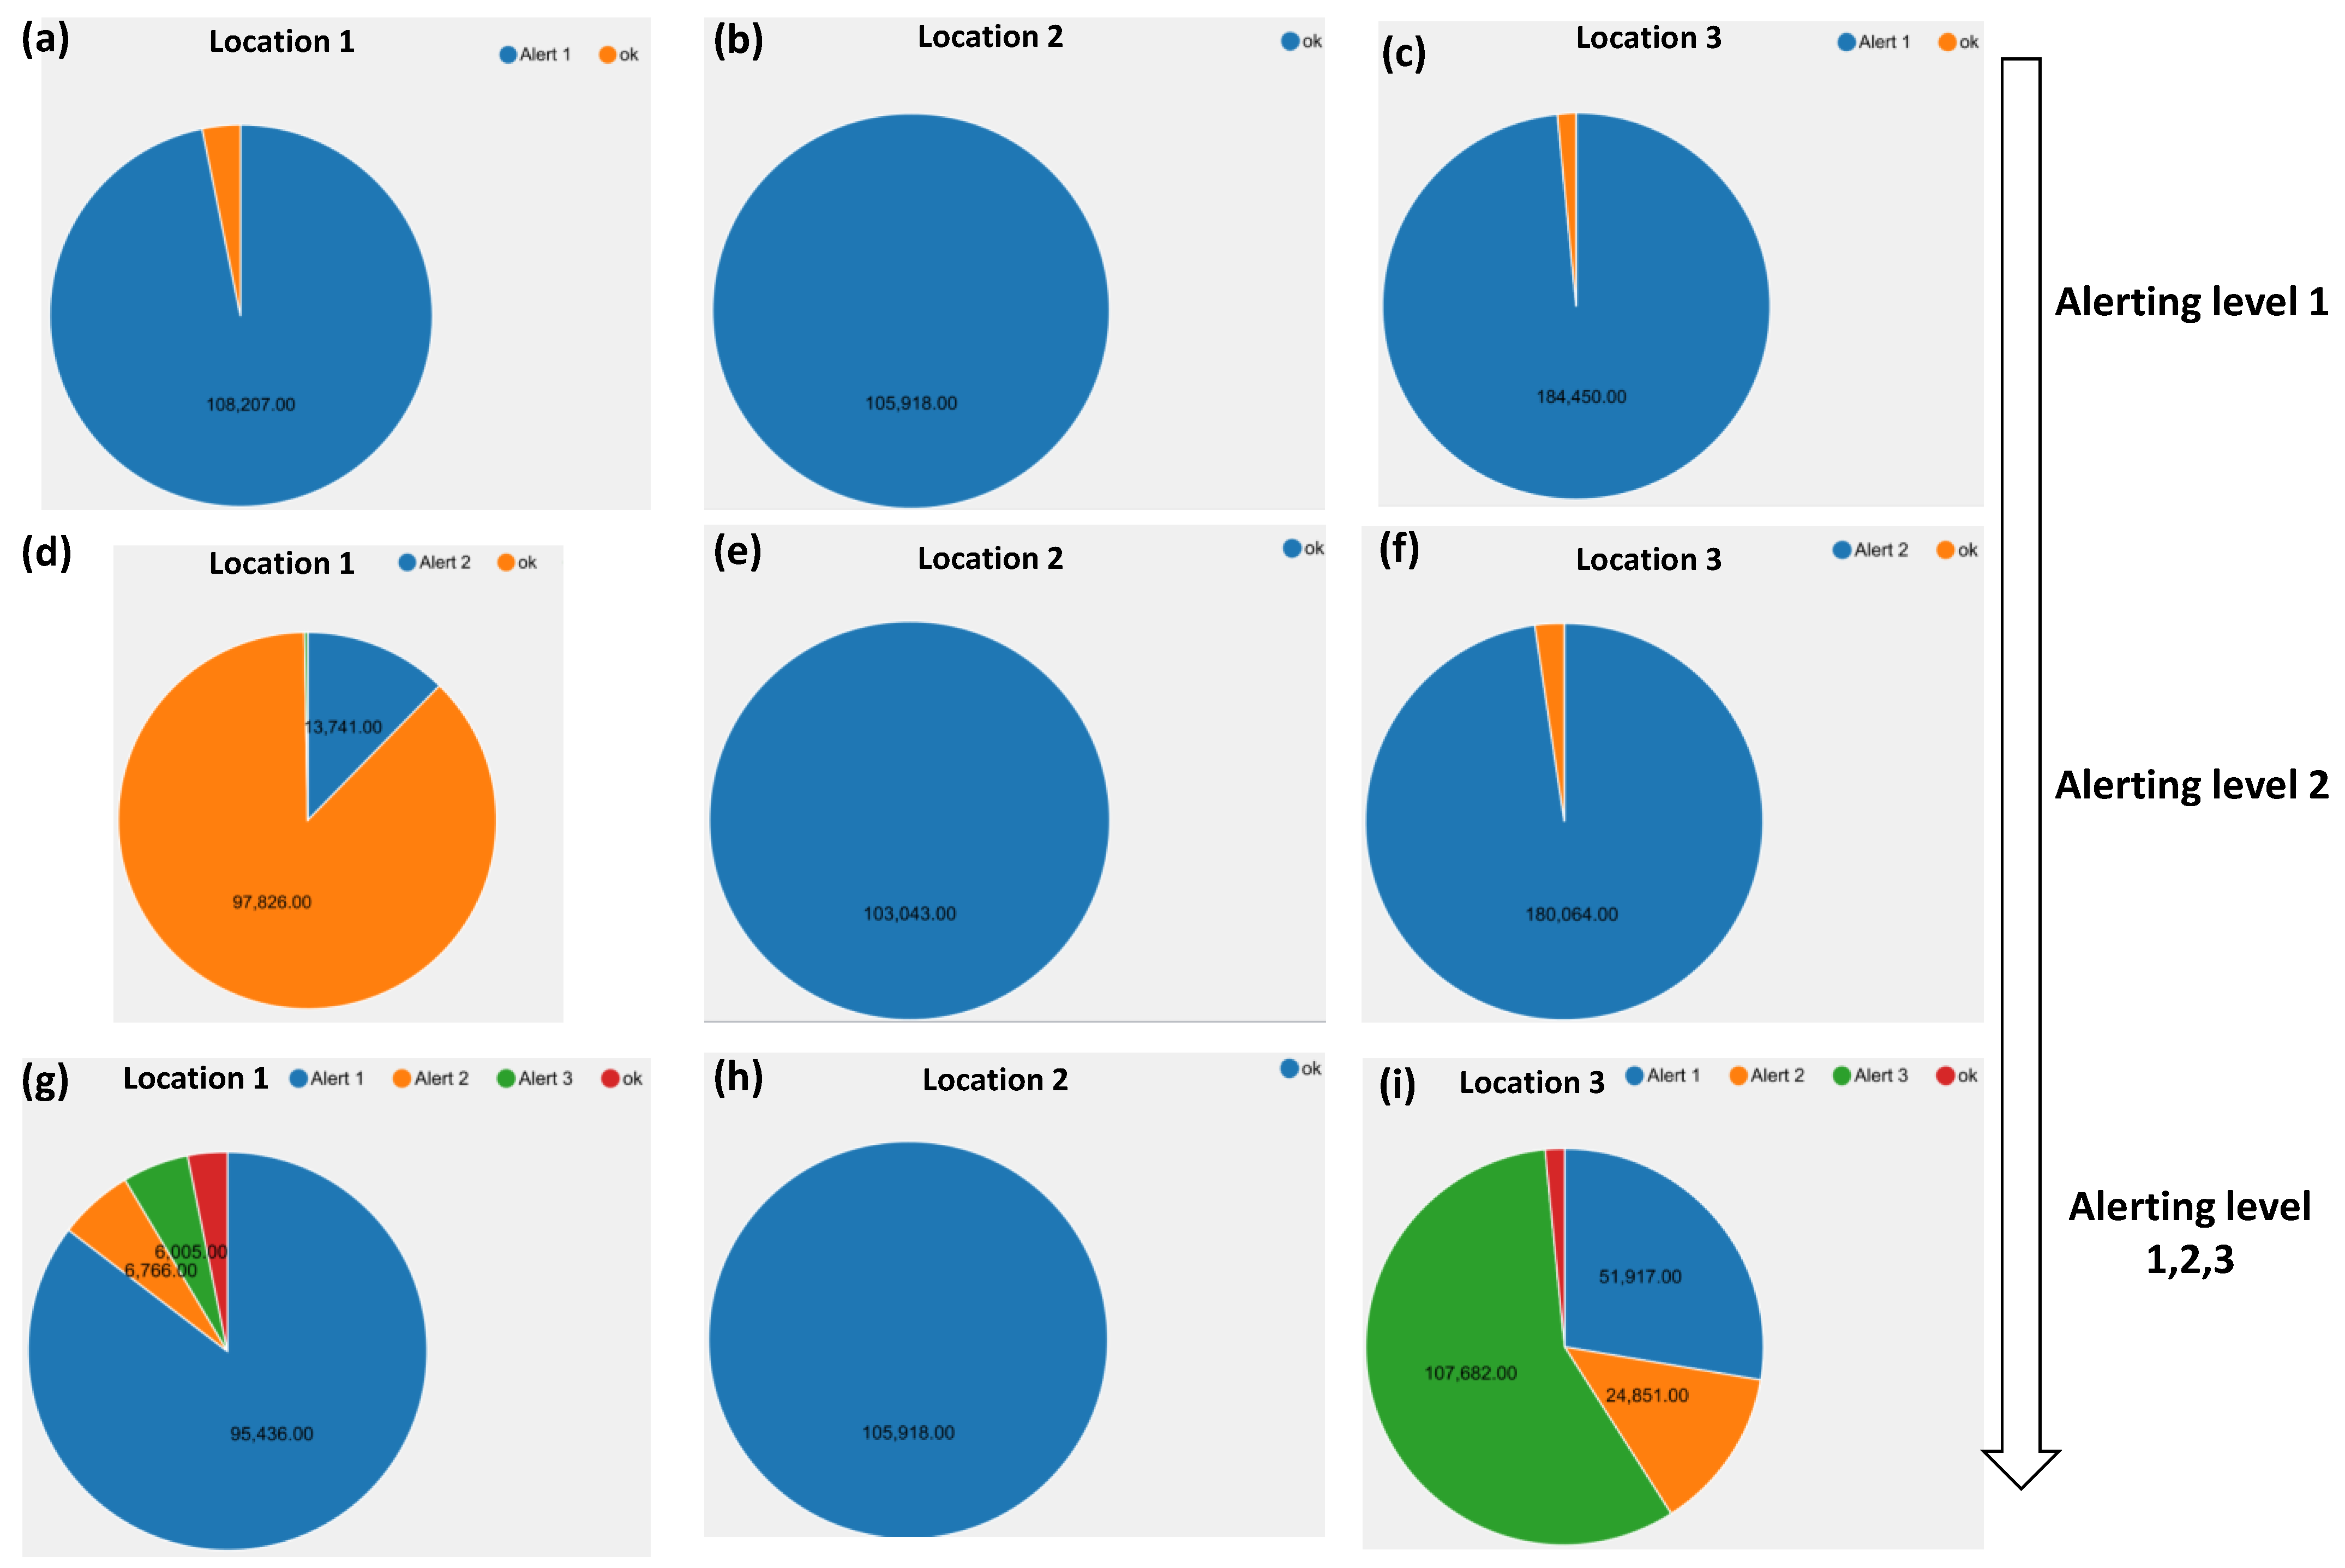
It is observed that the threshold values are assumed only to prove the correct implementation of the KNIME workflow (testing of the model), thus, a real scenario can be different, according to local laws or policies. The pie dashboards of Figure 4a–i summarize the results regarding all risks in the three locations where the sensor matrices are positions. As shown in Figure 4, location 3 exhibits a more dangerous condition, having a higher impact of “Alert 3” condition if compared with the other two locations (location 1 is simply characterized by a no lighting condition, and location 3 is in a ‘no risk’ zone).
3.2. KNIME Model Implementing ANN-MLP Network Supporting Decisions
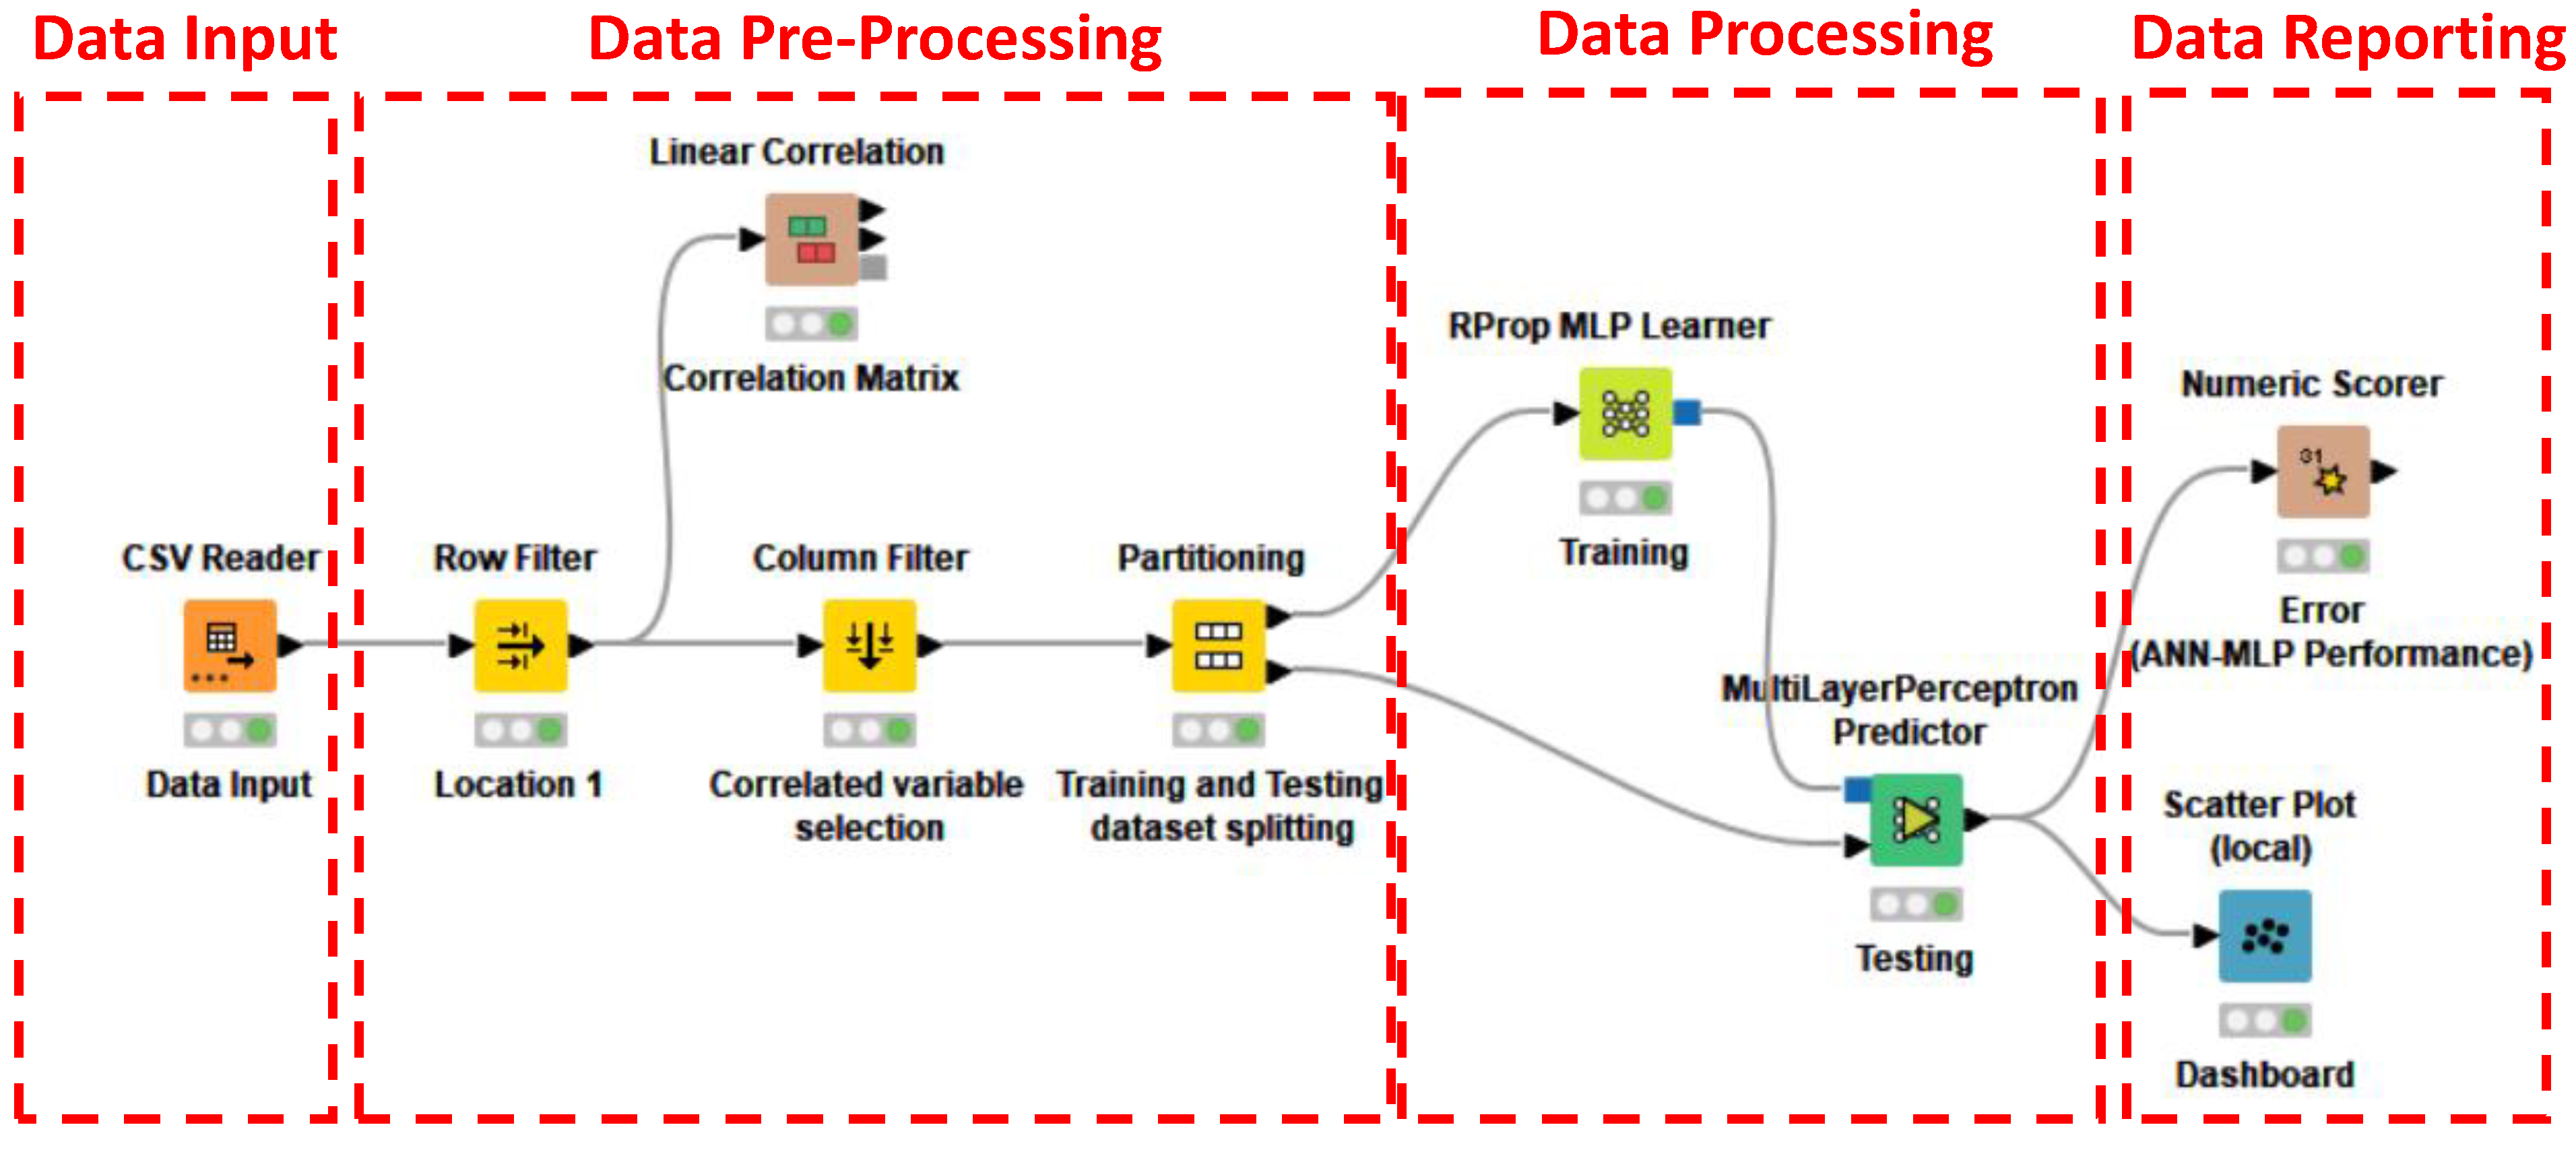
The PM model of Figure 2 additionally takes into account the check of predicted results, providing a complete risk scenario regarding the medium and the long periods. For the analyzed case, the attention is focused on DSS level 2 because it has no ability to predict the light condition. We note that it is important to predict mainly the smoke variable because it represents a sure condition of a plant/machine malfunction or failure. The KNIME workflow of Figure 5 indicates all the data processing phases of the ANN-MLP algorithm predicting the smoke variable. The phases are classified as:
- data input: Data importing action (csv containing IoT datasets).
- data pre-processing: Selection of the main variables (key variables) to process as inputs of the ANN-MLP network (variables chosen by analyzing the correlation matrix by means the “Linear Correlation” block); column filtering process able to clean the dataset from the other variables; partitioning process (“Partitioning” block) splitting the input dataset into two dataset (first partition for the training data process, and second partition for the testing data processing).
- data processing: Training (by “RProp Learner” block) and testing (by “MultiLayerPerceptron Predictor” block) phases.
- data reporting: Plot of the predicted results versus other key variables (by “Scatter Plot” block); performance of the algorithm provided by error’s estimation.
Figure 5.
KNIME workflow implementing ANN-MLP network predicting important variables about worker security (in the analyzed case is predicted the labelled variable smoke).
Figure 5.
KNIME workflow implementing ANN-MLP network predicting important variables about worker security (in the analyzed case is predicted the labelled variable smoke).

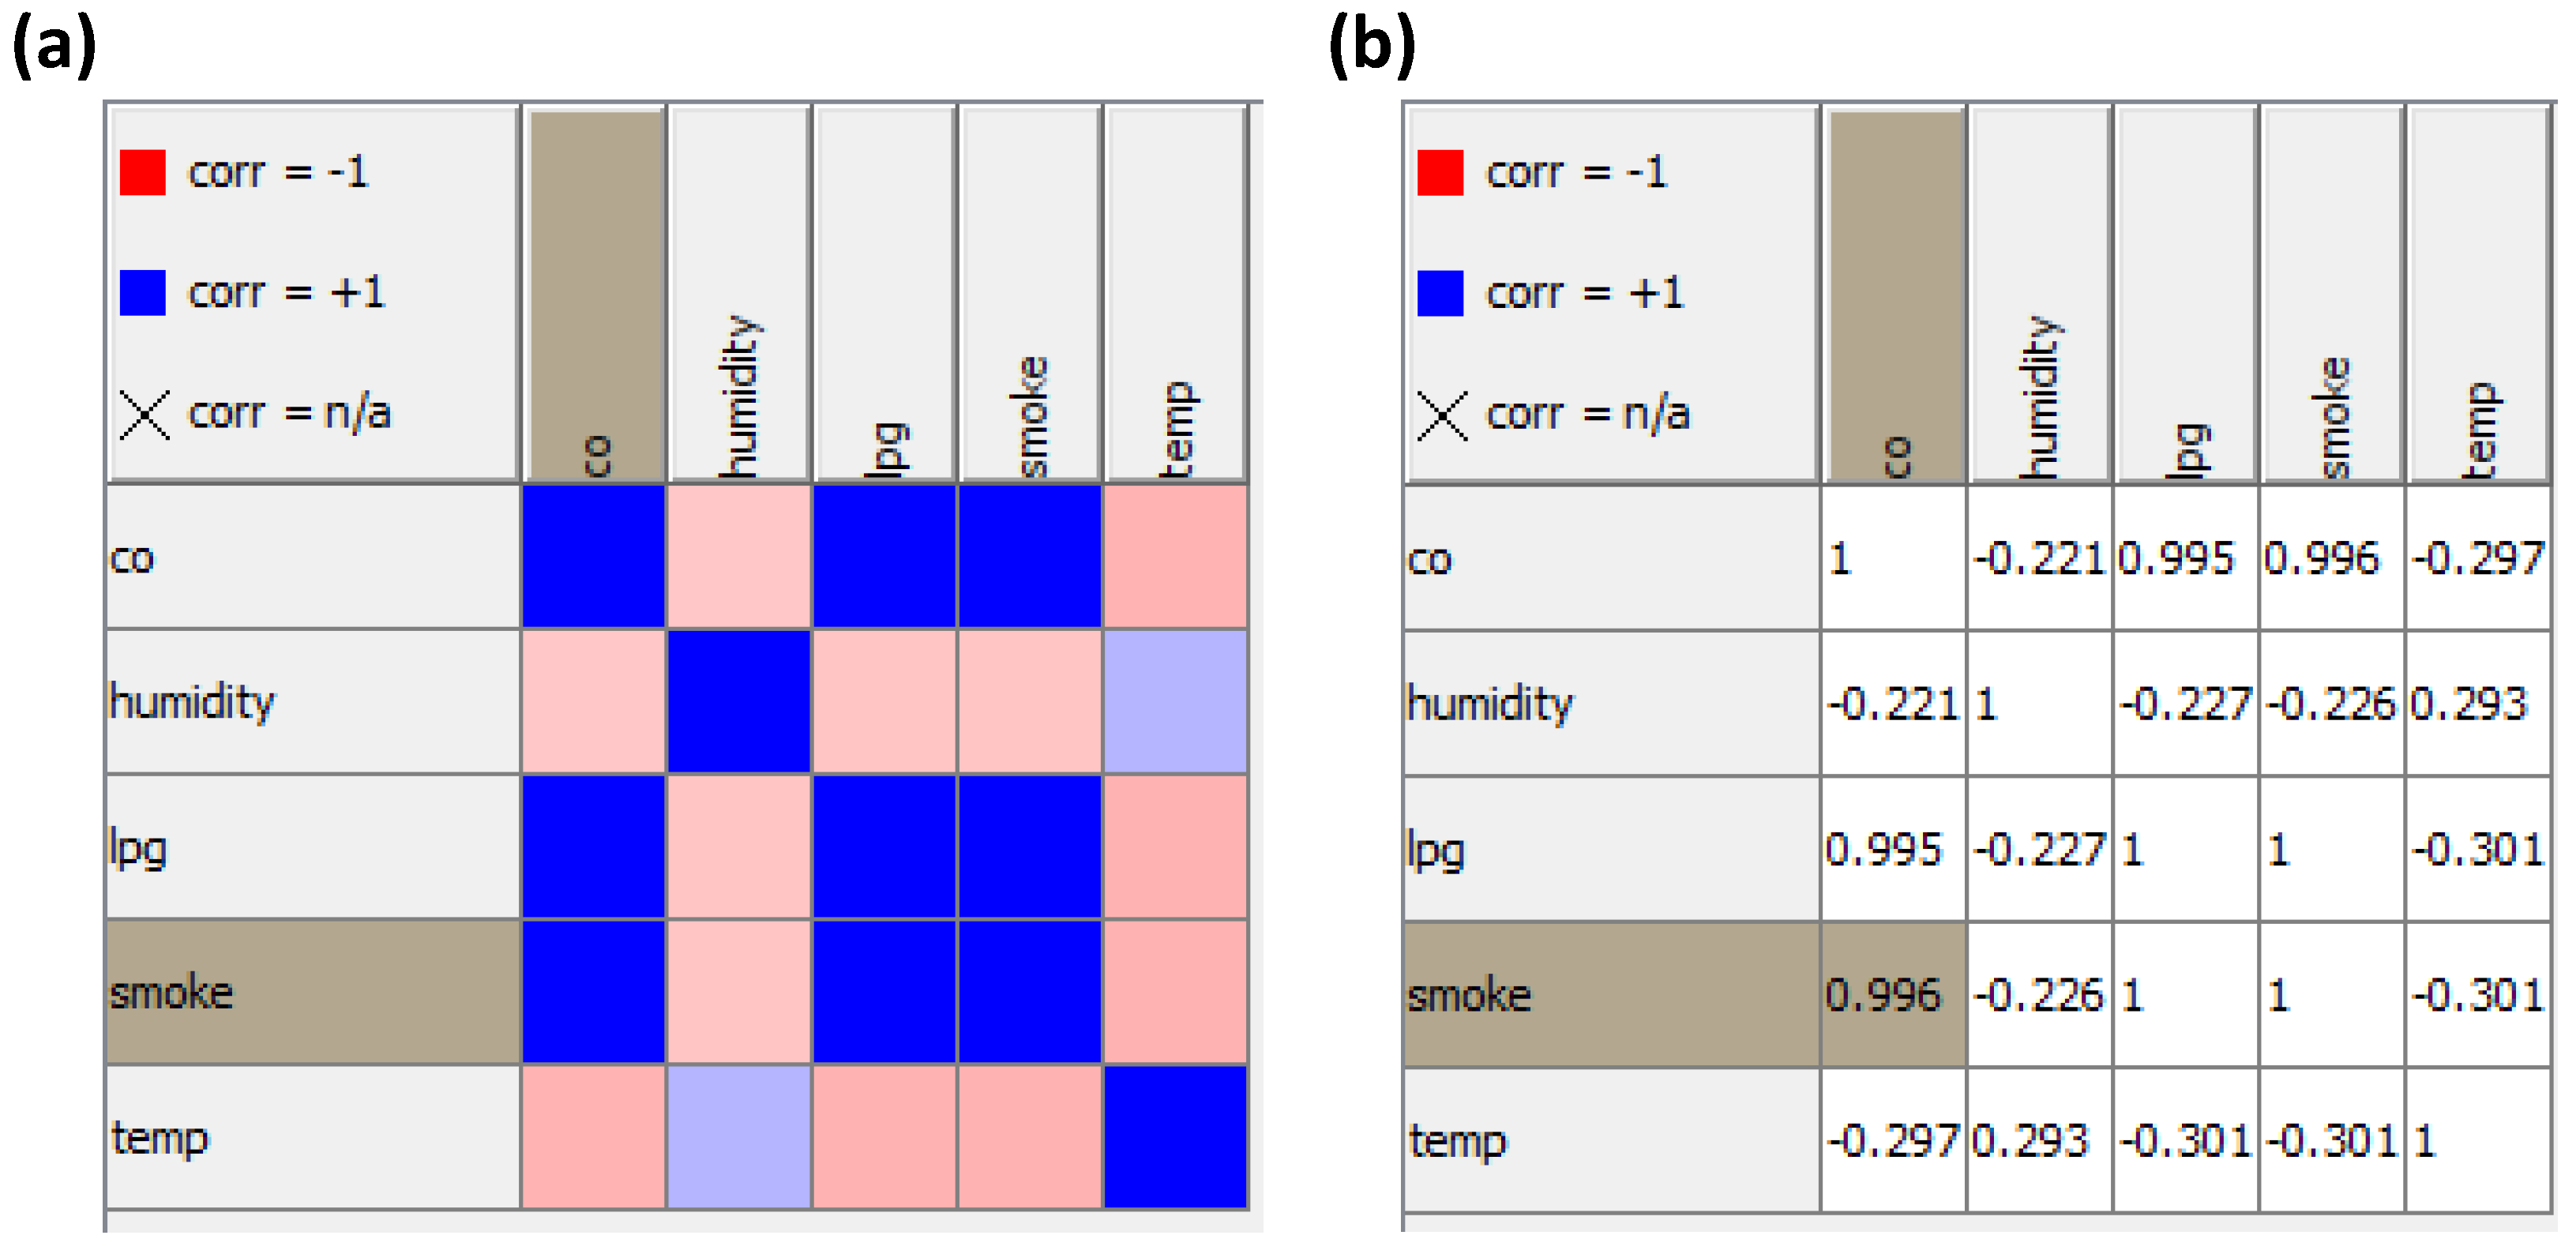
The key variables to be processed by the ANN-MLP algorithm are suggested by the correlation matrix analysis. This analysis takes into account the variables characterized by a strong correlation as the input nodes of the ANN-MLP network. By supposing that the smoke and the carbon monoxide are emitted together at the same time (and after this emission appear lpg due to a deeper machine damage happening after a long period of smoke emission), the variables to process are essentially smoke and co; this choice is enhanced by the correlation analysis illustrated in Figure 6a,b, where the correlation matrix values using a colored scale and double precision numbers are indicated, respectively.
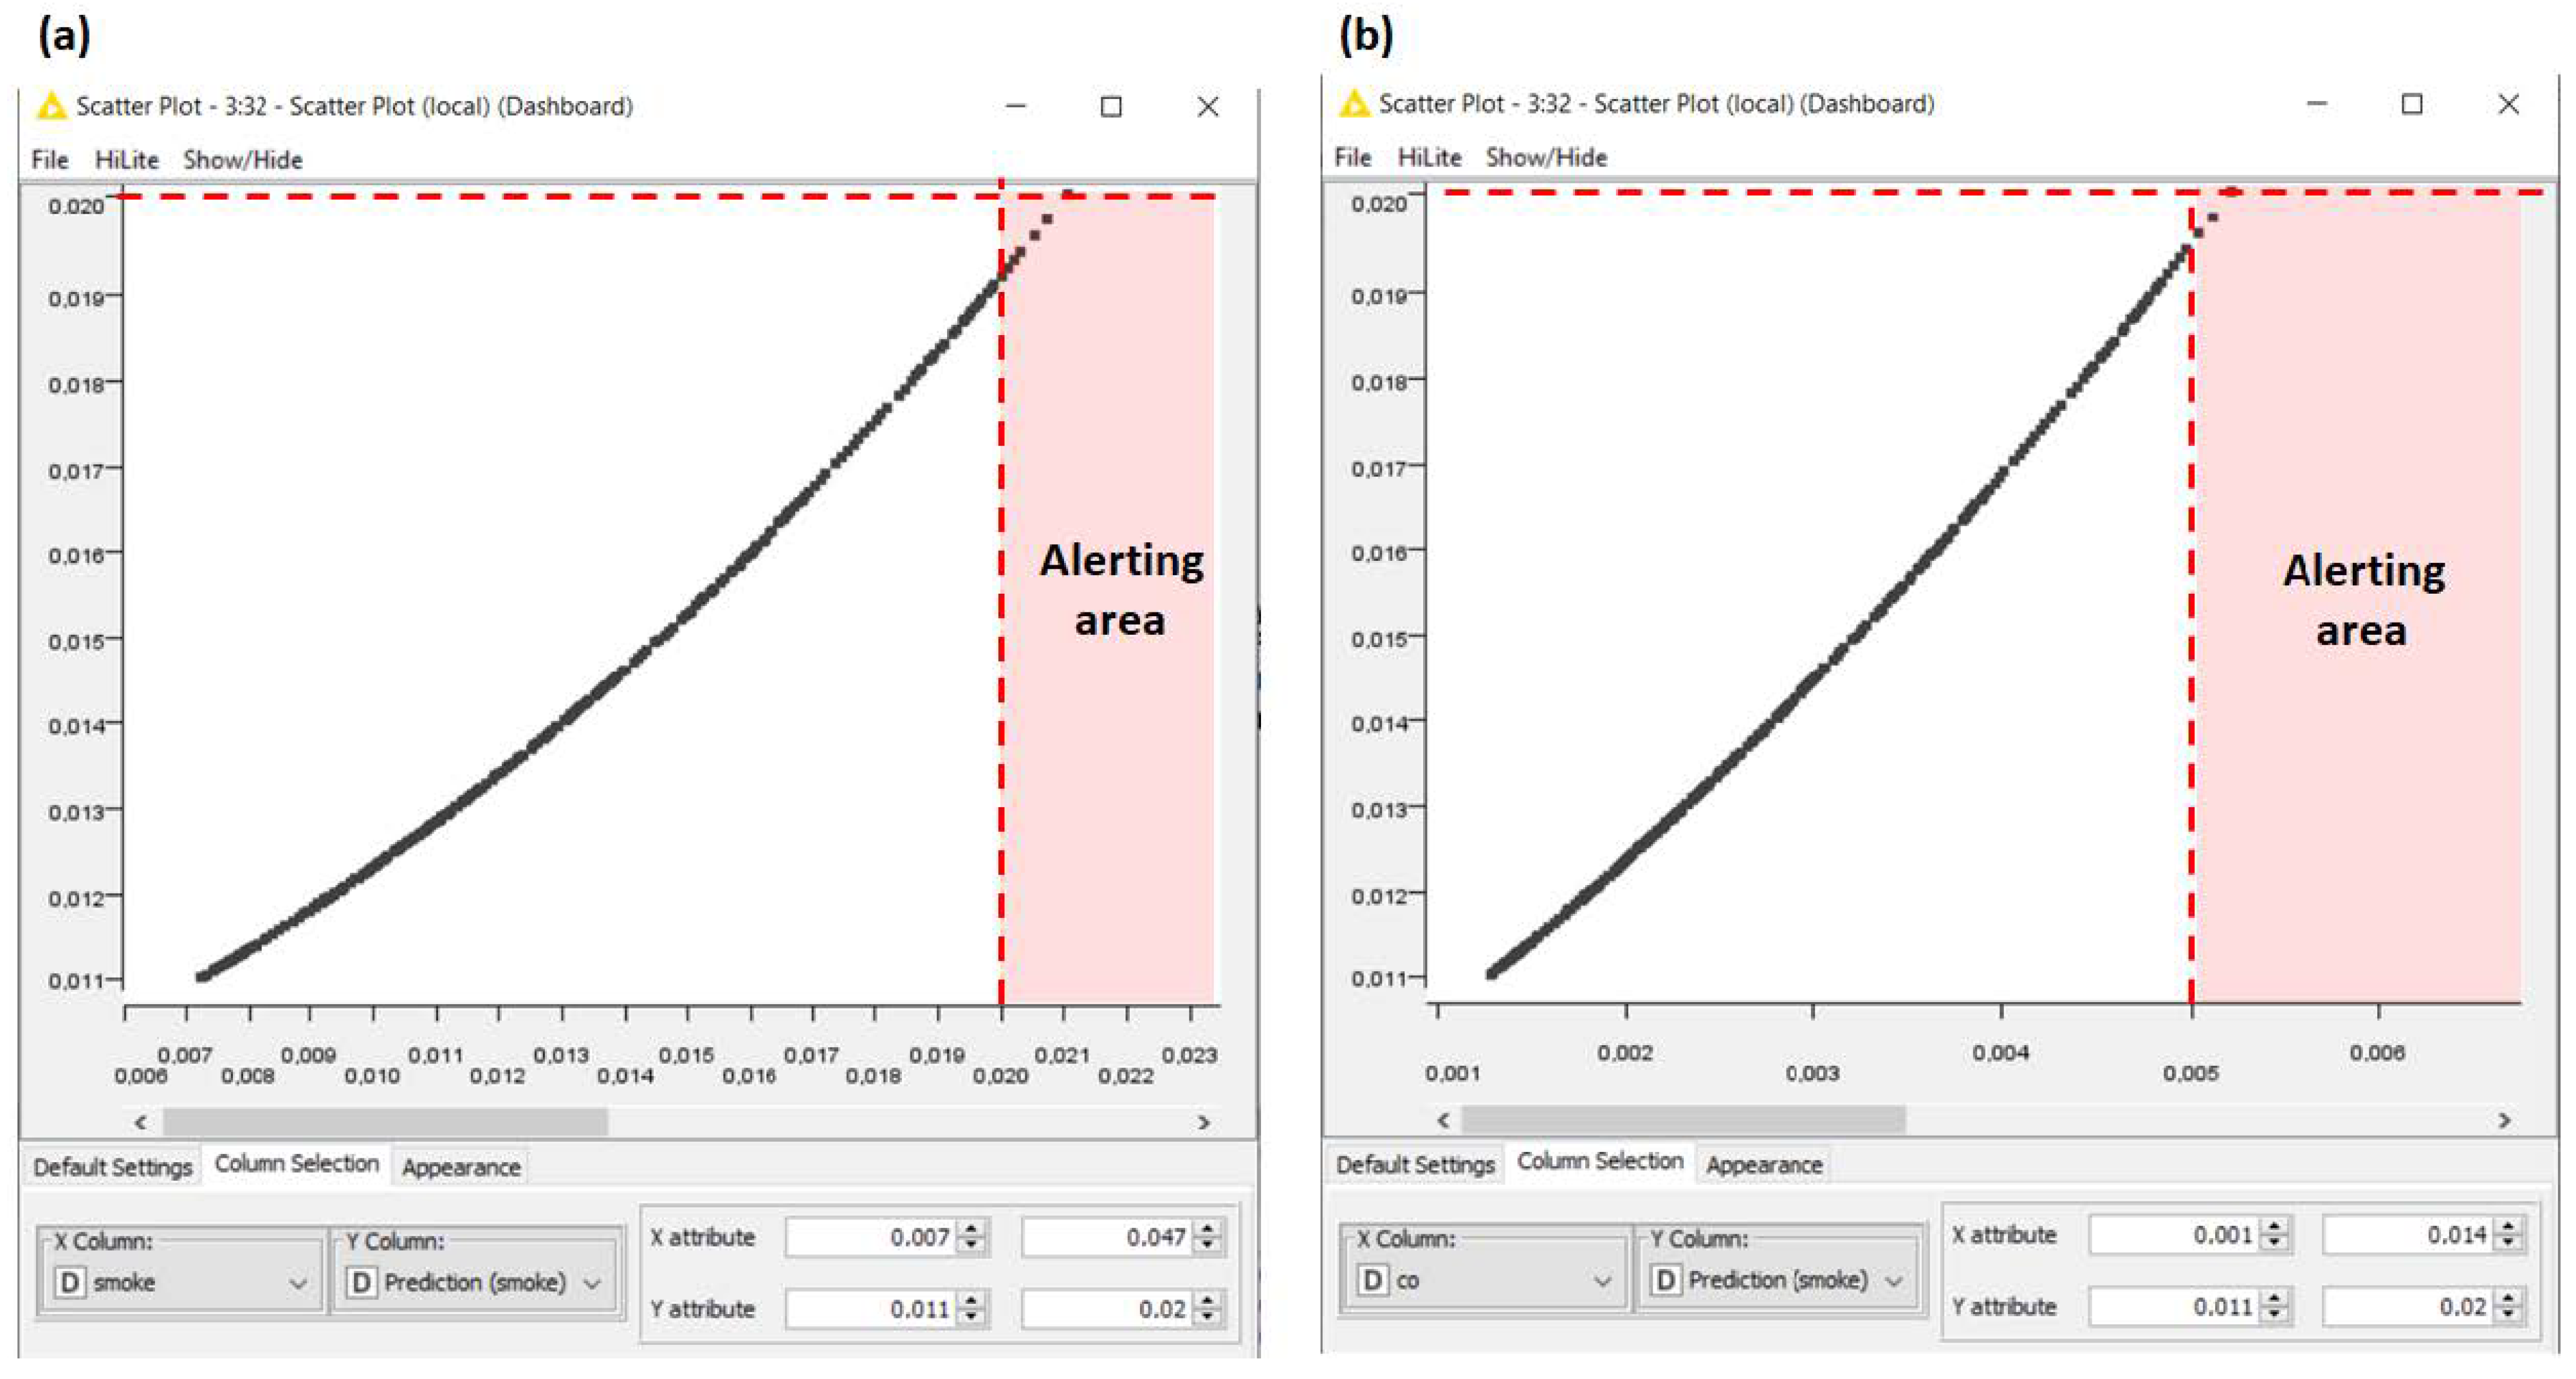
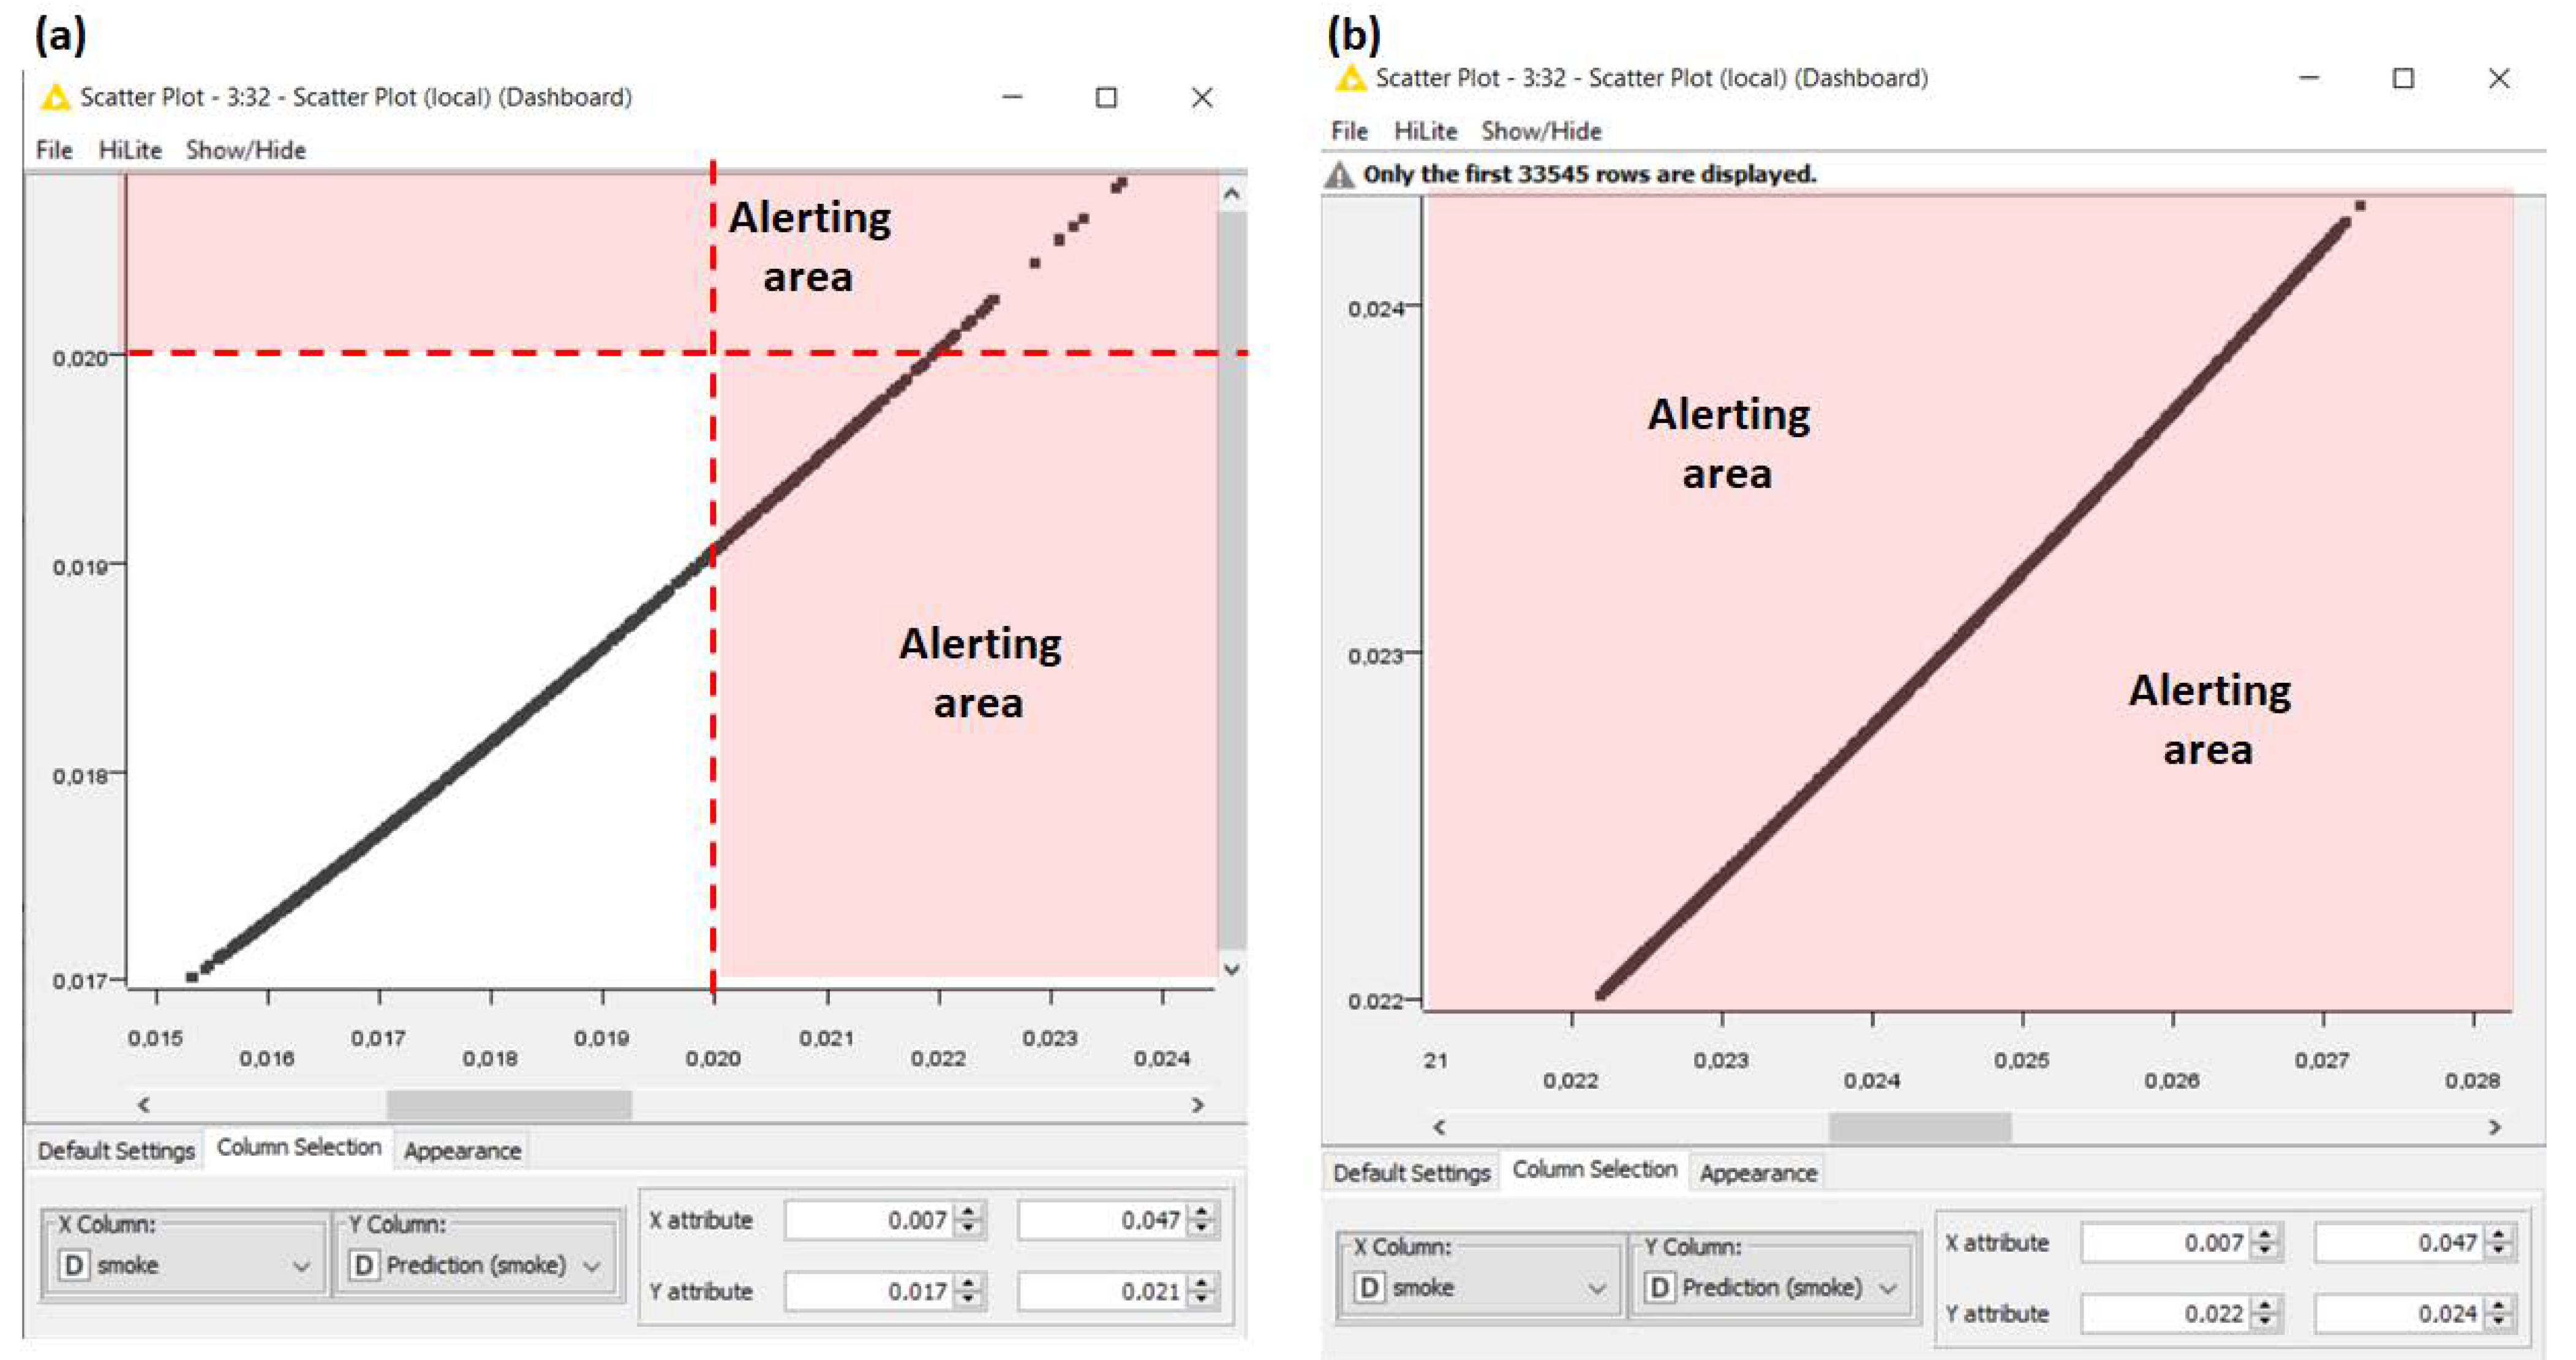
The outputs of the KNIME workflow of Figure 5 are illustrated in Figure 7a,b and Figure 8a,b. The plots of location1 indicate that the predicted smoke and co variables are mainly under the threshold, and, consequently, there is a no risk condition. Besides, a moderate predicted alert for location 2 and a high predicted alert for the location 3 are observed. A very low Means Absolute Error (MAE) of 0.001 (estimated by means the “Numeric Scorer” block of Figure 5) is checked for the prediction analysis, thus proving the good performance of the applied ANN-MLP algorithm. The ANN-MLP hyper-parameters and the related model used for the calculus are listed in Appendix A.
In Table 2, the results of the threshold checking and the ANN-MLP predicted alert are summarized.
4. Discussion
The first step adopted to process data is to define the key variables influencing the worker security in a specified environment. In the analyzed case are considered four key variables: lighting condition, smoke, carbon monoxide, and liquid petroleum gas. The implemented logic conditions (AND logic conditions) take the overcoming of specific thresholds into account as risk conditions (alerting conditions). The proposed security multi-level PM model is powered by means of the prediction of the smoke variable, given the hypothesis that the dangerous condition occurs in the following steps:
- The smoke is first emitted from the machine together with carbon monoxide gas.
- For a break condition (after the smoke emission), the liquid petroleum gas is also emitted, introducing a further risk of fire or explosion (stronger risk).
The AI data processing is performed by considering the steps of the physical phenomena and the correlation analysis of all the variables. The ANN-MLP analysis considers that the smoke and the carbon monoxide are strongly correlated; the input variables of the algorithm, then, are the smoke and the co, predicting the smoke condition. The prediction could also detect some alerting conditions even when the thresholds are not exceeded. The self-learning approach of ANN-MLP supervised algorithms based on the data processing of historical data (training phase) allows for the provision of further dashboards over the medium and long periods. The dashboards of Figure 4 represent imminent risks or dangerous conditions in the short period. Besides, the dashboards of Figure 7 and Figure 8 are related the medium and the long periods. Sensors and IoT systems are able to detect data useful to control production and ensure worker security. In Table 3, different key variables influencing quality and worker security conditions are listed.
Detection of the key variable values is achieved by reading sensor data. The automatism about product quality corrections and security management (thought acoustic or visual alerting tools) can be achieved by mechatronic systems linked to programmable logic controller (PLC) interfaces stopping production machines, vehicles, and tools. The DSS structure in more levels allows for the definition of more detailed risk maps based on the classification of hazard levels. In Table 4, some indicative research works about possible topics involving PM model and the potential applications of the proposed multi-level approach as research advances are listed.
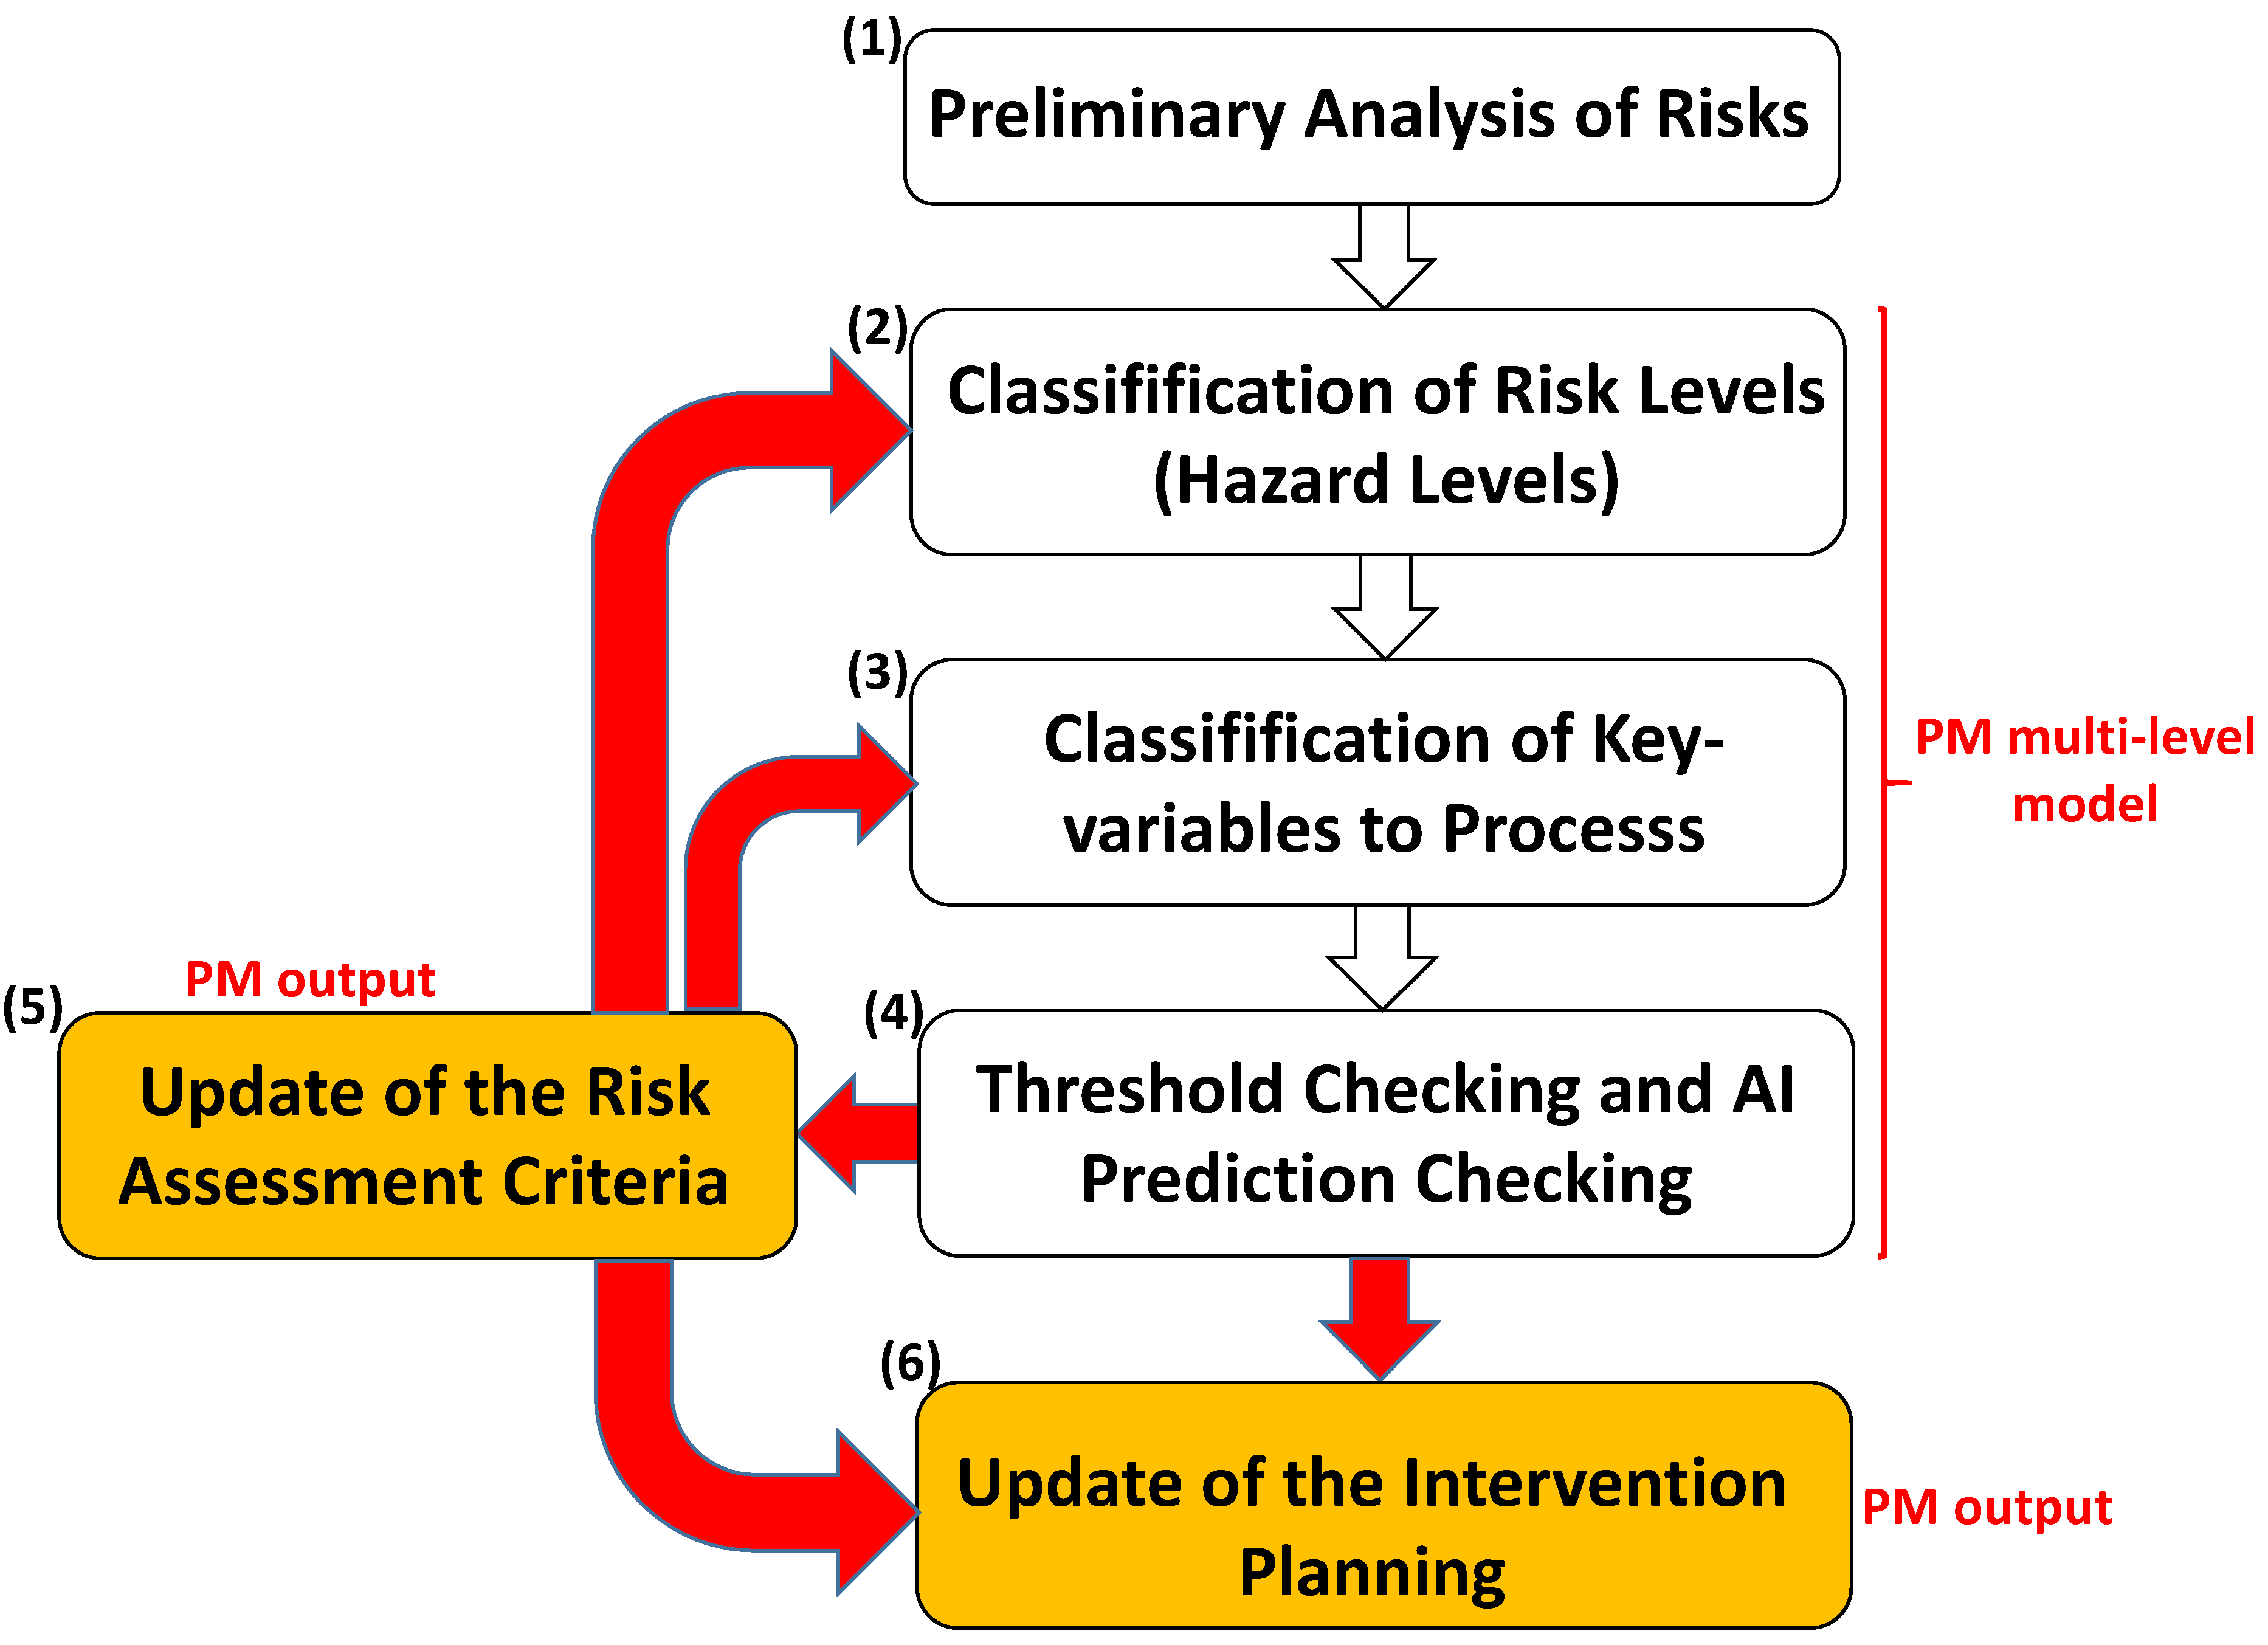
Figure 9 illustrates a flowchart indicating PM model advantages regarding risk assessment and conformance of the intervention plan (outputs of the PM model). Specifically, the diagram highlights the PM operating phases as:
- (1)
- Preliminary Analysis of Risks: A preliminary analysis of the process to perform defines the main scenario (about production or safety risks); the preliminary analysis includes the ‘AS IS’ BPMN process mapping.
- (2)
- Classification of Risk Levels: The preliminary analysis provides a first classification of hazard levels, thus establishing the number of the alerting levels to consider in the PM model.
- (3)
- Classification of Key variables to Process: The classification of the alerting levels allows the definition of the key variable to be processed for each level (variables to process for each level of the PM model); this phase includes the definition of the logics of the DSS to be implemented for the checking phase (phase 4).
- (4)
- Threshold checking and AI Prediction checking: The checking of the key variable’s overcoming of a threshold and the prediction analysis are executed by considering the logic rules of phase 3 (DSS logics).
- (5)
- Update of the Risk Assessment Criteria (output of the PM model): The risk assessment model is based on the analysis of the PM outputs; the hazard levels could be updated according to PM results.
- (6)
- Update of the Intervention planning (output of the PM model): According to the PM output and to the update of the risk assessment model, the intervention planning is scheduled and updated.
Figure 9.
Flowchart representing the PM phases and the related outputs.

In Table 5, the main advantages of the PM outputs are listed.
According to the example proposed in this paper about safety in the workplace, the PM provides the following results, which optimize the process controlling security:
- Extraction of the process features to map the ‘TO BE’ safety control process (update of the risk assessment and of the intervention plan): the dashboards of Figure 4 highlight that only location 3 exhibits a more dangerous condition, having a higher impact of “Alert 3” (application of the DSS algorithm based on the logics explicated in Appendix A); this allows for an update of the risk assessment only of location 3 by controlling machines; the interventions to plan are related mainly to location 3; more responsible and attentive workers will be allocated to location 3; a periodic control plan of machine of location 3 is required by storing an hourly event log; location 1 shows a low alerting risk (no intervention need be planned);
- Further decisions supported by AI prediction: the key variables to control are smoke, lpg, and co (see correlation matrix of Figure 6); with smoke being the most important key variable (after the smoke emission are lpg and co) the ANN-MLP forecasting analysis of the smoke highlights a no-risk prediction (see Figure 7) for location 1. Consequently, the machine can be revised without stopping the production, and the hazard level is updated as lower level (see Figure 9); the no-alert prediction of location 1 confirms that no interventions will be planned over the short and medium period; the prediction of smoke at location 2 enhances a potential risk (moderate alert), thus suggesting activation of a monitoring plan; the prediction of smoke at location 3 confirms that an urgent intervention should be performed.
In Table 6, the PM outcomes of the analyzed case are listed.
The application of the PM theoretical model to another case study will provide different outcomes, but the method to be applied remains the same.
5. Conclusions
The study introduces a “proof concept” of PM implementing a DSS multi-level engine supporting decision-making processes. In the analyzed case, the DSS integrates logic functions and an ANN-MLP algorithm providing prediction of air parameters critical for safety. The method adopted to sketch the PM model is the BPMN model. KNIME workflows are used for the application of the BPMN model, providing risk dashboards. The discussed considerations about the PM results refer to the specific safety process to control and change depending on the working scenario. Different key variables and logics will be considered according to the preliminary risk assessment evaluation for the specific scenario being analyzed. The PM results facilitate the extraction of guidelines for risk assessment and for the optimized scheduling of the interventions to ensure worker safety. The proposed example provides the reading keys of the PM outputs and the method to control a specific process. The DSS algorithm to be applied includes the possibility to integrate AI supervised or unsupervised algorithms that can improve the PM decision-making model [42]. In this direction, the KNIME tool is suitable for the implementation of algorithms modeling the same workflow of the analyzed process [42,43]. For the first time, the PM model is structured into a multi-level model able to provide a risk assessment based on the characterization of hazard levels. The main assumption of the proposed methodology is the preliminary analysis of risks identifying the key variables to process by means of the DSS engine. The limitations are mainly in the automatisms to be implemented to achieve a self-adaptive model, because AI algorithms cannot entirely replace human intervention. Furthermore, a big dataset is required, as regards the analyzed case, in order to execute AI algorithms with good computational performance. Future works will address the last aspects of finding new solutions for an automatic DSS solution and for the use of augmented data-improving AI models. Additionally, the proposed PM approach can be adapted for quality control and management of production monitoring machines tools and product defects. The PM model is formulated to automate safety procedures, addressing research on Industry 5.0 processes and advanced systems.
Funding
This research received no external funding.
Acknowledgments
Author gratefully thanks the staff of “Ingegneria Gestionale” of LUM University “Giuseppe Degennaro”.
Conflicts of Interest
The author declare no conflict of interest.
Appendix A. Dataset Description and Data Processing Information
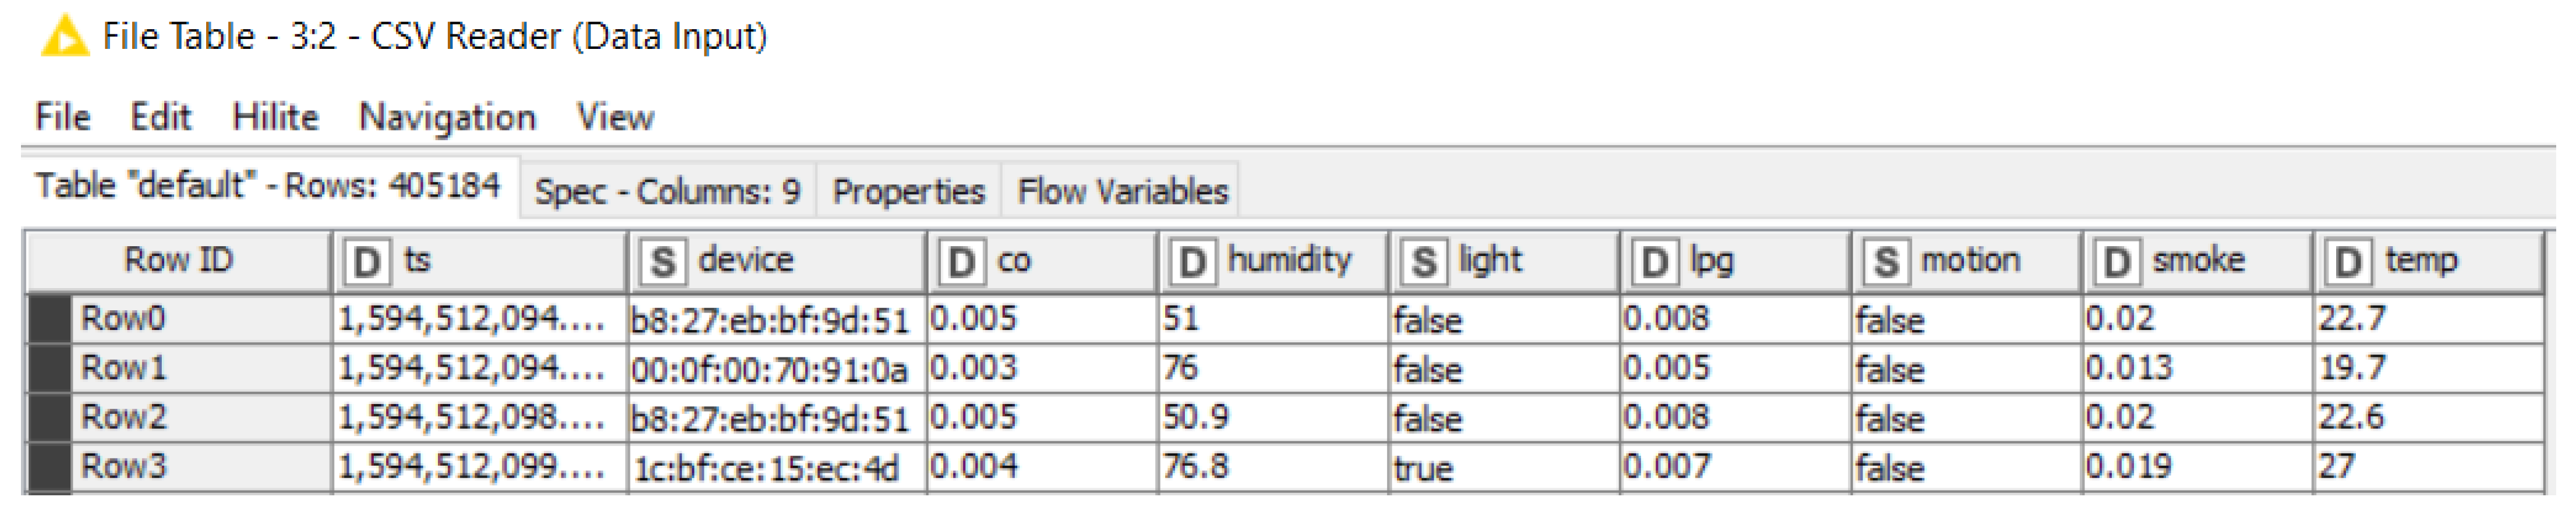
The analyzed open dataset is found in [15]. The data are detected by three identical IoT breadboard-based sensor arrays through Queuing Telemetry Transport (MQTT) network protocol. Each IoT device is placed in a specific location (named location 1, location 2, and location 3). The same technology can be applied in real scenarios of industrial sectors. The analyzed variables are: temperature (temp variable expressed in Fahrenheit units), humidity (humidity variable expressed in percentage), carbon monoxide (co variable expressed in ppm %), liquid petroleum gas (lpg variable expressed in ppm %), smoke (smoke variable expressed in ppm %), light (light boolean variable), motion (motion boolean variable indicating the presence of a worker into a specific location), timestamp (ts variable indicating in epoch unit the timestamp of event), and device (string indicating the unique device name). In Figure A1 is illustrated a screenshot of the dataset imported in the local repository of a personal computer adopted for the calculus. Figure A2 illustrates some trends of variables having a major weight about worker security control (co, lpg, and smoke).
Figure A1.
Screenshot of the Csv Reader table indicating the imported variables and the total number of the processed records (405,184 rows).
Figure A1.
Screenshot of the Csv Reader table indicating the imported variables and the total number of the processed records (405,184 rows).

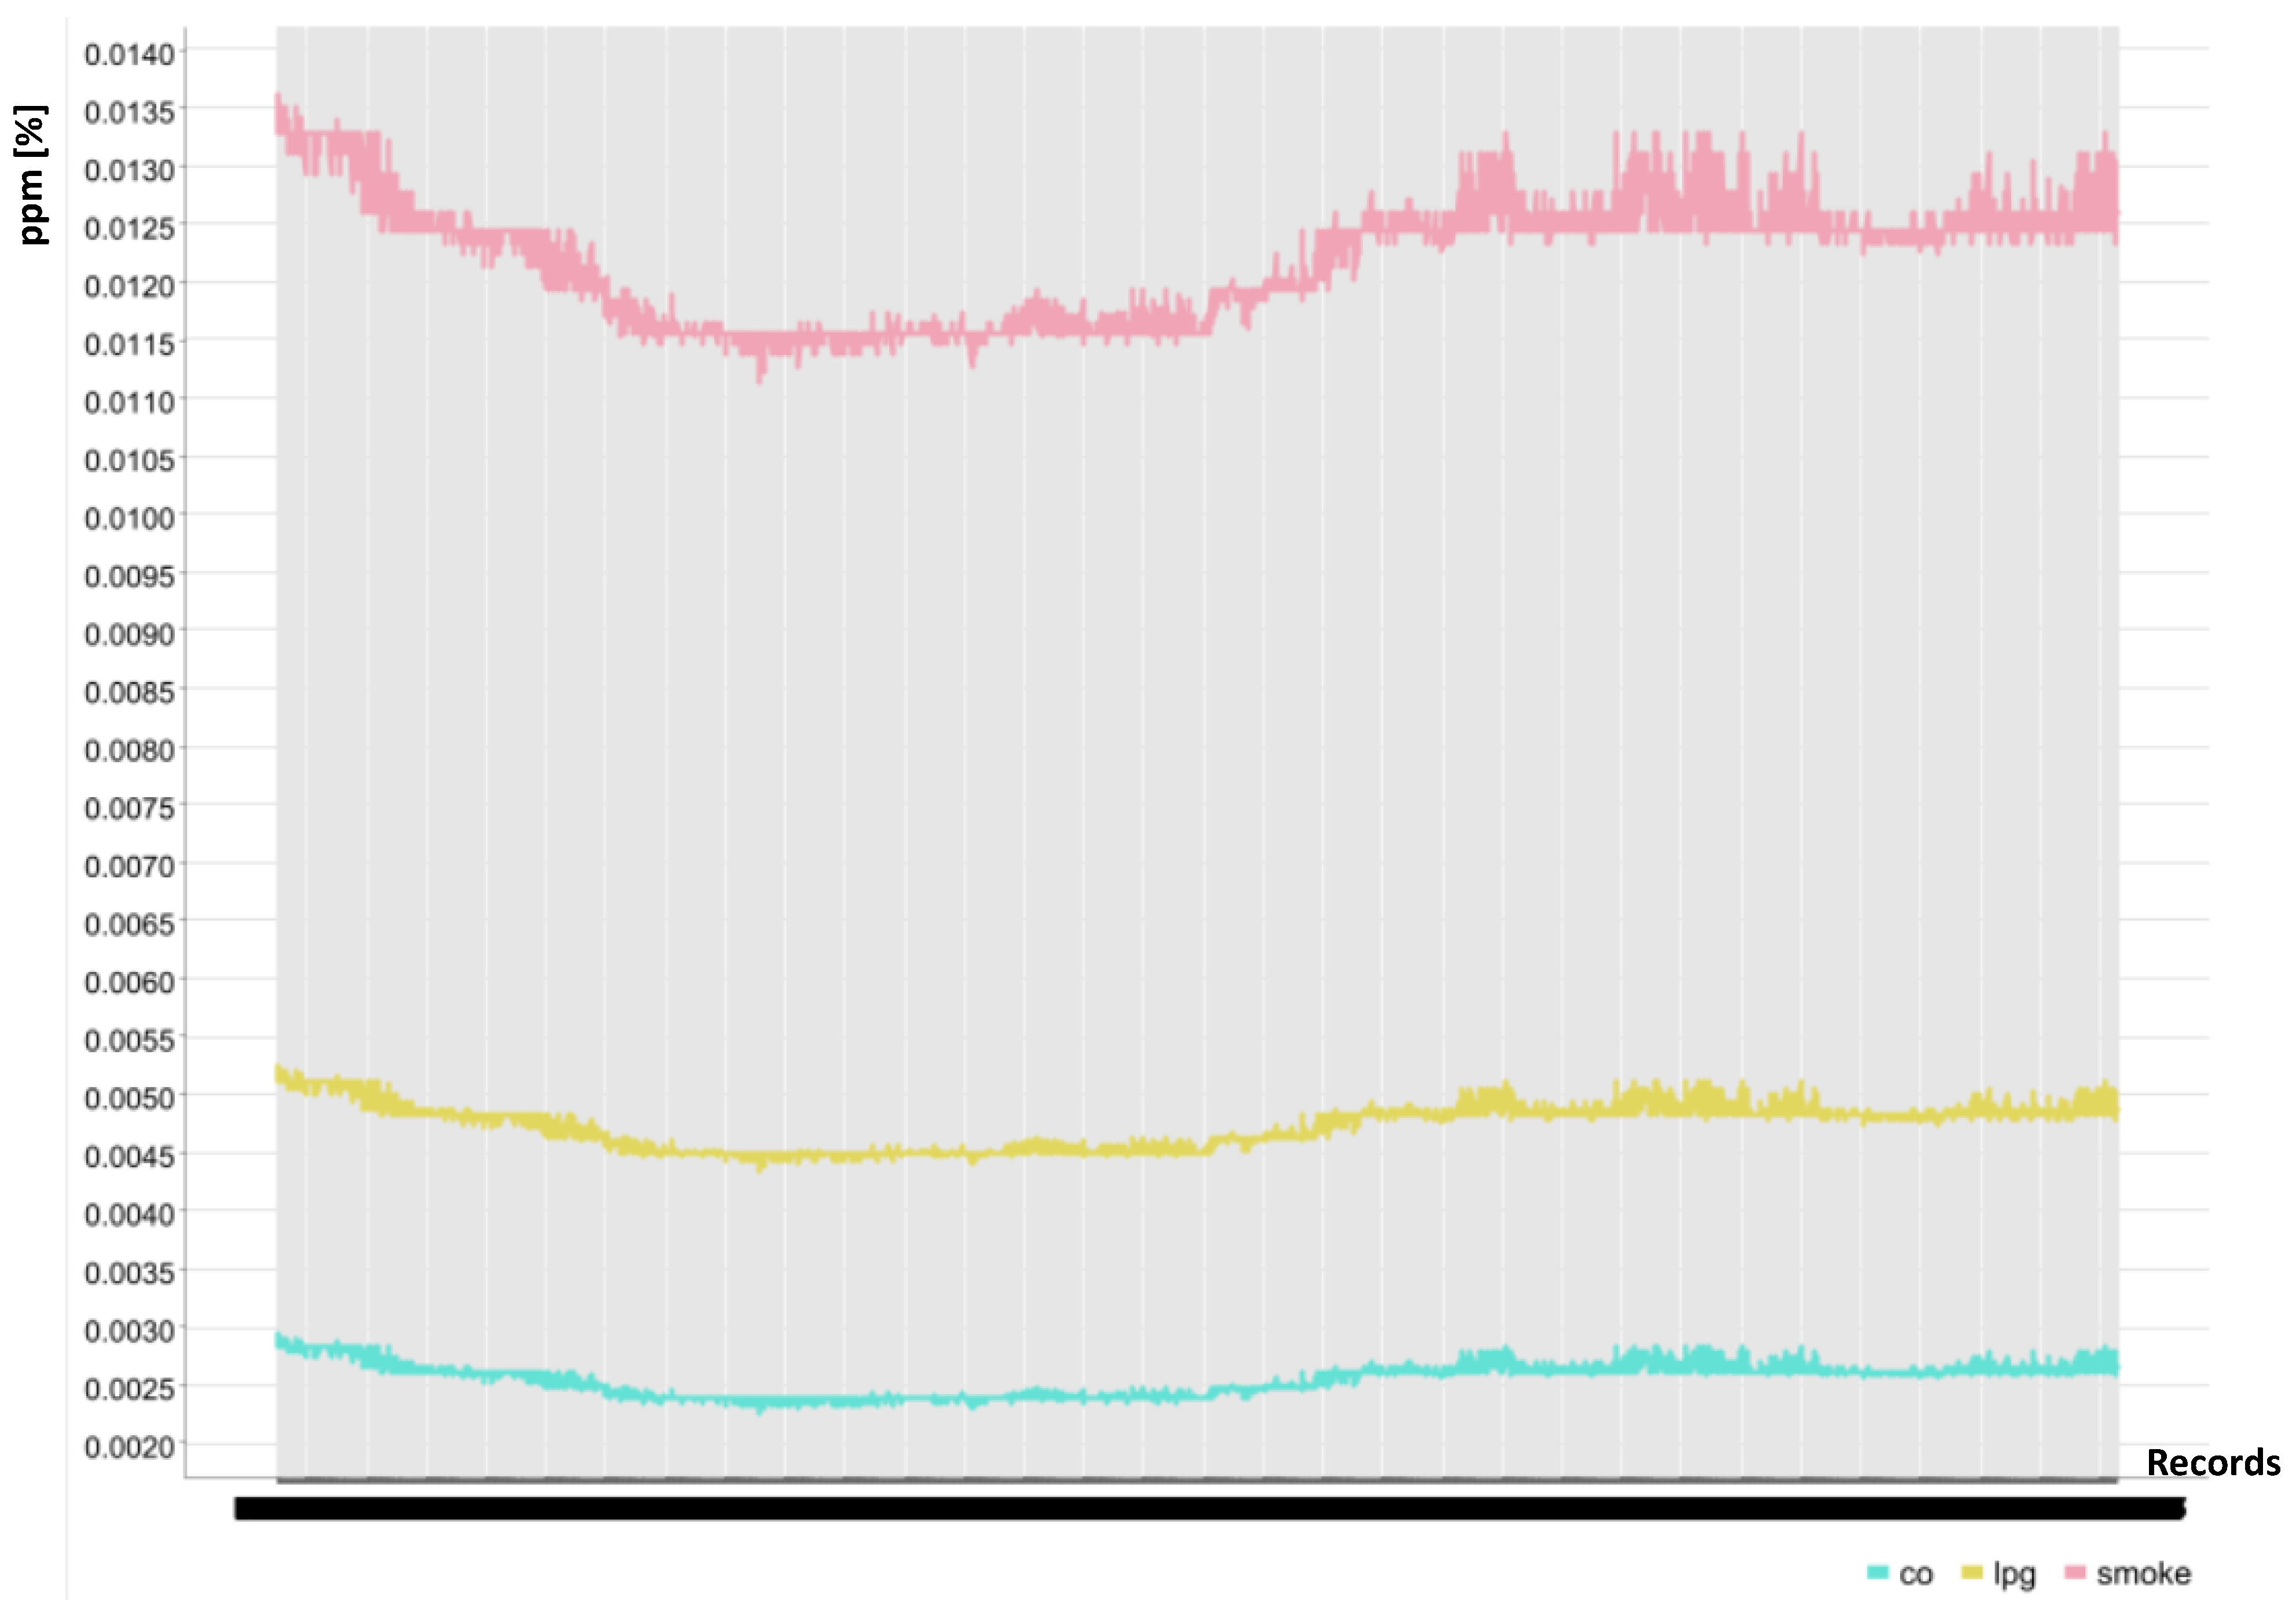
Figure A2.
First 4,000 records of the most important variables chosen for the data processing (co, lpg, and smoke variables).
Figure A2.
First 4,000 records of the most important variables chosen for the data processing (co, lpg, and smoke variables).

Concerning KNIME block configurations, in Figure A3 is illustrated the screenshot of the KNIME Graphical User Interface (GUI) configuring Row Filter block selecting a working location (each IoT device is located in a different location).
Figure A3.
KNIME GUI selecting device of a location (“Row Filter” block).

Below is listed the pseudocodes of the “Role Engine” blocks of Figure 3 (logic conditions implementing the DSS multi-level system):
- Logic condition of the “Role Engine” Logic Control 1 block of Figure 3:
- –
- $light$ = “false” => “Alert 1”;
- –
- $light$ = “true” => “ok”.
- Logic condition of the “Role Engine” Logic Control 2 block of Figure 3:
- –
- ($Alerting Message$ = “Alert 1” AND $smoke$ >=0.02 )=> “Alert 2”;
- –
- $smoke$ < 0.02 => “ok”.
- Logic condition of the “Role Engine” Logic Control 3 block of Figure 3 (summarizing all the conditions):
- –
- ($Alerting Message 2$ = “Alert 2” AND $co$ >=0.005 AND $lpg$ >=0.008 )=> “Alert 3”;
- –
- ($Alerting Message 2$ = “Alert 2” AND $co$ < 0.005 AND $lpg$ < 0.008 )=> “Alert 2”;
- –
- $Alerting Message$ = “Alert 1” => “Alert 1”;
- –
- $Alerting Message$ = “ok” => “ok”.
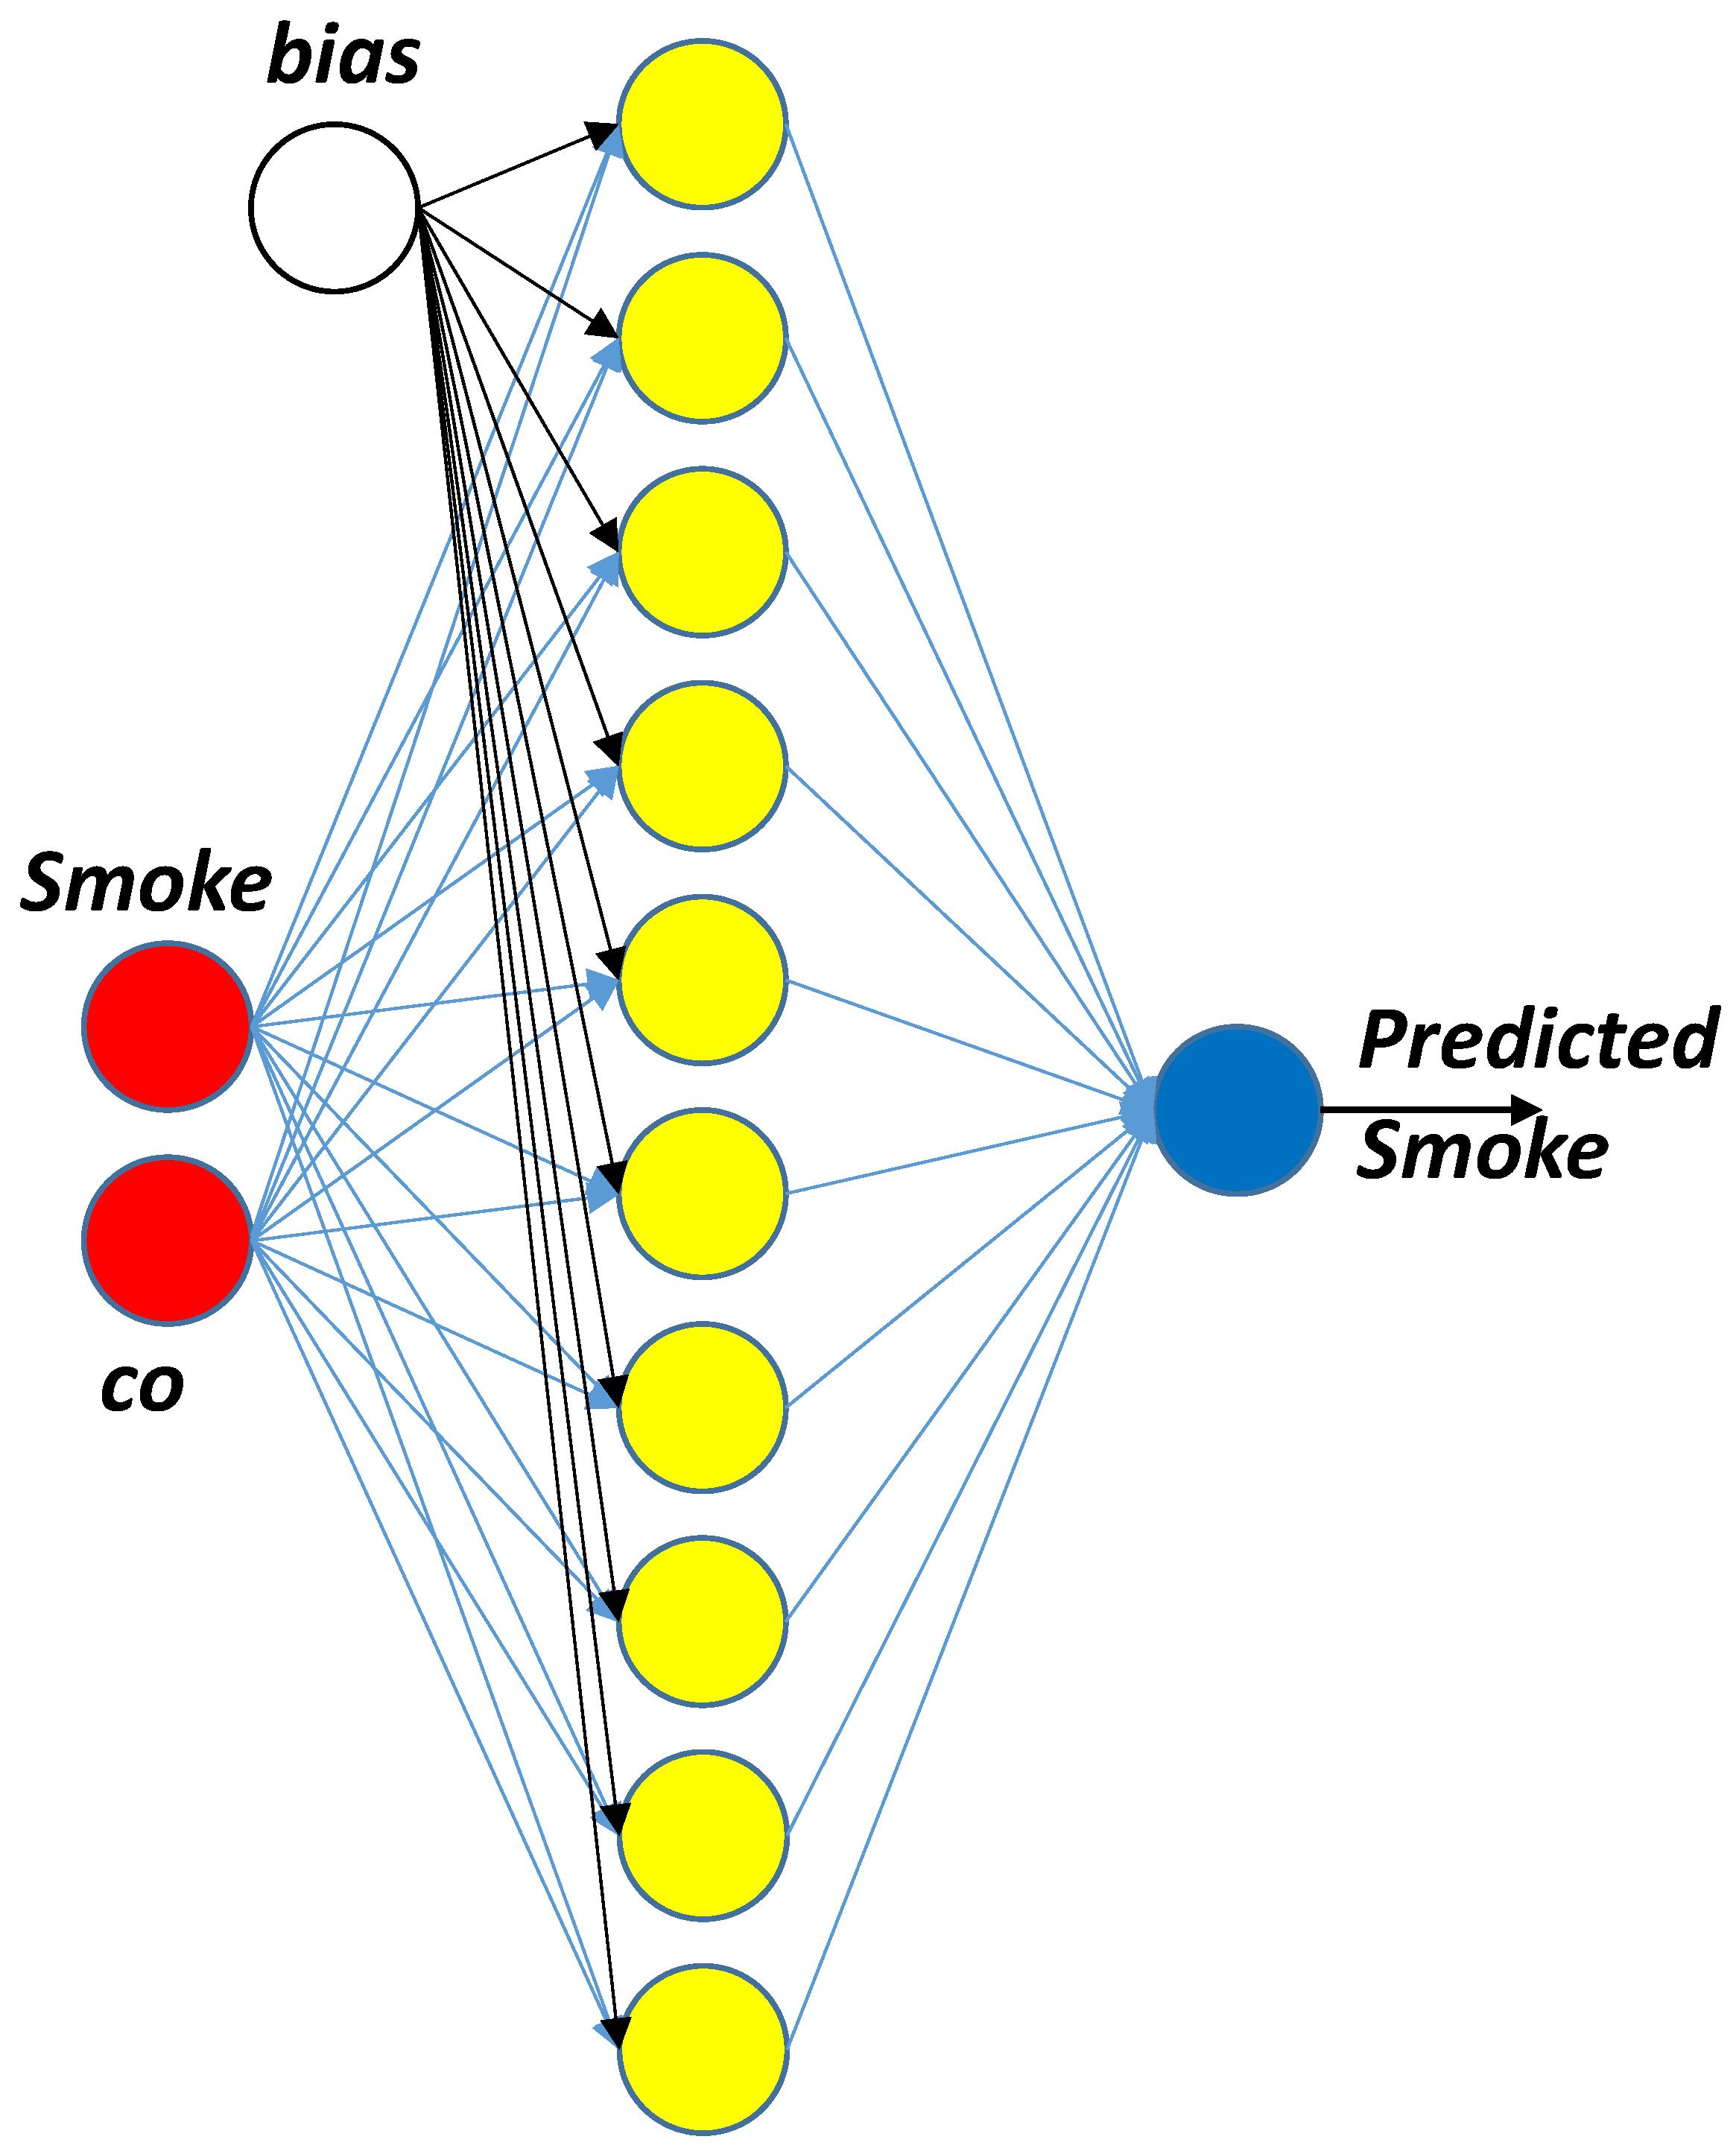
The ANN-MLP hyper-parameters adopted for the calculus are: 100 epochs (maximum number of iterations), 1 hidden layer, 10 hidden neurons per layer, smoke as labelled variable, 70% of the dataset for training process, 30% of the dataset for testing process, co and smoke as input nodes. The processed data refers to the location 1 (device 1). 405,184 records are processed for the prediction of the smoke variable. In Figure A4 is sketched the used ANN-MLP model according to the selected hyper-parameters.
Figure A4.
ANN-MLP network adopted for the prediction of the smoke variable.

References
- Massaro, A. Electronic in Advanced Research Industry: From Industry 4.0 to Industry 5.0 Advances; Wiley: Hoboken, NJ, USA; IEEE: New York, NY, USA, 2021; ISBN 9781119716877. [Google Scholar]
- Drakoulogkonas, P.; Apostolou, D. On the Selection of Process Mining Tools. Electronics 2021, 10, 451. [Google Scholar] [CrossRef]
- Springer. Lecture Notes in Business Information Processing. Available online: https://www.springer.com/series/7911 (accessed on 25 October 2022).
- Gope, A.K.; Liao, Y.-S.; Kuo, C.-F.J. Quality Prediction and Abnormal Processing Parameter Identification in Polypropylene Fiber Melt Spinning Using Artificial Intelligence Machine Learning and Deep Learning Algorithms. Polymers 2022, 14, 2739. [Google Scholar] [CrossRef]
- Wong, L.-T.; Mui, K.-W.; Tsang, T.-W. Updating Indoor Air Quality (IAQ) Assessment Screening Levels with Machine Learning Models. Int. J. Environ. Res. Public Health 2022, 19, 5724. [Google Scholar] [CrossRef]
- Álvarez-Díaz, N.; Caballero-Gil, P. Decision Support System Based on Indoor Location for Personnel Management. Remote Sens. 2021, 13, 248. [Google Scholar] [CrossRef]
- Fernandes, J.; Reis, J.; Melão, N.; Teixeira, L.; Amorim, M. The Role of Industry 4.0 and BPMN in the Arise of Condition-Based and Predictive Maintenance: A Case Study in the Automotive Industry. Appl. Sci. 2021, 11, 3438. [Google Scholar] [CrossRef]
- Zareen, S.; Akram, A.; Ahmad Khan, S. Security Requirements Engineering Framework with BPMN 2.0.2 Extension Model for Development of Information Systems. Appl. Sci. 2020, 10, 4981. [Google Scholar] [CrossRef]
- Massaro, A. Information Technology Infrastructures Supporting Industry 5.0 Facilities. In Electronics in Advanced Research Industries; Wiley: Hoboken, NJ, USA, 2021; pp. 51–101. [Google Scholar] [CrossRef]
- Massaro, A.; Maritati, V.; Savino, N.; Galiano, A.; Convertini, D.; De Fonte, E.; Di Muro, M. A Study of a Health Resources Management Platform Integrating Neural Networks and DSS Telemedicine for Homecare Assistance. Information 2018, 9, 176. [Google Scholar] [CrossRef] [Green Version]
- Bastos, P.; Lopes, I.; Pires, L. Application of data mining in a maintenance system for failure prediction. In Safety, Reliability and Risk Analysis: Beyond the Horizon; Steenbergen, R., Van Gelder, P.H.A.J.M., Miraglia, S., Vrouwenvelder, T., Eds.; Taylor & Francis Group: London, UK, 2014; pp. 933–940. ISBN 978-1-138-00123-7. [Google Scholar]
- Draw.io Releases Notes for 20.3.0. Available online: https://github.com/jgraph/drawio-desktop/releases (accessed on 25 October 2022).
- Berthold, M.R.; Cebron, N.; Dill, F.; Gabriel, T.R.; Kötter, T.; Meinl, T.; Ohl, P.; Sieb, C.; Thiel, K.; Wiswedel, B. KNIME: The Konstanz Information Miner. In Data Analysis, Machine Learning and Applications; Springer: Berlin/Heidelberg, Germany, 2008; pp. 319–326. [Google Scholar]
- KNIME. Available online: https://www.knime.com/ (accessed on 25 October 2022).
- Environmental Sensor Telemetry Data. Available online: https://www.kaggle.com/datasets/garystafford/environmental-sensor-data-132k (accessed on 24 October 2022).
- Kulinska, E.; Dendera-Gruszka, M. Hazards in the Production Process, Characteristics and Methods of Risk Elimination. Sci. J. Mil. Univ. Land Forces 2018, 189, 244–252. [Google Scholar] [CrossRef]
- Morales-Sánchez, V.; Rivero-Cruz, I.; Laguna-Hernández, G.; Salazar-Chávez, G.; Mata, R. Chemical Composition, Potential Toxicity, and Quality Control Procedures of the Crude Drug of Cyrtopodium Macrobulbon. J. Ethnopharmacol. 2014, 154, 790–797. [Google Scholar] [CrossRef]
- Hazards during Chemicals in Use and Safety Guideline. Available online: https://www.labour.gov.hk/eng/public/os/D/Chemicals.pdf (accessed on 26 October 2022).
- Massaro, A. “Energetic” KPI in Logistics: Complex System Theory and Multi-level Modeling. Zenodo 2022. Available online: https://zenodo.org/record/6137729#.Y1lLGXZBxPY (accessed on 26 October 2022).
- Magaletti, N.; Cosoli, G.; Massaro, A. Wearable Smart Sensors for Health Security in Transport: The Case of Study of Diabetic Risk Management Thought Advanced Data Analysis Approaches Integrated into Enterprise Process Models. Inf. Technol. Ind. 2021, 10, 1–8. Available online: https://it-in-industry.com/issue/archive/papers/121.html (accessed on 26 October 2022).
- Escaler, X.; Mebarki, T. Full-Scale Wind Turbine Vibration Signature Analysis. Machines 2018, 6, 63. [Google Scholar] [CrossRef] [Green Version]
- Massaro, A.; Starace, G. Advanced and Complex Energy Systems Monitoring and Control: A Review on Available Technologies and Their Application Criteria. Sensors 2022, 22, 4929. [Google Scholar] [CrossRef] [PubMed]
- Identifying High Voltage Hazards. Available online: https://www.worksafe.qld.gov.au/safety-and-prevention/hazards/electricity/hazardous-electrical-environments/identifying-high-voltage-hazards (accessed on 26 October 2022).
- Guerdelli, H.; Ferrari, C.; Barhoumi, W.; Ghazouani, H.; Berretti, S. Macro- and Micro-Expressions Facial Datasets: A Survey. Sensors 2022, 22, 1524. [Google Scholar] [CrossRef] [PubMed]
- Gayathri, M. Image Processing for Facial Expression Recognition in Recruitment. Ijcrt.org. Available online: https://ijcrt.org/papers/IJCRT2003107.pdf (accessed on 26 October 2022).
- Saloko, S.; Sulastri, Y.; Murad; Rinjani, M.A. The Effects of Temperature and Roasting Time on the Quality of Ground Robusta Coffee (Coffea rabusta) Using Gene Café Roaster. In Proceedings of the 2nd International Conference on Bioscience, Biotechnology, and Biometrics 2019, Lombok, Indonesia, 13–14 August 2019. [Google Scholar]
- Catelani, T.A.; Páscoa, R.N.M.J.; Santos, J.R.; Pezza, L.; Pezza, H.R.; Lima, J.L.F.C.; Lopes, J.A. A Non-Invasive Real-Time Methodology for the Quantification of Antioxidant Properties in Coffee during the Roasting Process Based on near-Infrared Spectroscopy. Food Bioproc. Tech. 2017, 10, 630–638. [Google Scholar] [CrossRef] [Green Version]
- Borrero, J.D.; Mariscal, J. A Case Study of a Digital Data Platform for the Agricultural Sector: A Valuable Decision Support System for Small Farmers. Agriculture 2022, 12, 767. [Google Scholar] [CrossRef]
- Massaro, A.; Savino, N.; Galiano, A. Agri-Photonics in Precision Agriculture. In Proceedings of the 2020 22nd International Conference on Transparent Optical Networks (ICTON), Bari, Italy, 19–23 July 2020; pp. 1–4. [Google Scholar] [CrossRef]
- Kim, C. Special Issue on Performance Measurement and Optimization for Sustainable Production Processes Improvement. Processes 2020, 8, 287. [Google Scholar] [CrossRef] [Green Version]
- Yin, S.; Li, B.; Zhang, X.; Zhang, M. How to Improve the Quality and Speed of Green New Product Development? Processes 2019, 7, 443. [Google Scholar] [CrossRef] [Green Version]
- Skėrė, S.; Žvironienė, A.; Juzėnas, K.; Petraitienė, S. Decision Support Method for Dynamic Production Planning. Machines 2022, 10, 994. [Google Scholar] [CrossRef]
- Kechagias, E.P.; Gayialis, S.P.; Konstantakopoulos, G.D.; Papadopoulos, G.A. An Application of a Multi-Criteria Approach for the Development of a Process Reference Model for Supply Chain Operations. Sustainability 2020, 12, 5791. [Google Scholar] [CrossRef]
- Poswa, F.; Adenuga, O.T.; Mpofu, K. Productivity Improvement Using Simulated Value Stream Mapping: A Case Study of the Truck Manufacturing Industry. Processes 2022, 10, 1884. [Google Scholar] [CrossRef]
- Cimino, M.G.C.A.; Vaglini, G. An Interval-Valued Approach to Business Process Simulation Based on Genetic Algorithms and the BPMN. Information 2014, 5, 319–356. [Google Scholar] [CrossRef] [Green Version]
- Krajčovič, M.; Furmannová, B.; Grznár, P.; Furmann, R.; Plinta, D.; Svitek, R.; Antoniuk, I. System of Parametric Modelling and Assessing the Production Staff Utilisation as a Basis for Aggregate Production Planning. Appl. Sci. 2021, 11, 9347. [Google Scholar] [CrossRef]
- Yan, X.; Duan, G. The Real-Time Prediction of Product Quality Based on the Equipment Parameters in a Smart Factory. Processes 2022, 10, 967. [Google Scholar] [CrossRef]
- Rebello, C.M.; Marrocos, P.H.; Costa, E.A.; Santana, V.V.; Rodrigues, A.E.; Ribeiro, A.M.; Nogueira, I.B.R. Machine Learning-Based Dynamic Modeling for Process Engineering Applications: A Guideline for Simulation and Prediction from Perceptron to Deep Learning. Processes 2022, 10, 250. [Google Scholar] [CrossRef]
- Meilanitasari, P.; Shin, S.-J. A Review of Prediction and Optimization for Sequence-Driven Scheduling in Job Shop Flexible Manufacturing Systems. Processes 2021, 9, 1391. [Google Scholar] [CrossRef]
- Lemos, J.; Gaspar, P.D.; Lima, T.M. Environmental Risk Assessment and Management in Industry 4.0: A Review of Technologies and Trends. Machines 2022, 10, 702. [Google Scholar] [CrossRef]
- Rantala, M.; Lindholm, M.; Tappura, S. Supporting Occupational Health and Safety Risk Assessment Skills: A Case Study of Five Companies. Int. J. Environ. Res. Public Health 2022, 19, 1720. [Google Scholar] [CrossRef]
- Massaro, A. Advanced Control Systems in Industry 5.0 Enabling Process Mining. Sensors 2022, 22, 8677. [Google Scholar] [CrossRef]
- Massaro, A.; Cosoli, G.; Magaletti, N.; Costantiello, A. A Search Methodology Based on Industrial Ontology and Machine Learning to Analyze Georeferenced Italian Districts. Knowledge 2022, 2, 243–265. [Google Scholar] [CrossRef]
- Lin, J.C.-W.; Djenouri, Y.; Srivastava, G.; Yun, U.; Fournier-Viger, P. A Predictive GA-Based Model for Closed High-Utility Itemset Mining. Appl. Soft Comput. 2021, 108, 107422. [Google Scholar] [CrossRef]
- Pery, A.; Rafiei, M.; Simon, M.; van der Aalst, W.M.P. Trustworthy Artificial Intelligence and Process Mining: Challenges and Opportunities. In Lecture Notes in Business Information Processing; Springer International Publishing: Cham, Switzerland, 2022; pp. 395–407. [Google Scholar]
Figure 1.
Block diagram of the “proof of concept” of the main PM model controlling production and worker safety by means of a multi-level DSS interconnected to AI algorithms.
Figure 1.
Block diagram of the “proof of concept” of the main PM model controlling production and worker safety by means of a multi-level DSS interconnected to AI algorithms.

Figure 4.
KNIME dashboards (output of the “Pie/Donut charts” blocks of the KNIME workflow of Figure 1). Alerting level 1 dashboards of location 1 (a), location 2 (b), and location 3 (c). Alerting level 2 dashboards of location 1 (d), location 2 (e), and location 3 (f). Alerting level 3 dashboards and summary of other alerting levels of location 1 (g), location 2 (h), and location 3 (i).

Figure 6.
KNIME results: (a) correlation matrix of selected variables using a colored scale (a) and double precision values (b).
Figure 6.
KNIME results: (a) correlation matrix of selected variables using a colored scale (a) and double precision values (b).

Figure 7.
KNIME ANN-MLP algorithm predicting smoke variable. Plots of smoke versus predicted smoke (a), and co versus predicted smoke (b). The red area represents the alerting condition.
Figure 7.
KNIME ANN-MLP algorithm predicting smoke variable. Plots of smoke versus predicted smoke (a), and co versus predicted smoke (b). The red area represents the alerting condition.

Figure 8.
KNIME ANN-MLP algorithm predicting smoke variable. Plots of smoke versus predicted smoke for location 1 (a), for location 2 (b), and for location 3 (b). The red area represents the alerting condition.
Figure 8.
KNIME ANN-MLP algorithm predicting smoke variable. Plots of smoke versus predicted smoke for location 1 (a), for location 2 (b), and for location 3 (b). The red area represents the alerting condition.


Table 1.
Problems of digital transformation, current solutions, and aspects concerning originality of the study.
Table 1.
Problems of digital transformation, current solutions, and aspects concerning originality of the study.
| Problems of Digital Transformation Involving PM | Current Solutions [1] | Originality of the Study |
|---|---|---|
| Knowledge Gain (KG) | Digital transformation process in industry involves the creation of a Knowledge Base (KB) and the possibility to gain information. Typically, the KG of a company is provided by the processing of data detected by Internet of Things (IoT) sensors. AI algorithms are also used to create KG. | The KG is also obtained by processing, in different phases, the digital data of sensors, thus providing incremental information about risks: the possibility of processing data by implementing specific logic conditions can strengthen decision making. |
| Risk mapping and risk prediction | The ‘AS IS’ and the ‘TO BE’ risk mapping is sketched by BPMN approach, integrating AI algorithms’ risk predictions. | The risks are estimated by a multi-level DSS, which simultaneously integrates specific logics and risk forecasting. The prediction is mainly indicated for the ‘TO BE’ processes matched with the medium and the long period. The prediction activity is performed by AI algorithms that gain information about possible risks, thereby improving the risk assessment. A preliminary analysis of the correlation of variables is important for a ‘precise’ prediction (selection of the variables having a major weight for the specific analysis). |
| Decision-making for intervention | Decision making processes are driven by AI results (robotic handling, predictive maintenance, etc.). | The decision-making processes are classified into intervention classes depending on the estimated alerting levels. The efficacy of the intervention is increased. |
| Real time alerting process | Real time data processing is fundamental for adopting rapid interventions by avoiding the risk degeneration for health and for the breakage of components. | Real time data processing can be activated only when it is required, thereby making computing resources more efficient. |
Table 2.
Alerting conditions as results of the check of thresholds and of the ANN-MLP predicted alert.
Table 2.
Alerting conditions as results of the check of thresholds and of the ANN-MLP predicted alert.
| Location | Alert 1 | Alert 2 | Alert 3 | Predicted Alert | MAE |
|---|---|---|---|---|---|
| Location 1 | Yes | Low | Low | No alert | 0.001 |
| Location 2 | No | No | No | Moderate alert | 0.001 |
| Location 3 | Yes | Yes | Yes | High Alert | 0.001 |
Table 3.
Classes of key variables to control production quality and worker security.
| Industry Production Sector | Key Variables to Control for the Quality Process | Key Variables to Control for the Worker Security |
|---|---|---|
| Manufacturing | Defects magnitude (defect classification) controlling processing tolerance, quality of assembled parts (check of welds), quality of cut parts, process temperature (for productions controlled in temperature), pressure of machine, product alignment on the machine, smoke (machine malfunction), correct use of electronic/mechatronic tools in advanced manufacturing and in additive manufacturing [1]. | Distance from machine, breathing emitted gas, presence small parts shot in the air due to the tool processing (danger for eyes), temperature of the environment, correct use of the manual tool, smoke emission, lighting of the environment, worker distractions, improper movements, tools misuse, failure to follow safety instructions, unauthorized repair of defects in equipment [16]. |
| Chemical | Check of chemical compositions, toxicity level [17], clean tools (contaminants detection). | Breathing of emitted gases, interaction between chemical liquids, fire/explosion risk, intoxication level [18]. |
| Logistics | Key Performance Indicators (KPI) about fleet management (loads, patterns, vehicle traceability by satellite Global Positioning System (GPS) sensors, fuel consumption, etc.) [19]. | Distances from vehicles (intralogistics operations), health of drivers (requiring a real time monitoring system [20]). |
| Energy Production | Energy balancing, KPI for energy, produced current/voltage (renewable energy systems), correct setting of energy tools (energy of inverters, power of electrical transformers, correct orientation and efficiency of photovoltaic panels, wind turbine vibrations [21], etc.) [22]. | Electric power (exposition to high voltages), electrical insulation of the components to handle, distance from high voltage electrical cable (according to the local laws) [23]. |
| Engineering Services | Time to develop the engineering design. | Correct use of tools for engineering design and plant maintenance, following of guidelines about inspection procedures. |
| Human Resource (HR) selection | Adoption of psychological methods to check the worker suitability (humor, micro- and macro- expressions [24], worker movements during the interview) [25]. | No particular elements. |
| Food | Temperature (in roasting/cooking processes and in general processes requiring ovens) [26] and Near Infrared Spectroscopy (NIR) [27], disinfection, presence of contaminants. | Interaction with food processing machine (mainly food processes are automatic). |
| Agriculture | DSS applied in agriculture scenarios (precision agriculture) [28,29] | Correct use of agriculture machines in the field. |
Table 4.
Literature and research gap concerning main research topics involving PM.
| Research Topic | Topic Description | Proposed Research Advances (Possible Applications) |
|---|---|---|
| Process improvement [30,31,32,33] | Optimization for sustainable product process improvement, modeling analytic hierarchy processes for the development of new products, solutions for computerised decision support systems, multi-criteria approach for the development of a process reference model for supply chain operations. | The sustainability of product process improvement can be analyzed by analyzing different crucial aspect classified as for hierarchical models, where the ‘root node’ represents the main problem to solve. The multi-level model allows to improve the hierarchical model by defining the key variables contributing for process improvement. |
| Process simulation [34,35,36] | Simulations for optimal process flow improving productivity, algorithms for BPMN approach simulating business processes, simulations as production planning methods. | Processes can be easily simulated by simultaneously considering the real time monitoring checking threshold overcoming of the analyzed variable and forecasting (see Figure 2). |
| Process prediction [37,38,39] | Prediction of product quality, dynamic predicting models for process engineering, prediction for job scheduling. | The decision making is performed by merging the statistical analysis with the predicted one. The variables to analyze can be pre-processed in order to select ones having a major weight for the prediction (the other irrelevant variables are not considered in the calculus thus avoiding computing consumption and the redundancy of information). |
| Risk management [10,20,40,41,42,43] | Risk management in the conditions of economic transformation, Industry 4.0 environmental risk assessment, safety risk assessment, worker/patient health risk control, production risk, supply chain district management. | Interventions are planned in function of the detected risk defining different hazard levels. This principle is applied for production monitoring and for worker health control. |
| Market Decisions [44,45] | Decision making using AI optimizing recommendations of information/products and regulatory compliance processes. | The proposed PM model is suitable to be applied also in the strategic marketing field, by defining hierarchical risk levels according to new specific key variables as for [44,45]. |
Table 5.
Main advantages of the PM outputs.
| PM Output | Production | Safety in Workplace |
|---|---|---|
| Guidelines for risk assessment | Reduction of costs related to machine malfunctions; optimization of the management of raw materials; optimization of the checkpoints according to the standard ISO 9001:2015; major control of the product’s defects; formulation of exit strategies due to a high production risk. | Definition of the best rules for worker’s behavior; selection of responsible for the safety of a specific area (safety manager); improvement of the control of plants, of machines and of working conditions; adoption of risk containment measures. |
| Intervention plan | Formulation of a predictive maintenance plan; definition of a strategy avoiding the risk of production stoppage; guarantee of continuity of production; increase of production efficiency; increase of product quality. | Preventive actions addressed on risk prevention; staff displacement according to their behavior; predictive maintenance of parts which could be a risk for the worker; training plan about work behavior and the correct use of machines or tools. |
Table 6.
PM outcomes of the case.
| PM Outcome (Application of the PM Model) | Outcome Description |
|---|---|
| Definition of risk hazard levels (alerting levels of the PM model) | According to the risk assessment model of Figure 9, the first step to apply of the PM model is to define the risk levels (phases 1 and 2 of Figure 9). The classification of the key variables to process (phase 3 of Figure 9) are the variables having a major weight regarding worker security impact: the whole dataset (see Appendix A) provides the temperature, humidity, light, motion, smoke, gas (lpg), and CO, but only light, smoke, CO, and gas are the key variables to be indicated in the preliminary risk analysis. Therefore, the matching of the PM model of Figure 1 with the dataset allows for the establishment of three alerting level: the first is related to the lighting condition, the second takes into account the smoke emission, and the third also considers the gas and the CO emission. This preliminary classification allows for a risk assessment characterized by the alerting thresholds (the hypnotized thresholds are 0.02 ppm % for smoke, 0.05 ppm % for co, and 0.08 for lpg). |
| First alerting level (lighting condition of the working environment) | The lighting of worker environment represents a ‘basic risk’: the case of absence of light enables the urgent first intervention to activate light. According to the dashboards of Figure 4, location 1 and location 3 are the environments at which the first intervention should be urgently applied (control of the entire lighting system due to frequent absence of light). Further, we note that the AI prediction in this stage (as indicated in the first pool of Figure 1) is unnecessary, because the prediction of lighting condition does not depend on causes of breakdown of machines. In any case, in the presence or in absence of lightning, the second level check phase is enabled (see dashed lines of Figure 1 starting at the first pool and ending at the second pool). |
| Second alerting level (high- risk level) | The simultaneous condition of absence of light (Alert 1) and the presence of smoke represents a high-risk condition (second level of the hazard risk scale defined by the overcoming of the smoke threshold value of 0.05 % ppm). The smoke variable is classified as the second important key variable, because after its emission, gases will appear due to deeper machine damage happening after a long period of smoke emission (very high-risk level). By observing Figure 4, location 3 is mainly characterized by this risk (Alert 2). Besides, for location 2, there is a lower probability of this risk, and for location 1, this risk is not present. A very urgent intervention is required for location 3 (control of lighting condition and of the machine status). A deeper analysis is performed by means of the AI prediction check (see second pool of Figure 2). The AI prediction (see second pool of Figure 1) is performed by analyzing the most-correlated key variables smoke and co (see Figure 6). The ANN-MLP prediction shows a no-risk prediction (see Figure 7) for location 1: the machines are checked without stopping production, and the hazard level of location 1 is updated as lower level (according to phase 5 of Figure 9), and no very urgent interventions are planned over the short and medium period. On the other side, the prediction of smoke at location 2 represents a potential risk, activating a monitoring plan. Finally, the prediction of smoke at location 3 confirms the very critical condition, thus requiring a very urgent intervention (by stopping production machines if necessary). |
| Third alerting level (very high-risk level) | A very high alert condition (Alert 3) is verified when Alert 2 condition and the threshold overcoming conditions of 0.05 ppm % for co, and 0.08 for lpg are simultaneously verified. Further, we note that the AI prediction at this stage is unnecessary (as indicated in the third pool of Figure 1) because the prediction performed in the second level is enough to confirm the execution of the plan. Results confirm that location 3 exhibits a very dangerous condition (Alert 3); this allows for an update of the risk assessment (according to the phase 5 of Figure 9) for location 3 by periodically controlling the machines updating, as well as the related intervention plan (according to the phase 6 of Figure 9): a possible solution is to assign more responsible and attentive workers to location 3. |
Publisher’s Note: MDPI stays neutral with regard to jurisdictional claims in published maps and institutional affiliations. |
© 2022 by the author. Licensee MDPI, Basel, Switzerland. This article is an open access article distributed under the terms and conditions of the Creative Commons Attribution (CC BY) license (https://creativecommons.org/licenses/by/4.0/).
Share and Cite
MDPI and ACS Style
Massaro, A. Multi-Level Decision Support System in Production and Safety Management. Knowledge 2022, 2, 682-701. https://doi.org/10.3390/knowledge2040039
AMA Style
Massaro A. Multi-Level Decision Support System in Production and Safety Management. Knowledge. 2022; 2(4):682-701. https://doi.org/10.3390/knowledge2040039
Chicago/Turabian StyleMassaro, Alessandro. 2022. "Multi-Level Decision Support System in Production and Safety Management" Knowledge 2, no. 4: 682-701. https://doi.org/10.3390/knowledge2040039