SmartPipes: Smart Wireless Sensor Networks for Leak Detection in Water Pipelines


Abstract
:
1. Introduction
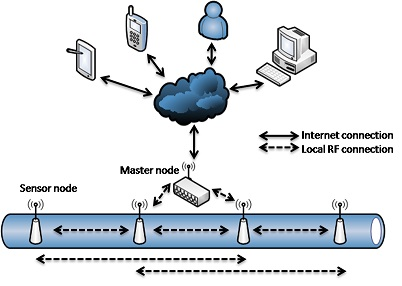
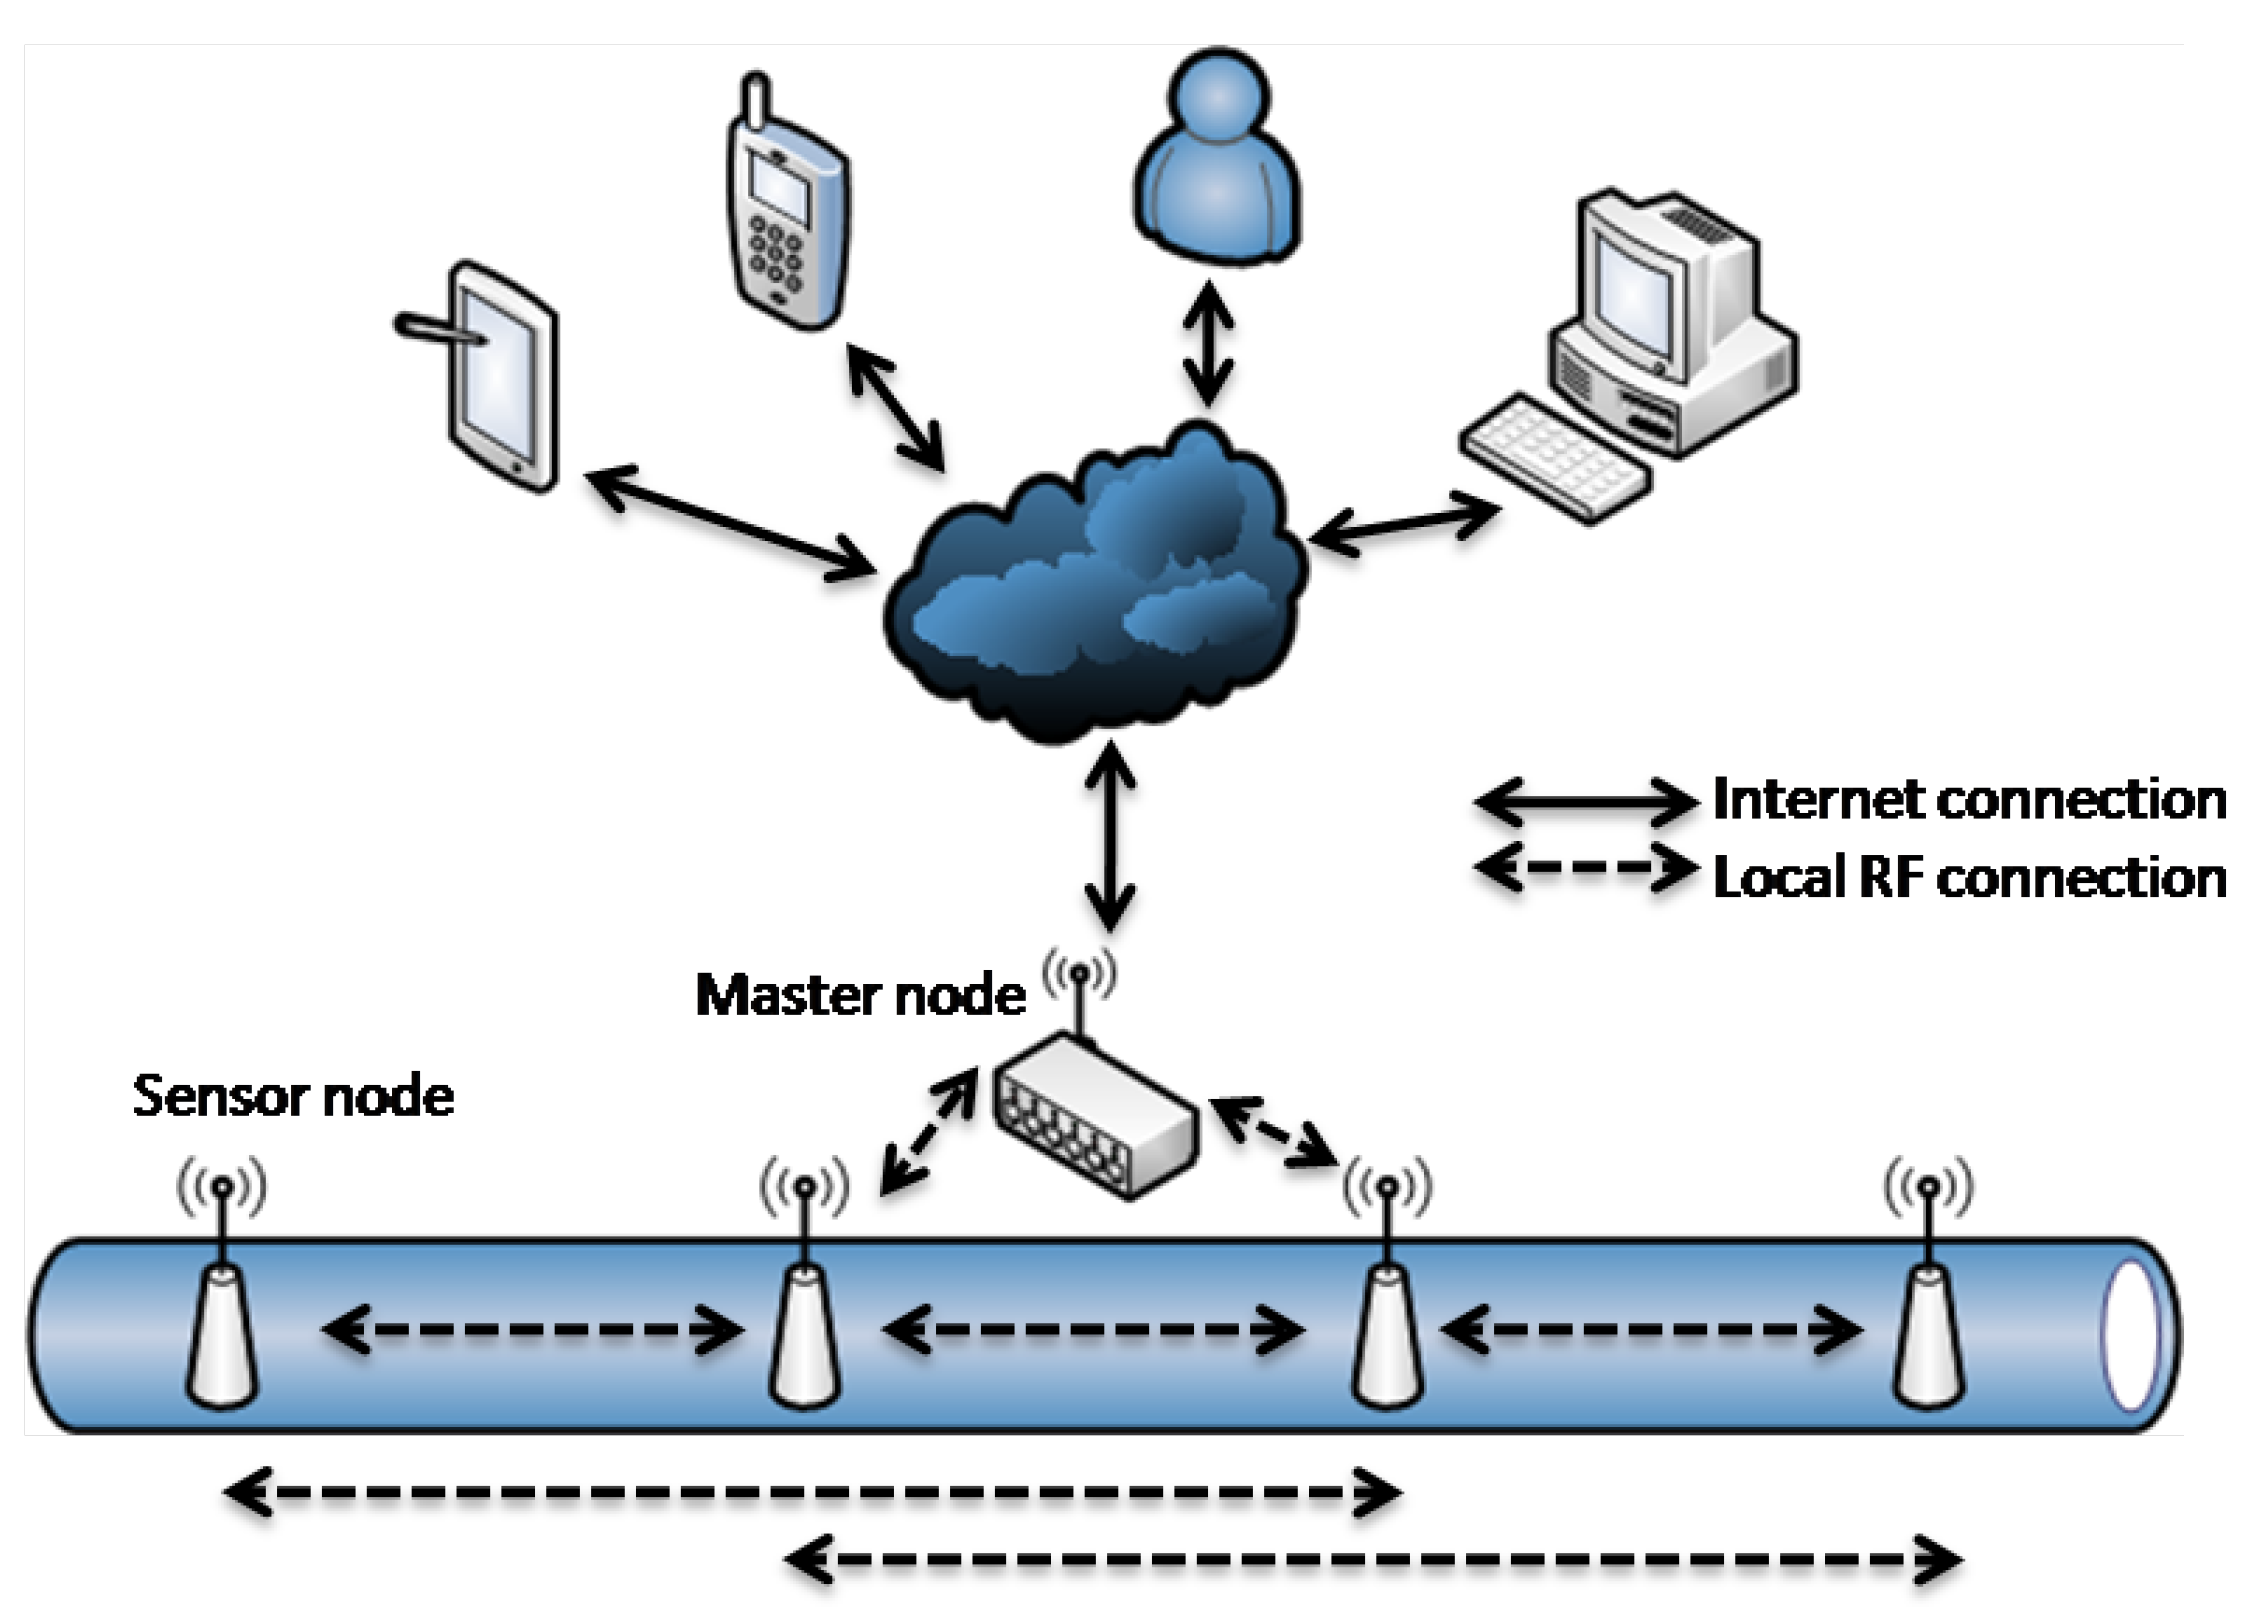
2. System Design

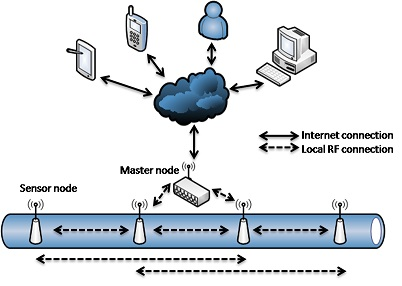
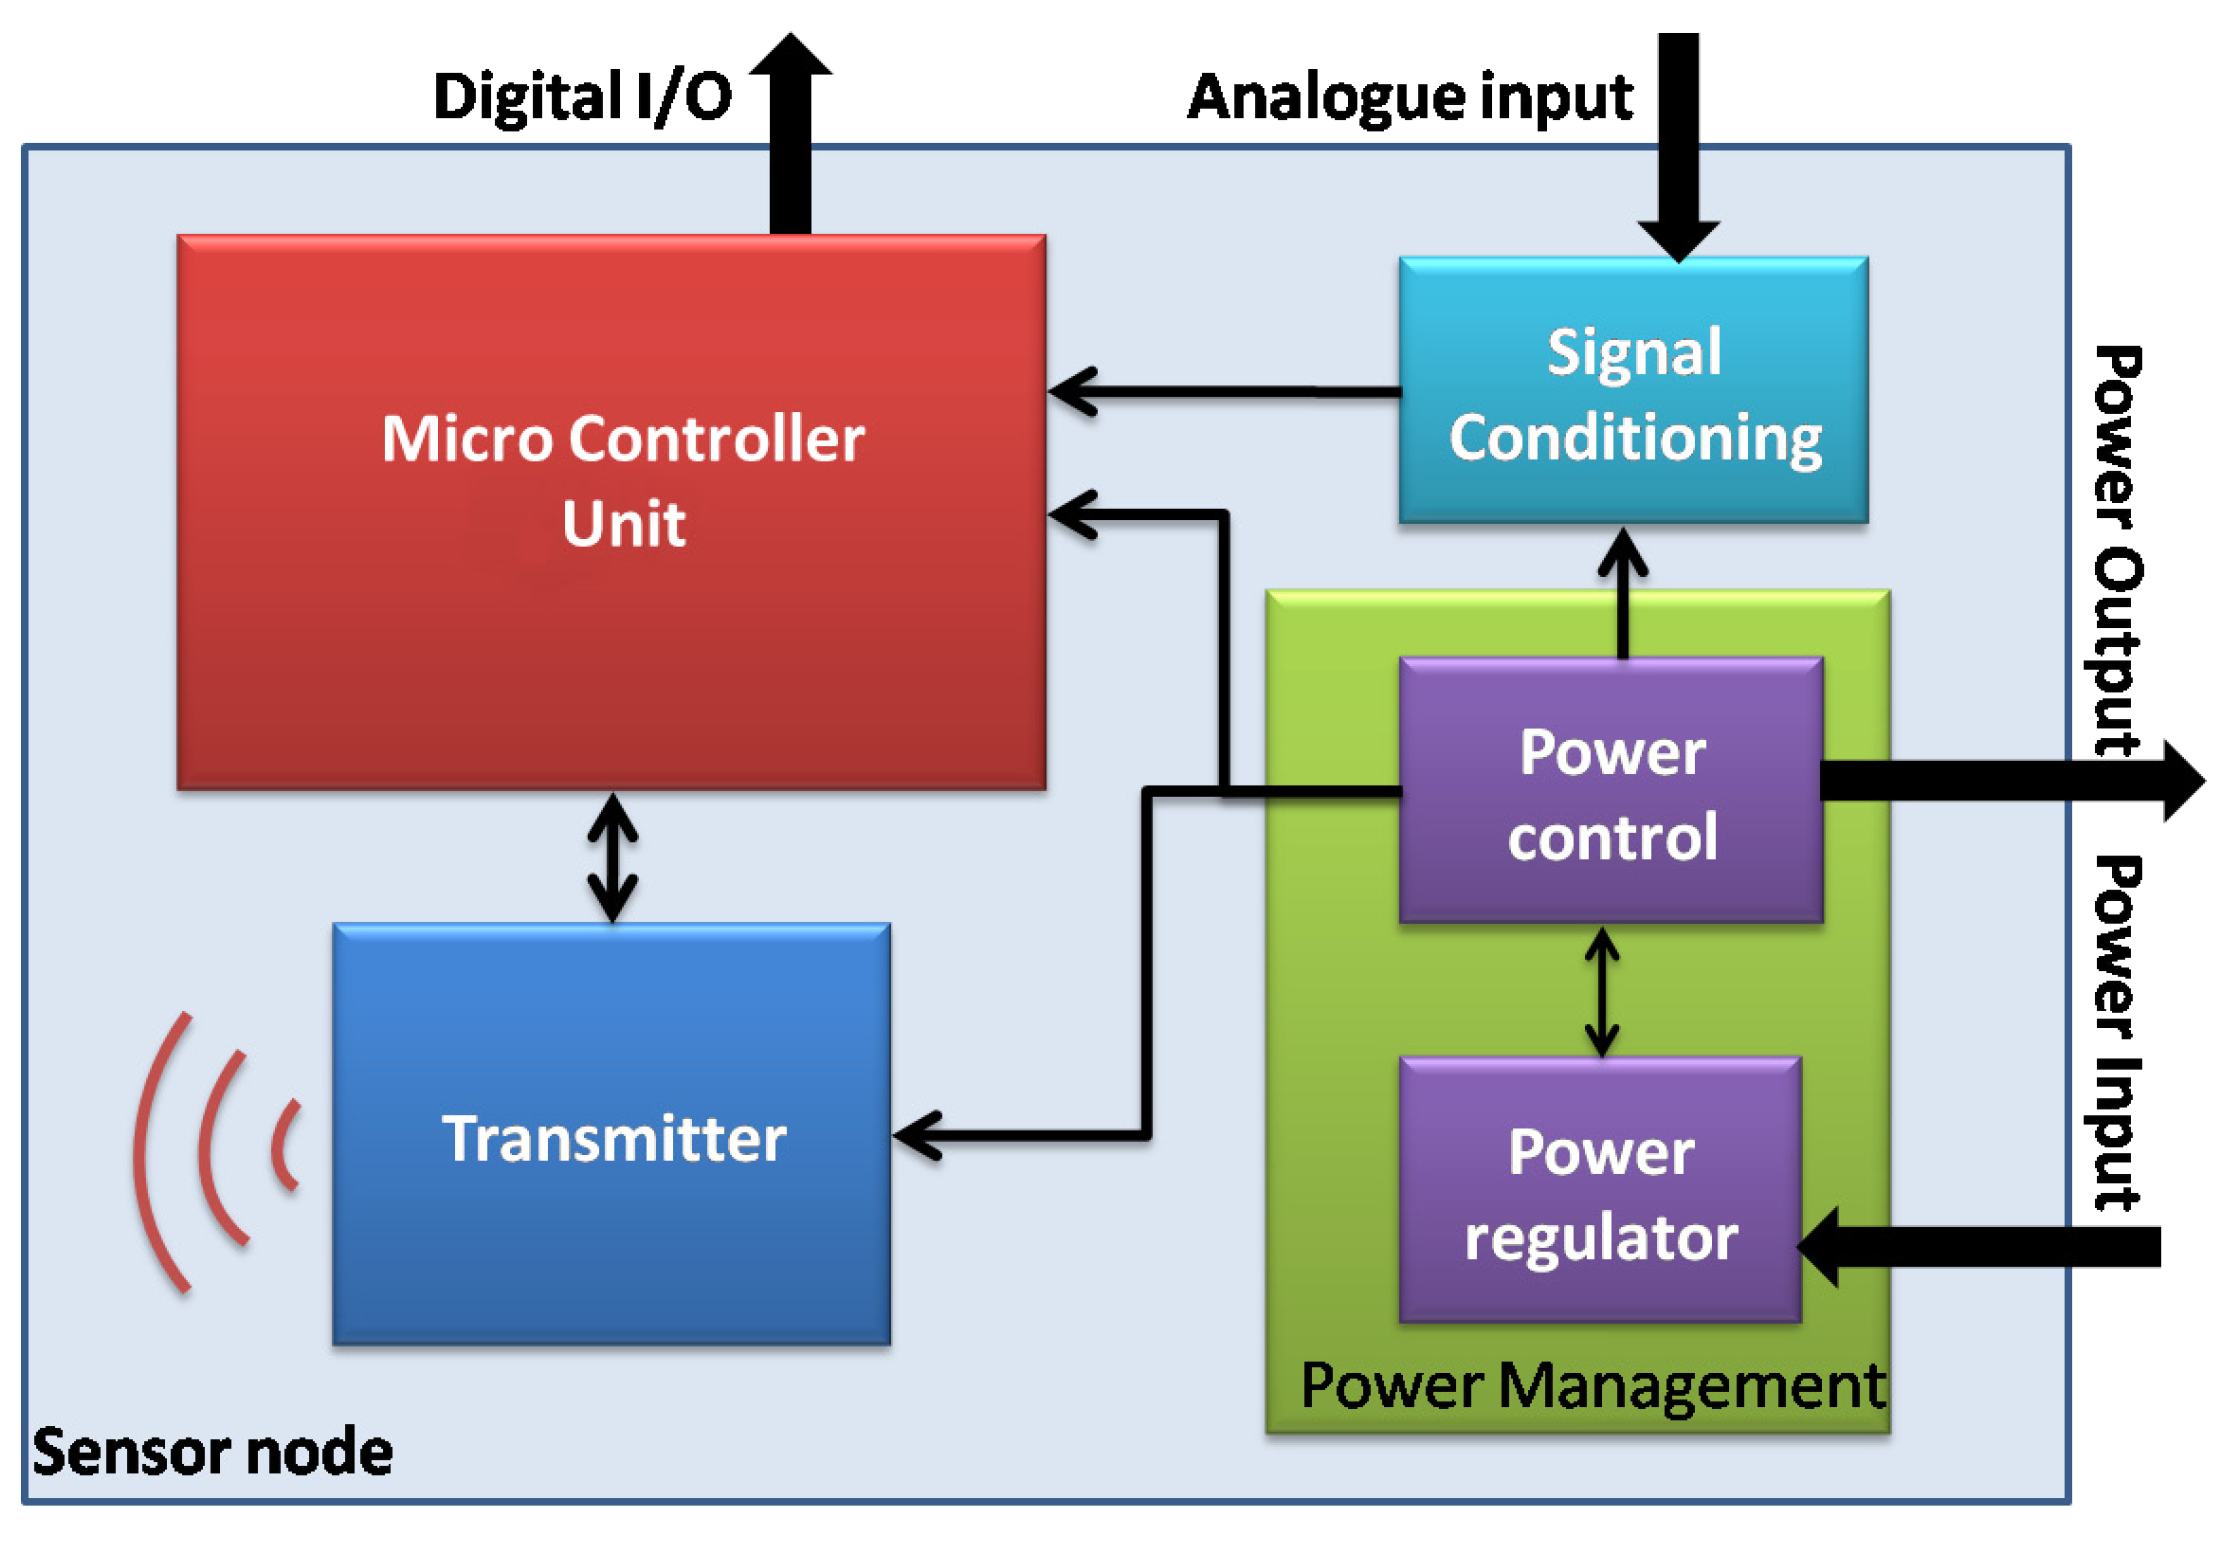
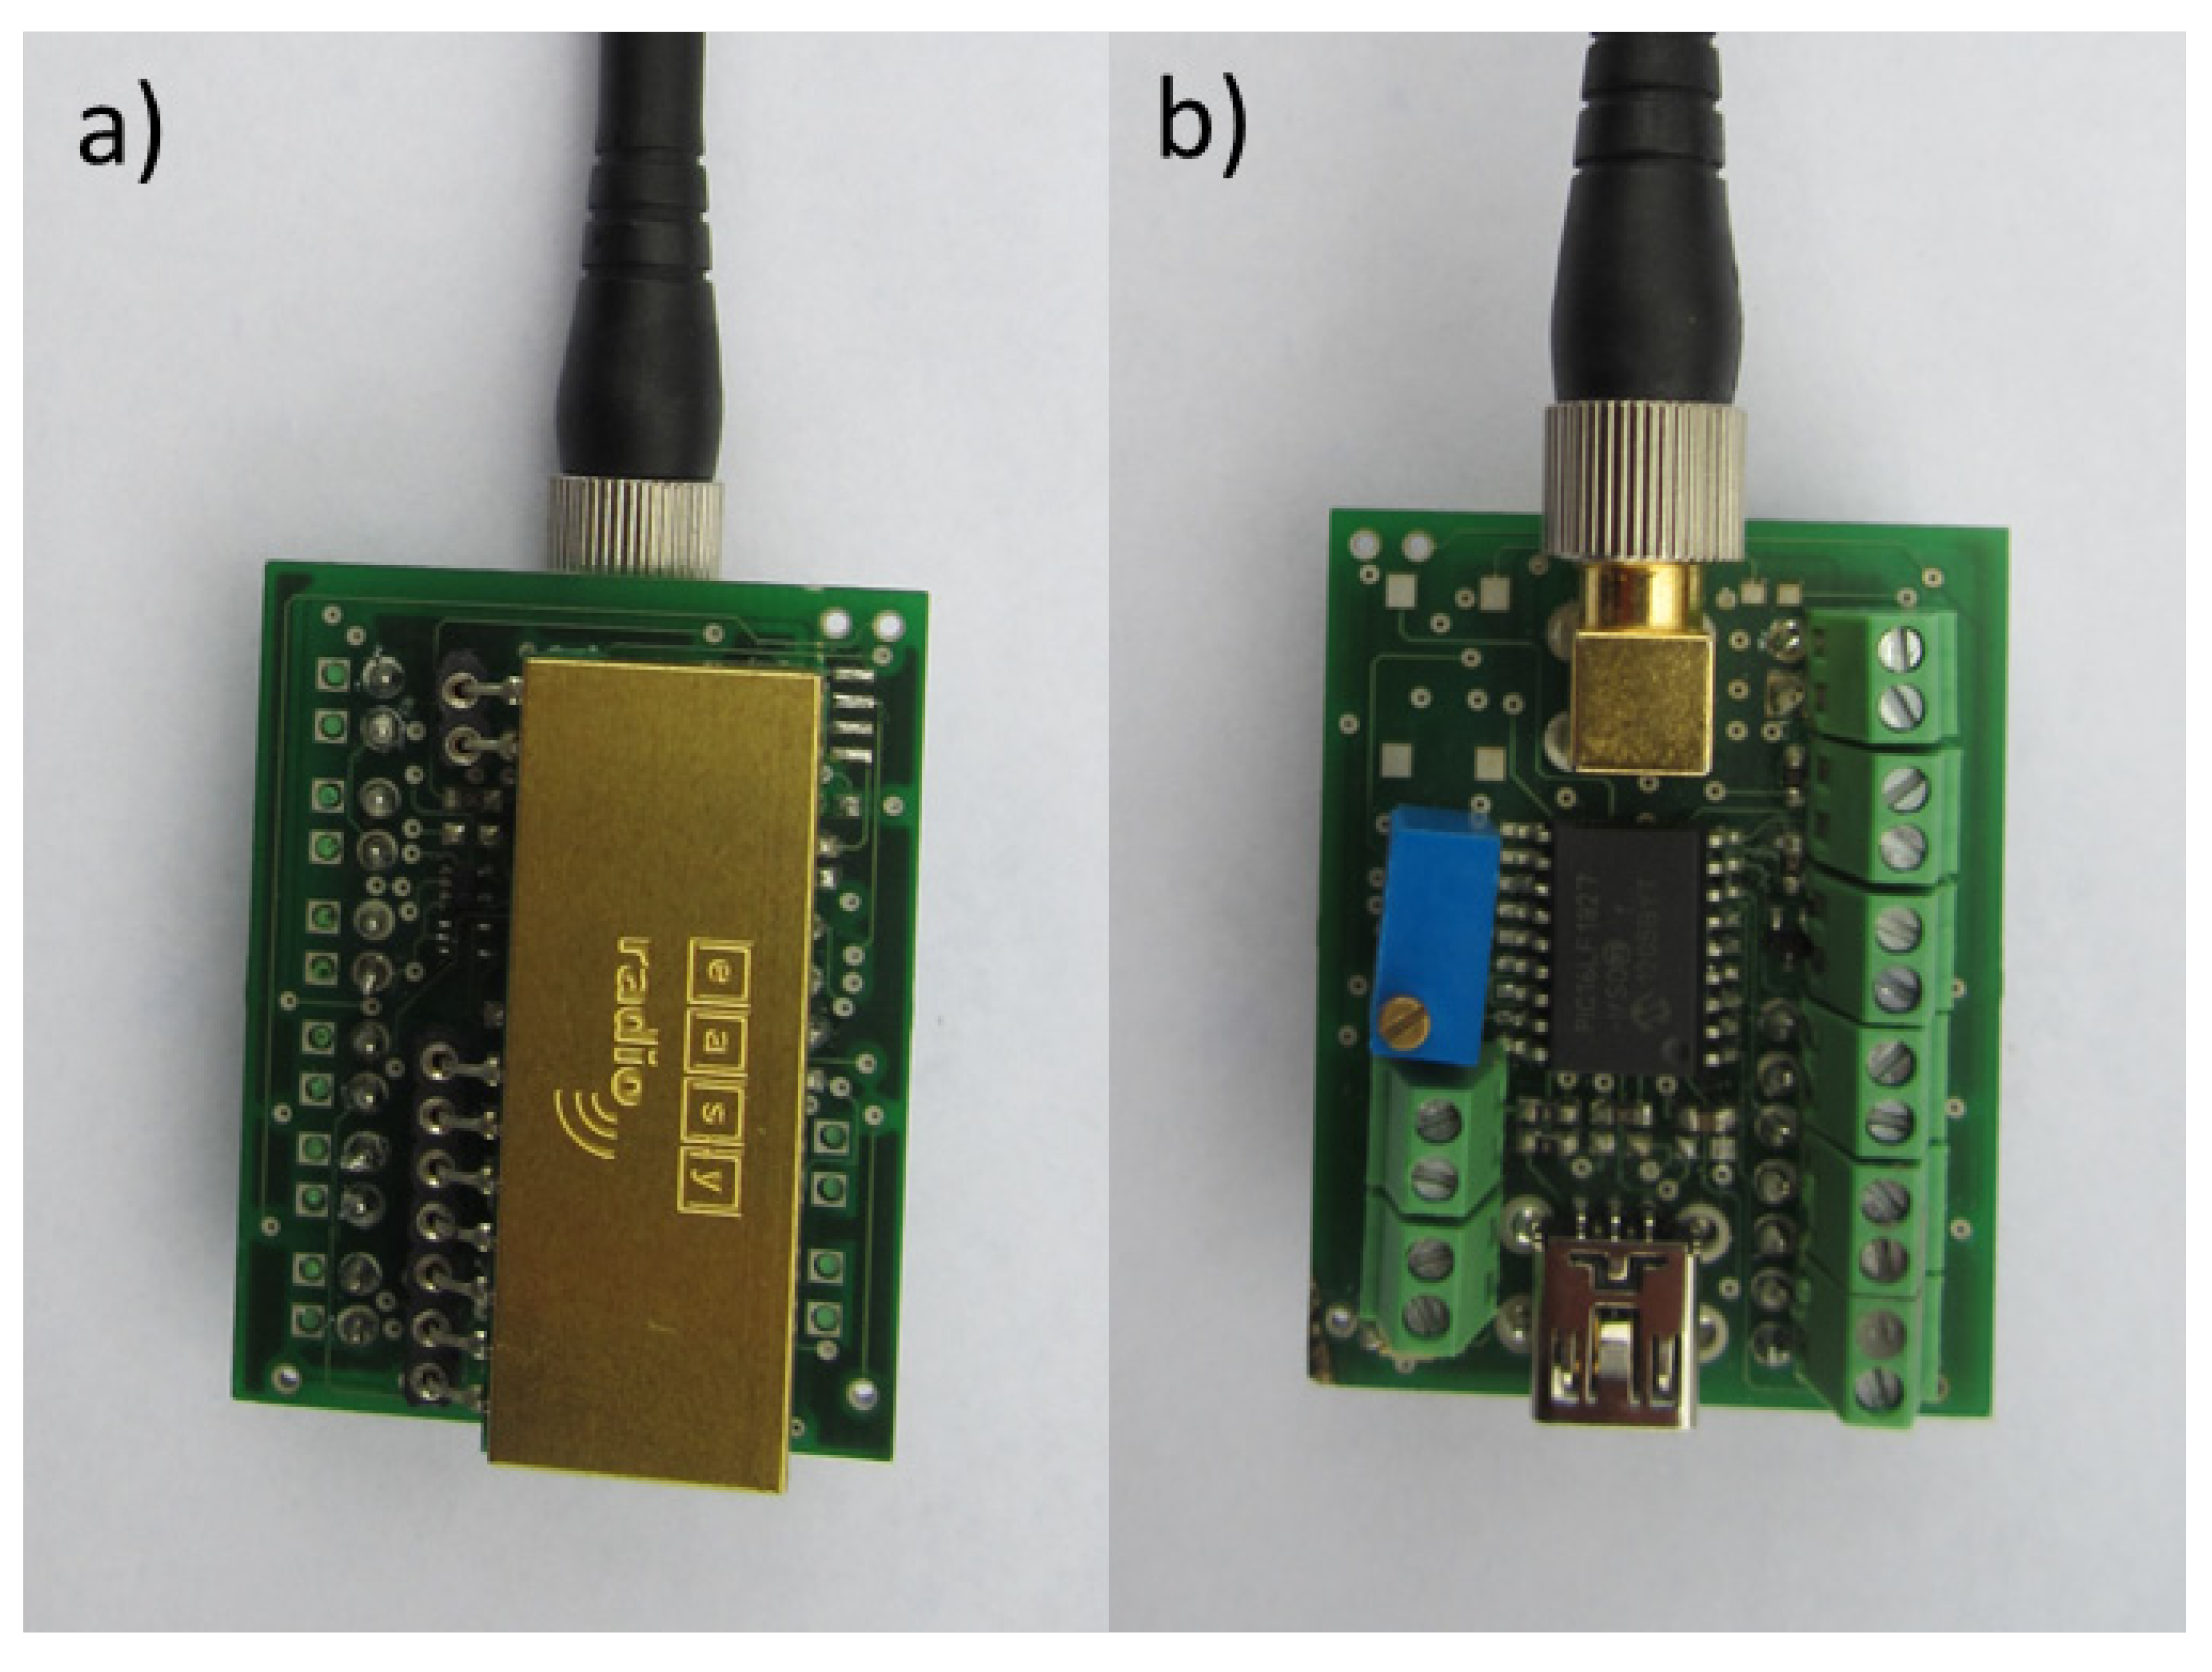
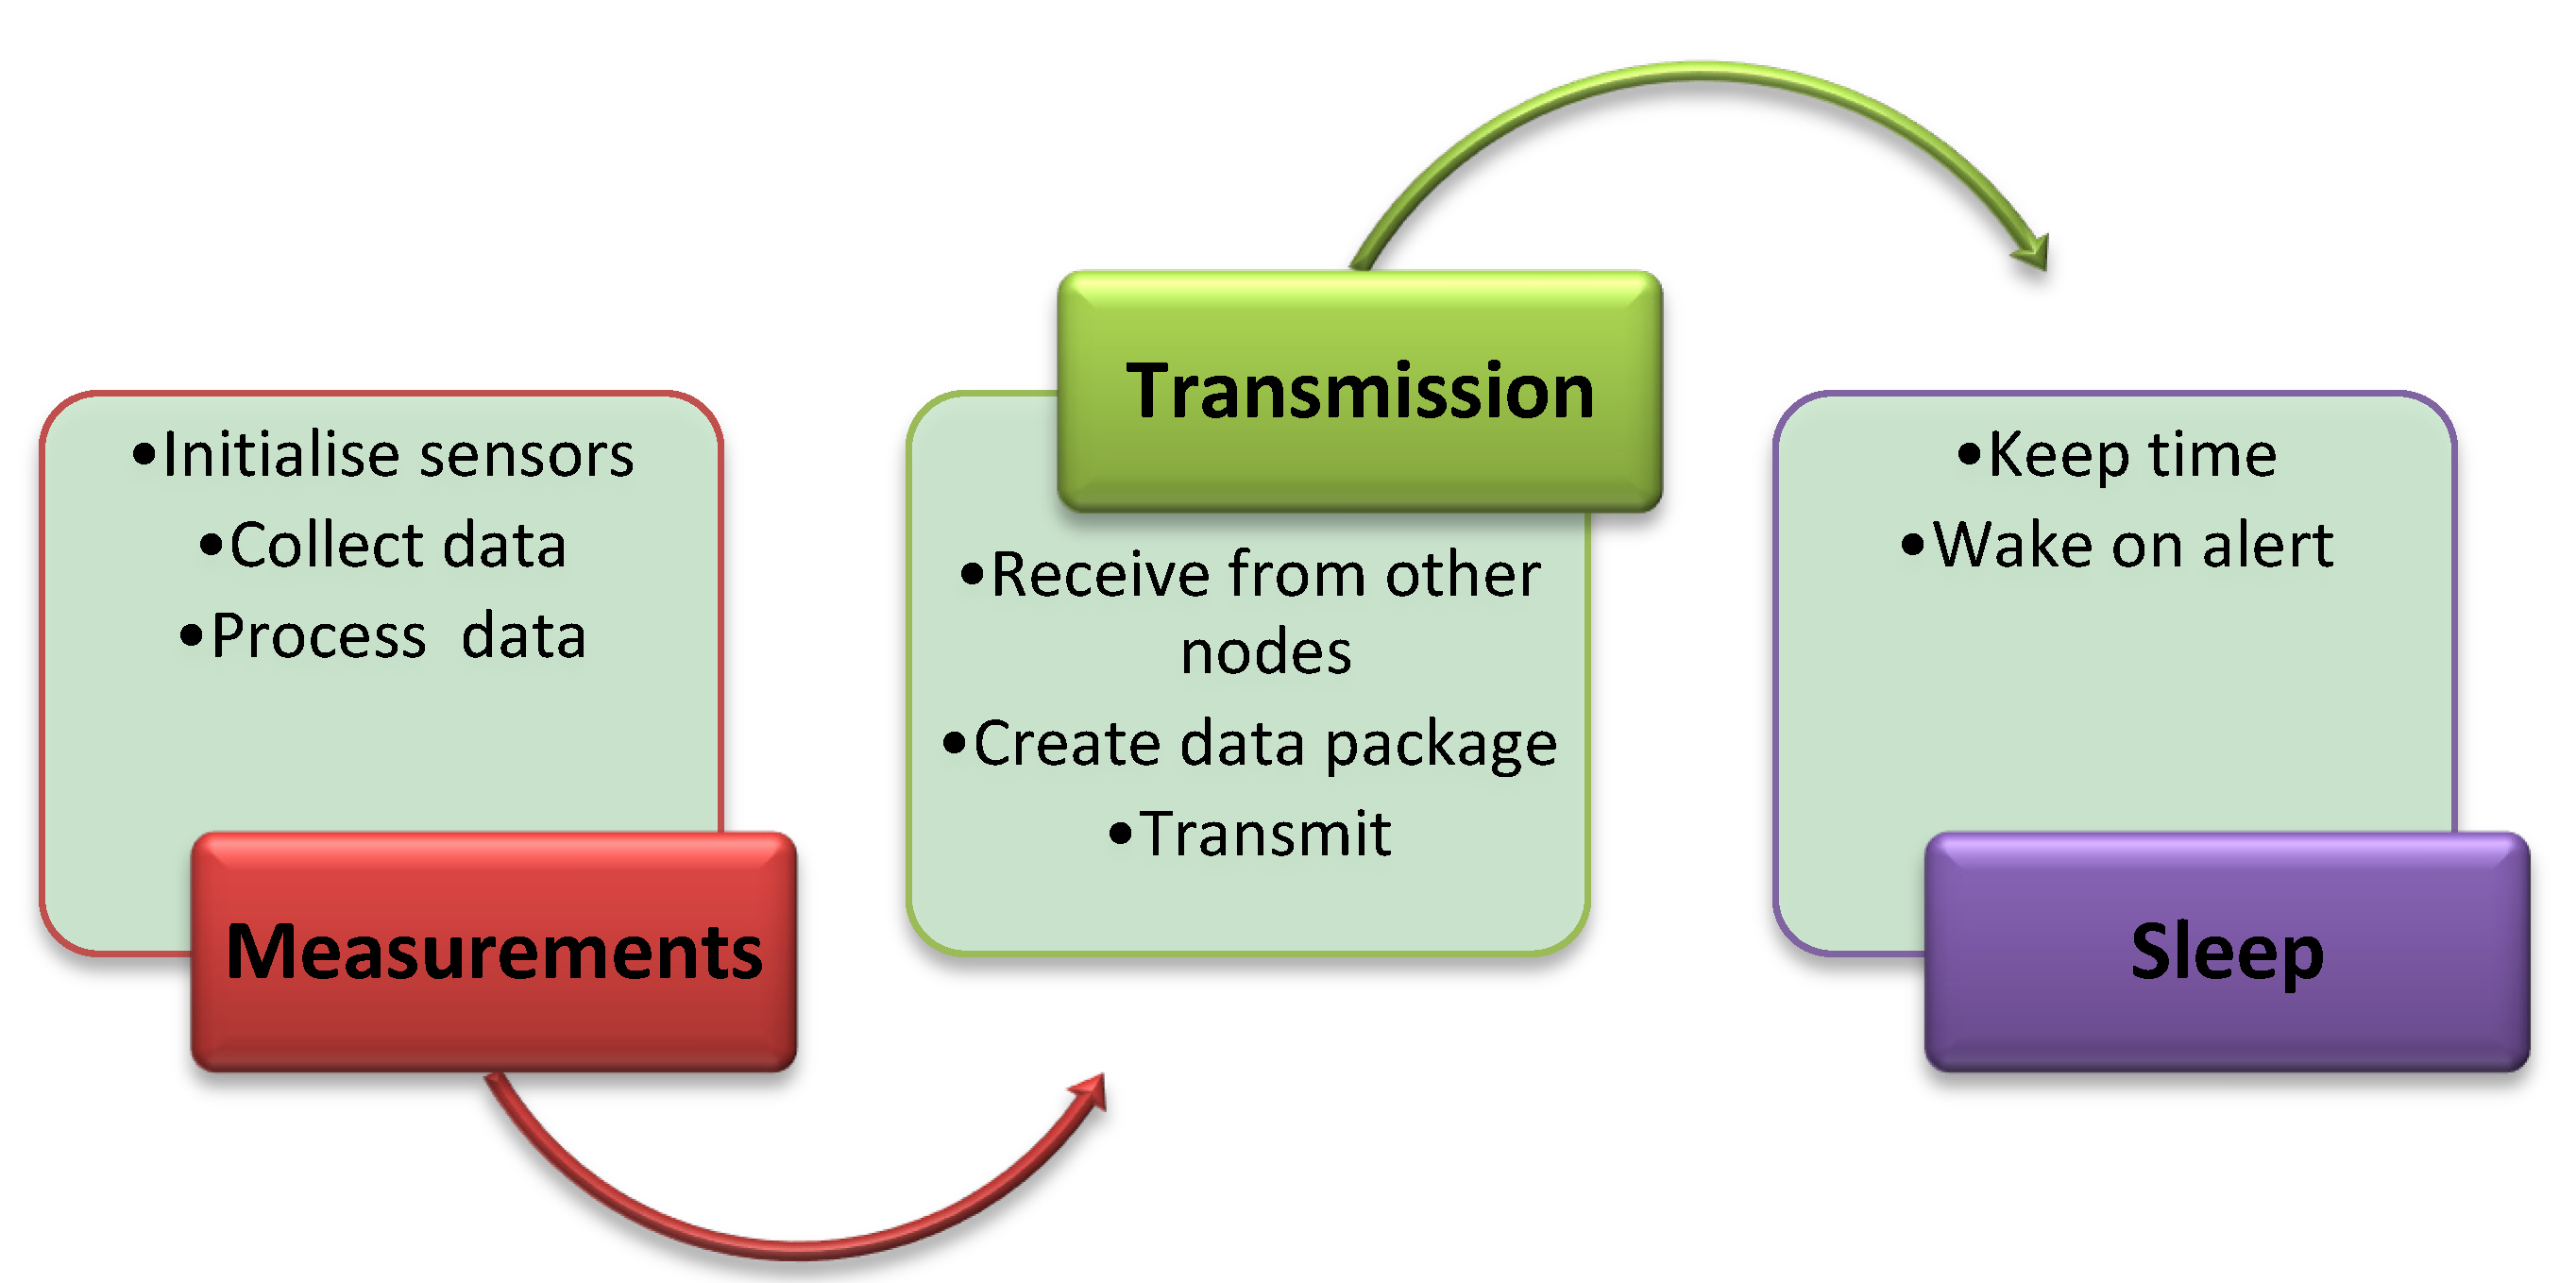
2.1. Processing Unit and Transmission


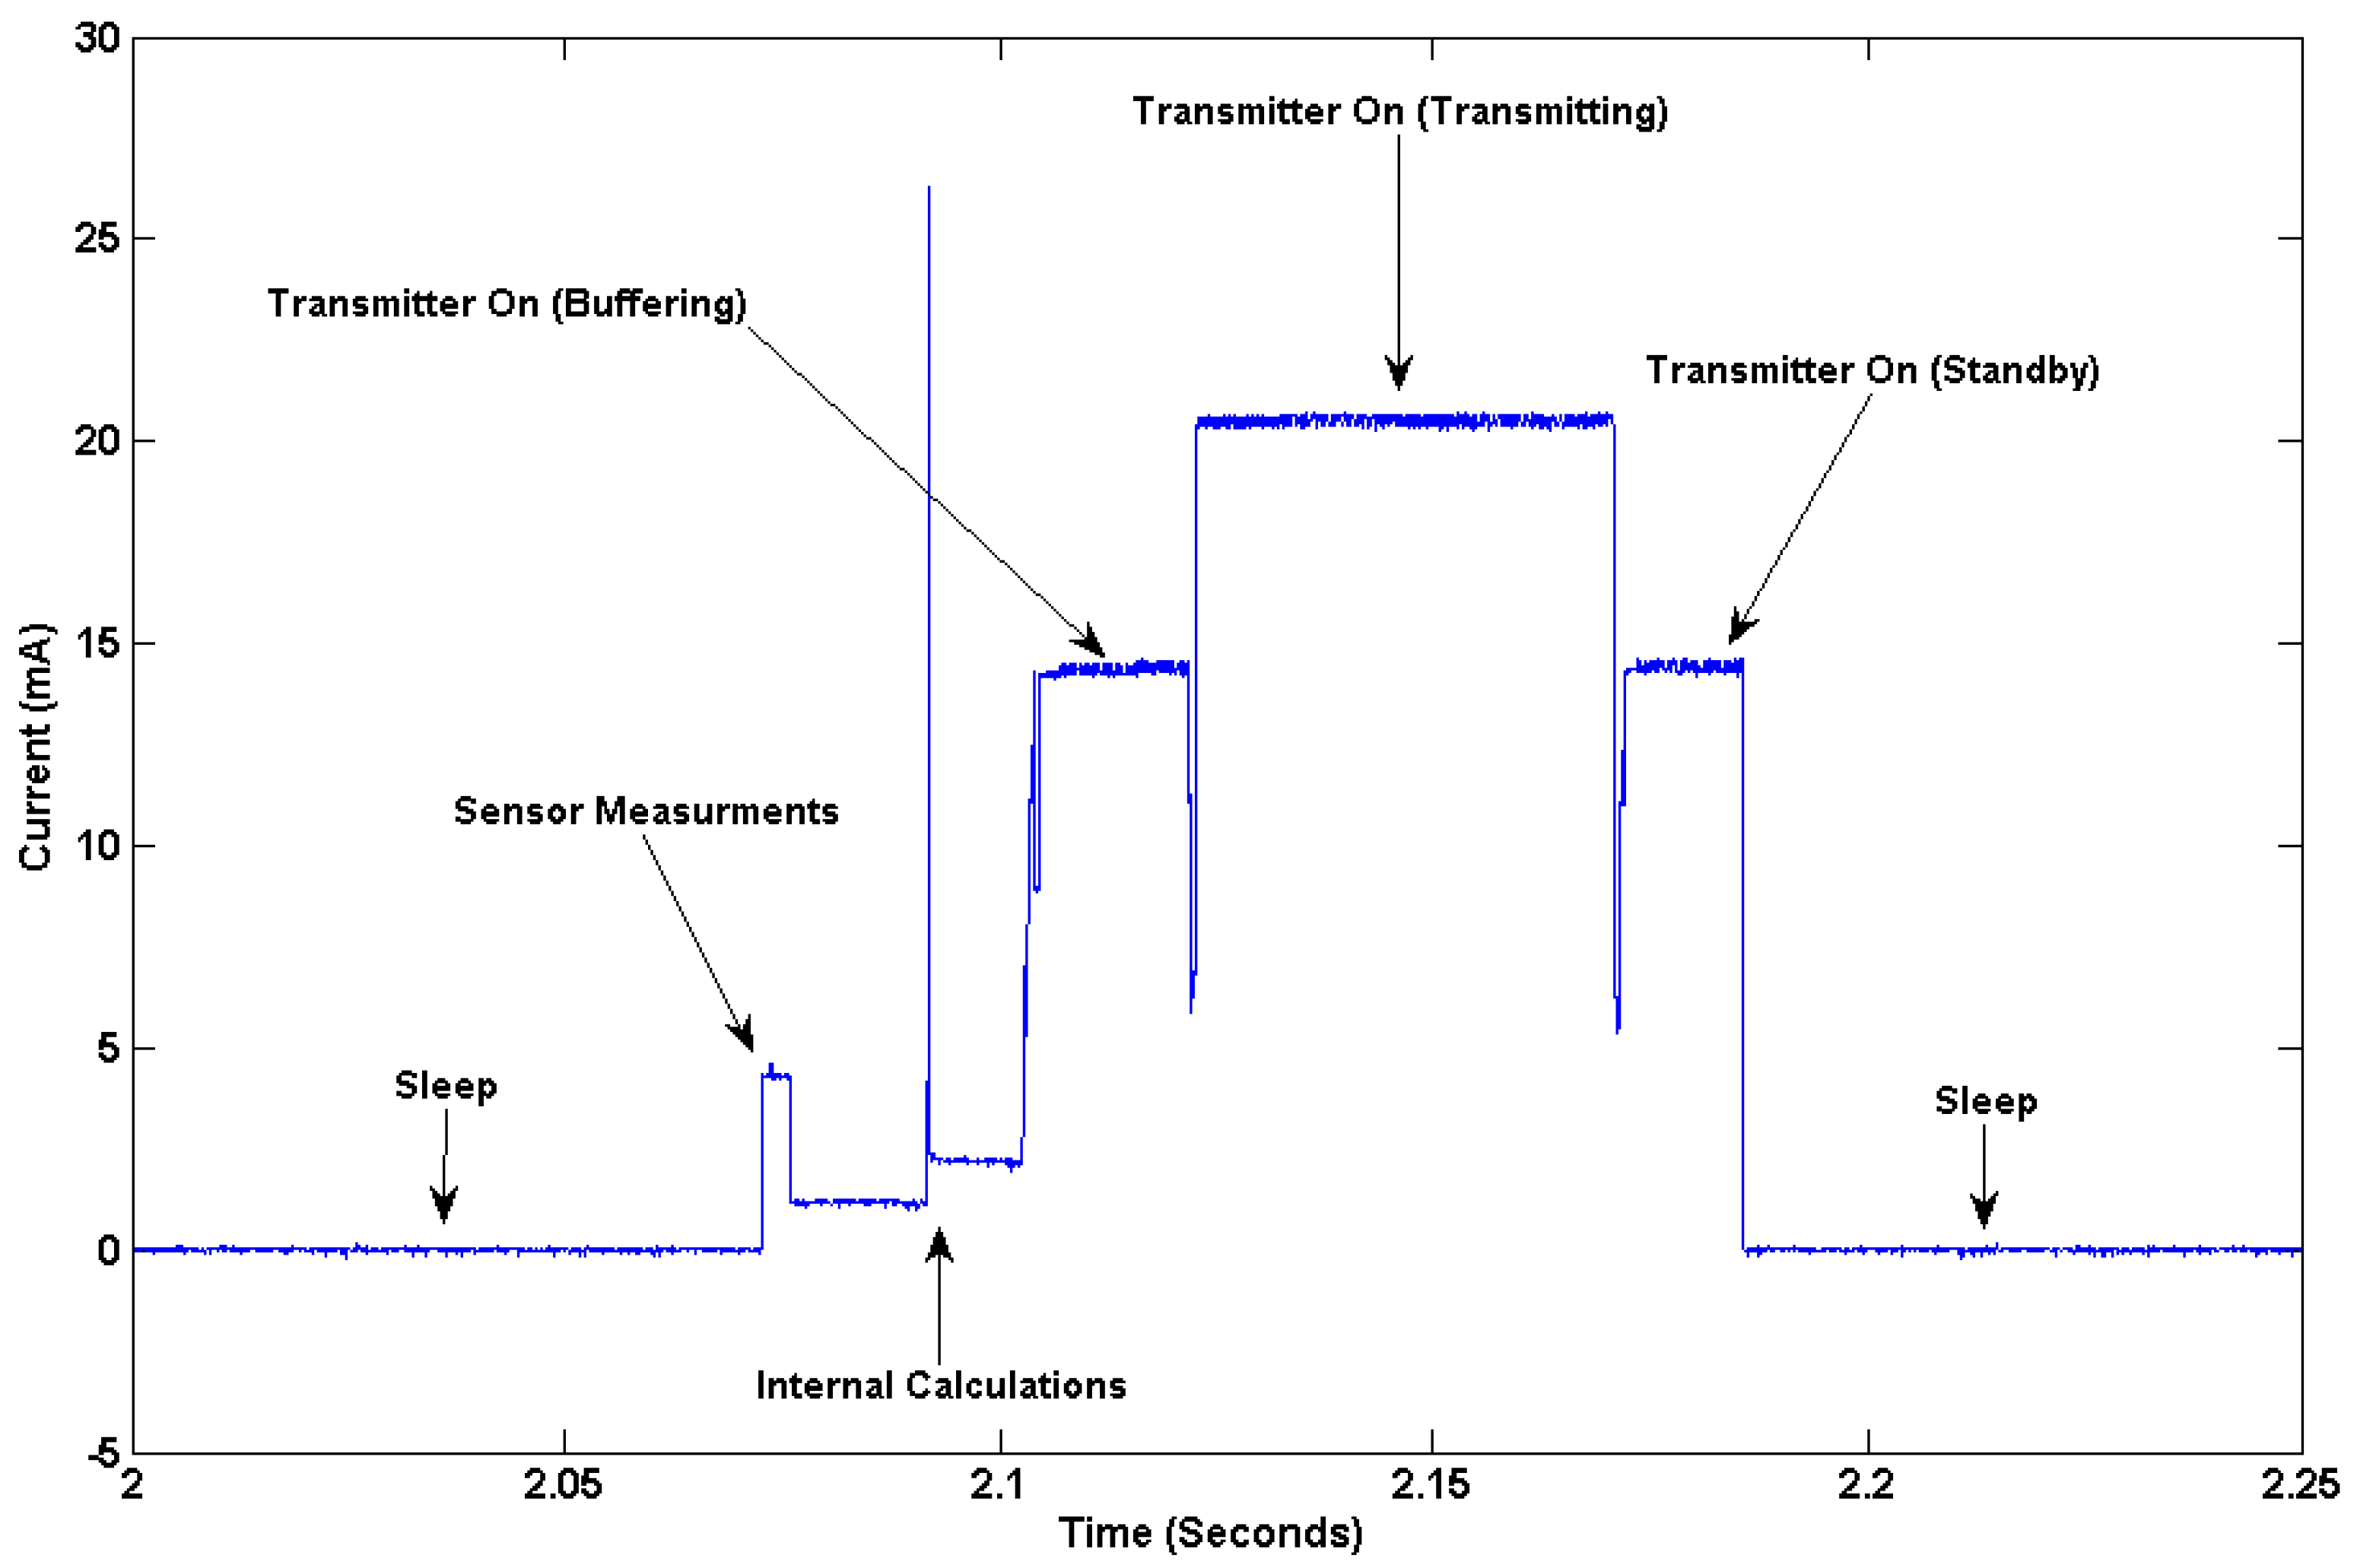
2.2. Power Consumption


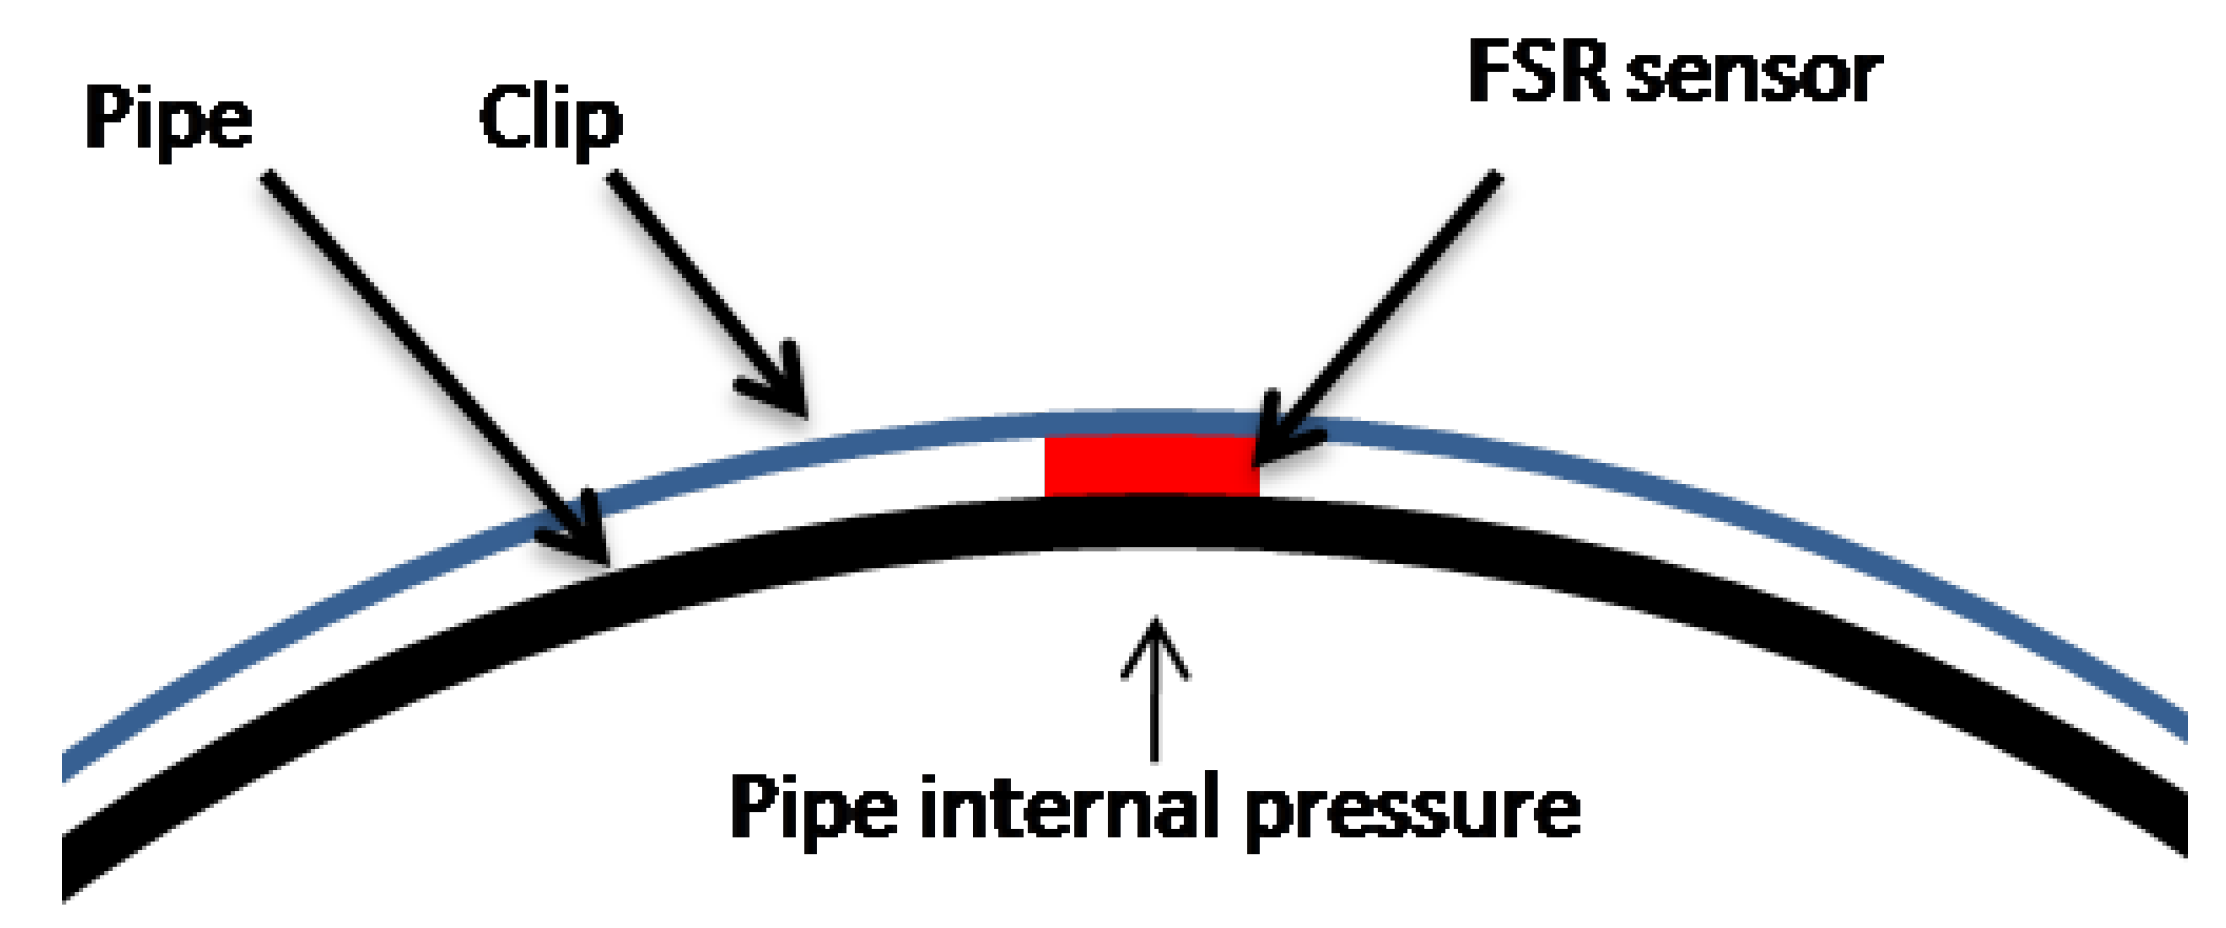
2.3. Sensors


3. Leak Detection Experimental Setup
3.1. Laboratory Tests

3.2. Field Trials

4. Results and Discussion


5. Conclusions
Acknowledgments
Author Contributions
Conflict of Interest
References
- Atzori, L.; Iera, A.; Morabito, G. The internet of things: A survey. Comput. Netw. 2010, 54, 2787–2805. [Google Scholar] [CrossRef]
- Miorandi, D.; Sicari, S.; De Pellegrini, F.; Chlamtac, I. Internet of things: Vision, applications and research challenges. Ad Hoc Netw. 2012, 10, 1497–1516. [Google Scholar] [CrossRef]
- Christin, D.; Reinhardt, A.; Mogre, P.S.; Steinmetz, R. Wireless Sensor Networks and the Internet of Things : Selected Challenges. In Proceedings of the 8th GI/ITG KuVS Fachgespräch Drahtlose Sensornetze, Hamburg, Germany, August 2009; pp. 31–33.
- Yu, X.; Wu, P.; Han, W.; Zhang, Z. Overview of wireless underground sensor networks for agriculture. Afr. J. Biotechnol. 2012, 11, 3942–3948. [Google Scholar]
- Hieu, B.; Choi, S.; Kim, Y.U.; Park, Y.; Jeong, T. Wireless transmission of acoustic emission signals for real-time monitoring of leakage in underground pipes. KSCE J. Civ. Eng. 2011, 15, 805–812. [Google Scholar] [CrossRef]
- Akyildiz, I.F.; Sun, Z.; Vuran, M.C. Signal propagation techniques for wireless underground communication networks. Phys. Commun. 2009, 2, 167–183. [Google Scholar] [CrossRef]
- Liu, Z.; Kleiner, Y. State-of-the-art review of technologies for pipe structural health monitoring. IEEE Sens. J. 2012, 12, 1987–1992. [Google Scholar] [CrossRef]
- Kingajay, M.; Jitson, T. Real-time laser monitoring based on pipe detective operation. Proc. World Acad. Sci. Eng. Technol. 2008, 44, 127–132. [Google Scholar]
- Sinha, S.K.; Knight, M.A. Intelligent system for condition monitoring of underground pipelines. Comput. Civ. Infrastruct. Eng. 2004, 19, 42–53. [Google Scholar]
- Gao, Y.; Brennan, M.; Joseph, P.; Muggleton, J.; Hunaidi, O. On the selection of acoustic/vibration sensors for leak detection in plastic water pipes. J. Sound Vib. 2005, 283, 927–941. [Google Scholar] [CrossRef]
- Khulief, Y.A.; Khalifa, A.; Ben Mansour, R.; Habib, M.A. Acoustic detection of leaks in water pipelines using measurements inside pipe. J. Pipeline Syst. Eng. Pract. 2012, 3, 47–54. [Google Scholar] [CrossRef]
- Stoianov, I.; Nachman, L.; Madden, S.; Tokmouline, T.; Csail, M. PIPENET: A Wireless Sensor Network for Pipeline Monitoring. In Proceedings of IEEE the 6th International Symposium on Information Processing in Sensor Networks (IPSN 2007), MA, USA, 25–27 April 2007; pp. 264–273.
- Ahadi, M.; Bakhtiar, M.S. Leak detection in water-filled plastic pipes through the application of tuned wavelet transforms to Acoustic Emission signals. Appl. Acoust. 2010, 71, 634–639. [Google Scholar] [CrossRef]
- Muggleton, J.M.; Brennan, M.J. Leak noise propagation and attenuation in submerged plastic water pipes. J. Sound Vib. 2004, 278, 527–537. [Google Scholar] [CrossRef]
- Muggleton, J.M.; Brennan, M.J.; Pinnington, R.J.; Gao, Y. A novel sensor for measuring the acoustic pressure in buried plastic water pipes. J. Sound Vib. 2006, 295, 1085–1098. [Google Scholar] [CrossRef]
- Gao, Y.; Brennan, M.J.; Joseph, P.F.; Muggleton, J.M.; Hunaidi, O. A model of the correlation function of leak noise in buried plastic pipes. J. Sound Vib. 2004, 277, 133–148. [Google Scholar] [CrossRef]
- Nakhkash, M. Water Leak Detection Using Ground Penetrating Radar. In Proceedings of the 10th International Conference on Ground Penetrating Radar, Delft, The Netherlands, 21–24 June 2004; pp. 525–528.
- Li, H.-N.; Li, D.-S.; Song, G.-B. Recent applications of fiber optic sensors to health monitoring in civil engineering. Eng. Struct. 2004, 26, 1647–1657. [Google Scholar] [CrossRef]
- Yan, S.Z.; Chyan, L.S. Performance enhancement of BOTDR fiber optic sensor for oil and gas pipeline monitoring. Opt. Fiber Technol. 2010, 16, 100–109. [Google Scholar] [CrossRef]
- Nikles, M. Long-distance fiber optic sensing solutions for pipeline leakage, intrusion and ground movement detection. Proc. SPIE 2009, vol. 7316, 731602–731613. [Google Scholar] [CrossRef]
- Myles, A. Permanent Leak Detection on Pipes using a Fibre Optic Based Continuous Sensor Technology. In Proceedings of Pipelines Conference 2011: A Sound Conduit for Sharing Solutions, WA, USA, 23–27 July 2011; pp. 744–754.
- López-higuera, J.M.; Cobo, L.R.; Incera, A.Q.; Cobo, A. Fiber optic sensors in structural health monitoring. J. Light. Technol. 2011, 29, 587–608. [Google Scholar] [CrossRef]
- Akyildiz, I.F.; Stuntebeck, E.P. Wireless underground sensor networks: Research challenges. Ad Hoc Netw. 2006, 4, 669–686. [Google Scholar] [CrossRef]
- Walton, R.; Sadeghioon, A.M.; Metje, N.; Chapman, D.; Ward, M. Smart Pipes: The Future for Proactive Asset Management. In Proceedings of the International Conference on Pipelines and Trenchless Technology, Beijing, China, 26–29 October 2011; pp. 1512–1523.
- Metje, N.; Chapman, D.N.; Metje, N.; Walton, R.; Sadeghioon, A.M.; Ward, M. Real time condition monitoring of buried water pipes. Tunn. Undergr. Sp. Technol. 2012, 28, 315–320. [Google Scholar] [CrossRef]
- Sadeghioon, A.M.; Walton, R.; Chapman, D.; Metje, N.; Anthony, C.; Ward, M. Design and development of a non intrusive pressure measurement system for pipeline monitoring. J. Pipeline Syst. Eng. Pract. 2014. (Accepted awaiting publication). [Google Scholar]
© 2014 by the authors; licensee MDPI, Basel, Switzerland. This article is an open access article distributed under the terms and conditions of the Creative Commons Attribution license (http://creativecommons.org/licenses/by/3.0/).
Share and Cite
Sadeghioon, A.M.; Metje, N.; Chapman, D.N.; Anthony, C.J. SmartPipes: Smart Wireless Sensor Networks for Leak Detection in Water Pipelines. J. Sens. Actuator Netw. 2014, 3, 64-78. https://doi.org/10.3390/jsan3010064
Sadeghioon AM, Metje N, Chapman DN, Anthony CJ. SmartPipes: Smart Wireless Sensor Networks for Leak Detection in Water Pipelines. Journal of Sensor and Actuator Networks. 2014; 3(1):64-78. https://doi.org/10.3390/jsan3010064
Chicago/Turabian StyleSadeghioon, Ali M., Nicole Metje, David N. Chapman, and Carl J. Anthony. 2014. "SmartPipes: Smart Wireless Sensor Networks for Leak Detection in Water Pipelines" Journal of Sensor and Actuator Networks 3, no. 1: 64-78. https://doi.org/10.3390/jsan3010064