
Untangling SNP Variations within CYP2D6 Gene in Croatian Roma

 , ,
, ,
Abstract
:
1. Introduction
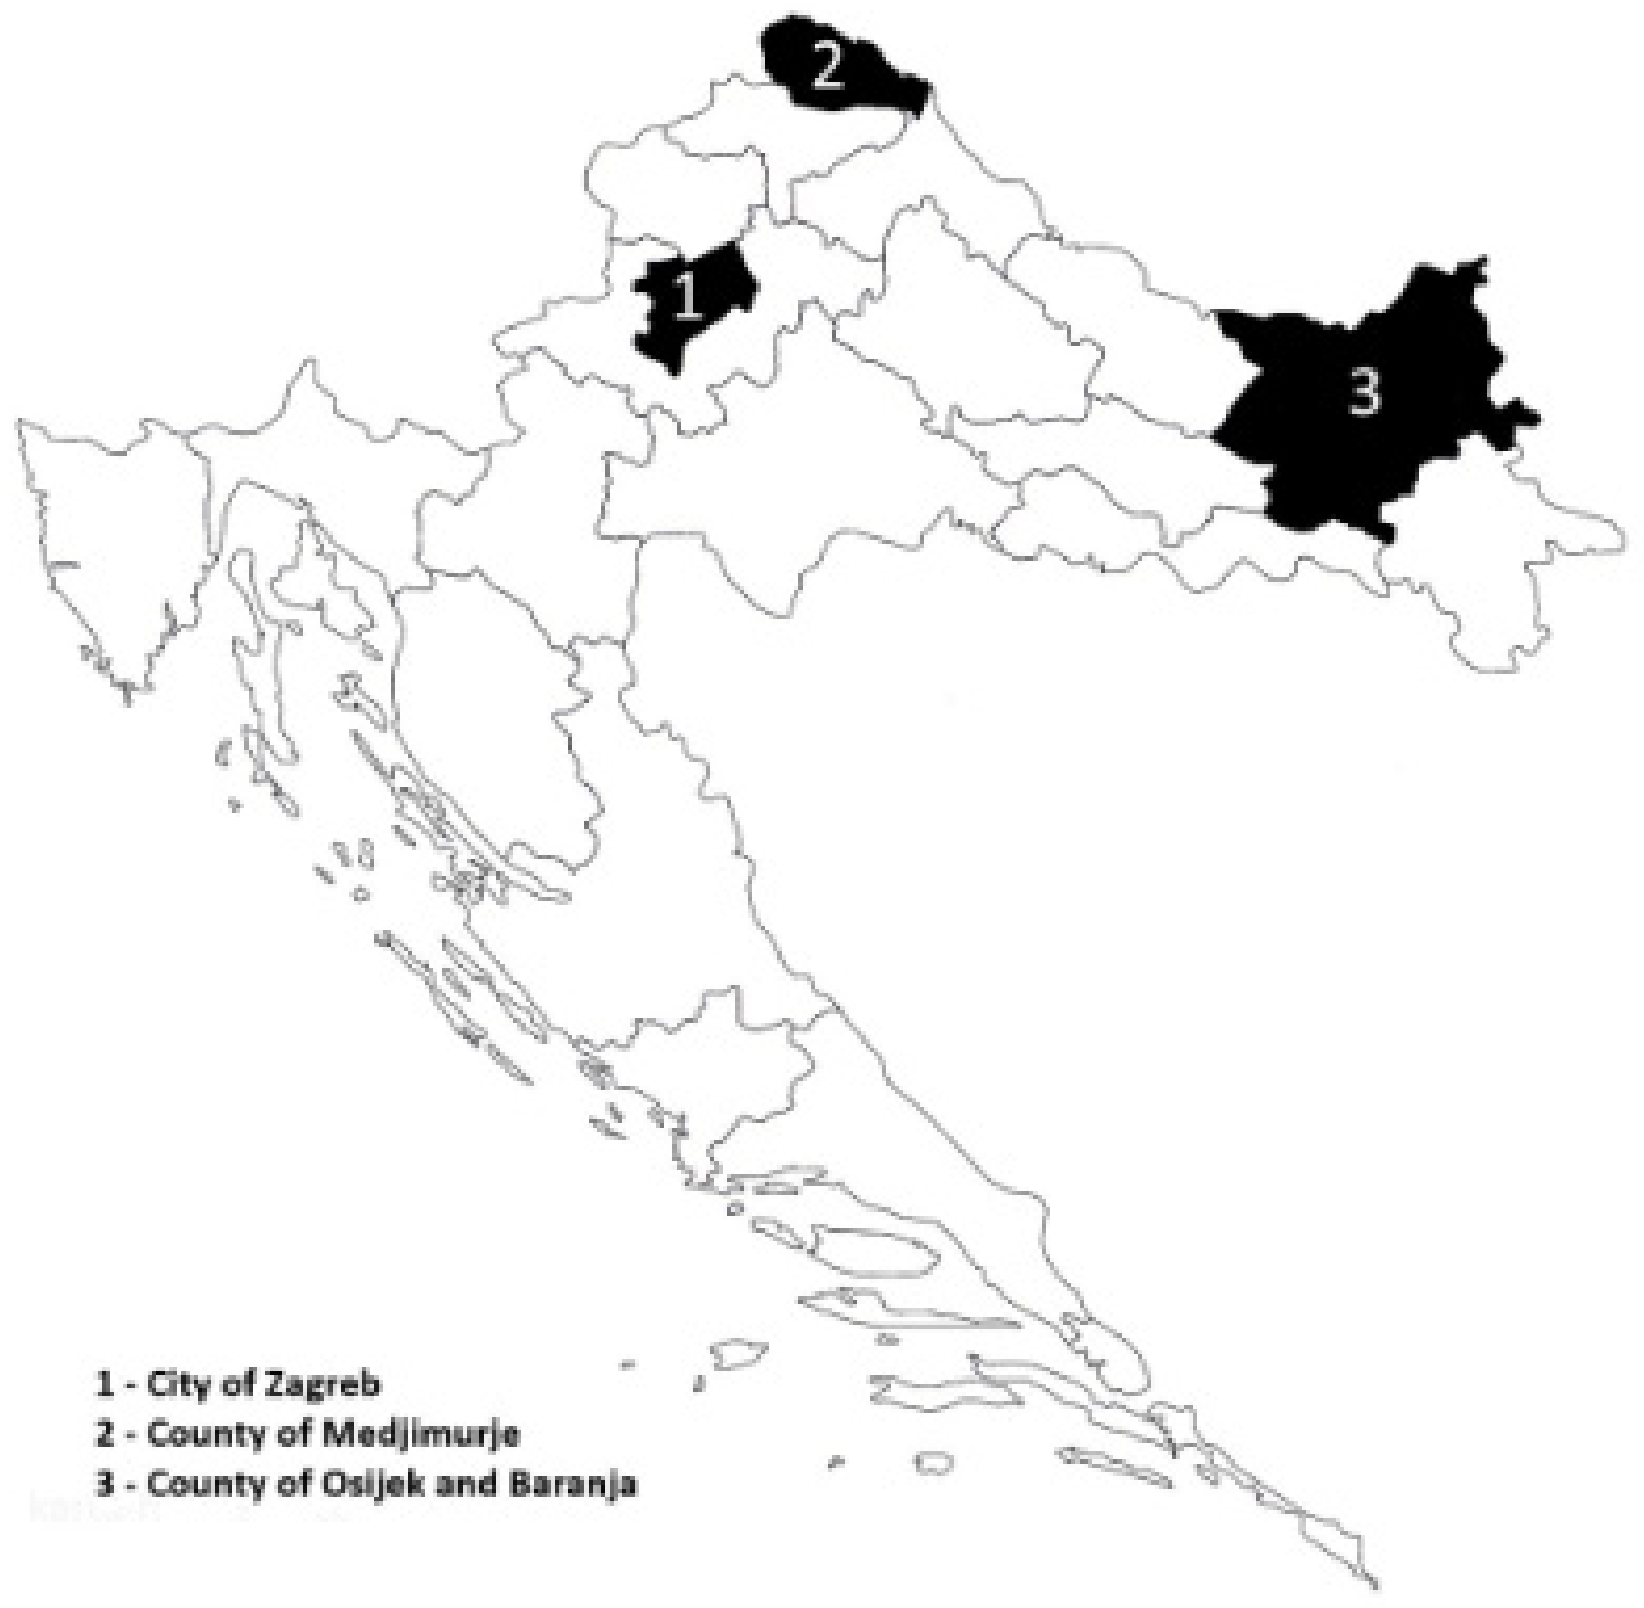
2. Materials and Methods
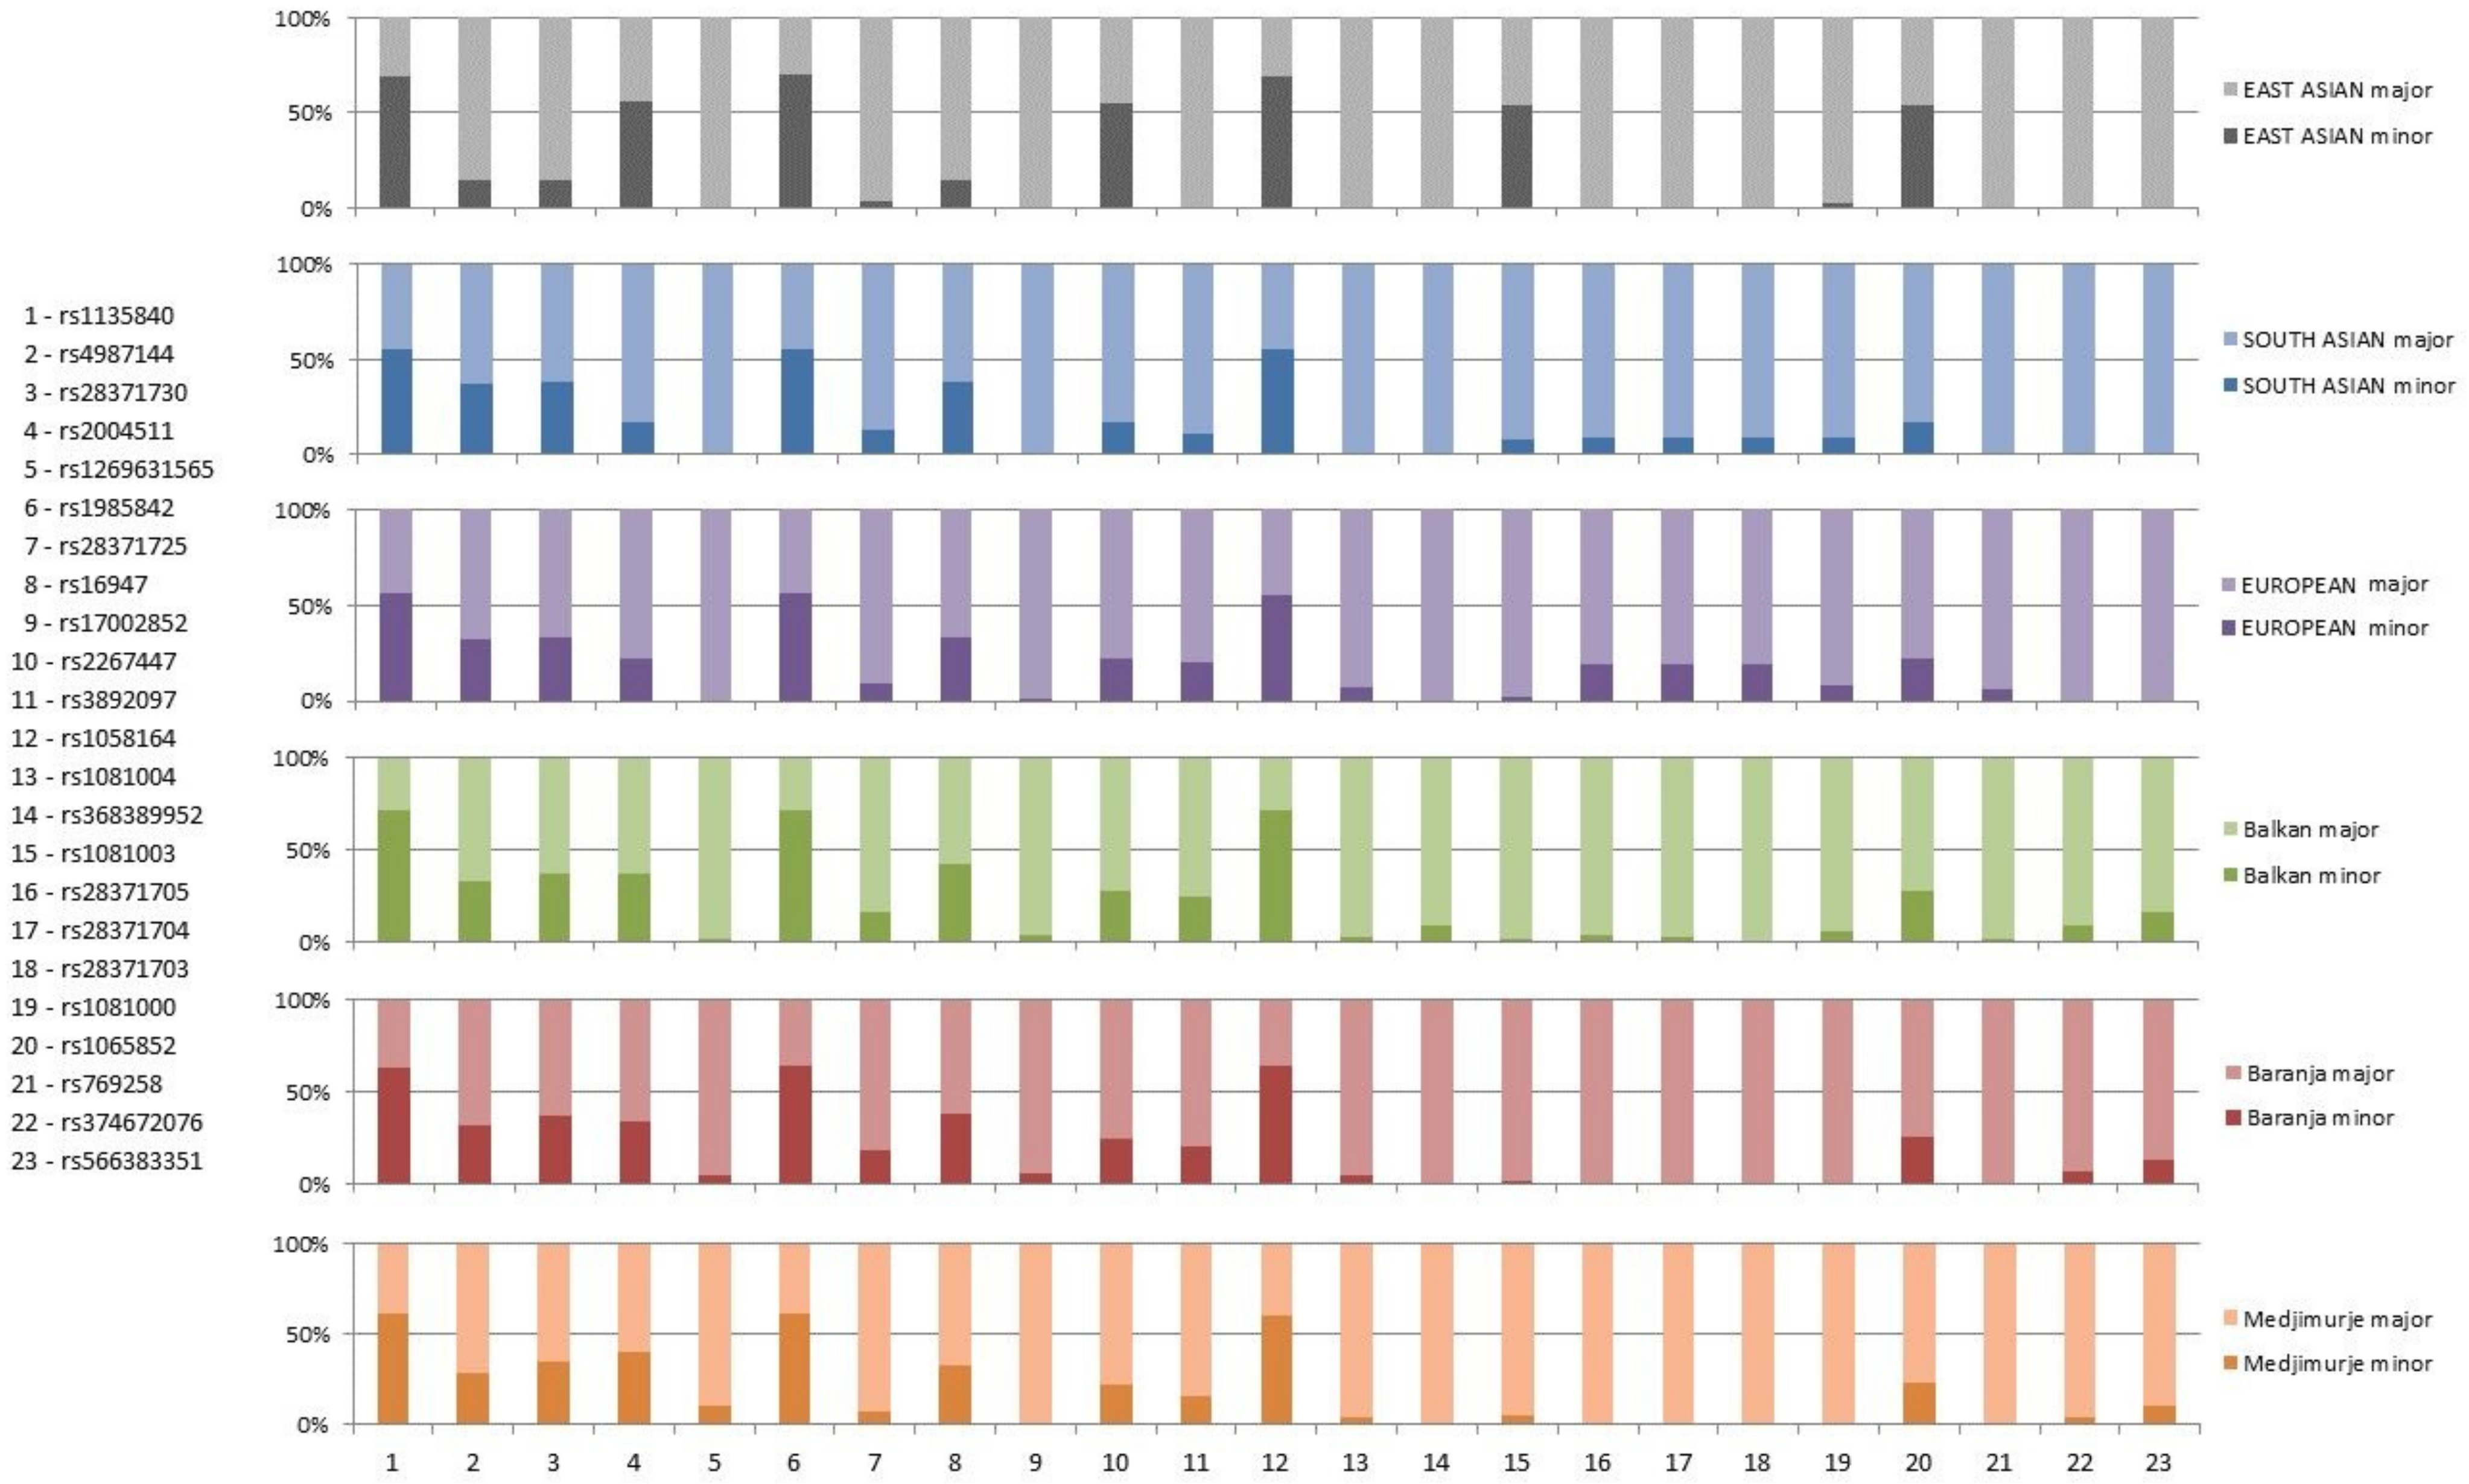
3. Results
4. Discussion
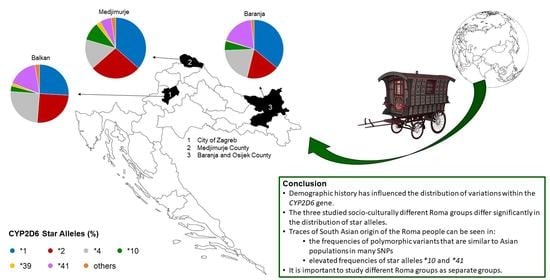
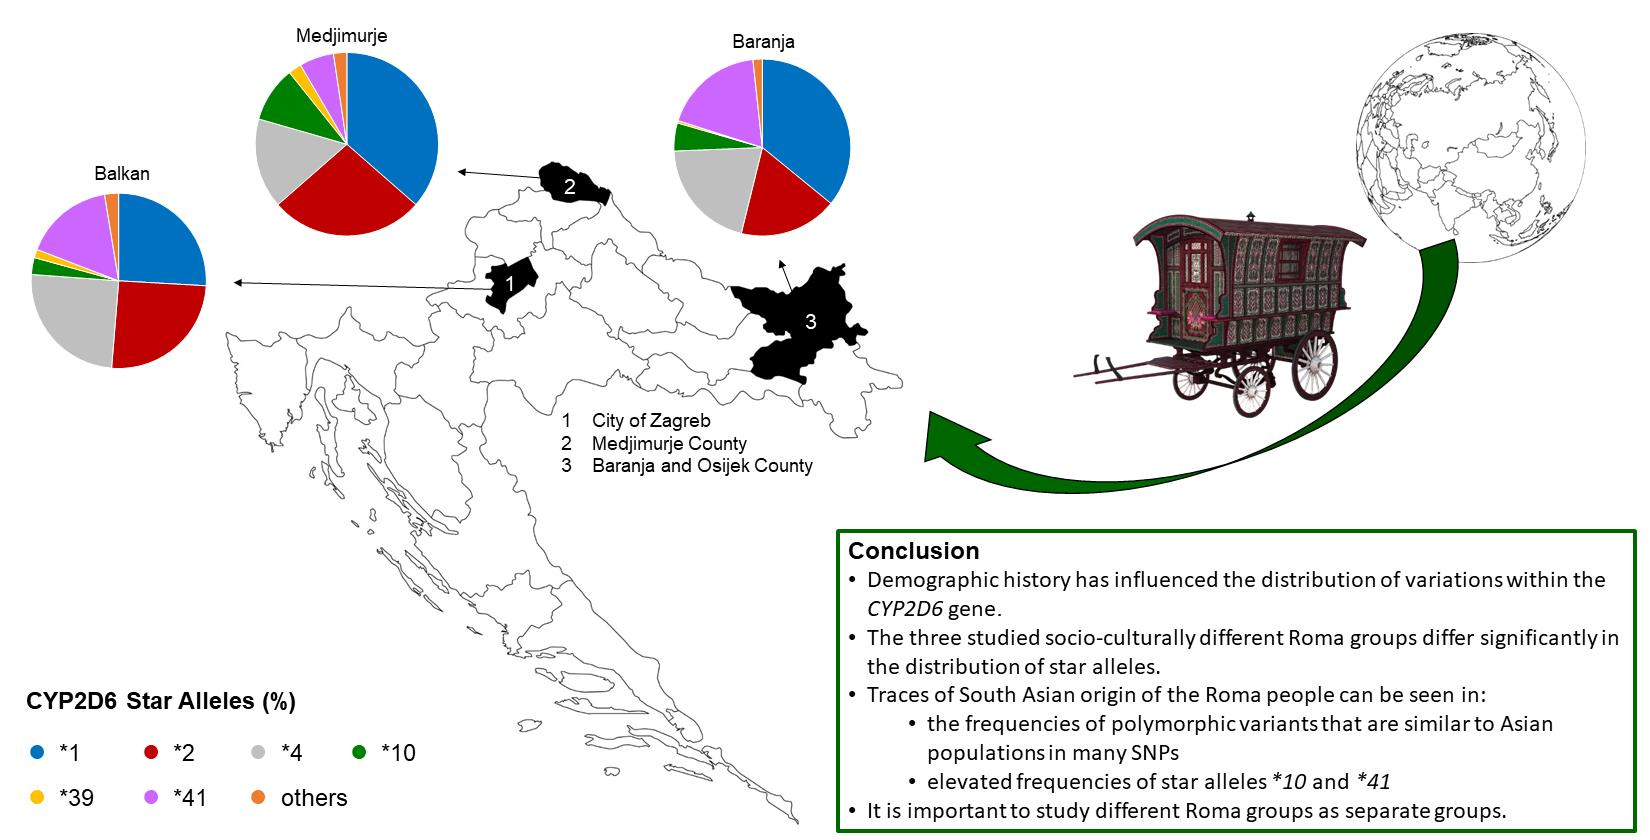
5. Conclusions
Supplementary Materials
Author Contributions
Funding
Institutional Review Board Statement
Informed Consent Statement
Data Availability Statement
Acknowledgments
Conflicts of Interest
References
- Kimura, S.; Umeno, M.; Skoda, R.C.; Meyer, U.A.; Gonzalez, F.J. The human debrisoquine 4-hydroxylase (CYP2D) locus: Sequence and identification of the polymorphic CYP2D6 gene, a related gene, and a pseudogene. Am. J. Hum. Genet. 1989, 45, 889–904. [Google Scholar] [PubMed]
- Heim, M.H.; Meyer, U.A. Evolution of a highly polymorphic human cytochrome P450 gene cluster: CYP2D6. Genomics 1992, 14, 49–58. [Google Scholar] [CrossRef]
- Daly, A.K.; Brockmöller, J.; Broly, F.; Eichelbaum, M.; Evans, W.E.; Gonzalez, F.J.; Huang, J.D.; Idle, J.R.; Ingelman-Sundberg, M.; Ishizaki, T.; et al. Nomenclature for human CYP2D6 alleles. Pharmacogenetics 1996, 6, 193–201. [Google Scholar] [CrossRef] [PubMed]
- Gaedigk, A.; Sangkuhl, K.; Whirl-Carrillo, M.; Klein, T.; Leeder, J.S. Prediction of CYP2D6 phenotype from genotype across world populations. Genet. Med. 2017, 19, 69–76. [Google Scholar] [CrossRef] [Green Version]
- Hicks, J.K.; Swen, J.J.; Gaedigk, A. Challenges in CYP2D6 phenotype assignment from genotype data: A critical assessment and call for standardization. Curr. Drug Metab. 2014, 15, 218–232. [Google Scholar] [CrossRef]
- Caudle, K.E.; Sangkuhl, K.; Whirl-Carrillo, M.; Swen, J.J.; Haidar, C.E.; Klein, T.E.; Gammal, R.S.; Relling, M.V.; Scott, S.A.; Hertz, D.L.; et al. Standardizing CYP2D6 Genotype to Phenotype Translation: Consensus Recommendations from the Clinical Pharmacogenetics Implementation Consortium and Dutch Pharmacogenetics Working Group. Clin. Transl. Sci. 2019, 13, 116–124. [Google Scholar] [CrossRef] [Green Version]
- Human Cytochrome P450 (CYP) Allele Nomenclature Database. Available online: http://www.cypalleles.ki.se/ (accessed on 15 August 2021).
- PHARMGKB. Available online: https://www.pharmgkb.org/ (accessed on 15 August 2021).
- He, Z.X.; Chen, X.W.; Zhou, Z.W.; Zhou, S.F. Impact of physiological, pathological and environmental factors on the expression and activity of human cytochrome P450 2D6 and implications in precision medicine. Drug Metab. Rev. 2015, 47, 470–519. [Google Scholar] [CrossRef]
- Ingelman-Sundberg, M.; Sim, S.C.; Gomez, A.; Rodriguez-Antona, C. Influence of cytochrome P450 polymorphisms on drug therapies: Pharmacogenetic, pharmacoepigenetic and clinical aspects. Pharmacol. Ther. 2007, 116, 496–526. [Google Scholar] [CrossRef]
- Zanger, U.M.; Schwab, M. Cytochrome P450 enzymes in drug metabolism: Regulation of gene expression, enzyme activities, and impact of genetic variation. Pharmacol. Ther. 2013, 138, 103–141. [Google Scholar] [CrossRef]
- Williams, I.S.; Gatchie, L.; Bharate, S.B.; Chaudhuri, B. Biotransformation, Using Recombinant CYP450-Expressing Baker’s Yeast Cells, Identifies a Novel CYP2D6.10A122V Variant Which Is a Superior Metabolizer of Codeine to Morphine Than the Wild-Type Enzyme. ACS Omega 2018, 3, 8903–8912. [Google Scholar] [CrossRef] [Green Version]
- Zanger, U.M.; Turpeinen, M.; Klein, K.; Schwab, M. Functional pharmacogenetics/genomics of human cytochromes P450 involved in drug biotransformation. Anal. Bioanal. Chem. 2008, 392, 1093–1108. [Google Scholar] [CrossRef]
- Fleeman, N.; Dundar, Y.; Dickson, R.; Jorgensen, A.; Pushpakom, S.; McLeod, C.; Pirmohamed, M.; Walley, T. Cytochrome P450 testing for prescribing antipsychotics in adults with schizophrenia: Systematic review and meta-analyses. Pharm. J. 2010, 11, 1–14. [Google Scholar] [CrossRef] [Green Version]
- Stingl, J.C.; Brockmöller, J.; Viviani, R. Genetic variability of drug-metabolizing enzymes: The dual impact on psychiatric therapy and regulation of brain function. Mol. Psychiatry 2012, 18, 273–287. [Google Scholar] [CrossRef]
- Gaedigk, A. Complexities of CYP2D6gene analysis and interpretation. Int. Rev. Psychiatry 2013, 25, 534–553. [Google Scholar] [CrossRef]
- Hicks, J.K.; Swen, J.J.; Thorn, C.F.; Sangkuhl, K.; Kharasch, E.D.; Ellingrod, V.L.; Skaar, T.C.; Müller, D.J.; Gaedigk, A.; Stingl, J.C. Clinical Pharmacogenetics Implementation Consortium (CPIC) Guideline for CYP2D6 and CYP2C19 Genotypes and Dosing of Selective Serotonin Reuptake Inhibitors. Clin. Pharmacol. Ther. 2015, 98, 127–134. [Google Scholar] [CrossRef] [Green Version]
- Beoris, M.; Amos Wilson, J.; Garces, J.A.; Lukowiak, A.A. CYP2D6 copy number distribution in the US population. Pharm. Genom. 2016, 26, 96–99. [Google Scholar] [CrossRef] [Green Version]
- Christensen, P.M.; Gotzsche, P.C.; Brosen, K. The sparteine/debrisoquine (CYP2D6) oxidation polymorphism and the risk of Parkinson’s disease: A meta-analysis. Pharmacogenetics 1998, 8, 473–479. [Google Scholar] [CrossRef]
- Lu, Y.; Peng, Q.; Zeng, Z.; Wang, J.; Deng, Y.; Xie, L.; Mo, C.; Zeng, J.; Qin, X.; Li, S. CYP2D6 phenotypes and Parkinson’s disease risk: A meta-analysis. J. Neurol. Sci. 2014, 336, 161–168. [Google Scholar] [CrossRef]
- Ur Rasheed, M.S.; Mishra, A.K.; Singh, M.P. Cytochrome P450 2D6 and Parkinson’s Disease: Polymorphism, Metabolic Role, Risk and Protection. Neurochem. Res. 2017, 42, 3353–3361. [Google Scholar] [CrossRef]
- Patsopoulos, N.A.; Ntzani, E.E.; Zintzaras, E.; Ioannidis, J.P. CYP2D6 polymorphisms and the risk of tardive dyskinesia in schizophrenia: A meta-analysis. Pharm. Genom. 2005, 15, 151–158. [Google Scholar] [CrossRef]
- Scordo, M.G.; Dahl, M.L.; Spina, E.; Cordici, F.; Arena, M.G. No association between CYP2D6 polymorphism and Alzheimer’s disease in an Italian population. Pharmacol. Res. 2006, 53, 162–165. [Google Scholar] [CrossRef]
- Ma, S.L.; Tang, N.L.S.; Wat, K.H.Y.; Tang, J.H.Y.; Lau, K.H.; Law, C.B.; Chiu, J.; Tam, C.C.W.; Poon, T.K.; Lin, K.L.; et al. Effect of CYP2D6 and CYP3A4 Genotypes on the Efficacy of Cholinesterase Inhibitors in Southern Chinese Patients with Alzheimer’s Disease. Am. J. Alzheimers Dis. Other Dement. 2019, 34, 302–307. [Google Scholar] [CrossRef]
- Agundez, J. Cytochrome P450 Gene Polymorphism and Cancer. Curr. Drug Metab. 2004, 5, 211–224. [Google Scholar] [CrossRef]
- Rodriguez-Antona, C.; Gomez, A.; Karlgren, M.; Sim, S.C.; Ingelman-Sundberg, M. Molecular genetics and epigenetics of the cytochrome P450 gene family and its relevance for cancer risk and treatment. Hum. Genet. 2009, 127, 1–17. [Google Scholar] [CrossRef]
- Ingelman-Sundberg, M. Genetic polymorphisms of cytochrome P450 2D6 (CYP2D6): Clinical consequences, evolutionary aspects and functional diversity. Pharm. J. 2004, 5, 6–13. [Google Scholar] [CrossRef]
- Aklillu, E.; Herrlin, K.; Gustafsson, L.L.; Bertilsson, L.; Ingelman-Sundberg, M. Evidence for environmental influence on CYP2D6-catalysed debrisoquine hydroxylation as demonstrated by phenotyping and genotyping of Ethiopians living in Ethiopia or in Sweden. Pharmacogenetics 2002, 12, 375–383. [Google Scholar] [CrossRef]
- Podgorná, E.; Diallo, I.; Vangenot, C.; Sanchez-Mazas, A.; Sabbagh, A.; Černý, V.; Poloni, E.S. Variation in NAT2 acetylation phenotypes is associated with differences in food-producing subsistence modes and ecoregions in Africa. BMC Evol. Biol. 2015, 15, 263. [Google Scholar] [CrossRef] [Green Version]
- Fuselli, S.; de Filippo, C.; Mona, S.; Sistonen, J.; Fariselli, P.; Destro-Bisol, G.; Barbujani, G.; Bertorelle, G.; Sajantila, A. Evolution of detoxifying systems: The role of environment and population history in shaping genetic diversity at human CYP2D6 locus. Pharmacogenet. Genom. 2010, 20, 485–499. [Google Scholar] [CrossRef]
- Li, J.; Zhang, L.; Zhou, H.; Stoneking, M.; Tang, K. Global patterns of genetic diversity and signals of natural selection for human ADME genes. Hum. Mol. Genet. 2011, 20, 528–540. [Google Scholar] [CrossRef] [Green Version]
- LLerena, A.; Naranjo, M.E.; Rodrigues-Soares, F.; Penas-LLedó, E.M.; Fariñas, H.; Tarazona-Santos, E. Interethnic variability ofCYP2D6alleles and of predicted and measured metabolic phenotypes across world populations. Expert Opin. Drug Metab. Toxicol. 2014, 10, 1569–1583. [Google Scholar] [CrossRef]
- Pratt, V.M.; Cavallari, L.H.; Del Tredici, A.L.; Gaedigk, A.; Hachad, H.; Ji, Y.; Kalman, L.V.; Ly, R.C.; Moyer, A.M.; Scott, S.A.; et al. Recommendations for Clinical CYP2D6 Genotyping Allele Selection. J. Mol. Diagn. 2021, 23, 1047–1064. [Google Scholar] [CrossRef] [PubMed]
- Zhang, H.; De, T.; Zhong, Y.; Perera, M.A. The Advantages and Challenges of Diversity in Pharmacogenomics: Can Minority Populations Bring Us Closer to Implementation? Clin. Pharmacol. Ther. 2019, 106, 338–349. [Google Scholar] [CrossRef] [PubMed]
- Fraser, A. The Gypsies; Blackwell Publishers: Oxford, UK, 1992. [Google Scholar]
- Hancock, I.F. We Are the Romani People; University of Herdforshire Press: Hatfield, UK, 2002. [Google Scholar]
- Gresham, D.; Morar, B.; Underhill, P.A.; Passarino, G.; Lin, A.A.; Wise, C.; Angelicheva, D.; Calafell, F.; Oefner, P.J.; Shen, P.; et al. Origins and divergence of the Roma (gypsies). Am. J. Hum. Genet. 2001, 69, 1314–1331. [Google Scholar] [CrossRef] [PubMed] [Green Version]
- Chaix, R.; Austerlitz, F.; Morar, B.; Kalaydjieva, L.; Heyer, E. Vlax Roma history: What do coalescent-based methods tell us? Eur. J. Hum. Genet. 2004, 12, 285–292. [Google Scholar] [CrossRef] [Green Version]
- Škarić-Jurić, T.; Tomas, Ž.; Zajc Petranović, M.; Božina, N.; Smolej Narančić, N.; Janićijević, B.; Salihović, M.P. Characterization of ADME genes variation in Roma and 20 populations worldwide. PLoS ONE 2018, 13, e0207671. [Google Scholar] [CrossRef]
- Miller, S.A.; Dykes, D.D.; Polesky, H.F. A simple salting out procedure for extracting DNA from human nucleated cells. Nucleic Acids Res. 1988, 16, 1215. [Google Scholar] [CrossRef] [Green Version]
- Campbell, N.R.; Harmon, S.A.; Narum, S.R. Genotyping-in-Thousands by sequencing (GT-seq): A cost effective SNP genotyping method based on custom amplicon sequencing. Mol. Ecol. Resour. 2015, 15, 855–867. [Google Scholar] [CrossRef]
- Danecek, P.; Auton, A.; Abecasis, G.; Albers, C.A.; Banks, E.; DePristo, M.A.; Handsaker, R.E.; Lunter, G.; Marth, G.T.; Sherry, S.T.; et al. The variant call format and VCFtools. Bioinformatics 2011, 27, 2156–2158. [Google Scholar] [CrossRef]
- Stephens, M.; Smith, N.J.; Donnelly, P. A new statistical method for haplotype reconstruction from population data. Am. J. Hum. Genet. 2001, 68, 978–989. [Google Scholar] [CrossRef] [Green Version]
- Stephens, M.; Donnelly, P. A comparison of bayesian methods for haplotype reconstruction from population genotype data. Am. J. Hum. Genet. 2003, 73, 1162–1169. [Google Scholar] [CrossRef] [Green Version]
- Pharmacogene Variation (PharmVar) Consortium—CYP2D6. Available online: https://www.pharmvar.org/gene/CYP2D6 (accessed on 15 August 2021).
- Clinical Pharmacogenetics Implementation Consortium—Term Standardization. Available online: https://cpicpgx.org/resources/term-standardization (accessed on 15 August 2021).
- Excoffier, L.; Lischer, H.E. Arlequin suite ver 3.5: A new series of programs to perform population genetics analyses under Linux and Windows. Mol. Ecol. Resour. 2010, 10, 564–567. [Google Scholar] [CrossRef]
- Bandelt, H.J.; Forster, P.; Rohl, A. Median-joining networks for inferring intraspecific phylogenies. Mol. Biol. Evol. 1999, 16, 37–48. [Google Scholar] [CrossRef]
- Free Phylogenetic Network Software. Available online: https://www.fluxus-engineering.com/sharenet.htm (accessed on 10 January 2021).
- Mendizabal, I.; Valente, C.; Gusmão, A.; Alves, C.; Gomes, V.; Goios, A.; Parson, W.; Calafell, F.; Alvarez, L.; Amorim, A.; et al. Reconstructing the Indian origin and dispersal of the European Roma: A maternal genetic perspective. PLoS ONE 2011, 6, e15988. [Google Scholar] [CrossRef] [Green Version]
- Salihović, M.P.; Barešić, A.; Klarić, I.M.; Cukrov, S.; Lauc, L.B.; Janićijević, B. The role of the Vlax Roma in shaping the European Romani maternal genetic history. Am. J. Phys. Anthropol. 2011, 146, 262–270. [Google Scholar] [CrossRef]
- Gusmão, A.; Valente, C.; Gomes, V.; Alves, C.; Amorim, A.; Prata, M.J.; Gusmão, L. A genetic historical sketch of European Gypsies: The perspective from autosomal markers. Am. J. Phys. Anthropol. 2010, 141, 507–514. [Google Scholar] [CrossRef]
- Klarić, I.M.; Salihović, M.P.; Lauc, L.B.; Zhivotovsky, L.A.; Rootsi, S.; Janićijević, B. Dissecting the molecular architecture and origin of Bayash Romani patrilineages: Genetic influences from South-Asia and the Balkans. Am. J. Phys. Anthropol. 2009, 138, 333–342. [Google Scholar] [CrossRef]
- Bianco, E.; Laval, G.; Font-Porterias, N.; García-Fernández, C.; Dobon, B.; Sabido-Vera, R.; Sukarova Stefanovska, E.; Kučinskas, V.; Makukh, H.; Pamjav, H.; et al. Recent Common Origin, Reduced Population Size, and Marked Admixture Have Shaped European Roma Genomes. Mol. Biol. Evol. 2020, 37, 3175–3187. [Google Scholar] [CrossRef]
- Mendizabal, I.; Lao, O.; Marigorta, U.M.; Wollstein, A.; Gusmão, L.; Ferak, V.; Ioana, M.; Jordanova, A.; Kaneva, R.; Kouvatsi, A.; et al. Reconstructing the population history of European Romani from genome-wide data. Curr. Biol. 2012, 22, 2342–2349. [Google Scholar] [CrossRef] [Green Version]
- Genome Aggregation Database. Available online: https://gnomad.broadinstitute.org/ (accessed on 17 June 2021).
- He, X.; He, N.; Ren, L.; Ouyang, Y.; Zhang, N.; Ma, Y.; Yuan, D.; Kang, L.; Jin, T. Genetic polymorphisms analysis of CYP2D6 in the Uygur population. BMC Genom. 2016, 17, 409. [Google Scholar] [CrossRef] [Green Version]
- Ahmed, S.; Zhou, J.; Zhou, Z.; Chen, S.Q. Genetic Polymorphisms and In Silico Mutagenesis Analyses of CYP2C9, CYP2D6, and CYPOR Genes in the Pakistani Population. Genes 2018, 9, 514. [Google Scholar] [CrossRef] [Green Version]
- Leiden Open Variation Database. Available online: https://databases.lovd.nl (accessed on 15 August 2021).
- ClinVar—RCV001028788.2. Available online: https://www.ncbi.nlm.nih.gov/clinvar/RCV001028788 (accessed on 15 August 2021).
- Bradford, L.D. CYP2D6 allele frequency in European Caucasians, Asians, Africans and their descendants. Pharmacogenomics 2002, 3, 229–243. [Google Scholar] [CrossRef]
- Sistonen, J.; Sajantila, A.; Lao, O.; Corander, J.; Barbujani, G.; Fuselli, S. CYP2D6 worldwide genetic variation shows high frequency of altered activity variants and no continental structure. Pharmacogenet. Genom. 2007, 17, 93–101. [Google Scholar] [CrossRef]
- Naveen, A.T.; Adithan, C.; Soya, S.S.; Gerard, N.; Krishnamoorthy, R. CYP2D6 Genetic Polymorphism in South Indian Populations. Biol. Pharm. Bull. 2006, 29, 1655–1658. [Google Scholar] [CrossRef] [Green Version]
- Weber, A.; Szalai, R.; Sipeky, C.; Magyari, L.; Melegh, M.; Jaromi, L.; Matyas, P.; Duga, B.; Kovesdi, E.; Hadzsiev, K.; et al. Increased prevalence of functional minor allele variants of drug metabolizing CYP2B6 and CYP2D6 genes in Roma population samples. Pharmacol. Rep. 2015, 67, 460–464. [Google Scholar] [CrossRef] [PubMed]
- Dlouhá, L.; Adámková, V.; Šedová, L.; Olišarová, V.; Hubáček, J.A.; Tóthová, V. Five genetic polymorphisms of cytochrome P450 enzymes in the Czech non-Roma and Czech Roma population samples. Drug Metab. Pers. Ther. 2020, 35, 20200103. [Google Scholar] [CrossRef] [PubMed]
- Gough, A.C.; Miles, J.S.; Spurr, N.K.; Moss, J.E.; Gaedigk, A.; Eichelbaum, M.; Wolf, C.R. Identification of the primary gene defect at the cytochrome P450 CYP2D locus. Nature 1990, 347, 773–776. [Google Scholar] [CrossRef] [PubMed]
- Gomes, L.; Lemos, M.C.; Paiva, I.; Ribeiro, C.; Carvalheiro, M.; Regateiro, F.J. CYP2D6 genetic polymorphisms are associated with susceptibility to pituitary tumors. Acta Med. Port. 2005, 18, 339–343. [Google Scholar] [PubMed]
- Zanger, U.M.; Raimundo, S.; Eichelbaum, M. Cytochrome P450 2D6: Overview and update on pharmacology, genetics, biochemistry. Naunyn-Schmiedeberg’s Arch. Pharmacol. 2004, 369, 23–37. [Google Scholar] [CrossRef]
- Petranović, M.Z.; Rizzieri, A.E.; Sivaraj, D.; Narančić, N.S.; Škarić-Jurić, T.; Celinšćak, Ž.; Marković, A.S.; Salihović, M.P.; Kalászi, J.; Kalászi, M.; et al. CVD Risk Factors in the Ukrainian Roma and Meta-Analysis of Their Prevalence in Roma Populations Worldwide. J. Pers. Med. 2021, 11, 1138. [Google Scholar] [CrossRef]
- Gardiner, S.J.; Begg, E.J. Pharmacogenetics, Drug-Metabolizing Enzymes, and Clinical Practice. Pharmacol. Rev. 2006, 58, 521–590. [Google Scholar] [CrossRef]
- Christensen, P.M.; Gøtzsche, P.C.; Brøsen, K. The sparteine/debrisoquine (CYP2D6) oxidation polymorphism and the risk of lung cancer: A meta-analysis. Eur. J. Clin. Pharmacol. 1997, 51, 389–393. [Google Scholar] [CrossRef]
- Wolf, C.R.; Smith, C.A.; Bishop, T.; Forman, D.; Gough, A.C.; Spurr, N.K. CYP 2D6 genotyping and the association with lung cancer susceptibility. Pharmacogenetics 1994, 4, 104–106. [Google Scholar] [CrossRef]
- He, W.; Grassmann, F.; Eriksson, M.; Eliasson, E.; Margolin, S.; Thorén, L.; Hall, P.; Czene, K. CYP2D6 Genotype Predicts Tamoxifen Discontinuation and Prognosis in Patients with Breast Cancer. J. Clin. Oncol. 2020, 38, 548–557. [Google Scholar] [CrossRef]
- He, W.; Eriksson, M.; Eliasson, E.; Grassmann, F.; Bäcklund, M.; Gabrielson, M.; Hammarström, M.; Margolin, S.; Thorén, L.; Wengström, Y.; et al. CYP2D6 genotype predicts tamoxifen discontinuation and drug response: A secondary analysis of the KARISMA trial. Ann. Oncol. 2021, 32, 1286–1293. [Google Scholar] [CrossRef]


| rsID | Clinical Implications | Genotypes and Alleles | Balkan N (%) | Medjimurje N (%) | Baranja N (%) | Combined N (%) | HWE Balkan | HWE Medjimurje | HWE Baranja | HWE CroRoma | X2 | p | |
|---|---|---|---|---|---|---|---|---|---|---|---|---|---|
| 9200 G > C (rs1135840) missense variant | ultrarapid metabolism of debrisoquine, deutetrabenazine response, tamoxifen response, tramadol response, benign | genotype | G/G | 8 (8.16%) | 20 (18.52%) | 14 (11.97%) | 42 (13.00%) | 0.8873 | 0.1119 | 0.6276 | 0.3772 | 18.22617 | 0.0991 |
| C/C | 51 (52.04%) | 44 (40.74%) | 46 (39.32%) | 141 (43.65%) | |||||||||
| G/C | 39 (39.80%) | 43 (39.81%) | 56 (47.86%) | 138 (42.72%) | |||||||||
| allele | C | 141 (71.94%) | 131 (61.21%) | 148 (63.79%) | 420 (65.42%) | 5.62592 | 0.06003 | ||||||
| 8848 G > A (rs28371732) synonymous variant | genotype | G/G | 96 (97.96%) | 102 (94.44%) | 92 (78.63%) | 290 (89.78%) | 0.9605 | 0.9766 | 1.83154 | 0.40021 | |||
| G/A | 0 | 1 (0.93%) | 0 | 1 (0.31%) | |||||||||
| allele | A | 0 | 1 (0.48%) | 0 | 1 (0.17%) | 1.82838 | 0.40084 | ||||||
| 8810 C > T (rs4987144) intron variant | genotype | C/C | 44 (44.90%) | 59 (54.63%) | 59 (50.43%) | 162 (50.15%) | 0.8366 | 0.0538 | 0.066 | 0.0363 | 3.49495 | 0.47865 | |
| T/T | 10 (10.20%) | 13 (12.04%) | 16 (13.68%) | 39 (12.07%) | |||||||||
| C/T | 44 (44.90%) | 36 (33.33%) | 42 (35.90%) | 122 (37.77%) | |||||||||
| allele | T | 64 (32.65%) | 62 (28.70%) | 74 (31.62%) | 200 (30.96%) | 0.82556 | 0.66181 | ||||||
| 8604 G > A (rs28371730) intron variant | genotype | G/G | 40 (40.82%) | 45 (41.67%) | 50 (42.74%) | 135 (41.80%) | 0.7361 | 0.8758 | 0.2036 | 0.3834 | 1.12704 | 0.88996 | |
| A/A | 14 (14.29%) | 13 (12.04%) | 19 (16.24%) | 46 (14.24%) | |||||||||
| G/A | 44 (44.90%) | 50 (46.30%) | 48 (41.03%) | 142 (43.96%) | |||||||||
| allele | A | 72 (36.73%) | 76 (35.19%) | 86 (36.75%) | 234 (36.22%) | 0.15128 | 0.92175 | ||||||
| 8602 A > G (rs2004511) intron variant | genotype | A/A | 37 (37.76%) | 30 (27.78%) | 45 (38.46%) | 112 (34.67%) | 0.3336 | 0.0007 | 0.0088 | 0.0001 | 5.54417 | 0.23588 | |
| G/G | 11 (11.22%) | 9 (8.33%) | 7 (5.98%) | 27 (8.36%) | |||||||||
| A/G | 50 (51.02%) | 69 (63.89%) | 65 (55.56%) | 184 (56.97%) | |||||||||
| allele | G | 72 (36.73%) | 87 (40.28%) | 79 (33.76%) | 238 (36.84%) | 2.05158 | 0.35851 | ||||||
| 8565 dup (rs1269631565) intron variant | genotype | T/T | 94 (95.92%) | 86 (79.63%) | 106 (90.60%) | 286 (88.54%) | 0.8366 | 0.2386 | 0.5936 | 0.2749 | 14.2025 | 0.00082 | |
| TT/TT | 0 | 0 | 0 | 0 | |||||||||
| T/TT | 4 (4.08%) | 22 (20.37%) | 11 (9.40%) | 37 (11.46%) | |||||||||
| allele | TT | 4 (2.04%) | 22 (10.19%) | 11 (4.70%) | 37 (5.73%) | 13.3396 | 0.00127 | ||||||
| 8504 G > A (rs867985262) intron variant | genotype | G/G | 98 (100.00%) | 107 (99.07%) | 117 (100.00%) | 322 (99.69%) | 0.9614 | 0.9778 | 1.99692 | 0.36845 | |||
| G/A | 0 | 1 (0.93%) | 0 | 1 (0.31%) | |||||||||
| allele | A | 0 | 1 (0.46%) | 0 | 1 (0.15%) | 1.99383 | 0.36902 | ||||||
| 8498 A > G (rs79596243) intron variant | genotype | A/A | 98 (100.00%) | 107 (99.07%) | 117 (100.00%) | 322 (99.69%) | 0.9614 | 0.9778 | 1.99692 | 0.36845 | |||
| A/G | 0 | 1 (0.93%) | 0 | 1 (0.31%) | |||||||||
| allele | G | 0 | 1 (0.46%) | 0 | 1 (0.15%) | 1.99383 | 0.36902 | ||||||
| 8455 C > A (rs28371729) intron variant | tramadol response | genotype | C/C | 96 (97.96%) | 107 (99.07%) | 116 (99.15%) | 319 (98.76%) | 0.9187 | 0.9614 | 0.9630 | 0.9108 | 0.74298 | 0.68971 |
| C/A | 2 (2.04%) | 1 (0.93%) | 1 (0.85%) | 4 (1.24%) | |||||||||
| allele | A | 2 (1.02%) | 1 (0.46%) | 1 (0.43%) | 4 (0.62%) | 0.73835 | 0.69131 | ||||||
| 8413 T > C (rs28578778) intron variant | genotype | T/T | 98 (100.00%) | 108 (100.00%) | 116 (99.15%) | 322 (99.69%) | 0.9630 | 0.9778 | 1.76615 | 0.41351 | |||
| T/C | 0 | 0 | 1 (0.85%) | 1 (0.31%) | |||||||||
| allele | C | 0 | 0 | 1 (0.43%) | 1(0.15%) | 1.76341 | 0.41408 | ||||||
| 8404 A > C (rs1985842) intron variant | genotype | A/A | 8 (8.16%) | 19 (17.59%) | 13 (11.11%) | 40 (12.38%) | 1.000 | 0.2143 | 0.4040 | 0.7101 | 7.04036 | 0.13377 | |
| C/C | 50 (51.02%) | 44 (40.74%) | 46 (39.32%) | 140 (43.34%) | |||||||||
| A/C | 40 (40.82%) | 45 (41.67%) | 58 (49.57%) | 143 (44.27%) | |||||||||
| allele | C | 140 (71.43%) | 133 (61.57%) | 150 (64.10%) | 423 (65.48%) | 4.72262 | 0.0943 | ||||||
| 8199 C > T (rs200335621) synonymous variant | genotype | C/C | 96 (97.96%) | 106 (98.15%) | 107 (91.45%) | 309 (95.67%) | 0.9187 | 0.9226 | 0.6292 | 0.6905 | 7.85586 | 0.01968 | |
| C/T | 2 (2.04%) | 2 (1.85%) | 10 (8.55%) | 14 (4.33%) | |||||||||
| allele | T | 2 (1.02%) | 2 (0.93%) | 10 (4.27%) | 14 (2.17%) | 7.68184 | 0.02147 | ||||||
| 8180 G > C (rs141009491) missense variant | genotype | G/G | 98 (100.00%) | 108 (100.00%) | 116 (99.15%) | 322 (99.69%) | 0.9630 | 0.9778 | 1.76615 | 0.41351 | |||
| G/C | 0 | 0 | 1 (0.85%) | 1 (0.31%) | |||||||||
| allele | C | 0 | 0 | 1 (0.43%) | 1 (0.15%) | 1.76341 | 0.41408 | ||||||
| 8008 G > A (rs28371725) intron variant | deutetrabenazine response, tamoxifen response, tramadol response | genotype | G/G | 66 (67.35%) | 88 (81.48%) | 75 (64.10%) | 229 (70.90%) | 0.0543 | 0.4254 | 0.9517 | 0.1832 | 13.69378 | 0.00834 |
| A/A | 5 (5.10%) | 0 (0.00%) | 4 (3.42%) | 9 (2.79%) | |||||||||
| G/A | 20 (20.41%) | 15 (13.89%) | 34 (29.06%) | 69 (21.36%) | |||||||||
| allele | A | 30 (16.48%) | 15 (7.28%) | 42 (18.58%) | 87 (14.17%) | 12.0599 | 0.00241 | ||||||
| 7870 C > T (rs16947) missense variant | benign, ultrarapid metabolism of debrisoquine, deutetrabenazine response, tamoxifen response, tramadol response | genotype | C/C | 34 (34.69%) | 46 (42.59%) | 48 (41.03%) | 128 (39.63%) | 0.0511 | 0.6876 | 0.0393 | 0.0236 | 7.05147 | 0.13319 |
| T/T | 21 (21.43%) | 10 (9.26%) | 21 (17.95%) | 52 (16.10%) | |||||||||
| C/T | 35 (35.71%) | 47 (43.52%) | 42 (35.90%) | 124 (38.39%) | |||||||||
| allele | T | 77 (42.78%) | 67 (32.52%) | 84 (37.84%) | 228 (37.5%) | 4.32612 | 0.11497 | ||||||
| 7632_7634 del (rs762158210) inframe deletion | genotype | GAGAA/ GAGAA | 67 (68.37%) | 37 (34.26%) | 23 (19.66%) | 127 (39.32%) | 0.9028 | 0.9293 | 1.76652 | 0.41343 | |||
| GAGAA/ GA | 2 (2.04%) | 0 | 0 | 2 (0.62%) | |||||||||
| allele | GA | 2 (1.45%) | 0 | 0 | 2 (0.78%) | 1.75272 | 0.4163 | ||||||
| 7569 del (rs35742686) frameshift variant | poor metabolizer of debrisoquine | genotype | CAG/CAG | 92 (93.88%) | 97 (89.81%) | 95 (81.20%) | 284 (87.93%) | 0.9584 | 0.9763 | 2.07179 | 0.35491 | ||
| CAG/CG | 1 (1.02%) | 0 | 0 | 1 (0.31%) | |||||||||
| allele | CG | 1 (0.54%) | 0 | 0 | 1 (0.18%) | 2.06814 | 0.3556 | ||||||
| 7503 G > T (rs28371717) missense variant | tramadol response | genotype | G/G | 98 (100.00%) | 108 (100.00%) | 116 (99.15%) | 322 (99.69%) | 0.9630 | 0.9778 | 1.76615 | 0.41351 | ||
| G/T | 0 | 0 | 1 (0.85%) | 1 (0.31%) | |||||||||
| allele | T | 0 | 0 | 1 (0.43%) | 1 (0.15%) | 1.76341 | 0.41408 | ||||||
| 7490 T > C (rs17002852) synonymous variant | tramadol response | genotype | T/T | 91 (92.86%) | 108 (100.00%) | 104 (88.89%) | 303 (93.81%) | 0.7139 | 0.3395 | 0.2439 | 12.93642 | 0.01159 | |
| C/C | 0 | 0 | 1 (0.85%) | 1 (0.31%) | |||||||||
| T/C | 7 (7.14%) | 0 | 12 (10.26%) | 19 (5.88%) | |||||||||
| allele | C | 7 (3.57%) | 0 | 14 (5.98%) | 21 (3.25%) | 12.87541 | 0.0016 | ||||||
| 7117 A > G (rs2267447) intron variant | tramadol response | genotype | A/A | 53 (54.08%) | 63 (58.33%) | 63 (53.85%) | 179 (55.42%) | 0.4295 | 0.3927 | 0.2320 | 0.4934 | 3.98125 | 0.40855 |
| G/G | 9 (9.18%) | 4 (3.70%) | 5 (4.27%) | 18 (5.57%) | |||||||||
| A/G | 36 (36.73%) | 41 (37.96%) | 49 (41.88%) | 126 (39.01%) | |||||||||
| allele | G | 54 (27.55%) | 49 (22.68%) | 59 (25.21%) | 162 (25.08%) | 2.08793 | 0.35206 | ||||||
| 6866 G > A (rs3892097) splice acceptor variant | amitriptyline response, antidepressants response—dosage. toxicity/ADR, clomipramine response, poor metabolizer of debrisoquine, deutetrabenazone response, tamoxifen response, tramadol response, desipramine response, doxepine response, imipramine response, nortriptyline response, trimipramine response, urinary metabolite levels in chronic kidney disease | genotype | G/G | 57 (58.16%) | 74 (68.52%) | 71 (60.68%) | 202 (62.54%) | 0.5398 | 0.0522 | 0.0974 | 0.1578 | 11.76100 | 0.01922 |
| A/A | 7 (7.14%) | 0 | 2 (1.71%) | 9 (2.79%) | |||||||||
| G/A | 34 (34.69%) | 34 (31.48%) | 44 (37.61%) | 112 (34.67%) | |||||||||
| allele | A | 48 (24.49%) | 34 (15.74%) | 48 (20.51%) | 130 (20.12%) | 4.92789 | 0.0851 | ||||||
| 6769 A > G (rs1135824) missense variant | likely benign, germline origin | genotype | A/A | 92 (93.88%) | 108 (100.00%) | 117 (100.00%) | 317 (98.14%) | 0.7546 | 0.8662 | 14.03625 | 0.00090 | ||
| A/G | 6 (6.12%) | 0 | 0 | 6 (1.86%) | |||||||||
| allele | G | 6 (3.06%) | 0 | 0 | 6 (0.93%) | 13.90466 | 0.00096 | ||||||
| 6684 C > T (rs1349481801) synonymous variant | genotype | C/C | 98 (100.00%) | 108 (100.00%) | 116 (99.15%) | 322 (99.69%) | 0.9630 | 0.9778 | 1.76615 | 0.41351 | |||
| C/T | 0 | 0 | 1 (0.85%) | 1 (0.31%) | |||||||||
| allele | T | 0 | 0 | 1 (0.43%) | 1 (0.15%) | 1.76341 | 0.41408 | ||||||
| 6681 G > C (rs1058164) synonymous variant | genotype | G/G | 8 (8.16%) | 19 (17.59%) | 13 (11.11%) | 40 (12.38%) | 1.000 | 0.2803 | 0.4040 | 0.7749 | 7.07838 | 0.13180 | |
| C/C | 50 (51.02%) | 43 (39.81%) | 46 (39.32%) | 139 (43.03%) | |||||||||
| G/C | 40 (40.82%) | 46 (42.59%) | 58 (49.57%) | 144 (44.58%) | |||||||||
| allele | C | 140 (71.43%) | 132 (61.11%) | 150 (64.10%) | 422 (65.33%) | 5.07114 | 0.0792 | ||||||
| 6460 T > C (rs376056664) intron variant | genotype | T/T | 96 (97.96%) | 105 (97.22%) | 115 (98.29%) | 316 (97.83%) | 0.9593 | 0.9776 | 2.2752 | 0.3206 | |||
| C/C | 0 | 0 | 0 | 0 | |||||||||
| T/C | 1 (1.02%) | 0 | 0 | 1 (0.31%) | |||||||||
| allele | C | 1 (0.52%) | 0 | 0 | 1 (0.16%) | 2.27162 | 0.32116 | ||||||
| 6313 G > A (rs189736703) intron variant | genotype | G/G | 98 (100.00%) | 108 (100.00%) | 114 (97.44%) | 320 (99.07%) | 0.9626 | 0.9777 | 1.79690 | 0.40720 | |||
| G/A | 0 | 0 | 1 (0.85%) | 1 (0.31%) | |||||||||
| allele | A | 0 | 0 | 1 (0.43%) | 1 (0.16%) | 1.7941 | 0.40777 | ||||||
| 6188 G > A (rs1081004) intron variant | tramadol response | genotype | G/G | 94 (95.92%) | 103 (95.37%) | 110 (94.02%) | 307 (95.05%) | 0.0001 | 0.00002 | <10−5 | <10−5 | 2.57173 | 0.63184 |
| A/A | 1 (1.02%) | 3 (2.78%) | 5 (4.27%) | 9 (2.79%) | |||||||||
| G/A | 3 (3.06%) | 2 (1.85%) | 2 (1.71%) | 7 (2.17%) | |||||||||
| allele | A | 5 (2.56%) | 8 (3.70%) | 12 (5.13%) | 25 (3.87%) | 1.92838 | 0.38129 | ||||||
| 6089 G > A (rs368389952) intron variant | genotype | G/G | 86 (87.76%) | 108 (100.00%) | 117 (100.00%) | 311 (96.28%) | <10−5 | <10−5 | 28.61408 | <10−5 | |||
| A/A | 6 (6.12%) | 0 | 0 | 6 (1.86%) | |||||||||
| G/A | 6 (6.12%) | 0 | 0 | 6 (1.86%) | |||||||||
| allele | A | 18 (9.18%) | 0 | 0 | 18 (2.79%) | 42.51105 | <10−5 | ||||||
| 6057 C > T (rs1081003) synonymous variant | genotype | C/C | 94 (95.92%) | 96 (88.89%) | 114 (97.44%) | 304 (94.12%) | 0.8366 | 0.5410 | 0.8883 | 0.5860 | 8.23424 | 0.01629 | |
| C/T | 4 (4.08%) | 12 (11.11%) | 3 (2.56%) | 19 (5.88%) | |||||||||
| allele | T | 4 (2.04%) | 12 (5.56%) | 3 (1.29%) | 19 (2.94%) | 7.98471 | 0.01846 | ||||||
| 6015 C > G (rs28371705) synonymous variant | genotype | C/C | 91 (92.86%) | 108 (100.00%) | 115 (98.29%) | 314 (97.21%) | 0.7139 | 0.9257 | 0.7996 | 10.4630 | 0.0054 | ||
| G/G | 0 | 0 | 0 | 0 | |||||||||
| C/G | 7 (7.14%) | 0 | 2 (1.71%) | 9 (2.79%) | |||||||||
| allele | G | 7 (3.57%) | 0 | 2 (0.86%) | 9 (1.39%) | 10.31512 | 0.00576 | ||||||
| 6002 A > G (rs28371704) missense variant | tramadol response | genotype | A/A | 91 (92.86%) | 108 (100.00%) | 115 (98.29%) | 314 (97.21%) | 0.7553 | 0.9257 | 0.8214 | 8.5260 | 0.0141 | |
| G/G | 0 | 0 | 0 | 0 | |||||||||
| A/G | 6 (6.12%) | 0 | 2 (1.71%) | 8 (2.48%) | |||||||||
| allele | G | 6 (3.09%) | 0 | 2 (0.86%) | 8 (1.24%) | 8.41879 | 0.01486 | ||||||
| 5992 C > A (rs28371703) intron variant | genotype | G/G | 95 (96.94%) | 108 (100.00%) | 116 (99.15%) | 319 (98.76%) | 0.9630 | 0.9777 | 1.74048 | 0.41885 | |||
| G/A | 0 | 0 | 1 (0.85%) | 1 (0.31%) | |||||||||
| allele | A | 0 | 0 | 1 (0.43%) | 1 (0.16%) | 1.73776 | 0.41942 | ||||||
| 5289 C > T (rs29001678) noncoding transcript exon variant | genotype | C/C | 80 (81.63%) | 96 (88.89%) | 97 (82.91%) | 273 (84.52%) | 0.9110 | 0.005 | 0.001 | 1.8 × 10⁻⁵ | 3.88908 | 0.42123 | |
| T/T | 0 | 1 (0.93%) | 2 (1.71%) | 3 (0.93%) | |||||||||
| C/T | 2 (2.04%) | 0 | 2 (1.71%) | 4 (1.24%) | |||||||||
| allele | T | 2 (1.22%) | 2 (1.03%) | 6 (2.97%) | 10 (1.79%) | 2.54616 | 0.27997 | ||||||
| 5264 A > G (rs1081000) noncoding transcript exon variant | genotype | A/A | 86 (87.76%) | 108 (100.00%) | 115 (98.29%) | 309 (95.67%) | 0.5538 | 0.9257 | 0.7116 | 19.53312 | <10−5 | ||
| A/G | 11 (11.22%) | 0 | 2 (1.71%) | 13 (4.02%) | |||||||||
| allele | G | 11 (5.67%) | 0 | 2 (0.85%) | 13 (2.02%) | 42.511 | <10−5 | ||||||
| 5119 C > T (rs1065852) missense variant | poor metabolizer of debrisoquine, deutetrabenazone response, tamoxifen response, tramadol response, response to serotonin reuptake inhibitors in major depressive disorder | genotype | C/C | 53 (54.08%) | 63 (58.33%) | 63 (53.85%) | 179 (55.42%) | 0.2532 | 0.6703 | 0.6483 | 0.8448 | 3.08176 | 0.54424 |
| T/T | 10 (10.20%) | 5 (4.63%) | 7 (5.98%) | 22 (6.81%) | |||||||||
| C/T | 35 (35.71%) | 40 (37.04%) | 47 (40.17%) | 122 (37.77%) | |||||||||
| allele | T | 55 (28.06%) | 50 (23.15%) | 61 (26.07%) | 166 (25.70%) | 1.32564 | 0.5154 | ||||||
| 5101 C > T (rs138100349) missense variant | genotype | C/C | 97 (98.98%) | 106 (98.15%) | 114 (97.44%) | 317 (98.14%) | 0.9595 | 0.9226 | 0.8883 | 0.8662 | 0.69712 | 0.70570 | |
| C/T | 1 (1.02%) | 2 (1.85%) | 3 (2.56%) | 6 (1.86%) | |||||||||
| allele | T | 1 (0.51%) | 2 (0.93%) | 3 (1.28%) | 6 (0.93%) | 0.69059 | 0.70801 | ||||||
| 5050 G > A (rs769258) missense variant | tramadol response, likely benign | genotype | G/G | 95 (96.94%) | 108 (100.00%) | 115 (98.29%) | 318 (98.45%) | 0.8777 | 0.9257 | 0.8885 | 3.19059 | 0.20285 | |
| G/A | 3 (3.06%) | 0 | 2 (1.71%) | 5 (1.55%) | |||||||||
| allele | A | 3 (1.53%) | 0 | 2 (0.85%) | 5 (0.77%) | 3.1657 | 0.20539 | ||||||
| 4818 G > A (rs372204775) intron variant | genotype | G/G | 95 (96.94%) | 99 (91.67%) | 111 (94.87%) | 305 (94.43%) | 0.9183 | 0.6514 | 0.7759 | 0.6266 | 4.02766 | 0.13348 | |
| G/A | 2 (2.04%) | 9 (8.33%) | 6 (5.13%) | 17 (5.26%) | |||||||||
| allele | A | 2 (1.03%) | 9 (4.17%) | 6 (2.56%) | 17 (2.64%) | 3.91845 | 0.14097 | ||||||
| 4666 A > G (rs530422334)intron variant | tramadol response | genotype | A/A | 98 (100.00%) | 101 (93.52%) | 113 (96.58%) | 312 (96.59%) | 0.7278 | 0.8508 | 0.7556 | 6.56138 | 0.03760 | |
| A/G | 0 | 7 (6.48%) | 4 (3.42%) | 11 (3.41%) | |||||||||
| allele | G | 0 | 7 (3.24%) | 4 (1.71%) | 11 (1.70%) | 6.44772 | 0.0398 | ||||||
| 4655 G > A (rs1080992) intron variant | genotype | G/G | 98 (100.00%) | 106 (98.15%) | 117 (100.00%) | 321 (99.38%) | 0.9226 | 0.9555 | 4.00629 | 0.13491 | |||
| G/A | 0 | 2 (1.85%) | 0 | 2 (0.62%) | |||||||||
| allele | A | 0 | 2 (0.93%) | 0 | 2 (0.31%) | 3.99385 | 0.13575 | ||||||
| 4623 G > T (rs769811346) intron variant | genotype | G/G | 98 (100.00%) | 108 (100.00%) | 116 (99.15%) | 322 (99.69%) | 0.9630 | 0.9778 | 1.76615 | 0.41351 | |||
| G/T | 0 | 0 | 1 (0.85%) | 1 (0.31%) | |||||||||
| allele | T | 0 | 0 | 1 (0.43%) | 1 (0.15%) | 1.76341 | 0.41408 | ||||||
| 4622 G > C (rs374672076) intron variant | genotype | G/G | 81 (82.65%) | 98 (90.74%) | 100 (85.47%) | 279 (86.38%) | 0.3471 | 0.6139 | 0.3968 | 0.1890 | 2.98457 | 0.22486 | |
| G/C | 17 (17.35%) | 10 (9.26%) | 17 (14.53%) | 44 (13.62%) | |||||||||
| allele | C | 17 (8.67%) | 10 (4.63%) | 17 (7.26%) | 44 (6.81%) | 2.42978 | 0.29719 | ||||||
| 4589 C > T (rs566383351) intron variant | genotype | C/C | 67 (68.37%) | 85 (78.70%) | 85 (72.65%) | 237 (73.37%) | 0.0629 | 0.2155 | 0.0866 | 0.0058 | 2.85917 | 0.23941 | |
| C/T | 31 (31.63%) | 23 (21.30%) | 32 (27.35%) | 86 (26.63%) | |||||||||
| allele | T | 31 (15.82%) | 23 (10.65%) | 32 (13.68%) | 86 (13.31%) | 2.42008 | 0.29819 | ||||||
| Roma Group | No. of Polym. Loci | No. of Haplotypes | Haplotype Diversity | Nucleotide Diversity | Observed F Value * | Expected F Value * | p-Value * |
|---|---|---|---|---|---|---|---|
| Balkan | 27 | 46 | 0.9490 | 0.2046 | 0.0558 | 0.0546 | 0.6408 |
| Baranja | 26 | 47 | 0.9154 | 0.2035 | 0.0885 | 0.0574 | 0.9665 |
| Medjimurje | 21 | 37 | 0.9114 | 0.1791 | 0.0929 | 0.0762 | 0.8412 |
| Star Allele | Function † | Balkan N (%) | Baranja N (%) | Medjimurje N (%) | Total N (%) |
|---|---|---|---|---|---|
| *1 | normal | 50 (25.91) | 84 (35.90) | 78 (36.45) | 212 (33.07) |
| 2 | normal | 49 (25.39) | 42 (17.95) | 58 (27.10) | 149 (23.24) |
| 4 | no function | 48 (24.87) | 48 (20.51) | 34 (15.89) | 130 (20.28) |
| 10 | decreased | 6 (3.11) | 12 (5.13) | 21 (9.81) | 39 (6.08) |
| 22 | uncertain | 1 (0.52) | 0 | 2 (0.93) | 3 (0.47) |
| 34 | normal | 2 (1.04) | 1 (0.43) | 3 (1.40) | 6 (0.94) |
| 35 | normal | 2 (1.04) | 2 (0.85) | 0 | 4 (0.62) |
| 39 | uncertain | 3 (1.55) | 1 (0.43) | 5 (2.34) | 9 (1.40) |
| 41 | decreased | 32 (16.58) | 43 (18.38) | 13 (6.07) | 88 (13.73) |
| 65 | uncertain | 0 | 1 (0.43) | 0 | 1 (0.16) |
| Total | 193 (100) | 234 (100) | 214 (100) | 641 (100) |
| Star Diplotype | Phenotype | Balkan N (%) | Baranja N (%) | Medjimurje N (%) | Total N (%) |
|---|---|---|---|---|---|
| 1/1 | NM | 6 (6.32) | 14 (11.97) | 17 (16.04) | 37 (11,64) |
| 1/2 | NM | 8 (8.42) | 14 (11.97) | 21 (19.81) | 43 (13.52) |
| 1/4 | IM | 16 (16.84) | 22 (18.80) | 9 (8.49) | 47 (14.78) |
| 1/10 | NM | 1 (1.05) | 6 (5.13) | 4 (3.77) | 11 (3.46) |
| 1/22 | IM | 1 (1.05) | 0 | 1 (0.94) | 2 (0.63) |
| 1/34 | NM | 1 (1.05) | 0 | 1 (0.94) | 2 (0.63) |
| 1/39 | NM | 1 (1.05) | 0 | 2 (1.89) | 3 (0.94) |
| 1/41 | NM | 10 (10.53) | 14 (11.97) | 6 (5.66) | 30 (9.43) |
| 2/2 | NM | 10 (10.53) | 4 (3.42) | 8 (7.55) | 22 (6.92) |
| 2/4 | IM | 9 (9.47) | 8 (6.84) | 11 10.38) | 28 (8.81) |
| 2/10 | NM | 2 (2.10) | 1 (0.85) | 6 (5.66) | 9 (2.83) |
| 2/34 | NM | 0 | 0 | 1 (0.94) | 1 (0.31) |
| 2/35 | NM | 1 (1.05) | 2 (1.71) | 0 | 3 (0.94) |
| 2/41 | NM | 8 (8.42) | 9 (7.69) | 3 (2.83) | 20 (6.29) |
| 4/4 | PM | 7 (7.37) | 2 (1.71) | 0 | 9 (2.83) |
| 4/10 | IM | 2 (2.10) | 5 (4.27) | 9 (8.49) | 16 (5.03) |
| 4/34 | IM | 0 | 0 | 1 (0.94) | 1 (0.31) |
| 4/35 | IM | 1 (1.05) | 0 | 0 | 1 (0.31) |
| 4/39 | IM | 1 (1.05) | 0 | 1 (0.94) | 2 (0.63) |
| 4/41 | IM | 4 (4.21) | 9 (7.69) | 3 (2.83) | 16 (5.03) |
| 10/10 | IM | 0 | 0 | 1 (0.94) | 1 (0.31) |
| 10/41 | IM | 1 (1.05) | 0 | 0 | 1 (0.31) |
| 22/41 | IM | 0 | 0 | 1 (0.94) | 1 (0.31) |
| 34/39 | NM | 1 (1.05) | 0 | 0 | 1 (0.31) |
| 34/41 | NM | 0 | 1 (0.85) | 0 | 1 (0.31) |
| 39/41 | NM | 0 | 1 (0.85) | 0 | 1 (0.31) |
| 41/41 | IM | 4 (4.21) | 4 (3.42) | 0 | 8 (2.52) |
| 65/41 | IM | 0 | 1 (0.85) | 0 | 1 (0.31) |
| Total | 95 (100) | 117 (100) | 106 (100) | 318 (100) |
Publisher’s Note: MDPI stays neutral with regard to jurisdictional claims in published maps and institutional affiliations. |
© 2022 by the authors. Licensee MDPI, Basel, Switzerland. This article is an open access article distributed under the terms and conditions of the Creative Commons Attribution (CC BY) license (https://creativecommons.org/licenses/by/4.0/).
Share and Cite
Stojanović Marković, A.; Zajc Petranović, M.; Tomas, Ž.; Puljko, B.; Šetinc, M.; Škarić-Jurić, T.; Peričić Salihović, M. Untangling SNP Variations within CYP2D6 Gene in Croatian Roma. J. Pers. Med. 2022, 12, 374. https://doi.org/10.3390/jpm12030374
Stojanović Marković A, Zajc Petranović M, Tomas Ž, Puljko B, Šetinc M, Škarić-Jurić T, Peričić Salihović M. Untangling SNP Variations within CYP2D6 Gene in Croatian Roma. Journal of Personalized Medicine. 2022; 12(3):374. https://doi.org/10.3390/jpm12030374
Chicago/Turabian StyleStojanović Marković, Anita, Matea Zajc Petranović, Željka Tomas, Borna Puljko, Maja Šetinc, Tatjana Škarić-Jurić, and Marijana Peričić Salihović. 2022. "Untangling SNP Variations within CYP2D6 Gene in Croatian Roma" Journal of Personalized Medicine 12, no. 3: 374. https://doi.org/10.3390/jpm12030374